Embed Size (px)
Citation preview
Isolation and Characterization of New
Triethylamine and Ethyl Acrylate
Degrading Bacteria
VOM PROMOTIONSAUSSCHUSS DER
TECHNISCHEN UNIVERSITÄT HAMBURG-HARBURG
ZUR ERLANGUNG DES AKADEMISCHEN GRADES
DOKTOR(IN) DER NATURWISSENSCHAFTEN (DR. RER. NAT.)
GENEHMIGTE DISSERTATION
VON
Rita Issa Numeir Alayoub aus Ramallah
2012

Vorsitzender des Prüfungsausschusses: Prof. Dr.-Ing. Wolfgang Calmano
1. Gutachter: Prof. Dr. rer. nat. Rudolf Müller
2. Gutachter: Prof. Dr. Dr. h.c. Garabed Antranikian
Tag der mündlichen Prüfung: 27.01.2012

In Loving Memory of My Father
Acknowledgements
There are many persons and institutions that I would like to thank for their support during my
Ph.D. studies. I would like to begin with the KAAD (Katholischer Akademischer Ausländer
Dienst) for awarding me the scholarship to carry out my doctoral studies at the Hamburg
University of Technology (TUHH) and for giving me the chance to come to Germany and
experience a new life.
I would like to express my deepest gratitude to Professor Rudolf Müller for his patient
guidance, thorough advice, wholehearted support and for giving me the opportunity to carry
out this research work at his institute at the Hamburg University of Technology. I would also
like to acknowledge the support of Professor Volker Kasche, Dr. Boris Galunsky, Professor
Andreas Liese as well as my colleagues at the Department of Technical Biocatalysis. Special
thanks are also due to Dr. Sugima Rappert for her continuous help and advice in the
laboratorial work. I also wish to thank Maren Breuer, Uta Naefken and Dip.-Ing. Gerd
Schietke for providing expert technical assistance, especially with the chronically problematic
equipment. I am also grateful to Gisela Görk for assisting me with the various bureaucratic
formalities at the University and for supporting me in the process of learning the German
language.
I deeply thank Professor Wolfgang Calmano for accepting to chair the doctoral examination
committee and Professor Garabed Antranikian for reviewing the manuscript and for being
part of the examination committee.
My sincere appreciation goes to the Department of Biomechanics at the Hamburg University
of Technology under the chairmanship of Professor Michael Morlock for the exceptionally
friendly working environment as well as for the additional support throughout the duration of
this work. I especially thank Dr. Anne Gebert de Uhlenbrock and Dr. Nick Bishop for the
many helpful tips and fruitful discussions. I also thank Dip.-Ing. Matthias Vollmer for the
indispensable technical support.
I could have not finished this work without the support of my friends in Hamburg, and those
living somewhere else but keeping in touch with me during the last years. Special thanks go
to Professor Hans Bienlein and his wife Melanie, Dr. George Zimmerer, his wife Hannelore,
their daughter Bettina, her husband Marcus and their daughters Johanna and Marlene.
Warm thanks go to my closest friends Cesar Lazo, Athina and Maria Pantoula, Corinna
Wellige, Georgios Papantoniou, Davide Moncalvo, Urs Lübbert, Manfred Glaser and
Christine Völkel.

For the spiritual support and guidance, I would like to express my deep appreciation to
Professor Said Zeedani from Palestine.
I am highly indebted to my beloved father, Issa Numeir Ayoub, who passed away on 25
September 2009, to my Mom, Farha Abbasi Ayoub, to my brothers, Marwan, Munther and
Mazen, to my sister Rima, to my nieces Rawan and Batoul and to my nephew Issa for their
affection, understanding and support throughout the years of my Ph.D. studies in Germany.
i
Table of Contents
CHAPTER 1 INTRODUCTION ..................................................................... 1
1.1 The revolution of biotechnology ................................................................................ 1
1.2 Odour and odorous compounds ............................................................................... 2
1.2.1 Definitions ........................................................................................................... 2
1.2.2 Sources .............................................................................................................. 3
1.2.3 Food processing ................................................................................................. 3
1.2.4 Volatile organic compounds ................................................................................ 4
1.2.5 Exposure to VOCs .............................................................................................. 4
1.2.6 Odour treatment ................................................................................................. 5
1.2.7 Analysis technique .............................................................................................. 6
1.3 Ethyl acrylate ........................................................................................................... 6
1.3.1 Properties ........................................................................................................... 6
1.3.2 Occurrence ......................................................................................................... 7
1.3.3 Applications ........................................................................................................ 7
1.3.4 Preparation ......................................................................................................... 7
1.3.5 Exposure ............................................................................................................ 8
1.3.6 Toxicity ............................................................................................................. 10
1.3.7 Metabolism ....................................................................................................... 11
1.3.8 Sampling and analysis ...................................................................................... 11
1.4 Amines ................................................................................................................... 11
1.4.1 Definition .......................................................................................................... 11
1.4.2 Preparation ....................................................................................................... 12
1.4.3 Applications ...................................................................................................... 12
1.5 Triethylamine ......................................................................................................... 13
1.5.1 Properties ......................................................................................................... 13
1.5.2 Applications ...................................................................................................... 14
1.5.3 Exposure .......................................................................................................... 15
1.5.4 Metabolism ....................................................................................................... 18
ii
1.6 Degradation of environmental pollutants ................................................................ 18
1.6.1 Biodegradation of amines ................................................................................. 20
1.6.2 Dimethylamine .................................................................................................. 22
1.6.3 Trimethylamine ................................................................................................. 23
1.6.4 Diethylamine ..................................................................................................... 24
1.6.5 Triethylamine .................................................................................................... 25
1.7 Aim of the study ..................................................................................................... 26
CHAPTER 2 MATERIALS AND METHODS .................................................. 27
2.1 Overview ................................................................................................................ 27
2.2 Equipment, chemicals and media ........................................................................... 27
2.2.1 Growth media and solutions ............................................................................. 29
2.2.2 Buffers .............................................................................................................. 32
2.3 Bacteria that degrade triethylamine ........................................................................ 34
2.3.1 Isolation procedure ........................................................................................... 34
2.3.2 Anaerobic growth .............................................................................................. 34
2.4 Bacteria that degrade ethyl acrylate ....................................................................... 35
2.4.1 Isolation procedure ........................................................................................... 35
2.4.2 Anaerobic growth .............................................................................................. 35
2.5 Analytical procedures ............................................................................................. 35
2.6 Enzyme assay ........................................................................................................ 37
2.6.1 Spectrophotometric assay with p-nitrophenyl acetate (-NPA) as substrate ..... 37
2.7 Purification and characterization of esterase from 2Cbei cells ................................ 37
2.7.1 Bacterial strain cultivation and native crude enzyme extraction ......................... 37
2.7.2 Purification of esterase from 2Cbei cells ........................................................... 38
2.7.3 Influence of pH and temperature on esterase activity and thermostability ......... 38
2.7.4 Effect of various compounds on esterase activity ............................................. 38
2.7.5 Substrate specificity .......................................................................................... 41
2.8 Biochemical methods ............................................................................................. 41
2.8.1 Determination of protein concentration ............................................................. 41
iii
2.9 Disposal of waste materials .................................................................................... 42
CHAPTER 3 RESULTS ........................................................................... 43
3.1 Bacteria that degrade triethylamine ........................................................................ 43
3.1.1 Isolation procedure ........................................................................................... 43
3.1.2 Identification of the triethylamine degrading bacteria RA1 and RA2 .................. 43
3.1.3 Determination of growth characteristics of Pseudomonas citronellolis RA1 and
Mycobacterium diernhoferi RA2 ........................................................................ 47
3.1.4 Substrate spectra of Pseudomonas citronellolis RA1 and Mycobacterium
diernhoferi RA2 ................................................................................................. 51
3.1.5 Determination of the degradation pathway for triethylamine .............................. 55
3.1.5.1 Growth of RA1 on the different substrates in a nitrogen-free mineral
medium 1.10 M (YE-N). ............................................................................ 55
3.1.5.2 Growth of RA2 on the different substrates in a nitrogen-free mineral
medium 1.10 M (YE-N). ............................................................................ 57
3.1.5.3 Growth of RA1 on the different substrates in minimal mineral medium
with an ammonium source (1.10 M (-YE+N)). ........................................... 59
3.1.5.4 Growth of RA2 on the different substrates in minimal mineral medium
with an ammonium source (1.10 M (-YE+N)). ........................................... 61
3.1.5.5 Growth of RA1 on the different substrates in minimal mineral medium
without an ammonium source (1.10 M (-YE-N)). ....................................... 63
3.1.5.6 Growth of RA2 on the different substrates in minimal mineral medium
without an ammonium source (1.10 M (-YE-N)). ....................................... 65
3.2 Bacteria that degrade ethyl acrylate ....................................................................... 67
3.2.1 Isolation procedure ........................................................................................... 67
3.2.2 Identification of the ethyl acrylate degrading bacteria 2C and 2Cbei ................. 67
3.2.3 Determination of growth characteristics of Defluvibacter lusatiensis 2C and
2Cbei ................................................................................................................ 70
3.2.4 Determination of the degradation pathway for ethyl acrylate ............................. 76
3.2.4.1 Growth of 2C on the different substrates in a mineral medium containing
0.1% yeast extract (1.10 M (+YE)). ........................................................... 76
3.2.4.2 Growth of 2Cbei on the different substrates in a mineral medium
containing 0.1% yeast extract (1.10 M (+YE)). .......................................... 77
iv
3.2.5 Detection and characterization of an esterase from Defluvibacter lusatiensis
2Cbei ................................................................................................................ 80
3.2.5.1 Substrate spectrum .................................................................................. 80
3.2.5.2 Inhibitors, detergents, solvents and metal ions ......................................... 80
3.2.5.3 pH (optimum) ............................................................................................ 83
3.2.5.4 Temperature (optimum) ............................................................................ 84
3.2.5.5 Purification ................................................................................................ 85
CHAPTER 4 DISCUSSION ....................................................................... 87
4.1 Bacteria that degrade triethylamine ........................................................................ 87
4.1.1 Isolation, characterization and identification of new triethylamine degrading
bacteria, RA1 and RA2 ..................................................................................... 87
4.1.1.1 The species, Pseudomonas citronellolis, desription: ................................. 88
4.1.1.2 The species, Mycobacterium diernhoferi, description: .............................. 89
4.1.2 Determination of growth characteristics of Pseudomonas citronellolis RA1 and
Mycobacterium diernhoferi RA2 ........................................................................ 90
4.1.3 Substrate spectra of Pseudomonas citronellolis RA1 and Mycobacterium
diernhoferi RA2 ................................................................................................. 91
4.1.4 Determination of the degradation pathway for triethylamine .............................. 92
4.2 Bacteria that degrade ethyl acrylate ....................................................................... 95
4.2.1 Isolation, characterization and identification of new ethyl acrylate degrading
bacteria, 2C and 2Cbei ..................................................................................... 95
4.2.1.1 Description of the genus Defluvibacter gen. nov. : .................................... 95
4.2.1.2 Description of the type species Defluvibacter lusatiae sp.nov. .................. 96
4.2.2 Determination of growth characteristics of Defluvibacter lusatiensis, 2C and
2Cbei ................................................................................................................ 96
4.2.3 Determination of the degradation pathway for ethyl acrylate ............................. 97
4.2.4 Detection and characterization of an esterase from Defluvibacter lusatiensis
2Cbei ................................................................................................................ 98
4.3 Concluding remarks and further prospects ........................................................... 100
CHAPTER 5 SUMMARY ........................................................................ 101
v
CHAPTER 6 ZUSAMMENFASSUNG ......................................................... 104
CHAPTER 7 REFERENCES ................................................................... 107
7.1 General References ............................................................................................. 107
7.2 Online References ............................................................................................... 119
__________________________________________________________________________
vi
LIST OF FIGURES
Figure 1.1: Direct esterification acrylic acid with sulphonated styrene DVB
copolymer (Online 17) .............................................................................................. 8
Figure 1.2: The proposed formation and degradation pathways for trimethylamine by
microorganisms in the environment under aerobic conditions. The
enzymes of the pathways are shown in red (Van Agteren et al., 1998;
Kim et al., 2001; Rappert and Müller, 2005b). ....................................................... 23
Figure 3.1: Pseudomonas citronellolis, RA1 (DSM ID 03-1328); cell form: rod; width
0.5-0.7µm; length 1.8-3.0µm. ................................................................................. 47
Figure 3.2: Mycobacterium diernhoferi, RA2 (DSM ID 03-1329); cell form: rod; width
1µm; length 2µm. ................................................................................................... 47
Figure 3.3: Degradation of triethylamine by RA1. ..................................................................... 48
Figure 3.4: Degradation of triethylamine by RA2. ..................................................................... 48
Figure 3.5: Degradation of higher concentration of triethylamine by RA1 (0.5mM –
10.0mM). ................................................................................................................ 49
Figure 3.6: Degradation of higher concentration of triethylamine by RA1 (11.0mM –
20.0mM). ................................................................................................................ 50
Figure 3.7: Degradation of higher concentration of triethylamine by RA2 (0.5mM –
10.0mM). ................................................................................................................ 50
Figure 3.8: Degradation of higher concentration of triethylamine by RA2 (11.0mM –
20.0mM). ................................................................................................................ 51
Figure 3.9: Growth of RA1 on 1.10 M (-YE-N) with/without (A) 1.0mM triethylamine;
(B) 1.0mM diethylamine; (C) 1.0mM triethanolamine; (D) 1.0mM
diethanolamine; (E) 1.0mM ethanolamine; (F) 1.0mM acetalhyde; (G)
1.0mM sodium acetate. .......................................................................................... 56
Figure 3.10: Growth of RA2 on 1.10 M (-YE-N) with/without (A) 1.0mM triethylamine;
(B) 1.0mM diethylamine; (C) 1.0mM triethanolamine; (D) 1.0mM
diethanolamine; (E) 1.0mM ethanolamine; (F) 1.0mM acetaldehyde; (G)
1.0 mM sodium acetate. ......................................................................................... 58
Figure 3.11: Growth of RA1 on 1.10 M (-YE+N) with/without (A) 1.0mM
triethylamine; (B) 1.0mM diethylamine; (C) 1.0mM triethanolamine; (D)
1.0mM diethanolamine; (E) 1.0mM ethanolamine; (F) 1.0mM
acetaldehyde; (G) 1.0mM sodium acetate. ............................................................. 60
__________________________________________________________________________
vii
Figure 3.12: Growth of RA2 on 1.10 M (-YE+N) with/without (A) 1.0mM
triethylamine; (B) 1.0mM diethylamine; (C) 1.0mM triethanolamine; (D)
1.0mM diethanolamine; (E) 1.0mM ethanolamine; (F) 1.0mM
acetaldehyde; (G) 1.0mM sodium acetate. ............................................................. 62
Figure 3.13: Accumulation of ammonium during growth of RA1 with (A) 1.0mM
triethylamine; (B) 1.0mM diethylamine; (C) 1.0mM triethanolamine; (D)
1.0mM diethanolamine; (E) 1.0mM ethanolamine; (F) 1.0mM
acetaldehyde; (G) 1.0mM sodium acetate; (H) on minimal mineral
medium 1.10 M (-YE-N). ........................................................................................ 64
Figure 3.14: Accumulation of ammonium during growth of RA2 with (A) 1.0mM
triethylamine; (B) 1.0mM diethylamine; (C) 1.0mM triethanolamine; (D)
1.0mM diethanolamine; (E) 1.0mM ethanolamine; (F) 1.0mM
acetaldehyde; (G) 1.0mM sodium acetate; (H) on minimal mineral
medium 1.10 M (-YE-N). ........................................................................................ 66
Figure 3.15: Defluvibacter lusatiensis, 2C (ID 02-582) and 2Cbei (ID 02-583). ......................... 68
Figure 3.16: Effect of yeast extract on the degradation of ethyl acrylate by 2C. ........................ 71
Figure 3.17: Effect of yeast extract on the degradation and product formation of ethyl
acrylate by 2C. ....................................................................................................... 71
Figure 3.18: Effect of yeast extract on the degradation and product formation of ethyl
acrylate by 2C ........................................................................................................ 72
Figure 3.19: Growth of 2C Strain in a 30 Litre Fermenter. ........................................................ 72
Figure 3.20: Effect of yeast extract on the degradation of ethyl acrylate by 2Cbei. ................... 73
Figure 3.21: Effect of yeast extract on the degradation and product formation of ethyl
acrylate by 2Cbei. .................................................................................................. 73
Figure 3.22: Effect of yeast extract on the degradation and product formation of ethyl
acrylate by 2Cbei. .................................................................................................. 74
Figure 3.23: Degradation of higher concentrations of ethyl acrylate by 2C. .............................. 75
Figure 3.24: Degradation of higher concentrations of ethyl acrylate by 2Cbei. .......................... 75
Figure 3.25: Growth of 2C on 1.10 M (+YE) with/without (A) acrylic acid, (B) ethanol,
(C) L(+)-Lactic acid, (D) D-(-)-Lactic acid, (E) malonic acid ,(F) ethyl
acrylate .................................................................................................................. 77
Figure 3.26: Growth of 2Cbei on 1.10 M (+YE) with/without (A) acrylic acid, (B)
ethanol, (C) L(+)-Lactic acid, (D) D-(-)-Lactic acid, (E) malonic acid, (F)
ethyl acrylate .......................................................................................................... 79
__________________________________________________________________________
viii
Figure 3.27: Substrate specificity of the 2Cbei enzyme ............................................................ 80
Figure 3.28: Effect of inhibitors on activity of 2Cbei enzyme (40%+60%) measured
after 1 hour of incubation at 30 degrees. ................................................................ 81
Figure 3.29: Effect of different detergents on the activity of the 2Cbei (40%+60%)
enzyme. ................................................................................................................. 82
Figure 3.30: Effect of various organic solvents on the activity of 2Cbei enzyme
(40%+60%). ........................................................................................................... 82
Figure 3.31: Effect of different metal ions on the activity of 2Cbei enzyme. .............................. 83
Figure 3.32: Optimum pH of the 2Cbei enzyme measured at the optimum
temperature T 56°C. ............................................................................................... 83
Figure 3.33: Optimum temperature of 2Cbei enzyme. .............................................................. 84
Figure 3.34: Thermal stability of the 2Cbei enzyme. ................................................................. 85
Figure 4.1: Proposed pathway of aerobic metabolism of triethylamine in strains RA1
and RA2. ................................................................................................................ 93
Figure 4.2: Proposed pathway of aerobic metabolism of triethylamine in strains RA1
and RA2. ................................................................................................................ 94
Figure 4.3: Proposed degradation pathway for ethyl acrylate. .................................................. 98
__________________________________________________________________________
ix
LIST OF TABLES
Table 1.1: Odour thresholds of amines and microorganisms degrading these
aminesa (Rappert et al., 2005b) .............................................................................. 21
Table 2.1: List of equipment ..................................................................................................... 28
Table 2.2: Organic solvents tested. .......................................................................................... 39
Table 2.3: Inhibitors. ................................................................................................................. 40
Table 2.4: Surfactants. ............................................................................................................. 40
Table 3.1: Morphological and physiological properties of Pseudomonas citronellolis,
RA1 and Mycobacterium diernhoferi, RA2. ............................................................. 45
Table 3.2: Fatty acid composition (%) of strain RA2. ................................................................ 46
Table 3.3: Growth of amine degrading bacteria in the presence of other odour
compounds. ........................................................................................................... 52
Table 3.4: Growth of RA1 and RA2 in the presence of other odour compounds. ...................... 53
Table 3.5: Amine degradation by RA1 and RA2. ...................................................................... 54
Table 3.6: Morphological and physiological properties of Defluvibacter lusatiensis,
2C and 2Cbei. ........................................................................................................ 69
Table 3.7: Purification of the esterase of Defluvibacter lusatiensis 2Cbei. ................................ 86
1
Chapter 1
INTRODUCTION
__________________________________________________________________________
1.1 The revolution of biotechnology
The foundation for what has since been named biotechnology was established by the
geneticist and evolutionary biologist JBS Haldane more than half a century ago, a visionary
polymath (Prentis, 1989). The term “biotechnology” is frequently refered to in contemporary
biology (Brown et al., 1988) but is variously defined as the application of biological
organisms, systems or processes to the manufacturing and service industries (Smith, 1990);
and as the controlled application of simple biological agents, such as living or dead cells, or
cell components, to technically useful operations, either in manufacture or as service
operations (Bu’lock and Kristiansen, 1987). Biotechnology integrates biology, microbiology,
biochemistry, chemical engineering and process engineering, together with other disciplines,
to optimize the exploitation of their potential (Bu’Lock and Kristiansen, 1987; Smith, 1990).
The European Federation of Biotechnology (EFB) has defined biotechnology as “the
integration of natural sciences and engineering in order to achieve the application of
organisms, cells, parts thereof and molecular analogues for products and services” (EFB
General Assembly, 1989; Qoura, 2006).
Examples of biotechnology can be traced back thousands of years. Wine and beer are
known to have been produced using microbes (yeast extract) prior to 6000 BC, and leavened
bread was similarly produced using yeast extract by 4000 BC (Prentis, 1989; Smith, 1990). A
more recent example from the sixteenth century is the harvesting of algae from lakes to be
used for food by the Aztecs (Smith, 1990; Qoura, 2006).
A first step in the understanding of biotechnology was made in the late 16th and early 17th
centuries, when microbes were first observed by Antoni van Leeuwenhoek using his newly
designed microscope. Later, during the 18th century, Louis Pasteur, who is known as the
father of microbiology, demonstrated the use of microorganisms in fermentation and could
also be considered as the father of biotechnology. In the early 20th century Eduard Buchner,
Chapter 1 Introduction __________________________________________________________________________
2
earned the Nobel Prize in chemistry for his further work on fermentation and his
demonstration that the enzymes extracted from yeast extract could convert sugar into alcohol
(Prentis, 1989; Smith, 1990; Qoura, 2006).
In the first half of the 20th century, the application of microbes to large-scale sewage
purification was established, Alexander Fleming discovered penicillin, and the double helix
structure of DNA was revealed. Later, and particularly during the seventies, genetic
engineering experiments were first undertaken, marking the beginning of applied genetics
and recombinant DNA technology. In addition, the technology for the production of
monoclonal antibodies evolved (Prentis, 1989; Smith, 1990; Qoura, 2006).
Over the previous decades, biotechnology has been developing very rapidly and has been
applied to all aspects of life. The importance of biotechnology lies in: Livestock husbandry
and animal health, the production of food crops, chemical and pharmaceutical industries, the
accurate diagnosis and prevention of human diseases, the conversion of biomass into
energy, the transformation of wastes and agricultural and industrial bio-products, pollution
control and environmental sanitation (Bull et al., 1982; Hacking, 1987; Yanchinski, 1985;
Zimmerman, 1984a,b; Qoura, 2006).
1.2 Odour and odorous compounds
1.2.1 Definitions
Odour may be defined as a physiological stimulus of the olfactory cells in the presence of
specific molecules. The nature and concentration of molecules detected by olfactory cells
varies between individuals and with environmental conditions, such as humidity, pressure
and temperature. According to this definition, the term odour includes volatile organic
compounds (VOCs) as well as some inorganic compounds (VICs) (Kennes and Veiga, 2001;
Rappert and Müller, 2005b).
Without a clear understanding of what odour is, how to measure it, and where it originates, it
will be difficult to control the odour (Mackie et al., 1998; Zhu, 2000).
Moeser et al. (2003) reported that the response to the odour depends on individual odour
perception (Rappert and Müller, 2005a).
Poor odour control and prevention of environmental problems are related to a lack of
knowledge of the fundamental nature of odour and its production. A quantitative description
Chapter 1 Introduction __________________________________________________________________________
3
of environmental odour exposure is limited both by the complexity of chemical mixtures and
by the sensitivity of the human nose (Rappert and Müller, 2005a).
1.2.2 Sources
Generation of odours is a complex process that involves many bacterial species (Rappert
and Müller, 2005a).
Biosolids are an abundant source of food for microorganisms, including proteins, amino
acids, and carbohydrates. The microorganisms degrade these energy sources, and odorous
compounds are formed (Rappert and Müller, 2005a).
Dimethyl disulfide (DMDS) is produced by many bacteria and fungi found in waste water
(Tomita et al., 1987; Sunesson et al., 1995). The methylation of sulfide may be responsible
for its emission (Tomita et al., 1987; Kelly et al., 1994; Ginzburg et al., 1999; Rappert and
Müller, 2005a).
Trimethylamine (TMA) is always present in the highest concentration compared with other
atmospheric amines (ca. 7-folds). This is possibly because of the fact that trisubstituted
amines are less readily attacked by the microorganisms during the protein catabolism than
monoamines (Rosenfeld et al., 2001). Trimethylamine (TMA) is frequently found in effluents
of fish meal manufacturing processes (Sandberg and Ahring, 1992; Hwang et al., 1994;
Rappert and Müller., 2005a).
1.2.3 Food processing
Odours generated in food processing plants are usually a low concentration mixture of
various organic and inorganic compounds. Most of these compounds are reduced carbon,
nitrogen, and/or sulfur compounds, such as aldehydes, ketones, alcohols, acids, ammonia,
amines, sulfides, mercaptans and hydrogen sulfide, which are easily biodegraded. In some
cases the odours may also be caused by volatile organic compounds, which are less
biodegradable (Rappert and Müller, 2005a).
Amines, nitriles, hydrocarbons and aldehydes result from decarboxylation and deamination
of amino acids at very high temperatures, significantly above the boiling point of water
(Mottram, 1991; Rappert and Müller, 2005a).
A number of volatile compounds in food may be produced by microbiological processes.
Microorganisms (fungi, yeast extracts, bacteria) produce volatile compounds during both
Chapter 1 Introduction __________________________________________________________________________
4
primary and secondary metabolisms from a wide variety of starting compounds (e.g.,
acetate, amino acids, fatty acids, and keto acids) as de novo biosynthesis products and
secondary metabolites (Rappert and Müller, 2005a).
Objectionable odours in the food industry are generally a result of the physical processing of
foods (such as heating, drying, or smoking of food). Typical odorous compounds
encountered in food processing include aldehydes, ketones, lactones, alcohols, acids,
esters, ammonia, amines, pyrazines, sulfides, mercaptans, and hydrogen sulfide, which are
not toxic and easily biodegradable (Rappert and Müller, 2005a).
An ester’s odour is described as fruity, berrylike, and floral, whereas an amine’s odour is
described as fishy (Rappert and Müller, 2005a).
1.2.4 Volatile organic compounds
VOCs are organic hydrocarbons that can volatilize to form an organic vapour in air.
Hydrocarbons are molecules that consist of hydrogen and carbon. Hydrocarbons with 1 to 4
carbon atoms exist in the gas phase at ordinary temperature and pressure. Hydrocarbons
with 5 to 12 carbon atoms exist in the liquid or solid phases at ordinary temperature and
pressure. Hydrocarbons with more than 12 carbon atoms do not volatilize sufficiently to
reach atmospheric concentrations in the gas phase (Waldbott, 1973; Rafson, 1998).
1.2.5 Exposure to VOCs
Exposure to volatile organic compounds (VOCs) occurs in the workplace. They are also the
most common accidental release in the outdoor environment. By definition, it is the volatility
of these organic compounds which renders them most susceptible to inhalation by exposed
workers. This most commonly occurs in manufacturing or other industries which rely on the
VOCs to perform a number of functions, including degreasing, lubricating, fueling, stripping
or thinning paint, and cleaning (Rafson, 1998).
Because of their lipid solubility, VOCs are readily absorbed by the lung, gastrointestinal tract,
and, in liquid form, the skin. They may bioaccumulate in lipid tissues in the body. In general,
most of the internal dose is eliminated quickly, although a small fraction is eliminated more
slowly. Cigarette smoking is a major source of VOCs found in the body and is the major
confounder in studies of workers and potentially exposed citizens (Ashley et al., 1996).
Most chemical solvents and all the VOCs are known to cause both acute and chronic Central
Nervous System (CNS) disease. In addition, the fat-soluble VOCs easily move into the
Chapter 1 Introduction __________________________________________________________________________
5
airways and across the lung tissue into the bloodstream. Many of them have a local, irritating
effect on the airways and can cause irritation of the respiratory tract, leading to (1) throat
irritation and coughing in mild exposure, (2) irritation of the airways, leading to spasm and
wheezing which may be transient or permanent, or (3) damage to the lung itself, leading to
leakage of fluid into lung tissue and impairing diffusion of oxygen across the tissue (Rafson,
1998).
VOCs may also cause liver disease. In some cases, the liver may create metabolic products
which are more toxic than their parent compounds. All the VOCs can be irritating to the skin,
particularly when contacted in liquid form. Formaldehyde has been shown to cause an
allergy-based contact dermatitis. Because of their fat solubility, and after damaging protective
layers of skin, the VOCs are readily absorbed through the skin into the bloodstream (Rafson,
1998).
1.2.6 Odour treatment
The basic principles for controlling odours are reduction of odours at the generation sources
and removal of odours from collection air-stream before the odours are discharged into the
atmosphere. The major techniques for removing odorous compounds from the exhaust air
stream include mist filtration, absorption (scrubbing), adsorption, thermal
oxidation/incineration, chemical oxidation, and biological oxidation (biofiltration, biotrickling
filtration, bio scrubbing) (Rappert and Müller, 2005a).
Although many technologies exist, biofiltration still is the most attractive method due to its low
maintenance and operating costs (Sheridan et al., 2003). Biofilters are generally used to
clean the air exiting the building through exhaust fans. However, biofilters have only been
efficient at treating low concentrations of odorants from waste exhaust air. Aeration, the basic
principle of this treatment is to provide, by whatever means, enough dissolved oxygen to
aerobic bacteria so they can actively decompose the odorous compounds; hence achieving
odour reduction (Rappert and Müller, 2005a).
A biofiltration system consists mainly of a reactor packed with solid materials (e.g. peat,
perlite, compost, wood chips) on which a biofilm is formed, given the proper microbial
population. When a contaminated air stream passes through the reactor, the pollutants are
transferred to the biofilm where they are biodegraded to simple end products such as water
and carbon dioxide (Adler, 2001). A consortium of microbial populations is known to play an
important role in this process, but current understanding of the mechanisms and specific
microbial enzymes involved is limited (Burgess et al., 2001; Torkian et al., 2005).
Chapter 1 Introduction __________________________________________________________________________
6
Studies on biofiltration over the last several decades have primarily been focused on odorous
compounds such as hydrogen sulphide, ammonia, mercaptanes, etc. (Strikauska et al.,
1999; Wani et al., 1999; Busca and Pistarino, 2003). However, adoption of stricter emission
policies in recent years has greatly increased the inventory of compounds subject to
regulation. Furthermore, increasing costs of chemicals and disposal of hazardous wastes
have provided further incentive for development and optimization of biological treatment
methods. Biofiltration has emerged as one of the cost effective biological air pollution control
technologies for treatment of volatile organic compounds (VOCs) emitted from chemical and
process industries (Yoon and Park, 2002; Torkian et al., 2005).
1.2.7 Analysis technique
Gas chromatography (GC) is the technique most commonly applied to separate and identify
volatile and gaseous samples. This method provides the accurate concentration of specific
compounds in a sample and can be used on-site and for continuous assessment (Rappert
and Müller, 2005a).
1.3 Ethyl acrylate
1.3.1 Properties
Ethyl acrylate (C5H8O2) is a colourless organic compound with a sharp, acrid penetrating
odour. The odour threshold for ethyl acrylate ranges from 0.001 to 0.005 parts per million
(ppm) parts of air. The vapour pressure for ethyl acrylate is 40 mm Hg at 26 ºC, and its log
octanol/water partition coefficient (log Kow) is 1.33. It is also called carbonyl ethylene, 1-
propenoic acid ethyl ester, 2-propenoic acid ethyl ester, ethyl-2-propenoate, ethyl propenoate
(IUPAC name), ethyl acrylic ester, acrylic acid ethyl ester and ethoxycarbonyl ethylene
(Online 1; 2; 6; 7; 12; 15).
Ethyl acrylate is flammable, highly reactive and slightly soluble in water and is completely
miscible with ether, chloroform and alcohol. Elevated temperatures may cause
polymerization and contact of ethyl acrylate with oxidizers, peroxides, polymerizers, strong
alkalies, or moisture causes a violent reaction. When heated to decomposition, ethyl acrylate
emits smoke and acrid fumes (Online 1; 2; 4).
Ethyl acrylate is used in the production of polymers including resins, plastics, rubber and
denture material. It has been produced commercially since the early 1930s. Occupational
exposure occurs in the manufacture of ethyl acrylate and in the manufacture and use of its
Chapter 1 Introduction __________________________________________________________________________
7
emulsion polymers. It is also used as a synthetic flavouring substance and fragrance
adjuvant in consumer products, but it should be noted that its use as a food additive has
been steadily decreasing since the early 1980s (Online 2; 3; 10).
1.3.2 Occurrence
Ethyl acrylate occurs naturally in some fruits: Blackberries, raspberries, pineapples and
yellow passion fruit (BUA, 1995). Ethyl acrylate levels in these fruits are very low, with
pineapples having ethyl acrylate concentrations of 0.77 mg/kg (IARC, 1986; Online 6).
1.3.3 Applications
Ethyl acrylate is used to form paint coatings that are resistant to water, sunshine and
weather. These coatings retain flexibility even at low temperatures. Ethyl acrylate is also
used in industrial finishes and coatings for cans and coils. Fabrics gain texture and durability
when ethyl acrylate is added during their manufacture. Ethyl acrylate also imparts dirt
resistance, improves abrasion and binds pigments to fabric. Paper is coated with ethyl
acrylate to make it water-resistant. Magazines, books, business paper, frozen-food
packaging and folding boxboards have such coatings, making them resistant to water,
grease and oil. Ethyl acrylate is also used in adhesives for envelopes, labels and decals.
Caulk, glazing and various sealants also contain ethyl acrylate. Leather products, such as
automotive upholstery, furniture, clothing and shoes contain ethyl acrylate so that
topcoatings do not migrate. Ethyl acrylate is also used as a fragrance additive in various
soaps, detergents, creams, lotions, perfumes and as a synthetic fruit essence (IARC 1986).
Ethyl acrylate is also found in such household items as nail mending kits and in medical
items that assist with the binding of tissues, sealing wounds and ileostomy appliances
(Online 6).
1.3.4 Preparation
Ethyl acrylate can be prepared by several industrial methods. Acrylonitrile can be reacted
with ethanol using sulphuric acid as a catalyst to produce ethyl acrylate. It may also be
prepared from acetylene, carbon monoxide and ethanol (Online 2).
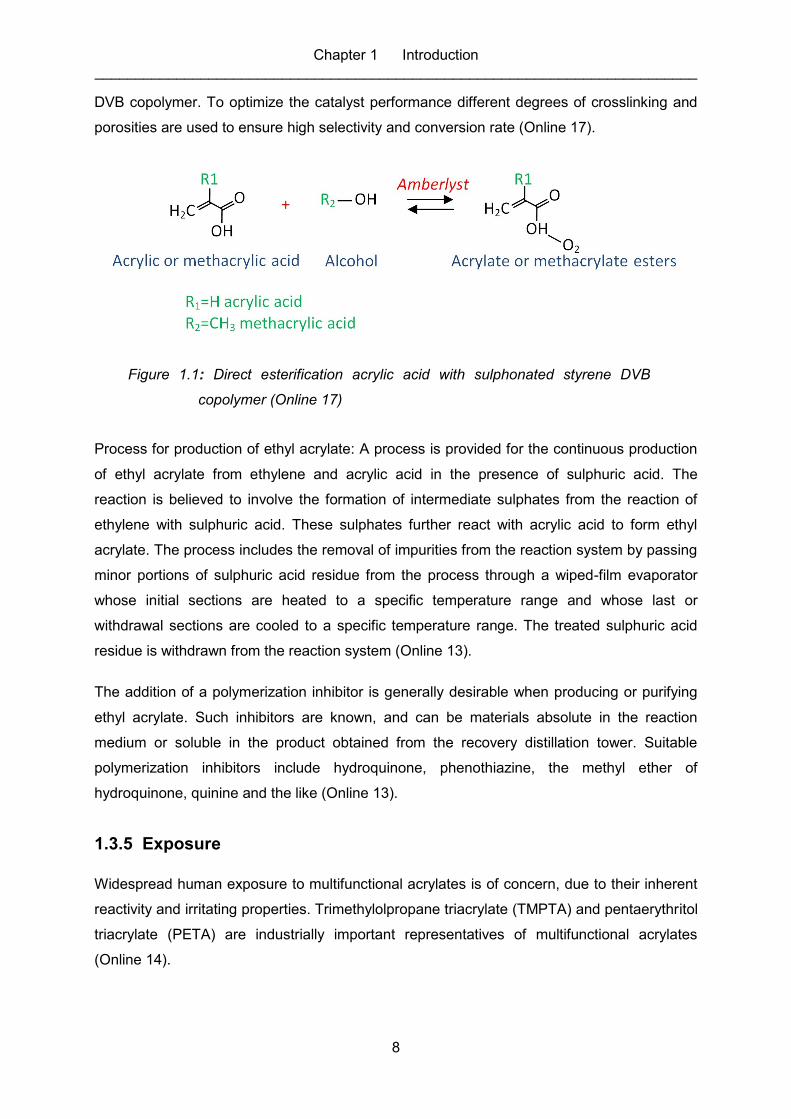
The direct esterification of alcohol with acrylic acid is the only significant route for the
production of esters (Figure 1.1). Some smaller volume esters are produced through
transesterification. It is catalyzed by an acid such as sulphuric acid or a sulfonated styrene
Chapter 1 Introduction __________________________________________________________________________
8
DVB copolymer. To optimize the catalyst performance different degrees of crosslinking and
porosities are used to ensure high selectivity and conversion rate (Online 17).
Figure 1.1: Direct esterification acrylic acid with sulphonated styrene DVB
copolymer (Online 17)
Process for production of ethyl acrylate: A process is provided for the continuous production
of ethyl acrylate from ethylene and acrylic acid in the presence of sulphuric acid. The
reaction is believed to involve the formation of intermediate sulphates from the reaction of
ethylene with sulphuric acid. These sulphates further react with acrylic acid to form ethyl
acrylate. The process includes the removal of impurities from the reaction system by passing
minor portions of sulphuric acid residue from the process through a wiped-film evaporator
whose initial sections are heated to a specific temperature range and whose last or
withdrawal sections are cooled to a specific temperature range. The treated sulphuric acid
residue is withdrawn from the reaction system (Online 13).
The addition of a polymerization inhibitor is generally desirable when producing or purifying
ethyl acrylate. Such inhibitors are known, and can be materials absolute in the reaction
medium or soluble in the product obtained from the recovery distillation tower. Suitable
polymerization inhibitors include hydroquinone, phenothiazine, the methyl ether of
hydroquinone, quinine and the like (Online 13).
1.3.5 Exposure
Widespread human exposure to multifunctional acrylates is of concern, due to their inherent
reactivity and irritating properties. Trimethylolpropane triacrylate (TMPTA) and pentaerythritol
triacrylate (PETA) are industrially important representatives of multifunctional acrylates
(Online 14).
Chapter 1 Introduction __________________________________________________________________________
9
Exposure to ethyl acrylate can occur through inhalation, ingestion and eye or skin contact. It
is a strong irritant of the eyes, skin, mucous membranes, respiratory system and
gastrointestinal tract in humans (Clayton and Clayton, 1981-1982; Hathaway et al. 1991). At
a concentration of 50 ppm, for a period of exposure described only as “prolonged”, exposure
to ethyl acrylate caused drowsiness, headache, and nausea (ACGIH 1991; Hathaway et al.
1991). Ethyl acrylate causes sensitization in some exposed individuals; a 4 percent
concentration in petroleum jelly caused skin sensitization in 10 of 24 volunteers (ACGIH
1991; Hathaway et al. 1991; Online 1).
Acute exposure to ethyl acrylate vapour may cause irritation of the eyes, nose, and throat,
with tearing, runny nose and burning of the throat. While chronic exposure to ethyl acrylate
may cause skin sensitization, with redness, swelling and itching of the affected areas (DFG,
1994; Potokar et al., 1985; Online 1; 16).
Following inhalation exposure, ethyl acrylate is hydrolysed by carboxylesterases to acrylic
acid in the nasal cavity (Frederick et al., 1994). Resorption is higher in the upper respiratory
tract than in the lower respiratory tract (Stott and McKenna, 1984). After oral administration
(gavage) ethyl acrylate is rapidly absorbed and distributed into all major tissues of rats. The
major route of excretion after oral application is exhalation of CO2 (about 70% of the
administered dose) followed by urinary excretion of mercapturic acids, degradation products
of GSH conjugates (Ghanayem et al., 1987; Online 16).
Carcinogenicity: Ethyl acrylate was first listed in the National Toxicology Program (NTP)
Fifth Annual Report on Carcinogens as reasonably anticipated to be a carcinogen based
upon a gavage study resulting in dose-related forestomach benign and malignant neoplasms
in rats and mice (NTP 1998; Online 6; 7).
It was reported that an excess of colon and rectum cancers (p = 0.0001) was found in a
group of 3934 workers exposed to ethyl acrylate prior to 1946 compared with unexposed
workers. However, this study is confounded by the fact that there was concurrent exposure
to a number of other chemicals (unquantified); ethyl acrylate comprised approximately 10%
of all the chemicals manufactured at the plant (Online 10).
No data are available to evaluate the reproductive effects or prenatal toxicity of ethyl acrylate
to humans and also no case report or epidemiological study is available to evaluate the
carcinogenicity of ethyl acrylate to humans. On the other hand, there is sufficient evidence
for the carcinogenicity of ethyl acrylate in experimental animals (Online 3).
Chapter 1 Introduction __________________________________________________________________________
10
In one experiment in rats, oral administration of ethyl acrylate produced signs of
embryotoxicity and foetotoxicity at mildly maternally toxic doses but did not increase foetal
malformation. It was not embryotoxic, foetotoxic or teratogenic to rats at an airborne
concentration that produced slight maternal toxicity (Online 9).
Ethyl acrylate was not mutagenic to Salmonella typhimurium in the presence or absence of
an exogenous metabolic system, nor was it mutagenic to Drosophila melanogaster. It
induced chromosomal aberrations in Chinese hamster lung cells in vitro and micronuclei in
the bone marrow of mice treated in vivo (Online 9).
The US government and the National Toxicology Programs (NTP) removed ethyl acrylate
from its list of potential cancer-causing agents in 2000. This is the first time that the NTP has
removed a substance from its list, but this does not change the current need to reference
ethyl acrylate on Material Data Safety Sheets (MSDSs). Although ethyl acrylate induces
tumors in animals, it only does so when the chemical is given by mouth at such high
concentrations that there is severe persistent injury to the stomach. Comparable “significant
chronic human oral exposure to (comparably) high concentrations of ethyl acrylate” was
deemed by the government to be “unlikely” (Online 5; 11).
Environmental exposure: Ethyl acrylate enters the environment mainly as a result of spills
and industrial discharges. Human exposure to ethyl acrylate occurs mostly through inhalation
of ethyl acrylate vapours, but it may also result from skin contact or drinking contaminated
water. Ethyl acrylate is highly soluble in water and is slightly persistent (half-life of 2-20
days). However, the majority of ethyl acrylate will dissipate and mix with the air (91%). Ethyl
acrylate also bioaccumulates in fish; with fish tissues analyzed having about the same
average concentrations as the water they inhabit (EPA, 1998; Online 6).
1.3.6 Toxicity
Genotoxicity: The genotoxicity of ethyl acrylate has been investigated extensively in both in
vitro and in vivo assays. The in vitro assays demonstrate that ethyl acrylate can induce DNA
damage including chromosomal aberrations and gene/point mutations. When tested in vivo,
ethyl acrylate was found to be nonmutagenic in systems measuring both the induction
chromosomal damage and induction of gene/point mutations. The lack of mutagenicity in
vivo is consistent with data in rats on its rapid metabolism by hydrolysis to acrylic acid (IARC
1986). Thus, ethyl acrylate has mutagenic potential for the induction of chromosomal
damage that is not fulfilled in vivo due to its rapid metabolism. In conclusion, the in vitro and
Chapter 1 Introduction __________________________________________________________________________
11
in vivo data on the genotoxicity of ethyl acrylate are consistent with the interpretation that
ethyl acrylate should be considered non-genotoxic to exposed human populations (Online 6).
1.3.7 Metabolism
The major metabolite of ethyl acrylate is acrylic acid (C3H4O2). It is a clear colourless liquid
and is soluble in water, DMSO, 95% ethanol and acetone (Miller et al., 1981; Online 6).
Ethyl acrylate is metabolized by carboxylesterases (Silver and Murphy 1981; Stott and
McKenna 1985; Udinsky and Frederick 1989) and by conjugation with glutathione (GSH)
(Hashimoto and Aldridge 1970; Frederick et al., 1992). The mercapturic acid of ethyl acrylate
has also been shown to be a minor urinary metabolite (deBethizy et al., 1987). It has also
been proposed that ethyl acrylate binds to proteins and lipids in vivo (Ghanayem et al., 1987;
Online 6).
Ethyl acrylate biodegrades faster in air than in water. In the atmosphere, it undergoes photo
oxidative reduction with OH-radicals, and its half-life has been calculated at 13.7 hours. Ethyl
acrylate has also been qualitatively detected in the air of a landfill in the United States. Ethyl
acrylate can be readily absorbed into the ground, making it a very mobile compound (BUA
1995; Online 6).
1.3.8 Sampling and analysis
Ethyl acrylate vapour sampling is the best method for determining environmental ethyl
acrylate concentrations. National Institute of Occupational Safety and Health (NIOSH)
approves of various collection tubes, with the best being a carbon disulfide tube. The tubes
are then analyzed by gas chromatography. Biomarkers are not used because they cannot
accurately be analyzed (NIOSH, 1981; Online 6).
1.4 Amines
1.4.1 Definition
General Description Of Amine: Amine is a group of basic organic compounds derived from
ammonia (NH3) by replacement of one (primary amines), two (secondary amines), or three
(tertiary amines) hydrogen atoms by alkyl, aryl groups or organic radicals. Amines, like
ammonia, are weak bases because the unshared electron pair of the nitrogen atom can form
a coordinate bond with a proton. Amines react with acids to give salts and with acid
Chapter 1 Introduction __________________________________________________________________________
12
anhydrides (or ester) to form amides. They react with halogenoalkanes to form longer chains
(Online 22).
Many amines are not only bases but also nucleophiles that form a variety of electrophile
compounds. They are important intermediates for chemical syntheses due to the basic
functionality of the nitrogen atom and electrophilic substitution at nitrogen (Online 22).
Amines, in general, are difficult to collect and analyse because of their reactivity. For many
tertiary amines, NIOSH (National Institute for Occupational Safety and Health) and OSHA
(Occupational Safety and Health Administration) do not presently have validated sampling
and analysis methods. The most suitable methods for validation for triethylamine were
considered to be those of (Andersson and Andersson, 1989). These methods for sampling
and analysis of triethylamine involve collection on a charcoal tube and analysis by a gas
chromatograph equipped with a flame ionization detector (FID) or a thermionic specific
detector (TSD). The charcoal tubes must be stored under freezer conditions as soon as
possible after sampling. Ideally, they should be analysed within 15 days (Verma et al., 1998).
1.4.2 Preparation
Synthetic amines are made mostly by reaction of alcohols with ammonia, catalyzed by
metals (nickel or copper) or metal oxide at high temperature (Online 22).
Primary amines contain the functional group –NH2 (amino group) and are converted into
secondary and tertiary amines if heated with alkyl or aryl iodides. Tertiary amines combine
with one molecular proportion of an alkyl iodide to form quaternary ammonium salts in which
a central nitrogen atom is joined to four organic radicals and one acid radical. Quaternary
ammonium salts are used as corrosion inhibitor, emulsifying and antiseptic agents. Aliphatic
amines which have the lowest carbon content are water-soluble gases or liquids of low
boiling point, also readily soluble in water in the case of the next lowest carbon content. But
aliphatic amines which have the high carbon content are odourless solids of high boiling
point and are insoluble in water. They are all bases and easily form salts with the mineral
acids and double salts with the halogenoalkanes. Amine salts are crystalline substances that
are readily soluble in water. If alkali (sodium hydroxide) is added to solutions of such salts
the free amine is liberated (Online 22).
1.4.3 Applications
Amines are used as reducing agents for the recovery of precious metals. They are versatile
intermediates. They have active applications in organic synthesis for polymerization catalyst,
Chapter 1 Introduction __________________________________________________________________________
13
chain extender in urethane coatings, agrochemicals, pharmaceuticals, photographic, heat
stabilizers, polymerization catalysts, flame-retardants, blowing agents for plastics, explosives
and colorants. Alkyl tertiary amines are used as fuel additives and preservatives. They have
similar applications with long chain alkyl amines. Aromatic amines also exist, such as
phenylamine, which are important for the production of diazonium salts. They dissociate in
water (some very weakly). Aromatic amines are much weaker bases than the aliphatics. One
of the most important aromatic amines is aniline, a pale brown liquid boiling at 184 °C,
melting at – 6 °C (Online 22).
Amines are widely used as catalysts in casting operations. They are also the major pollutants
in the gaseous emissions of chemical manufacturing factories (Torkian et al., 2005). Tertiary
amines, such as triethylamine, are the main gaseous catalysts comprising the majority of
nitrogenous emissions (Borger et al., 1997). Previous studies have suggested suitable
biodegradation potential of amines (Tang et al., 1996; Chou and Shiu, 1997). As such,
biofiltration seems to be an appropriate method to treat waste gases containing these
pollutants (Torkian et al., 2005).
1.5 Triethylamine
1.5.1 Properties
Triethylamine is the colourless chemical compound with the formula N(CH2CH3)3, commonly
abbreviated Et3N. It has a strong fishy ammonia-like odour, with an odour threshold of 0.48
ppm (Online 21). Triethylamine exhibits golden yellow colour on long standing (Online 32).
The vapour pressure for triethylamine is 54 mm Hg at 20 °C and its log octanol/water
partition coefficient (log Kow) is 1.45 (Online 21). It is also called N,N-diethylethanamine, TEA,
TEN, di(ethylamino)ethane or diethylaminoethane and N,N,N-triethylamine. It is commonly
encountered in organic synthesis probably because it is the simplest symmetrically
trisubstituted amine, i.e. a tertiary amine, that is liquid at room temperature.
Diisopropylethylamine (Hünig’s base) is a widely used relative of triethylamine. Triethyamine
is also the smell of the hawthorn plant, and semen, among others (Lloyd, 2006; Online 18;
19; 21; 32).
Triethylamine is stable, moderately soluble in water and extremely flammable (Online 19). It
is also soluble in acetone, benzene and chloroform (Online 31). It readily forms explosive
mixtures with air and is incompatible with strong oxidizing agents, strong acids, ketones,
aldehydes and halogenated hydrocarbons (Online 19; 31).
Chapter 1 Introduction __________________________________________________________________________
14
Triethylamine is heavier than air and may travel a considerable distance to a source of
ignition (Online 27).
Triethylamine is a high volume chemical with production exceeding 1 million pounds annually
in the U.S. It is used in consumer products, building materials or furnishings that contribute to
indoor air pollution and is ranked as one of the most hazardous compounds (worst 10%) to
ecosystems and human health (Online 20).
1.5.2 Applications
Triethylamine is commonly used as a catalyst in the making of foundry sand molds, phenolic
resins, polycarbonates, polyesters and engineered plastics. It has a variety of pharmaceutical
applications where it is used as an extraction solvent and as an intermediate in the
manufacture of Antibiotics like Penicillin, Ampicillin, Amoxycillin, Cephalexin and other
derivatives (Online 32). It is also used in the synthesis of pesticides, pharmaceuticals, paints
and coatings, corrosion inhibitors (Online 28) and as a catalyst in the esterification reaction to
manufacture perfume (Online 32).
Triethylamine is used as a catalytic solvent in chemical syntheses; as an accelerator
activator for rubber; as a corrosion inhibitor; as a curing and hardening agent for polymers;
as a propellant; in the manufacture of wetting, penetrating, and waterproofing agents of
quaternary ammonium compounds; and for the desalination of seawater (Online 21).
Triethylamine was found to catalyze the reaction of Phenols benzoylation in dioxane at 25
°C. This acylation reaction was studied for substituted nitrophenols (R = 2,4,6-(NO2)3, 2,5-
(NO2)2, 2,4-(NO2)2, 4-(NO2), 4-NO, 4-PhN=N) (Belousova et al., 1999).
Triethylamine is commonly employed in organic synthesis as a base, most often in the
preparation of esters and amides from acyl chlorides (Sorgi, 2001). Such reactions lead to
the production of hydrogen chloride which combines with triethylamine to form the salt
triethylamine hydrochloride, commonly called triethylammonium chloride. This reaction
removes the hydrogen chloride from the reaction mixture, which is required for these
reactions to proceed to completion (R, R’ = alkyl, aryl) (Online 18).
R2NH + R’C(O)Cl + Et3N → R’C(O)NR2 + Et3NH+Cl-
Chapter 1 Introduction __________________________________________________________________________
15
Like other tertiary amines, it catalyzes the formation of urethane foams (Albrecht and
Stephenson, 1988) and epoxy resins and is used as a corrosion inhibitor for polymers
(Nelson and Bull, 1990). It is also useful in dehydrohalogenation reactions and Swern
oxidations (Online 18). Triethylamine is one of the amines emitted from cattle feedlots
(Mosier et al., 1973) and in the gas phase it can react with nitric acid to form amine nitrates
that become part of atmospheric particulates (Online 31).
Triethylamine is readily alkylated to give the corresponding quaternary ammonium salt
(Online 18):
RI + Et3N → Et3NR+I-
Triethylamine is ideal for HPLC separation and analysis of peptides. It is an ion-pairing
reagent that alters selectivity in reverse-phase HPLC separations. By pairing with peptides, it
effectively sharpens peaks, resulting in improved peak resolution (Online 26).
In 1996, C7 gas mask filters entered service. They contain a dual bed of carbon with the inlet
bed (i.e., upper bed) being 7 percent triethylamine (TEA) impregnated base carbon (known
as BPL) and the outlet bed (i.e., lower bed) ASC carbon with 3 percent TEDA
(triethylenediamine). The C7 filter contains a total of 250 ml of adsorbent with the inlet and
outlet bed each containing 125 ml. Triethylamine was selected as the impregnant of choice
because of its superior chemisorptive properties (Verma and Eckstein, 1998).
1.5.3 Exposure
Triethylamine is corrosive – causes burns, is harmful by ingestion, inhalation and if absorbed
through the skin. Chronic exposure may cause liver damage and it is very damaging to the
mucous membranes. Triethylamine is also a lachrymator (tear gas) (Online 19; 31).
Environmental data: Triethylamine is harmful to aquatic organisms (Online 29). When
released into the soil, this material may leach into groundwater and may evaporate to a
moderate extent. And when released into water, it may evaporate to a moderate extent.
Triethylamine has an estimated bioconcentration factor (BCF) of less than 100 and is not
expected to significantly bioaccumulate. When released into the air, it is expected to be
readily degraded by reaction with photochemically produced hydroxyl radicals and be readily
removed from the atmosphere by wet deposition (Online 30).
Chapter 1 Introduction __________________________________________________________________________
16
Occupational exposure to triethylamine may occur primarily via inhalation and dermal contact
during its manufacture and use. Exposure to 200 ppm is immediately dangerous to life and
health. Triethylamine can irritate the lungs and repeated exposure may cause bronchitis to
develop with cough, phlegm and/or shortness of breath. The general population may be
exposed to triethylamine from ingesting contaminated food; triethylamine has been identified
in broiled beef (Bethesda, 1993; Online 21; 25).
Acute (short-term) exposure of humans to triethylamine vapour causes eye irritation, corneal
swelling and halo vision. People have complained of seeing “blue haze” or having “smoky
vision.” These effects have been reversible upon cessation of exposure. Acute exposure can
irritate the skin and mucous membranes in humans (Online 21).
Amines have been noted to have other effects on the eye, including mydriasis and
cycloplegia (Albrecht and Stephenson, 1988; Reilly et al., 1995).
In a study carried out to determine the effects of experimental exposure to triethylamine on
vision and the eye, it was found that triethylamine caused a marked oedema and microcysts
in corneal epithelium but only minor increases in corneal thickness. The effects may be
mediated by the lacrimal fluid owing to its high triethylamine concentration. Four hour
exposure to a triethylamine concentration of 3.0 mg/m3 seemed to cause no effects, whereas
exposure to 6.5 mg/m3 for the same period caused blurred vision and a decrease in contrast
sensitivity (Järvinen, 1998; Järvinen et al., 1999).
In another study carried out in a foundry in Japan, complaints of visual disturbances were
found to be prevalent among workers exposed to triethylamine. This study suggested that
visual disturbances could develop even at about 1 ppm, but as reported by all workers, these
symptoms were transient and improved within several hours after discontinuation of work
exposed to triethylamine (Yoshida et al., 2001).
The ocular toxicity observed with triethylamine is most likely not due to a specific property of
the chemical, but rather to the alkaline nature of aliphatic amines. It is a sensitive effect in
humans, with minimal effects occurring at around 10 mg/m3 (Warren and Selchan, 1988;
Åkesson et al., 1988; Online 23).
A study was carried out by Järvinen to determine if the exposure to triethylamine provokes
headaches and elevated blood pressure among the workers of three different foundries
(Järvinen, 1998). As stated earlier by Diamond and Baltes, many chemicals can produce
headaches by vasodilatation (e.g., nitrates) or hypoxia (e.g., carbon dioxide or carbon
monoxide). In addition, other factors, such as odours and noise, can cause headaches
Chapter 1 Introduction __________________________________________________________________________
17
(Diamond and Baltes, 1967). Some reports have suggested a relationship between amine
exposure and headaches. Theoretically headaches can develop from the possible histamine
releasing and vasodilating effects of the amines (Albrecht and Stephenson, 1988). In the
clinical classification of headaches (traction headache, vascular headache and muscle
tension headache), triethylamine induced headache is likely to be of the vascular type
(Diamond and Baltes, 1967). The results of Järvinen suggest, however, that triethylamine
exposed workers more regularly have work-associated mild headaches and it seems unlikely
that triethylamine exposure is associated with elevated blood pressure (Järvinen, 1998).
Acute animal tests, such as the LC50 and LD50 tests in rats, mice and rabbits, have
demonstrated triethylamine to have moderate acute toxicity from inhalation, moderate to high
acute toxicity from oral exposure and high acute toxicity from dermal exposure (Online 21).
Chronic (long-term) exposure of workers to triethylamine vapour has been observed to cause
reversible corneal edema (Online 21).
Chronic inhalation exposure has resulted in inflammation of the nasal passage in rats.
Thickening of the interalveolar walls of the lungs, mucous accumulation in the alveolar
spaces of the lungs, and haematological effects have also been reported in rats chronically
exposed by inhalation (Online 21).
Chronic inhalation exposure of rabbits has been reported to cause irritation of the lungs,
edema, moderate peribronchitis, vascular thickening and eye lesions (Online 21).
The inhalation Reference Concentration (RfC) for triethylamine is 0.007 mg/m3 based on
inflammation of the nasal passages in rats (Lynch et al., 1990). It considers toxic effects for
both the respiratory system (portal-of-entry) and for effects peripheral to the respiratory
system (extrarespiratory effects). In general, the RfC is an estimate (with uncertainty
spanning perhaps an order of magnitude) of a daily inhalation exposure of the human
population (including sensitive subgroups) that is likely to be without an appreciable risk of
deleterious effects during a lifetime (Online 21; 23; 31).
There is no direct evidence in the literature to quantify a differential effect of triethylamine in
infants and children. However, it is a respiratory irritant and thus has the potential to
exacerbate asthma. In addition, other alkylamines are known to be associated with
occupational asthma (Bernstein et al., 1999). There is some concern that triethylamine could
have a similar effect (Online 31)

Chapter 1 Introduction __________________________________________________________________________
18
No information is available on the reproductive, developmental or carcinogenic effects of
triethylamine in humans or animals. And EPA (Environmental Protection Agency) has not
classified triethylamine with respect to potential carcinogenicity (Online 21; 24).
1.5.4 Metabolism
Although the knowledge of the metabolism of triethylamine in humans is important for the
use of biological monitoring as a means to control exposure and risk, it was not studied until
1988 (Åkesson et al., 1988). The metabolism of a similar amine, trimethylamine (TMA), has
been studied extensively, both in animals and in man. Trimethylamine is, to some extent,
excreted unmetabolized in the urine. In addition, trimethylamine-N-oxide (TMAO), is formed
which is excreted into the urine. The fractional oxygenation of triethylamine is much less than
that observed for trimethylamine (Strack et al., 1963). Neither the calculations of absorbed
amounts of triethylamine nor the chromatograms obtained at the analysis of plasma and
urine indicated any dealkylation of triethylamine (formation of diethylamine). Had it been
formed, it would appear in the urine, as excretion of diethylamine and monoethylamine has
been shown in man after ingestion of these compounds (Rechenberger, 1940; Åkesson et
al., 1988).
1.6 Degradation of environmental pollutants
Public awareness and concern about the quality of our environment is currently a strong
driving force for improved pollution control. A highly effective and economically viable
alternative method of pollution control is the microbial control of pollution. Bioremediation is
becoming the technology of choice for the remediation of many contaminated environments.
For the treatment of various waste effluents and contaminated environments many
processes are currently used that rely enormously on microbial activity. Although microbial
control of pollution is not a new concept and a number of biological treatment technologies
have been developed, some pollution problems, such as the odour problem, remain to be
solved (Rappert and Müller, 2005b).
Biological treatment is an environmentally safe technology, treatment is generally performed
at ambient temperatures and it does not generate nitrogen oxides nor secondary waste
streams (Deshusses, 1997). Organic pollutants are generally converted to carbon dioxide
and water under the metabolic action of growing or resting microorganisms (Deshusses,
1997; Lewandowski and DeFilippi, 1998; Rappert and Müller, 2005b).
Chapter 1 Introduction __________________________________________________________________________
19
Microorganisms can transform virtually any organic compound, whether manmade or
naturally occurring, if the environmental conditions (oxygen content, chemical composition,
temperature, etc.) are suitable and the compounds are not toxic to microorganisms
(Lewandowski and DeFilippi, 1998; Rappert and Müller, 2005b).
Biodegradation is dependent on three major factors: (1) the presence of microorganisms that
can degrade the specific chemical structure, (2) environmental conditions that allow the
microorganisms to grow and release their degradation enzymes, and (3) good physical
contact between the organic substrate and the organism (Rappert and Müller, 2005b).
Biodegradation mostly results in the mineralisation of the target or parent compound into
inorganic compounds containing C, N, P, and S (Alexander, 1999). Considering the
mineralisation of hazardous compounds, microorganisms are very often the only means of
converting these chemicals into inorganic products. Not to be neglected in this context is the
fact that there are compounds in existence, which are converted by microorganisms into
other organic substances, which in turn accumulate in the environment. These substances
can be more toxic than the parent compound (Otto, 2001).
Because microorganisms play the major role in successful biological odour treatment
system, the understanding of microbial degradation of the key odorants is very important.
Some of the key odorous compounds selected are sulphides, esters, amines, and pyrazine
compounds (Rappert and Müller, 2005b).
Air pollutants that are detected most easily are those related to odour or smell problems.
Other contaminants leading to air pollution problems, such as carcinogenic compounds, are
more difficult to detect although they are not less harmful. Their effect is often visible only
after several years (Kennes and Veiga, 2001; Rappert and Müller, 2005b).
Odorous waste gases are a special kind of air pollutant (Hunter and Oyama, 2000). Odour
emissions are important sources of air pollution in many industrial plants, in particular in
livestock production, food processing plants, composting plants, waste water treatment
facilities, rubber processing, pharmaceutical processing, pulp and paper processing,
petroleum refining, paint finishing plants and chemical production (Valentin and North, 1980;
Glowiak et al., 1985; Fouhy, 1992; Passant et al., 1992; Williams and Miller, 1992; Luch,
1994; Kapahi and Gross, 1995; Both, 2001; Rappert and Müller, 2005b).
Chapter 1 Introduction __________________________________________________________________________
20
1.6.1 Biodegradation of amines
Amines are compounds derived from ammonia with one or more of the hydrogen atoms
replaced by alkyl groups. Examples include methylamine, dimethylamine, and trimethylamine
(Rafson, 1998).
Amines, such as dimethylamine (DMA), trimethylamine (TMA), diethylamine (DEA), and
triethylamine (TEA), are the major pollutants in the gaseous emissions of chemical
industries, food industries, and agricultural operations (Tang et al., 1996; Van Agteren et al.,
1998; Chang et al., 2004; Rappert and Müller, 2005b). The characteristics of these
compounds are shown in Table 1.1. The occurrences, toxic properties and microbial
degradation of each of these compounds are described below (Rappert and Müller, 2005b).
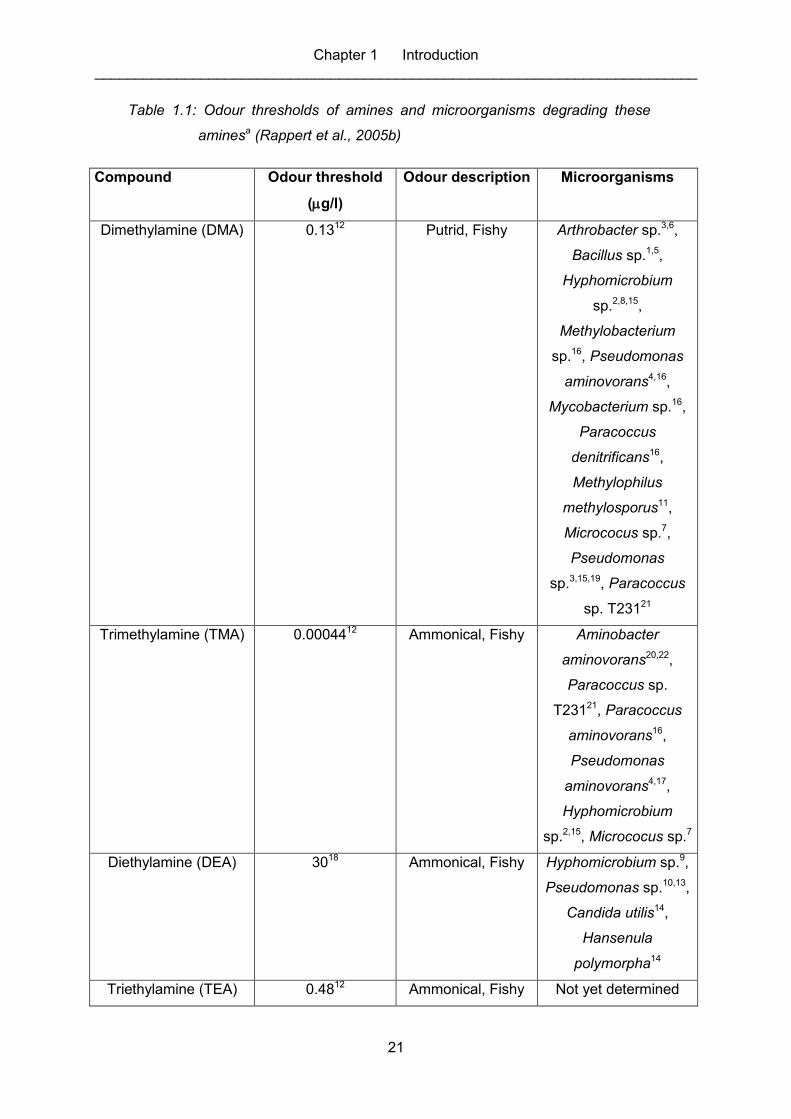
Chapter 1 Introduction __________________________________________________________________________
21
Table 1.1: Odour thresholds of amines and microorganisms degrading these
aminesa (Rappert et al., 2005b)
Compound Odour threshold
(g/l)
Odour description Microorganisms
Dimethylamine (DMA) 0.1312 Putrid, Fishy Arthrobacter sp.3,6,
Bacillus sp.1,5,
Hyphomicrobium
sp.2,8,15,
Methylobacterium
sp.16, Pseudomonas
aminovorans4,16,
Mycobacterium sp.16,
Paracoccus
denitrificans16,
Methylophilus
methylosporus11,
Micrococus sp.7,
Pseudomonas
sp.3,15,19, Paracoccus
sp. T23121
Trimethylamine (TMA) 0.0004412 Ammonical, Fishy Aminobacter
aminovorans20,22,
Paracoccus sp.
T23121, Paracoccus
aminovorans16,
Pseudomonas
aminovorans4,17,
Hyphomicrobium
sp.2,15, Micrococus sp.7
Diethylamine (DEA) 3018 Ammonical, Fishy Hyphomicrobium sp.9,
Pseudomonas sp.10,13,
Candida utilis14,
Hansenula
polymorpha14
Triethylamine (TEA) 0.4812 Ammonical, Fishy Not yet determined
Chapter 1 Introduction __________________________________________________________________________
22
a Sources: 1Myers and Zatmann (1971); 2Attwood and Harder (1972); 3Colby and Zatmann
(1973); 4Boulton et al. (1974); 5Colby and Zatmann (1975); 6Loginova and Trotsenko (1975);
7Tate and Alexander (1976); 8Meiberg and Harder (1978); 9Meiberg (1979); 10Claus and
Kutzner (1981); 11Large and Haywood (1981); 12 Amoore and Hautala (1983); 13Ghisalba and
Kuenzi (1983); 14Zwart and Harder (1983); 15Ghisalba et al. (1985); 16Urakami et al. (1990);
17Gamati et al. (1991); 18Lundqvist et al. (1992) ; 19Shirkot et al. (1994) ; 20Lobo et al. (1997) ;
21Kim et al. (2001) ; 22Rappert et al. (2004).
1.6.2 Dimethylamine
Dimethylamine (DME) is mainly used as an accelerator in rubber vulcanization processes,
during tanning of leather, and for production of detergents and pesticides. It is also formed
during synthesis of solvents (N,N-dimethylformamide) and pesticides (tetramethylthiuram
disulfide, TMTD) (Urakami et al., 1990; Shirkot et al., 1994 ). Dimethylamine is also formed
during the degradation of trimethylamine by several algae and microorganisms (Meiberg and
Harder, 1978; Lundstrom and Racicot, 1983; Van Agteren et al., 1998; Kim et al., 2001).
Dimethylamine has a malodorous character and is important because of its role as precursor
of the carcinogenic compound N-nitrosodimethylamine (Lundstrom and Racicot, 1983).
Therefore, prompt treatment is necessary (Rappert and Müller, 2005b).
In agricultural soil dimethylamine was found to be rapidly metabolized by microorganisms
and did not accumulate (Ayanaba et al., 1973; Smith and Aubin, 1992). The metabolism of
dimethylamine in the environment under aerobic conditions starts with conversion to
methylamine and formaldehyde (Van Agteren et al., 1998). Many microorganisms that
degrade dimethylamine under aerobic conditions have been isolated and are summarized in
Table 1.1. The hypothetical pathway for the aerobic microbial degradation of dimethylamine
follows the same route as the degradation of trimethylamine, which is summarized in Figure
1.2 (Rappert and Müller, 2005b).
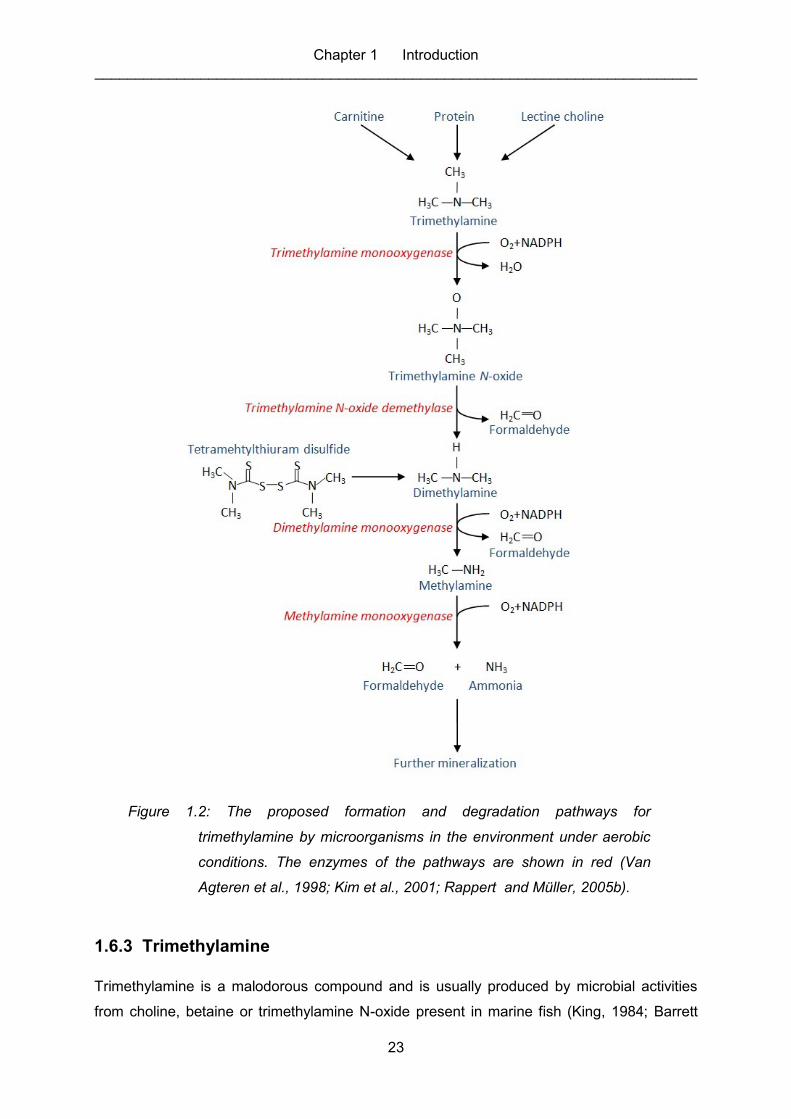
Chapter 1 Introduction __________________________________________________________________________
23
Figure 1.2: The proposed formation and degradation pathways for
trimethylamine by microorganisms in the environment under aerobic
conditions. The enzymes of the pathways are shown in red (Van
Agteren et al., 1998; Kim et al., 2001; Rappert and Müller, 2005b).
1.6.3 Trimethylamine
Trimethylamine is a malodorous compound and is usually produced by microbial activities
from choline, betaine or trimethylamine N-oxide present in marine fish (King, 1984; Barrett
Chapter 1 Introduction __________________________________________________________________________
24
and Kwan, 1985; Lin and Hurng, 1989; Mouné et al., 1999; Lopez-Caballero et al., 2001). In
addition, trimethylamine is a toxic compound because of its tissue-corrosive and penetrative
properties. It inhibits the biosynthesis of macromolecules, such as DNA, RNA, proteins, and
has a teratogenic effect on mouse embryos (Guest and Varma, 1992). Trimethylamine is
frequently found in effluents of fish-meal manufacturing processes (Sandberg and Ahring,
1992; Hwang et al., 1994; Rappert and Müller, 2005b).
Microbial degradation of trimethylamine under aerobic conditions has been intensively
studied (Urakami et al., 1990; Ohara et al., 1990; Lobo et al., 1997; Kim et al., 2001). Many
microorganisms that are able to degrade trimethylamine aerobically have been isolated and
are summarized in Table 1.1. The rate of trimethylamine consumption by Aminobacter
aminovorans was 1.79 mM h-1 measured in a bubble column continuous fermentation system
(Lobo et al., 1997). Rappert and Müller found that in a shaking culture of A. aminovorans
containing mineral medium 1.10 M supplemented with 5.0 mM trimethylamine > 95% of the
trimethylamine was utilized after 24 h (Rappert and Müller, 2005b).
The degradation pathway of trimethylamine by A. aminovorans has been proposed. The
strain oxidizes trimethylamine to dimethylamine by the action of the enzyme trimethylamine
dehydrogenase, then to monomethylamine by the activity of dimethylamine monooxygenase
and finally to formaldehyde and ammonia by the action of enzyme monomethylamine
dehydrogenase before carbon incorporation in the serine pathway (Large, 1983). The same
degradation pathway has been found with a newly isolated denitrifying bacterium,
Paracoccus sp. T231 (Kim et al., 2001). The biological degradation pathway of
trimethylamine under aerobic conditions is summarized in Figure 1.2 (Rappert and Müller,
2005b).
1.6.4 Diethylamine
Diethylamine is irritating to the skin and to mucous membranes. It is used in the rubber
industry, in pharmaceutical products, in resin and in colouring materials (Van Agteren et al.,
1998; Rappert and Müller, 2005b).
Little is known about the physiology and microbial degradation of diethylamine, unlike
dimethylamine and trimethylamine. In 1979, Meiberg isolated Hyphomicrobium strains that
could grow on dimethylamine and diethylamine at a concentration of 1 g l-1. Several groups
have isolated Pseudomonas strains that are able to grow on diethylamine up to 5 g l-1
(Ghisalba and Kuenzi, 1983; Ghisalba et al., 1985; Claus and Kutzner, 1981; Rappert and
Müller, 2005b).
Chapter 1 Introduction __________________________________________________________________________
25
Not only bacteria can degrade diethylamine, some yeast extracts such as Candida utilis and
Hansenula polymorpha were found to degrade diethylamine and use it as a nitrogen source
(Zwart and Harder, 1983). No information was found about the biodegradation of
diethylamine in the environment, soil or water samples (Rappert and Müller, 2005b). Pietsch
et al. (2001) reported that under conditions similar to drinking water treatment plants,
dimethylamine had higher biodegrability than diethylamine. The degradation pathway of
diethylamine under aerobic conditions is expected to be similar to that of dimethylamine (Van
Agteren et al., 1998). Microorganisms that degrade diethylamine under aerobic conditions
are showns in Table 1.1 (Rappert and Müller, 2005b).
1.6.5 Triethylamine
Triethylamine is used as an intermediate in the production of various chemicals, including
pharmaceuticals. It is also widely used as catalyst for polymerisation reactions (in urethane
and epoxy resin systems) and as solvent and corrosion inhibitor (Åkesson et al., 1988).
Exposure to triethylamine may cause adverse health effects such as visual disturbances and
asthma (Belin et al., 1983; Åkesson et al., 1985). In addition, triethylamine has a very low
odour threshold, as shown in Table 1.1. Therefore, an effective treatment of this compound is
necessary (Rappert and Müller, 2005b).
The metabolism of triethylamine in man has been studied (Åkesson et al., 1988). However,
little is known about microbial degradation of triethylamine. Under anaerobic conditions, it
was reported that triethylamine was not degraded in a biodegradation test (Kawahara et al.,
1999). In contrast to the results obtained under anaerobic conditions, Tang et al. (1996)
reported that 100% removal efficiency of triethylamine (with the triethylamine loads up to 140
g (m3 h)-1) was observed in a laboratory-scale reactor. This bioreactor contained a mixture of
sieved compost particles (equivalent diameter: 1.2-2.5 mm) and chaff particles (equivalent
diameter: 4-5 mm), as the filter material, and activated sludge, obtained from the wastewater
treatment plant of a fertilizer factory where amines were the major pollutant treated, as the
inoculum. The removal efficiency of the biofilter decreased as the amount of triethylamine
introduced into the biofilter increased above the maximum loading capacity (140 g (m3 h)-1)
(Rappert and Müller, 2005b).
The experimental results of the deodorization of triethylamine carried out in three different
natural beds were shown by Palica and Walus (1998). It was found that the most effective
natural bed for the deodorization was crumbled bark from deciduous trees. The use of
processed material from mushroom production as a biofilter medium was less effective and
the use of wheat straw was the least effective. The moisture content of the air was the most
Chapter 1 Introduction __________________________________________________________________________
26
decisive parameter influencing the deodorization, whilst the feeding and contact times were
the least decisive parameters. It has been proven over a wide range of odour concentrations
and air flow rates that full removal of triethylamine in process air is attained when using a
biofilter medium of crumbled bark from deciduous trees (Palica and Walus, 1998; Rappert
and Müller, 2005b).
There are no present published data on biodegradation of triethylamine by pure microbial
strains.
1.7 Aim of the study
Biological degradation has recently emerged as an efficient method to treat odorous
compounds. Two common industrial waste products, triethylamine and ethyl acrylate, were
chosen for study here due to their exceedingly bad odour. The aims of this study were:
1. To isolate bacteria that can degrade triethylamine and ethyl acrylate.
2. Characterization and identification of the isolated strains.
3. To determine the biodegradability of these substrates alone, and also in the presence
of other odorous compounds. The latter resembles the situation in nature and in
industry.
4. Determination of the optimum temperature, pH and degradable substrate
concentrations.
5. To determine the mechanism of degradation of these strains and suggest possible
degradation pathways for each compound.
6. To extract, purify and characterize the enzyme of one of the strains isolated.
27
Chapter 2
MATERIALS AND METHODS
__________________________________________________________________________
2.1 Overview
In this work, several bacterial strains were isolated from a variety of environmental samples
and tested for their potential to degrade two odorous compounds: Triethylamine and ethyl
acrylate. The environmental samples used here were screened from a large number of
sources that were believed to be contaminated with the target compounds. Sources included
biofilter material, bio-scrubber “biowäscher”, scrubber “wäscher” and soil. The two bacterial
strains demonstrating the most efficient degradation of each odorous compound were
chosen for further analysis. Gas chromatography was used to assess the substrate-
degradation potential of each bacterial strain. Temperature, pH and concentration were
varied to find the optimum conditions for degradation. Finally, one of the strains was selected
and its enzyme was extracted and was purified and characterized.
2.2 Equipment, chemicals and media
The experimental work (if not indicated elsewhere) was carried out using the following
equipment:
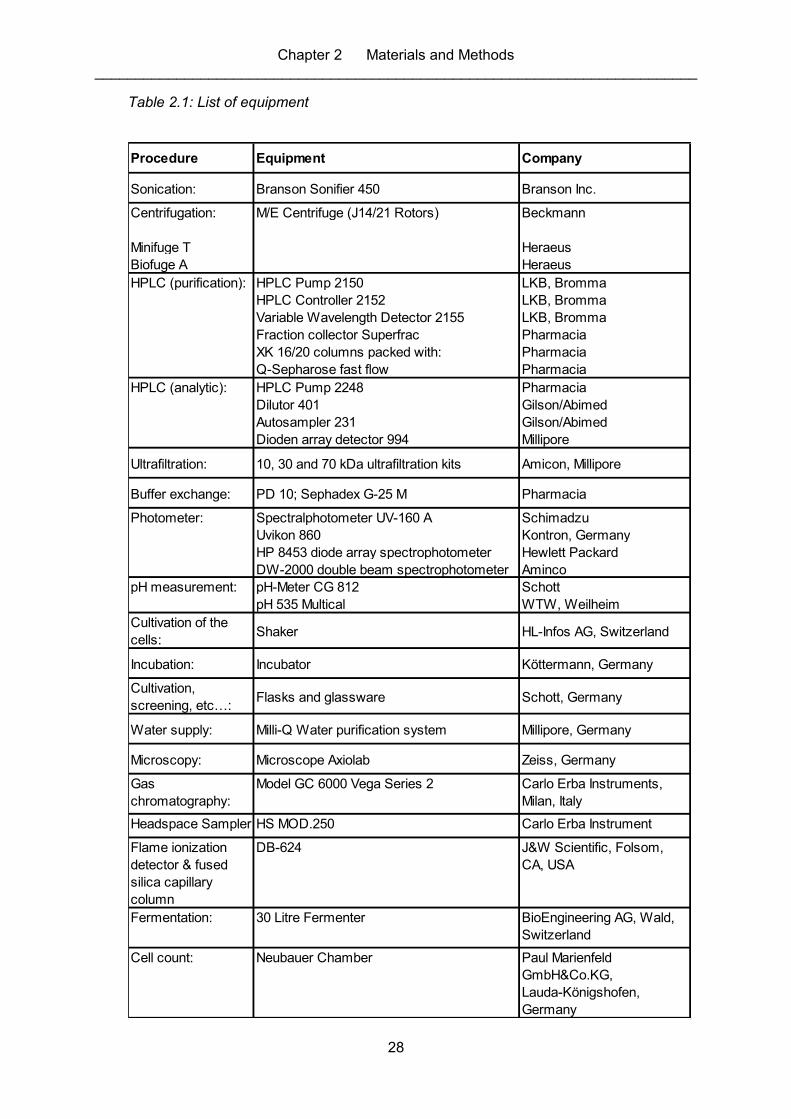
Chapter 2 Materials and Methods __________________________________________________________________________
28
Table 2.1: List of equipment
Procedure Equipment Company
Sonication: Branson Sonifier 450 Branson Inc.
Centrifugation: M/E Centrifuge (J14/21 Rotors) Beckmann
Minifuge T Heraeus
Biofuge A Heraeus
HPLC (purification): HPLC Pump 2150 LKB, Bromma
HPLC Controller 2152 LKB, Bromma
Variable Wavelength Detector 2155 LKB, Bromma
Fraction collector Superfrac Pharmacia
XK 16/20 columns packed with: Pharmacia
Q-Sepharose fast flow Pharmacia
HPLC (analytic): HPLC Pump 2248 Pharmacia
Dilutor 401 Gilson/Abimed
Autosampler 231 Gilson/Abimed
Dioden array detector 994 Millipore
Ultrafiltration: 10, 30 and 70 kDa ultrafiltration kits Amicon, Millipore
Buffer exchange: PD 10; Sephadex G-25 M Pharmacia
Photometer: Spectralphotometer UV-160 A Schimadzu
Uvikon 860 Kontron, Germany
HP 8453 diode array spectrophotometer Hewlett Packard
DW-2000 double beam spectrophotometer Aminco
pH measurement: pH-Meter CG 812 Schott
pH 535 Multical WTW, Weilheim
Cultivation of the
cells:Shaker HL-Infos AG, Switzerland
Incubation: Incubator Köttermann, Germany
Cultivation,
screening, etc…:Flasks and glassware Schott, Germany
Water supply: Milli-Q Water purification system Millipore, Germany
Microscopy: Microscope Axiolab Zeiss, Germany
Gas
chromatography:
Model GC 6000 Vega Series 2 Carlo Erba Instruments,
Milan, Italy
Headspace Sampler HS MOD.250 Carlo Erba Instrument
Flame ionization
detector & fused
silica capillary
column
DB-624 J&W Scientific, Folsom,
CA, USA
Fermentation: 30 Litre Fermenter BioEngineering AG, Wald,
Switzerland
Cell count: Neubauer Chamber Paul Marienfeld
GmbH&Co.KG,
Lauda-Königshofen,
Germany
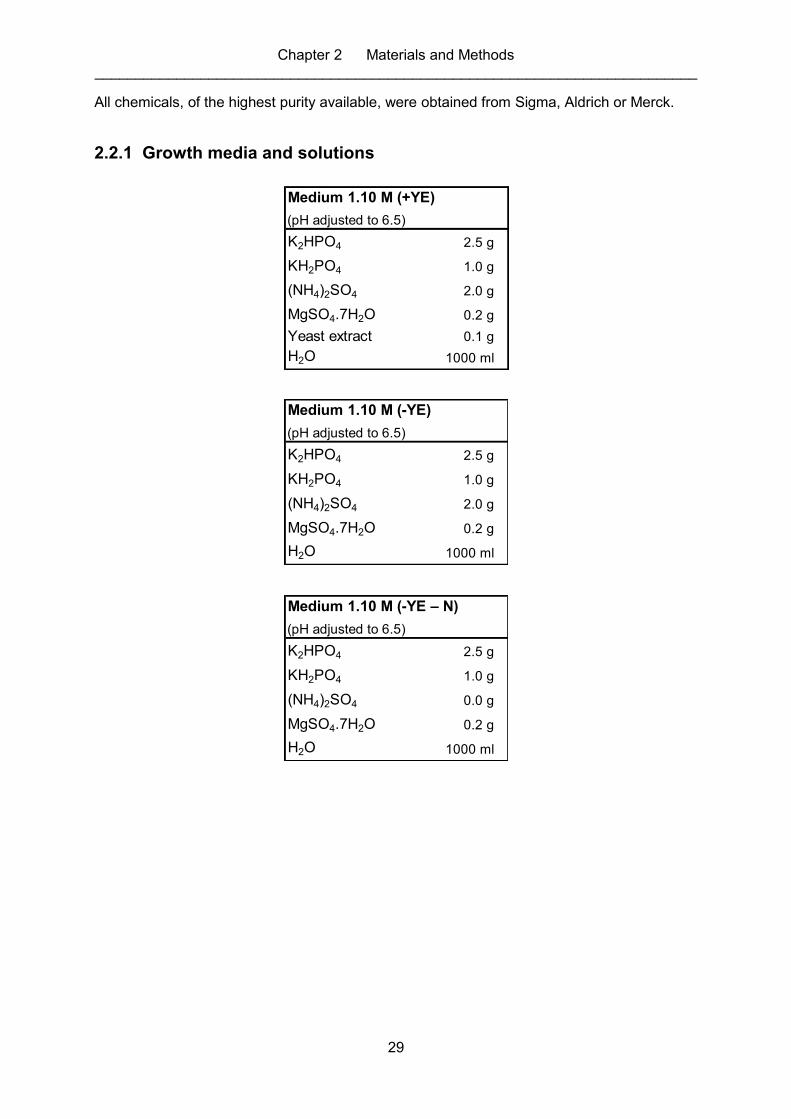
Chapter 2 Materials and Methods __________________________________________________________________________
29
All chemicals, of the highest purity available, were obtained from Sigma, Aldrich or Merck.
2.2.1 Growth media and solutions
(pH adjusted to 6.5)
K2HPO4 2.5 g
KH2PO4 1.0 g
(NH4)2SO4 2.0 g
MgSO4.7H2O 0.2 g
Yeast extract 0.1 g
H2O 1000 ml
Medium 1.10 M (+YE)
(pH adjusted to 6.5)
K2HPO4 2.5 g
KH2PO4 1.0 g
(NH4)2SO4 2.0 g
MgSO4.7H2O 0.2 g
H2O 1000 ml
Medium 1.10 M (-YE)
(pH adjusted to 6.5)
K2HPO4 2.5 g
KH2PO4 1.0 g
(NH4)2SO4 0.0 g
MgSO4.7H2O 0.2 g
H2O 1000 ml
Medium 1.10 M (-YE – N)
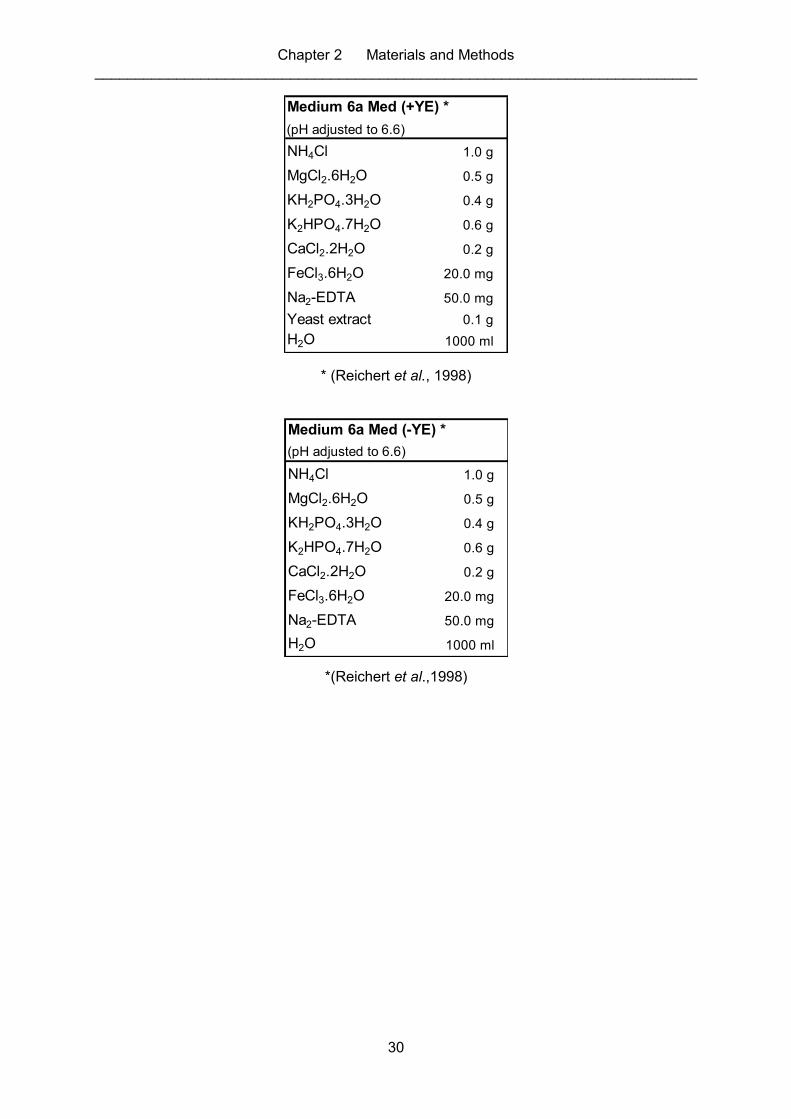
Chapter 2 Materials and Methods __________________________________________________________________________
30
(pH adjusted to 6.6)
NH4Cl 1.0 g
MgCl2.6H2O 0.5 g
KH2PO4.3H2O 0.4 g
K2HPO4.7H2O 0.6 g
CaCl2.2H2O 0.2 g
FeCl3.6H2O 20.0 mg
Na2-EDTA 50.0 mg
Yeast extract 0.1 g
H2O 1000 ml
Medium 6a Med (+YE) *
* (Reichert et al., 1998)
(pH adjusted to 6.6)
NH4Cl 1.0 g
MgCl2.6H2O 0.5 g
KH2PO4.3H2O 0.4 g
K2HPO4.7H2O 0.6 g
CaCl2.2H2O 0.2 g
FeCl3.6H2O 20.0 mg
Na2-EDTA 50.0 mg
H2O 1000 ml
Medium 6a Med (-YE) *
*(Reichert et al.,1998)
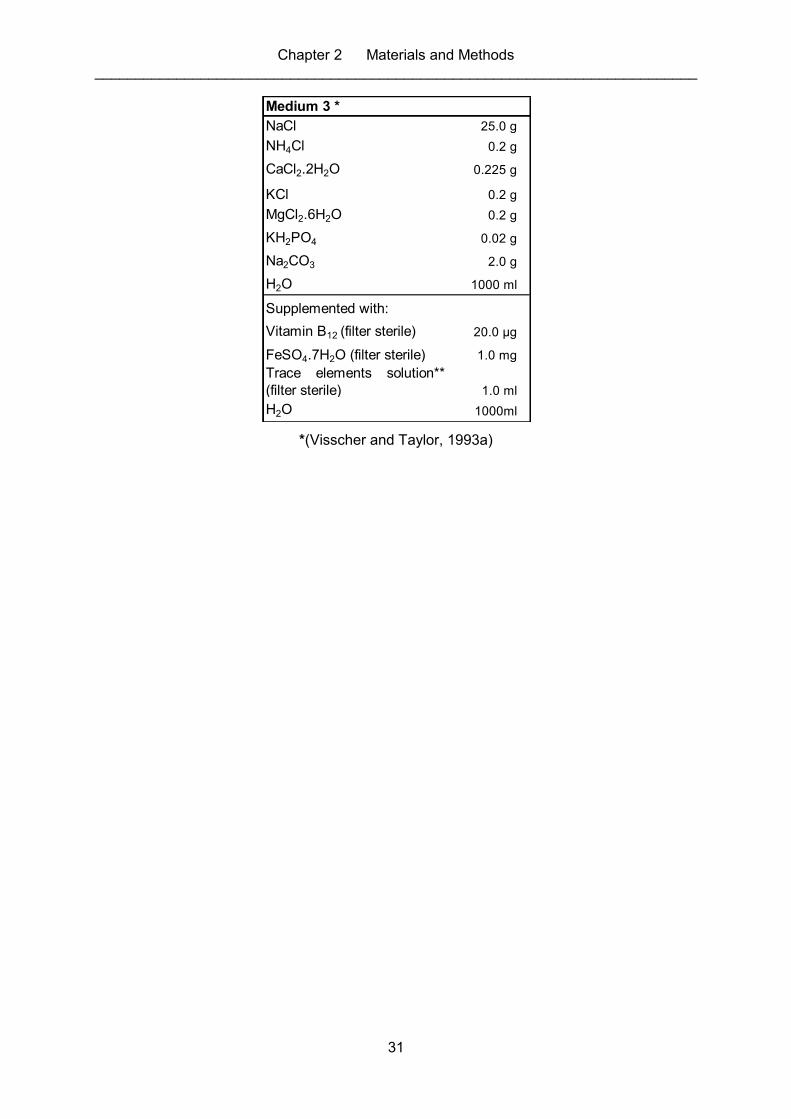
Chapter 2 Materials and Methods __________________________________________________________________________
31
NaCl 25.0 g
NH4Cl 0.2 g
CaCl2.2H2O 0.225 g
KCl 0.2 g
MgCl2.6H2O 0.2 g
KH2PO4 0.02 g
Na2CO3 2.0 g
H2O 1000 ml
Supplemented with:
Vitamin B12 (filter sterile) 20.0 µg
FeSO4.7H2O (filter sterile) 1.0 mg
Trace elements solution**
(filter sterile) 1.0 ml
H2O 1000ml
Medium 3 *
*(Visscher and Taylor, 1993a)
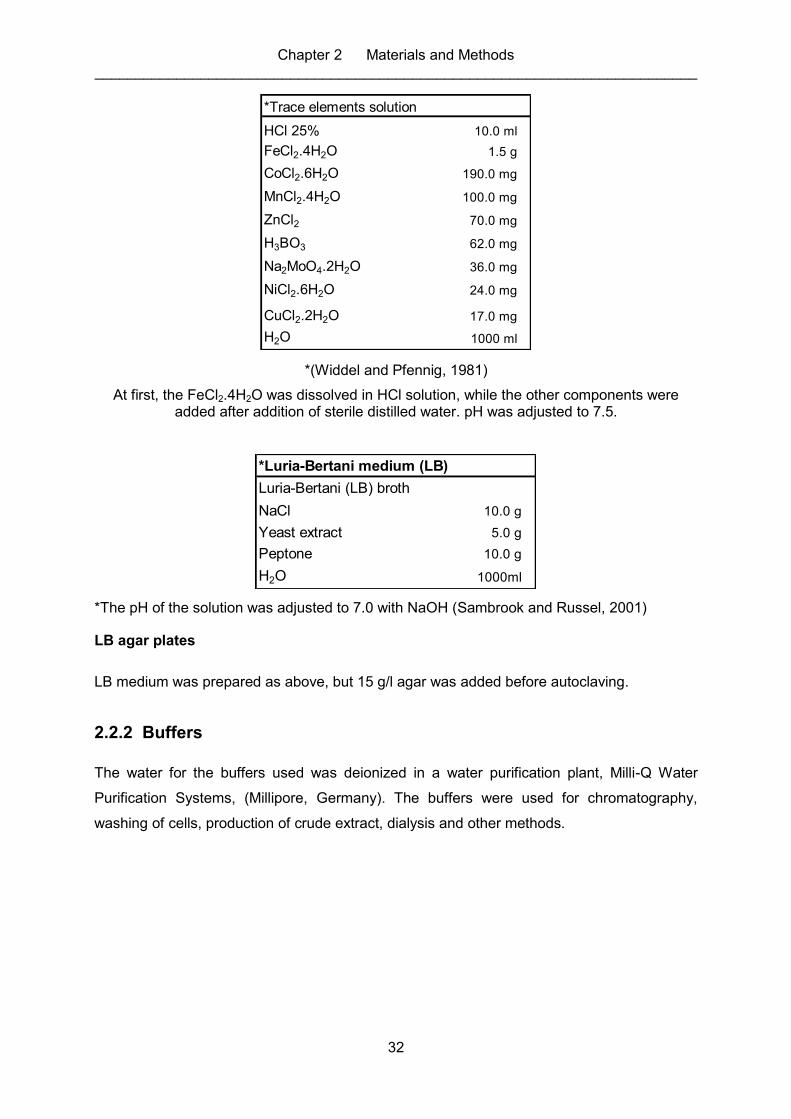
Chapter 2 Materials and Methods __________________________________________________________________________
32
*Trace elements solution
HCl 25% 10.0 ml
FeCl2.4H2O 1.5 g
CoCl2.6H2O 190.0 mg
MnCl2.4H2O 100.0 mg
ZnCl2 70.0 mg
H3BO3 62.0 mg
Na2MoO4.2H2O 36.0 mg
NiCl2.6H2O 24.0 mg
CuCl2.2H2O 17.0 mg
H2O 1000 ml
*(Widdel and Pfennig, 1981)
At first, the FeCl2.4H2O was dissolved in HCl solution, while the other components were added after addition of sterile distilled water. pH was adjusted to 7.5.
*Luria-Bertani medium (LB)
Luria-Bertani (LB) broth
NaCl 10.0 g
Yeast extract 5.0 g
Peptone 10.0 g
H2O 1000ml
*The pH of the solution was adjusted to 7.0 with NaOH (Sambrook and Russel, 2001)
LB agar plates
LB medium was prepared as above, but 15 g/l agar was added before autoclaving.
2.2.2 Buffers
The water for the buffers used was deionized in a water purification plant, Milli-Q Water
Purification Systems, (Millipore, Germany). The buffers were used for chromatography,
washing of cells, production of crude extract, dialysis and other methods.
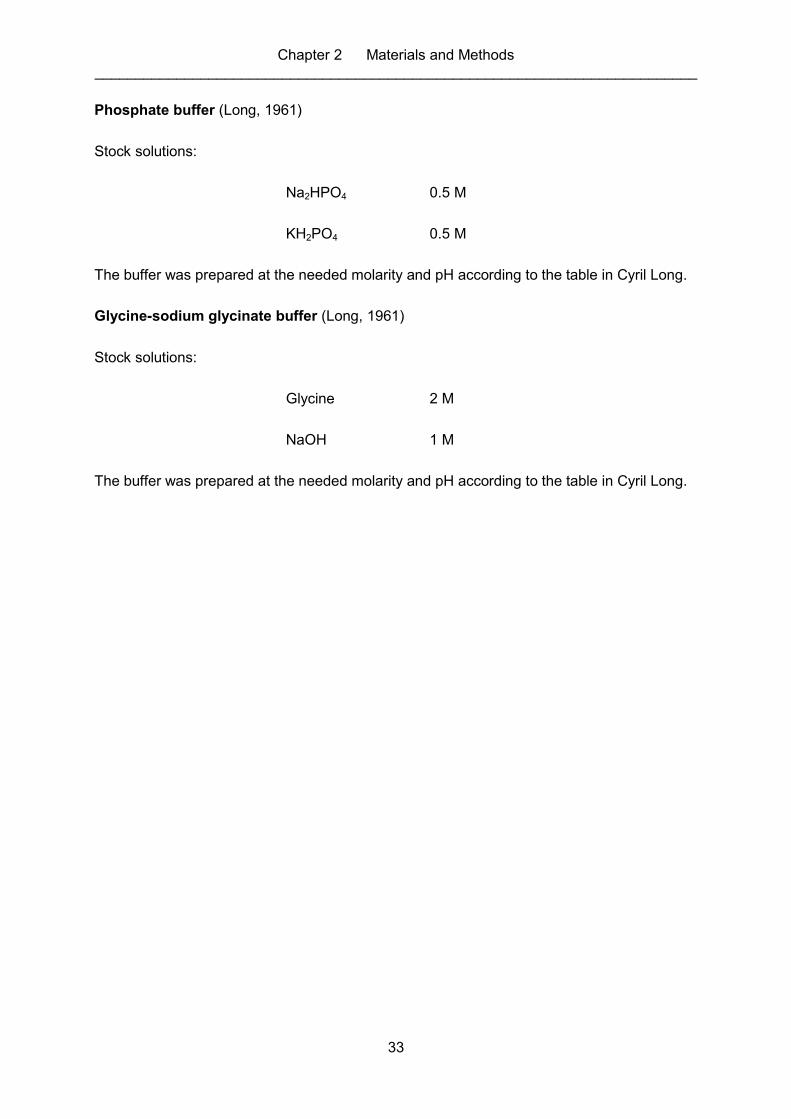
Chapter 2 Materials and Methods __________________________________________________________________________
33
Phosphate buffer (Long, 1961)
Stock solutions:
Na2HPO4 0.5 M
KH2PO4 0.5 M
The buffer was prepared at the needed molarity and pH according to the table in Cyril Long.
Glycine-sodium glycinate buffer (Long, 1961)
Stock solutions:
Glycine 2 M
NaOH 1 M
The buffer was prepared at the needed molarity and pH according to the table in Cyril Long.
Chapter 2 Materials and Methods __________________________________________________________________________
34
2.3 Bacteria that degrade triethylamine
2.3.1 Isolation procedure
In order to isolate bacteria with the potential to degrade triethylamine, several environmental
samples were collected from different sources, such as biofilter, biowäscher “bioscrubber”
and wäscher “scrubber”, from the fish-meal producing company See Loewe in Cuxhaven,
Germany. Using 100-ml serum bottles, 2 g of biofilter material were suspended in 20 ml of
different media including 1.10 M (+YE), 1.10 M (-YE), 6a Med (+YE), 6a Med (-YE) and
Medium 3. Media were adjusted to different pH values (6.5, 7.0 and 7.5). Same was done
using 2 ml of scrubber or bioscrubber material. Finally 0.5 mM triethylamine were added as a
carbon and energy source; then samples were sealed with a butyl rubber septum and an
aluminium crimp seal to prevent the loss of volatile substrates. Cultures were stirred at 110
rpm while incubated at 25 °C. Samples showing turbidity were selected and 2 ml were
transferred into a 20 ml fresh medium with the addition of 0.5 mM triethylamine. This process
of inoculation was repeated several times and then 50 µl from the enrichment culture were
spread on 1.10 M (-YE) mineral medium agar plates and incubated in a sealed jar, which
was saturated with vapour of triethylamine. The jar was kept for several days at 25 °C and
plates were monitored for growth of bacterial colonies. Single colonies were transferred onto
fresh plates and this process was repeated till each plate only contained one type of
colonies. At the end, a total of sixty one pure strains were isolated and then tested for the
ability to degrade 0.5 mM triethylamine. Degradability was measured using a head-space GC
and cell count was carried out simultaneously.
2.3.2 Anaerobic growth
The potential of RA1 and RA2 to degrade triethylamine under anaerobic conditions was also
studied. Two anaerobic media were prepared: 1.10 M (+YE) and 1.10 M (-YE) (Section
2.2.1). To a one litre medium, an amount of 100 μl of a 1% Rezazurin solution was added
before boiling and sterilization. The medium was boiled gently for approximately one hour
using a heating mantle and a dark pink colour evolved. The growth experiments for each
strain were carried out using 100-ml serum bottles (Section 2.3.1). Continuous purging with
N2 was performed to completely free the medium of O2 during which the bottles were sealed
and then sterilized. To each bottle containing 19 ml medium, a 1 ml innoculum was added to
which an amount of 0.1 ml of a 5% Na2S solution was added to detect any amount of O2 that
may still have been present in the solution. A complete disappearance of the pink colour
confirmed the total absence of O2 in the aneorobic medium. Finally, 0.5 mM triethylamine
Chapter 2 Materials and Methods __________________________________________________________________________
35
was added to each bottle and cultures were stirred at 110 rpm while incubated at 25 °C
where the growth of bacteria was monitored for 21 days.
2.4 Bacteria that degrade ethyl acrylate
2.4.1 Isolation procedure
In order to isolate bacteria with the potential to degrade ethyl acrylate, ten soil samples were
collected in April 2000 from different sites of Aussenmühle Park in Harburg, Germany. In a
100-ml serum bottle, 2 g of a soil sample were suspended in 20 ml of 1.10 M (+YE), adjusted
to different pH values (6.5, 7.0 and 7.5). 2.0 mM ethyl acrylate were added as a carbon and
energy source and bottles were sealed with a butyl rubber septum and an aluminium crimp
seal to prevent the loss of volatile substrates. Cultures were shaken at 110 rpm while
incubated at 25 °C. Samples showing turbidity were selected and 2 ml of each were
transferred into 20 ml fresh medium with the addition of 2.0 mM ethyl acrylate. This process
of inoculation was repeated several times and then 50 µl from the enrichment culture were
spread on LB-medium plates and incubated at 25 °C and were monitored for growth of
bacterial colonies. Single colonies were transferred onto fresh plates and this process was
repeated till each plate only contained one type of colonies. At the end, a total of two pure
strains were isolated and then tested for the ability to degrade 2.0 mM ethyl acrylate.
Degradability was measured using a head-space gas chromatograph and cell count was
carried out simultaneously.
2.4.2 Anaerobic growth
The potential of 2C and 2Cbei to degrade ethyl acrylate under anaerobic conditions was also
studied. Two anaerobic media were prepared as described in Section 2.3.2 where 2.0 mM
ethyl acrylate was used (instead of 0.5 mM triethylamine) as an energy and carbon source.
Finally, cultures were stirred at 110 rpm while incubated at 25 °C where the growth of
bacteria was monitored for 21 days.
2.5 Analytical procedures
Bacterial growth was monitored routinely by recording the optical density at 600 nm, and the
total cell count was determined by counting under the microscope using a Neubauer
counting chamber (depth of 0.020 mm and a small square area of 0.0025 mm2). Substrate
concentrations of the odorous compounds were measured by gas chromatography (model
GC 6000 Vega Series 2, Carlo Erba Instruments, Milan, Italy). One millilitre of the culture
Chapter 2 Materials and Methods __________________________________________________________________________
36
medium was transferred into a 5-ml sample vial sealed with butyl rubber septa and
aluminium crimp seal, and incubated in the water bath at 30 C for 30 min. For amine
compounds, in order to release free amines from their salts, 0.1 ml of 2.5 M NaOH was
added to 1 ml of sample before incubation in the water bath (Kim et al., 2001). A sample of
500 l of the gas phase was taken by a Headspace Sampler (HS MOD.250, Carlo Erba
Instrument) and injected into the GC equipped with a flame ionization detector and a J&W
fused silica capillary column DB-624 (J&W Scientific, Folsom, CA, USA). The temperatures
of the oven, of the injection port, and of the detector were 100, 60, and 200 C, respectively.
Nitrogen gas was used as carrier gas, at a flow rate of 20 ml/min.
Chapter 2 Materials and Methods __________________________________________________________________________
37
2.6 Enzyme assay
2.6.1 Spectrophotometric assay with p-nitrophenyl acetate (-NPA) as
substrate
The activity of the esterase from 2Cbei was measured with various para-nitrophenyl esters.
The yellow colour developed by the release of the nitrophenol was measured at 405 nm. For
the calculation of the activity, a molar extinction coefficient of 9500 L.mol-1.cm-1 was used
(Böckle, 1994). Enzyme activity was calculated according to the following formula:
Enzyme Activity (U/ml) = Vp
Vk
ed
tE
/
E – difference of absorption
t – difference of time (min)
d – breadth of the cuvette (cm)
e – the molar extinction coefficient (cm2/mole)
Vk – the general reaction volume (ml)
Vp – the volume of the enzyme (ml)
2.7 Purification and characterization of esterase from 2Cbei cells
2.7.1 Bacterial strain cultivation and native crude enzyme extraction
Cells of Defluvibacter lusatiensis 2Cbei were harvested from 2, 5 and 10 litre cell culture
samples by centrifugation at 9,000 g for 90 min (producing ~ 0.2 g wet weight cell mass),
washed 3 times with phosphate buffer of pH 7, and resuspended in same buffer in a constant
ratio of 1:4 wet weight cell mass (g) to buffer volume (ml). The resuspended cells were
disrupted with an ultrasonicator (Branson Sonifier 450, Branson Inc., USA) ~ 10 times and
the suspension was centrifuged at 25,000 g for 80 min at 4 °C. The supernatant produced
was filter sterile and used as the native enzyme crude extract.
Chapter 2 Materials and Methods __________________________________________________________________________
38
2.7.2 Purification of esterase from 2Cbei cells
All purification steps were carried out at room temperature. The native esterase crude extract
from ~ 50 g (wet weight) of Defluvibacter lusatiensis cell mass was dialyzed against 100
volumes of 20 mM phosphate buffer, pH 7. The crude extract was fractionated by the
addition of ammonium sulfate. The enzyme precipitated between 40 and 60 % saturation.
The precipitate was dissolved in 20 mM phosphate buffer of pH 7. After dialysis against the
same buffer, the enzyme was loaded onto a column of Q-Sapharose (mono QTM 5/50 GL).
The enzyme was eluted with a linear gradient from 0 to 1 M NaCl. Active fractions were
pooled, dialyzed and loaded onto a column of Superdex G200. The column was run with 20
mM phosphate buffer of pH 7. Active fractions were pooled and concentrated with Microcon
YM-10.
2.7.3 Influence of pH and temperature on esterase activity and
thermostability
The optimum conditions for the enzyme activity were determined. The activity was measured
under standard conditions at temperatures from 25 to 80 °C with increments of 5 °C and at
pH 6.0, 6.5, 7.0, 7.5 and 8.0 in phosphate buffer and at pH 8.0, 8.5, 9.0, 9.5 and 10.0 in
Glycine/NaOH buffer.
2.7.4 Effect of various compounds on esterase activity
The effect of various substances on esterase activity was examined using enzyme assay
after pre-incubation of the purified esterase with various reagents in different concentrations
at 20 C for 120 min. For examination of the enzyme’s residual activity, 100 l of pre-
incubation mixture was mixed with 900 l of substrate in 50 mM phosphate buffer of pH 7.0.
The reaction was carried out for 10 min at 60C (unless stated otherwise). The enzyme’s
activity without additional compounds was defined as 100%. Four groups of the various
compounds (organic solvents, inhibitors, surfactants and metal ions) were studied for their
effect on esterase activity. The compounds are listed in Table 2.2 –Table 2.4.
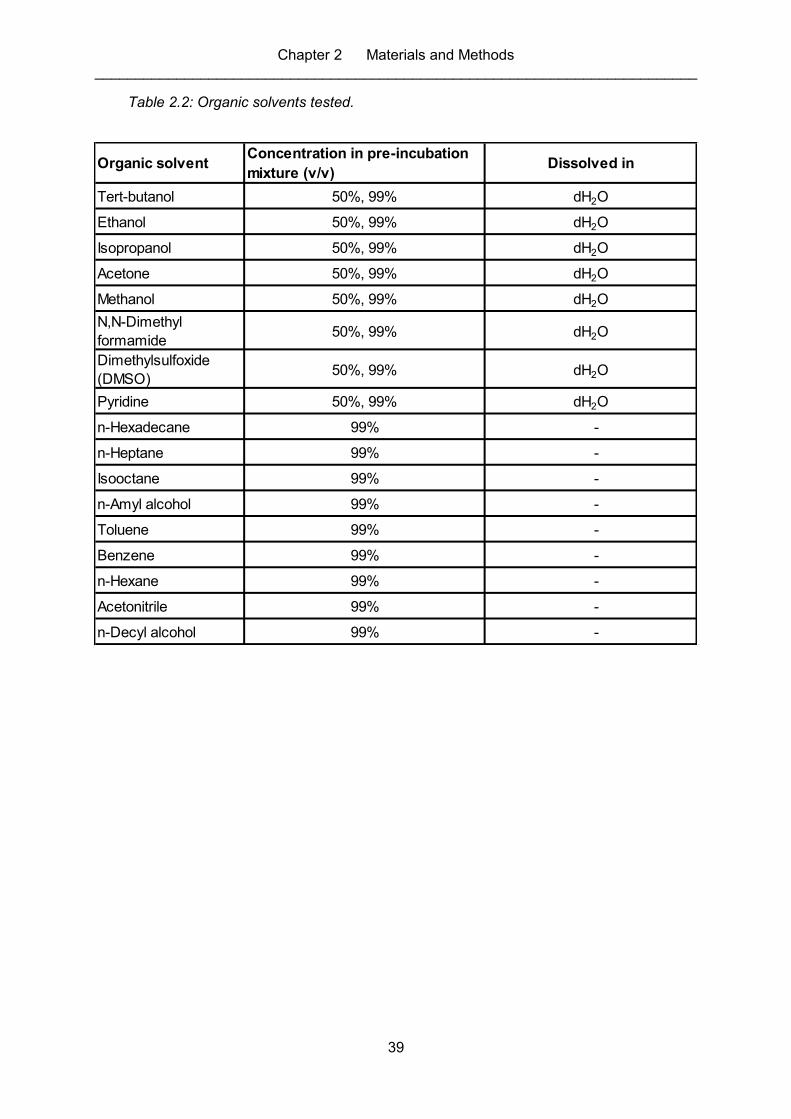
Chapter 2 Materials and Methods __________________________________________________________________________
39
Table 2.2: Organic solvents tested.
Organic solventConcentration in pre-incubation
mixture (v/v)Dissolved in
Tert-butanol 50%, 99% dH2O
Ethanol 50%, 99% dH2O
Isopropanol 50%, 99% dH2O
Acetone 50%, 99% dH2O
Methanol 50%, 99% dH2O
N,N-Dimethyl
formamide50%, 99% dH2O
Dimethylsulfoxide
(DMSO)50%, 99% dH2O
Pyridine 50%, 99% dH2O
n-Hexadecane 99% -
n-Heptane 99% -
Isooctane 99% -
n-Amyl alcohol 99% -
Toluene 99% -
Benzene 99% -
n-Hexane 99% -
Acetonitrile 99% -
n-Decyl alcohol 99% -
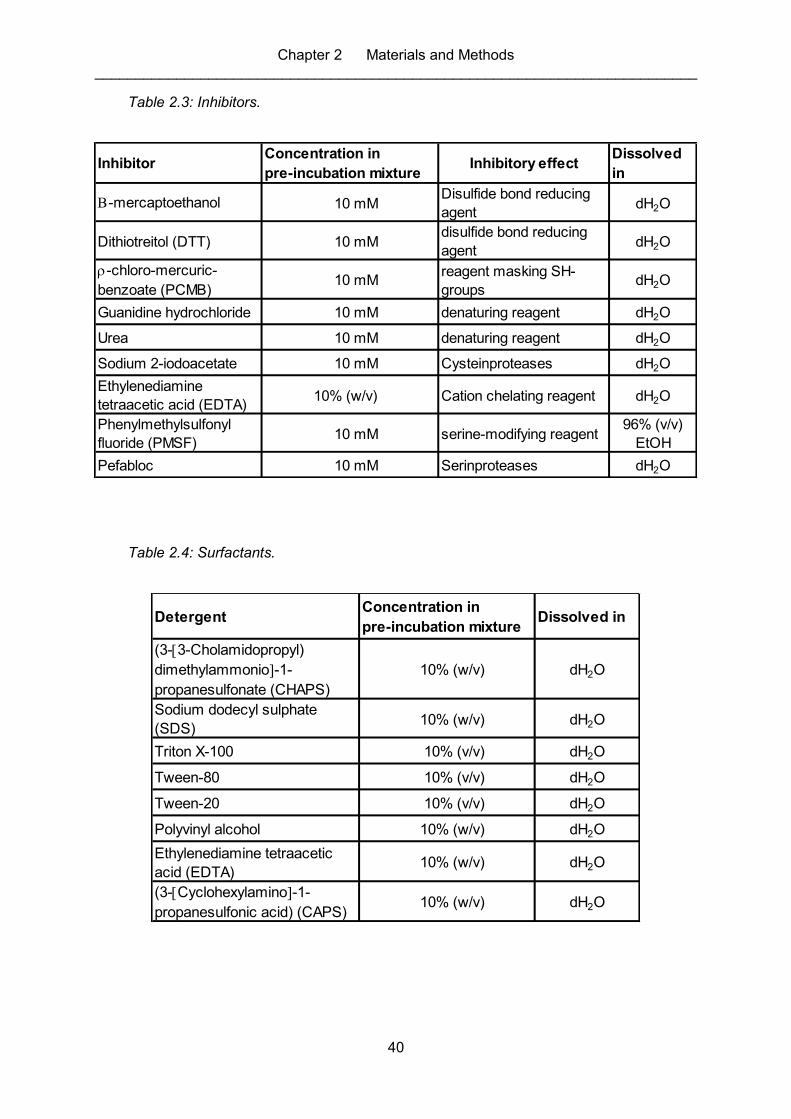
Chapter 2 Materials and Methods __________________________________________________________________________
40
Table 2.3: Inhibitors.
InhibitorConcentration in
pre-incubation mixtureInhibitory effect
Dissolved
in
B-mercaptoethanol 10 mMDisulfide bond reducing
agentdH2O
Dithiotreitol (DTT) 10 mMdisulfide bond reducing
agentdH2O
-chloro-mercuric-
benzoate (PCMB)10 mM
reagent masking SH-
groupsdH2O
Guanidine hydrochloride 10 mM denaturing reagent dH2O
Urea 10 mM denaturing reagent dH2O
Sodium 2-iodoacetate 10 mM Cysteinproteases dH2O
Ethylenediamine
tetraacetic acid (EDTA)10% (w/v) Cation chelating reagent dH2O
Phenylmethylsulfonyl
fluoride (PMSF)10 mM serine-modifying reagent
96% (v/v)
EtOH
Pefabloc 10 mM Serinproteases dH2O
Table 2.4: Surfactants.
DetergentConcentration in
pre-incubation mixtureDissolved in
(3-[3-Cholamidopropyl)
dimethylammonio]-1-
propanesulfonate (CHAPS)
10% (w/v) dH2O
Sodium dodecyl sulphate
(SDS)10% (w/v) dH2O
Triton X-100 10% (v/v) dH2O
Tween-80 10% (v/v) dH2O
Tween-20 10% (v/v) dH2O
Polyvinyl alcohol 10% (w/v) dH2O
Ethylenediamine tetraacetic
acid (EDTA)10% (w/v) dH2O
(3-[Cyclohexylamino]-1-
propanesulfonic acid) (CAPS)10% (w/v) dH2O
Chapter 2 Materials and Methods __________________________________________________________________________
41
Metal ions:
The salts containing the ions of Na+, K+, Ca2+, Mg2+, Cu2+, Rb+, Ag+, Mn2+, Co2+, Sr2+, Ni2+,
Al3+, Fe3+, Fe2+, Zn2+, Cr3+, Hg2+ were tested with a concentration of 1 mM in the incubation
mixture.
2.7.5 Substrate specificity
The enzyme specificity was studied with -nitrophenyl esters of varying alkyl chain lengths
from C2 to C18 as described in the enzyme assay. The reactions were carried out at 60C
for 10 min.
The following substrates were tested: -nitrophenyl acetate (C2), -nitrophenyl butyrate (C4),
-nitrophenyl caprylate (C8), -nitrophenyl caprate (C10), -nitrophenyl laurate (C12), -
nitrophenyl myristate (C14), -nitrophenyl palmitate (C16), -nitrophenyl stearate (C18).
2.8 Biochemical methods
2.8.1 Determination of protein concentration
(Bradford, 1976)
Protein concentration was determined by a modified Bradford method (BioRad protein assay)
and by UV spectroscopy measurement at 280 nm. The BioRad protein assay is based on the
differential colour change of a dye (acidic solution of Coomassie brilliant blue G-250) in
response to various protein concentrations. Protein standard solutions of bovine serum
albumin (BSA) were prepared in the range of 1 – 25 g/ml. 0.2 ml of the concentrated
BioRad dye was added to 0.8 ml of each of the protein solutions in sterile test tubes. The
blank contained only the dye solution. After 15 minutes the absorbance of the samples was
measured at 590 nm (corrected for the blank). By using the standard curve the protein
concentration in the samples was extrapolated.
For a rough estimation of the protein concentration, the UV-spectra of the samples were
recorded between 200-350 nm. Protein concentration was calculated according to the
following equation:
Protein (mg/ml) = 1.55 A 280 nm – 0.76 A 260 nm (Layne, 1957)
Chapter 2 Materials and Methods __________________________________________________________________________
42
2.9 Disposal of waste materials
Waste materials and residues were disposed of through the university’s waste-water disposal
network. Toxic reagents were only used when no environmentally safer alternatives are
available. All other organic reagents (chloroform, acetone, hexane, etc.) were first pooled in
large waste containers and disposed of through the university’s technical service. The plastic
waste, such as pipette tips were disposed of through the university’s waste disposal network.
43
Chapter 3
RESULTS
_________________________________
3.1 Bacteria that degrade triethylamine
3.1.1 Isolation procedure
In order to isolate bacteria with the potential to degrade triethylamine, 2 ml of material taken
from the scrubber “Wäscher” of the fish-meal producing company Seelöwe in Cuxhaven,
Germany, were suspended in 20 ml of medium 1.10 M (-YE) with 0.5 mM triethylamine as a
sole carbon and energy source. After 4 days, the triethylamine had disappeared and 2 ml
were transferred into 20 ml of fresh medium. This procedure was repeated. After ~10
transfers, 50 μl were spread onto 1.10 M (-YE) mineral medium agar plates and incubated in
a sealed jar containing triethylamine as a sole carbon and energy source. The strain was
purified by consequent colony picking; different colonies were transferred onto fresh plates.
After ~10 transfers, the bacteria obtained were checked for purity on nutrient broth agar
plates. From the plates showing only one type of colonies, one colony was transferred into
liquid medium with triethylamine as carbon source. The fastest growing strain was selected
for further studies and was named RA1. The same steps were applied on a sample
originating from the bio-scrubber “Biowäscher” of the same company and the fastest growing
strain was selected for further studies. This strain was named RA2.
3.1.2 Identification of the triethylamine degrading bacteria RA1 and RA2
The growth of the two strains, RA1 and RA2, obtained in the enrichment procedure was
tested. With 0.5 mM triethylamine, the growth rates at 25°C were 0.046 h-1 and 0.045 h-1,
respectively. The morphology and the physiological parameters of the strains were
determined by the Deutsche Sammlung von Mikroorganismen und Zellkulturen GmbH
(DSMZ), Braunschweig. Strain RA1 was a motile gram negative rod of width 0.5 – 0.7 µm
and length 1.8 – 3.0 µm. Strain RA2 was a non-motile, non-spore forming gram negative rod
Chapter 3 Results __________________________________________________________________________
44
of width 1.0 µm and length 2.0 µm. The properties of the two strains are summarized in Table
3.1. Based on these results, strain RA1 was classified as Pseudomonas citronellolis, and
strain RA2 was identified as Mycobacterium diernhoferi (Figure 3.1 and Figure 3.2).
The colonies of RA1 were smooth and pale yellowish on LB medium; whereas the colonies
of RA2 were chromium yellow. The strain RA1 was oxidase and catalase positive; while RA2
was not tested. The growth of RA1 at 41 °C was positive (Table 3.1). Neither growth of RA1
nor of RA2 was observed under anaerobic conditions.
The strain RA1 grew on a variety of substrates. Growth was observed on yeast extract,
glucose, adipate, malate, phenylacetate, citrate, caprate, gluconate, azelate, geraniol and
citronellol. No growth was observed on arabinose, mannitol, maltose, n-acetylglucosamine,
acetamide, trehalose, sorbitol and citraconate.
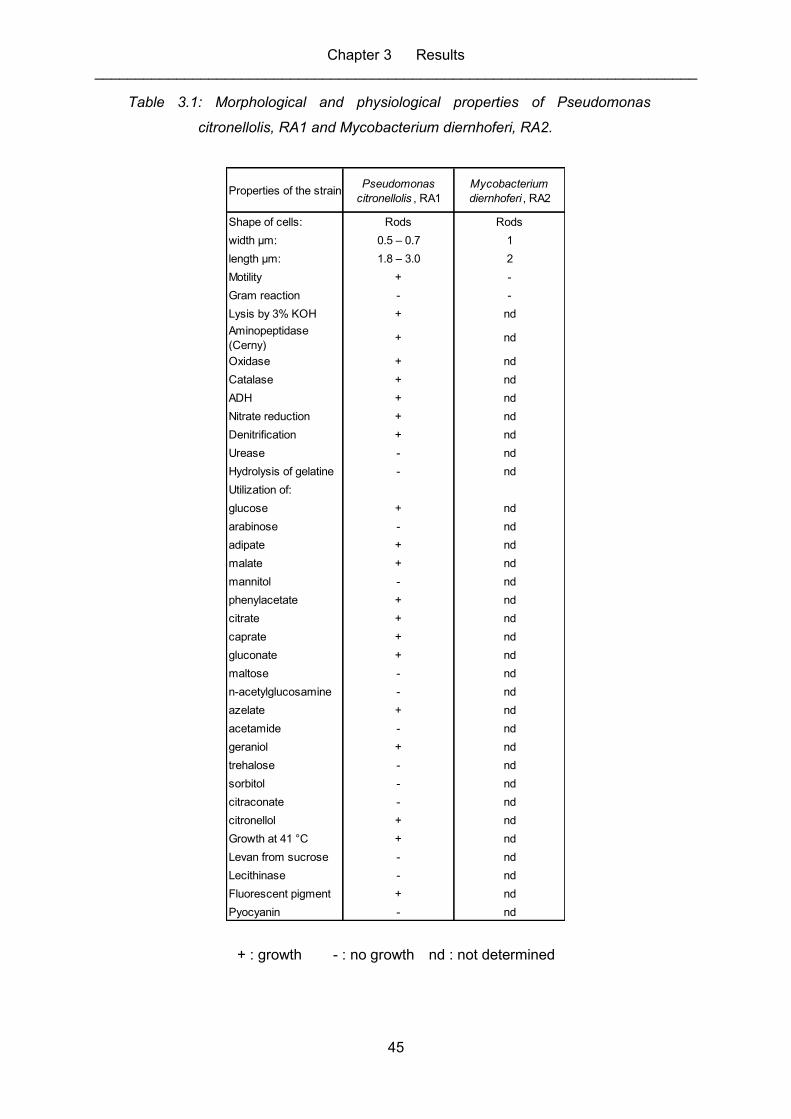
Chapter 3 Results __________________________________________________________________________
45
Table 3.1: Morphological and physiological properties of Pseudomonas
citronellolis, RA1 and Mycobacterium diernhoferi, RA2.
Properties of the strain Pseudomonas
citronellolis , RA1
Mycobacterium
diernhoferi , RA2
Shape of cells: Rods Rods
width μm: 0.5 – 0.7 1
length µm: 1.8 – 3.0 2
Motility + -
Gram reaction - -
Lysis by 3% KOH + nd
Aminopeptidase
(Cerny)+ nd
Oxidase + nd
Catalase + nd
ADH + nd
Nitrate reduction + nd
Denitrification + nd
Urease - nd
Hydrolysis of gelatine - nd
Utilization of:
glucose + nd
arabinose - nd
adipate + nd
malate + nd
mannitol - nd
phenylacetate + nd
citrate + nd
caprate + nd
gluconate + nd
maltose - nd
n-acetylglucosamine - nd
azelate + nd
acetamide - nd
geraniol + nd
trehalose - nd
sorbitol - nd
citraconate - nd
citronellol + nd
Growth at 41 °C + nd
Levan from sucrose - nd
Lecithinase - nd
Fluorescent pigment + nd
Pyocyanin - nd
+ : growth - : no growth nd : not determined
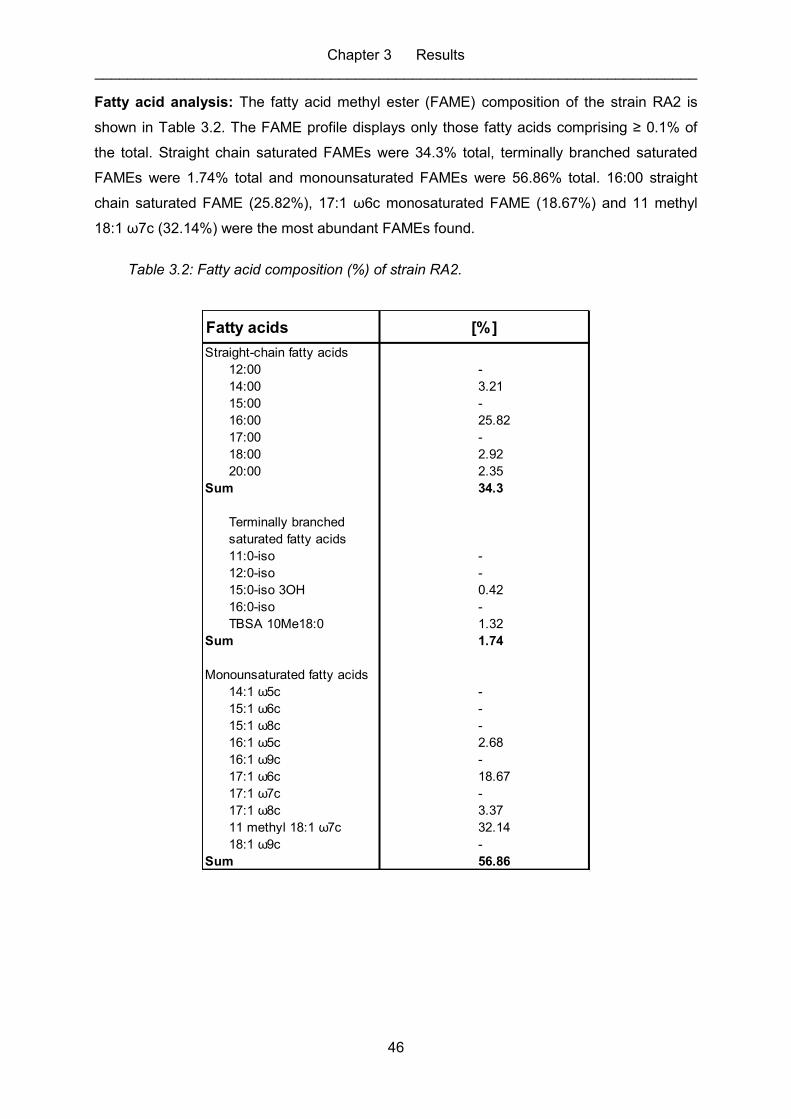
Chapter 3 Results __________________________________________________________________________
46
Fatty acid analysis: The fatty acid methyl ester (FAME) composition of the strain RA2 is
shown in Table 3.2. The FAME profile displays only those fatty acids comprising ≥ 0.1% of
the total. Straight chain saturated FAMEs were 34.3% total, terminally branched saturated
FAMEs were 1.74% total and monounsaturated FAMEs were 56.86% total. 16:00 straight
chain saturated FAME (25.82%), 17:1 ω6c monosaturated FAME (18.67%) and 11 methyl
18:1 ω7c (32.14%) were the most abundant FAMEs found.
Table 3.2: Fatty acid composition (%) of strain RA2.
Fatty acids [%]
Straight-chain fatty acids
12:00 -
14:00 3.21
15:00 -
16:00 25.82
17:00 -
18:00 2.92
20:00 2.35
Sum 34.3
Terminally branched
saturated fatty acids
11:0-iso -
12:0-iso -
15:0-iso 3OH 0.42
16:0-iso -
TBSA 10Me18:0 1.32
Sum 1.74
Monounsaturated fatty acids
14:1 ω5c -
15:1 ω6c -
15:1 ω8c -
16:1 ω5c 2.68
16:1 ω9c -
17:1 ω6c 18.67
17:1 ω7c -
17:1 ω8c 3.37
11 methyl 18:1 ω7c 32.14
18:1 ω9c -
Sum 56.86
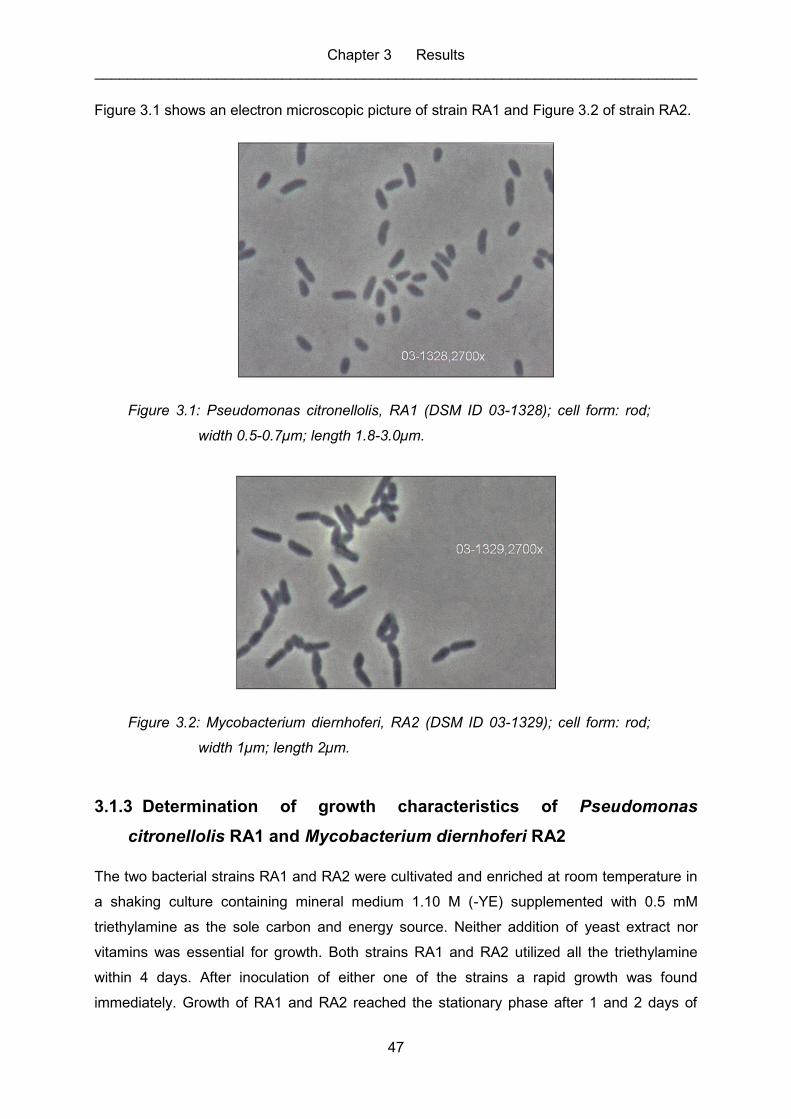
Chapter 3 Results __________________________________________________________________________
47
Figure 3.1 shows an electron microscopic picture of strain RA1 and Figure 3.2 of strain RA2.
Figure 3.1: Pseudomonas citronellolis, RA1 (DSM ID 03-1328); cell form: rod;
width 0.5-0.7µm; length 1.8-3.0µm.
Figure 3.2: Mycobacterium diernhoferi, RA2 (DSM ID 03-1329); cell form: rod;
width 1µm; length 2µm.
3.1.3 Determination of growth characteristics of Pseudomonas
citronellolis RA1 and Mycobacterium diernhoferi RA2
The two bacterial strains RA1 and RA2 were cultivated and enriched at room temperature in
a shaking culture containing mineral medium 1.10 M (-YE) supplemented with 0.5 mM
triethylamine as the sole carbon and energy source. Neither addition of yeast extract nor
vitamins was essential for growth. Both strains RA1 and RA2 utilized all the triethylamine
within 4 days. After inoculation of either one of the strains a rapid growth was found
immediately. Growth of RA1 and RA2 reached the stationary phase after 1 and 2 days of
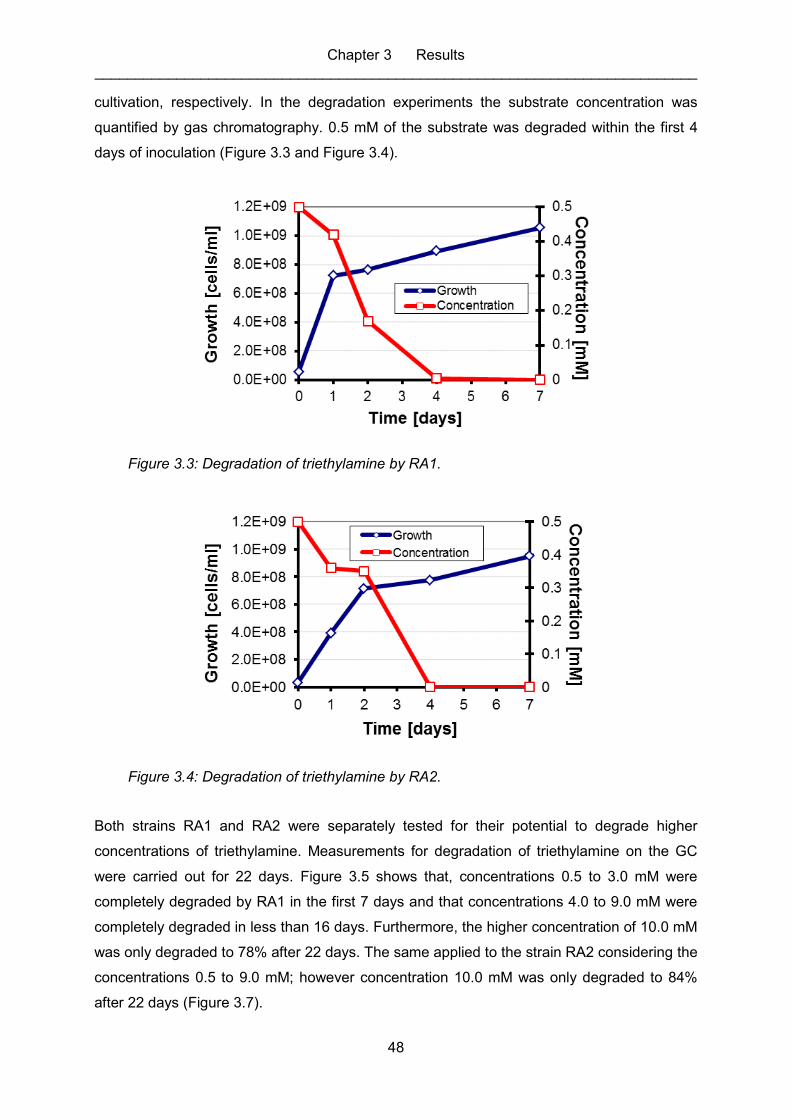
Chapter 3 Results __________________________________________________________________________
48
cultivation, respectively. In the degradation experiments the substrate concentration was
quantified by gas chromatography. 0.5 mM of the substrate was degraded within the first 4
days of inoculation (Figure 3.3 and Figure 3.4).
Figure 3.3: Degradation of triethylamine by RA1.
Figure 3.4: Degradation of triethylamine by RA2.
Both strains RA1 and RA2 were separately tested for their potential to degrade higher
concentrations of triethylamine. Measurements for degradation of triethylamine on the GC
were carried out for 22 days. Figure 3.5 shows that, concentrations 0.5 to 3.0 mM were
completely degraded by RA1 in the first 7 days and that concentrations 4.0 to 9.0 mM were
completely degraded in less than 16 days. Furthermore, the higher concentration of 10.0 mM
was only degraded to 78% after 22 days. The same applied to the strain RA2 considering the
concentrations 0.5 to 9.0 mM; however concentration 10.0 mM was only degraded to 84%
after 22 days (Figure 3.7).
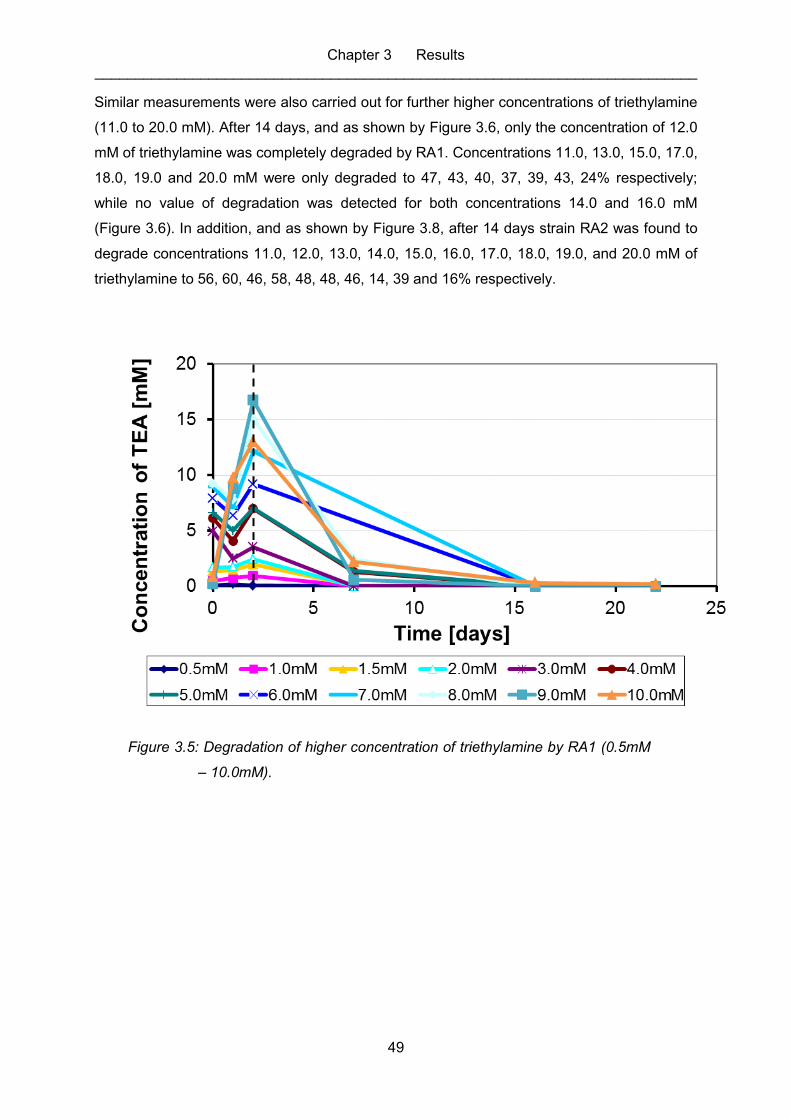
Chapter 3 Results __________________________________________________________________________
49
Similar measurements were also carried out for further higher concentrations of triethylamine
(11.0 to 20.0 mM). After 14 days, and as shown by Figure 3.6, only the concentration of 12.0
mM of triethylamine was completely degraded by RA1. Concentrations 11.0, 13.0, 15.0, 17.0,
18.0, 19.0 and 20.0 mM were only degraded to 47, 43, 40, 37, 39, 43, 24% respectively;
while no value of degradation was detected for both concentrations 14.0 and 16.0 mM
(Figure 3.6). In addition, and as shown by Figure 3.8, after 14 days strain RA2 was found to
degrade concentrations 11.0, 12.0, 13.0, 14.0, 15.0, 16.0, 17.0, 18.0, 19.0, and 20.0 mM of
triethylamine to 56, 60, 46, 58, 48, 48, 46, 14, 39 and 16% respectively.
Figure 3.5: Degradation of higher concentration of triethylamine by RA1 (0.5mM
– 10.0mM).
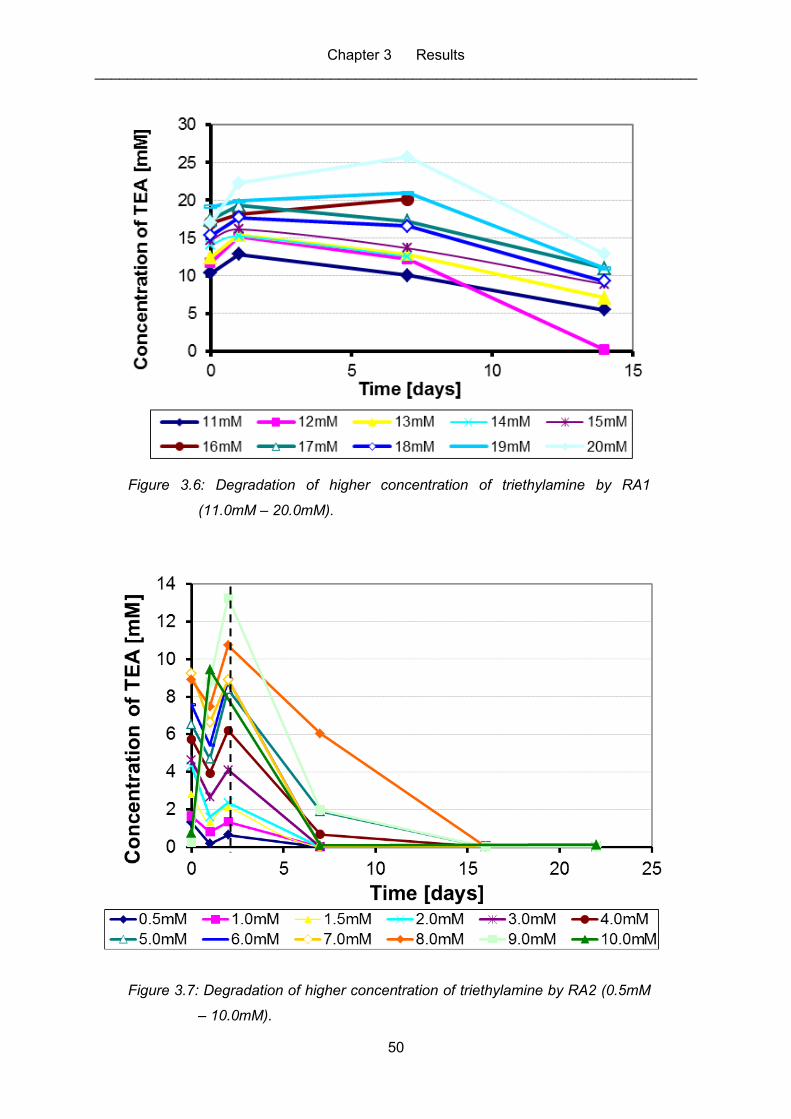
Chapter 3 Results __________________________________________________________________________
50
Figure 3.6: Degradation of higher concentration of triethylamine by RA1
(11.0mM – 20.0mM).
Figure 3.7: Degradation of higher concentration of triethylamine by RA2 (0.5mM
– 10.0mM).
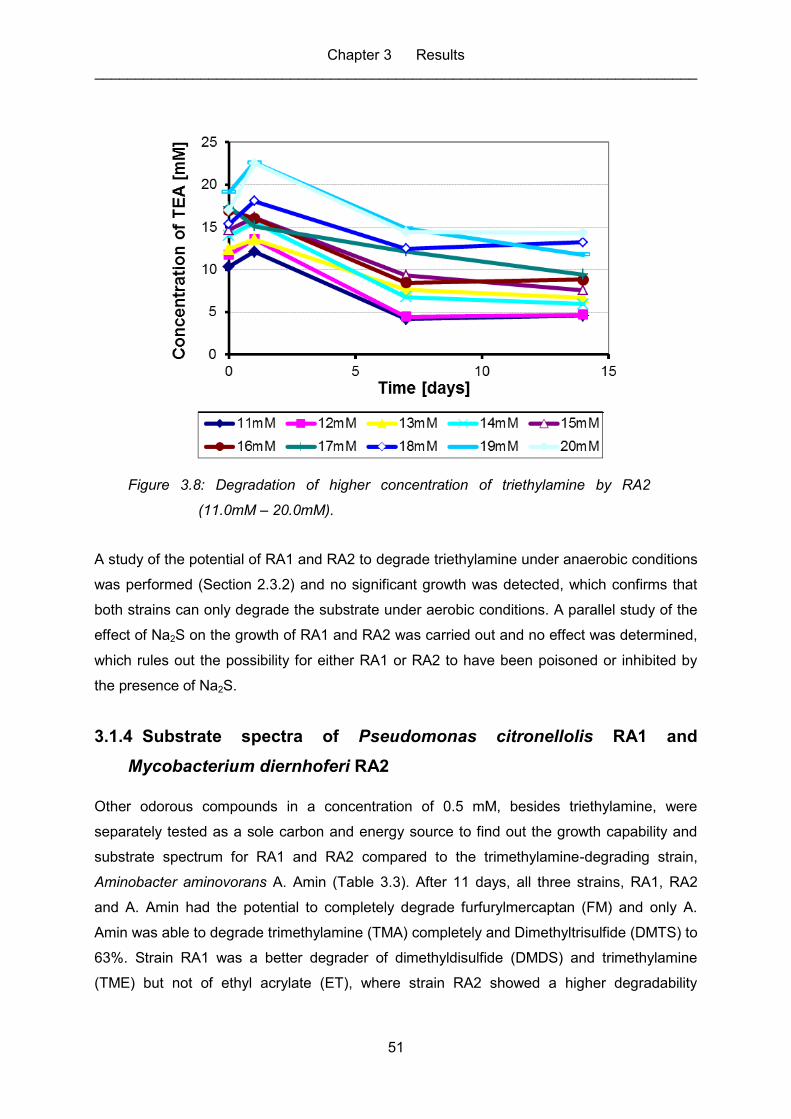
Chapter 3 Results __________________________________________________________________________
51
Figure 3.8: Degradation of higher concentration of triethylamine by RA2
(11.0mM – 20.0mM).
A study of the potential of RA1 and RA2 to degrade triethylamine under anaerobic conditions
was performed (Section 2.3.2) and no significant growth was detected, which confirms that
both strains can only degrade the substrate under aerobic conditions. A parallel study of the
effect of Na2S on the growth of RA1 and RA2 was carried out and no effect was determined,
which rules out the possibility for either RA1 or RA2 to have been poisoned or inhibited by
the presence of Na2S.
3.1.4 Substrate spectra of Pseudomonas citronellolis RA1 and
Mycobacterium diernhoferi RA2
Other odorous compounds in a concentration of 0.5 mM, besides triethylamine, were
separately tested as a sole carbon and energy source to find out the growth capability and
substrate spectrum for RA1 and RA2 compared to the trimethylamine-degrading strain,
Aminobacter aminovorans A. Amin (Table 3.3). After 11 days, all three strains, RA1, RA2
and A. Amin had the potential to completely degrade furfurylmercaptan (FM) and only A.
Amin was able to degrade trimethylamine (TMA) completely and Dimethyltrisulfide (DMTS) to
63%. Strain RA1 was a better degrader of dimethyldisulfide (DMDS) and trimethylamine
(TME) but not of ethyl acrylate (ET), where strain RA2 showed a higher degradability
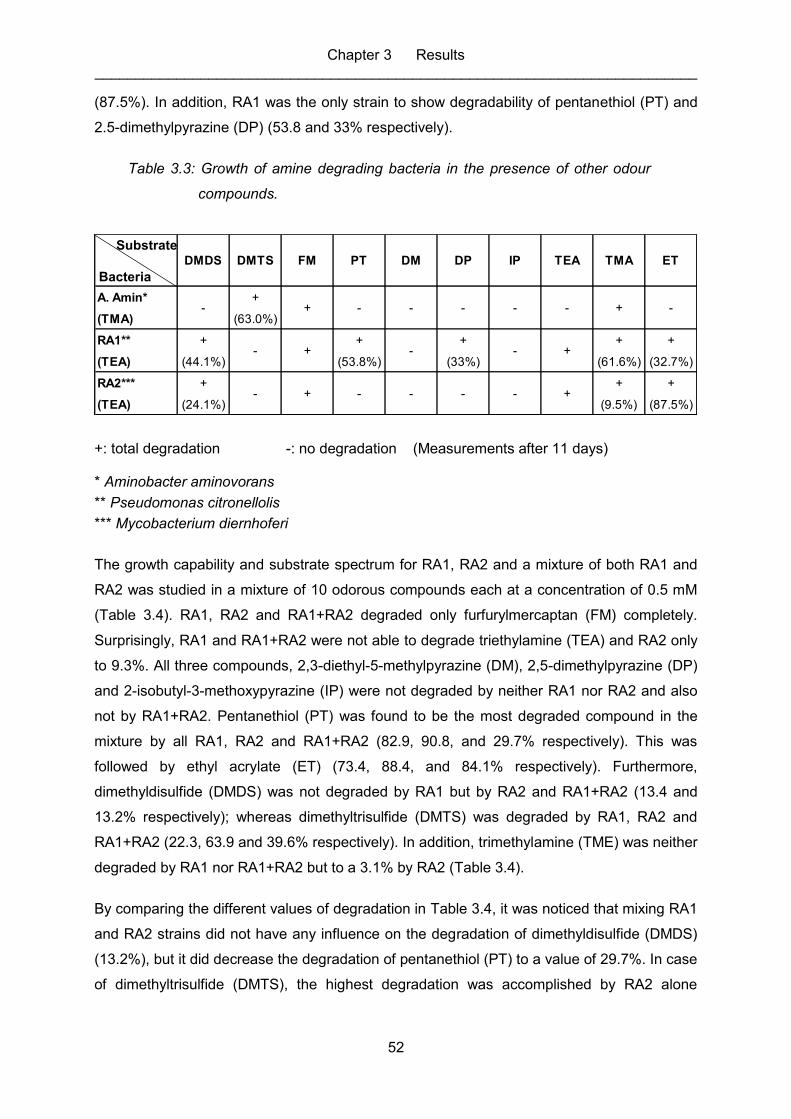
Chapter 3 Results __________________________________________________________________________
52
(87.5%). In addition, RA1 was the only strain to show degradability of pentanethiol (PT) and
2.5-dimethylpyrazine (DP) (53.8 and 33% respectively).
Table 3.3: Growth of amine degrading bacteria in the presence of other odour
compounds.
A. Amin* +
(TMA) (63.0%)
RA1** + + + + +
(TEA) (44.1%) (53.8%) (33%) (61.6%) (32.7%)
RA2*** + + +
(TEA) (24.1%) (9.5%) (87.5%)-- + -
-
- -
-+
+
-
- +
PT
+ +
DM DP IP
--
ET
- --
DMDS DMTS FM TEA TMA
-
+: total degradation -: no degradation (Measurements after 11 days)
* Aminobacter aminovorans
** Pseudomonas citronellolis
*** Mycobacterium diernhoferi
The growth capability and substrate spectrum for RA1, RA2 and a mixture of both RA1 and
RA2 was studied in a mixture of 10 odorous compounds each at a concentration of 0.5 mM
(Table 3.4). RA1, RA2 and RA1+RA2 degraded only furfurylmercaptan (FM) completely.
Surprisingly, RA1 and RA1+RA2 were not able to degrade triethylamine (TEA) and RA2 only
to 9.3%. All three compounds, 2,3-diethyl-5-methylpyrazine (DM), 2,5-dimethylpyrazine (DP)
and 2-isobutyl-3-methoxypyrazine (IP) were not degraded by neither RA1 nor RA2 and also
not by RA1+RA2. Pentanethiol (PT) was found to be the most degraded compound in the
mixture by all RA1, RA2 and RA1+RA2 (82.9, 90.8, and 29.7% respectively). This was
followed by ethyl acrylate (ET) (73.4, 88.4, and 84.1% respectively). Furthermore,
dimethyldisulfide (DMDS) was not degraded by RA1 but by RA2 and RA1+RA2 (13.4 and
13.2% respectively); whereas dimethyltrisulfide (DMTS) was degraded by RA1, RA2 and
RA1+RA2 (22.3, 63.9 and 39.6% respectively). In addition, trimethylamine (TME) was neither
degraded by RA1 nor RA1+RA2 but to a 3.1% by RA2 (Table 3.4).
By comparing the different values of degradation in Table 3.4, it was noticed that mixing RA1
and RA2 strains did not have any influence on the degradation of dimethyldisulfide (DMDS)
(13.2%), but it did decrease the degradation of pentanethiol (PT) to a value of 29.7%. In case
of dimethyltrisulfide (DMTS), the highest degradation was accomplished by RA2 alone
Substrate
Bacteria
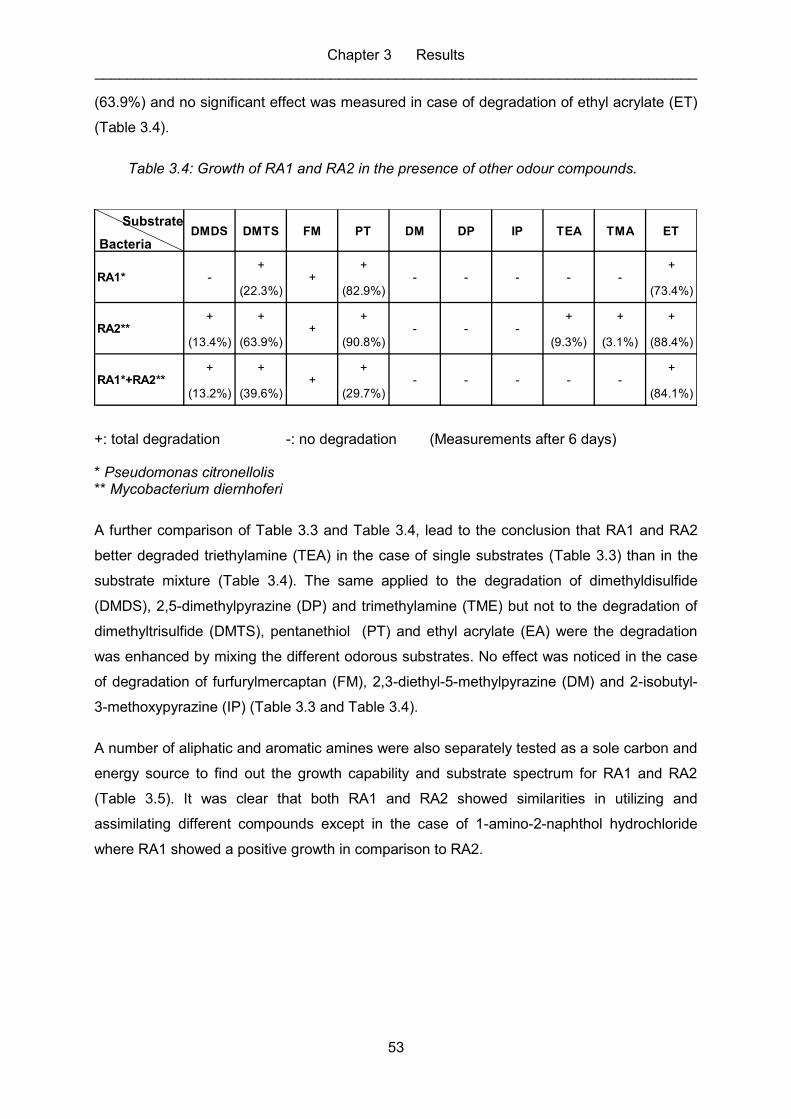
Chapter 3 Results __________________________________________________________________________
53
(63.9%) and no significant effect was measured in case of degradation of ethyl acrylate (ET)
(Table 3.4).
Table 3.4: Growth of RA1 and RA2 in the presence of other odour compounds.
DMDS DMTS FM PT DM DP IP TEA TMA ET
+ + +
(22.3%) (82.9%) (73.4%)
+ + + + + +
(13.4%) (63.9%) (90.8%) (9.3%) (3.1%) (88.4%)
+ + + +
(13.2%) (39.6%) (29.7%) (84.1%)-
RA2**
RA1*+RA2**
- - -
- - - -+
+
- -RA1* - + - - -
+: total degradation -: no degradation (Measurements after 6 days)
* Pseudomonas citronellolis ** Mycobacterium diernhoferi
A further comparison of Table 3.3 and Table 3.4, lead to the conclusion that RA1 and RA2
better degraded triethylamine (TEA) in the case of single substrates (Table 3.3) than in the
substrate mixture (Table 3.4). The same applied to the degradation of dimethyldisulfide
(DMDS), 2,5-dimethylpyrazine (DP) and trimethylamine (TME) but not to the degradation of
dimethyltrisulfide (DMTS), pentanethiol (PT) and ethyl acrylate (EA) were the degradation
was enhanced by mixing the different odorous substrates. No effect was noticed in the case
of degradation of furfurylmercaptan (FM), 2,3-diethyl-5-methylpyrazine (DM) and 2-isobutyl-
3-methoxypyrazine (IP) (Table 3.3 and Table 3.4).
A number of aliphatic and aromatic amines were also separately tested as a sole carbon and
energy source to find out the growth capability and substrate spectrum for RA1 and RA2
(Table 3.5). It was clear that both RA1 and RA2 showed similarities in utilizing and
assimilating different compounds except in the case of 1-amino-2-naphthol hydrochloride
where RA1 showed a positive growth in comparison to RA2.
Bacteria
Substrate
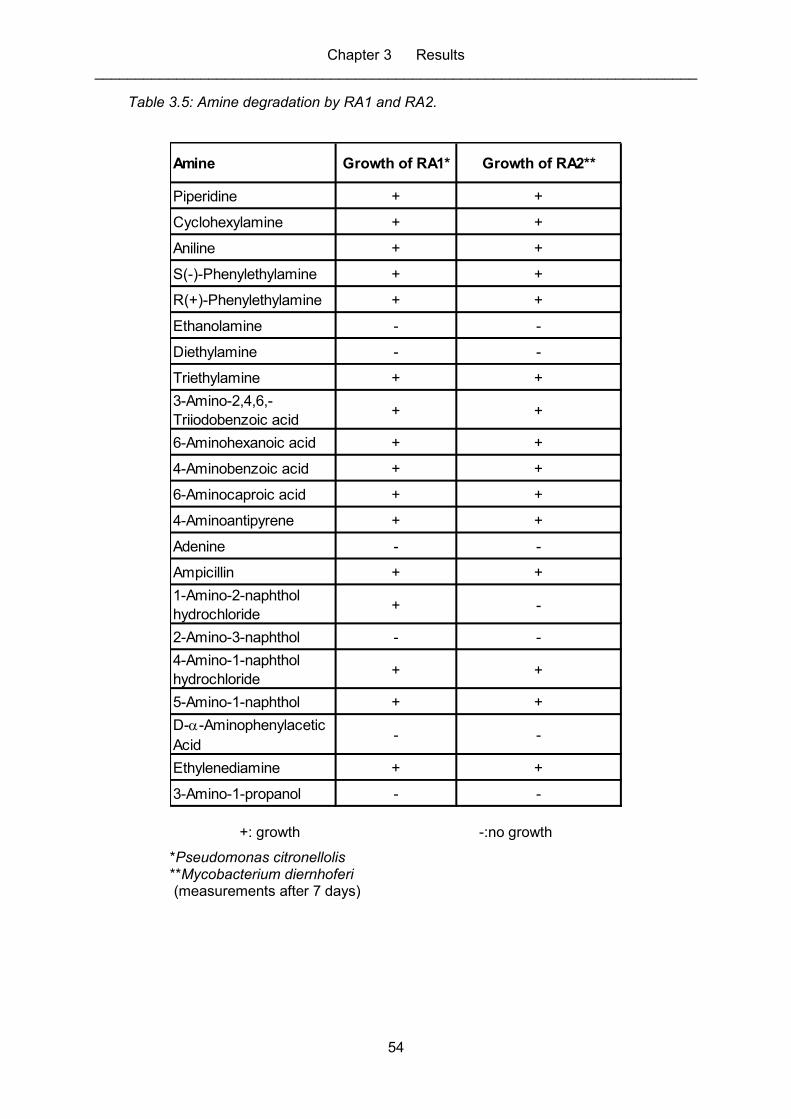
Chapter 3 Results __________________________________________________________________________
54
Table 3.5: Amine degradation by RA1 and RA2.
Amine Growth of RA1* Growth of RA2**
Piperidine + +
Cyclohexylamine + +
Aniline + +
S(-)-Phenylethylamine + +
R(+)-Phenylethylamine + +
Ethanolamine - -
Diethylamine - -
Triethylamine + +
3-Amino-2,4,6,-
Triiodobenzoic acid+ +
6-Aminohexanoic acid + +
4-Aminobenzoic acid + +
6-Aminocaproic acid + +
4-Aminoantipyrene + +
Adenine - -
Ampicillin + +
1-Amino-2-naphthol
hydrochloride+ -
2-Amino-3-naphthol - -
4-Amino-1-naphthol
hydrochloride+ +
5-Amino-1-naphthol + +
D-a-Aminophenylacetic
Acid- -
Ethylenediamine + +
3-Amino-1-propanol - -
+: growth -:no growth
*Pseudomonas citronellolis **Mycobacterium diernhoferi (measurements after 7 days)
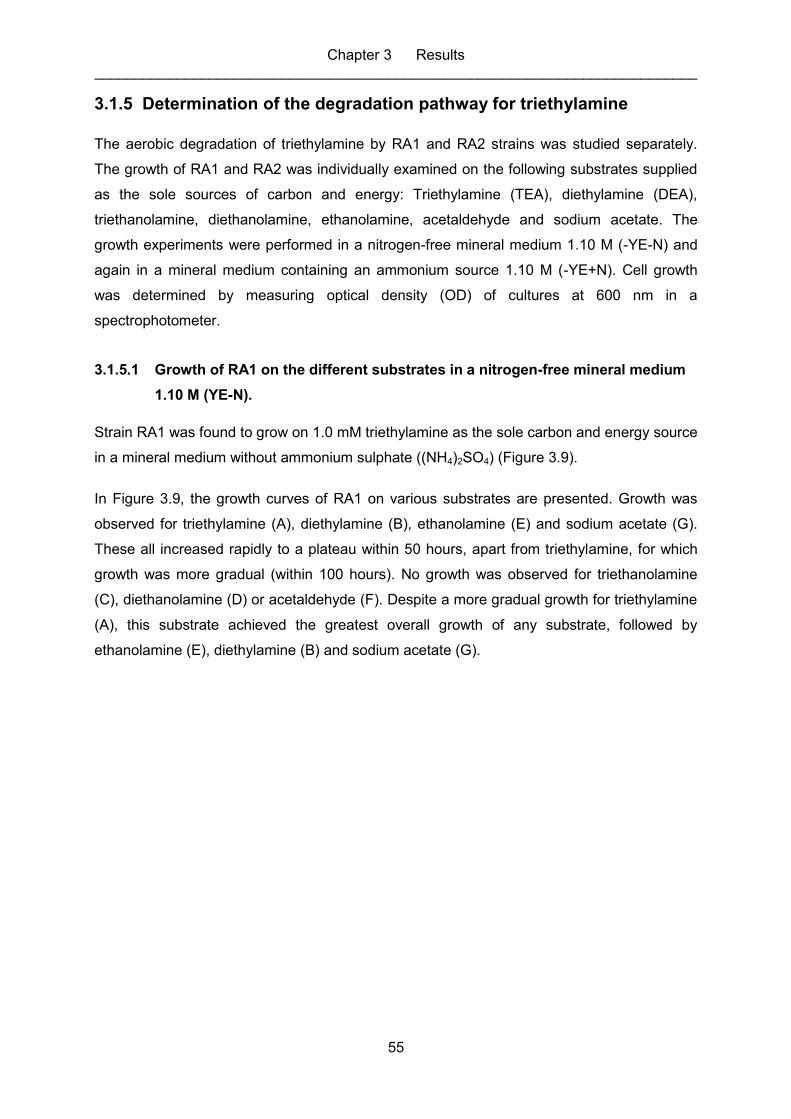
Chapter 3 Results __________________________________________________________________________
55
3.1.5 Determination of the degradation pathway for triethylamine
The aerobic degradation of triethylamine by RA1 and RA2 strains was studied separately.
The growth of RA1 and RA2 was individually examined on the following substrates supplied
as the sole sources of carbon and energy: Triethylamine (TEA), diethylamine (DEA),
triethanolamine, diethanolamine, ethanolamine, acetaldehyde and sodium acetate. The
growth experiments were performed in a nitrogen-free mineral medium 1.10 M (-YE-N) and
again in a mineral medium containing an ammonium source 1.10 M (-YE+N). Cell growth
was determined by measuring optical density (OD) of cultures at 600 nm in a
spectrophotometer.
3.1.5.1 Growth of RA1 on the different substrates in a nitrogen-free mineral medium
1.10 M (YE-N).
Strain RA1 was found to grow on 1.0 mM triethylamine as the sole carbon and energy source
in a mineral medium without ammonium sulphate ((NH4)2SO4) (Figure 3.9).
In Figure 3.9, the growth curves of RA1 on various substrates are presented. Growth was
observed for triethylamine (A), diethylamine (B), ethanolamine (E) and sodium acetate (G).
These all increased rapidly to a plateau within 50 hours, apart from triethylamine, for which
growth was more gradual (within 100 hours). No growth was observed for triethanolamine
(C), diethanolamine (D) or acetaldehyde (F). Despite a more gradual growth for triethylamine
(A), this substrate achieved the greatest overall growth of any substrate, followed by
ethanolamine (E), diethylamine (B) and sodium acetate (G).
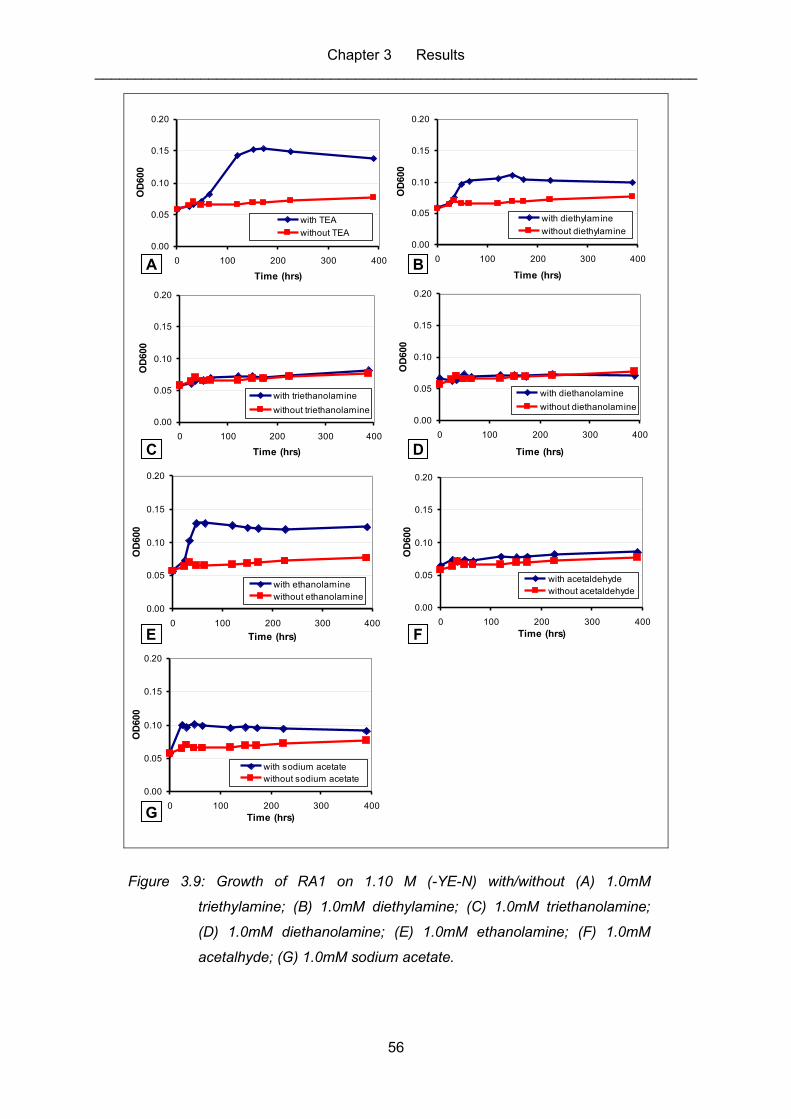
Chapter 3 Results __________________________________________________________________________
56
0.00
0.05
0.10
0.15
0.20
0 100 200 300 400
Time (hrs)
OD
600
with sodium acetate
without sodium acetate
0.00
0.05
0.10
0.15
0.20
0 100 200 300 400
Time (hrs)
OD
600
with acetaldehyde
without acetaldehyde
0.00
0.05
0.10
0.15
0.20
0 100 200 300 400
Time (hrs)
OD
600
with ethanolamine
without ethanolamine
0.00
0.05
0.10
0.15
0.20
0 100 200 300 400
Time (hrs)
OD
600
with diethanolamine
without diethanolamine
0.00
0.05
0.10
0.15
0.20
0 100 200 300 400
Time (hrs)
OD
600
with triethanolamine
without triethanolamine
0.00
0.05
0.10
0.15
0.20
0 100 200 300 400
Time (hrs)
OD
600
with diethylamine
without diethylamine
0.00
0.05
0.10
0.15
0.20
0 100 200 300 400
Time (hrs)
OD
600
with TEA
without TEA
A B
C D
E F
G
Figure 3.9: Growth of RA1 on 1.10 M (-YE-N) with/without (A) 1.0mM
triethylamine; (B) 1.0mM diethylamine; (C) 1.0mM triethanolamine;
(D) 1.0mM diethanolamine; (E) 1.0mM ethanolamine; (F) 1.0mM
acetalhyde; (G) 1.0mM sodium acetate.
Chapter 3 Results __________________________________________________________________________
57
3.1.5.2 Growth of RA2 on the different substrates in a nitrogen-free mineral medium
1.10 M (YE-N).
In Figure 3.10, the growth curves of RA2 on the same substrates as for RA1 (Figure 3.9) are
shown. Very similar trends were observed for the two strains. Thus, growth was measured
for triethylamine (A), diethylamine (B), ethanolamine (E) and sodium acetate (G) and not for
triethanolamine (C), diethanolamine (D) or acetaldehyde (F). However, despite similar growth
rates, the growth peaks were higher for RA2 than for RA1 in each case, and therefore
occurred later (200 hours for triethylamine (A), 150 hours for ethanolamine (E) and 50 hours
for diethylamine (B) and sodium acetate (G)).
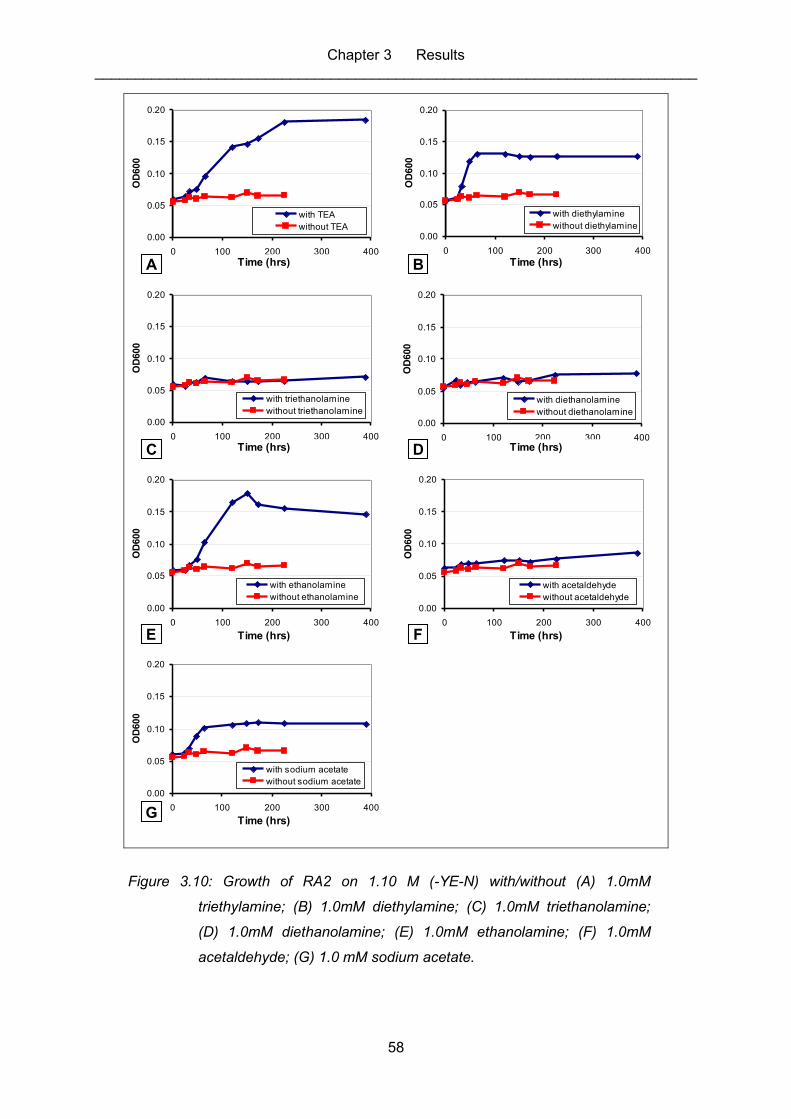
Chapter 3 Results __________________________________________________________________________
58
0.00
0.05
0.10
0.15
0.20
0 100 200 300 400
Time (days)
OD
600
with diethylamine
without diethylamine
0.00
0.05
0.10
0.15
0.20
0 100 200 300 400
Time (days)
OD
600
with triethanolamine
without triethanolamine
0.00
0.05
0.10
0.15
0.20
0 100 200 300 400
Time (days)
OD
600
with diethanolamine
without diethanolamine
0.00
0.05
0.10
0.15
0.20
0 100 200 300 400
Time (days)
OD
600
with ethanolamine
without ethanolamine
0.00
0.05
0.10
0.15
0.20
0 100 200 300 400
Time (days)
OD
600
with acetaldehyde
without acetaldehyde
0.00
0.05
0.10
0.15
0.20
0 100 200 300 400
Time (days)
OD
600
with sodium acetate
without sodium acetate
0.00
0.05
0.10
0.15
0.20
0 100 200 300 400
Time (days)
OD
600
with TEA
without TEA
A B
C D
E F
G
Time (hrs) Time (hrs)
Time (hrs) Time (hrs)
Time (hrs) Time (hrs)
Time (hrs)
Figure 3.10: Growth of RA2 on 1.10 M (-YE-N) with/without (A) 1.0mM
triethylamine; (B) 1.0mM diethylamine; (C) 1.0mM triethanolamine;
(D) 1.0mM diethanolamine; (E) 1.0mM ethanolamine; (F) 1.0mM
acetaldehyde; (G) 1.0 mM sodium acetate.
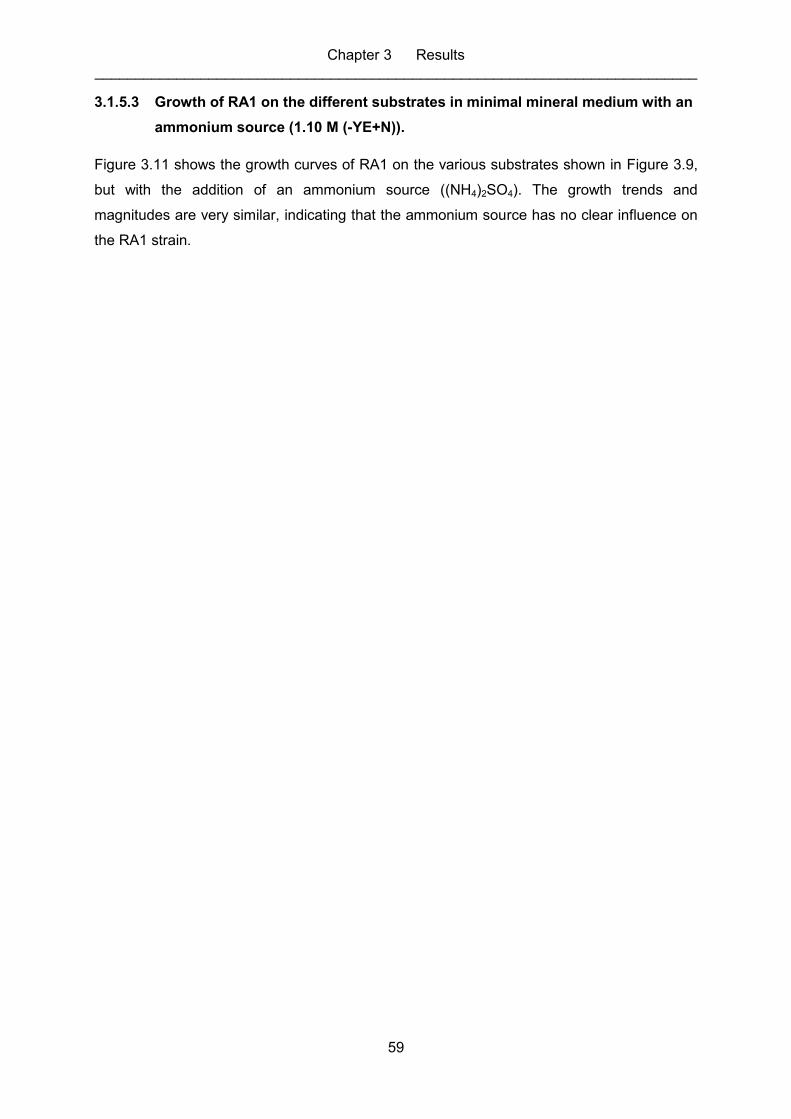
Chapter 3 Results __________________________________________________________________________
59
3.1.5.3 Growth of RA1 on the different substrates in minimal mineral medium with an
ammonium source (1.10 M (-YE+N)).
Figure 3.11 shows the growth curves of RA1 on the various substrates shown in Figure 3.9,
but with the addition of an ammonium source ((NH4)2SO4). The growth trends and
magnitudes are very similar, indicating that the ammonium source has no clear influence on
the RA1 strain.
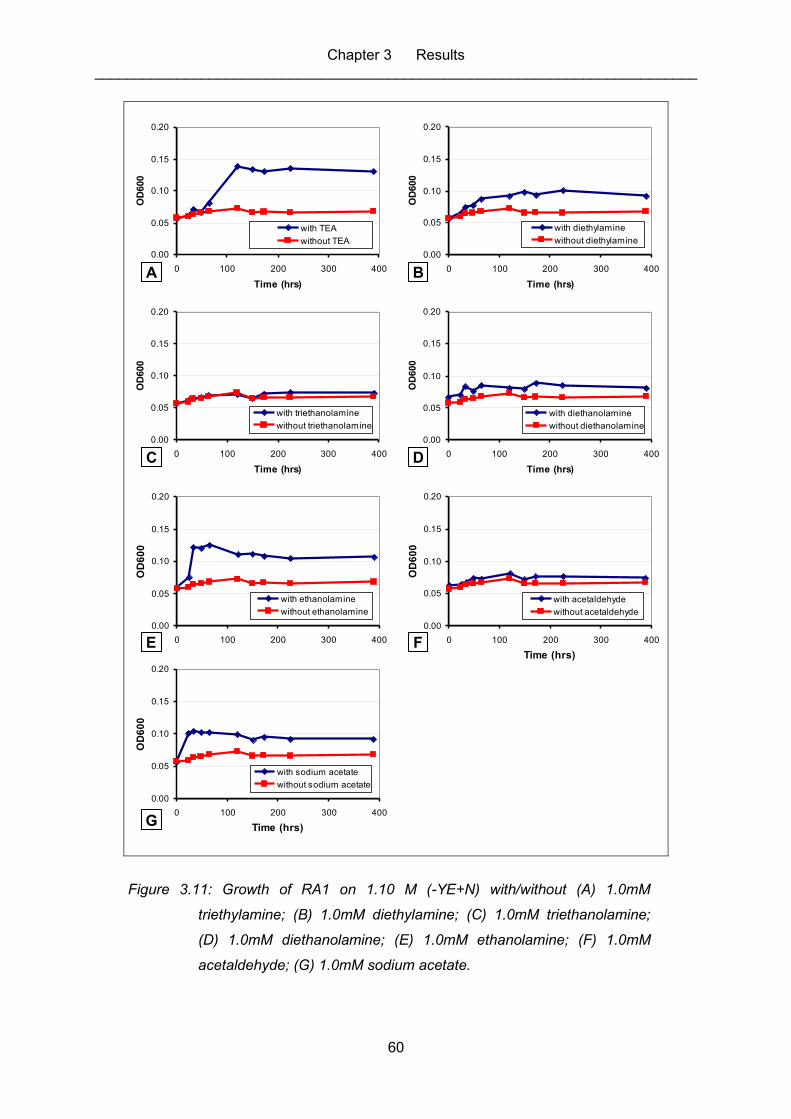
Chapter 3 Results __________________________________________________________________________
60
0.00
0.05
0.10
0.15
0.20
0 100 200 300 400
Time (hrs)
OD
600
with TEA
without TEA
0.00
0.05
0.10
0.15
0.20
0 100 200 300 400
Time (hrs)
OD
600
with diethylamine
without diethylamine
0.00
0.05
0.10
0.15
0.20
0 100 200 300 400
Time (hrs)
OD
600
with triethanolamine
without triethanolamine
0.00
0.05
0.10
0.15
0.20
0 100 200 300 400
Time (hrs)
OD
600
with diethanolamine
without diethanolamine
0.00
0.05
0.10
0.15
0.20
0 100 200 300 400
Time (hrs)
OD
60
0
with ethanolamine
without ethanolamine
0.00
0.05
0.10
0.15
0.20
0 100 200 300 400
Time (hrs)
OD
60
0
with acetaldehyde
without acetaldehyde
0.00
0.05
0.10
0.15
0.20
0 100 200 300 400
Time (hrs)
OD
60
0
with sodium acetate
without sodium acetate
A B
C D
E F
G
Figure 3.11: Growth of RA1 on 1.10 M (-YE+N) with/without (A) 1.0mM
triethylamine; (B) 1.0mM diethylamine; (C) 1.0mM triethanolamine;
(D) 1.0mM diethanolamine; (E) 1.0mM ethanolamine; (F) 1.0mM
acetaldehyde; (G) 1.0mM sodium acetate.
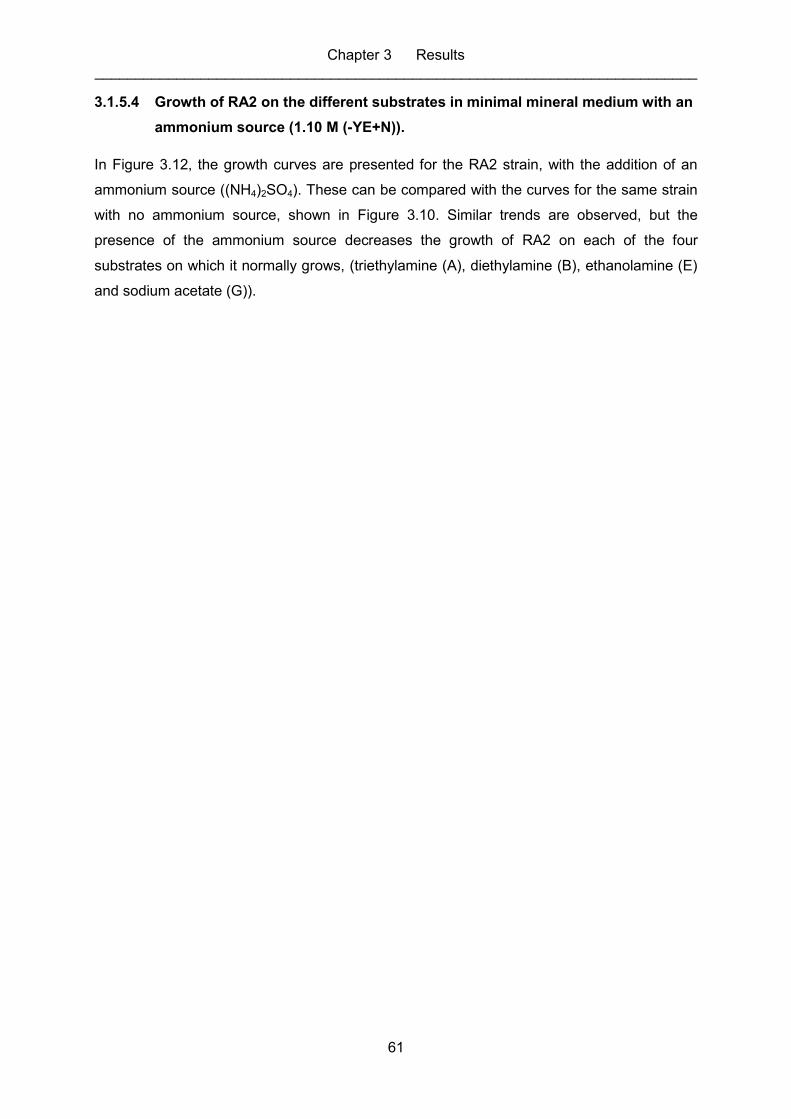
Chapter 3 Results __________________________________________________________________________
61
3.1.5.4 Growth of RA2 on the different substrates in minimal mineral medium with an
ammonium source (1.10 M (-YE+N)).
In Figure 3.12, the growth curves are presented for the RA2 strain, with the addition of an
ammonium source ((NH4)2SO4). These can be compared with the curves for the same strain
with no ammonium source, shown in Figure 3.10. Similar trends are observed, but the
presence of the ammonium source decreases the growth of RA2 on each of the four
substrates on which it normally grows, (triethylamine (A), diethylamine (B), ethanolamine (E)
and sodium acetate (G)).
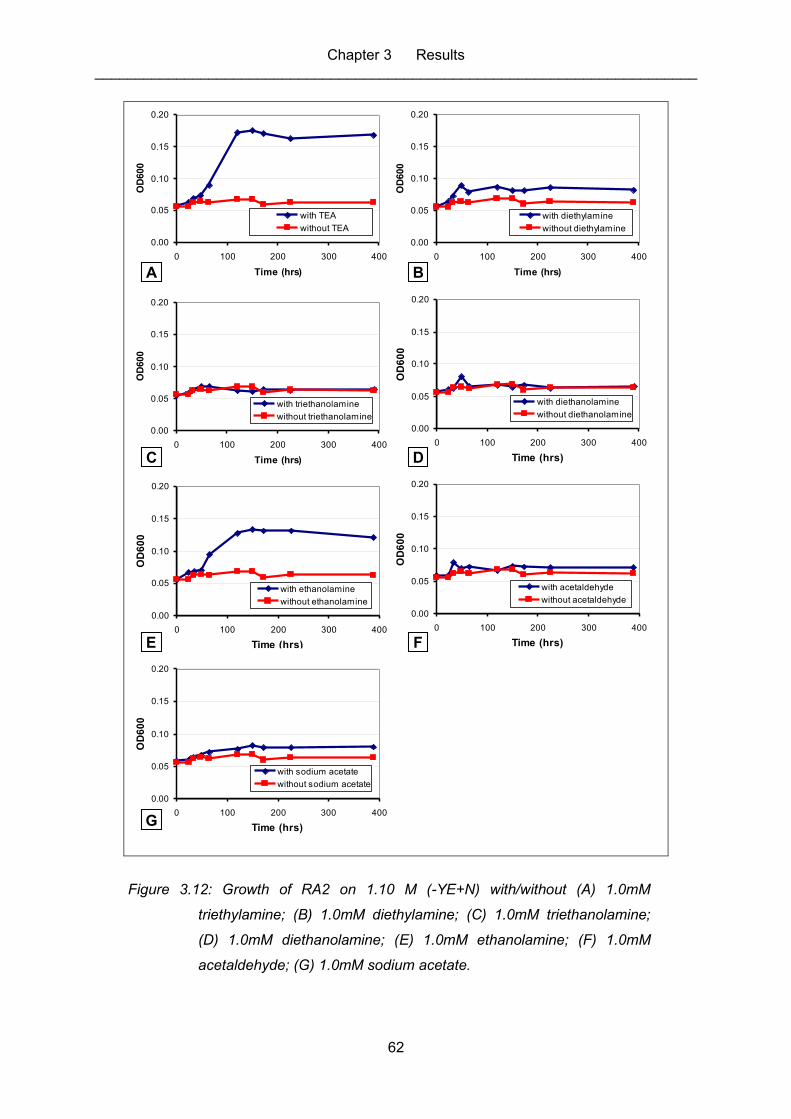
Chapter 3 Results __________________________________________________________________________
62
0.00
0.05
0.10
0.15
0.20
0 100 200 300 400
Time (hrs)
OD
600
with TEA
without TEA
0.00
0.05
0.10
0.15
0.20
0 100 200 300 400
Time (hrs)
OD
600
with diethylamine
without diethylamine
0.00
0.05
0.10
0.15
0.20
0 100 200 300 400
Time (hrs)
OD
600
with triethanolamine
without triethanolamine
0.00
0.05
0.10
0.15
0.20
0 100 200 300 400
Time (hrs)
OD
60
0with diethanolamine
without diethanolamine
0.00
0.05
0.10
0.15
0.20
0 100 200 300 400
Time (hrs)
OD
60
0
with ethanolamine
without ethanolamine
0.00
0.05
0.10
0.15
0.20
0 100 200 300 400
Time (hrs)
OD
60
0
with acetaldehyde
without acetaldehyde
0.00
0.05
0.10
0.15
0.20
0 100 200 300 400
Time (hrs)
OD
60
0
with sodium acetate
without sodium acetate
A B
C D
E F
G
Figure 3.12: Growth of RA2 on 1.10 M (-YE+N) with/without (A) 1.0mM
triethylamine; (B) 1.0mM diethylamine; (C) 1.0mM triethanolamine;
(D) 1.0mM diethanolamine; (E) 1.0mM ethanolamine; (F) 1.0mM
acetaldehyde; (G) 1.0mM sodium acetate.
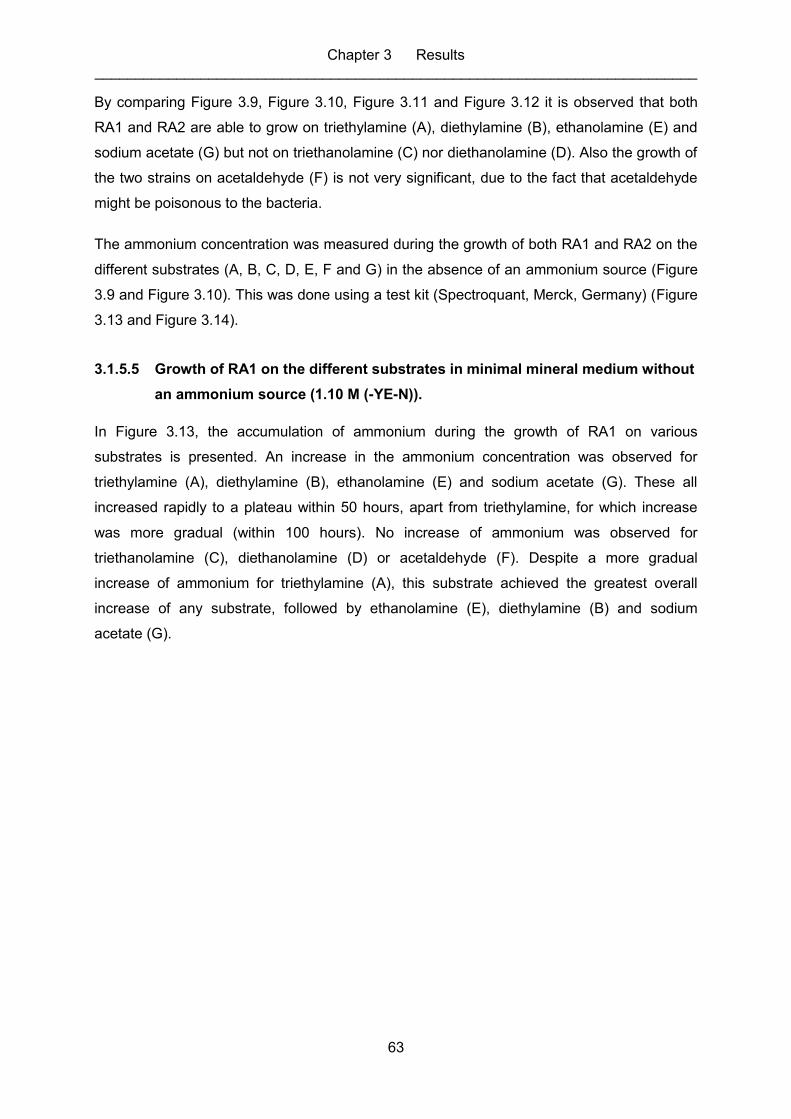
Chapter 3 Results __________________________________________________________________________
63
By comparing Figure 3.9, Figure 3.10, Figure 3.11 and Figure 3.12 it is observed that both
RA1 and RA2 are able to grow on triethylamine (A), diethylamine (B), ethanolamine (E) and
sodium acetate (G) but not on triethanolamine (C) nor diethanolamine (D). Also the growth of
the two strains on acetaldehyde (F) is not very significant, due to the fact that acetaldehyde
might be poisonous to the bacteria.
The ammonium concentration was measured during the growth of both RA1 and RA2 on the
different substrates (A, B, C, D, E, F and G) in the absence of an ammonium source (Figure
3.9 and Figure 3.10). This was done using a test kit (Spectroquant, Merck, Germany) (Figure
3.13 and Figure 3.14).
3.1.5.5 Growth of RA1 on the different substrates in minimal mineral medium without
an ammonium source (1.10 M (-YE-N)).
In Figure 3.13, the accumulation of ammonium during the growth of RA1 on various
substrates is presented. An increase in the ammonium concentration was observed for
triethylamine (A), diethylamine (B), ethanolamine (E) and sodium acetate (G). These all
increased rapidly to a plateau within 50 hours, apart from triethylamine, for which increase
was more gradual (within 100 hours). No increase of ammonium was observed for
triethanolamine (C), diethanolamine (D) or acetaldehyde (F). Despite a more gradual
increase of ammonium for triethylamine (A), this substrate achieved the greatest overall
increase of any substrate, followed by ethanolamine (E), diethylamine (B) and sodium
acetate (G).
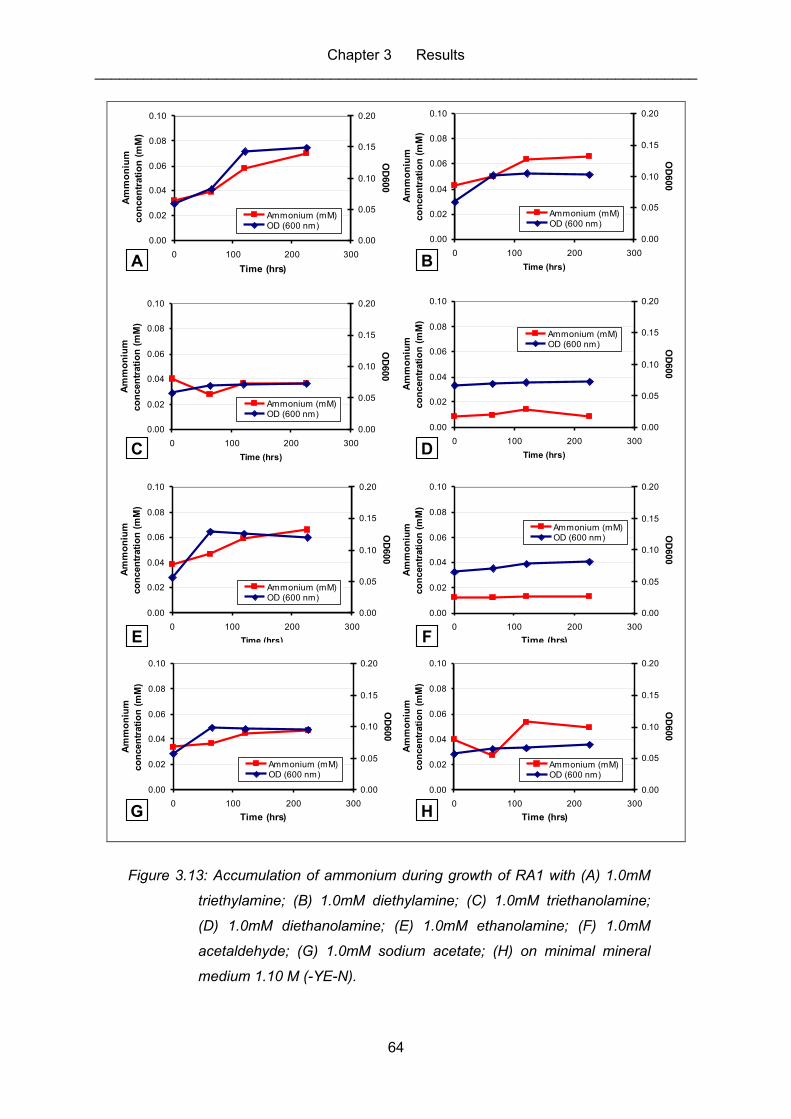
Chapter 3 Results __________________________________________________________________________
64
0.00
0.02
0.04
0.06
0.08
0.10
0 100 200 300
Time (hrs)
Am
mo
niu
m
co
ncen
trati
on
(m
M)
0.00
0.05
0.10
0.15
0.20O
D600
Ammonium (mM)OD (600 nm)
0.00
0.02
0.04
0.06
0.08
0.10
0 100 200 300
Time (hrs)
Am
mo
niu
m
co
ncen
trati
on
(m
M)
0.00
0.05
0.10
0.15
0.20
OD
600
Ammonium (mM)OD (600 nm)
0.00
0.02
0.04
0.06
0.08
0.10
0 100 200 300
Time (hrs)
Am
mo
niu
m
co
ncen
trati
on
(m
M)
0.00
0.05
0.10
0.15
0.20
OD
600
Ammonium (mM)OD (600 nm)
0.00
0.02
0.04
0.06
0.08
0.10
0 100 200 300
Time (hrs)
Am
mo
niu
m
co
ncen
trati
on
(m
M)
0.00
0.05
0.10
0.15
0.20
OD
600
Ammonium (mM)OD (600 nm)
0.00
0.02
0.04
0.06
0.08
0.10
0 100 200 300
Time (hrs)
Am
mo
niu
m
co
ncen
trati
on
(m
M)
0.00
0.05
0.10
0.15
0.20
OD
600
Ammonium (mM)OD (600 nm)
0.00
0.02
0.04
0.06
0.08
0.10
0 100 200 300
Time (hrs)
Am
mo
niu
m
co
ncen
trati
on
(m
M)
0.00
0.05
0.10
0.15
0.20
OD
600
Ammonium (mM)OD (600 nm)
0.00
0.02
0.04
0.06
0.08
0.10
0 100 200 300
Time (hrs)
Am
mo
niu
m
co
ncen
trati
on
(m
M)
0.00
0.05
0.10
0.15
0.20
OD
600
Ammonium (mM)OD (600 nm)
0.00
0.02
0.04
0.06
0.08
0.10
0 100 200 300
Time (hrs)
Am
mo
niu
m
co
ncen
trati
on
(m
M)
0.00
0.05
0.10
0.15
0.20
OD
600
Ammonium (mM)OD (600 nm)
A B
C D
E F
G H
Figure 3.13: Accumulation of ammonium during growth of RA1 with (A) 1.0mM
triethylamine; (B) 1.0mM diethylamine; (C) 1.0mM triethanolamine;
(D) 1.0mM diethanolamine; (E) 1.0mM ethanolamine; (F) 1.0mM
acetaldehyde; (G) 1.0mM sodium acetate; (H) on minimal mineral
medium 1.10 M (-YE-N).
Chapter 3 Results __________________________________________________________________________
65
3.1.5.6 Growth of RA2 on the different substrates in minimal mineral medium without
an ammonium source (1.10 M (-YE-N)).
In Figure 3.14, the accumulation of ammonium during the growth of RA2 on various
substrates is presented as for RA1 (Figure 3.13). Very similar trends were observed for the
two strains. An increase of ammonium was measured for triethylamine (A), diethylamine (B),
ethanolamine (E) and sodium acetate (G) and not for triethanolamine (C), diethanolamine (D)
or acetaldehyde (F). However, despite similar increase rates, the amount of ammonium
produced was higher for RA2 than for RA1 in each case.
Chapter 3 Results __________________________________________________________________________
66
0.00
0.02
0.04
0.06
0.08
0.10
0 100 200 300
Time (hrs)
Am
mo
niu
m
co
ncen
trati
on
(m
M)
0.00
0.05
0.10
0.15
0.20
OD
600
Ammonium (mM)OD (600 nm)
0.00
0.02
0.04
0.06
0.08
0.10
0 100 200 300
Time (hrs)
Am
mo
niu
m
co
ncen
trati
on
(m
M)
0.00
0.05
0.10
0.15
0.20O
D600
Ammonium (mM)OD (600 nm)
0.00
0.02
0.04
0.06
0.08
0.10
0 100 200 300
Time (hrs)
Am
mo
niu
m
co
ncen
trati
on
(m
M)
0.00
0.05
0.10
0.15
0.20
OD
600
Ammonium (mM)OD (600 nm)
0.00
0.02
0.04
0.06
0.08
0.10
0 100 200 300
Time (hrs)
Am
mo
niu
m
co
ncen
trati
on
(m
M)
0.00
0.05
0.10
0.15
0.20
OD
600
Ammonium (mM)OD (600 nm)
0.00
0.02
0.04
0.06
0.08
0.10
0 100 200 300
Time (hrs)
Am
mo
niu
m
co
nc
en
tra
tio
n (
mM
)
0.00
0.05
0.10
0.15
0.20
OD
60
0
Ammonium (mM)OD (600 nm)
0.00
0.02
0.04
0.06
0.08
0.10
0 100 200 300
Time (hrs)
Am
mo
niu
m
co
nc
en
tra
tio
n (
mM
)
0.00
0.05
0.10
0.15
0.20
OD
60
0
Ammonium (mM)OD (600 nm)
0.00
0.02
0.04
0.06
0.08
0.10
0 100 200 300
Time (hrs)
Am
mo
niu
m
co
ncen
trati
on
(m
M)
0.00
0.05
0.10
0.15
0.20
OD
600
Ammonium (mM)OD (600 nm)
0.00
0.02
0.04
0.06
0.08
0.10
0 100 200 300
Time (hrs)
Am
mo
niu
m
co
nc
en
tra
tio
n (
mM
)
0.00
0.05
0.10
0.15
0.20
OD
60
0
Ammonium (mM)OD (600 nm)
A B
C D
E F
G H
Figure 3.14: Accumulation of ammonium during growth of RA2 with (A) 1.0mM
triethylamine; (B) 1.0mM diethylamine; (C) 1.0mM triethanolamine;
(D) 1.0mM diethanolamine; (E) 1.0mM ethanolamine; (F) 1.0mM
acetaldehyde; (G) 1.0mM sodium acetate; (H) on minimal mineral
medium 1.10 M (-YE-N).
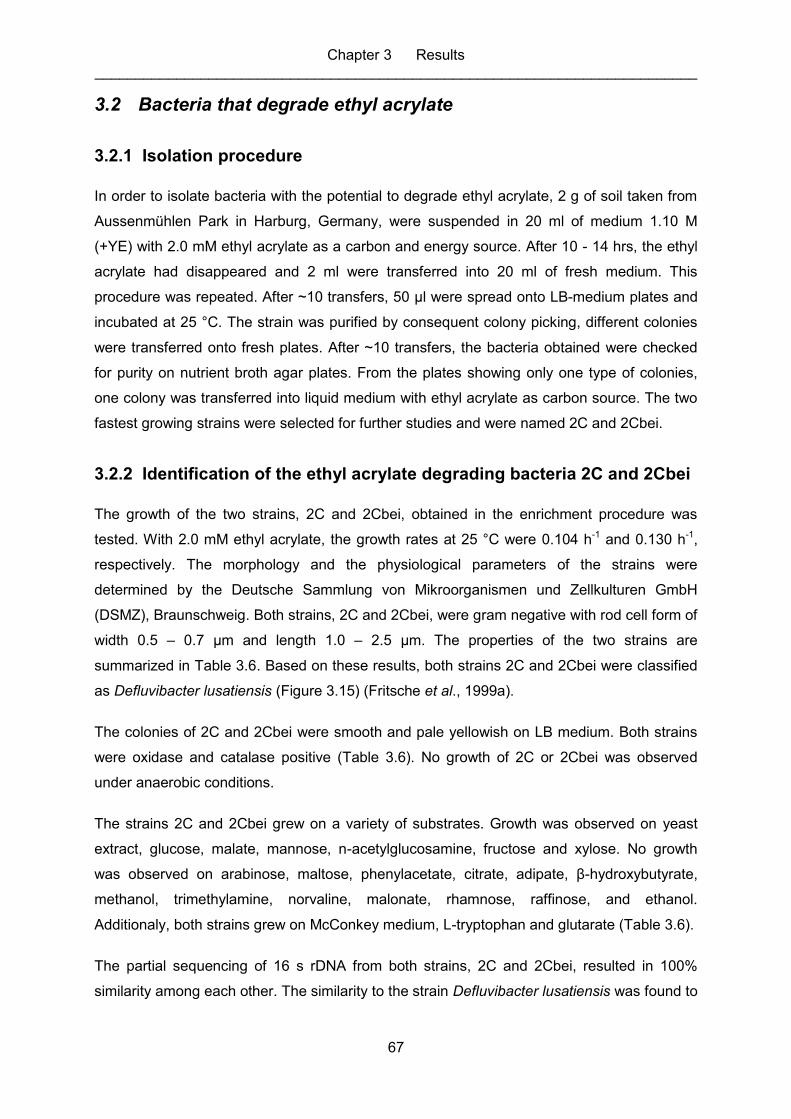
Chapter 3 Results __________________________________________________________________________
67
3.2 Bacteria that degrade ethyl acrylate
3.2.1 Isolation procedure
In order to isolate bacteria with the potential to degrade ethyl acrylate, 2 g of soil taken from
Aussenmühlen Park in Harburg, Germany, were suspended in 20 ml of medium 1.10 M
(+YE) with 2.0 mM ethyl acrylate as a carbon and energy source. After 10 - 14 hrs, the ethyl
acrylate had disappeared and 2 ml were transferred into 20 ml of fresh medium. This
procedure was repeated. After ~10 transfers, 50 μl were spread onto LB-medium plates and
incubated at 25 °C. The strain was purified by consequent colony picking, different colonies
were transferred onto fresh plates. After ~10 transfers, the bacteria obtained were checked
for purity on nutrient broth agar plates. From the plates showing only one type of colonies,
one colony was transferred into liquid medium with ethyl acrylate as carbon source. The two
fastest growing strains were selected for further studies and were named 2C and 2Cbei.
3.2.2 Identification of the ethyl acrylate degrading bacteria 2C and 2Cbei
The growth of the two strains, 2C and 2Cbei, obtained in the enrichment procedure was
tested. With 2.0 mM ethyl acrylate, the growth rates at 25 °C were 0.104 h-1 and 0.130 h-1,
respectively. The morphology and the physiological parameters of the strains were
determined by the Deutsche Sammlung von Mikroorganismen und Zellkulturen GmbH
(DSMZ), Braunschweig. Both strains, 2C and 2Cbei, were gram negative with rod cell form of
width 0.5 – 0.7 µm and length 1.0 – 2.5 µm. The properties of the two strains are
summarized in Table 3.6. Based on these results, both strains 2C and 2Cbei were classified
as Defluvibacter lusatiensis (Figure 3.15) (Fritsche et al., 1999a).
The colonies of 2C and 2Cbei were smooth and pale yellowish on LB medium. Both strains
were oxidase and catalase positive (Table 3.6). No growth of 2C or 2Cbei was observed
under anaerobic conditions.
The strains 2C and 2Cbei grew on a variety of substrates. Growth was observed on yeast
extract, glucose, malate, mannose, n-acetylglucosamine, fructose and xylose. No growth
was observed on arabinose, maltose, phenylacetate, citrate, adipate, β-hydroxybutyrate,
methanol, trimethylamine, norvaline, malonate, rhamnose, raffinose, and ethanol.
Additionaly, both strains grew on McConkey medium, L-tryptophan and glutarate (Table 3.6).
The partial sequencing of 16 s rDNA from both strains, 2C and 2Cbei, resulted in 100%
similarity among each other. The similarity to the strain Defluvibacter lusatiensis was found to
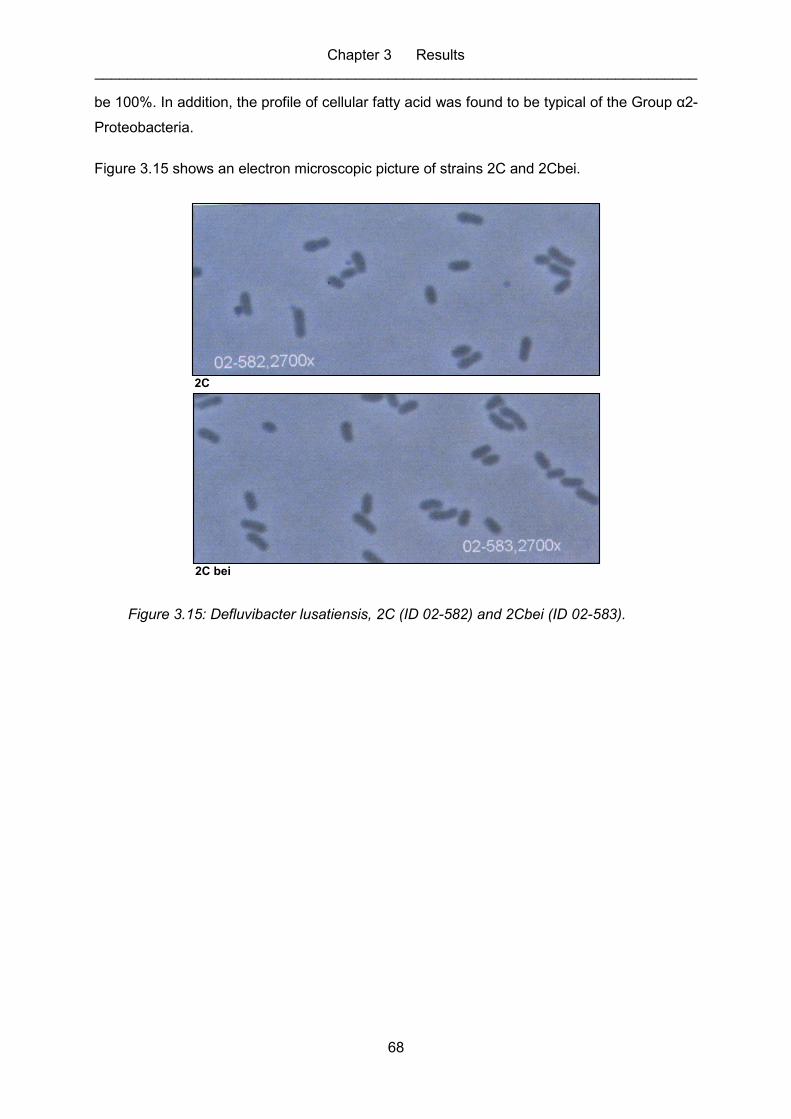
Chapter 3 Results __________________________________________________________________________
68
be 100%. In addition, the profile of cellular fatty acid was found to be typical of the Group α2-
Proteobacteria.
Figure 3.15 shows an electron microscopic picture of strains 2C and 2Cbei.
2C
2C bei
Figure 3.15: Defluvibacter lusatiensis, 2C (ID 02-582) and 2Cbei (ID 02-583).
Chapter 3 Results __________________________________________________________________________
69
Table 3.6: Morphological and physiological properties of Defluvibacter
lusatiensis, 2C and 2Cbei.
Properties of the strain Defluvibacter lusatiensis, 2C Defluvibacter lusatiensis, 2Cbei
Shape of cells: Rods Rods
width μm: 0.5 – 0.7 0.5 – 0.7
length µm: 1.0 – 2.5 1.0 – 2.5
Gram reaction - -
Lysis by 3% KOH + +
Aminopeptidase (Cerny) + +
Oxidase + +
Catalase + +
ADH - -
Urease - -
Nitrate reduction - -
Hydrolysis of gelatine - -
Hydrolysis of Esculin - -
Hydrolysis of Tween 80 - -
Hydrolysis of DNA - -
Hydrolysis of Starch - -
Indol reaction - -
Utilization of:
glucose + +
arabinose - -
maltose - -
malate + +
mannose + +
phenylacetate - -
citrate - -
adipate - -
n-acetylglucosamine + +
β-hydroxybutyrate - -
methanol - -
trimethylamine - -
norvaline - -
malonate - -
L-tryptophan w w
Glutarate w w
Acid from:
glucose + +
fructose + +
xylose + +
rhamnose - -
arabinose - -
raffinose - -
ethanol - -
Growth on McConkey w W
+ : growth - : no growth w : little growth
Chapter 3 Results __________________________________________________________________________
70
3.2.3 Determination of growth characteristics of Defluvibacter
lusatiensis 2C and 2Cbei
The two bacterial strains 2C and 2Cbei were cultivated and enriched at room temperature in
a shaking culture containing mineral medium 1.10 M (+YE) supplemented with 2.0 mM ethyl
acrylate as a carbon and energy source. No addition of vitamins was essential for the growth.
The effect of yeast extract on the growth of both 2C and 2Cbei and on their degradability of
2.0 mM ethyl acrylate was studied separately. It was found that the strain 2C was faster in
the degradation of 2.0 mM ethyl acrylate in the presence of 0.1% yeast extract. A complete
degradation of the substrate was measured after 14 hours; while 21 hours were needed in
the absence of 0.1% yeast extract (Figure 3.16). In addition, the growth of 2C on a mineral
medium containing 0.1% yeast extract was higher than the growth of 2C on a mineral
medium containing 0.1% yeast extract and 2.0 mM ethyl acrylate (1.10 M (+YE)). Strain 2C
was found to grow slowest on a mineral medium containing 2.0 mM ethyl acrylate without
0.1% yeast extract (1.10 M (-YE)) (Figure 3.16).
While strain 2C was found to be highly affected by the presence of 0.1% yeast extract
(Figure 3.16), strain 2Cbei was almost not affected (Figure 3.20). The same time of 10 to 11
hours was needed by 2Cbei for the degradation of 2.0 mM ethyl acrylate both in presence
and absence of 0.1% yeast extract (Figure 3.20). Also, the growth of 2Cbei was not
noticeably affected by the presence of 0.1% yeast extract. A similar pattern of growth was
observed as shown in Figure 3.20.
By comparing the two strains 2C and 2Cbei (Figure 3.16 and Figure 3.20), it is obvious that
strain 2Cbei was faster in degrading 2.0 mM ethyl acrylate. 2Cbei required 10 to 11 hours
both in presence and absence of 0.1% yeast extract; whereas 2C required 14 hours in the
presence of 0.1% yeast extract and 21 hours in the absence of 0.1% yeast extract. The
growth rate of strain 2C was calculated to be 0.160 h-1 in the fermenter.
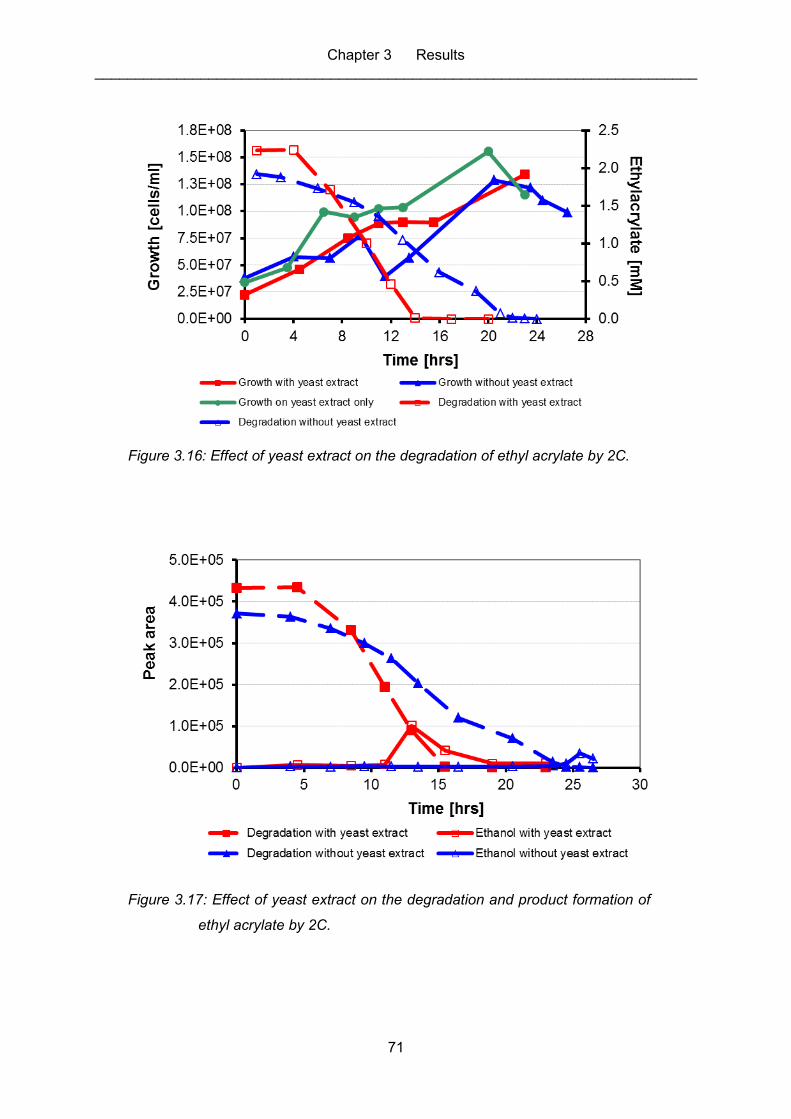
Chapter 3 Results __________________________________________________________________________
71
Figure 3.16: Effect of yeast extract on the degradation of ethyl acrylate by 2C.
Figure 3.17: Effect of yeast extract on the degradation and product formation of
ethyl acrylate by 2C.
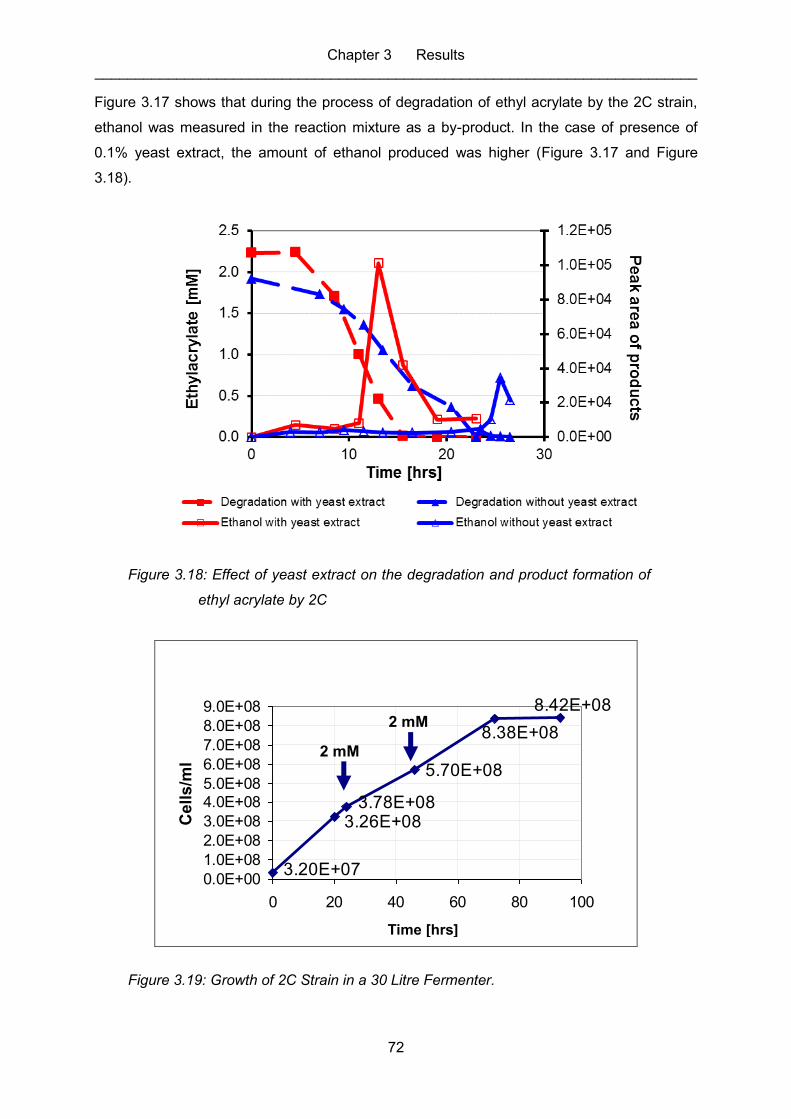
Chapter 3 Results __________________________________________________________________________
72
Figure 3.17 shows that during the process of degradation of ethyl acrylate by the 2C strain,
ethanol was measured in the reaction mixture as a by-product. In the case of presence of
0.1% yeast extract, the amount of ethanol produced was higher (Figure 3.17 and Figure
3.18).
Figure 3.18: Effect of yeast extract on the degradation and product formation of
ethyl acrylate by 2C
Growth of 2C Strain in Fermenter
5.70E+08
3.20E+07
3.26E+083.78E+08
8.42E+08
8.38E+08
0.0E+00
1.0E+08
2.0E+08
3.0E+08
4.0E+08
5.0E+08
6.0E+08
7.0E+08
8.0E+08
9.0E+08
0 20 40 60 80 100
Time (hrs)
Cell
s/m
l
2 mM
2 mM
Figure 3.19: Growth of 2C Strain in a 30 Litre Fermenter.
Time [hrs]
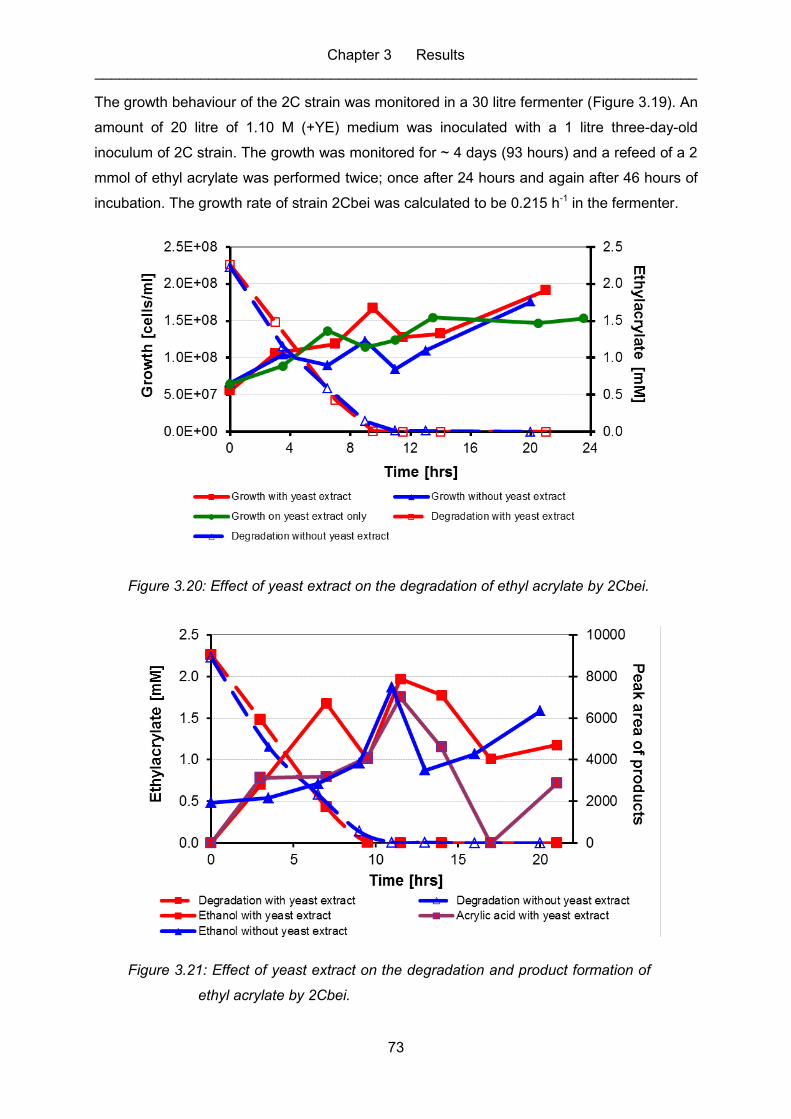
Chapter 3 Results __________________________________________________________________________
73
The growth behaviour of the 2C strain was monitored in a 30 litre fermenter (Figure 3.19). An
amount of 20 litre of 1.10 M (+YE) medium was inoculated with a 1 litre three-day-old
inoculum of 2C strain. The growth was monitored for ~ 4 days (93 hours) and a refeed of a 2
mmol of ethyl acrylate was performed twice; once after 24 hours and again after 46 hours of
incubation. The growth rate of strain 2Cbei was calculated to be 0.215 h-1 in the fermenter.
Figure 3.20: Effect of yeast extract on the degradation of ethyl acrylate by 2Cbei.
Figure 3.21: Effect of yeast extract on the degradation and product formation of
ethyl acrylate by 2Cbei.
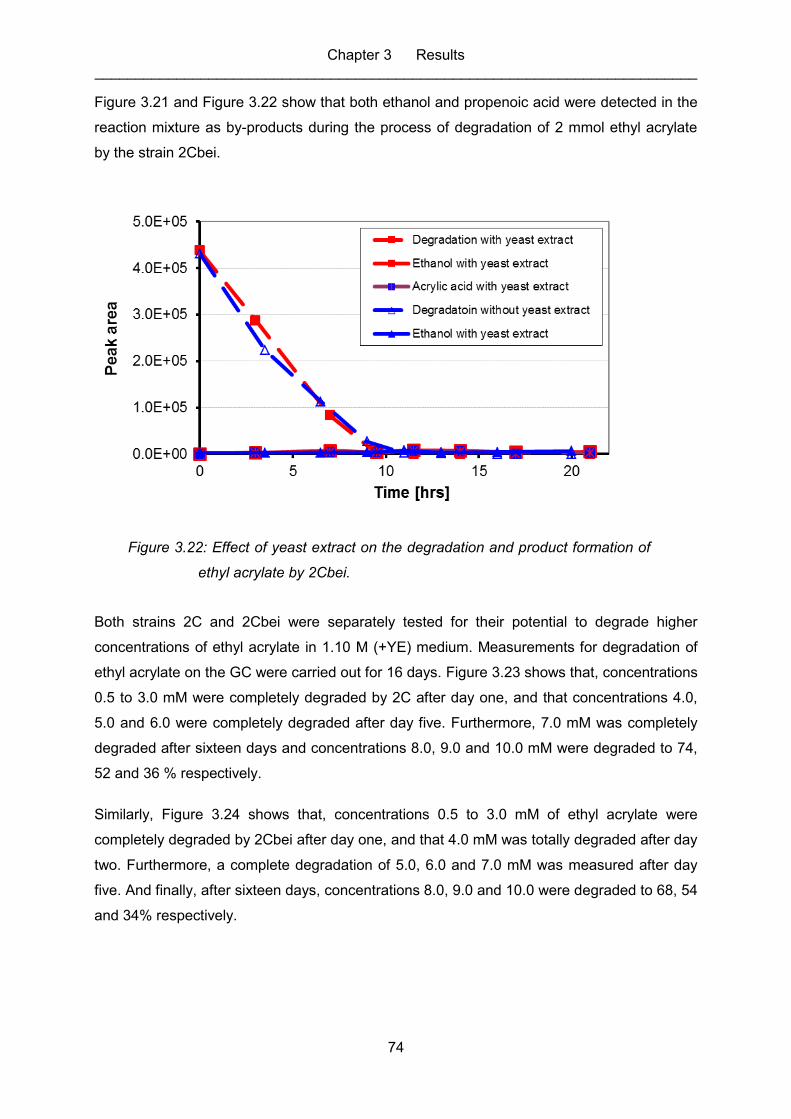
Chapter 3 Results __________________________________________________________________________
74
Figure 3.21 and Figure 3.22 show that both ethanol and propenoic acid were detected in the
reaction mixture as by-products during the process of degradation of 2 mmol ethyl acrylate
by the strain 2Cbei.
Figure 3.22: Effect of yeast extract on the degradation and product formation of
ethyl acrylate by 2Cbei.
Both strains 2C and 2Cbei were separately tested for their potential to degrade higher
concentrations of ethyl acrylate in 1.10 M (+YE) medium. Measurements for degradation of
ethyl acrylate on the GC were carried out for 16 days. Figure 3.23 shows that, concentrations
0.5 to 3.0 mM were completely degraded by 2C after day one, and that concentrations 4.0,
5.0 and 6.0 were completely degraded after day five. Furthermore, 7.0 mM was completely
degraded after sixteen days and concentrations 8.0, 9.0 and 10.0 mM were degraded to 74,
52 and 36 % respectively.
Similarly, Figure 3.24 shows that, concentrations 0.5 to 3.0 mM of ethyl acrylate were
completely degraded by 2Cbei after day one, and that 4.0 mM was totally degraded after day
two. Furthermore, a complete degradation of 5.0, 6.0 and 7.0 mM was measured after day
five. And finally, after sixteen days, concentrations 8.0, 9.0 and 10.0 were degraded to 68, 54
and 34% respectively.
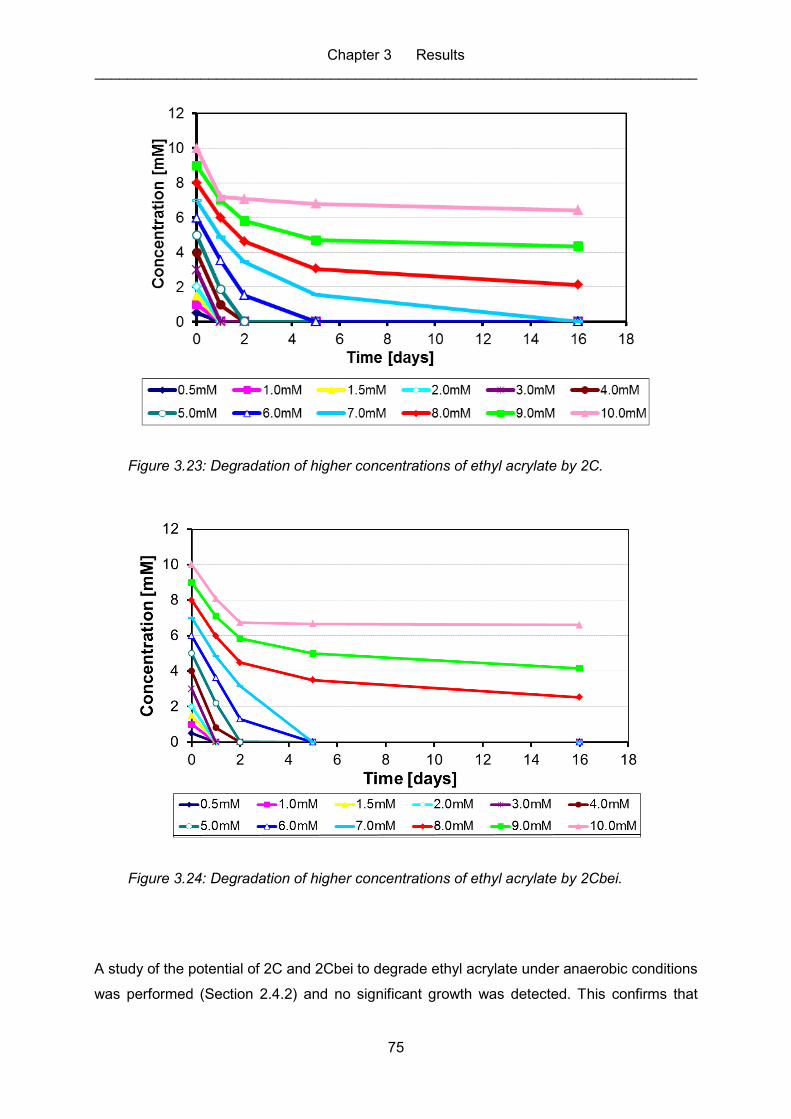
Chapter 3 Results __________________________________________________________________________
75
Figure 3.23: Degradation of higher concentrations of ethyl acrylate by 2C.
Figure 3.24: Degradation of higher concentrations of ethyl acrylate by 2Cbei.
A study of the potential of 2C and 2Cbei to degrade ethyl acrylate under anaerobic conditions
was performed (Section 2.4.2) and no significant growth was detected. This confirms that
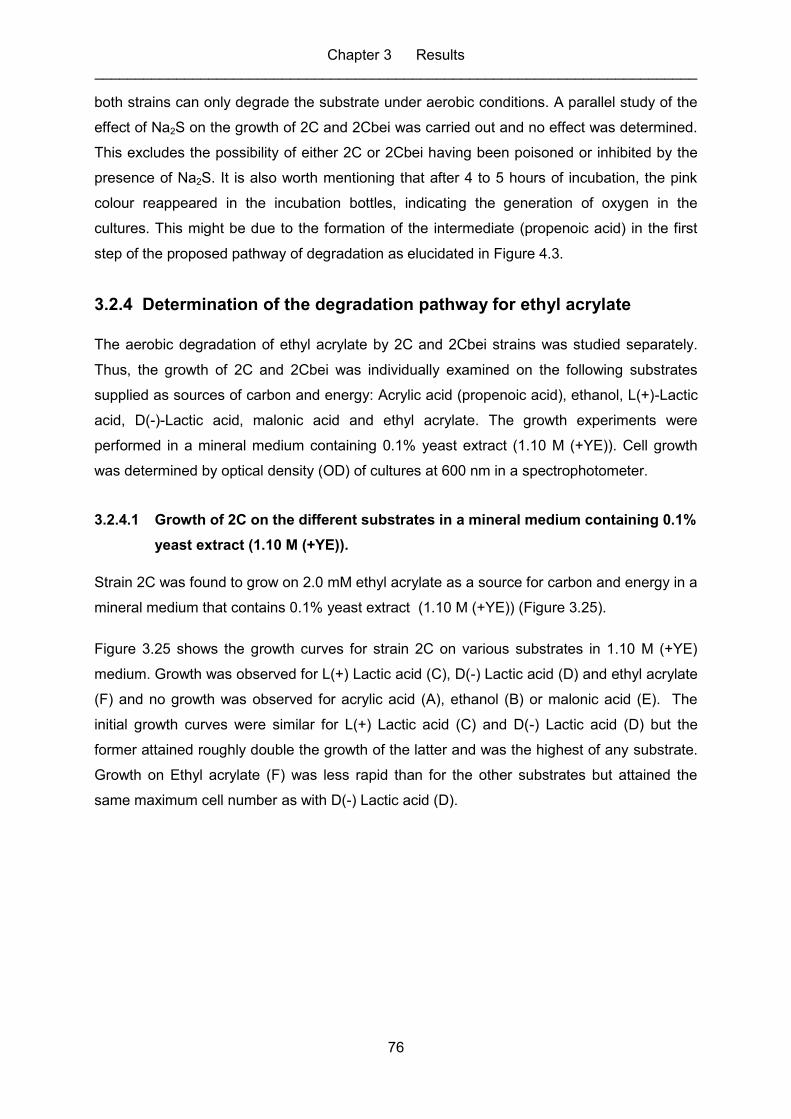
Chapter 3 Results __________________________________________________________________________
76
both strains can only degrade the substrate under aerobic conditions. A parallel study of the
effect of Na2S on the growth of 2C and 2Cbei was carried out and no effect was determined.
This excludes the possibility of either 2C or 2Cbei having been poisoned or inhibited by the
presence of Na2S. It is also worth mentioning that after 4 to 5 hours of incubation, the pink
colour reappeared in the incubation bottles, indicating the generation of oxygen in the
cultures. This might be due to the formation of the intermediate (propenoic acid) in the first
step of the proposed pathway of degradation as elucidated in Figure 4.3.
3.2.4 Determination of the degradation pathway for ethyl acrylate
The aerobic degradation of ethyl acrylate by 2C and 2Cbei strains was studied separately.
Thus, the growth of 2C and 2Cbei was individually examined on the following substrates
supplied as sources of carbon and energy: Acrylic acid (propenoic acid), ethanol, L(+)-Lactic
acid, D(-)-Lactic acid, malonic acid and ethyl acrylate. The growth experiments were
performed in a mineral medium containing 0.1% yeast extract (1.10 M (+YE)). Cell growth
was determined by optical density (OD) of cultures at 600 nm in a spectrophotometer.
3.2.4.1 Growth of 2C on the different substrates in a mineral medium containing 0.1%
yeast extract (1.10 M (+YE)).
Strain 2C was found to grow on 2.0 mM ethyl acrylate as a source for carbon and energy in a
mineral medium that contains 0.1% yeast extract (1.10 M (+YE)) (Figure 3.25).
Figure 3.25 shows the growth curves for strain 2C on various substrates in 1.10 M (+YE)
medium. Growth was observed for L(+) Lactic acid (C), D(-) Lactic acid (D) and ethyl acrylate
(F) and no growth was observed for acrylic acid (A), ethanol (B) or malonic acid (E). The
initial growth curves were similar for L(+) Lactic acid (C) and D(-) Lactic acid (D) but the
former attained roughly double the growth of the latter and was the highest of any substrate.
Growth on Ethyl acrylate (F) was less rapid than for the other substrates but attained the
same maximum cell number as with D(-) Lactic acid (D).
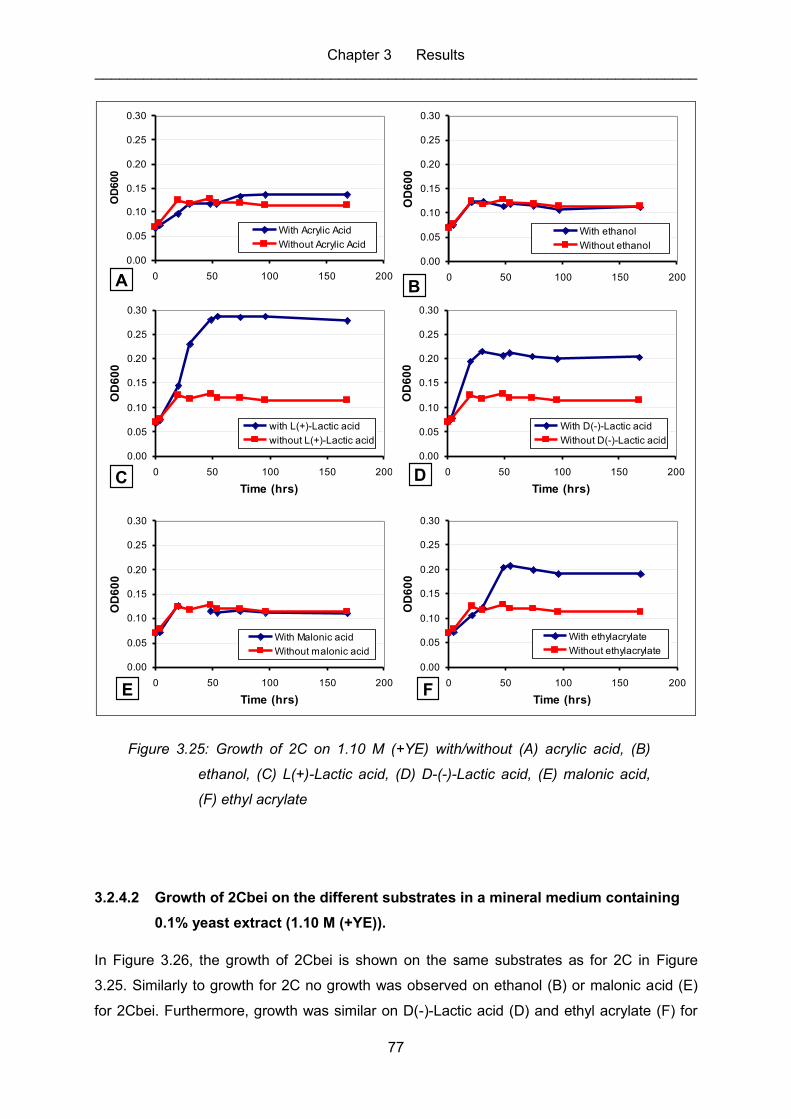
Chapter 3 Results __________________________________________________________________________
77
0.00
0.05
0.10
0.15
0.20
0.25
0.30
0 50 100 150 200
Time (hrs)
OD
600
With Acrylic Acid
Without Acrylic Acid
0.00
0.05
0.10
0.15
0.20
0.25
0.30
0 50 100 150 200
Time (hrs)
OD
60
0
With ethanol
Without ethanol
0.00
0.05
0.10
0.15
0.20
0.25
0.30
0 50 100 150 200
Time (hrs)
OD
60
0
with L(+)-Lactic acid
without L(+)-Lactic acid
0.00
0.05
0.10
0.15
0.20
0.25
0.30
0 50 100 150 200
Time (hrs)
OD
60
0
With D(-)-Lactic acid
Without D(-)-Lactic acid
0.00
0.05
0.10
0.15
0.20
0.25
0.30
0 50 100 150 200
Time (hrs)
OD
60
0
With Malonic acid
Without malonic acid
0.00
0.05
0.10
0.15
0.20
0.25
0.30
0 50 100 150 200
Time (hrs)
OD
60
0
With ethylacrylate
Without ethylacrylate
A B
C D
E F
Figure 3.25: Growth of 2C on 1.10 M (+YE) with/without (A) acrylic acid, (B)
ethanol, (C) L(+)-Lactic acid, (D) D-(-)-Lactic acid, (E) malonic acid,
(F) ethyl acrylate
3.2.4.2 Growth of 2Cbei on the different substrates in a mineral medium containing
0.1% yeast extract (1.10 M (+YE)).
In Figure 3.26, the growth of 2Cbei is shown on the same substrates as for 2C in Figure
3.25. Similarly to growth for 2C no growth was observed on ethanol (B) or malonic acid (E)
for 2Cbei. Furthermore, growth was similar on D(-)-Lactic acid (D) and ethyl acrylate (F) for
Chapter 3 Results __________________________________________________________________________
78
2Cbei and 2C. However, some clear differences were observed: In contrast to 2C, for which
no growth was observed on acrylic acid, clear growth was observed for 2Cbei on this
substrate (A). Also, the growth of 2Cbei on L(+)-Lactic acid (Figure 3.26C) was more rapid
than that for 2C on the same substrate (Figure 3.25C) (~25 hours versus ~60 hours,
respectively) but a slightly lower growth was attained for 2Cbei, which then decreased, while
that for 2C maintained a maximum plateau.
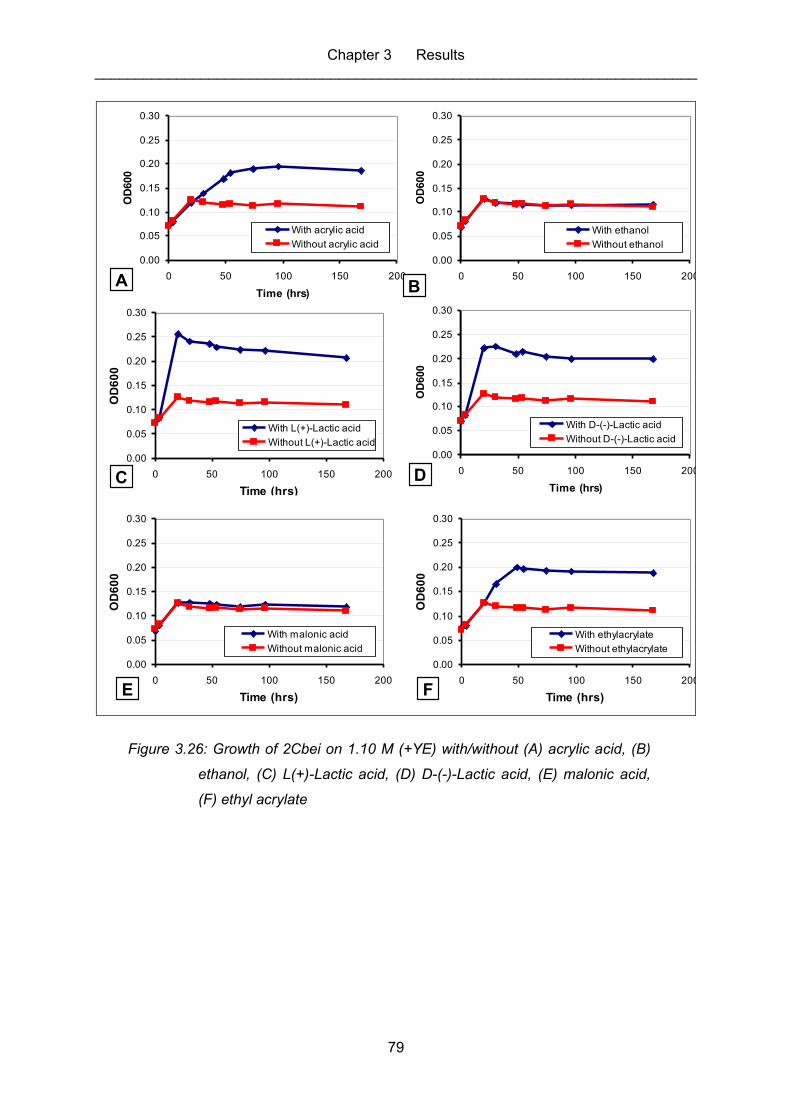
Chapter 3 Results __________________________________________________________________________
79
0.00
0.05
0.10
0.15
0.20
0.25
0.30
0 50 100 150 200
Time (hrs)
OD
60
0
With L(+)-Lactic acid
Without L(+)-Lactic acid
0.00
0.05
0.10
0.15
0.20
0.25
0.30
0 50 100 150 200
Time (hrs)
OD
600
With ethanol
Without ethanol
0.00
0.05
0.10
0.15
0.20
0.25
0.30
0 50 100 150 200
Time (hrs)
OD
600
With acrylic acid
Without acrylic acid
0.00
0.05
0.10
0.15
0.20
0.25
0.30
0 50 100 150 200
Time (hrs)
OD
600
With D-(-)-Lactic acid
Without D-(-)-Lactic acid
0.00
0.05
0.10
0.15
0.20
0.25
0.30
0 50 100 150 200
Time (hrs)
OD
60
0
With malonic acid
Without malonic acid
0.00
0.05
0.10
0.15
0.20
0.25
0.30
0 50 100 150 200
Time (hrs)
OD
60
0
With ethylacrylate
Without ethylacrylate
A B
C D
E F
Figure 3.26: Growth of 2Cbei on 1.10 M (+YE) with/without (A) acrylic acid, (B)
ethanol, (C) L(+)-Lactic acid, (D) D-(-)-Lactic acid, (E) malonic acid,
(F) ethyl acrylate
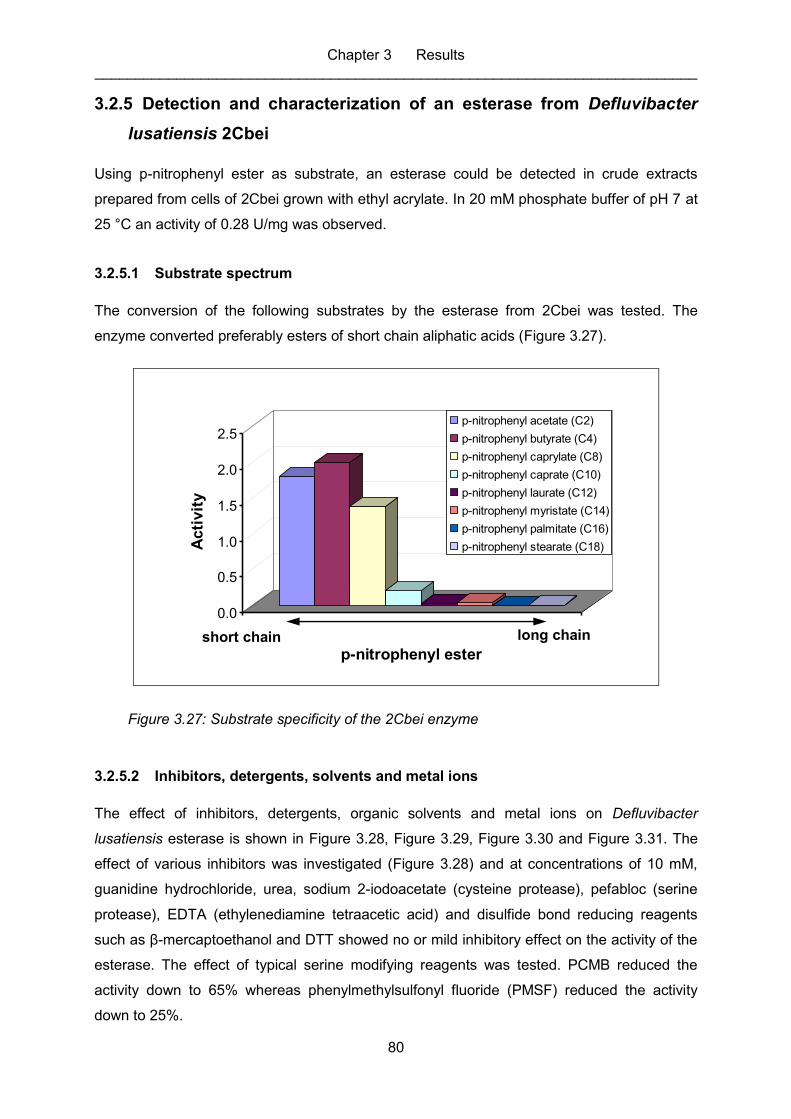
Chapter 3 Results __________________________________________________________________________
80
3.2.5 Detection and characterization of an esterase from Defluvibacter
lusatiensis 2Cbei
Using p-nitrophenyl ester as substrate, an esterase could be detected in crude extracts
prepared from cells of 2Cbei grown with ethyl acrylate. In 20 mM phosphate buffer of pH 7 at
25 °C an activity of 0.28 U/mg was observed.
3.2.5.1 Substrate spectrum
The conversion of the following substrates by the esterase from 2Cbei was tested. The
enzyme converted preferably esters of short chain aliphatic acids (Figure 3.27).
0.0
0.5
1.0
1.5
2.0
2.5
Acti
vit
y
Activity****
p-nitrophenyl ester
Substrate specificity of the 2cbei enzyme
p-nitrophenyl acetate (C2)
p-nitrophenyl butyrate (C4)
p-nitrophenyl caprylate (C8)
p-nitrophenyl caprate (C10)
p-nitrophenyl laurate (C12)
p-nitrophenyl myristate (C14)
p-nitrophenyl palmitate (C16)
p-nitrophenyl stearate (C18)
Figure 3.27: Substrate specificity of the 2Cbei enzyme
3.2.5.2 Inhibitors, detergents, solvents and metal ions
The effect of inhibitors, detergents, organic solvents and metal ions on Defluvibacter
lusatiensis esterase is shown in Figure 3.28, Figure 3.29, Figure 3.30 and Figure 3.31. The
effect of various inhibitors was investigated (Figure 3.28) and at concentrations of 10 mM,
guanidine hydrochloride, urea, sodium 2-iodoacetate (cysteine protease), pefabloc (serine
protease), EDTA (ethylenediamine tetraacetic acid) and disulfide bond reducing reagents
such as β-mercaptoethanol and DTT showed no or mild inhibitory effect on the activity of the
esterase. The effect of typical serine modifying reagents was tested. PCMB reduced the
activity down to 65% whereas phenylmethylsulfonyl fluoride (PMSF) reduced the activity
down to 25%.
short chain long chain
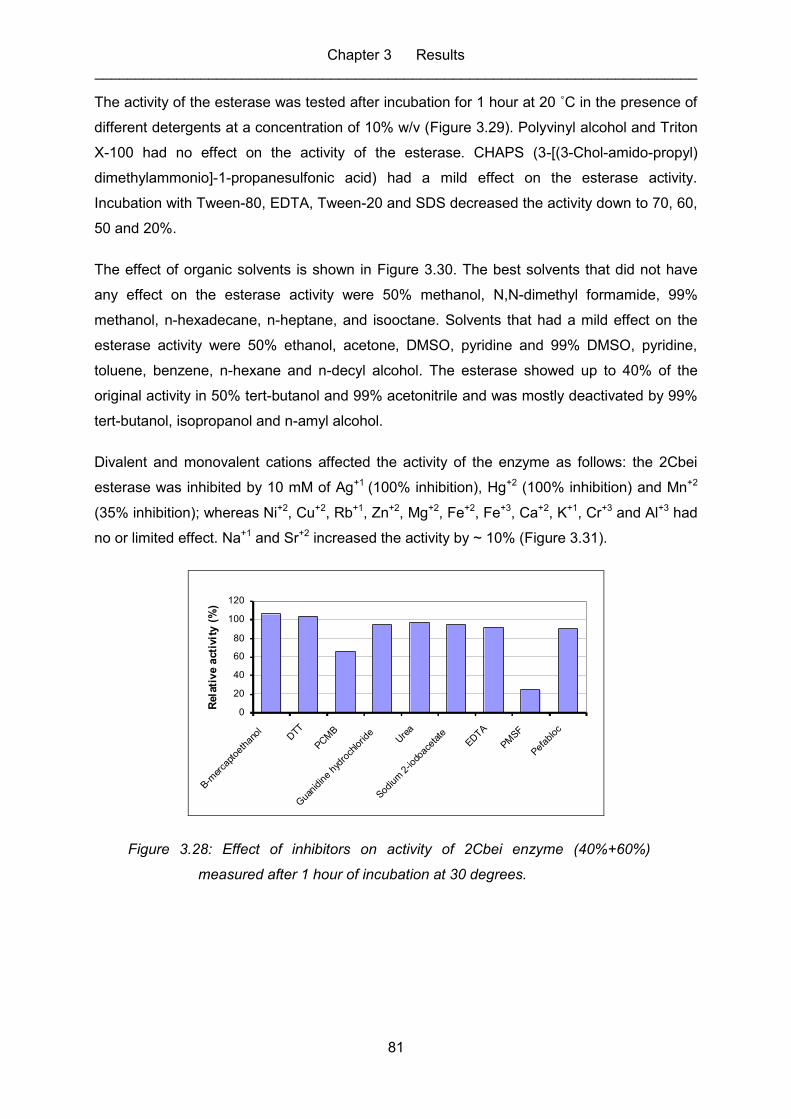
Chapter 3 Results __________________________________________________________________________
81
The activity of the esterase was tested after incubation for 1 hour at 20 ˚C in the presence of
different detergents at a concentration of 10% w/v (Figure 3.29). Polyvinyl alcohol and Triton
X-100 had no effect on the activity of the esterase. CHAPS (3-[(3-Chol-amido-propyl)
dimethylammonio]-1-propanesulfonic acid) had a mild effect on the esterase activity.
Incubation with Tween-80, EDTA, Tween-20 and SDS decreased the activity down to 70, 60,
50 and 20%.
The effect of organic solvents is shown in Figure 3.30. The best solvents that did not have
any effect on the esterase activity were 50% methanol, N,N-dimethyl formamide, 99%
methanol, n-hexadecane, n-heptane, and isooctane. Solvents that had a mild effect on the
esterase activity were 50% ethanol, acetone, DMSO, pyridine and 99% DMSO, pyridine,
toluene, benzene, n-hexane and n-decyl alcohol. The esterase showed up to 40% of the
original activity in 50% tert-butanol and 99% acetonitrile and was mostly deactivated by 99%
tert-butanol, isopropanol and n-amyl alcohol.
Divalent and monovalent cations affected the activity of the enzyme as follows: the 2Cbei
esterase was inhibited by 10 mM of Ag+1 (100% inhibition), Hg+2 (100% inhibition) and Mn+2
(35% inhibition); whereas Ni+2, Cu+2, Rb+1, Zn+2, Mg+2, Fe+2, Fe+3, Ca+2, K+1, Cr+3 and Al+3 had
no or limited effect. Na+1 and Sr+2 increased the activity by ~ 10% (Figure 3.31).
0
20
40
60
80
100
120
B-mer
captoe
than
ol DTT
PCM
B
Gua
nidine
hyd
roch
lorid
eUre
a
Sodium
2-io
doac
etate
EDTA
PMSF
Pefab
loc
Rela
tiv
e a
cti
vit
y (
%)
Figure 3.28: Effect of inhibitors on activity of 2Cbei enzyme (40%+60%)
measured after 1 hour of incubation at 30 degrees.
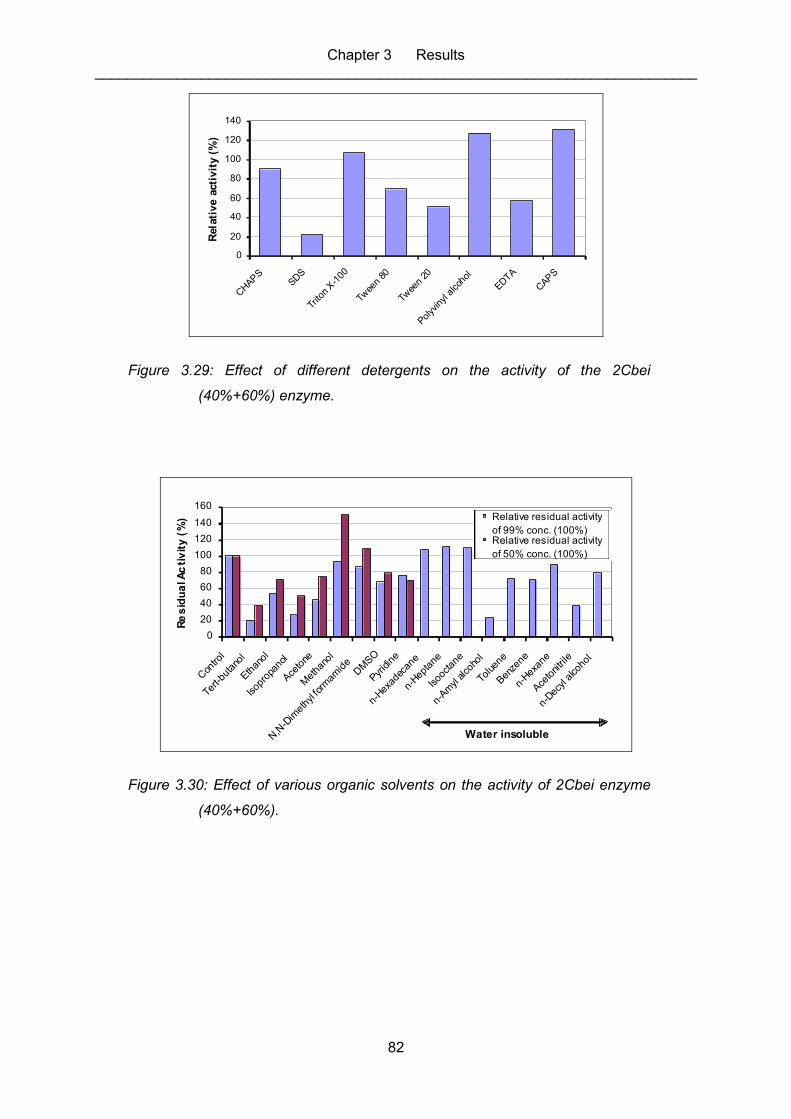
Chapter 3 Results __________________________________________________________________________
82
0
20
40
60
80
100
120
140
CHAP
SSD
S
Trito
n X-1
00
Twee
n 80
Twee
n 20
Polyv
inyl a
lcoh
ol
EDTA
CAP
S
Rela
tiv
e a
cti
vit
y (
%)
Figure 3.29: Effect of different detergents on the activity of the 2Cbei
(40%+60%) enzyme.
0
20
40
60
80
100
120
140
160
Con
trol
Tert-
buta
nol
Ethan
ol
Isop
ropa
nol
Aceto
ne
Met
hano
l
N,N
-Dim
ethy
l for
mam
ide
DM
SO
Pyridin
e
n-Hex
adec
ane
n-Hep
tane
Isoo
ctan
e
n-Am
yl alco
hol
Toluen
e
Benze
ne
n-Hex
ane
Aceto
nitri
le
n-Dec
yl a
lcoho
l
Re
sid
ua
l Ac
tiv
ity
(%
) Relative residual activity
of 99% conc. (100%)Relative residual activity
of 50% conc. (100%)
Water insoluble
Figure 3.30: Effect of various organic solvents on the activity of 2Cbei enzyme
(40%+60%).
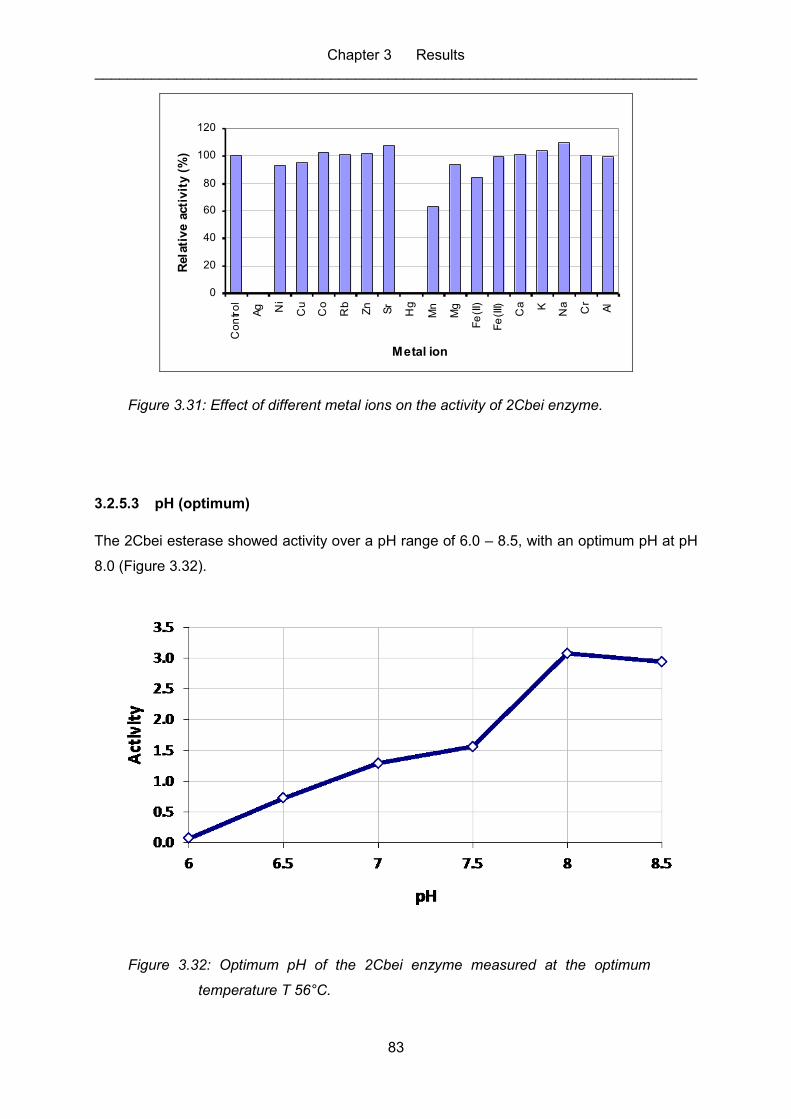
Chapter 3 Results __________________________________________________________________________
83
0
20
40
60
80
100
120
Co
ntr
ol
Ag N
i
Cu
Co
Rb
Zn
Sr
Hg
Mn
Mg
Fe
(II)
Fe
(III)
Ca K
Na
Cr
Al
Metal ion
Rela
tiv
e a
cti
vit
y (
%)
Figure 3.31: Effect of different metal ions on the activity of 2Cbei enzyme.
3.2.5.3 pH (optimum)
The 2Cbei esterase showed activity over a pH range of 6.0 – 8.5, with an optimum pH at pH
8.0 (Figure 3.32).
Figure 3.32: Optimum pH of the 2Cbei enzyme measured at the optimum
temperature T 56°C.
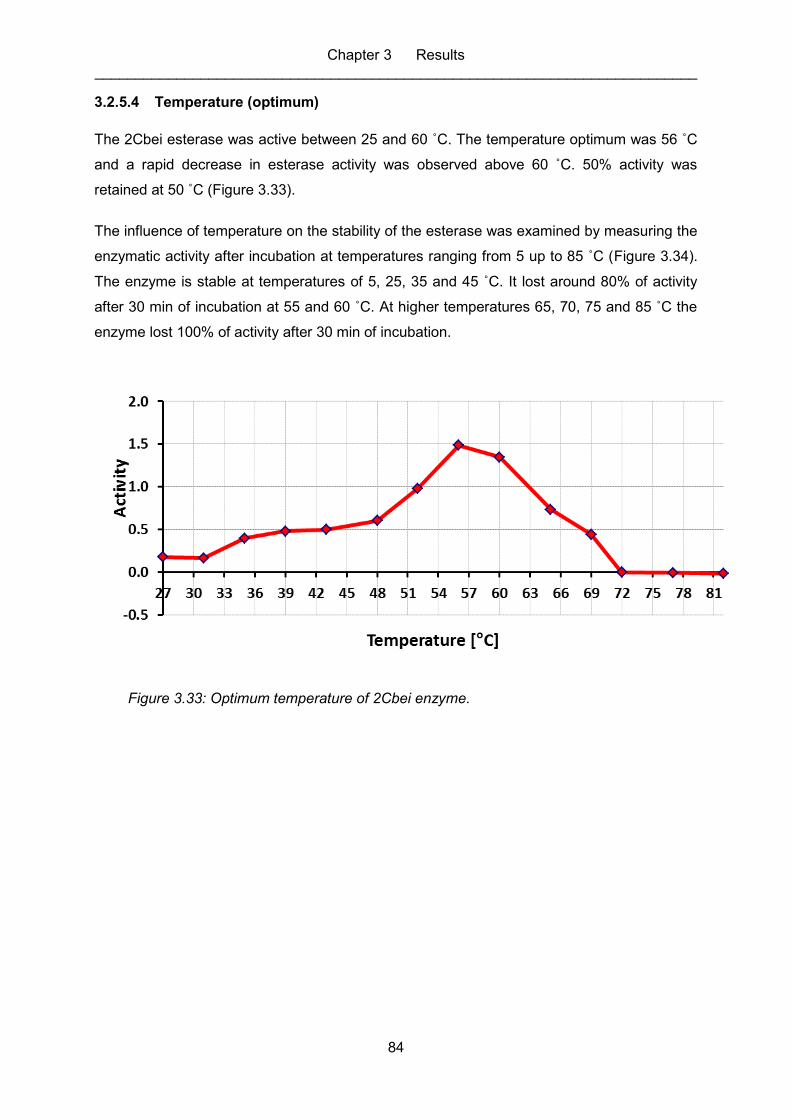
Chapter 3 Results __________________________________________________________________________
84
3.2.5.4 Temperature (optimum)
The 2Cbei esterase was active between 25 and 60 ˚C. The temperature optimum was 56 ˚C
and a rapid decrease in esterase activity was observed above 60 ˚C. 50% activity was
retained at 50 ˚C (Figure 3.33).
The influence of temperature on the stability of the esterase was examined by measuring the
enzymatic activity after incubation at temperatures ranging from 5 up to 85 ˚C (Figure 3.34).
The enzyme is stable at temperatures of 5, 25, 35 and 45 ˚C. It lost around 80% of activity
after 30 min of incubation at 55 and 60 ˚C. At higher temperatures 65, 70, 75 and 85 ˚C the
enzyme lost 100% of activity after 30 min of incubation.
Figure 3.33: Optimum temperature of 2Cbei enzyme.
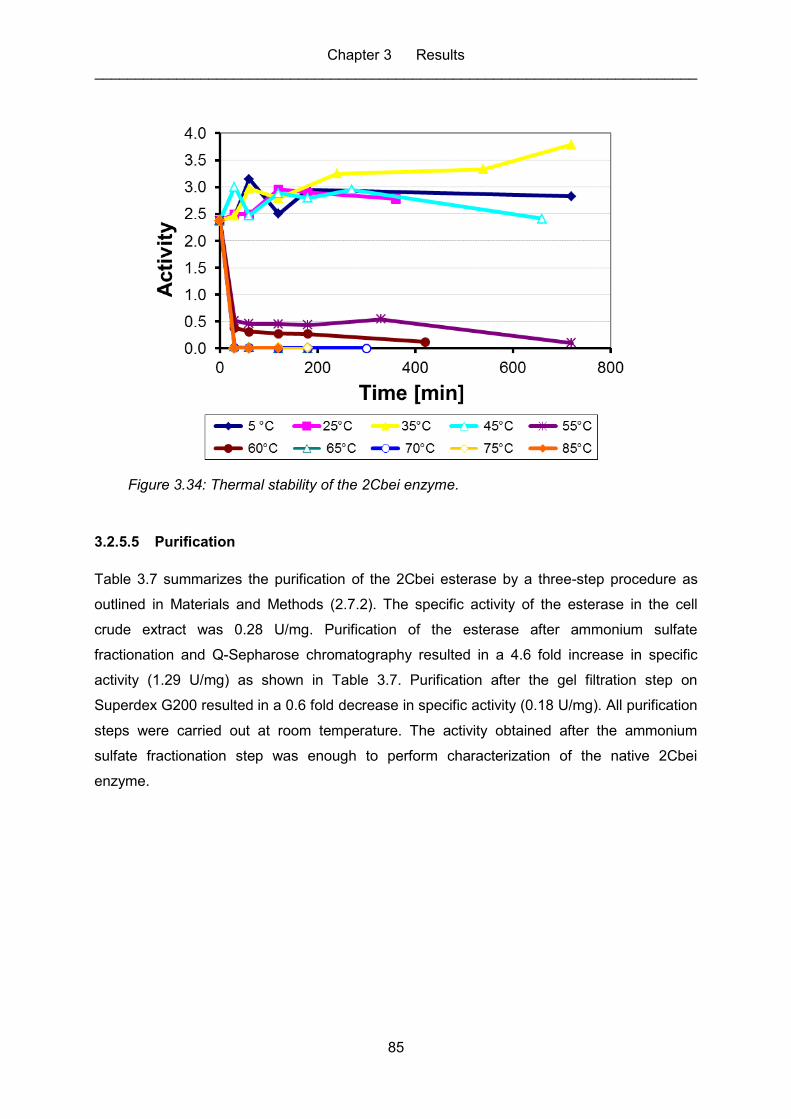
Chapter 3 Results __________________________________________________________________________
85
Figure 3.34: Thermal stability of the 2Cbei enzyme.
3.2.5.5 Purification
Table 3.7 summarizes the purification of the 2Cbei esterase by a three-step procedure as
outlined in Materials and Methods (2.7.2). The specific activity of the esterase in the cell
crude extract was 0.28 U/mg. Purification of the esterase after ammonium sulfate
fractionation and Q-Sepharose chromatography resulted in a 4.6 fold increase in specific
activity (1.29 U/mg) as shown in Table 3.7. Purification after the gel filtration step on
Superdex G200 resulted in a 0.6 fold decrease in specific activity (0.18 U/mg). All purification
steps were carried out at room temperature. The activity obtained after the ammonium
sulfate fractionation step was enough to perform characterization of the native 2Cbei
enzyme.
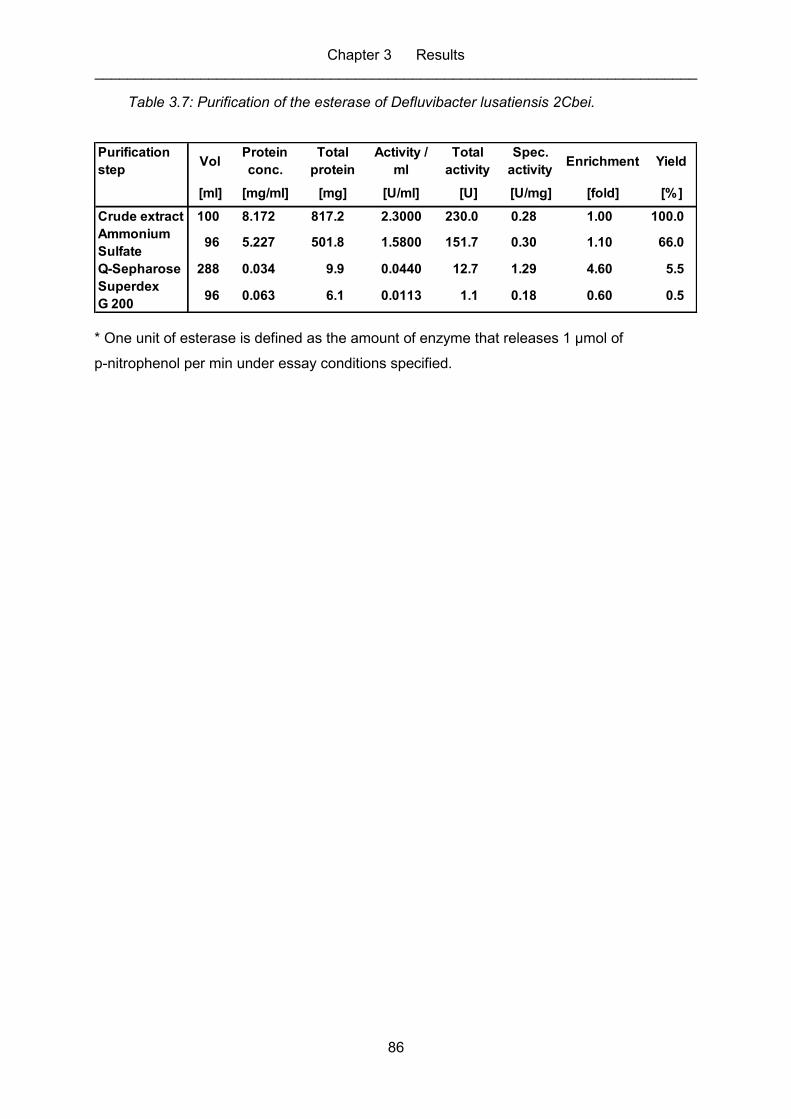
Chapter 3 Results __________________________________________________________________________
86
Table 3.7: Purification of the esterase of Defluvibacter lusatiensis 2Cbei.
Purification
stepVol
Protein
conc.
Total
protein
Activity /
ml
Total
activity
Spec.
activityEnrichment Yield
[ml] [mg/ml] [mg] [U/ml] [U] [U/mg] [fold] [%]
Crude extract 100 8.172 817.2 2.3000 230.0 0.28 1.00 100.0
Ammonium
Sulfate96 5.227 501.8 1.5800 151.7 0.30 1.10 66.0
Q-Sepharose 288 0.034 9.9 0.0440 12.7 1.29 4.60 5.5
Superdex
G 20096 0.063 6.1 0.0113 1.1 0.18 0.60 0.5
* One unit of esterase is defined as the amount of enzyme that releases 1 μmol of
p-nitrophenol per min under essay conditions specified.
87
Chapter 4
DISCUSSION
_________________________________ The aim of this study was to isolate bacteria that have the potential to degrade triethylamine
and ethyl acrylate. These two common industrial waste products are considered to be
extremely annoying due to their exceedingly bad odour. Numerous environmental samples
were collected from various sources for the screening process. A total of sixty one pure
strains were isolated and tested for their ability to degrade triethylamine, and forty were
isolated and tested for their ability to degrade ethyl acrylate. The two most effective strains
were chosen for each substrate: RA1 and RA2 for triethylamine; 2C and 2Cbei for ethyl
acrylate. All four strains were found to completely degrade the target compounds and are
ready to be used in industrial purification processes. Furthermore, the mechanisms of
degradation followed by these strains were determined.
4.1 Bacteria that degrade triethylamine
4.1.1 Isolation, characterization and identification of new triethylamine
degrading bacteria, RA1 and RA2
The process of screening for bacteria that have the potential to degrade triethylamine was
not very successful at first. Numerous samples were collected from different sources and
locations that were expected to be contaminated with the target compound. After many
attempts and much tedious work, several strains were isolated and tested for their
degradation potential. The two best strains were selected for further studies and
characterization: RA1 was isolated from a scrubber sample “Wäscher” taken from the fish-
meal producing company See Löwe in Cuxhaven, Germany, and the strain RA2 was isolated
from the same company but from a bio-scrubber “Biowäscher” sample. The company See
Löwe was chosen due to the fact that fish odour contains some amine compounds,
especially trimethylamine, as measured by Ranau and Steinhart (2004). It is also worth
Chapter 4 Discussion __________________________________________________________________________
88
mentioning that various samples taken from the bio-filter of the same company were
successful, but to a lesser extent than those taken from the scrubber and bio-scrubber.
The characterization and identification of the strains were performed by DSMZ using the cell
morphology, cell wall fatty acids analysis and 16S rDNA sequence. Strain RA1 was identified
as Pseudomonas citronellolis and strain RA2 as Mycobacterium diernhoferi.
4.1.1.1 The species, Pseudomonas citronellolis, desription:
The new species of the genus Pseudomonas was first isolated from soil collected under pine
trees in Northern Virginia. The isolation was carried out by the use of the enrichment culture
technique with citronellol as the sole carbon source. After the morphological and nutritional
characteristics of the organism were described, the name Pseudomonas citronellolis n. sp.
was proposed. The bacterium was characterized as citronellol- and farnesol-oxidizing and
after cultures were aerated with sterile air at 30 °C, the odour of citronellol had disappeared
completely within 3 to 4 days (Seubert, 1959). This measured time is comparable to the 4
days needed by the isolated strain RA1 in order for it to completely degrade triethylamine
which was also used as the sole carbon and energy source during the enrichment process
followed in this study. Furthermore, it was stated that harvesting at an earlier stage usually
resulted in inactivation of the cells caused by toxicity of the excess citronellol concentrated
with the cells during centrifugation (Seubert, 1959); a case that was not comparable to RA1,
where no signs of toxicity were to be detected.
Pseudomonas citronellolis is a gram-negative bacterium that is used to study the
mechanisms of pyruvate carboxylase (Seubert and Remberger, 1961). The organism,
measuring 0.5 by 1.0 to 1.5 μm, is rod-shaped, which usually occurs singly but occasionally
in pairs. It possesses a single polar flagellum. Surface colonies observed on the basal
medium containing 2 per cent agar are transparent, pin-point, raised circular colonies with
slightly wrinkled margins (Seubert, 1959). All this morphological description of the organism
may also be related to that of the isolated strain RA1.
Based on 16S rRNA analysis, Pseudomonas citronellolis has been placed in the
Pseudomonas aeruginosa group (Anzai et al., 2000). It has also been found capable of the
biosynthesis of polyhydroxyal-kanoates from “linear mono- and dicarboxylic acids”, a type of
bacteria-synthesized polyester (Choi and Yoon, 1994).
Growth of the organism was found to occur anaerobically only in the presence of nitrate. It
was measured to be vigorous over the range of 25 to 37 °C, with optimal growth at 31 °C
(Seubert, 1959). For the isolated strain RA1 there was no anaerobic growth detected.
Chapter 4 Discussion __________________________________________________________________________
89
It is important to note that, excepting RA1, none of the strains described so far was shown to
degrade triethylamine.
4.1.1.2 The species, Mycobacterium diernhoferi, description:
Mycobacterium diernhoferi (diern ho´ fer i. of Diernhof, who originally isolated the organisms)
(Tsukamura et al., 1983). The name Mycobacterium diernhoferi has been revived for the
organism originally described by Bönicke and Juhasz in 1965 (Bönicke and Juhasz, 1965). In
previous articles it was already noted that in the vicinity of humans and animals there are
bacteria of the genus Mycobacterium, the characteristic properties of which are different to
the previously known Mycobacterium species (Bönicke and Juhasz, 1964). The immediate
and broader environment of the cow was searched very carefully and systematically for
Mycobacteria. The majority of the strains were isolated by Karl Diernhofer; thus the proposed
name Mycobacterium diernhoferi for the new species. The bacterial cells are very consistent
and are short and plump, 1-3 μm long and 0.5-0.8 μm wide. Their ends sometimes appeared
to be thickened and rounded (Bönicke and Juhasz, 1965). All this morphological description
of the organism may also be related to that of the isolated strain RA2.
Mycobacterium diernhoferi can be stained according to the Ziehl-Neelsen procedure. Its acid
strength is equivalent to that of other fast-growing Mycobacterium species, such as
Mycobact. vaccae, Mycobact. phlei, Mycobact. smegmatis, Mycobact. borstelense or
Mycobact. fortuitum (Bönicke and Juhasz, 1965).
In the Löwenstein-Jensen, glycerin-broth agar or glycerol broth agar growth media, abundant
growth of Mycobacterium diernhoferi was observed after an incubation time of 3 days at
temperatures of 22-37 °C. At 17 °C growth was inhibited, even more at 40 °C. At 42 °C and
higher temperatures, growth was completely absent (Bönicke and Juhasz, 1965). The growth
behaviour of the isolated strain RA2 was found to be very similar when compared at room
temperature where the cultures where grown.
Mycobacterium dienhoferi is not heat resistant. After 4 hours of heating at 60 °C, the growth
was completely inhibited (Bönicke and Juhasz, 1965). No similar heat resistnace studies
were performed on the isolated strain RA2; thus no comparison may be made here. This is
due to the importance of degradation at normal temperatures and not at elevated ones.
Previously, Mycobacterium diernhoferi was regarded as a synonym for Mycobacterium
parafortuitum (Liston et al., 1963). However, in a study by Tsukamura et al. (1983), it was
established that organisms in this group could be differentiated from Mycobacterium
parafortuitum. Kusunose et al. (1979) found that Mycobacterium diernhoferi (Source: Soil
Chapter 4 Discussion __________________________________________________________________________
90
obtained from a cattle field, Germany) contains 68- to 76-carbon mycolic acids; whereas
mycobacterium parafortuitum contains 54- to 60-carbon mycolic acids (Tsukamura et al.,
1983).
4.1.2 Determination of growth characteristics of Pseudomonas
citronellolis RA1 and Mycobacterium diernhoferi RA2
The potential of RA1 and RA2 to degrade triethylamine was initially determined for a 0.5 mM
concentration of the substrate. This low concentration was chosen to resemble the situation
in exhaust contaminated air (Matz et al., 2004; Schlegelmilch et al., 2005) and is also easily
detected using gas chromatography. The observation of growth of RA1 to saturation
(stationary phase) within the first day, measured by the number of cells counted, confirms
that this strain consumes triethylamine. Measurements showed that RA1 has the capacity to
completely degrade this target compound within 4 days. RA2 was similarly found to
completely degrade triethylamine within 4 days, but with less rapid growth, requiring twice as
long to reach the stationary phase (see chapter 3).
Having proved the degradation potential of RA1 and RA2 towards a low concentration of
triethylamine (0.5 mM), their effect under higher concentrations was investigated, to
determine the maximum possible concentration without inhibiting their function. Increasing
concentration corresponded to an increase in the time taken for complete degradation, but
was found to be possible for RA1 within 16 days for substrate concentrations below 12 mM.
For higher concentrations of up to 20 mM, degradation was found to be progressive at 14
days, and by extrapolation of the slopes of the degradation curves, degradation could
therefore be expected to be complete within a few weeks. Since measured environmental
concentrations of this substrate are roughly an order of magnitude lower than the maximum
tested (Kleeberg et al., 2005; Matz et al., 2005), RA1 could be employed in industrial air
purification applications with reasonable time scales.
RA2 demonstrated similar potential for degradation to that of RA1, for substrate
concentrations below 10 mM. However, at higher concentrations (11-20 mM) a plateau was
observed between 7 and 14 days, which demonstrates the diminished potency of RA2 in
comparison with RA1. Despite this difference, the two strains demonstrate similar function for
the lower concentrations expected in industry.
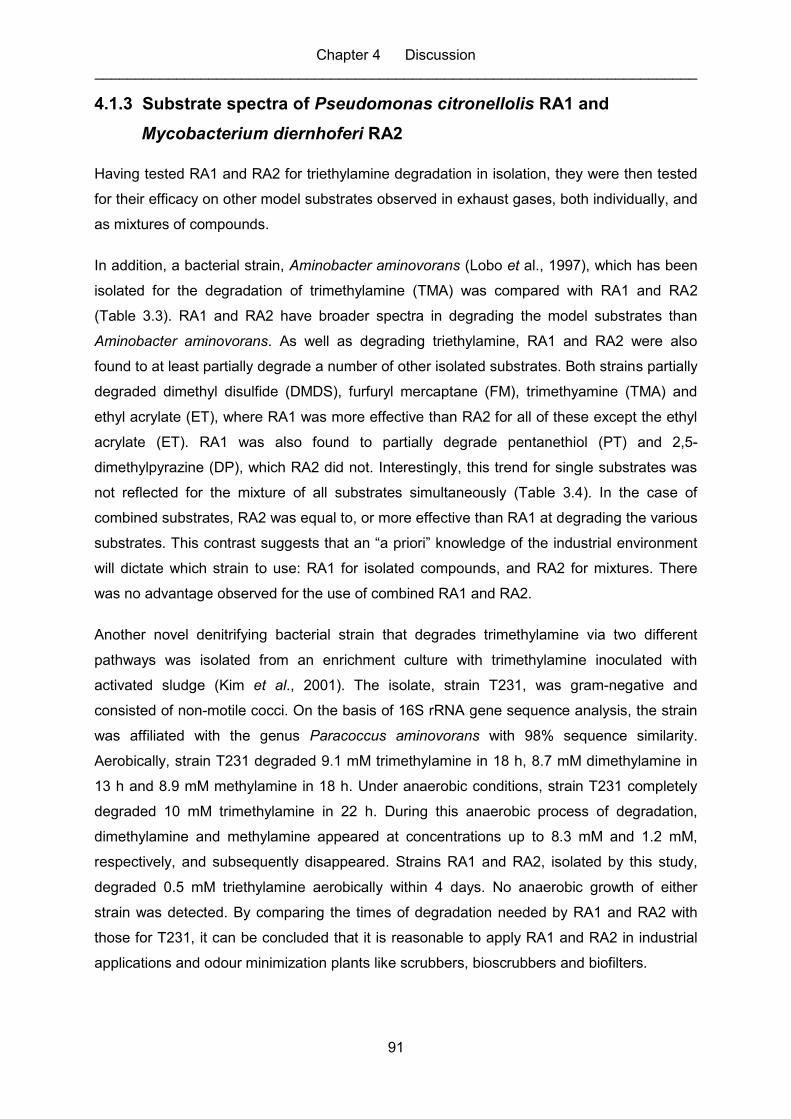
Chapter 4 Discussion __________________________________________________________________________
91
4.1.3 Substrate spectra of Pseudomonas citronellolis RA1 and
Mycobacterium diernhoferi RA2
Having tested RA1 and RA2 for triethylamine degradation in isolation, they were then tested
for their efficacy on other model substrates observed in exhaust gases, both individually, and
as mixtures of compounds.
In addition, a bacterial strain, Aminobacter aminovorans (Lobo et al., 1997), which has been
isolated for the degradation of trimethylamine (TMA) was compared with RA1 and RA2
(Table 3.3). RA1 and RA2 have broader spectra in degrading the model substrates than
Aminobacter aminovorans. As well as degrading triethylamine, RA1 and RA2 were also
found to at least partially degrade a number of other isolated substrates. Both strains partially
degraded dimethyl disulfide (DMDS), furfuryl mercaptane (FM), trimethyamine (TMA) and
ethyl acrylate (ET), where RA1 was more effective than RA2 for all of these except the ethyl
acrylate (ET). RA1 was also found to partially degrade pentanethiol (PT) and 2,5-
dimethylpyrazine (DP), which RA2 did not. Interestingly, this trend for single substrates was
not reflected for the mixture of all substrates simultaneously (Table 3.4). In the case of
combined substrates, RA2 was equal to, or more effective than RA1 at degrading the various
substrates. This contrast suggests that an “a priori” knowledge of the industrial environment
will dictate which strain to use: RA1 for isolated compounds, and RA2 for mixtures. There
was no advantage observed for the use of combined RA1 and RA2.
Another novel denitrifying bacterial strain that degrades trimethylamine via two different
pathways was isolated from an enrichment culture with trimethylamine inoculated with
activated sludge (Kim et al., 2001). The isolate, strain T231, was gram-negative and
consisted of non-motile cocci. On the basis of 16S rRNA gene sequence analysis, the strain
was affiliated with the genus Paracoccus aminovorans with 98% sequence similarity.
Aerobically, strain T231 degraded 9.1 mM trimethylamine in 18 h, 8.7 mM dimethylamine in
13 h and 8.9 mM methylamine in 18 h. Under anaerobic conditions, strain T231 completely
degraded 10 mM trimethylamine in 22 h. During this anaerobic process of degradation,
dimethylamine and methylamine appeared at concentrations up to 8.3 mM and 1.2 mM,
respectively, and subsequently disappeared. Strains RA1 and RA2, isolated by this study,
degraded 0.5 mM triethylamine aerobically within 4 days. No anaerobic growth of either
strain was detected. By comparing the times of degradation needed by RA1 and RA2 with
those for T231, it can be concluded that it is reasonable to apply RA1 and RA2 in industrial
applications and odour minimization plants like scrubbers, bioscrubbers and biofilters.
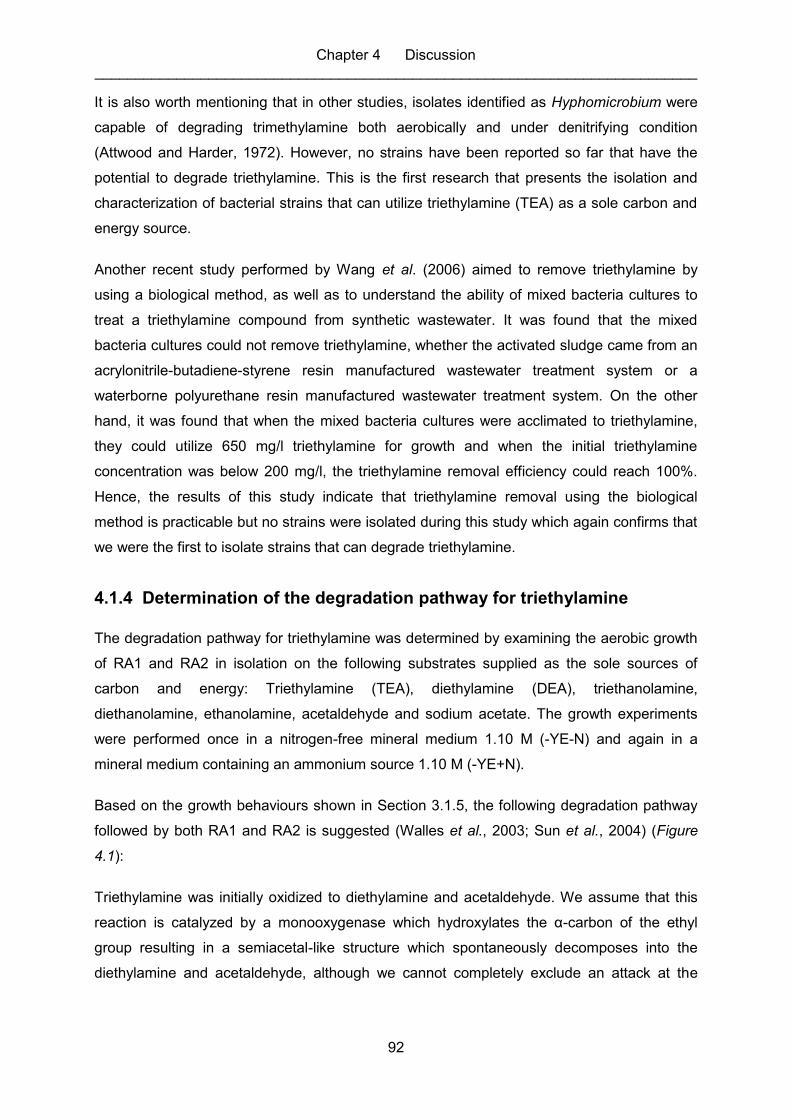
Chapter 4 Discussion __________________________________________________________________________
92
It is also worth mentioning that in other studies, isolates identified as Hyphomicrobium were
capable of degrading trimethylamine both aerobically and under denitrifying condition
(Attwood and Harder, 1972). However, no strains have been reported so far that have the
potential to degrade triethylamine. This is the first research that presents the isolation and
characterization of bacterial strains that can utilize triethylamine (TEA) as a sole carbon and
energy source.
Another recent study performed by Wang et al. (2006) aimed to remove triethylamine by
using a biological method, as well as to understand the ability of mixed bacteria cultures to
treat a triethylamine compound from synthetic wastewater. It was found that the mixed
bacteria cultures could not remove triethylamine, whether the activated sludge came from an
acrylonitrile-butadiene-styrene resin manufactured wastewater treatment system or a
waterborne polyurethane resin manufactured wastewater treatment system. On the other
hand, it was found that when the mixed bacteria cultures were acclimated to triethylamine,
they could utilize 650 mg/l triethylamine for growth and when the initial triethylamine
concentration was below 200 mg/l, the triethylamine removal efficiency could reach 100%.
Hence, the results of this study indicate that triethylamine removal using the biological
method is practicable but no strains were isolated during this study which again confirms that
we were the first to isolate strains that can degrade triethylamine.
4.1.4 Determination of the degradation pathway for triethylamine
The degradation pathway for triethylamine was determined by examining the aerobic growth
of RA1 and RA2 in isolation on the following substrates supplied as the sole sources of
carbon and energy: Triethylamine (TEA), diethylamine (DEA), triethanolamine,
diethanolamine, ethanolamine, acetaldehyde and sodium acetate. The growth experiments
were performed once in a nitrogen-free mineral medium 1.10 M (-YE-N) and again in a
mineral medium containing an ammonium source 1.10 M (-YE+N).
Based on the growth behaviours shown in Section 3.1.5, the following degradation pathway
followed by both RA1 and RA2 is suggested (Walles et al., 2003; Sun et al., 2004) (Figure
4.1):
Triethylamine was initially oxidized to diethylamine and acetaldehyde. We assume that this
reaction is catalyzed by a monooxygenase which hydroxylates the α-carbon of the ethyl
group resulting in a semiacetal-like structure which spontaneously decomposes into the
diethylamine and acetaldehyde, although we cannot completely exclude an attack at the
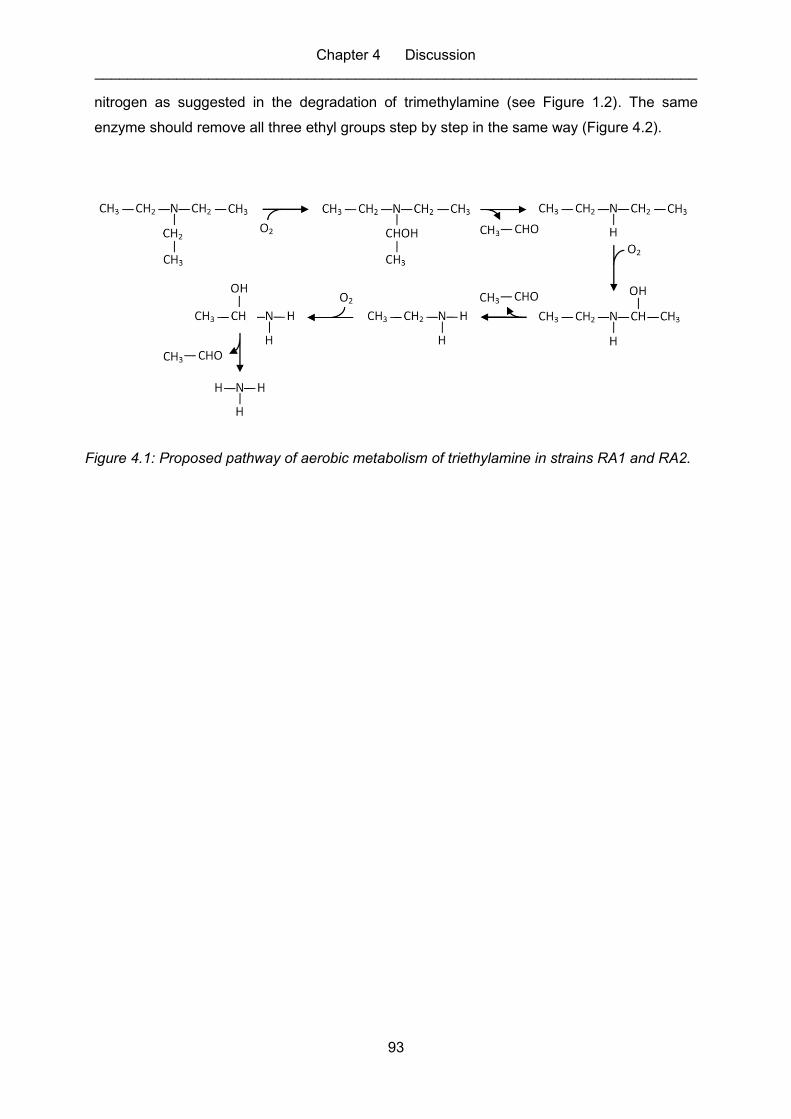
Chapter 4 Discussion __________________________________________________________________________
93
nitrogen as suggested in the degradation of trimethylamine (see Figure 1.2). The same
enzyme should remove all three ethyl groups step by step in the same way (Figure 4.2).
Figure 4.1: Proposed pathway of aerobic metabolism of triethylamine in strains RA1 and RA2.
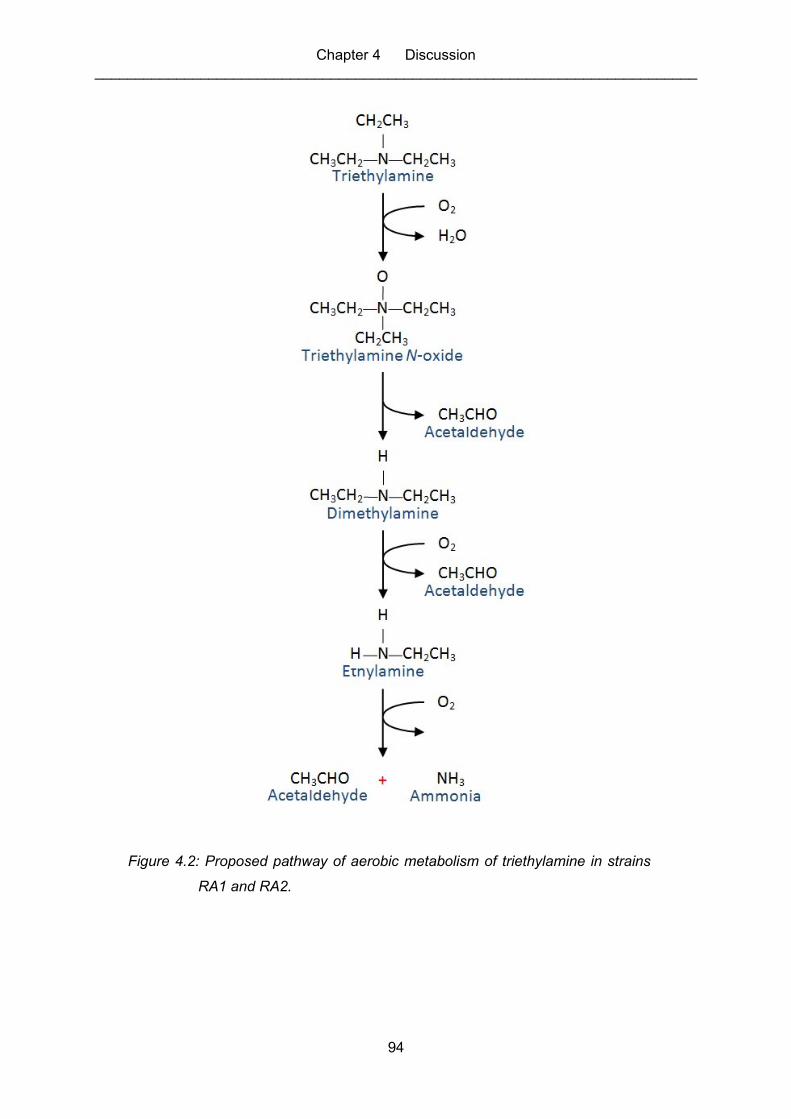
Chapter 4 Discussion __________________________________________________________________________
94
Figure 4.2: Proposed pathway of aerobic metabolism of triethylamine in strains
RA1 and RA2.
Chapter 4 Discussion __________________________________________________________________________
95
4.2 Bacteria that degrade ethyl acrylate
4.2.1 Isolation, characterization and identification of new ethyl acrylate
degrading bacteria, 2C and 2Cbei
The process of screening for bacteria that have the potential to degrade ethyl acrylate was
carried out where a number of soil samples had to be collected from different sources and
locations that were thought to be contaminated with the target compound. Several strains
were isolated and tested for their degradation potential. The two best strains were selected
for further studies and characterization: 2C and 2Cbei were isolated from a soil sample taken
from the Aussenmühlen Park in Harburg, Germany. It is worth mentioning that many other
soil samples from diverse locations also showed activity towards degrading ethyl acrylate.
The screening process for ethyl acrylate was therefore not as time-consuming and arduous
as for triethylamine, for which only three sources were found, and all at the same site. The
sources for triethylamine were scrubbers, bio-scrubbers and bio-filter from a fish-meal
producing company (Seelöwe, Cuxhafen).
The characterization and identification of the strains were carried out by DSMZ using the cell
morphology, cell wall fatty acids analysis and 16S rDNA sequence. Both strains 2C and
2Cbei were found to belong to the species Defluvibacter lusatiensis (Fritsche et al., 1999a).
For the two strains 2C and 2Cbei of Defluvibacter lusatiensis, there were no significant
differences in the colonies shape in case of growing on both LB and mineral salt media.
4.2.1.1 Description of the genus Defluvibacter gen. nov. :
The monospecific genus Defluvibacter was proposed by Fritsche et al. (1999a) (Kämpfer et
al., 2009). Defluvibacter (De.flu.vi.bac´ter. M. L. n. defluvium, waste water; Gr. hyp. masc. n.
bacter, rod; M. L. masc. n. Defluvibacter, referring to its origin from activated sludge of a
waste water treatment plant) (Fritsche et al., 1999a). Cells are Gram-negative short rods that
occur as single cells. Cells are motile by means of a flagellum. Strictly aerobic. Oxidase and
catalase positive. Nitrate is not reduced. Only a limited number of carbohydrates are utilized
for growth, e.g. D-glucose, D-fructose, D-mannose, D-ribose, D-xylose and L-lyxose.
Different amines and amino acids serve as carbon sources. Ubiquinone 10 is the major
ubiquinone. The abundant fatty acid is octadecenoic acid (C18:1). The hydroxyl fatty acid 3-
OH C12:0 is present in low quantities. Spermidine is the major polyamine. The genus can
also be recognized by the 16S rDNA sequence. Phylogenetically, the genus belongs to the
α-subgroup of the Proteobacteria with members of Pseudaminobacter, Mesorhizobium and
Chapter 4 Discussion __________________________________________________________________________
96
Phyllobacterium being the closest relatives. The type species is Defluvibacter lusatiae.
(Fritsche et al., 1999a).
Kämpfer et al. (2009) later proposed to reclassify Defluvibacter lusatiensis to the genus
Aquamicrobium as Aquamicrobium lusatiense comb. nov. A novel species, Aquamicrobium
aerolatum sp. nov., is described. This proposal was based on the remarkable congruence in
phenotypic characters. (Kämpfer et al., 2009).
4.2.1.2 Description of the type species Defluvibacter lusatiae sp.nov.
Defluvibacter lusatiae (lu.sa.ti.ae. M. L. gen. n. lusatiae, referring to the German province of
Lausitz [latin name Lusatia], where the organism was first isolated). The Gram-negative
strain S1, isolated by Fritsche et al., exhibited a stable capability to degrade 2,4-
dichlorophenol, 4-chloro-2-methylphenol, 4-chlorophenol and phenol. This capability to
degrade chlorophenols and phenols was stable over 30 transfers on nutrient agar. The strain
S1 was also described as type strain of a new species and assigned to a new genus with the
proposed name Defluvibacter lusatiae (Fritsche et. al, 1999a). The name was then corrected
to Defluvibacter lusatiensis on validation (Fritsche et al., 1999b; Kämpfer et al., 2009). Cells
are short rods (0.6 to 0.8 μm in width and 1.5 to 3 μm in length), occur singly and are motile
by means of a single polar flagellum. Spores are not formed. After 2 days of incubation on
nutrient agar, colonies are white-greyish, circular with a diameter of 2 mm, which can extend
to 4 mm after prolonged incubation, and appear slightly mucoid. Optimal growth is at 30-37
°C and pH 7.0-7.5. These properties were all found in our isolated strains. Nevertheless,
none of the stains described so far degraded ethyl acrylate.
4.2.2 Determination of growth characteristics of Defluvibacter
lusatiensis, 2C and 2Cbei
In order to determine the potential of 2C and 2Cbei to degrade ethyl acrylate, an initial
concentration of 2 mM was tested. And because these strains were originally isolated using
yeast extract as an additional carbon source to the mineral medium, degradation was tested
both with and without yeast extract. The 2C strain was found to have the capacity to
completely degrade the ethyl acrylate substrate without yeast extract, but its addition
decreased the time to complete degradation from 22 to 14 hours. 2Cbei was also found to
completely degrade ethyl acrylate both with and without yeast extract. However, the time
required was somewhat lower than for the 2C strain and degradation was not affected by the
presence of yeast extract. This suggests that 2Cbei is the more efficient strain in the
degradation of ethyl acrylate, with no extra yeast extract resources necessary.
Chapter 4 Discussion __________________________________________________________________________
97
Subsequently, the concentration of the substrate was varied. This set of experiments was
performed 9 months later than the original series discussed above. After this period the
bacteria were found to be less potent and required yeast extract to completely degrade the
substrate. Degradation took almost twice as long for the 2 mM concentration used in the
original series. This phenomenon remains unexplained, but could be related to mutations of
the bacterial strains over time. Contamination was ruled out, since multiple sources of the
strains demonstrated the same trend. Complete degradation was still shown to occur for both
strains for substrate concentrations of up to 7 mM. For higher concentrations, of up to 10
mM, degradation was observed to be progressive at 16 days, and could be therefore
expected to eventually lead to complete degradation. Despite their diminished function, 2C
and 2Cbei are clearly candidates for the degradation of ethyl acraylate in an applied
industrial setting.
During the degradation of ethyl acrylate by 2C, a peak was noted in the GC measurements,
referring to ethanol, which was therefore shown to be a by-product of ethyl acrylate
degradation. The concentration of ethanol was found to be three times higher with the
addition of yeast extract.
4.2.3 Determination of the degradation pathway for ethyl acrylate
The degradation pathway for ethyl acrylate was determined by monitoring the aerobic growth
of 2C and 2Cbei in isolation on the following substrates supplied as sources of carbon and
energy: Acrylic acid (propenoic acid), ethanol, L(+)-Lactic acid, D(-)-Lactic acid, malonic acid
and ethyl acrylate.
From these data (Section 3.2.4) it was concluded that the ester bond in the ethyl acrylate is
hydrolyzed first. The ethanol was used as a carbon source and to the double bond of the
acrylate water was added and the resulting lactate was also used as carbon source.
These growth experiments (Figure 3.25 and Figure 3.26) confirm the suggested degradation
pathway for ethyl acrylate, which is illustrated as follows (Figure 4.3):
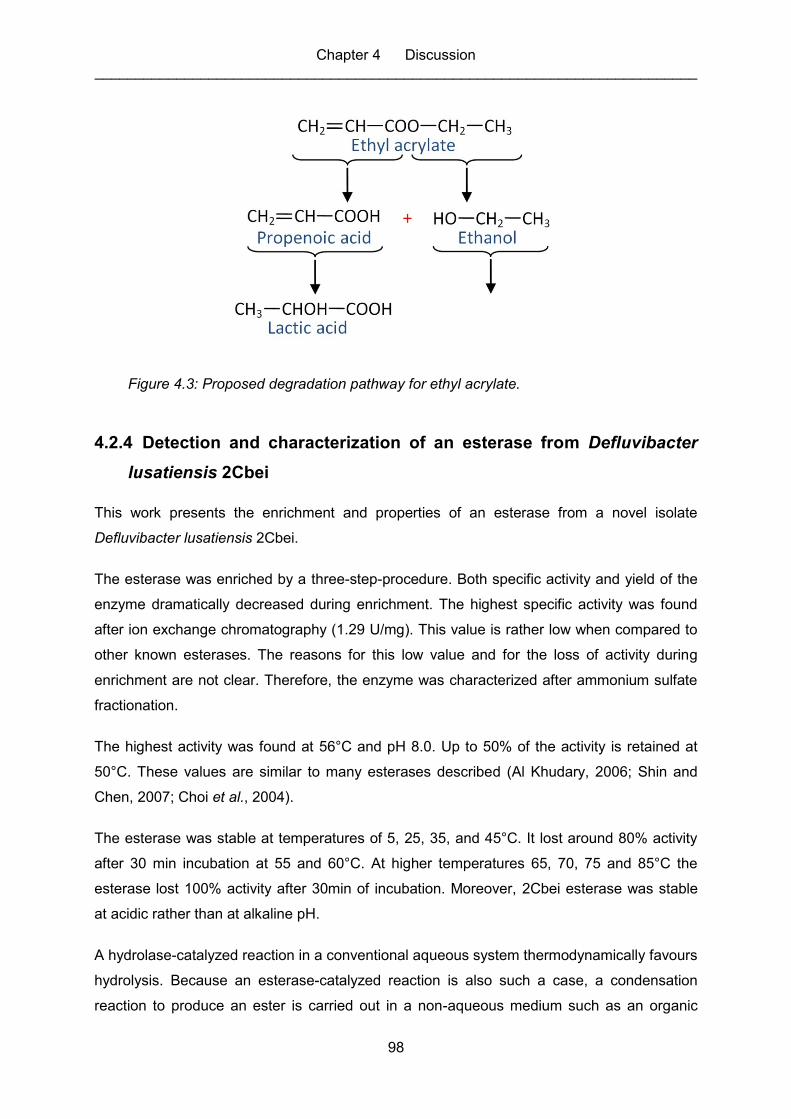
Chapter 4 Discussion __________________________________________________________________________
98
Figure 4.3: Proposed degradation pathway for ethyl acrylate.
4.2.4 Detection and characterization of an esterase from Defluvibacter
lusatiensis 2Cbei
This work presents the enrichment and properties of an esterase from a novel isolate
Defluvibacter lusatiensis 2Cbei.
The esterase was enriched by a three-step-procedure. Both specific activity and yield of the
enzyme dramatically decreased during enrichment. The highest specific activity was found
after ion exchange chromatography (1.29 U/mg). This value is rather low when compared to
other known esterases. The reasons for this low value and for the loss of activity during
enrichment are not clear. Therefore, the enzyme was characterized after ammonium sulfate
fractionation.
The highest activity was found at 56°C and pH 8.0. Up to 50% of the activity is retained at
50°C. These values are similar to many esterases described (Al Khudary, 2006; Shin and
Chen, 2007; Choi et al., 2004).
The esterase was stable at temperatures of 5, 25, 35, and 45°C. It lost around 80% activity
after 30 min incubation at 55 and 60°C. At higher temperatures 65, 70, 75 and 85°C the
esterase lost 100% activity after 30min of incubation. Moreover, 2Cbei esterase was stable
at acidic rather than at alkaline pH.
A hydrolase-catalyzed reaction in a conventional aqueous system thermodynamically favours
hydrolysis. Because an esterase-catalyzed reaction is also such a case, a condensation
reaction to produce an ester is carried out in a non-aqueous medium such as an organic
Chapter 4 Discussion __________________________________________________________________________
99
solvent, a solvent-free system, or an ionic liquid. To carry out a condensation reaction, the
esterase should be stable in the organic solvent. The organic solvents recommended for
2Cbei esterase are: 50% methanol, N,N-dimethyl formamide, 99% methanol, n-hexadecane,
n-heptane and isooctane where it showed 100% stability upon incubation for 60 min. Other
organic solvents like 50% ethanol, acetone, DMSO, pyridine and 99% DMSO, pyridine,
toluene, benzene, n-hexane and n-decyl alcohol decreased the activity of the esterase to 70,
75, 80, 75, 90, 80, 75, 75, 90, 80% repectively. The esterase showed up to 40% of the
original activity in 50% tert-butanol and 99% acetonitrile and was mostly deactivated by 99%
tert-butanol, isopropanol and n-amyl alcohol. No 100% inhibition of the 2Cbei esterase was
caused by any of the organic solvents tested.
Generally, esterases are cofactor-independent enzymes. 2Cbei esterase was inhibited by 10
mM of Ag+1 (100% inhibition), Hg+2 (100% inhibition) and Mn+2 (35% inhibition); whereas Ni+2,
Cu+2, Rb+1, Zn+2, Mg+2, Fe+2, Fe+3, Ca+2, K+1, Cr+3 and Al+3 had no or limited effect. Na+1 and
Sr+2 increased the activity by ~10%. Hg+2 and Ag+1 were reported to inhibit activity of the
esterase from Lactobacillus plantarum 2739 (Gobetti et al., 1996) and of the esterase from
Lactobacillus fermentum DT41 (Gobetti et al., 1997). Ca+2 is known to increase activity in
some lipases and was reported to slightly increase the activity of PsyEst from Psychrobacter
sp. Ant300 (Kulakova et al., 2004) whereas Ca+2 had no effect on the activity of 2Cbei
esterase.
Various inhibitors were used to study the structure and catalytic mechanism of the esterase.
There are two classes of enzyme inhibitors: Reversible and irreversible. The reversible
inhibitors are classified further in two groups as non-specific and specific reversible inhibitors.
Compounds that inhibit esterase activity by changing the conformation or interfacial
properties, but do not act directly on the active site are defined as non-specific inhibitors such
as surfactants. Specific inhibitors directly interact with the active site of the enzyme and can
be either reversible or irreversible. Specific irreversible inhibitors inhibit the catalytic activity
of enzymes by reacting with the amino acids at or near the active site. Serine inhibitors are
potential esterase active-site irreversible inhibitors, because esterases belong to a class of
serine hydrolases with the catalytic triad Ser-His-Asp. Phenylmethylsulfonyl fluoride (PMSF),
phenylboronic acid, Pefablock and diethyl ρ-nitrophenyl phosphate belong to serine-specific
inhibitors. PMSF reduced the activity of 2Cbei esterase down to 25%. Therefore, the enzyme
belongs to the serine hydrolases.
PCMB reduced the activity of the 2Cbei esterase only slightly to 65%. The specific
irreversible inhibitors such as 2-mercaptoethanol, iodoacetate and DTT, which react with
sulphhydryl groups and thus modify the protein conformation, did not have an inhibitory effect
Chapter 4 Discussion __________________________________________________________________________
100
on the 2Cbei esterase activity. Therefore, the esterase of 2Cbei does not have a sulphhydryl
group at the active site.
No inhibitory effect of the 2Cbei esterase by EDTA was observed suggesting that no divalent
ions are required for activity.
The 2Cbei esterase had a broad substrate specificity considering the chain length of fatty
acids. However; the enzyme exhibited higher activity towards water soluble substrates with
short chains, such as ρ-nitrophenyl esters with fatty acid chain shorter than C10. Therefore
the enzyme is a true esterase and not a lipase.
4.3 Concluding remarks and further prospects
This study had been successful in contributing more to the understanding of biological
degradation of some key odorous compounds that needed to be improved. The necessary
microorganisms, needed for the purpose of the degradation of both triethylamine and ethyl
acrylate, were successfully isolated and characterized. The results and the information
obtained by the research were important and will aid our understanding of biodegration in
natural ecosystems and will assist the development of strategies for effective biological odour
treatment technologies.
The research study determined: (1) the degradation ability of the isolated microorganisms
and (2) the influence of the presence of other odorous compounds on the degradation of the
target odorous compound. The latter was necessary since the waste gases always consist of
a mixture of various odorous compounds.
It is also worth pointing out that this research has been the first that presents the isolation
and characterization of bacterial strains that can utilize triethylamine as a sole carbon and
energy source.
The biological degradation pathways of both triethylamine and ethyl acrylate were described.
And finally, the esterase of the 2Cbei enzyme was purified and further characterized.
It was concluded that the goals of the study were achieved and new strains were isolated:
RA1 and RA2 for the degradation of triethylamine; 2C and 2Cbei for the degradation of ethyl
acrylate.
Last but not least, more detailed research is recommended concerning further investigations
of the degradation pathways and an isolation of the different metabolites for both
triethylamine and ethyl acrylate.
101
Chapter 5
SUMMARY
_________________________________ In this study, bacteria that have the potential to degrade triethylamine and ethyl acrylate were
isolated. These two common industrial waste products are considered to be extremely
annoying due to their exceedingly bad odour. A biological degradation of these compounds
has not been previously described.
Numerous environmental samples were collected from a large number of sources that were
believed to be contaminated with the target compounds. Sources included biofilter material,
bio-scrubber “Biowäscher”, scrubber “Wäscher” and soils. Several strains were isolated and
the two bacterial strains demonstrating the most efficient degradation of each odorous
compound were chosen for further analysis in this study: RA1 and RA2 for triethylamine; 2C
and 2Cbei for ethyl acrylate.
RA1 was isolated from the scrubber “Wäscher” of the fish-meal producing company Seelöwe
in Cuxhaven, Germany; whereas RA2 was isolated from a sample originating from the bio-
scrubber “Biowäscher” of the same company. The growth of the two strains, RA1 and RA2,
obtained in the enrichment procedure was tested. With 0.5 mM triethylamine, the growth
rates at 25 °C were 0.046 h-1 and 0.045 h-1, respectively. After 4 days, the 0.5 mM
triethylamine had disappeared and was completely degraded by RA1 and RA2 separately.
Strain RA1 was found to be a motile gram negative rod of width 0.5 – 0.7 μm and length 1.8
– 3.0 μm. Strain RA2 was found to be a non-motile, non-spore forming gram negative rod of
width 1.0 μm and length 2.0 μm. Based on these results and on the characterization of
DSMZ, RA1 was classified as Pseudomonas citronellolis and RA2 as Mycobacterium
diernhoferi.
Both 2C and 2Cbei were isolated from a soil sample taken from Aussenmühlen Park in
Harburg, Germany. The growth of these two strains, obtained in the enrichment procedure,
was tested. With 2.0 mM ethyl acrylate, the growth rates at 25 °C were 0.104 h-1 and
Chapter 5 Summary __________________________________________________________________________
102
0.130 h-1, respectively. By comparing the two strains, strain 2Cbei was faster in degrading
2.0 mM ethyl acrylate. 2Cbei required 10 to 11 hours both in the presence and absence of
0.1% yeast extract; whereas 2C required 14 hours in the presence of 0.1% yeast extract and
21 hours in the absence of 0.1% yeast extract.
2C and 2Cbei were found to be gram negative with rod cell form of width 0.5 – 0.7 μm and
length 1.0 – 2.5 μm. The partial sequencing of 16 s rDNA from both strains resulted in 100%
similarity between them. The similarity to the strain Defluvibacter lusatiensis was found to be
100%; thus both strains were classified as Defluvibacter lusatiensis.
A study of the potential of RA1 and RA2 to degrade triethylamine and of 2C and 2Cbei to
degrade ethyl acrylate under anaerobic conditions was performed and no significant growth
was detected. This confirms that all four strains can only degrade the target substrate strictly
under aerobic conditions.
Optimum temperature, pH and substrate concentration were determined and the substrate-
degradation potential of each bacterial strain was examined. The aerobic mechanisms of
degradation by these strains were determined and degradation pathways were suggested for
each compound.
Finally, from all four strains, Defluvibacter lusatiensis 2Cbei, the enzyme initiating the
degradation of ethyl acrylate was extracted, purified and characterized. Using p-nitrophenyl
ester as substrate, an esterase could be detected in crude extracts prepared from cells of
2Cbei grown with ethyl acrylate. In 20 mM phosphate buffer of pH 7 at 25 °C an activity of
0.28 U/mg was measured. The extracted esterase was purified by a three-step procedure:
Purification of the esterase after ammonium sulfate fractionation and Q-Sepharose
chromatography resulted in a 4.6 fold increase in specific activity (1.29 U/mg). Purification
after the gel filtration step on Superdex G200 resulted in a 40% decrease in specific activity
(0.18 U/mg). All purification steps were carried out at room temperature. The activity
obtained after the ammonium sulfate fractionation step was sufficient to perform
characterization of the native 2Cbei enzyme.
The 2Cbei esterase showed activity over a pH range of 6.0 – 8.5, with an optimum pH of 8.0.
The enzyme was active between 25 and 60 °C. The optimum temperature was 56 °C and a
rapid decrease in esterase activity was observed above 60 °C. 50% activity was retained at
50 °C. The influence of temperature on the stability of the esterase was examined by
measuring the enzymatic activity after incubation at temperatures ranging from 5 to 85 °C.
The enzyme was stable at temperatures of 5, 25, 35 and 45 °C. It lost around 80% of activity
Chapter 5 Summary __________________________________________________________________________
103
after 30 min of incubation at 55 and 60 °C. At higher temperatures 65, 70, 75 and 85 °C the
enzyme lost 100% of activity after 30 min of incubation.
The effect of inhibitors, detergents, organic solvents and metal ions on the esterase of
Defluvibacter lusatiensis was studied and the enzyme converted preferentially esters of short
chain aliphatic acids.
In this study all four strains studied were found to degrade the target compounds completely.
In combination with the determination of optimum degradation conditions and discovery of
the mechanism, the strains are now ready to be used in industrial air and waste water
purification processes.
104
Chapter 6
ZUSAMMENFASSUNG
_________________________________ In dieser Studie wurden Bakterien, die Triethylamin und Ethylacrylat abbauen, isoliert. Diese
zwei gängigen, industriellen Abfallprodukte sind extrem lästig aufgrund ihres äußerst
schlechten Geruchs. Ein biologischer Abbau von diesen Gemischen wurde bislang noch
nicht beschrieben.
Zahlreiche Boden- und Wasserproben wurden von verschiedenen Quellen entnommen, von
denen angenommen wurde, dass sie mit Triethylamin und Ethylacrylat kontaminiert sind.
Dabei handelte es sich um Biofiltermaterial, Biowäscher, Wäscher und Bodenproben.
Mehrere Bakterienstämme wurden isoliert. Die zwei besten Bakterienstämme, die den
jeweiligen Geruch von Triethylamin und Ethylacrylat am effizientesten abbauen konnten,
wurden näher untersucht: RA1 und RA2 für Triethylamin; 2C und 2Cbei für Ethylacrylat.
RA1 wurde von einem „Wäscher“ der Fischmehl Fabrik, Seelöwe in Cuxhaven Deutschland,
isoliert. RA2 wurde von einem „Biowäscher“ der selbigen Firma isoliert. Es wurde das
Wachstum der beiden Bakterienstämme untersucht. Unter Zugabe von 0,5 mM Triethylamin
waren die Wachstumsraten für RA1 und RA2 0.046 h-1 und 0.045 h-1 bei einer Temperatur
von 25°C. Nach 4 Tagen wurde das Triethylamin von RA1 und ebenso von RA2 vollständig
abgebaut.
RA1-Bakterien sind Gram-negativ, stäbchenförmig und beweglich. Die Abmaße sind: 0,5 -
0,7 µm Breite und 1,8 – 3,0 µm Länge. RA2-Bakterien sind Gram-negativ, nicht
sporenbildend, stäbchenförmig und nicht beweglich mit einer Breite von 1,0 µm und einer
Länge von 2,0 µm. Basierend auf diesen Ergebnissen und der Charakterisierung der DSMZ
wurde RA1 als Pseudomonas citronellolis klassifiziert. RA2 wurde als Mycobacterium
diemhoferi klassifiziert.
Beide Stämme 2C und 2Cbei wurden von einer Bodenprobe aus dem Außenmühlen Park,
Hamburg-Harburg, Deutschland, isoliert. Es wurde das Wachstum beider Bakterienstämme
Chapter 6 Zusammenfassung __________________________________________________________________________
105
untersucht. Unter Zugabe von 2,0 mM Ethylacrylat betrugen die Wachstumsraten für 2C und
2Cbei 0.104 h-1 und 0.130 h-1 bei Temperatur 25°C; wobei 2Cbei schneller Ethylacrylat
abbaute als 2C. 2Cbei benötigte dafür 10 bis 11 Stunden sowohl mit als auch ohne Zugabe
von 0,1% Hefeextrakt. 2C hingegen benötigte für den Abbau 14 Stunden bei Zugabe von
0,1% Hefeextrakt und 21 Stunden ohne die Zugabe von 0,1% Hefeextrakt.
2C und 2Cbei sind Gram-negative und stäbchenförmige Bakterien. Sie weisen eine Breite
von 0,5 – 0,7 µm und eine Länge von 1,0 – 2,5 µm auf. Die Teilsequenzen von 16 s rDNA
der beiden Stämme hatten eine Ähnlichkeit von 100%. Folglich wurden beide Stämme als
Defluvibacter lusatiensis klassifiziert.
Zusätzlich wurde das Potential von RA1 und RA2 Triethylamin bzw. von 2C und 2Cbei
Ethylacrylat unter anaeroben Bedingungen abzubauen untersucht. Es zeigte sich kein
signifikantes Wachstum der Bakterienstämme. Dies unterstreicht, dass alle vier
Bakterienstämme ausschließlich unter aeroben Bedingungen die Substrate abbauen können.
Optimale Temperatur, pH-Wert und Substratkonzentration in Bezug auf das Abbauverhalten
wurden für jeden Bakterienstamm ermittelt. Der aerobe Abbaumechanismus des Geruchs
bzw. der Verstoffwechselungsweg dieser Bakterienkulturen wurde heraus gearbeitet.
Von den vier Bakterienstämmen wurde das Enzym von Defluvibacter lusatiensis 2Cbei,
welches Ethylacrylat abbaut, extrahiert, gereinigt und charakterisiert. Unter Verwendung von
p-Nitrophenylester als Substrat konnte eine Esterase im Rohextrakt, erzeugt durch 2Cbei
unter Einfluss von Ethylacraylat, detektiert werden. In 20 mM Phosphat-Puffer bei einem pH-
Wert von 7 und einer Temperatur von 25°C wurde eine Aktivität von 0,28 U/mg gemessen.
Die extrahierte Esterase wurde in 3 Stufen gereinigt: Reinigung der Esterase nach
Fraktionierung mit Ammoniumsulfat und die Q-Sepharose-Chromatographie ergaben eine
4,6-fache spezifische Aktivität (1,29 U/mg). Die Reingung nach der
Gelfiltrationchromatographie mit Superdex G200 ergab 60% an spezifischer Aktivität
(0,18 U/mg). Alle Reinigungsschritte wurden bei Raumtemperatur durchgeführt. Die
spezifische Aktivität, die sich nach der ersten Reinigungsstufe, der
Ammoniumsulfatfraktionierung, einstellte, war ausreichend zur Charakterisierung des nativen
Enzyms 2Cbei.
2Cbei Esterase zeigte in einem pH-Bereich von 6,0 – 8,5 eine Aktivität, wobei der optimale
pH-Wert bei 8,0 lag. Das Enzym war aktiv bei einer Temperatur zwischen 25 °C und 60 °C.
Die optimale Temperatur war 56 °C; eine rasche Abnahme der Aktivität wurde über einer
Temperatur von 60 °C beobachtet. 50% der Aktivität wurde bei einer Temperatur von 50 °C
gemessen. Der Einfluss der Temperatur auf die Stabilität der Esterase wurde durch die
Chapter 6 Zusammenfassung __________________________________________________________________________
106
Messung der Enzymaktivität nach Inkubation der Proben bei einer Temperatur zwischen
5 °C und 85 °C untersucht. Das Enzym war bei den Temperaturen 5 °C, 25 °C, 35 °C und
45 °C stabil. Es verlor ~80% der Aktivität nach einer Inkubation von 30 Minuten bei einer
Temperatur von 55 °C und 60 °C. Bei höheren Temperaturen 65 °C, 70 °C, 75 °C und 85 °C
verlor das Enzym 100% der Aktivität nach einer Inkubation von 30 Minuten.
Der Einfluss von Hemmstoffen, Detergenzien, organischen Lösungsmitteln und Metallionen
auf die Esterase von Defluvibacter lusatiensis wurde untersucht. Das Enzym wandelte
vorzugsweise Ester von kurzkettigen, aliphatischen Säuren um.
Zusammengefasst zeigte sich, dass alle vier Bakterienkulturen die Geruchsstoffe
Triethylamin und Ethylacrylat vollständig abbauen können. Durch die Bestimmung der
optimalen Abbaubedingungen und der Entschlüsselung des Abbaumechanismus sind diese
vier isolierten Bakterienkulturen einsatzbereit für industrielle Luft- und
Wasserreinigungsanlagen.
107
Chapter 7
REFERENCES
__________________________________________________________________________
7.1 General References
ACGIH (1991). Documentation of the threshold limit values and biological exposure indices. 6th ed. American Conference of Governmental Industrial Hygienists. Cincinnati, OH.
Adler, S. F. (2001). Biofiltration-a primer, Chem Eng Prog, 97 (4), 33-41.
Åkesson, B., Florén, I., and Skerfving, S. (1985). Visual disturbances after experimental human exposure to triethylamine. Br. J. Ind. Med. 42 , 848-850.
Åkesson, B., Skerfving, S. and Mattiasson, L. (1988). Experimental study on the metabolism of triethylamine in man. Br. J. Ind. Med. 45 (4), 262-268.
Al Khudary, R. (2006). A Novel Cold Active Esterase from the Marine Psychrotolerant Isolate Pseudoalteromonas arctica sp. nov. Hamburg-Harburg: ISBN-13: 978-3-8334-6644-1.
Albrecht, W. and Stephenson, R. (1988). Health hazards of tertiary amine catalysts. Scand. Work Environ. Health 14 , 209-219.
Alexander, M. (1999). Biodegradation and bioremediation. Academic Press, London.
Amoore, J. E. and Hautala, E. (1983). Odour as an aid to chemical safety : Odour thresholds compared with threshold limit values and volatilities for 214 industrial chemicals in air and water dilution. J. Appl. Toxicol. 3 (6) , 272-290.
Andersson, B. and Andersson, K. (1989). Determination of Tertiary Amine in Air. Appl. Ind. Hyg. 4 , 175-178.
Anzai, Y., Kim, H., Park, J. Y., Wakabayashi, H. and Oyaizu, H. (2000). Phylogenetic affiliation of the pseudomonads based on 16S rRNA sequence. Int J Syst Evol Microbiol 50 (Pt 4), 1563–1589.
Ashley, D. L., Bonin, M. A., Cardinali, F. L., McCraw, J. M. and Wooten, J. V. (1996). Measurement of Volatile Organic Compounds in Human Blood. Env Health Perspect 104 (Suppl 5) , 871-877.
Attwood, M. M. and Harder, W. (1972). A rapid and specific enrichment procedure for Hyphomicrobium spp. Antonie van Leeuwenhoek 38 , 369-378.
Chapter 7 References __________________________________________________________________________
108
Ayanaba, A., Verstraete, W. and Alexander, M. (1973). Formation of dimethylnitrosamine, a carcinogen and mutagen, in soils treated with nitrogen compounds. Soil Sci. Soc. Am. Proc. 37, 565-568.
Barrett, E. L. and Kwan, H. S. (1985). Bacterial reduction of trimethylamine oxide. Annu. Rev. Microbiol. 39, 131-149.
Belin, L., Wass, U., Audunsson, G. and Mathiasson, I. (1983). Amines possible causative agents in the development of bronchial hyperreactivity in workers manufacturing polyurethanes from isocyanates. Br. J. Ind. Med. 40, 251-257.
Belousova, I. A., Simanenko, Yu. S., Savelova, V. A. and Suprun, I. P. (1999). Mechanism of Catalysis with Triethylamine of Phenols, Benzoylation in Dioxane. New Quality Experiment. Litvinenko Institute of Physical Organic and Coal Chemistry. Ukrainian National Academy of Sciences.
Bernstein, I. L., Chan-Yeung, M., Malo, J. L. and Bernstein, D. I. (1999). Asthma in the Workplace. 2nd ed. New York: Marcel Dekker, 524-525.
Bethesda, MD. (1993). U.S. Department of Health and Human Services . Hazardous Substances Data Bank (HSDB, online database). National Toxicology Information Program, National Library of Medicine.
Bethesda, MD. (1993). U.S. Department of Health and Human Services. Registry of Toxic Effects of Chemical Substances (RTECS, online database). National Toxicology Information Program, National Library of Medicine.
Böckle, B. (1994). Untersuchungen zum mikrobiellen Abbau von Keratin. Isolierung und Characterisierung einer keratinolytisch wirkenden Protease aus Streptomyces pactum. Hamburg-Harburg: Techn. Univ., Institut für Biotechnologie.
Bönicke, R. and Juhasz, S. E. (1965). Mycobakterium diernhoferi n. sp., eine in der Umgebung des Rindes häufig vorkommende neue Mycobakterium-Species. Zentralbl. Bakteriol. Parasitenkd. Infektionskr. Hyg. Abt. 1 orig. 197: 292-294. (This article has been corrected, See Bacteriol Rev. 1977 December; 41(4), 903).
Bönicke, R. and Juhasz, S. E. (1964). Beschreibung der neuen Species Mycobacterium vaccae n. sp. Zbl. Bakter. I. Abtlg. Orig. 192, 133.
Borger, T., Salden, A. and Eigenberger, G. (1997). A combined vacuum and temperature swing adsorption process for the recovery of amine from foundry air. Chem. Eng. Processing 36, 231-38.
Both, R. (2001). Directive on odour in ambient air: An established system of odour measurement and odour regulation in Germany. Wat. Sci. Tech. 44 (9), 119-126.
Boulton, C. A., Crabbe, M. J. C. and Large, P. J. (1974). Partial purification of a trimethylamine mono-oxygenase from Pseudomonas aminovorans and its role in growth on trimethylamine. Biochem. J. 140, 253-263.
Bradford, M. M. (1976). A rapid and sensitive method for the quantitation of microgram quantities of protein utilizing the principle of protein-dye binding. Anal Biochem 72, 248-254.
Brown, G. M., Campbell, I. and Priest, F. G. (1988). Introduction to biotechnology. Edited by English language book society / Blackwell scientific publications, UK.
Chapter 7 References __________________________________________________________________________
109
BUA (1995). Beratergremium für umweltrelevante Altstoffe. Ethyl Acrylate 128:105.
Bull, A. T., Holt, J. G. and Lilly, M. D. (1982). Biotechnology. International trends and perspectives. Edited by organization for economic cooperation and development, Paris.
Bu’lock, J. and Kristiansen. (1987). Basic biotechnology. Edited by H. Brace. Jovanovich, London.
Burgess, J. E., Parsons, S. A. and Stuets, R. M. (2001). Development in odors control and waste gas treatment biotechnology: A review. Biotechnol Adv 19, 35-43.
Busca, G. and Pistarino, C. (2003). Abatement of ammonia and amines from waste gases: A summary. J Loss Prevention in the Process Industries 16, 157-166.
Chang, C. T., Chen, B. Y., Shiu, I. S. and Jeng, F. T. (2004). Biofiltration of trimethylamine-containing waste gas by entrapped mixed microbial cells. Chemosphere 55 (5), 751-756.
Choi, Mun Huan and Sung Chul Yoon (1994). Polyester Biosynthesis Characteristics of Pseudomonas citronellolis Grown on Various Carbon Sources, Including 3-Methyl-Branched Substrates. Applied and environmental microbiology 60 (9), 3245–3254.
Choi, Y. J., Miguez, C. B. And Lee, B. H. (2004). Characterization and Heterologous Gene Expression of a Novel Esterase from Lactobacillus casei CL96. Appl Environ Microbiol 70 (6), 3213-3221.
Chou, M. S. and Shiu, W. Z. (1997). Bioconversion of methylamine in biofilters. J Air Waste Manage Assoc 47, 58-64.
Claus, G. and Kutzner, H. J. (1981). Microbial degradation of odorous substances from waste air streams. Landwirsch. Forsch. Sonderh. 37, 541-550.
Clayton, G. and Clayton, F. (1981-1982). Patty's industrial hygiene and toxicology. 3rd rev. ed. New York, NY: John Wiley & Sons.
Colby, J. and Zatmann, L. J. (1975). Tricarboxylic acid-cycle and related enzymes in restrictive facultative methylotrophs. Biochem. J. 148, 505-511.
Colby, J. and Zatmann, L. J. (1973). Trimethylamine metabolism in obligate and facultative methylotrophs. Biochem. J. 132, 101-112.
deBethizy, J. D., Udinsky, J. R., Scribner, H. E. and Frederick, C. B. (1987). The disposition and metabolism of acrylic acid and ethyl acrylate in male Sprague-Dawley rats. Fundam Appl Toxicol. 8, 549-561.
Deshusses, M. (1997). Biological waste air treatment in biofilters. Curr. Opin. Biotechnol. 8, 335-339.
DFG (Deutsche Forschung Gemeinschaft) (1994). Occupational Toxicants, Critical Data Evaluation for MAK Values and Classification of Carcinogens, Ethyl acrylate Vol. 6, 217-229.
Diamond, S. and Baltes, B. J. (1967). Headache - an industrial nemesis. Ind Med Surg 36, 585-587.
EPA, U.S. (United States Environmental Protection Agency) (1998). TRIFacts Ethyl Acrylate. http://mail.odsnet.com/TRIFacts/108.html .
Chapter 7 References __________________________________________________________________________
110
Fouhy, K. (1992). Cleaning waste gas naturally. Chem. Eng. (December), 43-46.
Frederick, C. B., Potter, D. W., Chang-Mateu, M. I. and Andersen, M. E. (1992). A physiologically based pharmacokinetic and pharmacodynamic model to describe the oral dosing of rats with ethyl acrylate and its implications for risk assessment. Toxicol Appl. Pharmacol 114, 246-260.
Frederick, C. B., Udinsky, J. R. and Finch, L. (1994). The regional hydrolysis of ethyl acrylate to acrylic acid in the rat nasal cavity. Toxicol Lett. 70, 49-56.
Fritsche, K., Auling, G., Andreesen, J. R. and Lechner, U. (1999a). Defluvibacter lusatiae gen. nov., sp. nov., a New Chlorophenol-degrading Member of the α-2 Subgroup of Proteobacteria. Syst Appl Microbiol. 22, 197-204.
Fritsche, K., Auling, G., Andreesen, J. R. and Lechner, U. (1999b). Defluvibacter lusatiensis corrig., sp. nov. In Validation of Publication of New Names and New Combinations Previously Effectively Published Outside the IJSB, List no. 71. Int J Syst Bacteriol 49, 1325-1326.
Gamati, S., Luong, J. H. and Mulchandani, A. (1991). A microbial biosensor for trimethylamine using Pseudomonas aminovorans cells. Biosens. Bioelectron. 6 (2), 125-131.
Ghanayem, B. I., Burka, L. T. and Matthews, H.B.(1987). Ethyl acrylate distribution, macromolecular binding, excretion and metabolism in male Fisher 344 rats. Fundam. Appl. Toxicol. 9, 389-397.
Ghisalba, O. and Kuenzi, M. (1983). Biodegradation of quaternary alkylammonium compounds by specialized methylotrophs. Experientia 39, 1264-1271.
Ghisalba, O., Cevey, P., Kuenzi, M. and Schar, H. P. (1985). Biodegradation of chemical waste by specialized methylotrophs, an alternative to physical methods of waste disposal. Conserv. Recycl. 8, 47-71.
Ginzburg, B., Chalifa, I., Hadas, O., Dor, I. and Lev, O. (1999). Formation of dimethyloligosulfides in lake Kinneret. Wat. Sci. Technol. 40 (6), 73-78.
Glowiak, B. J., Grefen, K., Jüngten, H., Kirchner, K., Pilarczyk, E., Sporenberg, F. and Weber, E. (1985). In: Suess, M. J., Grefen, K., Reinish, D. W. (Eds.), Ambient Air Pollutants for Industrial Sources. New York: Elsevier, pp. 708-713.
Gobetti, M., Fox, P. F. and Stepaniak, L. (1996). Isolation and Characterization of a Tributyrin Esterase from Lactobacillus plantarum 2739. Journal of Dairy Science 80 (12), 3099- 3106.
Gobetti, M., Smacchi, E. and Corsetti, A. (1997). Purification and characterization of a cell surface-associated esterase from Lactobacillus fermentum DT41. International Dairy Journal 7 (1), 13-21.
Guest, I. and Varma, D. R. (1992). Teratogenic and macromolecular synthesis inhibitory effects of trimethylamine on mouse embryos in culture. J. Toxicol. Environ. Health 36, 27-41.
Hacking, A. J. (1987). Economic aspects of biotechnology, Cambridge studies in biotechnology. Edited by Cambridge University Press, Cambridge.
Chapter 7 References __________________________________________________________________________
111
Hashimoto, K. and Aldridge, W. N. (1970). Biochemical studies on acrylamide, a neurotoxic agent. Biochem.Pharmacol. 19, 2591-2604.
Hathaway, G. J., Proctor, N. H., Hughes, J. P. and Fischman, M. L. (1991). Proctor and Hughes' chemical hazards of the workplace. 3rd ed. New York, NY: Van Nostrand Reinhold.
Hong, T., Butler, W. R., Hollis, F., Floyd, M. M., Toney, S. R., Tang, Y. W., Steele, C. and Leggiadro, R. J. (2003). Characterization of a Novel Rapidly Growing Mycobacterium Species Associated with Sepsis. Journal of Clinical Microbiology 41 (12), 5650-5653.
Hunter, P. and Oyama, S. T. (2000). Control of Volatile Organic Compound Emissions: Conventional and Emerging Technologies. New York: Wiley.
Hwang, Y., Matsuo, T., Hanaki, K. and Suzuki, N. (1994). Removal of odorous compounds in wastewater by using activated carbon, ozonation and aerated biofilter. Water Res. 28, 2309-2319.
IARC (International Agency for Research on Cancer) (1986). Some Chemicals used in Plastics and Elastomers. IARC Evaluation of the Carcinogenic Risk of Chemicals to Humans Vol. 39 (sup 7), 81-98.
Järvinen, P. (1998). Headache and blood pressure among triethylamine-exposed foundry workers. Occup. Med. Vol. 48, 113-117.
Järvinen, P., Engström, K., Riihimäki, V., Ruusuvaara, P. and Setälä, K. (1999). Effects of experimental exposure to triethylamine on vision and the eye. Occup. Environ. Med. Vol. 56 (1), 1-5.
Kämpfer, P., Martin, E., Lodders, N. and Jäckel, U. (2009). Transfer of Defluvibacter lusatiensis to the genus Aquamicrobium as Aquamicrobium lusatiense comb. nov. and description of Aquamicrobium aerolatum sp. nov. International Journal of Systematic and Evolutionary Microbiology 59, 2468-2470.
Kapahi, R. and Gross, M. (1995). Biofiltration for VOC and ammonia emissions control. Biocycle (February), 87-90.
Kawahara, K., Yakabe, Y., Ohide, T. and Kida, K. (1999). Evaluation of laboratory-made sludge for an anaerobic biodegradability test and its use for assessment of 13 chemicals. Chemosphere 39 (12), 2007-2018.
Kelly, D. P., Wood, A. P., Jordan, S. L., Paddent, A. N., Gorlenko, V. M. and Dubinina, G. A. (1994). Biological production and consumption of gaseous organic sulphur compounds. Biochem. Soc. Trans. 22 (4), 1011-1015.
Kennes, C. and Veiga, M. C. (2001). Bioreactors for Waste Gas Treatment. London: Kluwer Academic Publishers.
Kim, S. G., Bae, H. S. and Lee, S. T. (2001). A Novel denitrifying bacteria isolated that degrades trimethylamine both aerobically and anaerobically via two different pathways. Arch. Microbiol. 176, 271-277.
King, G. M. (1984). Metabolism of trimethylamine, choline, and glycine betaine by sulfate-reducing and methanogenic bacteria in marine sediments. Appl. Environ. Microbiol. 48, 719-725.
Chapter 7 References __________________________________________________________________________
112
Kleeberg, K. K., Liu, Y., Jans, M., Schlegelmilch, M., Streese, J., and Stegmann, R. (2005). Development of a simple and sensitive method for the characterization of odorous waste gas emissions by means of solid-phase microextraction (SPME) and GC-MS/olfactometry. Waster Management 25, 872-879.
Kulakova, L., Galkin, A., Nakayama, T., Nishino, T. and Esaki, N. (2004). Cold-active esterase from Psychrobacter sp. Ant300: Gene cloning, characterization, and the effects of Gly-->Pro substitution near the active site on its catalytic activity and stability. Biochem Biophys Acta 1696, 59-65.
Kusunose, M., Kusunose, E., Yano, I., Toriyama, S., Saito, H. and Tsukamura, M. (1979). Kekkaku 54: 219-220.
Large, P. J. and Haywood, G. W. (1981). Methylophilus methylotrophus grows on methylated amines. FEMS Microbiol. Lett. 11, 207-209.
Large, P. J. (1983). In: Cole, J. A., Knowles, C. J., Schlessinger, D. D. (Eds.), Methylotrophy and Methanogenesis. Workingham: Van Nostrand Reinhold.
Layne, E. (1957). Spectrophotometric and turbidometric methods for measuring proteins. Analytical Biochemistry 3, 447-454.
Lewandowski, G. A. and DeFilippi, L. J. (1998). Biological Treatment of Hazardous Wastes. New York: Wiley.
Lin, J. K. and Hurng, D. C. (1989). Potentiation of ferrous sulphate and ascorbate on the microbial transformation of endogenous trimethylamine N-oxide to trimethylamine and dimethylamine in squid extracts. Food Chem. Toxicol. 27 (9), 613-618.
Liston, J., Wiebe, W. and Colwell, R. R. (1963). Quantitative approach to the study of bacterial species. J. Bacteriol. 85, 1061-1070.
Lloyd, J. (2006). The Book of General Ignorance. Faber and Faber Limited.
Lobo, N., Rebelo, A., Partidário, P. J. and Roseiro, J. C. (1997). A bubble column continuous fermentation system for trimethylamine conversion by Aminobacter aminovorans. Enzyme Microb. Technol. 21, 191-195.
Loginova, N. V. and Trotsenko, Y. A. (1975). Facultative methylotroph belonging to the genus Arthrobacter. Mikrobiologya 43, 831-836.
Long, C. (1961). Biochemist’s handbook. London, England: Roy. Coll. Surgeons.
Lopez-Caballero, M. E., Sanchez-Fernandez, J. A. and Moral, A. (2001). Growth and metabolic activity of Shewanella putrefaciens maintained under different CO2 and O2 concentrations. Int. J. Food Microbiol. 64 (3), 277-287.
Luch, K. (April 1994). Biofiltration makes the organics go down biofilters remove low level organics from coater exhausts. Chem. Eng. (April), 153.
Lundqvist, G. R., Yamagiwa, M., Pedersen, O. F. and Nielsen, G. D. (1992). Inhalation of diethylamine-acute nasal effects and subjective response. Am. Ind. Hyg. Assoc. J. 53 (3), 181-185.
Chapter 7 References __________________________________________________________________________
113
Lundstrom, R. C. and Racicot, L. D. (1983). Decomposition in foods: Gas chromatographic determination of dimethylamine and trimethylamine in seafoods. J. Assoc. Off. Anal. Chem. 66 (5), 1158-1163.
Lynch, D. W., Moorman, T. R., Lewis, P., Stober, P., Hamlin, R. and Scheuler, R. L. (1990). Subchronic inhalation of triethylamine vapor in Fischer-344 rats: Organ system toxicity. Toxicol. Ind. Health 6 (3/4), 403-414.
Mackie, R. I., Stroot, P. G. and Varel, V. H. (1998). Biochemical identification and biological origin of key odour components in livestock waste. J. Anim. Sci. 76, 1331-1342.
Matz, G., Schröder, W. and Ollesch, T. (2005). New methods for fast on-site measurement of odorous compounds. Waste Management 25, 864-871.
Matz, G., Schröder, W. and Ollesch, T. (2004). Schnelle Vor-Ort-Analytik von Gerüchen mittels Sensornearrays und Massenspektrometer. Erfassung und Minimierung von Gerüchen. In: Niemeyer, B., Robers, A. and Thiesen, P. (Eds.), Messung und Minimierung von Gerüchen, Hamburger Berichte 23, Verlag Abfall aktuell, Stuttgart, Germany, 91-108.
Meiberg, J. M. (1979). Metabolism of methylated amines in Hyphomicrobium spp. Ph.D. Thesis. University of Groningen, The Netherlands.
Meiberg, J. B. M. and Harder, W. (1978). Aerobic and anaerobic metabolism of trimethylamine, dimethylamine and methylamine in Hyphomicrobium X. J. Gen. Microbiol. 106, 265-276.
Miller, R. R., Ayres, J. A., Rampy, L. W. and McKenna, M. J. (1981). Metabolism of acrylate esters in rat tissue homogenates. Fundam. Appl. Toxicol. 1, 410-414.
Moeser, A. J., See, M. T., Van Heugten, E., Morrow, W. E. and Van Kempen, T. A. (2003). Diet and evaluators affect perception of swine waste odour: An educational demonstration. J. Anim. Sci. 81 (12), 3211-3215.
Mosier, A. R., Andre, C. E. and Viets, F. G. Jr. (1973). Identification of aliphatic amines volatilized from cattle feedyard. Environ. Sci. Technol. 7, 642-644.
Mottram, D. S. (1991). Meat. In: Maarse, H. (Ed), Volatile Compounds in Foods and Beverages. Marcel Dekker, Inc., New York, USA, 107-177.
Mouné, S., Manac’h, N., Hirschler, A., Caumette, P., Willison, J. C. and Matheron, R. (1999). Haloanaerobacter salinarius sp. nov., a novel halophilic fermentative bacterium that reduces glycine-betaine to trimethylamine with hydrogen or serine as electron donors; emendation of the genus Haloanaerobacter. Int. J. Syst. Bacteriol 49, 103-112.
Myers, P. A. and Zatmann, L. J. (1971). The metabolism of trimethylamine N-oxide by Bacillus PM6. Biochem. J. 121, 10.
Nelson, M. and Bull, R. (1990). Triethylamine. Ethel Browning’s Toxicity and Metabolism of Industrial Solvents 2, 129-133.
NIOSH. (National Institute of Occupational Safety and Health) (1981). NIOSH/OSHA Occupational Health Guidelines for Chemical Hazards. Publication No. 2, 81-123.
Chapter 7 References __________________________________________________________________________
114
Ohara, M., Katayama, Y., Tsuzaki, M., Nakamoto, S. and Kuraishi, H. (1990). Paracoccus kocurii sp. nov., a tetramethylammonium assimilating bacterium. Int. J. Syst. Bacteriol. 40, 292-296.
Otto, K. (2001). Characterization of a Thermostable Alkane Oxidising System. Berlin: Logos.
Palica, M. and Walus, J. (1998). Application of selected natural beds in deodorization of triethylamine. Part II. Biodegradation rate and deodorization effectiveness. Chem. Biochem. Eng. Q. 12 (1), 37-43.
Passant, N. R., Richardson, S. J., Swannel, R. P. J., Woodfield, M., van der Lugt, J. P., Wolsink, J. H., Hecht, V., Brebbermann, D. and Bischoff, H. (1992). Biodegradability of the volatile organic compound (VOC) emissions from the food, drink and metal degreasing industries. In: Dragt, A. J., van Ham, J. (Eds), Biotechniques for Air Pollution Abatement and Odour Control Policies International Symposium 1991 (pp.315-320), Delft, The Netherlands: Elsevier.
Pietsch, J., Sacher, F., Schmidt, W. and Brauch, H. (2001). Polar nitrogen compounds and their behaviour in the drinking water treatment process. Water Res. 35 (15), 3537-3544.
Potokar, M., Grundler, O. J., Heusener, A., Jung, R., Mürmann, P., Schöbel, C., Suberg, H. and Zechel, H. K. (1985). Studies on the design of animal tests for the corrosiveness of industrial chemicals. Fd. Chem. Toxicol 23, 615-617.
Prentis. (1989). Biotechnology, A new industrial revolution. Edited by G. Braziller. New York.
Quora, F. (2006). Isolation and characterization of new psychrophilic bacteria; Cloning and characterization of industrial relevant pullulanase and serine protease. Hamburg-Harburg: Techn. Univ., Institut für Technische Mikrobiologie.
Rafson, H. J. (1998). Odor and VOC Control Handbook. New York, USA: McGraw-Hill Professional.
Ranau, R. and Steinhart, H. (2004). Bewertung und Quantifizierung von Leitsubstanzen aus der geruchstragenden Abluft von Lebensmittelbetrieben und der Ferkelaufzucht. Erfassung und Minimierung von Gerüchen. In: Niemeyer, B., Robers, A. and Thiesen, P. (Eds.), Messung und Minimierung von Gerüchen, Hamburger Berichte 23, Verlag Abfall aktuell, Stuttgart, Germany, 147-165.
Rappert, S. and Müller, R. (2005b). Microbial degradation of selected odorous substances. Waste Management 25, 940-954.
Rappert, S. and Müller, R. (2005a). Odour compounds in waste gas emissions from agricultural operations and food industries. Waste Management 25, 887-907.
Rappert, S., Ayoub, R., Li, R., Botsch, K., Obi, I. and Müller, R. (2004). Biologischer Abbau von geruchsaktiven Einzelstoffen und von realen Vielstoffgemischen. Erfassung und Minimierung von Gerüchen. In: Niemeyer, B., Robers, A., Thiesen, P. (Eds.), Messung und Minimierung von Gerüchen, Hamburger Berichte 23. Verlag Abfall aktuell, Stuttgart, Germany, 203-220.
Rechenberger, J. (1940). Über die fluchtigen Alkylamine im menschlichen Stoffwechsel.II Mitteilung: Ausscheidung im Ham nach oraler Zufuhr. Z Physiol Chem 265, 275-284.
Chapter 7 References __________________________________________________________________________
115
Reichert, K., Lipski, A., Pradella, S., Stackebrandt, E. and Altendorf, K. (1998). Pseudonocardia asaccharolytica sp. nov. and Pseudonocardia sulfidoxydans sp. nov., two new dimethyl disulfide-degrading actinomycetes and emended description of the genus Pseudonocardia. Int. Journal of Systematic Bacteriology. Vol. 48 Pt 2, 441-449.
Reilly, M. J., Rosenman, K. D., Abrams, J. H., Zhu, Z., Tseng, C. Y., Hertzberg, V. and Rice, C. (1995). Ocular effects of exposure to triethylamine in the sand core cold box of a foundry. Occupational and Environmental Medicine. 52, 337-343.
Rosenfeld, P. E., Henry, C. L. and Benett, D. (2001). Wastewater dewatering polymer affect on biosolids odour emissions and microbial activity. Water Environ. Res. 73 (3), 363-367.
Sambrook, J. and Russel, D. (2001). Molecular Cloning: a laboratory manual. New York: Cold Spring Harbor Laboratory Press, Cold Spring Harbor.
Sandberg, M. and Ahring, B. (1992). Anaerobic treatment of fish meal process waste-water in UASB reactor at high pH. Appl. Microbiol. Biotechnol. 36, 800-804.
Schlegelmilch, M., Streese, J. and Stegmann, R. (2005). Odour management and treatment technologies: An overview. Waste Management 25, 928-939.
Seubert, W. (1959). Degradation of isoprenoid compounds by microorganisms I. Isolation and characterization of an Isoprenoid-degradaing bacterium, Pseudomonas citronellolis n.sp. J Bacteriol 79, 426-434.
Seubert W. and Remberger U. (1961). Purification and mechanism of action of pyruvate carboxylase from Pseudomonas citronellolis. Biochem Z. 334, 401-14.
Sheridan, B. A., Curran, T. P. and Dodd, V. A. (2003). Biofiltration of n-butyric acid for control odour. Bioresour. Technol. 89 (2), 199-205.
Shin, H. D. and Chen, R. R. (2007). A type B feruloyl esterase from Aspergillus nidulans with broad pH applicability. Appl Microbiol Biotechnol 73, 1323-1330.
Shirkot, C., Shirkot, P. and Gupta, K. (1994). Isolation from soil and growth characteristics of the tetramethylthiuram disulfide (TMTD) degrading strain of Pseudomonas aeruginosa. J. Environ. Sci. Health 29, 605-614.
Silver, E. H. and Murphy, S. D. (1981). Potentiation of acrylate ester toxicity by prior treatment with carboxylesterase inhibitor triorthololyl phosphate (TOTP). Toxicol Appl. Pharmacol 57, 271-278.
Smith, A. E. and Aubin, A. J. (1992). Breakdown of [14C]dimethylamine in soils. J. Agric. Chem. 40, 2299-2301.
Smith, J. E. (1990). Biotechnology. Edited by E. Arnold. A division of Holder and Stoughton, London.
Sorgi, K. L. (2001). “Triethylamine” in Encyclopedia of Reagents for Organic Synthesis. New York: John Wiley & Sons.
Stott, W. T. and McKenna M. J. (1985). Hydrolysis of several glycol ether acetates and acrylate esters by nasal mucosal carboxylesterase in vitro. Fundam. Appl. Toxicol 5, 399-404.
Chapter 7 References __________________________________________________________________________
116
Stott, W. T. and McKenna, M. J. (1984). The comparative absorption and excretion of chemical vapors by the upper, lower and intact respiratiory tract of rats. Fundam. Appl. Toxicol. 4 (4), 594-602.
Strack, E., Bemm, H. and Rotsch, W. (1963). Trimethylamin und Trimethylaminoxyd im Harn nach Zufuhr von '4N- und 5N-(-)-Carnitin. Acta Biol Med Germ 11, 14-28.
Strikauska, S., Zarina, D., Berzins, A. and Viesturs, U. (1999). Biodegradation of ammonia by two stage biofiltration system. Environ Eng policy 1, 175-182.
Sun, L., Zhang, S. q. and Zhong, D. f. (2004). In vitro identification of metabolites of verapamil in rat liver microsomes. Acta Pharmacol Sin 25 (1), 121-128.
Sunesson, A. L., Vaes, W. H. J., Nillson, C. A., Blomquist, G., Andersson, B. and Carlson, R. (1995). Identification of volatile metabolites from five fungal species cultivated on two media. Appl. Environ. Microbiol. 61, 2911.
Tang, H. M., Hwang, S. J. and Hwang, S. C. (1996). Waste gas treatment in biofilters. Air Waste Manage. Assoc. 46, 349-354.
Tate, R. L. and Alexander, M. (1976). Microbial formation and degradation of dimethylamine. Appl. Environ. Microbiol. 31, 399-403.
Tomita, B., Inoue, H., Chaya, K., Nakamura, A. and Hamamura, N. (1987). Identification of dimethyl disulfide-forming bacteria isolated from activated sludge. Appl. Environ. Microbiol. 53, 1541-1547.
Torkian, A., Keshavarzi Shirazi, H. and Azimi, A. (2005). Effects of Operational Conditions on the Performance of Triethylamine Biofiltration. Iranian J. Env. Health. Sci. Eng. Vol. 2 No. 2, 31-40.
Tsukamura, M., Van Der Meulen, H. J. and Grabow, W. O. K. (1983). Numerical Taxonomy of Rapidly Growing, Scotochromogenic Mycobacteria of the Mycobacterium parafortuitum Complex: Mycobacterium austroafricanum sp. nov. and Mycobacterium diernhoferi sp. nov., nom. rev. International Journal Of Systematic Bacteriology 33 (3),460-469.
Udinsky, J. R. and Frederick, C. B. (1989). The enzymatic hydrolysis of ethyl acrylate by rat tissue homogenates. The Toxicologist 9, 238.
Urakami, T., Kobayashi, H. and Araki, H. (1990). Isolation and identification of N,N-dimethylformamide-biodegrading bacteria. J. Ferment. Bioeng. 1, 45-47.
Valentin, F. H. H. and Norh, A. A. (1980). Odour Control: A Concise Guide. Warren Spring Laboratory, Herefordshire, England.
Van Agteren, M. H., Keuning, S. and Janssen, D. B. (1998). Handbook on Biodegradation and Biological Treatment of Hazardous Organic Compounds. Kluwer Academic Publishers, London.
Verma, D. K., Shaw, D. S., DesTombe, K., Linkert, L. M., Johnson, D. M., Shaw, M. L. and Nieboer, E. (1994). Health Hazard Assessment of Enhanced Protection Carbon - Method Development, Validation and Field Trial. Department of National Defence, Ottawa, Canada, 107.
Chapter 7 References __________________________________________________________________________
117
Verma, S. and Eckstein, F. (1998). Assessment of Triethylamine and Diethylamine Emission from Military Gas Mask Canisters. Ann Occup Hyg 42, 325-330.
Visscher, P. and Taylor, B. F. (1993b). A new mechanism for the aerobic catabolism of dimethyl sulfide. Appl. Environ. Microbiol. 59 (11), 3784-3789.
Visscher, P. and Taylor, B. F. (1993a). Aerobic and anaerobic degradation of a range of alkyl sulfides by denitrifying marine bacterium. Appl. Environ. Microbiol. 59 (12), 4083-4089.
Waldbott, G. L. (1973). Health Effects of Environmental Pollutants. St. Louis, MO: G.V. Mosby Co.
Walles, M., Thum, T., Levsen, K. and Borlak, J. (2003). Metabolism of verapamil: 12 new phase I and phase II metabolites identified in cell cultures of rat hepatocytes by liquid chromatography-tandem mass spectrometry. Journal of Chromatography B 798, 265-274.
Wang, C. C., Lu, K. L. and Chen, X. Y. (2006). Removal of triethylamine from synthetic wastewater by acclimated mixed bacteria cultures. International Biodeterioration & Biodegradation 59, 202-205.
Wani, A. H., Lau, A. K. and Branion, R. M. R. (1999). Biofiltration control of pulping odors hydrogen sulfide: Performance, macrokinetics and coexistence effects of organo-sulfur species. J. Chem. Technol Biotechnol 74, 9-15.
Warren, D. W. and Selchan, D. F. (1988). An industrial hygiene appraisal of triethylamine and dimethylamine exposure limits in the foundry industry. Am. Ind. Hyg. Assoc. J. 49(12), 630-634.
Widdel, F. and Pfennig, N. (1981). Studies on Dissimilatory Sulfate-Reducing Bacteria that Decompose Fatty Acids. Arch. Micro. 129, 395-400.
Williams, T. O. and Miller, F. C. (1992). Biofilters and facility operations. Biocycle (November) , 75-79.
Yanchinski, S. (1985). Setting genes to work: The industrial era of biotechnology. Edited by Viking, London.
Yoon, I. K. and Park, C. H. (2002). Effects of gas flow rate, inlet concentration and temperature on biofiltration of volatile organic compounds in a peat packed biofilter. J Biosci Bioeng 93, 165-211.
Yoshida, T., Ono, Y., Muto, S., Nagaoka, K., Taniwaki, H., Imaeda, T. Kamei, T. and Kurita, H. (2001). Visual Disturbances among Workers Exposed to Triethylamine in a Foundry in Japan. J Occup Health 43, 199–200.
Zhu, J. (2000). A review of microbiology in swine manure odour control. Agric. Ecosystems and Environ 78, 93-106.
Zimmerman, B. K. (1984a). Biofuture: Confronting the genetic era. Edited by Plenum press, London.
Zimmerman, B. K. (1984b). Trends in biotechnology. Edited by UNIDO, Vienna.
Chapter 7 References __________________________________________________________________________
118
Zwart, K. B. and Harder, W. (1983). Regulation of the metabolism of some alkylated amines in the yeast extract Candida utilis and Hansenula polymorpha. J. Gen. Microbiol. 129, 3157-3169.
Chapter 7 References __________________________________________________________________________
119
7.2 Online References
Online 1 Available from: http://www.osha.gov/SLTC/healthguidelines/ethylacrylate/recognition.html [Accessed 24 March 2011] Online 2 Available from: http://en.wikipedia.org/wiki/Ethyl_acrylate [Accessed 24 March 2011] Online 3 Available from: http://www.inchem.org/documents/iarc/vol39/ethylacrylate.html [Accessed 24 March 2011] Online 4 Available from: http://www.probertencyclopaedia.com/cgi-bin/res.pl?keyword=Ethyl+Acrylate&offset=0 [Accessed 24 March 2011] Online 5 Available from: http://www.medterms.com/script/main/art.asp?articlekey=13298 [Accessed 24 March 2011] Online 6 Available from: http://ntp.niehs.nih.gov/files/EthylAcryl.pdf [Accessed 24 March 2011] Online 7 Available from: http://www.lakes-environmental.com/toxic/ETHYL_ACRYLATE.HTML [Accessed 24 March 2011] Online 8 Available from: http://toxsci.oxfordjournals.org/cgi/content/abstract/9/3/389 [Accessed 24 March 2011] Online 9 Available from: http://www.intox.org/databank/documents/chemical/ethylacr/iarc559.htm [Accessed 24 March 2011] Online 10 Available from: http://nj.gov/health/eoh/rtkweb/documents/fs/0843.pdf [Accessed 24 March 2011]
Chapter 7 References __________________________________________________________________________
120
Online 11 Available from: http://findarticles.com/p/articles/mi_hb3143/is_200009/ai_n7832957 [Accessed 24 March 2011] Online 12 Available from: http://www.fao.org/ag/agn/jecfa-flav/details.html?flavId=4570 [Accessed 24 March 2011] Online 13 Available from: http://www.patentgenius.com/patent/4490553.html [Accessed 24 March 2011] Online 14 Available from: http://tpx.sagepub.com/cgi/content/full/33/6/631 [Accessed 24 March 2011] Online 15 Available from: http://www.epa.gov/ttn/atw/hlthef/ethylacr.html [Accessed 24 March 2011] Online 16 Available from: http://ec.europa.eu/employment_social/health_safety/docs/sum_047.pdf [Accessed 24 March 2011] Online 17 Available from: http://www.amberlyst.com/acrylate.htm [Accessed 24 March 2011] Online 18 Available from: http://en.wikipedia.org/wiki/Triethylamine [Accessed 24 March 2011] Online 19 Available from: http://msds.chem.ox.ac.uk/TR/triethylamine.html [Accessed 24 March 2011] Online 20 Available from: http://www.scorecard.org/chemical-profiles/summary.tcl?edf_substance_id=121-44-8 [Accessed 24 March 2011] Online 21 Available from: http://www.lakes-environmental.com/toxic/TRIETHYLAMINE.HTML [Accessed 24 March 2011]
Chapter 7 References __________________________________________________________________________
121
Online 22 Available from: http://chemicalland21.com/industrialchem/organic/TRIETHYLAMINE.htm [Accessed 24 March 2011] Online 23 Available from: http://www.epa.gov/iris/subst/0520.htm [Accessed 24 March 2011] Online 24 Available from: http://www.epa.gov/ttn/atw/hlthef/tri-lami.html [Accessed 24 March 2011] Online 25 Available from: http://nj.gov/health/eoh/rtkweb/documents/fs/1907.pdf [Accessed 24 March 2011] Online 26 Available from: http://www.piercenet.com/Products/Browse.cfm?fldID=02040622 [Accessed 24 March 2011] Online 27 Available from: http://phyvirtual.nju.edu.cn/material/MSDS/G82.pdf [Accessed 24 March 2011] Online 28 Available from: http://www.taminco.com/content/view/174/153/ [Accessed 24 March 2011] Online 29 Available from: http://www.ilo.org/public/english/protection/safework/cis/products/icsc/dtasht/_icsc02/icsc0203.htm [Accessed 24 March 2011] Online 30 Available from: http://www.jtbaker.com/msds/englishhtml/t5330.htm [Accessed 24 March 2011] Online 31 Available from: http://www.oehha.org/air/chronic_rels/pdf/121448.pdf [Accessed 24 March 2011] Online 32 Available from: http://www.balajiamines.com/pdf/TRIETHYLAMINE%20(TEA).pdf [Accessed 24 March 2011]

__________________________________________________________________________
CURRICULUM VITAE
Surname Alayoub
Name Rita Issa Numeir
Date of Birth 21.03.1967
Place of Birth Ramallah, Palestine (Jordanian National)
Email [email protected]
01.2002 - present Freelance at different Market Research companies in Hamburg: GFK, ASK, Inra, Ipsos, Konkret; Freelance in English (business, technical, scientific and medical) at different companies and institutes: Küllmer GmbH, Hauni, Körber-Foundation, and others
04.2011 - 06.2012 Freelance work for Blinckmann Languages and Marketing: Personal trainer and coach in English
09.2001 - 01.2012 Ph.D. in the Department of Technical Biocatalysis, Technical University, Hamburg-Harburg, Germany: “Isolation and Characterization of New Triethylamine and Ethyl Acrylate Degrading Bacteria”
09.2010 - 03.2011 Freelance work for Grone School, Hamburg: Lecturer in Chemistry, Biology, Mathematics and English
01.2000 - 08.2001 Further scientific training in microbiology. Project: “Der Einsatz thermophiler Mikroorganismen zur produktionsintegrierten Reinigung fetthaltiger Abwässer in der Lebensmittelindustrie”, Technical University, Hamburg-Harburg, Germany
03.1999 - 09.1999 German language courses, Kreuzberg Sprachschule, Bonn, Germany
09.1998 - 02.1999 German language courses, Goethe Institute, Amman, Jordan
09.1996 - 06.1998 Ph.D. course work and teaching assistant at the Department of Chemistry, University of Jordan, Amman, Jordan
09.1992 - 06.1996 M.Sc. in the Department of Chemistry at Yarmouk University-Jordan: “The Catalytic Properties of Some Metallic Alloys Prepared by Impregnation and Chemical Precipitation”
09.1989 - 06.1992 B.Sc. continuation (after interruption by The First Palestinian Uprising) in the Department of Chemistry at Yarmouk University-Jordan
09.1984 - 06.1989 B.Sc. in the Department of Chemistry at Birzeit University, Birzeit, Palestine (interrupted by The First Palestinian Uprising)
09.1978 - 06.1984 Primary and High School education at the American Friends Girls School (F.G.S.) in Ramallah, Palestine
09.1972 - 06.1978 Elementary School education at the Greek Catholic School of Our Lady Annunciation in Ramallah, Palestine