Embed Size (px)
Citation preview

15 (2) 2016
ISSN 1644-0757eISSN 2450-4602

ACTA SCIENTIARUM POLONORUMCzasopismo naukowe założone w 200l roku przez polskie uczelnie rolniczeScientifi c Journal established in 2001 by Polish Life Sciences Universities
Oeconomia
Economics
Ekonomia
15 (2) 2016
Bydgoszcz Kraków Lublin OlsztynPoznań Siedlce Szczecin Warszawa Wrocław

Acta Scientiarum Polonorum Programming Board
Wiesław Nagórko (Warszawa), Ryszard Źróbek (Olsztyn), Józef Bieniek (Kraków), Krzysztof Szkucik (Lublin), Ewa Sobecka (Szczecin),
Janusz Prusiński (Bydgoszcz), Jerzy Sobota (Wrocław) – chairman,Stanisław Socha (Siedlce), Waldemar Uchman (Poznań)
Oeconomia Scientifi c Board
Carol J. Cumber (South Dakota State University, Brookings, USA), Roman Kisiel (University of Warmia and Mazury, Olsztyn, PL),
Joseph Andrew Kuzilwa (Mzumbe University, Tanzania),Lubos Smutka (Czech University of Life Sciences, Prague, CZ),
Wiesław Musiał (University of Agriculture in Krakow, Kraków, PL),Janina Sawicka (Warsaw University of Life Sciences – SGGW, Warszawa, PL)
– chairperson,Harun Uçak (Muğla Sıtkı Koçman University, Muğla, TR),
Dorota Witkowska (University of Łodz, Łódź, PL)Andra Zvirbule-Bērziņa (Latvia University of Agriculture, LV)
Editing committee
Jan Kiryjow – Warsaw University of Life Sciences PressPaulina Stolarczyk (WULS-SGGW) – Oeconomia secretary
Paulina Tuka (WULS-SGGW) – Oeconomia secretaryMarcin Chciałowski (WULS-SGGW) – Oeconomia secretary
Renata Marks-Bielska – University of Warmia and Mazury in Olsztyn – thematic editor,Tomasz Wojewodzic – University of Agriculture in Krakow – thematic editor,
Wojciech Pizło – WULS-SGGW – thematic editor,Iwona Pomianek – WULS-SGGW – thematic editor,
Aleksandra Matuszewska-Janica – WULS-SGGW – statistical editor,Kuo-Liang “Matt” Chiang – South Dakota State University – language consultant
The printed version of Acta Scientiarum Polonorum Oeconomia is an initial version of the journal
Editorial staff Dominika Cichocka, Anna Dołomisiewicz, Laura Szczepańska
ISSN 1644-0757, eISSN 2450-4602Edition: 200 prints
© Copyright by Warsaw University of Life Sciences PressWydawnictwo SGGW, ul. Nowoursynowska 166, 02-787 Warszawa
tel. 22 593 55 20 (-22; -25 – sprzedaż), fax 22 593 55 21e-mail: [email protected]
www.wydawnictwosggw.pl
Print: Agencja Reklamowo-Wydawnicza A. Grzegorczyk, www.grzeg.com.pl
From the Scientifi c Board
There has been the fi fteenth year of the Acta Scientiarum Polonorum Oeconomia publishing. The Acta is the periodical including several thematic series with uniform graphics and similar format. The publication was set up by group of enthusiasts – em-ployees of life sciences universities and has been published under the patronage of rectors of these universities. Constant involvement of academic society in increasing substantive and editorial level of the series, with efforts of the authors, the Programming Board and the Scientifi c Boards, has contributed to placing the Acta Scientiarum Polonorum (and our Oeconomia series) on the noticeable position in academic research society. Articles can be prepared in English with Polish title, abstract and keywords. Moreover, we publish latest issues in English only. The Scientifi c Board of the Oeconomia series, concerning the publication range, focuses its attention both on substantive content and precision of the form. The articles are revised in “double-blind review” process. Whole content of the Acta Scientiarum Polonorum Oeconomia is available in electronic version on the follow-ing website http://acta_oeconomia.sggw.pl. We are glad to inform that Acta Scientiarum Polonorum Oeconomia are indexed within the AGRIS-FAO, EBSCO, SIGŻ, Copernicus Index, AGRO, BazEkon, POL-index. Since 2015 each article published in Acta Sci. Pol. Oeconomia has 15 points at the Ministry of Science and Higher Education ranking list.
Please send the articles on one of following e-mail addresses:
While sending a printout, please attach also the electronic version on CD or DVD. Letters including note “the Acta Scientiarum Polonorum Oeconomia” should be sent on the following address:
Prof. dr hab. Janina SawickaDepartment of European Policy, Public Finances and MarketingFaculty of Economic SciencesWarsaw University of Life SciencesNowoursynowska 166, 02-787 Warsaw, Polandtel.: (+4822) 593 40 70; fax: (+4822) 593 40 77
Yours sincerelyJanina SawickaChairperson of the Scientifi c Board of the Acta Sci. Pol. Oeconomia series


Oeconomia 15 (2) 2016, 5–14
CORPORATE SOCIAL RESPONSIBILITY AS PART OF COMPANY IMAGE MANAGEMENT IN BANKING INSTITUTIONS
Dorota Bednarska-OlejniczakWroclaw University of Economics
Abstract. The scope and the predominant approaches to corporate social responsibil-ity (CSR) are discussed, as employed by the leading Polish retail banking institutions at present, together with analyses of the impact made by CSR activities upon the business image of banks as institutions of public trust. This study was based on critical analyses of available literature on corporate social responsibility, banking and marketing, and analy-ses of secondary sources on CSR activities employed by retail banks. Secondary data was obtained from offi cial CSR reports and announcements published on the webpages of se-lected banking institutions in Poland. The study confi rmed the involvement of all banks in CSR-related activities in all four areas specifi ed in the provisions of the ISO 26000 standard and the Global Compact initiative quidelines, namely: responsible approach to customers and markets, activities addressed to employees, support for local communities, and protec-tion of natural environment. The analysis of specialist rankings and offi cial CSR reports seems to confi rm the strategic character of the CSR activities employed by the selected representatives of the banking sector.
Key words: corporate social responsibility, retail banking, company image
INTRODUCTION
Over the recent years, the involvement of banks in activities related to corporate social responsibility (CSR) has followed a steady development trend. For many banking institu-tions, activities of this type are no longer perceived as short-term, immediate tactics, but as an important element of the company strategic orientation in the long-term realisation of specifi c business objectives. Due to its perceived signifi cance, CSR activities have
Corresponding author: Dorota Bednarska-Olejniczak, Wroclaw University of Economics – UE Wrocław, Faculty of Economic Sciences, Institute of Marketing, Komandorska 118/120, 53-345 Wrocław, Poland, e-mail: [email protected]© Copyright by Warsaw University of Life Sciences Press, Warsaw 2016
ISSN 1644-0757eISSN 2450-4602
http://acta_oeconomia.sggw.pl

6 D. Bednarska-Olejniczak
Acta Sci. Pol.
stimulated avid interest in the scientifi c community, with major studies by Ararat [2007], Yiannaki [2010], Islam [2012], Azim et al. [2014]. It seems that one of the more impor-tant reasons for the incorporation of CSR strategies by banking institutions is their poten-tial for improving company competitive advantage1. One of the ways for banks to achieve market advantage is to concentrate on building a strong company brand and a positive corporate image. Studies by Sen and Bhattacharya [2001] and Fatma et al. [2015], seem to confi rm that CSR activities can be a viable instrument in the realisation of the above objective2. This study presents analyses of CSR practices employed by the leading Polish retail banking institutions as part of their image-building strategies. The study was de-signed to test the following hypotheses: (1) the leading retail banks employ corporate so-cial responsibility practices in all four of the key areas defi ned in the ISO 26000 standard and the Global Compact priorities; (2) CSR-related activities are strategic in character – they are not intended to address immediate, short-term perspectives, but designed to provide continuous, durable, long-term effects; (3) corporate social responsibility may be considered an important instrument for shaping and managing corporate identity of bank-ing institutions, and – as such – will be referenced in formal mission statements.
SOURCE MATERIAL AND RESEARCH METHODS
The study is based on critical analyses of professional literature on corporate social re-sponsibility, banking and marketing, and analyses of secondary sources on CSR activities employed by retail banks. Secondary sources include offi cial CSR reports and announce-ments published on the webpages of selected banking institutions in Poland. Working on the assumption that directions of CSR development in banking industry are set by the most experienced and the most successful adopters of CSR strategies (as measured by their position in various CSR rankings and by the number of awards received), the reference point for this study was structured in accordance with the expert CSR Ranking of Banks in Poland of 2014, and the Ranking of Responsible Companies for the period of 2012–2014. The analysis involved an examination of types of CSR-related activities, grouped by CSR areas, as defi ned in the ISO 26000 standard and in 10 principles of Glo-bal Compact. Formal mission statements were also analysed, based on the assumption that this type of document should defi ne the fundamental characteristics of the corporate image that the company aspires to. Hence, if a company under study intends to utilise CSR activities in their brand/image management strategy, then it may be assumed that this intention will be clearly expressed in their mission statement.
1 Working on the assumption that competitive advantage represents an ability or circumstances of-fering clear advantage over the competition, J. Harasim identifi ed three principal sources of such advantage: (1) the bank’s corporate image and reputation, as parts of the corporate identity; (2) the quality of services; (3) modern technologies and the ability to incorporate it in practice [Harasim 2004].2 The research by M. Fatma, Z. Rahman and I. Khan was designed to identify the impact of CSR-re-lated activities upon bank’s reputation and brand value. The results clearly confirm that CSR-related activities have the effect of building and reinforcing customer trust, which in turn has a positive effect on the bank’s perceived reputation and brand value.

Corporate social responsibility as part of company... 7
Oeconomia 15 (2) 2016
Professional literature and publications of various organisations provide many defi ni-tions of corporate social responsibility. The European Commission has defi ned CSR as the responsibility of enterprises for their impact on society3. In the approach adopted by the PN-ISO 26000 standard4, CSR is defi ned as responsibility of an organisation for the impacts of its decisions and activities on society and the environment, through transparent and ethical behaviour. In addition, the ISO 26000 defi nes core subjects of social respon-sibility, namely: human rights, labour practices, the environment, fair operating practices, consumer issues, community involvement and development, and organisational govern-ance. The Global Compact program, initiated by the United Nations in 1999 as a platform for global business cooperation in support of corporate social responsibility development, provides no formal defi nition of CSR. However, it outlines a set of ten principles to be followed by any organisation intent to meet their fundamental responsibilities in the areas of human rights, labour, environment and anti-corruption, and to further the development of CSR among organisations5. The above defi nitions were analysed to determine key areas of CSR application, shared between all the aforementioned organisations. These are: (1) activities focused on responsible approach to customers and the market; (2) ac-tivities addressed to employees; (3) activities in support of the preservation of natural environment; (4) activities addressed to local communities and the society. The above division will serve as basis for analyses of specifi c CSR activities employed by selected banking institutions in Poland.
The issues of social responsibility and building a positive corporate image are of par-ticular importance for commercial banks, since they represent a sector of public trust. Under market economy, the banking institutions incorporate both commercial activities and ancillary services for the public good. The commercial dimension of banking refers places this type of institution in the role of an actor in the market system, acting on behalf of the owners (shareholders), representing their interests and ensuring the survival of the company on the market. The ancillary dimension, on the other hand, refl ects a bank’s role in the social system and its duty to act for the greater good of individuals and of the soci-ety at large [Korenik 2009]. Each of the above roles requires a different set of activities addressed to various stakeholder segments [Gostomski 2009]: (a) shareholders – value-based management; (b) customers – supply of moderately priced products designed to facilitate business operation or improve the quality of life; (c) bank employees – attractive jobs and support for personal and team development; (d) the society – fi nancing proenvi-ronmental undertakings, support for culture and education, charity involvement.
3 http://ec.europa.eu/growth/industry/corporate-social-responsibility/index_en.htm (accessed 05.09.2015).4 PN-ISO 26000 is a standard designed in 2010 by the International Organisation for Standarisation as a set of guidelines for organisations for the application of principles of corporate social respon-sibility and environmental protection. It is addressed to all types of organisations and is not subject to certification.5 For more on this, see https://www.unglobalcompact.org/ (accessed 10.10.2015).

8 D. Bednarska-Olejniczak
Acta Sci. Pol.
As already mentioned, the scope of CSR activities employed by banking institutions is one of the key elements that determine the company’s corporate image. Keller [1993] defi nes corporate image in terms of the brand’s public reception, refl ecting their brand awareness and the shape of brand associations formed in their conscious minds. It must be noted that brand image is a direct result of the bank’s brand identity building strategies and activities. In this approach, brand identity represents a desired brand reception pattern formed by the bank as part of an intentional strategy of brand building [Żyminkowski 2003]. General elements of this desired image are typically expressed by banks in their formal mission statements [Żyminkowski 2003]. Consequently, it may be assumed that the mission statement is an instrument for building a bank’s brand identity, i.e. the organi-sation’s behaviour, institutional communication and visual presentation. Thus, if CSR activities are to be perceived as one of the intentional methods of building the bank’s corporate image, it would be safe to assume that this intention will be expressed – at least in general terms – in the bank’s formal mission statement.
RESULTS AND DISCUSSION
The analysis of Ranking of Responsible Companies reports6 for the period of 2011–2014 suggests that fi nancial institutions are increasingly more intent on communicating their CSR practices to the public. Their growing involvement in CSR practices was also con-fi rmed in the analysis of CSR Ranking of Banks in Poland7 for 2014, with top scores awarded to Bank Gospodarki Żywnościowej (BGŻ), PKO BP and Bank Millennium. Results of studies on social involvement of Polish enterprises are also published regularly in the Ranking of Responsible Companies annual reports8. In the years 2012–2014, top eight positions in sectoral rankings of banking, fi nancial and insurance companies were occupied regularly by: ING Bank Śląski, Citi Handlowy, Bank BPH SA, Bank Zachodni WBK, BGŻ SA, PKO BP (with the exception of 2014), and Bank Millennium. This sug-gests a long-term involvement of the above institutions in CSR activities in all major ar-eas of their application. Furthermore, BGŻ SA, PKO BP and Bank Millennium received highest scores in the industry ranking organised by Gazeta Bankowa magazine. In view of the above, the aforementioned institutions seem to fi t the description of the leading banks in terms of their involvement in CSR activities. Consequently, it was concluded that the study of CSR involvement in the banking sector would be based on case studies of three of the obove banks.
6 The reports are published annually by the Forum of Responsible Business (Forum Odpowiedzial-nego Biznesu), as part of research on trends of CSR development in Polish enterprises.7 The report was produced by the Social Rating Agency (Agencja Ratingu Społecznego) in coopera-tion with Gazeta Bankowa magazine, as an instrument for public evaluation of banks in their ap-proach to the concept of corporate social responsibility. For detailed information see http://wgospo-darce.pl/projekty-bankowej/13304-ranking-csr-w-bankach-w-polsce (accessed 11.10.2015).8 The ranking is published by Dziennik Gazeta Prawna.

Corporate social responsibility as part of company... 9
Oeconomia 15 (2) 2016
For Bank BGŻ9, the fundaments of CSR policy are based on activities designed to support sustainable development in all the operating areas, and expressed as a 3×P prin-ciple: people, planet, profi t10. BGŻ declares their use of and consideration for all key areas defi ned in the ISO 26000 standard. Since 2008, the bank has been involved in the realisation of a consistent CSR strategy. The bank’s activities are strongly rooted in the principles of sustainable development, with emphasis on employees, local communities, customers, and the natural environment (Table 1). In their recent mission statement, BGŻ accentuates the signifi cance of CSR-related elements of their corporate identity: “Our mission is to offer, in a responsible way, a wide range of innovative fi nancial solutions to help our customers change the world they live in and increase their support for local economy”11.
PKO BP is intent on reaching their business objectives through sustainable develop-ment and in response to the varied needs of their employees, the market, the society, and the natural environment (Table 2). Their CSR policy is a long-term design and perceived as a factor of strategic importance. The bank declares that the key elements of their busi-ness model of operation are: work ethics, honesty, cooperation, trust and respect for all stakeholders, and that their priorities of sustainable development are cohesive with the company’s operating principles, corporate mission and values, and the adopted business strategy12. In their mission statement, PKO BP accentuate such elements as: sustainable development, responding to customer needs, building long-term relations with clients, providing profi t stability as required by the company shareholders through prudent risk management policies, and the aspiration to become the best employer in the Polish fi nan-cial sector13.
Bank Millennium approaches the CSR idea in terms of its potential for identifying and responding to the needs of their staheholders in the process of planning and implement-ing their corporate business strategy. CSR-related activities and principles are defi ned in the formal strategy of the Bank Millennium Group for the period 2015–2017. The bank’s mission is to ensure consistent realisation of corporate development and to strengthen the company’s market position, with the intent of ensuring a continued increase of their value for shareholders, the provision of a broad range of quality fi nancial services, and the ability to face new challenges posed by modern market development14. An outline of CSR activities employed by Bank Millennium is presented in Table 3.
9 In the 2014 ranking by Gazeta Bankowa, the company is identified as BGŻ; following a merger in 2015 with BNP Paribas Bank Polska, the bank adopted the name of BGŻ BNP Paribas.10 http://media.bgzbnpparibas.pl/pr/276637/bank-bgz-na-podium-w-kategorii-bankowej-rankingu-odpowiedzialnych-fi rm (accessed 11.10.2015).11 http://www.bgzbnpparibas.pl/o-banku/misja-i-cele.asp (accessed 22.10.2015).12 http://raportcsr.pl/potrzebna-jest-cala-wioska-zeby-wychowac-jedno-dziecko (accessed 22.10.2015).13 See: https://www.pkobp.pl/grupa-pko-banku-polskiego/pko-bank-polski/misja-i-wartosci (ac-cessed 22.10.2015).14 https://www.bankmillennium.pl/o-banku/o-banku/misja (accessed 22.10.2015).

10 D. Bednarska-Olejniczak
Acta Sci. Pol.
Table 1. Areas of corporate social responsibility addressed by BGŻ (for the year 2013)Area of involvement Examples of activities Instruments/Programs
Customers
customer interests: support for personal development, crisis assistance (such as credits to alleviate the effects of natural disasters), education
Agro Expert Network, conferences
special products for social organisations Leader – a social package
building proper relations with customers customer boardsmarketing communication based on four principles: responsibility, reliability, credibility and transparency
the Ethical Code of the BGŻ
Local communities
Support for the most important local institutions (schools, NGOs etc.)
sponsoring the National Philharmonic Orchestra
investing in new talents (scholarship programs) and support for those involved in local community work
BGŻ Class, BGŻ Agri-talents, scholarships
meetings, training programs, knowledge-sharing “Sign me English”
social projects with support from the BGŻ Fund “Drive Responsibly”, “BAKCYL”
Employees
improving internal communication communications auditing
emphasis on work safety and hygiene charters of Professional Risk
observance of employee rights work councilemployee voluntary services “Rely on me”appreciation and support for employees involved in local community work “No frontiers”
a day off for employees willing to participate in local community work –
tele-working alternative (part of work assignment can be done from home) –
focus on long-term relationship with employees permanent employment contracts
emphasis on maintaining proper work-life balanceemployee development (skill building, professional development, work results management, award and bonus policy, non-fi nancial benefi ts)
programs for develop-ment and training, succession policies
acquisition and development of new talents work placement and internship programs
Natural environment
support for pro-ecological attitudes Association for Sustain-able Development
fi nancing innovations that offer energy savings and increase of renewable energy sources
bio-gas installations, windfarm energy projects
promoting healthy lifestyle “Bikers’ Breakfast”collecting electrical waste
rational resource management support for paperless offi ce projects
Source: Own research based on http://raportyspoleczne.pl/wp-content/uploads/raports/1ab4ff5665d18255237 bb154db008b97.pdf (accessed 15.10.2015).

Corporate social responsibility as part of company... 11
Oeconomia 15 (2) 2016
Table 2. Areas of corporate social responsibility addressed by PKO BP (for the year 2013)Area of involvement Examples of activities Instruments/Programs
Customers and the market
products adjusted to customer needs and market realities
a “Business Debut 18” package, preferential credits for students
special care for customers with disabilities
cashpoints for visually impaired customers
active support for institutional clients dedicated investment credits
emphasis on customer satisfaction quarterly mystery shopper studies
Society
support for pro-social initiatives “BAHK” – a blood donation pro-gramme
educational programs economic education for the youngest
support for cultural eventspatronage over the National Cultural Programme for the 2011 Polish EU Presidency
support for science sponsor of a contest on current issues of Poland and the modern world
support for sports and healthy lifestyle PKO BP “Let’s Run Together”
Employees
observance of regulations and respect for human rights the Corporate Code of Ethics
developing and applying work standards “Work Regulations in PKO BP”
respecting the ethics of the profession, anti-mobbing practices the Corporate Code of Ethics
policies of employee development periodic evaluation system, training programmes
appreciation for individual differ-ences and respect for individualism –
emphasis on employee safety and security –
Natural environmentpromoting pro-ecological awareness –support for initiatives designed to protect the natural environment
programs for the optimisation of printed content, energy saving
External communication
emphasis on reliable and cohesive communication and transparency of operation
virtual press offi ce, reports, own publications
wide use of modern communications technologies
own TV studio, social media presence, blogging (“In the bank’s eyes”)
acting as an opinion-forming centre for the entire fi nancial market in Poland
debates and trade conferences
Source: Own research based on http://www.pkobp.pl/grupa-pko-banku-polskiego/odpowiedzialnosc-spo-leczna (accessed 15.10.2015).

12 D. Bednarska-Olejniczak
Acta Sci. Pol.
Table 3. Areas of corporate social responsibility addressed by Bank Millennium (for the year 2014)
Area of involvement
Examples of activities Instruments/Programs
Customers/Market (investors, business partners)
responsible sale of products and services
the Code of Ethics in Advertising, a “Your needs” section on the bank’s website, the Code of Ethics
ease of communication multi-channel communication, TeleMillennium
focus on the quality of service a program to improve the quality of services, customer satisfaction studies
protection of customer privacy it improvements (both software and hardware), training
easing the access to services for the elderly and for people with disabilities
elimination of architectural barriers to access, cash dispensers designed to be used by people with sight and motor impairments
offering socially responsible products and services
the WWF Millennium MasterCard supporting the operation of the WWF Polska Fund
Society
pro-societal activities “Nikifory” social programme addressed to people with mental impairments
promotion of culture partonage over the Planete+ Doc Film Festival
support for education “Millennium Bankers” a work placement programme for students
Employees
forms of employment permanent contracts of employment, transpar-ency in communicating employment openings, anti-mobbing measures
working conditions potential for individual negotiation of working hours
employee evaluation and development
systems for employee evaluation and training, development programmes
employee participation MilleForum, Intranet, the “Świat Millennium” magazine
Natural environment
resource management monitoring of water and energy consumptionintroduction of pro-ecological solutions
propagation of online printouts in place of hard-copy statements; limiting the print load
a range of pro-ecological banking products
The WWF credit card, Green Investment Funds, Leasing Eko Energia, PolSEEF
eco-education programmes eco-guide for customers and employees
Security of deposits
ensuring the security of deposits the Policy of Compliance, the Misappropriation Risk Management Programme
risk management Risk Committee and Risk Departmentcooperation with regulators and supervisory authorities
close cooperation with banking supervision authorities
Source: Own research based on the Responsible Business Report 2014, available at https://www.bankmillen-nium.pl/o-banku/csr (accessed 15.10.2015).

Corporate social responsibility as part of company... 13
Oeconomia 15 (2) 2016
CONCLUSIONS
Involvement in practical realisation of the CSR concept was confi rmed consistently in all the banks under study. Activities in this area were found to be undertaken in all four of the general areas of CSR application, as defi ned based on the guidelines of the ISO 26000 standard and the Global Compact initiative, namely: the responsible approach to custom-ers and the market, activities addressed to employees, activities designed to support local communities and the society, and pro-environmental actions. Analyses of specialist rank-ings and formal CSR reports seem to confi rm the strategic importance of all activities undertaken in relation to the principle of corporate social responsibility – these actions are designed in long-term perspective (analyses covered a period of four consecutive years) and are formally expressed in banks’ business strategies. Bearing in mind the specifi c character of banking institutions as organisations of public trust, and in relation to their ancillary role in modern economy, the corporate social responsibility of banks should be perceived as a factor of utmost signifi cance, since it not only adds to the welfare of the society at large, but also has a benefi cial effect on a bank’s corporate image. Based on the assumption that the general elements of a bank’s corporate identity are expressed in their formal mission statement, it seems that the observance of CSR recommendations is consistently employed for the purpose of building the desired corporate image in each of the banking institutions under study. Each such statement included some form of declara-tion of intent to pursue responsible methods and to satisfy the interests of stakeholders. The results of this study may be approached as part of initial research for a broader study, since the observations gathered in the course of the examination should be complemented by detailed empirical studies of banks’ corporate image as perceived by various stake-holder groups, as well as careful analyses of the perceived impact of CSR activities on such an image.
REFERENCES
Altkorn, J. (1999). Strategia marki. PWE, Warszawa (in Polish).Ararat, M. (2007). Corporate Social Responsibility Across Middle East and North Africa. Working
Paper Series. Sabanci University, School of Management, Corporate Governance Forum.Azim, M.T., Diyab, A.A., Al-Sabaan, S.A. (2014). CSR, Employee Job Attitude and Behavior: Sau-
di Bank Experience. Transylvanian Review of Administrative Sciences, 43 E, 25–47.Fatma, M., Rahman, Z., Khan, I. (2015). Building company reputation and brand equity through CSR:
the mediating role of trust. International Journal of Bank Marketing, 33, 6, 840–856.Gostomski, E. (2009). Społeczna odpowiedzialność banków w dobie kryzysu fi nansowego. [In:]
M. Bąk, P. Kulawczuk (Eds), Społeczna odpowiedzialność instytucji fi nansowych. IBnDiPP Uniwersytet Gdański, Warszawa (in Polish).
Islam, Z.M., Ahmed, S.U., Hasan, I. (2012). Corporate Social Responsibility and Financial Per-formance Linkage: Evidence from the Banking Sector of Bangladesh. Journal of Organi-zational Management, 1, 14–21.
Keller, K.L. (1993). Conceptualizing, measuring and managing customer-based brand equity. Jour-nal of Marketing, 57, 3.
Korenik, D. (2009). Odpowiedzialność banku komercyjnego. Próba syntezy. Difi n, Warszawa (in Polish).

14 D. Bednarska-Olejniczak
Acta Sci. Pol.
Sen, S., Bhattacharya, C.B. (2001). Does Doing Good Always Lead to Doing Better? Consum-er’s Reactions to Corporate Social Responsibility. Journal of Marketing Research, 38, 2, 225–243.
Yiannaki, S.M. (2010). CSR’s Role within Banking in Post Financial Crisis. Adaptive Options: A Global Network of Change and Development Professionals and Practitioners, 4, 2, 22–24.
Żyminkowski, T. (2003). Kształtowanie wizerunku banku. Wydawnictwo Akademii Ekonomicznej w Poznaniu, Poznań (in Polish).
SPOŁECZNA ODPOWIEDZIALNOŚĆ BIZNESU A KSZTAŁTOWANIE WIZERUNKU BANKU
Streszczenie. Celem artykułu jest określenie, w jaki sposób i w jakim zakresie wiodące banki detaliczne w Polsce wdrażają obecnie działania z zakresu społecznej odpowiedzial-ności biznesu (CSR), z uwzględnieniem ich wpływu na kształtowanie wizerunku banku jako instytucji zaufania publicznego. Wykorzystane metody badań to krytyczna analiza literatury przedmiotu z zakresu społecznej odpowiedzialności biznesu, bankowości i mar-ketingu oraz analiza danych wtórnych dotyczących działań banków detalicznych podejmo-wanych w obszarze CSR. Analizowane dane pochodzą z raportów CSR oraz stron inter-netowych wybranych banków. W wyniku badań stwierdzono, iż wszystkie badane banki podejmują działania związane z odpowiedzialnością społeczną, we wszystkich czterech obszarach wyłonionych na podstawie wytycznych normy ISO 26000 i standardów Global Compact. Są to działania związane z odpowiedzialnym podejściem do klientów i rynku, działania adresowane do pracowników oraz społeczności lokalnych, działania zmierzające do ochrony środowiska naturalnego. Analiza rankingów specjalistycznych oraz raportów CSR wskazuje na strategiczny charakter aktywności podejmowanych przez badane banki.
Słowa kluczowe: społeczna odpowiedzialność biznesu, bankowość detaliczna, wizerunek banku
Accepted for print: 20.04.2016
For citation: Bednarska-Olejniczak D. (2016). Corporate social responsibility as part of company image management in banking institutions. Acta Sci. Pol., Oeconomia, 15 (2), 5–14.

Oeconomia 15 (2) 2016, 15–25
TRANSFORMATION OF AGRARIAN STRUCTURE OF EU COUNTRIES WITHIN THE PERIOD OF 2010–2013
Jadwiga BożekUniversity of Agriculture in Krakow
Abstract. The aim of the paper is to determine the size and directions of changes and de-gree of differentiation of agrarian structure of EU countries within the period of 2010–2013. The research is based on Eurostat data presenting number of farms in groups of agricultural land area in particular countries. The areal groups are as follows: up to 5 ha of agricultural land, 5–20 ha, 20–50 ha, 50 ha and more. With the application of chosen methods of statisti-cal analysis of structures direction and rate of changes of the structure under investigation were compared. Basing on fuzzy classifi cation four groups of countries of similar structure were distinguished and the types of the structure under investigation were determined for EU countries in 2010 and 2013.
Key words: agrarian structure, European Union, classifi cation of countries
INTRODUCTION
At the moment of the accession of new member countries to the European Union the level of their socio-economic development was in general lower than the “old” EU countries [Poczta and Kołodziejczak 2004], therefore the necessity of cutting down these differences and the adaptation of the economies so that they could be competitive with the EU. This concerned also agriculture, in particular the agrarian structure that in case of most new member countries was very fragmented and far from the structure of such countries as Germany, France and Great Britain [Bożek 2010]. Since the accession in new member countries signifi cant changes of agrarian structure has been observed. They are the consequence of economic rationales as well as mechanisms introduced by Common Agricultural Policy of the European Union [Poczta 2013]. These changes are closely fol-lowed and analysed [Mierosławska 2008, Dzun 2009, Babiak 2010, Klepacki and Żak
Corresponding author: Jadwiga Bożek, University of Agriculture in Krakow, Faculty of Agriculture and Economics, Department of Statistics and Econometrics, Mickiewicza Av. 21, 31-120 Kraków, Poland, e-mail: [email protected]© Copyright by Warsaw University of Life Sciences Press, Warsaw 2016
ISSN 1644-0757eISSN 2450-4602
http://acta_oeconomia.sggw.pl

16 J. Bożek
Acta Sci. Pol.
2013]. The aim of the paper is the determination of the range, directions of changes and the degree of differentiation of the agrarian structure of the European Union countries within the period of 2010–2013.
The main determinant of the agrarian structure is the areal structure of farms. This structure can be considered in two aspects: with respect to the shares of number of farms in distinguished areal groups of arable land in the total number of farms in the given country and with respect to the percentage of the area of arable land that is covered. The paper presents the results concerning the fi rst capture of the research, i.e. the one concern-ing the number of farms in particular areal groups of arable land (the results concerning the area of arable land covered by farms in particular areal groups will be presented in a separate work). The research was carried out on the basis of the data from the internet database of the European Statistical Offi ce – Eurostat, with regard to the years 2010 and 2013 presenting the number of farms according to areal groups of arable land in particular countries of the EU. In the research the following areal groups were assumed: up to 5 ha of arable land, 5–20 ha, 20–50 ha, 50 and more ha. With the application of chosen meth-ods of statistical analysis of structures, the direction and rate of changes of the structure under investigation were compared in particular countries. Then on the basis of fuzzy classifi cation groups of countries were distinguished of similar agrarian structure and types of the structure being investigated in countries of the European Union in the years 2010 and 2013.
RESEARCH METHOD
In the paper chosen methods of statistical analysis of structures were applied. In order to determine the degree of changes that took place in the structure over a certain period the following measure was implemented [Kukuła 1989].If α is a partition structure investigated in time t = 0, 1, ..., n, consisting of r elements, i.e.
the matrix [αtk](t = 0,1, ..., n; k = 1,...,r) is given, where: 1
1 and 0 1,r
ti tit
α α=
= ≤ ≤
then ( )
1, 2
r
tk t kk
t tvτ
τ
α α −=
−
−=
determines the degree of changes of the structure over the period from t – τ to t. This measure takes values from the interval [0, 1]. Its high value indicates that the structure has undergone big changes. In particular, vn0 enables the comparison of the structure from the initial period t = 0 with the structure of the fi nal period t = n.
The above measure was also applied in order to determine the degree of differentia-tion of typological groups. As a measure of inter-group differentiation (inter-group dis-tance) the distance between the centres of gravity of groups calculated by the following formula:
* *
1
12
r
ij il jll
v a a=
= −

Transformation of agrarian structure of EU countries... 17
Oeconomia 15 (2) 2016
where * *,il jla a – the l-th element of the gravity centre of i-th and j-th group respectively (l-th element of the gravity centre of the group is the arithmetic mean of l-th elements of particular objects belonging to this group).
For grouping of countries with respect to the similarity of agrarian structure the fuzzy classifi cation was applied, which afterwards was transformed into classical classifi cation. In classical classifi cation the membership of objects in the given class is described by the zero-one variable, while in case of fuzzy classifi cation the membership of an object in a given class is described by a continuous variable. They are the so-called membership functions that take values from the interval [0, 1].
The problem of fuzzy classifi cation can be formulated as follows. Let’s assume a set of Ω with n objects (countries in his case): P1, P2, ..., Pn.These objects are described by the values of r variables: X1, X2, ..., Xr (in the paper X1 denotes the share of the number of farms from the l-th areal group in the total number of farms in the given country). On the set of Ω the family of fuzzy classes: S1, S2, ..., Sk (1 < K < n) should be determined so that the following conditions were fulfi lled:
( ) ( )0 1 1, ..., ; 1, ...,jS if P i n j K≤ ≤ = = where ( )
jS if P denotes the degree of mem-bership of the object Pi to the class Sj.
( ) ( )1
1 1, ..., .j
K
S ijf P i n
=
= =
Objects for which the degrees of membership in the same class are high – are treated as very similar while the objects for which the degrees of membership in different classes are high – are treated as little-similar. The creation of the fuzzy classifi cation then is based on the determination for each
object Pi ∈ Ω such a vector ( ) ( ) ( ) ( )( )1 2, , ...,
Ki S i S i S if P f P f P f P= that the conditions 1–3 are fulfi lled.
There are several methods of the construction of the fuzzy classifi cation [Jajuga 1984]. In the paper the iterative method based on the concept of fuzzy gravity centre was chosen. In his method in subsequent iteration the values of degrees of membership of objects in particular classes are being changed. This procedure is continued until these values stop changing in a signifi cant degree. The classifi cation obtained in this manner is then transformed into classical classifi cation by the assumption that the object Pi belongs to the class (typological group) Sj, when ( ) ( )max .
j lS i S ilf P f P=
INVESTIGATION RESULTS
Over the period of 2010–2013 signifi cant changes in the number of farms in the coun-tries of the European Union took place, which is presented in the Tables 1 and 2 (In Table 2 for easier capture of trends, countries of UE-15 and countries of UE-12 were grouped sep-arately). General number of farms in the European Union (UE-27) decreased by 1,331.4 thousand, which makes 11%. The drop of number of farms occurred in all countries apart from the Czech Republic (where there was the increase of the total number of farms by 3.4 thousand, that is 14.8%).
1.
2.
3.

18 J. Bożek
Acta Sci. Pol.
The largest drop in the number of farms – in absolute values – was observed in Italy (610.7 thousand, i.e. 37.7%), Romania (229.3 thousand, i.e. 6%), Bulgaria (115.6 thousand, i.e. 31.2%), Hungary (85.7 thousand, i.e.14.9%), Poland (78 thousand, i.e. 5.2%), therefore in countries of high fragmentation of farms. Signifi cant decrease of the number of farm also took place in France (43.8 thousand, i.e. 8.5%) and Portugal (40.6 thousand, i.e. 3.5%).
The least drop of the total number of farms was noticed in Estonia (0.4 thousand, i.e. 2%), Ireland (0.4 thousand, i.e. 0.3%), Slovakia (0.9 thousand, i.e. 3.7%) and also in Great Britain (1.8 thousand, i.e. 1%) and Slovenia (2.3 thousand, i.e. 3.1%).
The largest changes both in absolute and relative numbers concerned the number of very small farms, of the area up to 5 ha of arable land. The number of these farms dropped in all countries apart from the three countries (the Czech Republic, Ireland and Latvia) and the largest dynamics of the drop was noticed in Italy (50%), Finland (47%) and Belgium (43%). In absolute values the number of such farms decreased mostly in Italy, Romania, Bulgaria, Hungary and in Poland (Table 1), that is in countries, where the per-centage of these farms is the highest in the EU. The shares of these farms also dropped in all countries apart from the Czech Republic and Latvia, where a slight increase was observed (Table 2).
The number of farm of the area of 5–20 ha also decreased, but the drop here was relatively smaller than the one noticed in case of farm of the area up to 5 ha and in most countries did not exceed 10%.
Larger drop of the number of these farms was observed in Finland (20%) and in Lat-via (20%). In the Czech Republic and in Slovakia there was an increase of the number of these farms by about 18%, in Romania – by about 8%, while in Bulgaria, Ireland and Great Britain the number of these farms remained on the same level. In turn, the shares of this group of farms in 19 countries increased. The increase did not exceed 3 percentage points, apart from Italy, where there was an increase by nearly 10 percentage points. In other countries slight decrease of the shares of this group of farms took place, but in most cases it did not exceed 1 percentage point.
In the group of farms of the area of 20–50 ha in most „old” EU countries there wasa decrease of the number from 1% in Ireland up to 13% in Finland, while in most “new” member countries the number of such farms increased from 3 up to 10%. The shares of farms of the area of 20–50 ha changed very slightly (in most cases by less than 1 percentage point), in different directions: in 18 countries there was an increase of the number, in the rest of countries – the decrease or no change (they practically remained on the same level).
In the group of largest farms in most countries a slight increase took place, by 1–5%. Most such farms occurred in Poland: 5.1 thousand, i.e. 19.2%. Taking into account new member countries the number of farms of the area of more than 50 ha dropped only in Ro-mania (by 3.8%), while in other countries it remained on the same level or increased. In turn in 8 “old” countries (Belgium, Denmark, Greece, Spain, Ireland, Romania, Sweden) the number of such farms slightly decreased. The drop was on the level of 0.6% in France up to 5.3% in Sweden. With regard to the shares of the largest farms only in two coun-tries the increase did not occur: in the Czech Republic and in Ireland, where there was a decrease by 2 and 0.2 percentage points respectively. Apart from these two countries the shares of these farms increased or remained on the same level, although the increase in most cases did not exceed 1 percentage point. Only in Finland and in France the increase was higher and reached 4.8 and 3.3 percentage point respectively.

Transformation of agrarian structure of EU countries... 19
Oeconomia 15 (2) 2016
Table 1. Number of farms (in thousands) in groups of agricultural land area in countries of EU in 2010 and 2013
CountryTotal
Areal groups of arable land in ha Total
Areal groups of arable land in ha
0–5 5–20 20–50 ≥50 0–5 5–20 20–50 ≥502010 2013
Austria 150 47.5 59.2 32.3 11.3 140.4 43.1 54.7 31.4 11.3Belgium 42.9 9.7 12 12.2 9.0 37.8 5.5 11.8 11.8 8.7Bulgaria 370 339 17.6 6.0 8.4 254.4 221 17.7 6.6 9.2Cyprus 38.9 34.8 3.0 0.7 0.3 35.4 31.8 2.7 0.6 0.3Czech Republic 22.9 3.5 8.1 4.4 6.8 26.3 4.9 9.5 4.8 7.1
Denmark 42.1 3.1 15.8 9.2 14.0 38.8 2.6 14.6 8.3 13.3Estonia 19.6 6.6 7.5 2.7 2.8 19.2 6.3 7.3 2.6 3.0Finland 63.9 6.2 21.3 21.7 14.7 54.4 3.3 17.1 18.9 15.1France 516 139 96.8 88.5 192.0 472.2 116.4 85.9 79 190.9Greece 723 557 133 25.5 7.0 709.5 544.4 132.1 26.2 6.9Spain 990 526 253 108.0 104.0 965 506.5 251.6 105.2 101.8Netherlands 72.3 20.7 21.1 19.2 11.3 67.5 18.5 19.5 17.9 11.6Ireland 140 9.7 49.3 55.4 25.5 139.6 9.8 49.8 54.9 25.1Lithuania 199.9 117 61.4 12.5 8.6 171.8 91.5 58.5 12.1 9.8Latvia 83.4 28.3 40.2 9.6 5.3 81.8 34.9 31.9 9.4 5.6Germany 299 27.4 110 76.1 85.2 285 24.6 103.6 71.4 85.2Poland 1 507 831 553 95.3 26.5 1 429 777.8 517.2 102.4 31.6Portugal 305 231 52.2 11.7 10.5 264.4 191.1 49.7 12.9 10.7Romania 3 859 3 594 226 17.9 21.2 3 629.7 3 347.1 243.6 18.8 20.4Slovakia 24.5 15.8 4.3 1.4 3.0 23.6 13.9 5.1 1.5 3.1Slovenia 74.7 45.4 25.8 3.0 0.5 72.4 43.3 25.5 3.1 0.5Sweden 71.1 8.9 30 15.2 17.0 67.2 7.7 29.4 13.9 16.1Hungary 577 502 46 15.4 13.9 491.3 415.5 45.7 15.9 14.2Great Britain 187 16.7 55.5 42.4 72.2 185.2 15.8 55.7 40.8 72.9Italy 1 621 1 182 306 87.6 44.7 1 010.3 592.7 287.7 84.6 45.3Luxembourg 2.2 0.4 0.4 0.3 1.1 2.1 0.3 0.4 0.3 1.1Malta 12.5 12.2 0.3 0.0 0.0 9.4 9.1 0.3 0.0 0.0Croatia – – – – – 157.4 109.2 37.3 6.9 3.9UE (27) 12 015 8 314 2 210 774 717 10 684 7 079.4 2 129 755.1 720.6
Source: Own calculations on the basis of www.europa.eu/eurostat.

20 J. Bożek
Acta Sci. Pol.
Table 2. Dynamics of changes in the number of farms in EU countries in groups of agricultural land area in countries of EU in 2010 and 2013 (2010 = 100%)
CountryFarms in total(in thousands) Areal groups of arable land in ha (%)
2010 2013EU (27) –1 331.4 88.9 85.2 96.3 97.6 100.5Austria –9.6 93.6 90.7 92.4 97.2 100.0Belgium –5.1 88.1 56.7 98.3 96.7 96.7Denmark –3.3 92.2 83.9 92.4 90.2 95.0Finland –9.5 85.1 53.2 80.3 87.1 102.7France –43.8 91.5 83.7 88.7 89.3 99.4Greece –13.5 98.1 97.7 99.3 102.7 98.6Spain –25 97.5 96.3 99.4 97.4 97.9Netherlands –4.8 93.4 89.4 92.4 93.2 102.7Ireland –0.4 99.7 101.3 101.0 99.1 98.4Germany –14 95.3 89.8 94.2 93.8 100.0Portugal –40.6 86.7 82.7 95.2 110.3 101.9Sweden –4 94.4 86.5 98.0 91.4 94.7Great Britain –1.8 99.0 94.6 100.4 96.2 101.0Italy –610.7 62.3 50.1 94.0 96.6 101.3Luxembourg –0.1 95.5 75.5 100.0 100.0 100.0Bulgaria –115.6 68.8 65.2 100.6 110.0 109.5Cyprus –3.5 91.0 91.4 90.0 85.7 100.0Czech Republic 3.4 114.8 140.0 117.3 109.1 104.4Estonia –0.4 98.0 95.5 97.3 96.3 107.1Lithuania –28.1 85.9 78.2 95.3 96.8 114.0Latvia –1.6 98.1 123.3 79.4 97.9 105.7Poland –78 94.8 93.6 93.5 107.5 119.2Romania –229.3 94.1 93.1 107.8 105.0 96.2Slovakia –0.9 96.3 88.0 118.6 107.1 103.3Slovenia –2.3 96.9 95.4 98.8 103.3 100.0Hungary –85.7 85.1 82.8 99.3 103.2 102.2Malta –3.1 75.2 74.0 101.3 – –
Source: Own calculations on the basis of Table 1.
In order to compare the range of structural changes in particular countries the degree of structural changes was calculated (Table 3). The most intensive changes of the struc-ture took place in Italy, where the degree of structural changes equals 0.1427, in Latvia – 0.0922, in Belgium – 0.0806, Finland – 0.0554, Slovakia – 0.0559, Lithuania – 0.0541. The littlest structural changes (less than 0,01) took place in Cyprus, Greece, Spain, Ire-land, Romania, Slovenia.

Transformation of agrarian structure of EU countries... 21
Oeconomia 15 (2) 2016
Table 3. Number of farms (%) in groups of agricultural land area in countries of EU in 2010 and 2013
Country
Areal groups of arable land in ha Areal groups of arable land in ha
v2013.20100–5 5–20 20–50 50 and more 0–5 5–20 20–50 50 and
more2010 2013
Austria 31.7 39.5 21.5 7.5 30.7 39.0 22.4 8.0 0.081Belgium 22.6 28.0 28.4 21.0 14.6 31.2 31.2 23.0 0.046Bulgaria 91.6 4.8 1.6 2.3 86.9 7.0 2.6 3.6 0.003Cyprus 89.5 7.7 1.8 0.8 89.8 7.6 1.7 0.8 0.039Czech Republic 15.3 35.4 19.2 29.7 18.6 36.1 18.3 27.0 0.011
Denmark 7.4 37.5 21.9 33.3 6.7 37.6 21.4 34.3 0.013Estonia 33.7 38.3 13.8 14.3 32.8 38.0 13.5 15.6 0.055Finland 9.7 33.3 34.0 23.0 6.1 31.4 34.7 27.8 0.032France 26.9 18.8 17.2 37.2 24.7 18.2 16.7 40.4 0.004Grece 77.0 18.4 3.5 1.0 76.7 18.6 3.7 1.0 0.006Spain 53.1 25.6 10.9 10.5 52.5 26.1 10.9 10.5 0.016Netherlands 28.6 29.2 26.6 15.6 27.4 28.9 26.5 17.2 0.005Girland 6.9 35.2 39.6 18.2 7.0 35.7 39.3 18.0 0.054Lithuania 58.5 30.7 6.3 4.3 53.2 34.1 7.0 5.7 0.092Latvia 33.9 48.2 11.5 6.4 42.7 39.0 11.5 6.8 0.014Germany 9.2 36.8 25.5 28.5 8.6 36.4 25.1 29.9 0.013Poland 55.1 36.7 6.3 1.8 54.4 36.2 7.2 2.2 0.034Portugal 75.7 17.1 3.8 3.4 72.3 18.8 4.9 4.0 0.009Romania 93.1 5.9 0.5 0.5 92.2 6.7 0.5 0.6 0.056Slovakia 64.5 17.6 5.7 12.2 58.9 21.6 6.4 13.1 0.010Slovenia 60.8 34.5 4.0 0.7 59.8 35.2 4.3 0.7 0.017Sweden 12.5 42.2 21.4 23.9 11.5 43.8 20.7 24.0 0.024Hangary 87.0 8.0 2.7 2.4 84.6 9.3 3.2 2.9 0.011Great Britain 8.9 29.7 22.7 38.6 8.5 30.1 22.0 39.4 0.143Italy 72.9 18.9 5.4 2.8 58.7 28.5 8.4 4.5 0.014Luxembourg 18.2 18.2 13.6 50.0 14.4 19.0 14.3 52.4 0.038Malta 97.6 2.4 0.0 0.0 96.8 3.2 0.0 0.0 0.008Croatia 69.4 23.7 4.4 2.5
EU (27) 69.2 18.4 6.4 6.0 66.3 19.9 7.1 6.7 0.029Source: Own calculations on the basis of Table 1.

22 J. Bożek
Acta Sci. Pol.
The high differentiation of the structure under investigation is still observed in the countries of EU (Table 3). In 2013 farms of the area up to 5 ha constitutes from 6.1% in Finland up to 92.2% in Romania, the shares of farms of 5–20 ha reach from 7% in Bul-garia up to 43.8% in Sweden. Very large divergence concern also the shares of farms of the area of 20–50 ha: from 2.6% in Bulgaria up to 39.3% in Ireland and farms of the larg-est area more than 50 ha: from 0.6% in Romania up to 40.4% in France. These numbers are very far from the average values for the whole European Union, which equal 66.3, 20, 7, 6.7% respectively (Table 3).
On the basis of the method of fuzzy classifi cation method grouping of countries with respect to the level of similarity of the structure presented in the paper was carried out for the years 2010 and 2013 (two countries were not taken into account: Malta and Luxem-bourg because of the small number of farms, disjunctive to the rest of countries).
The calculations were carried out with the application of original computer program that for the given set of multidimensional objects determines gravity centres for clusters and computes values of membership functions for particular objects in these clusters. Ini-tial values of degrees of membership in fuzzy classes were determined at random, which did not infl uence the fi nal classifi cation. The computation stopped when the maximum (by classes and elements) of the modulus of the difference of values of membership de-grees in two subsequent iterations were less than 0.000001.
On the basis of the calculations carried out four groups of countries were distinguished. The composition of these groups and their characteristics in the years under investigation are presented in Tables 4 and 5.
Table 4. Membership of EU countries in typological groups
GroupComposition of group
2010 2013
I Bulgaria, Cyprus, Greece, Portugal, Romania, Hungary, Italy
Bulgaria, Cyprus, Greece, Portugal, Roma-nia, Hungary
II Spain, Lithuania, Poland, Slovakia, Slovenia
Spain, Lithuania, Latvia, Poland, Slova-kia, Slovenia, Italy, Croatia
III Austria, Estonia, Netherlands, Latvia Austria, Estonia, Netherlands
IVBelgium, Czech Republic, Denmark, Finland, France, Ireland, Germany, Sweden, Great Britain
Belgium, Czech Republic, Denmark, Fin-land, France, Ireland, Germany, Sweden, Great Britain
Source: Own investigations.
The largest fragmentation occurs in case of group I. In 2010 in the countries of this group 83.8% of the total number of farms was contributed by very small farms, of the area less than 5%, 11.5% was formed by farms of the area of 5–20 ha, while farms from the upper areal groups constituted non-signifi cant ratio: 20–50 ha – 2.8% and more than 50 ha – 1.9%. In 2013 the composition of this group changed: Italy, where intensive structural changes took place belongs to group II, with countries of less fragmented structure than the one in countries of group I. The transfer of Italy to group II and minor structural changes in Cyprus, Greece, Romania are the reason for the fact that in 2013 the average structure of group I practically did not change.
Transformation of agrarian structure of EU countries... 23
Oeconomia 15 (2) 2016
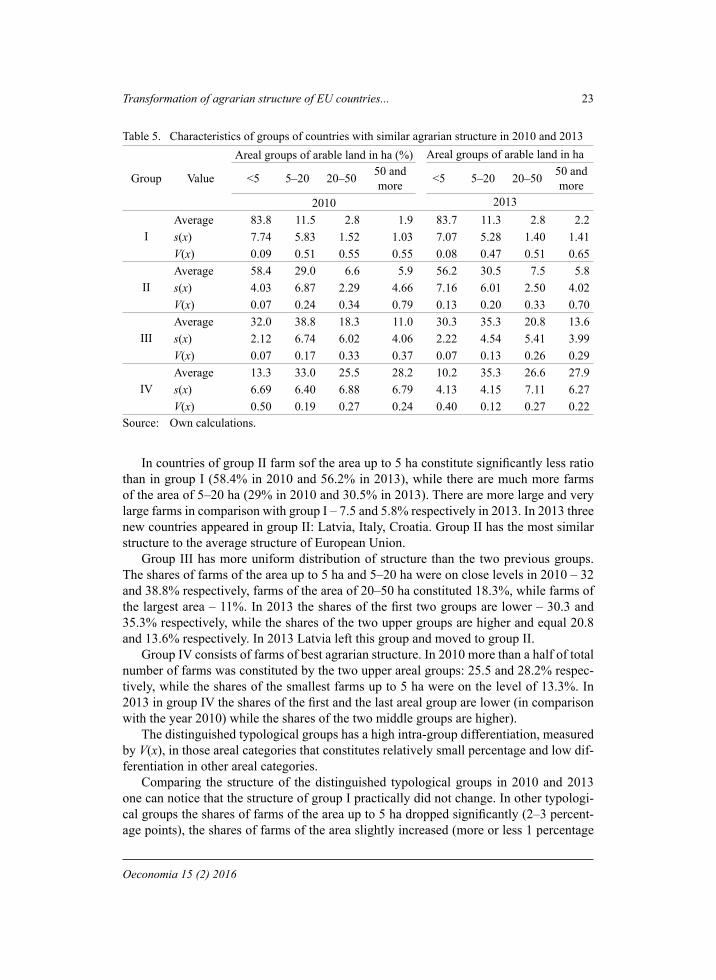
Table 5. Characteristics of groups of countries with similar agrarian structure in 2010 and 2013
Group Value
Areal groups of arable land in ha (%) Areal groups of arable land in ha
<5 5–20 20–50 50 and more <5 5–20 20–50 50 and
more2010 2013
IAverage 83.8 11.5 2.8 1.9 83.7 11.3 2.8 2.2s(x) 7.74 5.83 1.52 1.03 7.07 5.28 1.40 1.41V(x) 0.09 0.51 0.55 0.55 0.08 0.47 0.51 0.65
IIAverage 58.4 29.0 6.6 5.9 56.2 30.5 7.5 5.8s(x) 4.03 6.87 2.29 4.66 7.16 6.01 2.50 4.02V(x) 0.07 0.24 0.34 0.79 0.13 0.20 0.33 0.70
IIIAverage 32.0 38.8 18.3 11.0 30.3 35.3 20.8 13.6s(x) 2.12 6.74 6.02 4.06 2.22 4.54 5.41 3.99V(x) 0.07 0.17 0.33 0.37 0.07 0.13 0.26 0.29
IVAverage 13.3 33.0 25.5 28.2 10.2 35.3 26.6 27.9s(x) 6.69 6.40 6.88 6.79 4.13 4.15 7.11 6.27V(x) 0.50 0.19 0.27 0.24 0.40 0.12 0.27 0.22
Source: Own calculations.
In countries of group II farm sof the area up to 5 ha constitute signifi cantly less ratio than in group I (58.4% in 2010 and 56.2% in 2013), while there are much more farms of the area of 5–20 ha (29% in 2010 and 30.5% in 2013). There are more large and very large farms in comparison with group I – 7.5 and 5.8% respectively in 2013. In 2013 three new countries appeared in group II: Latvia, Italy, Croatia. Group II has the most similar structure to the average structure of European Union.
Group III has more uniform distribution of structure than the two previous groups. The shares of farms of the area up to 5 ha and 5–20 ha were on close levels in 2010 – 32 and 38.8% respectively, farms of the area of 20–50 ha constituted 18.3%, while farms of the largest area – 11%. In 2013 the shares of the fi rst two groups are lower – 30.3 and 35.3% respectively, while the shares of the two upper groups are higher and equal 20.8 and 13.6% respectively. In 2013 Latvia left this group and moved to group II.
Group IV consists of farms of best agrarian structure. In 2010 more than a half of total number of farms was constituted by the two upper areal groups: 25.5 and 28.2% respec-tively, while the shares of the smallest farms up to 5 ha were on the level of 13.3%. In 2013 in group IV the shares of the fi rst and the last areal group are lower (in comparison with the year 2010) while the shares of the two middle groups are higher).
The distinguished typological groups has a high intra-group differentiation, measured by V(x), in those areal categories that constitutes relatively small percentage and low dif-ferentiation in other areal categories.
Comparing the structure of the distinguished typological groups in 2010 and 2013 one can notice that the structure of group I practically did not change. In other typologi-cal groups the shares of farms of the area up to 5 ha dropped signifi cantly (2–3 percent-age points), the shares of farms of the area slightly increased (more or less 1 percentage

24 J. Bożek
Acta Sci. Pol.
points). The shares of other farms changed in different directions, but the changes were not signifi cant.
In order to estimate in what direction the inter-group differentiation changes (if the groups are getting similar or divergent) measures of inter-group differentiation were cal-culated for the years 2010 and 2013 (Table 6). The largest distance in both years occurs in case of groups I and IV and the shortest – in case of groups III and IV. Within the period of 2010–2013 the inter-group differentiation increased in case of group I and other groups and between group II and IV. In turn, the distance between group II and IV and group III and II decreased.
Table 6. Inter-group differentiation in 2010 and 2013
Group2010 2013
II III IV II III IVI 0.2541 0.5189 0.7053 0.2754 0.5345 0.7353II – 0.2648 0.4512 – 0.2591 0.4599III – – 0.2444 – – 0.2009
Source: Own calculations.
CONCLUSIONS
On the basis of the analysis of the agrarian structure of the countries of European Union carried out over the period of 2010 and 2013 the following conclusions can be formulated.
Over the period under investigation positive changes took place: there was a drop of the total number of farms in all EU countries (apart from the Czech Republic), while the largest drop of the number of farms was observed in countries of a high degree of frag-mentation of agriculture: Bulgaria, Romania, Italy, Poland and Portugal, which can be seen as a positive phenomenon.
The largest decrease of the number of farms, both in absolute and relative capture oc-curred in the areal group of farms up to 5 ha of arable land. At the same time there was an increase of the number of farms from the upper areal groups. The largest increase of the number of these farms was observed in new member countries of the EU (EU-12).
The agrarian structure of the EU countries is very differentiated. Four groups of coun-tries can be distinguished. Group I constitutes of six countries of the highest degree frag-mentation of farms: Bulgaria, Greece, Portugal, Romania, Hungary and Cyprus, where in 2013 where on average the share of the smallest farms of the area of up to 5 ha was on the level of 83.8% of the total number of farms, farms of the area of 5–20 ha have the contribution of 11.5%, farms of the area of 20–50 ha constitute 2.8%, and farms of the area of more than 50 ha form only 1.9% on average. Less fragmentation is observed in countries of group II: Spain, Lithuania, Poland, Slovakia, Slovenia, in which the percent-age of farms from the subsequent areal groups on average is as follows: 58, 29, 7 and 6% respectively. Group III (Austria, Estonia, the Netherlands, Latvia) differs from the previous groups because of high shares of largest farms and the distribution of structure is as follows: 32, 39, 18 and 11% respectively. Group IV (Belgium, the Czech Republic, Denmark, Finland, France, Ireland, Germany, Sweden, the Great Britain) consists of
Transformation of agrarian structure of EU countries... 25
Oeconomia 15 (2) 2016
countries of best agrarian structure of farms: 13, 33, 26 and 28%. Within the period under investigation the composition of groups did not change signifi cantly – only two countries changed their membership in groups. The group of countries of the highest fragmentation of farms decreased.
In 2013 the structure of typological groups seems more benefi cially than in 2010: the shares of farms of the area less than 5 ha are lower while the shares of farms of the largest area are higher.
REFERENCES
Babiak, J. (2010). Zmiany w strukturze rolnictwa krajów Unii Europejskiej. Roczniki Integracji Europejskiej, 4, 87–97.
Bożek, J. (2010). Typologia krajów Unii Europejskiej pod względem podobieństwa struktury agrar-nej. Acta Sci. Pol., Oeconomia, 9 (3), 17–25.
Dzun, W. (2009). Przedsiębiorstwa rolne przed i po wejściu Polski do UE. IERiGŻ-PIB, Warszawa.Jajuga, K. (1984). Zbiory rozmyte w zagadnieniu klasyfi kacji. Przegląd Statystyczny, 3/4, 237–290.Klepacki, B., Żak, A. (2013). Przemiany agrarne na terenach polskich przed i po integracji z Unią
Europejską. Journal of Agribusiness and Rural Development, 4 (30), 1–17.Mierosławska, A. (2008). Zmiany w strukturze agrarnej w trzy lata po akcesji Polski do UE w uję-
ciu regionalnym. Roczniki Naukowe SERiA, 10 (3), 392–397.Poczta, W., Ed. (2013). Gospodarstwa rolne w Polsce na tle gospodarstw Unii Europejskiej – wpływ
WPR. GUS, Warszawa 2013.Poczta, W., Kołodziejczak, M. (2004). Potencjał produkcyjny rolnictwa polskiego i efektywność
gospodarowania w aspekcie integracji z Unią Europejską. Wydawnictwo Akademii Rol-niczej w Poznaniu, Poznań.
PRZEMIANY STRUKTURY AGRARNEJ KRAJÓW UNII EUROPEJSKIEJ W OKRESIE 2010–2013
Streszczenie. Celem pracy jest określenie skali, kierunków przemian oraz stopnia zróż-nicowania struktury agrarnej krajów Unii Europejskiej w okresie 2010–2013. Badania przeprowadzono na podstawie danych Eurostatu przedstawiających liczbę gospodarstw w grupach obszarowych użytków rolnych w poszczególnych krajach. W pracy przyjęto następujące grupy obszarowe gospodarstw: do 5 ha użytków rolnych, 5–20 ha, 20–50 ha, 50 i więcej ha. Posługując się wybranymi metodami statystycznej analizy struktur, porów-nano kierunek i tempo zmian badanej struktury w krajach Unii Europejskiej. Na podstawie klasyfi kacji rozmytej wyodrębniono cztery grupy krajów o zbliżonej strukturze oraz okre-ślono typy badanej struktury w krajach Unii Europejskiej w latach 2010 i 2013.
Słowa kluczowe: struktura agrarna, Unia Europejska, klasyfi kacja krajów
Accepted for print: 29.03.2016
For citation: Bożek J. (2016). Transformation of agrarian structure of EU countries within the pe-riod of 2010–2013. Acta Sci. Pol., Oeconomia, 15 (2), 15–25.


Oeconomia 15 (2) 2016, 27–36
VALORIZATION OF PUBLIC GOODS IN THE ENVIRONMENT OF AGRITOURISM FARMS – AN ATTEMPT AT MODELING
Agnieszka BrelikWest Pomerania University of Technology in Szczecin
Abstract. The infl uence of public goods for the economic size of agritourism farms in West Pomerania region. For this purpose, it was used data from the conducted in 2012 survey of 150 agriculture farms (economic variables). The work was calculated coeffi cients of the two models of linear least squares method crotch (KMNK). All statistical analyzes and modeling done in the program. Statistica version 12.
Key words: public goods, agritourism, multifunctional development
INTRODUCTION
On the ground of neoclassical economy, which deals with the concept of perfect com-pletion, it is the market and the price mechanism that allowed adapting demand and sup-ply, assuring optimal usage of resources both on the microeconomic and macroeconomic level. Nevertheless, the market mechanism does not function properly and it departs from the model of perfect competition. One of the common symptoms of market failure was related to certain kinds of goods, described in economy as public goods (Hofmokl 2009). The theory of public goods is one of the elements of a much broader theory of public choice, which includes economic theory of democracy, advocacy group theory, the theory of public goods or rent-seeking mechanisms [Wilkin 2005]. These theories function in the idea of new institutional economy, which is a successful blend of neoclassical economy
Corresponding author: Agnieszka Brelik, West Pomeraria University of Technology in Szczecin, Faculty of Economics, Institute of Economy Politics and Tourism, Żołnierska 47, 71-210 Szczecin, Poland, e-mail: [email protected]© Copyright by Warsaw University of Life Sciences Press, Warsaw 2016
ISSN 1644-0757eISSN 2450-4602
http://acta_oeconomia.sggw.pl

28 A. Brelik
Acta Sci. Pol.
and institutionalism [Czyżewski 2009, Grzelak 2010]. It is one of the most dynamically developing trends in the contemporary economy, also raising interest in other social sci-ences, namely, political sciences, sociology and law. The theory of public choice is the economic theory of politics. This relatively new branch of economic sciences relies on using tools and methodological concepts of standard economy to analyse people’s behav-iour in politics and other fi elds of public spheres [Wilkin 2005].
Agriculture and rural areas are an open system consisting of three interdependent and interfusing subsystems: social, economic and ecological, which concerns the relation of agriculture with environment. The effects of farming depend on many external factors, but most importantly on environmental terms [Szumski 2007]. The transfers of public funds to agriculture began to take the shape of payment for farmers’ services to compen-sate the environment and landscape, which constitute public goods [Małażewska 2015].
Public goods increasing the value of landscape and the quality of live in rural area should pose as an incentive to set up agritourism farms which base on its value. Therefore, they allow using the working factor better and diversifying the business activity, simulta-neously increasing the income of administrative entities such as municipality. Supporting the process of public goods supply constitutes, in this respect, creating lucrative positions in rural areas for highly qualifi ed employees in farming, horticulture, food processing and nutrition-oriented services. It is the source of benefi ts for private entities operating on the basis of public goods, but it also includes the whole communities generating additional income in different forms (at different stages of income division of the municipality – pri-mary, secondary or fi nal income). At the fi rst attempt, public goods will be treated as free goods, which in this situation are given by nature, and consequently acquired at zero cost for consumers. In this case the consumer refers to agritourism farms using public goods situated in the municipality area where they are located. We certainly deal with alternative cost for the entire community. These goods provide benefi ts for business entities, which on its basis can acquire additional benefi ts. Taking into consideration such viewpoints would mean that the costs connected with public goods would be allotted to private enti-ties attaining these economic effects. Thus, those households, which in their activity show more diligence for the environment, e.g. animals’ and plants’ well-being, preservation of ecosystems, should declare higher income. Eventually, it should be refl ected in the higher income generated from agritourism. There is also a question if the market, in its estimates, considers public goods in commercial businesses, and if so, to what extent. Additionally, combining production of goods with public goods, which provide additional (although undervalued) income allows to use allocated production factors in a particular household more effectively. Consequently, an increased productivity of production factors engaged in local business entities, which base on local public goods, should be noticed. On the other hand, in such an attitude it would mean that market can add value to public goods, which according to the theory, is in a large extent restricted and, therefore, we deal with scarcity in providing public goods. Thus, the effectiveness in this case introduced by means of receiving income by agritourism households should not demonstrate a strong relation to public goods (on the assumption of relatively low maintenance costs). Simi-larly to Tiebout model which is described as incomplete [Oates 2006], we do not take

Valorization of public goods in the environment... 29
Oeconomia 15 (2) 2016
into consideration the costs of fi nancing public goods. The essence of Charles M. Tie-bout’s hypothesis leads us to the assumption that consumers, on account of preferences or the amount of income are active in searching for optimal local community, so the human vigour may cause a great number of consequences for public fi nances. Charles M. Tiebout assumed that a voter consumer may be interested in choosing local commu-nity, which would satisfy their preferences most effectively in case of public goods. The author claimed that a voter consumer wants to make a choice of local community that corresponds best with their preferences on account of public goods offer. On the central level, the preferences of voter consumers are known and the central authorities adjust public offer, but the income and costs of local communities can differ. Because of taking into consideration the differences, a voter consumer dwells where a local government’s offer suits their demands. Charles M. Tiebout assumed that consumers possess perfect information in a matter of choosing an optimal local community. In this way, Charles M. Tiebout hypothesis is based on the assumption that preferences towards public local services and the amount of disposable income may differentiate the people. Maintaining the thesis of different incomes and spendings, consumer voters make a choice of the local community, which best satisfi es their preferences. So voting with their feet leads to the development of differential local communities.
Referring back to the model, we refer to the situation, that in certain conditions this model ascertains effective allocation of resources regarding to the existence of public goods. Certainly, there is a risk resulting from uneven profi ts generated by businesses located in municipality due to public goods. Some scientifi c publications referring back to that considered model (including Esteban and Ray [1999], Khwaja [2004], Singleton [2014] indicate such threats). In this situation, business entities gaining above-average profi ts will increase the involvement of production factors. It may jeopardize the balance to some extent, and simultaneously the whole mechanism of cost measures of delivery of public goods becomes more complex.
RESEARCH METHOLOGY
The work used many research methods, among which were the study of selected liter-ature and statistical methods. A review of scientifi c literature, which plays a fundamental role in the considerations over multifunctional development of rural area and farmers as suppliers of public goods in agritourism, was the introduction to a few stages of conduct research. The research was based on deductive method using both domestic and foreign literature. Data used in the research was collected in 2012 after interviewing 150 rural farms with agritourism specialisation in Western Pomerania Province and obtained from Provincial Statistical Offi ce in Szczecin. The variables were used to build models:X1 – Expenditure on fi xed assets of wastewater management and water conservation (thousand PLN per 1 km2);X2 – Expenditure on fi xed assets in total water management (thousand PLN per 1 km2);X3 – The area municipalities (km2);X4 – Total population municipalities (number of people);X5 – Density of population (persons per km2);

30 A. Brelik
Acta Sci. Pol.
X6 – Forest cover (%);X7 – The areas about the qualities of holiday (ha to 1 km2);X8 – The number of lakes in the municipality category 1 (quantity); X9 – The number of lakes in the municipality of category 2 (quantity);X10 – The number of lakes in the municipality of category 3 (quantity);X11 – The number of lakes in the municipality of categories 4 and 5 (quantity);X12 – The area of natural areas protected by law (ha per 1 km2);X13 – Number parks (number per 1 km2);X14 – The area of nature reserves (ha per 1 km2);X15 – The number of natural monuments (number per 1 km2);X16 – The area of Natura 2000 sites (ha per 1 km2);X17 – The number of national parks (number per 1 km2);X18 – The share of agricultural land (UAA) in the total area (%);X19 – The share of grassland in the agricultural land (%);X20 – Employment in agriculture (number of people per km2);X21 – Granted accommodation (number of per 1 population of 1,000);X22 – The number of farms in the municipality (quantity);X23 – Farm area (km2);X24 – The period of activity of agritourism (years);X25 – The number of tourists visiting Polish agritourism farms (annual number of people);X26 – The number of beds in farm leading agritourism (number);X27 – The number of foreign tourists visiting an agritourism (annual number of people);X28 – The total number of tourists visiting annually agroturism farms (number);X29 – The number of overnight stays in farm tourism (annual number of people);X30 – Income from crop production (PLN);X31 – The level of area payments (PLN per km2);X32 – The value of subsidies area LFA (thousand PLN per 1 ha);X33 – The number of lakes including categories 1 to 5 (quantity);X34 – Income from agritourism farm (PLN);X35 – Subsidies from the RDP in 2007–2013 (PLN);X36 – Income per capita GDP (PLN);X45 – Age of farm owners (years); X46 – Gender farm owners (0 – man, 1 – woman);X47 – Education farmers (1 – basic, 2 – professional, 3 – average, 4 – higher).
Coeffi cients of the two models of linear least squares method crotch (KMNK) was calculated in paper. In this method was determined by linear form:
0 1 1 2 2 ... t tY x x xβ β β β= + + + +
where: Y – dependent variable; x1, x2, …, xt – explanatory variables; β1, β2, …, βt – model coeffi cients;

Valorization of public goods in the environment... 31
Oeconomia 15 (2) 2016
so that the sum of squared deviations resulting linear function of the actual value yi as small as possible:
( )20 1 1 2 2
1( ... ) min
N
i i i t tiiy x x xβ β β β
=
− + + + + →
the explanatory variables in the model chosen (enter or removed) were iteratively in the following steps of the method. The introduction or removal of variables from the model is determined by the critical value for F-statistic or critical values for p [http://www.statsoft.pl/textbook/stathome.html, accessed April 2015].
RESULTS
The analysis of stepwise regression proved the average relation (R2 = 0.32) between public goods present in particular municipalities and a level of income of agritourism households (Table 1). Among those factors, which have shown a positive effect (coef-fi cient β >0) on the level of income of agritourism households are: a number of lakes in cleanliness standards 1–3 situated in municipality (X33) (the numbers were combined due to a small number of lakes of different standards) and the area of unique tourist values (X7). These factors increase the level of income generated by agritourism households. A small number of lakes with relatively high cleanliness standards had a huge infl uence. Correction ratio (coeffi cient β <0) was a total municipality area (X3), in relation to the resources characterising environmental values, but also economic (the number of people working in farming). Therefore, lowering the shares of public goods and highly valued natural resources in a particular location restricted the level of profi ts.
According to the underlying estimation of the size of agritourism farm income repre-sented by the following linear model:
Y = 44,320.9 – 60.0410xi3 + 832.958xi7 + 91.829xi20 + 231.672xi33
where i – index of the municipality.
The presented model indicates that municipalities with a larger area and wider di-versity of businesses, as well as the kinds of public goods showed weaker correlation of income with goods.
Interestingly, from the point of view of correlations between agritourism households income and public goods is the role that was allotted to the number of people working in farming. A greater number of people working in this segment of the economy increased the income generated in agritourism household. It can be indirectly connected with public goods supplied by farmers, which were not taken into account directly in the analysis. It can be assigned to the concept of multifunctional agriculture, which provides additional in-come for businesses conducting ventures connected with farming. At the same time it points

32 A. Brelik
Acta Sci. Pol.
Table 1. Model 1. Estimation KMNK, used variables 1–36The dependent variable (Y): The average income of an agritourismIndependent variable
FactorΒ Standard error t-Student value p
Constant 44 320.9 7 723.16 5.739 2.59e-06c
X3 −60.041 23.3350 −2.573 0.0151a
X7 832.958 108.521 2.638 0.0012b
X20 91.829 31.7188 2.895 0.0069c
X33 231.672 107.896 2.147 0.0397a
The arithmetic mean of the dependent variable 25 152.17 standard deviation of
the dependent variable 18 961.18
The sum of squared residuals 8.48e+09 standard error of residues 16 538.84
The coeffi cient of determination R-squared
0.326135 adjusted R-squared 0.239184
Statistic F (4, 31) 3.750813 value p for F-test 0.013335Logarithm credibility −398.0750 Akaike’s information criterion 806.1500Bayes’s and Schwarz’s criterion 814.0676 Hannan’s and Quinn’s criterion 808.9135
Notes: a p <0.05, b p <0.01, c p <0.001 – adopted statistical signifi cance coeffi cients in the model, indi-cated by the beta factors statistically signifi cant different from zero at the signifi cance level α = 0.05.Source: Own calculations.
at dependencies between the development of agritourism and agriculture. In this case there is inevitably a combination of incomes generated from institutional system, between typical farming businesses and agritourism. Financial support realised under the common agricultural policy becomes a joint link. Multifunctionality suggests that farming may realise highly appreciated non-productive functions, which may not be produced by other segments of the economy. Agriculture in many regions of Europe shaped the landscape and signifi cant areas, which may constitute the source of public goods supply. A crucially important feature is the natural character of resources (especially area) related to farming. Therefore, according to Whitby [2000], farming in its nature is multifunctional. However, the level of socio-economic development causes the specifi c gradation of farming value in the system of social needs. An important aspect which is taken into consideration is the biological character as well as the multitude of both intended and unintended addi-tional products, taking the resemblance of public goods [OECD 2003]. The leverage of resources, through considering non-productive agricultural functions, leads to lowering the pressure of intensity of its implementation and consequently decreases the negative external effects. The leverage results in forming additional sources of generating income including the government grants.
Referring back to the location theory is partly agreeable with the concept of reversed circles by Thunen and the role of peripherals according to new economic geography rais-ing the importance of immobility of factors of production. So it presents the possibility of

Valorization of public goods in the environment... 33
Oeconomia 15 (2) 2016
differentiating income and profi ts stemming from the immobility of factors connected to a particular location, on which the demand is out-of on site. Low value model considering selected factors indicates the greater role of other phenomena connected with managing resources in agritourism households on economic results of those businesses. Assum-ingly, on one hand the market does not value the public goods, on the other, though; these goods are not the only ones that are taken into consideration when generating economic benefi ts. It is in the accordance with the previous assumptions one the basis of theoreti-cal clues indicating that such a relation might not have a strong bond. Referring to the Tiebout model, thereby, the potential benefi ts of agritourism households generate, can be measured by means of the number of tourists per one agritourism household. Then we omit a frequently raised issue of social preferences, because they are characterised by the number of visitors in the community per year. In this situation it can be noticed a higher level of coordinates characterising public goods present in particular territorial entities.
The relation between the number of lodgings in agritourism households and other factors characterising public goods and the communities tries to determine whether the amount of public goods infl uences the attractiveness of the community from the tour-ists’ viewpoint. This is the correlation, which shows more directly relations between the public goods and agritourism effects. A whole range of factors characterising the man-agement effi ciency and allocation of resources in agritourism household contributes to the economic outturn. It has been estimated that there is a correlation between these values (Table 2). The correlation presented in the form of equation describing the number of lodgings in agritourism households proved the expectations in case of higher level of relevance (coeffi cient R2 = 0.43, on a higher level than in the previous model ver-sion). However, it is not a satisfying level. The density of population was the correction factor (X5), whose increase infl uenced agritourism movement negatively. Together with the previously presented assumptions it constitutes the constraint for the development of agritourism limiting the access to certain public goods. However, with a higher level of afforestation (X6) and the substantial proportion of agricultural area (X18), where the fi rst one refers directly to the occurrence of public goods, and the second one, though, must be allocated to the open areas, which appeared in other research, strengthened the increase of number of tourists in agritourism households.
According to the uderlying estimation of the size of the number of overnight stays in farm engaged in agro-tourism is expressed by the following linear model:
y = − 6.16848 − 0.502908xi5 + 0,734532xi6 + 0,984118xi18
where i – the index of the municipality.The number of lodgings correlated with the density of population (X55), the affor-
estation of the community (X6) and the size of arable areas (X18) in municipality area. The fi rst measure shows a negative correlation as expected. Lower population density is accompanied by the increased number of lodgings in agritourism households. A higher level of afforestation, together with a higher share of arable areas (contrary to the fact

34 A. Brelik
Acta Sci. Pol.
Table 2. Model 2. Estimation KMNK, used variables 1–36 The dependent variable (Y): The number of overnight stays (Y)Independent variable
FactorΒ Standard error t-Student value p
Constant −6.16848 23.9641 −0.2574 0.03985a X5 −0.502908 0.168284 −2.988 0.0054b
X6 0.734532 0.323743 2.269 0.0302b
X18 0.984118 0.263507 3.735 0.0007c
The arithmetic mean of the dependent variable
46.16667 standard deviation of the dependent variable 26.62169
The sum of squared residuals 14,149.24 standard error of residues 21.02769
The coeffi cient of determination R-squared
0.429581 adjusted R-squared 0.376104
Statistic F (4, 31) 8.033041 value p for F-test 0.000395Logarithm credibility −158.6119 Akaike’s information criterion 325.2239
Bayes’s and Schwarz’s criterion 331.5580 Hannan’s and Quinn’s criterion 327.4346
Notes: Evaluation of the statistical signifi cance of the coeffi cient of the independent variable: a
p <0.05, b p <0.01, c
p <0.001.Source: Own calculations.
that agriculture is usually the main benefi cent of the soil) are factors which increase the touristic attractiveness of the area. In case of the second factor, it must be related to the occurrence of open areas and the attractive landscapes shaped by households. An average matching coeffi cient indicates a considerable diversity and the occurrence of additional conditions not related to the evaluated public goods.
CONCLUSIONS
The valorisation of public goods and proving their infl uence on the level of income generated by agritourism households may occur indirectly. Institutional system related to the economic policy associated with secondary distribution of national income, and here understood as common agricultural policy, is the intervening process. Thus, it is not the market that directly pays for the occurrence of public goods. Institutional system, having made a social contract, triggers the fl ow of funds which are a payment for delivering pub-lic goods. They constitute the mechanism by means of which the level of income is raised and public goods are included in economic calculation. It is crucial, as this area plays a more important role as a result of changes in public demand. As it has been indicated in the research, agritourism has a wider range of supporters, and with its preferences for a balanced growth of rural area, it affi rms the possibility to use the areas dominated by farming. Developed mechanism of funds transferred into agriculture, and in this case, to

Valorization of public goods in the environment... 35
Oeconomia 15 (2) 2016
agritourism is the answer to the demand voiced by at least the part of society. On the other hand, there appears the danger of ineffective allocation of the funds owing to political rent-seeking. It results in the way of supply of the goods and services, which is justifi able when market mechanism does not assure proper allocation of resources. The phenomenon of political rent-seeking is the effect of regulations or direct budget transfers. It results in weakening social consensus and the lack of effectiveness according to Pareto. Such a viewpoint introduces a new context in relation to choices made by business entities.
ACKNOWLEDGEMENT
Article was funded by the National Science Centre, awarded on the basis of deci-sion DEC-2011/01/B/HS4/02858. Partly was used fragments of book A. Brelik (2015) Public goods on rural areas as a factor of rural tourism development in West Pomerania region.
REFERENCES
Brelik, A. (2015). Public goods on rural areas as a factor of rural tourism development in West Pomerania region. Warsaw.
Czyżewski, B. (2009). Evolution of Land Rent Theory and its Signifi cance for the EU Agriculture. Proceedings of the international scientifi c conference Economic Science for Rural Devel-opment, 7/1, 83–131.
Esteban, J., Ray, D. (1999). Collective Action and the Group Size Paradox. IEE Working Papers 23. El Instituto de Estudios Economicos de Galicia Pedro Barrie de la Maza.
Grzelak, A. (2010). Czy teorie kryzysów ekonomicznych są przydatne dla wyjaśniania sytuacji w gospodarce żywnościowej? Roczniki Naukowe SERiA, 12 (1), 60–64.
Hofmokl, J. (2009). Internet jako nowe dobro wspólne. Wydawnictwo Akademickie i Profesjonalne, Warszawa.
Khwaja, A.I. (2004). Is Increasing Community Participation Always a Good Thing? Journal of the European Economic Association, 2 (2–3), 427–436.
Małażewska, S. (2015). Środowiskowe dobra publiczne w rolnictwie i na obszarach wiejskich. Ekonomia i Środowisko, 1 (52), 132–147.
Oates, W. (1972). Fiscal Federalism. Harcourt Brace Jovanowich, New York. OECD (2003). Multifunctionality: the Policy Implications. Paris.Singleton, J. (2014). Sorting Charles Tiebout. The Center for the History of Political Economy.
Working Paper Series 20.Szumski, S. (2007). Wspólna polityka rolna Unii Europejskiej. Warszawa.Whitby, M. (2000). Challenges and Options for the Agri-environment: Presidential Address. Jour-
nal of Agricultural Economics, 51, 317–332.Wilkin, J. (2005). Teoria wyboru publicznego. Wstęp do ekonomicznej analizy polityki i funkcjo-
nowania sfery publicznej. Scholar, Warszawa.
WALORYZACJA DÓBR PUBLICZNYCH W OTOCZENIU GOSPODARSTW AGROTURYSTYCZNYCH – PRÓBA MODELOWANIA
Streszczenie. W pracy dokonano próby waloryzacji dóbr publicznych w otoczeniu ba-danych gospodarstw agroturystycznych Pomorza Zachodniego. Do tego celu posłużono się danymi z przeprowadzonych w 2012 roku badań ankietowych wśród 150 gospodarstw

36 A. Brelik
Acta Sci. Pol.
agroturystycznych (zmienne ekonomiczne). W pracy obliczono współczynniki dwóch mo-deli liniowych krokową metodą najmniejszych kwadratów (KMNK). Wszystkie analizy statystyczne oraz modelowanie wykonano w programie. Statistica wersja 12.
Słowa kluczowe: dobra publiczne, agroturystyka, wielofunkcyjny rozwój
Accepted for print: 19.04.2016
For citation: Brelik A. (2016). Valorization of public goods in the environment of agritourism farms – an attempt at modeling. Acta Sci. Pol., Oeconomia, 15 (2), 27–36.

Oeconomia 15 (2) 2016, 37–47
ENTERPRISE INSOLVENCY AND THE EFFECTS ON THE LOCAL AND REGIONAL COMMUNITY – THE SOCIAL ECONOMY PERSPECTIVE
Justyna Franc-DąbrowskaWarsaw University of Life Sciences – SGGW
Małgorzata Porada-RochońUniversity of Szczecin
Radosław Suwałaindependent researcher
Abstract. In the article examines the issue enterprise insolvency and the effect it has on local and regional communities. Due to the fi rst symptoms of insolvency, such as diffi culty or an inability to settle liabilities when they come due, a model was adopted for the dependent variable level of commitments. The companies are divided into two groups – those, whose level of commitment was less than the median, and those, whose level was higher. It was found that companies with excessive level of commitments are more exposed to the risk of insolvency. The research enabled the identifi cation of determinants for forming commit-ments. It is very important that the inability of just one company to meet its obligations can have signifi cant consequences for the local market. While the phenomenon, as manifested in the insolvency transfer for the following entities may be a signifi cant factor in negative circumstances affecting the wider community – the regional approach.
Key words: enterprise insolvency, local community
INTRODUCTION
The study seeks to determine the effects of insolvency for companies in the small and medium-sized enterprises SMEs sector. The study included the following stages: a survey of the relevant literature, the development of two panel models, the opportunities and the
Corresponding author: Justyna Franc-Dąbrowska, Warsaw University of Life Sciences – SGGW, Department of Economics and Organization of Enterprises, Division of Finances of Enterprises and Accountancy, Nowoursynowska 166, 02-787 Warszawa, Poland, e-mail: [email protected]© Copyright by Warsaw University of Life Sciences Press, Warsaw 2016
ISSN 1644-0757eISSN 2450-4602
http://acta_oeconomia.sggw.pl

38 J. Franc-Dąbrowska, M. Porada-Rochoń, R. Suwała
Acta Sci. Pol.
risks factors determining solvency problems of SMEs on the local and regional commu-nity. The article is the latest installment in a series of articles on private sector enterprise insolvency. Earlier stages of the research identifi ed factors that enable the identifi cation of the threat of insolvency in a group of companies. Continuing with the analysis, the pres-ent article develops two panel models for the test group of companies. One of the factors is the community affecting the company’s current liabilities and their timely adjustment. The inability to pay for an obligation by its maturity date may result in a snowball effect, where problems with liquidity are shifted to many companies associated with the troubled entity and the companies continue to state their liquidity problems. This, in turn, can wreak havoc on the company’s immediate environment, family and staff, as well as the entire larger environment not directly related to the unit. The greater the scale of the prob-lems attending insolvency, the wider the problem will spread to the local and regional community. At the same time, a company’s lack of fi nancial problems coupled with the threat of insolvency might, on a positive note, help it forge a relationship of mutual sup-port with contractors, one that would lead to the development of cooperating companies, and also improve its fi nancial situation and that of its associates.
A key factor behind the increase or decrease in the risk of insolvency is current liabili-ties, in the models for the dependent variable is assumed to this category. In addition, the companies being researched are divided into two groups:
Model 1 for enterprises: the level of current liabilities was below the median level of current liabilities for the whole sample;Model 2 for enterprises: the level of current liabilities was higher than the median level of current liabilities for the whole sample.The distinction of the group of enterprises above and below the median value of cur-
rent liabilities is considered reasonable. Therefore, those companies with lower levels of current obligations should have fewer problems settling them on time than companies with a higher level of commitments. In addition, credit traders running up debt to excessive lev-els a sign of a deteriorating fi nancial situation and the attendant risk of insolvency.
LITERATURE REVIEW
The 2008–2009 global economic crisis highlighted the real fi nancial problems of en-terprises, particularly the problems of insolvency, which has since been the subject of hundreds of research studies i.a. Claessens et al. [2011], Chaston [2012], Porada-Rochoń [2013], Zeitun and Saleh [2015].
Short-term debt plays a crucial role in capital structure because it enables liquidity to be assessed. From both the entrepreneur’s and the bank’s point of view, short-term debt is a more preferable source of fi nancing [Landier and Thesmar 2009]. It is also very interesting how companies’ cash and profi tability affect the use of credit lines [Lins et al. 2010, Campello et al. 2011].
A lack of short-term debt can lead to solvency problems, fi nancial distress or even bankruptcy. Opler and Titman [1994] argue that there is an inverse relation between a fi rm’s fi nancial leverage and its performance in periods of economic distress. The prob-lem with having too high a level of debt, especially short-term debt, is that it is accompa-
•
•

Enterprise insolvency and the effects on the local... 39
Oeconomia 15 (2) 2016
nied by both direct and indirect costs, as well fi nancial distress costs. On the other hand, Wruck [1990] pointed out that carrying debt for fi nancial operations comes not only with costs but also potential benefi ts, one of which is the ability to restructure.
In spite of the potential benefi ts, however, it cannot be denied that a wide range of stakeholders suffer due to corporate insolvency. The main stakeholders affected by the 2008–2009 crisis (and who continue to be affected by corporate fi nancial problems today) were employees. Of course, investors, customers [Jacob 2012] and households also suf-fered. After all, SMEs responded to the global crisis with mass redundancies and “short--term working” income compensation schemes, which together ate away at the fi nancial condition of thousands of households.
Suppliers of fi nancially distressed fi rms may also suffer negative liquidity shocks, which can affect all suppliers and customers alike. This is consistent with the fi ndings of Boissay and Gropp and Reint [2012], who write that liquidity shocks are passed down the supply chain from defaulting customers to a fi rm’s suppliers, while fi rms with access to outside liquidity absorb these shocks with their “deep pockets” [Love and Zaidi 2010].
One of the tools to increase trust and the ethical treatment of stakeholders is corporate social responsibility (CSR), which has implications for the community in many ways. One is that it can reduce both the scale of insolvency and the risk of corporate insolvency occurring. Many organizations now have subsections on their websites detailing the spe-cifi c CSR programmes they have in place. Davis [1993] defi nes CSR as the voluntary efforts by business to achieve a balance of economic goals and quality of life.
The substantial increase in CSR practices has recently fueled research on the relation-ship between CSR and fi nancial performance. From a fi nance perspective, Jiao [2010] summarizes these views as having both a positive and a negative effect on corporate performance. One positive aspect is that CSR represents an investment in intangible as-sets, such as reputation and human capital, which help enhance fi rms’ competiveness. On the other hand, CSR represents private benefi ts (e.g. respect, job security, public image) that managers extract at the expense of shareholders. Hammond and Slocum [1996] have concluded that CSR can improve a corporation’s reputation and lower its fi nancial risk, rendering it less likely to go bankrupt than those which do not engage in CSR. Den Hond et al. [2014] insist that fi rms must pay close attention to their stakeholders and be consist-ent in sustaining their social performance, as well as political performance.
Perrin [2009] presents a new methodology which helps to assess employee perspec-tives on sustainable business practices (the SBP index). The methodology focuses par-ticularly on improving the quality of life of workers, family members, local communities and society at large [Ismail 2009]. While communities benefi t from these initiatives, there are also benefi ts to business, as enterprises build relationships and trust which may be helpful to them in gaining future support from communities for company development initiatives.
Alshammari [2015] found that fi rms expect to benefi t from socially responsible initia-tives and activities when they can be seen by a large number of constituents and stake-holders. The publicity of the fi rm’s activities can positively moderate the relationship between CSR activities and fi nancial performance.
It is very likely that, thanks to the crisis, many companies now have a better under-standing of the importance of social risks and their impact on reputation.

40 J. Franc-Dąbrowska, M. Porada-Rochoń, R. Suwała
Acta Sci. Pol.
METHODS USED TO INVESTIGATE THE RELATIONSHIP BETWEEN CASH FLOW AND OTHER VARIABLES
The study seeks to determine the effects of insolvency for companies in the small and medium-sized enterprises SMEs sector. The study included the following stages: a survey of the relevant literature, the development of two panel models, the opportunities and the risks factors determining solvency problems of SMEs on the local and regional commu-nity. The article is the latest installment in a series of articles on private sector enterprise insolvency. Earlier stages of the research identifi ed factors that enable the identifi cation of the threat of insolvency in a group of companies. Continuing with the analysis, the present article develops two panel models for the test group of companies. One of the fac-tors is the community affecting the company’s current liabilities and their timely adjust-ment. The inability to pay for an obligation by its maturity date may result in a snowball effect, where problems with liquidity are shifted to many companies associated with the troubled entity and the companies continue to state their liquidity problems. This, in turn, can wreak havoc on the company’s immediate environment, family and staff, as well as the entire larger environment not directly related to the unit. The greater the scale of the problems attending insolvency, the wider the problem will spread to the local and region-al community. At the same time, a company’s lack of fi nancial problems coupled with the threat of insolvency might, on a positive note, help it forge a relationship of mutual sup-port with contractors, one that would lead to the development of cooperating companies, and also improve its fi nancial situation and that of its associates.
A key factor behind the increase or decrease in the risk of insolvency is current liabili-ties, in the models for the dependent variable is assumed to this category. In addition, the companies being researched are divided into two groups:
Model 1 for enterprises: the level of current liabilities was below the median level of current liabilities for the whole sample;Model 2 for enterprises: the level of current liabilities was higher than the median level of current liabilities for the whole sample.The distinction of the group of enterprises above and below the median value of cur-
rent liabilities is considered reasonable. Therefore, those companies with lower levels of current obligations should have fewer problems settling them on time than compa-nies with a higher level of commitments. In addition, credit traders running up debt to excessive levels a sign of a deteriorating fi nancial situation and the attendant risk of insolvency.
METHODOLOGY
The panel-data are a collection of observations from the analysis information for a particular phenomenon of the individual in subsequent periods. Each unit in a set is observed with a specifi c frequency (months or years, for example). The size of the panel is defi ned in terms of the number of units participating in the survey (N) and the number of periods in each of these units was the test (T).
•
•

Enterprise insolvency and the effects on the local... 41
Oeconomia 15 (2) 2016
Therefore, the variables in the panel-data set have a double notation, e.g. yit (i = 1, N; t = 1, T) [Gruszczyński et al. 2010]. The research material is balanced and structured as a panel about microdata on fi nancial-economic considerations. The micropanel includes aggregate information on an annual basis for the years 2007–2011 for 215 SMEs, giving a total of 1,075. The analysis of cross-sectional data uses a linear regression model for panel data with random effects.
The static linear model for panel data in the form of a one-way model can be ex-pressed by the formula [Gruszczyński et al. 2010]:
it i ity α β ε= + +Titx (1)
where: yit – dependent variable; αi – individual effect for each tested entity; T
itx – dependent variable vector; β – vector of parameters in the model; εit – random component in the model.
The individual effect includes fi xed-time information about each unit that affects the dependent variable yit. However, due to the fact that they are diffi cult to measure or de-scribe in the form of a numeric variable in nature, they are not included among the ex-planatory variables xit [Gruszczyński et al. 2010].
Two types of estimation are applied: fi xed effects and random effects [Verbeek 2004]. The simple model with random effects can be derived using this formula [Verbeek 2004]:
it i ity μ α β ε= + + +Titx (2)
where: yit – dependent variable; μ – free term in the model; αi – individual effect of each tested entity; T
itx – dependent variables’ vector; β – vector of the structural parameters of the model; εit – random component.
The effects in Model 2 are random, so there is no need to estimate any additional parameters.
A model of the form of equation (2) can be presented as [Gruszczyński et al. 2010]:
it ity vμ β= + +Titx
vit = αi + εit
for i = 1,N , 1,t T=
where: vit – the sum of the random individual effects (αi) and white noise (εit).
In the random effects models, it is assumed that εit ~ IID 2(0; )σ∈ and close exogenic
issue dependent variables are E (xit · εis) = 0, for each i = 1,N and t, s = 1,t T= and [Gruszczyński et al. 2010]:

42 J. Franc-Dąbrowska, M. Porada-Rochoń, R. Suwała
Acta Sci. Pol.
for each unit the distribution of individual effects meets αi ~ IID 2(0; );ασthe independence of individual effects αi of independent variables xjt in the model for any i, j = 1,N and 1,t T= in order to avoid endogenous problems;the independence of individual effects αi from the random component of the model εit for all units i and in all periods t; that is, E (εit· αj) = 0 for each i, j = 1,N and 1,t T= . To meet the assumptions of causes compliance and unbiasedness of least squares
method (LSM) estimator used in Model 2. It is not effective [Gruszczyński et al. 2010].The matrix inverse of matrix Ω – the sum of the random individual effects (αi) and
white noise (εit) – is the matrix Ω–1 given by formula:
Ω–1 =
1
1
0
0
ω
ω
−
−
(3)
The matrix inverse to the variance–covariance matrix Ω–1 can be presented in this form [Gruszczyński et al. 2010]:
Ω–1 = –12
1 1[ ( 1)]Tε
ψσ
+ −TI u (4)
where:2
2 2Tε
ε α
σψσ σ
=+ ⋅ (5)
After inserting equation (4) into the formula for the UMNK Estimator and determin-ing that y is the average of the dependent variable for all units in all available periods, and the x is the medium-sized independent variable for all units in all available periods, an estimate is obtained:
–1
1 1 1
1 1 1
ˆ ( )( ) ( )( )
( )( ) ( )( )
N T NT T
RE it i it i i ii t i
N T NT T
it i it i i ii t i
x x x x T x x x x
x x y y T x x y y
β ψ
ψ
−
= = =
= = =
= − − + − − ×
× − − + − −
(6)
with the variance–covariance matrix given by the formula:
( ) 12
1 1 1ˆ{ } ( )( ) ( )( ) )N T NT TRE it i it i i ii t i
V x x x x T x x x xεβ σ ψ−
= = == − − + − − (7)
After the appointment of the estimates 2εσ and 2
ασ and placing them into formula (6), an estimate of the OUMNK (feasible GLS) is determined; this is called the random effects estimator.
An estimate of the 2ασ of the fi rst previous estimate of an additional model using the
so-called intergroup estimator [Gruszczyński et al. 2010].
••
•

Enterprise insolvency and the effects on the local... 43
Oeconomia 15 (2) 2016
Table 1 shows the results of model tests for the companies investigated. This group’s level of creditors was below the median and therefore they should be at less of a risk of insolvency and thus constitute a group of companies with less risk of a negative impact on the local and regional community.
Table 1. Determinants forming creditors in SME below median creditors
Coeffi cients Estimate SE t-value Pr(>|t|) Signifi -cance
Effects: var SD share
idiosyncratic: 3 163.34 56.24 0.431individual: 4 172.35 64.59 0.569theta: 0.6371
Residuals:Min. 1st Q Median 3rd Q Max. –285.000 –15.100 –0.388 14.200 840.000
(Intercept) 11.200964 15.43022053 0.7259 0.4680525lag(DebtorsthEUR, 0) 0.29063819 0.09409504 3.0888 0.0020618 b
lag(CurrentliabilitiesthEUR, 0) 0.20209143 0.05253347 3.8469 0.0001267 c
lag(OperatingPLEBITthEUR, 0) –0.1196472 0.05618501 –2.1295 0.0334393 a
lag(ROA, 0) 0.31314657 0.16540927 1.8932 0.0586064 .lag(ROE, 0) 0.00353844 0.00063067 5.6106 2.57E–08 c
lag(ShareholdersFounds_to_Totalassets, 0)
–0.37959338 0.12562335 –3.0217 0.0025737 b
Model parametersTSS: 6 603 300RSS: 3 520 200R2: 0.4669 Adj. R2: 0.46386 F-statistic: 155.895 on 6 and 1068 DF, p-value: <2.22e-16
a0.05; b0.01; c0.001; · – 0.1; empty cell – 1.Source: Own research.
It was found that the variables most strongly associated with the dependent variable of positive interdependence include debtors, current liabilities, ROA and ROE. Among the negative variables related to debt level of creditors identifi ed operating EBIT and shareholders founds total assets (SFTA). The use of these variables is justifi ed both in the subject literature and by practice. In enterprises where working capital is managed well, there is a direct relationship between statistical creditors, debtors, and current liabilities. A positive result of the use of the creditors for the test group of companies also provides a positive correlation with the profi tability indicators ROA and ROE. Keeping creditors below the median for the entire sample in the Model 1 entities has been observed to have a positive effect on the their fi nancial situation.

44 J. Franc-Dąbrowska, M. Porada-Rochoń, R. Suwała
Acta Sci. Pol.
There is, therefore, evidence to confi rm the principle that SMEs should keep a reason-able level of creditors, which will not result in excessive fi nancial burden and will not prevent them from settling their liabilities on schedule. As a result, the entrepreneur, his family and colleagues may feel satisfi ed with the work and remain assured that the under-taking will persevere. In turbulent times, ensuring the company’s continued existence and development is of paramount importance.
A sense of security is also essential for the entities that cooperate with the company as they In turbulent times, ensuring the company’s continued existence and development is of paramount importance.
Table 2 shows a similar calculation for the group of companies with a level of credi-tors above the median. This group of SMEs is clearly riskier as far as fi nancial deteriora-tion and insolvency are concerned. At the same time, some of the entrepreneurs who take fi nancial risk and use trade credits on a large scale will obtain very good results, though the fi nancial risk they take will be pronounced and burdensome.
Table 2. Determinants of creditors of SME above median creditors
Coeffi cients Estimate SE t-value Pr(>|t|) Signifi -cance
Effects: var SD share
idiosyncratic: 35 557.6 188.6 0.363individual: 62 288.3 249.6 0.637theta: 0.6466
Residuals:Min. 1st Q Median 3rd Q Max. –1 320.0 –64.2 –5.8 49.7 1 490.0
(Intercept) 50.654107 72.5846531 0.6979 0.4854536lag(CapitalthEUR, 0) –0.1503605 0.0596574 –2.5204 0.0119038 a
lag(CurrentliabilitiesthEUR, 0) 0.360397 0.0650924 5.5367 4.11E–08 c
lag(EBITDAMargin, 1) –6.9748132 2.5774174 –2.7061 0.0069434 b
lag(ReceivabletoTotalassets, 0) 2.8467134 0.7702928 3.6956 0.0002334 c
lag(OperatingrevenueTurnover th EUR, 0) 0.0290849 0.0095496 3.0457 0.002393 b
lag(ROS, 1) 3.4735212 1.7720267 1.9602 0.0502984 .lag(assetturnoverratio, 0) –0.2315867 0.1002343 –2.3105 0.0211011 a
Model parametersTSS: 76 563 000RSS: 30 496 000R2: 0.60169 Adj. R2: 0.59539 F-statistic: 160.691 on 8 and 851 DF, p-value <2.22e-16
a0.05; b0.01; c0.001; · – 0.1; empty cell – 1.Source: Own research.

Enterprise insolvency and the effects on the local... 45
Oeconomia 15 (2) 2016
In enterprises in which the level of creditors was higher than the median for the entire sample, the situation was somewhat different. Attention is drawn by negative determi-nants related to the dependent variable, including capital, the EBITDA margin and the asset turnover ratio. In this case, the issue of fi nancial security (defi ned as the golden rule of fi nancing) requires special attention, as the reduction of capital levels will deplete resources for the fi nancing of the fi xed assets, and this in turn can result in a greater likelihood of credit conditions deteriorating. The additional fi nancial burden of carrying high levels of debt may result in an increased risk of insolvency. Such conjecture may be considered confi rmed, since the negative variable associated with the dependent variable is the EBITDA margin, which provides information about the company’s fi nancial re-sults, particularly the results of operations. Another variable that requires comment is the asset turnover ratio, which can simplify the investment process and, for companies with a deteriorating fi nancial position, indicate diffi culties. Not without reason, unfi nished in-vestment processes are another factor that suggests a company may be having fi nancial diffi culties. The inability to invest reduces the company’s ability to develop and compete effectively in the market, which in turn could deepen its fi nancial problems and lead to insolvency. The negative effects of the entrepreneur, his family, employees and cooperat-ing companies (both suppliers and customers) have been earlier presented.
The M1 and M2 models are based on total data on small and medium-sized enterprises. A better solution would be to separate the models in both treatment groups of entities, pre-cisely because of the differences in their size. Such a combination was made consciously, because previous studies have suggested that part of the determinants concerning the risk of insolvency is the same for small and medium-sized enterprises. To recognize the differences among these two groups, the analysis was carried out in separate studies. An additional element that should be noted is that the inability to determine a number of fac-tors and in these studies one dependent variable has been considered. This assumption has also been taken deliberately, as specifi c determinants to the main factor have been looked for (that is, e.g., explanatory variables characterizing the level of creditors) and the other variables are subject to thorough analysis in subsequent stages of the study.
CONCLUSIONS
Studies show that in SMEs diversifi ed from the point of view of the level of the credi-tors, various factors affecting the increase in the risk of insolvency can be highlighted. It was found that keeping creditors below the median enables the company to improve its fi nancial situation. It can therefore be concluded that in SMEs, it is good to keep a reason-able level of debt, which will not burden the undertaking with additional costs or growth. As a result, both the entrepreneur, his family and colleagues can feel satisfi ed with the work and remain assured that the undertaking will not fold. Such a positive approach to the business and fi nancial benefi ts arising from its conduct are also important for entre-preneurs. They can in fact expect to receive timely entitlements and plan to adjust their obligations. In this context, companies interact with each other. At the same time, a group of companies with a level of creditors above the median of the identifi ed determinants of negatively associated with the dependent variable which should remain under special

46 J. Franc-Dąbrowska, M. Porada-Rochoń, R. Suwała
Acta Sci. Pol.
control of the entrepreneurs, as of they can contribute to the further deterioration of the fi nancial situation of the entity, and thus bring negative consequences for entrepreneur, employees and both near and far.
ACKNOWLEDGEMENT
This research is a part of the project fi nanced by the National Science Centre granted on the basis of decision DEC-2011/03/B/HS4/05503.
REFERENCES
Alshammari, Z. (2015). Corporate Social Responsibility and Firm Performance: The Moderating Role of Reputation and Institutional Investors. International Journal of Business and Ma-nagement, 10, 6, 1833–8119.
Boissay, Frédéric and Gropp, Reint (2012). Payment Defaults and Interfi rm Liquidity Provision. Forthcoming in the Review of Finance. Retrieved from http://dx.doi.org/10.2139/ssrn.966281.
Campello, M., Giambona, E., Graham, J.R., Harvey, C.R. (2016). Management and Corporate In-vestment During a Financial Crisis. Retrieved from http://ssrn.com/abstract=1444009 (accessed 10.01.2016).
Chaston, I. (2012). Recession and Family Firm Performance: An Assessment of Small U.K. Family Owned Hotels. Journal of CENTRUM Cathedra, 5 (1), 60–69.
Claessens, S., Djankov, S., Xu, L.C. (2011). Corporate Performance in the East Asian Financial Crisis. World Bank Research Observer, 15, 23–46.
Davis, P. (1973). How organizations can survive redundancy. Personnel Management, 22, 38–41.Gruszczyński, M. (Ed.), (2010). Mikroekonometria. Modele i metody analizy danych indywidual-
nych. Wydawnictwo Wolters Kluwers (in Polish).Hammond, S.A., Slocum, J.W. (1996). The impact of prior fi rm fi nancial performance on subsequ-
ent corporate reputation. Journal of Business Ethics, 15 (2), 159–165.Hond den, F., Rehbein, K.A., Bakker de, F.G.A., Kooijmans-van Lankveld, H. (2014). Playing on
Two Chessboards: Reputation Effects between Corporate Social Responsibility (CSR) and Corporate Political Activity (CPA). Journal of Management Studies, 51, 790–813.
Ismail, M. (2009). Corporate social responsibility and its role in community development: an inter-national perspective. The Journal of International Social Research, 2, 9, 199–209.
Jacob, Ch.K. (2012). The Impact of Financial Crisis on Corporate Social Responsibility and Its Implications for Reputation Risk of Management and Sustainability. Journal of Manage-ment and Sustainability, 2, 2.
Jiao, Y. (2010). Stakeholder welfare and fi rm value. Journal of Banking and Finance, 34, 2549–2561.Landier, A., Thesmar, D. (2009). Financial Contracting with Optimistic Entrepreneurs. The Review
of Financial Studies, 22, 1, 117–150.Lins, K., Servaes, H., Tufano, P. (2010). What Drives Corporate Liquidity? An International Survey
of Cash Holdings and Lines of Credit. Journal of Financial Economics, 98, 160–176.Love, I., Zaidi, R. (2010). Trade Credit, Bank Credit and Financial Crisis. International Review of
Finance, 10, 125–147. Opler, T.C., Titman, S. (1994). Financial Distress and Corporate Performance. The Journal of Fi-
nance, 49, 1015–1040. doi:10.1111/j.1540-6261.1994.tb00086.x.Perrin, T. (2016). Corporate Social Responsibility: It’s No Longer an Option. Retrieved from
http://www.towersperrin.com/tp/showdctmdoc.jsp (accessed 15.01.2016).

Enterprise insolvency and the effects on the local... 47
Oeconomia 15 (2) 2016
Porada-Rochoń, M. (2013). Modele decyzji fi nansowych mśp w wybranych krajach Europy Środ-kowo-Wschodnie w warunkach zaburzeń fi nansowych. Polskie Towarzystwo Ekono-miczne, Szczecin (in Polish).
Wruck, K. (1990). Financial distress, Reorganization and Organizational effi ciency. Journal of Fi-nancial Economics, 27, 419–444.
Verbeek, M. (2004). A Guide to Modern Econometrics. II edn. Wiley, Hoboken, NJ.Zeitun, R., Saleh, A.S. (2015). Dynamic performance, fi nancial leverage and fi nancial crisis: evi-
dence from GCC countries. EuroMed Journal of Business, 10, 2, 147–162.
NIEWYPŁACALNOŚĆ PRZEDSIĘBIORSTW A SKUTKI DLA SPOŁECZNOŚCI LOKALNEJ I REGIONALNEJ – PERSPEKTYWA EKONOMII SPOŁECZNEJ
Streszczenie. W artykule podjęto problematykę skutków niewypłacalności przedsiębiorstw dla społeczności lokalnej i regionalnej. Ponieważ pierwszym z symptomów niewypłacalno-ści są problemy z terminowym regulowaniem zobowiązań, w analizach modelowych przy-jęto za zmienną objaśnianą poziom zobowiązań bieżących. Przedsiębiorstwa podzielono na dwie grupy: te, których poziom zobowiązań był niższy od mediany, i te, których poziom był wyższy. Stwierdzono bowiem, że przedsiębiorstwa o nadmiernym poziomie zobowiązań bardziej narażone są na ryzyko niewypłacalności. Ważnym wynikiem badania są determi-nanty kształtujące poziom zobowiązań bieżących. Jest to o tyle istotne, że niewypłacalność tylko jednego przedsiębiorstwa może mieć znaczne konsekwencje dla lokalnego rynku. Zjawisko kuli śniegowej, objawiające się przeniesieniem niewypłacalności na kolejne pod-mioty, może być natomiast znaczącym czynnikiem negatywnie oddziałującym szerzej – na społeczność w ujęciu regionalnym.
Słowa kluczowe: niewypłacalność przedsiębiorstw, lokalna społeczność
Accepted for print: 25.04.2016
For citation: Franc-Dąbrowska J., Porada-Rochoń M., Suwała R. (2016). Enterprise insolvency and the effects on the local and regional community – the social economy perspective. Acta Sci. Pol., Oeconomia, 15 (2), 37–47.


Oeconomia 15 (2) 2016, 49–61
THE IMPORTANCE OF SELECTED DETERMINANTS OF ASSETS REPRODUCTION IN AGRICULTURAL HOLDINGS IN POLAND
Aleksander GrzelakPoznań University of Ekonomics
Abstract. The main aim of this article is to identify the importance of the determinants that shape processes of reproduction of assets (fi xed assets excluding land) in agricul-tural holdings in Poland conducting agricultural accountancy (FADN). The temporal scope of the analysis covers the period 2004–2012. One has stated that in a situation of economic growth the level of assets reproduction also noticeably improved; whereas the economic downturn was accompanied by impairment of those processes and dominance of narrowed reproduction. The infl uence of on reproduction processes of assets in agricultural holdings take place mainly on the channel: the conditions of business outlook-reproduction and productive resources – production – income – propensity to invest-reproduction. Among resource factors, one of relatively more importance in shaping of reproduction process-es is capital factor. The level of education of farm manager also differentiated the scale of reproduction processes.
Key words: agriculture, reproduction of assets, investments, Poland
INTRODUCTION
One of the conditions of development for agricultural holdings are reproduction proc-esses. They concern agricultural production, as well as resources of production factors. The reproduction refers mainly to fi xed assets that are renewal by investment expendi-tures [Grabowski 1991]. This issue is important from the point of view of the development prospects of agricultural holdings. A condition necessary, but not suffi cient for agricul-tural development, is not only the renewal of production assets, but also developmental investments, responsiveness to environmental and animal welfare standards, as well as
Corresponding author: Aleksander Grzelak, Poznań University of Economics, al. Niepodległości 10, 61-875 Poznań, Poland, e-mail: [email protected]© Copyright by Warsaw University of Life Sciences Press, Warsaw 2016
ISSN 1644-0757eISSN 2450-4602
http://acta_oeconomia.sggw.pl

50 A. Grzelak
Acta Sci. Pol.
improvement of work safety1. Therefore, reproduction processes allow not only to carry out the production and profi t function of agricultural holdings, but also to maintain hy-giene (e.g. in case of farms specialising in milk production), environmental and biological standards, which are related to specialised fi xed assets [Popławski 2013], and often become a necessary condition (requirement) to achieve the desired economic-production results. Therefore, in the context of reproduction and investment processes great importance is also put on qualitative dimension of these phenomena, e.g. improvement of work ergo-nomics or access infrastructure. After integration with the EU and taking up agriculture of the CAP instruments, the process has gained in strength. Thus, an evolution in terms of approach to reproduction processes in agriculture can be noticed. While previously they had been treated as a part of development of fi xed assets directly related to production functions, since the accession to the EU, their role in the shaping of non-productive func-tions of agriculture has become considerably more noticeable.
The issues of reproduction of assets in the literature were taken mainly from the per-spective of development of farms or their competitiveness [Józwiak 2012]. Meanwhile, the issues referring to the factors infl uencing the reproduction were taken in a limited extent. The exceptions were studies of Grabowki [1991], which focused on the 1980s. That is why the studies included in the article have the opportunity to fi ll the existing gap in this area.
The main aim of this article is to identify the importance of the determinants that form processes of reproduction of assets (fi xed assets excluding land) in agricultural hold-ings in Poland conducting agricultural accountancy (FADN). The article focuses mainly on endogenous factors, especially resource ones. Simultaneously, the following research question was formulated: what factors determine reproduction processes the most? The temporal scope of the analysis covers the period 2004–2012 and it is based on a sample of agricultural holdings conducting agricultural accountancy (FADN) in Poland.
RESEARCH METHODS
The paper discusses the results of agricultural holdings keeping their agricultural ac-counts in accordance with the principles of the FADN system. Despite the fact that the farm accountancy data network results cover only part of agricultural holdings (i.e. those that are economically stronger), they are approximately relevant (although not represent-ative) to commercial agricultural holdings in Poland, especially as regards determining trends prevailing among the analyzed phenomena. Particular attention should be paid to the fact that this data is of microeconomic nature and that it regards arithmetic mean values from an average agricultural holding from a specifi c group of farms. By referring to an average agricultural holding covered by the FADN system (the situation of which is the result of many agricultural producers’ behaviour), the analysed results become more systematic, thus restricting randomness. One should note here that the examined group
1 In later analyses, due to aggregation of data, delimitation of investment to replacement, adaption or development investments were not conducted, assuming that all of them decide about the dy-namics of assets reproduction processes.

The importance of selected determinants of assets reproduction... 51
Oeconomia 15 (2) 2016
of farms usually achieve better economic and production results as compared to average values for all agricultural holdings in Poland, as well as to average results of holdings monitored by the FADN system2.
The studied group of farms was reduced due to the presence of outliers and atypical observations3. Thus it was possible to obtain fairly normal distributions for the most im-portant examined features, which was confi rmed by Jarque-Bera test for normality. In to-tal, the average number of studied farms was 11.6 thousand (from 10.5 thousand in 2004 to 12.5 thousand in 2005). Reproduction processes were analysed by indicator of being the ratio of gross investment (excluding land purchase) to depreciation, as well as gross investment value (excluding land purchase). In the latter case a simplifying assumption was made that investments can be one of the measures of the reproduction scale. It results from the fact that fi xed assets are replaced through investments. In addition, the said assumption is possible because of the use a regression analysis which requires positive logarithmic variable values4. In order to evaluate the importance of factors determining renewal processes, regression models were used5.
The analyzed period of 2004–2012 was divided into three sub-periods: 2004–2007 (years of economic growth), 2008–2009 (economic downturn), 2010–2012 (economic recovery in agriculture)6. This division creates relatively homogenous economic sub-pe-riods in agriculture and refl ects the results of other studies investigating business outlooks in agriculture. At the same time, the division made it possible to more accurately show the connections between the analyzed issues with economic cycles in agriculture. Further-more, in the assessment of the selected characteristics of reproduction processes of assets, fi ve groups of farms were identifi ed, based on their indicator of reproduction of assets7.
2 For instance, in 2011 the number of Polish farms monitored in the FADN system was 738 thou-sand, as compared to 10.5 thousand farms in the analyzed sample (holdings conducting agricultural accountancy in the FADN system, excluding outliers and atypical observations). The surface area of arable land in the fi rst group was 55% of the size of farms in the second of the mentioned groups. As regards production values, the corresponding percentage was 48%, and 42% for income. At the same time, the 738 thousand agricultural holdings participating in the Polish FADN monitoring are economically stronger than the population of all agricultural holdings collecting direct payments (approximately 1.4 million).3 In the fi rst case the aim was to eliminate objects (farms) outlying in terms of indicator of reproduc-tion process (gross investment to depreciation). Thus, outliers were defi ned as those farms whose indicator of reproduction exceeded double standard deviation determined for the studied group (both downwards and upwards). In practice this meant exclusion of part of farms whose values were signifi cantly different (which was particularly common in the case of upwards deviations). Very high values deviating from the mean values were observed, which interfered with the results of analyses, most of which relate to the average values. On the other hand, atypical observations included agricultural holdings whose current assets value was 0. The total scope rejected outliers was approx imately 5% of farms conducting accountancy FADN in Poland.4 Application of the indicator of reproduction (sometimes taking a negative value) in this case could reduce the number of observations.5 The models are based on logarithmed data for individual observations (farms).6 Mean values for analyzed years were calculated for the sub-periods corresponding to business cycle phases.7 Group 1, below 0.5, includes agricultural holdings with a clear decapitalisation of assets (in-dicator of reproduction below 0.5). Group 2, consisting of agricultural holdings with narrowed

52 A. Grzelak
Acta Sci. Pol.
REPRODUCTION PROCESSES – THEORETICAL PERSPECTIVE
The problem of reproduction of assets has implications in the theory of corporate fi nance [Tomaszewski 2003]. It is in particular the issue of structure of a capital, its costs, depreciation [Juszczyk 2013]. In the case of agriculture in Poland there is still relatively low commonness of the use of agricultural accounting, as well as no need to create a de-preciation fund (except for units with legal personality). Consequently, it can be assumed that activities in farms related to reproduction of assets are often ad hoc and non-complex. In the long term, in the absence of an adequate supply of investment associated with modernisation, purchase of new fi xed assets, it would lead to decapitalisation of assets in farm. Therefore, there exists a need to reproduce assets, i.e. to renewal productive re-sources and thus maintain continuity of the production process.
With regard to usage of fi xed assets in agriculture, attention is brought to the fact that they are generally used seasonally, in diffi cult conditions (contact with soil, the impact of weather conditions), there exists considerate specialisation of equipment, as well as highly capital-intensive nature of production [Bollman et al. 1995]. It makes diffi cult reproduction of assets involved due to rising fi xed costs and causes pressure on increase the scale of production and its intensity. Furthermore, a signifi cant degree of fi xed assets consumption in Polish agriculture8 indicates that they are often used longer than their total depreciation period and regulations specify, which takes place especially in smaller agricultural holdings and concerns in particular buildings and structures. In consequence, this restricts real reproduction of these assets, while agriculture in Poland requires high capital expenditures [Grzelak 2014].
Maximisation of utility function of agricultural producer increases the pressure to make the reproduction processes more dynamic. Thus, there takes place a process of eliminating less effi cient techniques and structures, and replacing them with more effi cient or pro-environmental ones which is the basis for the development of agriculture [Zwolak 2007]. However, it should be emphasised here that in the case of smaller agricultural holdings with labour provided by family members, this process is limited due to adaptive servo-mechanism, which comes down to taking actions by farmers to eliminate or to compen-sate unfavourable changes in external farming conditions [Czyżewski 1986]. The proc-ess involves regulation of consumption level by agricultural family due to substitution of natural consumption and income from agricultural production, and most importantly, lowering one’s work cost in incomes gained during recession. As consequence, those farms may for years operate in a situation of so-called negative income, narrowed repro-duction and decapitalisation of assets [Czyżewski 1995, Makinen et al. 2009]. Moreover it should be noted that in the case of smaller agricultural holdings, the relatively low indi-cator of reproduction is connected with the fact that renewal of assets is limited by the
asset reproduction that still have a chance of achieving at least a fl at indicator of reproduction. The next group includes agricultural holdings with indicator of reproduction oscillating around simple recovery of assets. Group 4 consists of agricultural holdings with extended reproduction. Finally, Group 5 consists of farms with quickly growing indicator of reproduction s and an advanced level of fi xed assets modernisation.8 The extent of fi xed assets consumption in 2012, according to GUS aggregated data, reached ap-proximately 77% (GUS 2013).

The importance of selected determinants of assets reproduction... 53
Oeconomia 15 (2) 2016
diffi culties in funding investments with both own incomes, as well as external sources, e.g. loans. At the same time, it is generally only possible for bigger holdings to effi ciently use machinery and equipment purchased as part of investment support from the EU CAP instruments [Defrancesco et al. 2008]. On the other hand, when there is expanded repro-duction in agriculture, then it is accompanied by land rent, which are discounted in the price of land [Czyżewski and Brelik 2015].
Agricultural capital needs quickly and often abruptly increase when production con-centration processes in agriculture become more advanced. However, for a given level of productive resources, propensity to invest and agricultural income level plays the deci-sive role in the scope of a renewal of assets. At the same time, the use of external sources of fi nancing (debt) supports the reproduction and development processes [Swinnen et al. 1999], which are to some extent determined by the level of interest rates, the level of production profi tability, as well as production risk, which in the case of agriculture is high. Bigger holdings, in general, show greater propensity to take risks, and therefore the debt is relatively higher. However, due to average long production cycles, as well as a high share of land value in assets, there exists high demand for long-term sources of asset fi nancing [Moss et al. 1997].
Investment processes and asset reproduction connected with them also result from psychological factors concerning predictions of future business outlook by agriculture producers. Events in 2014 connected to African swine fever, Russian embargo are ex-amples of the impact of external negative signals, which, in turn, restricts further invest-ments and hinders assets reproduction. On the other hand, there are also examples of the positive impact. The abolition of milk quotas stimulated farmers to enlarge of the herd and to invest in the development of milk production.
A factor favouring the processes of reproduction in agricultural holdings is to support the state budget funds (or within the instruments of the CAP EU), especially booming in the economy, and furthermore in agriculture [Baryshrikov et al. 2011]. This primarily concerns price relations between the products purchased and products sold by farmers, which determines the conditions of profi tability in agriculture, as well as in the invest-ment processes. In case of negative relations, the investments are limited [Chand 2000]. Moreover, business outlook in agriculture can not only accelerate modernisation, but also allow the outfl ow of labour resources to non-agricultural sectors. Assuming that together with economic development of the country integration between changes in the economic situation in agriculture and the whole economy is also enhanced [Von Braun 1991], it can be concluded that the relation between the business outlook in agriculture and general economic situation in Poland will be getting stronger, which, in turn, may increase in-stability of the reproduction processes. Changes in economic conditions (as a part of the cycle) are to some extent an investment accuracy verifi er, and only recognition of repro-duction processes throughout the all business cycle presents the full picture of the situa-tion concerning the analysed processes. Seen from this narrowed reproduction during the economic downturn does not have to be evaluated negatively seeing as during economic recovery the investment processes easily compensate the consumption of assets. If the in-vestments are unsuccessful, not even high dynamics of reproduction processes are able to generate a parity income [Woś 2000] or a return on equity capital higher than the current interest rates. Moreover the dynamics of reproduction processes is stimulated indirectly

54 A. Grzelak
Acta Sci. Pol.
by vertical and horizontal integration in the food economy. It is conducted by lowering transaction costs, increase of effi ciency or propensity to invest of agricultural holdings [Bryła 2012].
An important stimulant for the reproduction processes was the fact that the EU CAP instruments were implemented in Polish agriculture. It can be stated that public aid for investment fi nancing is currently one of the most important elements that allows mod-ernisation of agriculture in Poland, as well as in other countries where the sector needs to be modernised [Karanikolas et al. 2007]. Thanks to the EU funds supporting capital expenditures, expenditures on a fi xed assets have increased, which, in turn, contributed to the implementation of innovations [Józwiak et al. 2012]. Implementation of the in-struments of the CAP EU in Polish agriculture, especially the introduction of the direct payments, infl uenced catalysing on income and reproduction processes, limiting their sharp declines. Also the experiences of other countries indicated on this phenomenon [Phimister et al. 2004]. It is also worth add that the scale of the processes of reproduction of assets depends on the development phase of the farm. In the case of acquisition of the farm by young successor and further continuation of agricultural production, as a rule, we can expect higher propensity to invest. A different situation is when the farm manager is close to retirement age and there is no successor.
EMPIRICAL RESEARCH FINDINGS
The processes of reproduction of assets showed variability depending on the terms of business outlook (Table 1). They decide about the profi tability of production, and re-sulted mainly from price relationships – price scissors. The reproduction has improved in terms of the favorable cyclical conditions. One could observe an increase in the case of agricultural output, income, propensity to invest (investment rate), and debt rate9 as we “move” to groups with higher indicator of reproduction in the studied agricultural holdings (Table 1). One can conclude that the scale of productive resources have a positive impact on the scope of the reproduction process of assets. These processes facilitate an increase in workforce productivity. In particular, the rate of investment showed a high diversity among the examined groups of farms due to the level of reproduction. This points to the important role of the propensity to invest in shaping the studied phenomena. The more active the agricultural farm as far as reproduction processes, the wider the scope of how it uses external fi nancing for its own development, with preferential credit being the most dominant in Poland. Bigger agricultural holdings more closely connected to the market, implement a riskier management strategy, replacing own capital with outside capital. On the other hand, the relatively low level of indicator of reproduction of assets in agricultural holdings with fewer productive resources results from the fact that renewal
9 The considerate infl uence of the indicator of debt on reproduction processes has been proven by logit models. They show that an increase of debt by 1% increases chances for extended reproduc-tion three-fi vefold (depending on the year). Despite of the fact that these models proved to be statistically signifi cant (verifi cation with a likelihood coeffi cient test), and the number of correct predictions stood at 72–79% level, due to the relatively low McFadden’s R-squared (0.05–0.15), they were not taken into account in further analyses.

The importance of selected determinants of assets reproduction... 55
Oeconomia 15 (2) 2016
of assets is limited by the diffi culties in funding investments with both own income, as well as external sources, e.g. credits [Kata 2011]. Still, the debt level of agriculture com-pared to other sectors is low due, among other things the relatively low potential creation of equity capital [Kulawik 1997]. Moreover, the data (Table 1) shows, that in the condi-tions of economic downturn, the relative liabilities of the surveyed agricultural house-holds has increase, while reduced in the case of economic recovery. It is connected with the higher possibilities of fi nancing its activities on the basis of income, in the period of favorable business outlook.
Table 1. The selected resource characteristics of farms due to the level of indicator of repro-duction of assets in agricultural holdings (for selected periods 2004–2012) conducting accountancy FADN in Poland (means from the selected sub-periods 2004–2012, for the average household)
Specifi cationa b c d e
2004–2007The indicator of reproductiona –0.03 0.73 0.99 1.33 3.87SE131 148.2 185.9 193.2 220.7 236.7SE420 53.5 71.9 74.7 82.7 94.4The indicator of debt 0.07 0.09 0.10 0.11 0.13The rate of investmentsc –0.05 0.13 0.28 0.46 0.94
2008–2009The indicator of reproductiona –0.05 0.70 0.96 1.30 3.55SE131 165.1 203.2 145.7 239.5 268.4SE420 51.7 66.9 74.9 83.7 95.3The indicator of debtb 0.11 0.12 0.12 0.13 0.14The rate of investmentsc –0.08 0.29 0.39 0.57 1.07
2010–2012The indicator of reproductiona –0.04 0.71 0.99 1.31 3.59SE131 193.1 232.3 291.2 294.7 344.6SE420 79.6 103.9 122.5 124.9 153.6The indicator of debtb 0.06 0.07 0.08 0.09 0.11The rate of investmentsc –0.18 0.20 0.37 0.56 1.05a, b, c, d, e – represent the categories of the ratio of reproduction: 0.5 and below – a; (0.5–0.9> – b; (0.9–1.1> – c; (1.1–1.5> – d; (1.5> –e.athe indicator of reproduction = investments (excluding purchase of land) / depreciation.bthe indicator of debt = total debt / value of the assets.cthe rate of investments = investments (excluding purchase of land) / agriculture income.SE131 total output (in thousand PLN); SE420 – farm net income (in thousand PLN). There are mean values (within the groups due to level of indicator of reproduction of assets) for examined sub-periods in the table.Source: Own calculation based on the database of the FADN system in Poland for the years 2004–2012.

56 A. Grzelak
Acta Sci. Pol.
At a subsequent stage of the study there was conducted a quantifi cation of the sig-nifi cance of resource factors (e.g. land, labour, capital) for the development of processes reproduction of assets (Table 2). For this purpose, exponential regression models were used, which made it possible to estimate elasticity coeffi cients of changes in produc-tive resources in relation to investments which reproduce fi xed assets. The constructed regression models are characterized by a rather low coeffi cient of convergence to empiri-cal data, and therefore any conclusions that result from them are not strongly grounded for the entire group of agricultural holdings. On the other hand, the model’s parameters,
Table 2. The results of regression analysis for relations between gross investment excluding pur-chase of land (lnSE516 – dependent variable) and production resources (independent variables) for agricultural holdings conducting accountancy (FADN) in Poland (means from the selected sub-periods 2014–2012, for the average household)
Specifi cationβ e p R2 cor.
(for model)p
(for model)2004–2007
lnSE10 0.08(0.07–0.08)
0.22(0.21–0.24) 0.000
0.29(0.28–0.30) 0.000lnSE25 0.09
(0.08–0.10)0.26
(0.25–0.27) 0.000
ln(SE441-SE446) 0.43(0.43–0.44)
1.21(1.20–1.22) 0.000
2008–2009
lnSE10 0.03(0.03–0.03)
0.18(0.18–0.18) 0.000
0.31(0.30–0.32) 0.000lnSE25 0.09
(0.08–0.10)0.25
(0.24–0.26) 0.000
lnSE(SE441-SE446) 0.45(0.45–0.45)
1.15(1.15–1.15) 0.000
2010–2012
lnSE10 0.04(0.03–0.05)
0.19(0.17–0.20) 0.009
0.34(0.33–0.36) 0.000lnSE25 0.13
(0.11–0.14)0.30
(0.28–0.31) 0.000
lnSE(SE441-SE446) 0.47(0.46–0.48)
1.13(1.12–1.14) 0.000
SE010 total labour input (AWU); SE025 – total utilised agricultural area (ha), SE441 – total fi xed assets, SE446 –value of land and permanent crops, β – the standardized coeffi cient of the indepen-dent variable of the parameter of the regression model, e – the coeffi cient of fl exibility of productive resources in realtion to invest.The mean values, in the examined sub-periods, for coeffi cients of determination, standardized co-effi cients of regression, fl exibility, signifi cance estimated from the regression models estimated for each year are contained in the cells. But provide only information about mean could cause methodical doubt due to the lack of information about the distribution of these values. Therefore one given (in brackets) the max. and min. value of estimated parameters of regression models for the examined sub-periods. It results that the dispersion were small and generally symmetrical in relation to the mean values.Source: Own calculation based on the database of the FADN system in Poland for the years 2004–2012.

The importance of selected determinants of assets reproduction... 57
Oeconomia 15 (2) 2016
as well as the model itself, are statistically signifi cant. It has been observed that the rela-tively strongest infl uence on the investment processes was exerted by the capital factor, whereas the weakest was exerted by the labour factor (both from the perspective of the β coeffi cient – standardised regression coeffi cient, as well as elasticity coeffi cient – e, cf. Table 2). Especially interesting is the capital factor’s high elasticity coeffi cient in relation to investment. This may result from the fact that the relations between capital and invest-ments are direct. Capital increase is a result of investment funding and leads to an increased demand for further investments, due to e.g. the need for depreciation of assets. On the other hand, the relations between investments and the labour factor are signifi cantly more com-plex and result from effi ciency of this factor, terms of profi tability, as well as capital – la-bour ratio. The models (Table 2) also show that the greater resources of production factors were conducive the higher investment activity, what should not be a surprise.
There have not been observed any clear tendencies in the model’s parameters infl uenced by the phase of business outlook. This may indicate that the infl uence of resource factors on investment activity in regards to assets is independent from conjunctural factors, what is connected mainly with existing system of investment support, periods of his startup. These relations are also confi rmed by research carried out by [Sadowski and Giżycka 2012]. They suggest that the factors that had the most infl uence on the choice of investment among agricultural holdings that receive fi nancial support as part of second pillar of the CAP were, e.g.: production potential, or relations between production factors.
The level of education is the main element of human capital [Wilkin 1998], therefore it determines the dynamics of development process of agricultural holdings, and hence assets reproduction. Some argue that in Poland the low education level of rural population is one of the barriers to rural development [Kłodziński 2005], that would allow existing resources to be used more effi ciently. In the examined group of agricultural holdings diversifi cation due to the level of indicator of reproduction and education was observed (Table 3). Its level was moderate. Higher level of reproduction of fi xed assets were ac-companied by an increase in education of farm manager, and greater focus was put on agricultural education profi le. This should not be surprising, given the fact that higher
Table 3. The level of indicator of reproduction due to the level of education of farm manager in examined agricultural holding conducting accountancy (FADN) in Poland (means from the selected sub-periods 2014–2012)
Educationa
1 2 3 4 5 6 72004–2007
0.76 0.80 0.93 0.83 0.99 0.95 1.062008–2009
0.61 0.63 0.67 0.65 0.73 0.64 0.842010–2012
0.64 0.59 0.73 0.71 0.83 0.69 0.89a1 – basic education, 2 – vocational non-agricultural, 3 – vocational agricultural, 4 – average non--agricultural, 5 – average agricultural, 6 – higher non-agricultural, 7 – higher agricultural.There are mean values (within the different types of education) for examined sub-periods in the table.Source: Own calculation based on the database of the FADN system in Poland for the years 2004–2012.

58 A. Grzelak
Acta Sci. Pol.
qualifi cations make management of agricultural holdings and their development easier. Similar results were obtained in studies of agriculture holding in Estonia [Virra et al. 2013]. They showed that the higher level of education of farm manager increased the probability of the development.
CONCLUSIONS
The considerations conducted in the examined group of agricultural holdings lead to the following conclusions.
Business outlook factors determine the scale of reproduction processes. In a situation of economic recovery the dynamic of assets reproduction also noticeably improved; whereas the economic downturn was accompanied by impairment of those processes and dominance of narrowed reproduction. However, no clear tendencies in the scope of infl uence of business outlook factors on the change of the impact of endogenous factors on reproduction process were observed, which may be due to the complexity of this infl uence and its intermediate character. It is initially stated that infl uence on reproduction processes of assets takes place as depicted in Figure 1. However, the most important channel impact is: the conditions of business outlook-reproduction and productive resources – production – income – propensity to invest – reproduction. Among resource factors, one of relatively more importance in shaping of reproduction processes is capital factor, which resulted from direct dependences between capital-investment. It can be assumed that as the eco-nomic development increases, the channel connected with debt will also increase.
Productive resources – production – income – propensity to invest
The level and type of education
Debt
The level of indicator of reproduction of assets
The conditions of business outlook
Fig. 1. Reproduction processes of assets interdependence.Source: Own elaboration.
Another differentiating factor affecting reproduction processes was education of farm managers. The indicator of reproduction of assets were positively correlated with the level of education and its agricultural profi le.Taking into consideration the fact that the study includes a group of agricultural holdings that are relatively above average in Poland, it can be concluded that the scope of reproduction processes is still insuffi cient for effective use of at least one existing land and capital factor in agriculture, as well as its modernisation. As for labour resources engaged in agriculture, there arises a social problem connected with
1.
2.
3.
4.

The importance of selected determinants of assets reproduction... 59
Oeconomia 15 (2) 2016
such usage of these resources so that, on the one hand, there would be an increase in workforce productivity through the outfl ow of labour resources to non-agricultural sectors, and, on the other, this would not cause their marginalisation. At the same time, further support for farmers in the framework of the EU CAP, in the case of investment support, should be selectively targeted to agricultural holdings that have great chances for achieving simple reproduction, but, on the other hand, it should be limited to individuals constantly achieve extended reproduction.
ACKNOWLEDGEMENT
The project was fi nanced from sources of Narodowe Centrum Nauki (National Sci-ence Centre) granted on the basis of the decision DEC-2011/03/B/HS4/01174.
REFERENCES
Baryshrikov, N.G., Samygin, D.J., Cherdantseva, E.A. (2011). Infl uence of the state support on conducting reproduction process in the agricultural organizations. Finance and Credit, 35 (467), 11–18.
Bollman, R.D., Whitener, L.A. Tung F.L. (1995). Trends and patterns of agricultural structural change: A Canada – US. Comparison. Canadian Journal of Agricultural Economic, Spe-cial Issue, 56.
Bryła, P. (2012). The characteristics of farmers applying for the EU investment support in Poland. Agricultural Economics – Czech, 1, 23.
Chand, R. (2000). Emerging trends and regional variations in agricultural investment and their implication for growth and equity. [In:] Policy Paper – National Centre for Agricultural Economics and Policy Research, 11, 11–67.
Czyżewski, A. (1986). Dochody rolnicze a procesy reprodukcji w gospodarce chłopskiej w okresie Polski Ludowej. Ekonomista, 4, 234 (in Polish).
Czyżewski, A. (1995). Makroekonomiczne uwarunkowania przedsiębiorczości w agrobiznesie. [In:] A. Czyżewski (ed.), Rozwój rolnictwa i agrobiznesu w skali lokalnej. Wyd. ODR w Sielinku, Poznań (in Polish).
Czyżewski, A., Brelik A. (2015). Considerations on a land intrinsic productivity and its determi-nants in a sustainable agriculture. Acta Sci. Pol., Oeconomica, 14 (3), 39–48.
Defrancesco, E., Gatto, P., Runge F., Trestini, S. (2008). Factors affecting farmers` participation in agri-environmetal Measures: A northern Italy perspective. Journal of Agricultural Econo-mics, 59 (1), 128.
Grabowski, S. (1991). Procesy reprodukcji w gospodarstwach indywidualnych. Wyd. PWRiL, Warszawa (in Polish).
Grzelak, A. (2014). Ocena procesów reprodukcji majątku w świetle wyników gospodarstw rol-nych prowadzących rachunkowość rolną (FADN). Zagadnienia Ekonomiki Rolnej, 3, 57 (in Polish).
Grzelak, A., Seremak-Bulge, J. (2014). Porównanie wybranych metod badania koniunktury w rol-nictwie w Polsce. Zagadnienia Ekonomiki Rolnej, 4, 124–128 (in Polish).
Józwiak, W. (2012). Polskie rolnictwo i gospodarstwa rolne w pierwszej i drugiej dekadzie XXI wie-ku. IERiGŻ, Warszawa (in Polish).
Józwiak, W., Kagan, A., Mirkowska, Z. (2012). Innowacje w polskich gospodarstwach rolnych, zakres ich wdrażania i znaczenie. Zagadnienia Ekonomiki Rolnej, 3, 21–23 (in Polish).
Juszczyk, S. (2013). Amortyzacja w ekonomice agrobiznesu. Wyd. SGGW, Warszawa (in Polish).

60 A. Grzelak
Acta Sci. Pol.
Karanikolas, P., Martinos, N. (2007). The Modernization Process in Greek Agriculture: the case of investment aid. Agriculture Economics Review, 8 (1), 45.
Kata, R. (2011). Interwencjonizm kredytowy w rolnictwie a problem dostępu rolników do kredytu bankowego. Roczniki Nauk Rolniczych, G, 98 (2), 125 (in Polish).
Kłodziński, M. (2005). Kapitał ludzki, społeczny i kulturowy polskiej wsi. [In:] Kwestia agrarna w Polsce i na świecie. Wyd. SGGW, Warszawa, 711–721 (in Polish).
Kulawik, J. (1997). Rozwój fi nansowy a wzrost i rozwój ekonomiczny w rolnictwie. Wyd. IERiGŻ, Warszawa (in Polish).
Makinen, H., Lahtinen L., Ylätalo M., Vehkamäki J. (2009). Measuring the success of Finnish fam-ily Farms. Acta Agriculturae Scandinavica, C, Food Economics, 6 (3–4), 185–196.
Moss, L.M., Barry, P.J., Ellinger, P.N. (1997). The competitive environment for agricultural bank-ers in the USA. Agribusiness, 13 (4), 431–444.
Phimister, E.P., Roberts, D., Gilbert, A. (2004). The dynamics of farms incomes. Journal of Agri-cultural Economics, 55 (2), 197–220.
Popławski, Ł. (2013). Ochrona Środowiska jako zawodność rynku – wybrane zagadnienia. Fo-lia Pomaeranae Universitatis Technologiae Stetinensis, Oeconomica, 301 (71), 103–111 (in Polish).
Sadowski, A., Giżycka, W. (2012). Charakterystyka gospodarstw korzystających ze wsparcia inwe-stycji modernizacyjnych i dostosowawczych na tle innych form pomocy Unii Europej-skiej. Journal of Agribusiness and Rural Development, 1, 122–133 (in Polish).
Swinnen, J.F., Gow, H.R. (1999). Agricultural credit problems and policies during the transition to a market economy in central and eastern Europe. Food Policy, 24, 19–20.
Tomaszewski, M. (2003). Procesy reprodukcji majątku trwałego przedsiębiorstw. Stowarzyszenie Naukowe Instytut Gospodarkii Rynku, Szczecin (in Polish).
Virra, A-H., Pöder, A., Värnik, R. (2013). The Determinants of Farm Growth, Decline and Exit in Estonia. German Journal of Agricultural Economics, 62 (1), 52–64.
Von Braun, J. (1991). The links between agricultural growth, environmental degradation, and nutri-tion and health. [In:] S. Vosti, T. Reardon, U. von Feldafi ng (Eds), Agricultural sustaina-bility. Growth and poverty alleviation: Issues and Policies. Germany, Deutsche Stiftung fur Internationale Entwicklung, 66–78.
Wilkin, J. (1998). Bariery edukacyjne i informatyczne. [W:] Rozwój obszarów wiejskich w Polsce, FAPA, Warszawa, 125 (in Polish).
Woś, A. (2000). Inwestycje i akumulacja w rolnictwie chłopskim w latach 1988–1998. IERiGŻ, Warszawa (in Polish).
Zwolak, J. (2007). Rola środków trwałych w rolnictwie polskim w latach 1990–2004. Wyd. AR w Lublinie, Lublin (in Polish).
ZNACZENIE WYBRANYCH DETERMINANT PROCESÓW REPRODUKCJI MAJĄTKU GOSPODARSTW ROLNYCH W POLSCE
Streszczenie. Głównym celem artykułu jest rozpoznanie znaczenia determinant kształtu-jących procesy reprodukcji w gospodarstwach rolnych w Polsce prowadzących rachun-kowość rolną FADN. Zakres czasowy analiz odnosi się do okresu 2004–2012. W sytuacji poprawy koniunktury miała miejsce wyraźna poprawa jeśli chodzi o dynamikę reprodukcji majątku, natomiast jej pogorszeniu towarzyszyło osłabienie tych procesów i dominacja reprodukcji zawężonej. Oddziaływanie na procesy reprodukcji majątku w gospodarstwach rolnych zachodzi głównie poprzez kanały: warunki koniunktury – reprodukcja oraz zasoby produkcyjne – produkcja – dochody – skłonność do inwestycji – reprodukcja. Spośród czynników zasobowych relatywnie wyraźne zależności oddziaływania zaobserwowano

The importance of selected determinants of assets reproduction... 61
Oeconomia 15 (2) 2016
w przypadku czynnika kapitału (wartość środków trwałych z wyłączeniem ziemi). Czynni-kami sprzyjającymi procesom reprodukcji był także wyższy stopień wykształcenia zarzą-dzającego gospodarstwem rolnym oraz skala dywersyfi kacji profi lu działalności w gospo-darstwie.
Słowa kluczowe: rolnictwo, reprodukcja majątku, inwestycje, Polska
Accepted for print: 21.03.2016
For citation: Grzelak A. (2016). The importance of selected determinants of assets reproduction in agricultural holdings in Poland. Acta Sci. Pol., Oeconomia, 15 (2), 49–61.


Oeconomia 15 (2) 2016, 63–73
PARADIGM OF SUSTAINABLE DEVELOPMENT IN MARKETING
Jacek KamińskiPope John Paul II State School of Higher Education in Biała Podlaska
Abstract. It is commonly perceived that the marketing and sustainable development are two different terms, since according to existing stereotype they are on two opposite sides of the consumption level. In the article it has been shown that the relationship between the marketing and sustainable development is exceptionally strong, which results from the functions fulfi lled by the marketing in the market economy consisting in mating goods and demand on a market and taking actions in the area of creating and satisfying needs of cus-tomers. The concept that fully refl ects interest of the marketing in sustainable development is sustainable marketing. Even though this concept is becoming increasingly popular in Po-land, it has not been discussed in broader terms than from the perspective of an enterprise. In the article has been discussed the issue of the sustainable marketing from the macromarketing perspective. Particular emphasis has been placed on the role that it plays from the perspec-tive of redefi ning the assumption of the traditional marketing concept.
Key words: sustainable marketing, marketing in sustainable economic development, ma-cromarketing
INTRODUCTION
Interest of the marketing in the issues of the sustainable development is currently one of the most dynamically developing paradigms of the marketing, which derives from the need to explain and detail the assumptions of the marketing from the social and environ-mental perspective. Numerous terms referring to the issue of the marketing and natural development such as: green marketing, greener marketing, environmental marketing, ecological marketing, or last but not least the sustainable marketing proving signifi cant interest of the marketing in the issue of the natural environment inclining to provide more detailed explanation of the place of the paradigm of the sustainable development both in the practice and theory of the marketing.
Corresponding author: Jacek Kamiński, Pope John Paul II State School of Higher Education in Biała Podlaska, Sidorska 95/97, 21-500 Biała Podlaska, Poland, e-mail: [email protected]© Copyright by Warsaw University of Life Sciences Press, Warsaw 2016
ISSN 1644-0757eISSN 2450-4602
http://acta_oeconomia.sggw.pl

64 J. Kamiński
Acta Sci. Pol.
In the article has been taken an attempt to defi ne the role of the paradigm of the sus-tainable development in the marketing. Moreover, it has also been presented the manner of understanding the sustainable marketing and to what extent does it constitute a change of the traditional manner of thinking about the marketing issues denoting redefi nition of the issues considered as the binding canon of the traditional marketing thinking. The purpose of the conducted analysis is to better understand the gist of the sustainable mar-keting, indicate its innovative nature and opportunities following from the sustainability for further development of the marketing theory.
Due to the fact that the sustainable marketing is strictly linked to the sustainable de-velopment in the article at fi rst has been defi ned the term sustainable development. Then, it has been explained from where stems the interest of the marketing in the sustainable development. In consideration of the fact that both in the economics and humanities inter-est in the environmental issues creates the need to substantially redefi ne the theory, there have been presented the main assumptions of the sustainable marketing by focusing on proving how it contributes to redefi ning the traditional manner of thinking about the mar-keting issues. In the last part of the article has been presented modifi cation of the market-ing mix from the perspective of the requirements of the sustainability.
SUSTAINABLE DEVELOPMENT
The term sustainable development is most frequently connected with the activity of the World Commission of Environment and Development commonly known as the Brundt-land Commission established in 1983 by the United Nations. In its report from 1987 the Commission considered that both the pace and process of the social and economic devel-opment constitutes threat to the natural environment [United Nations 1987]. Therefore, in order to prevent such phenomena as dwindling of natural resources and increasing threat to humans health the Commission requested the governments of the countries to change their manner of approaching the issue of economic and social growth by recommending the sustainable development. It has been defi ned as “development that meets the needs of the present without compromising the ability of future generations to meet their own needs” [United Nations 1987].
Since publication of the report of the Brundtland Commission the term sustainable development has been applied in various manners depending on whether it is used in academic, planning, business or environmental politics context. In spite of highly diversi-fi ed manner of understanding this term, there may be discerned substantial features of the sustainable development.
Considered in theoretical terms the sustainable development is based on reversal of the paradigm of the neoclassical economy, which assumed that goods such as earth, air, water, woods are infi nite (therefore, they are defi ned as free goods) and may be used by humans in the production process in indefi nite manner. According to the sustainable de-velopment concept these are rare goods and should be treated at least just as capital creat-ed by the human beings. On the other hand, the economic growth should ensure better use
Paradigm of sustainable development in marketing 65
Oeconomia 15 (2) 2016
of raw materials and other natural resources, rational use of power and work, as well as ecological technologies and protection of environmental and cultural heritage [Kamiński 2012]. Apart from the fact that the sustainable development brought new dimension to the economic category of scarcity (limitation), it has also caused that economists apart from balancing the needs in the interpersonal dimension have also faced the challenge of balancing the needs in the intergeneration dimension [van Dam and Apeldoorn 2008].
In practical understanding the sustainability is equivalent to life based on use of re-newable natural resources. This means that non-renewable raw materials should be used to smaller extent, whilst renewable raw materials (of plant or animal origin) should be used in pace resulting from the cycle of their regeneration. By using the language of the fi nancial market it could be said that according to the idea of the sustainable development the society should as much as possible live “from interest” and not “from capital”.
Along with safety and protection of the human right ensuring the sustainable develop-ment became one of the three primary tasks of the United Nations [Rotfeld 2015]. This need follows from disastrous condition of the natural environment. Some data depicting this situation have been presented below:
according to the data of the United Nations the use of the natural resources of the Earth had been exceeded already in 1980;in the year 2008 1.4 billion people on the Earth were living without access to fresh water;80% of the human population lives in the countries where there are used more re-sources than they may be reproduced within the boundaries of these countries. If all people on the Earth consumed on the same level, in order to live the human kind would need fi ve planets such as the Earth;using slight assumption of growth if humans do not change they manner of living and consumption of the natural resources, it is forecast that since 2030 it will be indispen-sable to sustain the natural resources of two planets such as the Earths and in 2050 almost four.
JUSTIFICATION FOR INTEREST OF THE MARKETING IN THE ISSUE OF SUSTAINABILITY
If we assume that the role of the marketing in the market economy leads solely to limit demand barriers [Krzyżanowska and Wrzosek 2009], it becomes obvious that the market-ing shows natural tendency towards direction contrary to the sustainability [Borland and Lindgreen 2012]. Planned aging of a product and stimulation of extending desire to mate-rial consumption constitutes the key factor of driving the growth of the traditional market-ing paradigm that contributes to creating the environmental issues. However, the sole role of the marketing is not to encourage to incur by consumers increasingly more expenses, but its role in the market economy exceeds substantially beyond the limitations of the demand barriers and increase of the consumption level. Interest of the marketing in the issues of the sustainable development follows primary from the function of the marketing consisting in distribution of resources, organization of network of communication and
•
•
•
•
66 J. Kamiński
Acta Sci. Pol.
exchange as well as creation of level and style of life [Kamiński 2014, Mish and Miller 2014, Wilkie and Moore 2014]. Potential of the marketing to contribute in the sustainable development follows from the possibility to prompt conducts that may be used in favour of the sustainable development. Therefore, the role of the marketing in the sustainable development is not impassive and as aptly noticed by van Dam and Apeldoorn “market-ing can be part of problem or part of solution” [2008, p. 266]. This interpretation is most broadly refl ected in the concept of the sustainable marketing.
THE TERM SUSTAINABLE MARKETING
Most generally the sustainable marketing may be defi ned as “marketing within and supportive of sustainable economic development” [van Dam and Appledoorn 2008, p. 254] or use of the sustainable development in the fi eld of the marketing [Mitchell et al. 2010]. The term sustainable marketing may also be defi ned by adjusting the needs of the sustainability to the currently binding defi nition of the marketing of the AMA1 [Kamiński 2009]. In this manner the sustainable marketing may be defi ned as process of creation, communication and provision to customers of values that both protect and strengthen the natural (environmental) and human capital [Martin and Schouten 2012].
The sustainable marketing may also be defi ned from the perspective of the effects of the marketing activities, from which the most fundamental is continuous consumption which is opposite to non-continuous consumption, i.e. hitherto developed threatening the natural environment by questioning human existence for propagation of which are sub-stantially responsible marketing departments of enterprises whose main task according to the binding marketing paradigm is to increase sale. This is proved, for instance, by the cri-teria of assessment of the effects of marketing activities published in popular marketing workbooks. The sustainable marketing is considered as a derivative of the “sustainable consumption”, i.e. “achievement of optimal satisfaction of consumer wants by allocating the use of environmental functions in the shape of products or services without exceeding externally determined limits” [van Dam and Appledoorn 2008, p. 265]. The sustainable marketing understood in this manner raises one of the main issues of the marketing by trying to answer the question how to accommodate the traditional purpose of the market-ing that is considered to be increase of sale (market share and profi t) with the sustainable consumption constituting one of the keystones of the sustainable development.
From the theoretical perspective the sustainable marketing is expression and attempt of broader view on marketing management resulting from ecological, social and econom-ic infl uences that result from globally material events affecting the market. The reasons of its increased popularity are practices questioning validity of the market orientation (MO) focused on achieving short-term profi ts and causing damage to the long-term interests of the interested parties such as cutting down tropical forests, irresponsible exploitation of some fi sh species (e.g. codfi sh) in seas or imprudence shown by bankruptcy of large enterprises, banks and insurance companies which led to the global fi nancial crisis in the year 2009 [Mitchell et al. 2010].
1 www.marketingpower.com/_layouts/Disctionary.aspx?dLetter=M (accessed 09.03.2016).

Paradigm of sustainable development in marketing 67
Oeconomia 15 (2) 2016
THEORETICAL BASIS OF THE SUSTAINABLE MARKETING
Due to the fact that there are some views that the sustainable development is the traditional marketing supplemented with environmental elements or opportunity to gain competitive advantage that may be achieved by reaching a group of consumers interested in environmental issues, below has been presented the theoretical basis of the sustainable marketing showing the consequences borne by the theory and practice of the marketing resulting from referring by the marketing to the idea of the sustainability and explaining to what extent the sustainable marketing constitutes redefi nition of the assumptions of the traditional marketing.
Epistemological assumptions. Contrary to the traditional marketing assuming con-stant increase of sale and share of an enterprise in the market the sustainable market-ing acknowledges that, since the time when the reproduction ability of the Earth has been extended the consumption should not increase, but rather stabilize or even decrease. Therefore, the primary challenge faced by the marketing in the sustainable economy is taking responsibility for transformation of the society towards consumption culture and lifestyles supporting the sustainability and providing support in redefi ning quality of life in the intangible categories [Assadourian 2010]. By offering proposals regarding values that refl ect broader scope of the human needs it attempts to create consumers whose lifestyle comes in response to the listed conditions of the system ensuring the sustainable development [Mish and Miller 2014].
The sustainable marketing also constitutes redefi nition of the traditional assumptions of the marketing concept (the marketing management) presented over fi fty years ago by McCarthy [1960], which may be found in the current marketing workbooks [Perreault and McCarthy 1999, Perreault et al. 2013], which assumes that the scope of the marketing issues is exemplifi ed through three concentric circles out of which the internal comprises a consumer as the main subject of marketing effort, the second “controlled factors” (prod-uct, price, distribution and promotion) and the third refers to the “uncontrolled factors”, i.e. elements of the surrounding of an enterprise that comprise, i.e.: (1) resources and goals of the enterprise, (2) current business situation, (3) economic environment, (4) po-litical and legal surrounding as well as (5) cultural and social surrounding.
The sustainable marketing substantially changes this traditional conceptualization. Firstly, it extends the list of the surrounding factors by the natural environment that is not included in the abovementioned model of E.J. McCarthy. Secondly, it assumes that similarly as other “uncontrolled factors” the natural environment should constitute im-portant subject of interest of marketing departments of the enterprises. Therefore, it far more expressly than in the traditional marketing assumes that the effects of the marketing activities are “transferred” to the factors hitherto considered as the “uncontrolled”. In the marketing this is a manner of thinking where the enterprise is not in the centre of interest and the main object of interest of the marketing science is the marketing system.
Indications of applying simple and obvious solutions from the scope of the environ-ment protection should not be referred to as the sustainable marketing [van Dam and Ap-pledoorn 2008]. As noticed and considered as being subject of infl uence of environmental factors of marketing departments it is “an appeal to lengthen corporate time horizons and to value continuity over profi t. Most importantly, sustainable marketing is an appeal to ac-

68 J. Kamiński
Acta Sci. Pol.
cept the limitations of marketing philosophy and acknowledge the necessity of regulatory constraints to the market mechanism” [van Dam and Appledoorn 2008, p. 266].
Acceptance of the assumptions of the sustainability in the economy means “for mar-keting theory (…) a shift in focus from competitive strategy and its economic grounds (such as profi t, cost, and market potential) toward restricted competition that balances corporate objectives, like market share, with societal objectives, like sustainability” [van Dam and Appledoorn 2008, p. 259].
“Natural Step”. Consideration of the “uncontrolled factors” as the object of the mar-keting management and extension of the time horizon of the marketing activities are not the sole properties of the sustainable marketing. In order to specify its assumptions there is applied a scientifi c frame of the sustainability known as “The Natural Step” [Martin and Schouten 2012, Martin and Schouten 2014, Mish and Miller 2014], which has been created by a team of international experts from over 50 countries representing various disciplines of science who by responding to the report of the Brundtland Commission identifi ed four “systemic conditions” that must be met for the purpose of the sustainable development that have been called the Natural Step. The team members agreed that in order to achieve the sustainable development the nature may not be subject of [the Natu-ral Step 2009]:
constant increase of extraction of the Earth’s crust (e.g. coal);concentration of poisonous substances produced by the human beings (e.g. plastic);degradation through physical intervention (e.g. cutting down forests). Apart from the abovementioned conditions referring to the sustainable natural environment (ecologi-cal), there was presented the fourth condition regarding use of the natural resources and raising the issues of social justice and life conditions. It has been considered that in sustainable society;people may not live in conditions that reduce their chances of satisfying their needs.When referring the above listed conditions to the marketing activities it is assumed
that in order to be able to talk about the sustainable marketing the marketing activities should be limited by: (1) delivery of production materials extracted from the Earth’s crust; (2) ability of the Earth to absorb the substances produced by the human beings that have negative effect on the ecosystem; (3) ability of the Earth to conduct reclamation of the losses resulting from human activity consisting in degradation of the ecosystem; (4) systemic conditions that question the human ability to sustain their basic needs. Taking into consideration the abovementioned criteria it has been ascertained that, e.g. these lim-itations quite substantially infringe marketing of the consumer electronics. It depends on a production process that requires rare metals coming from the Earth’s crust and chemical components, which are not available in the nature as well as other components obtained by physical degradation of the ecosystem. The production activities taken in this sector frequently threaten human ability in favour of satisfaction of the basic needs by decreasing access to water, emission of toxins or employment in dangerous conditions, and in numer-ous cases are realized based on considerations that are too low to satisfy the human needs.
Sustainable market orientation. The sustainable marketing also assumes that change of the marketing model of the enterprises. It is suggested in the sustainable marketing the market orientation that constitutes a basis of the marketing strategy of the most of the
•••
•

Paradigm of sustainable development in marketing 69
Oeconomia 15 (2) 2016
enterprises should be replaced by broader conceptualization, i.e. the sustainable market orientation (SMO) [Mitchell et al. 2010].
Since the second half of the previous century it has been emphasized in the marketing workbooks that neither time nor energy should be used as activities if they are of no mean-ing to a consumer. This view is defi ned as the market orientation (MO). However, it does not exclude attention of the consumers to the environmental issues. It has been known for a long time that most consumers are unwilling to pay substantially more for more en-vironmentally friendly products if their cheaper alternatives are available [Grunert 1992, Lewicka-Strzałecka 2015]. Moreover, expectations of the consumers usually manifest themselves with regard to a short-time perspective, whilst the environmental effects of the marketing activities concern the future generations. Therefore, it is assumed in the sustainable marketing that the marketing activities may not constitute simple refl ection of expectations of the consumers. This constitutes the main prerequisite justifying replace-ment of the market orientation (MO) with the sustainable market orientation (SMO).
The SMO differs from the traditional market orientation by the fact that it offers man-agement that is more socially and environmentally responsible and encourages to seek marketing strategies that guarantee positive results by connecting the marketing activi-ties with the social and environmental norms. According to Mitchell et al. “under the SMO model, corporate marketing management moves beyond MO’s market-based fun-damentalism to corporate marketing characterized by long-run strategies that aim to meet market expectations by the competitive and environmentally responsible application of resources and stakeholder-focused marketing enriched by dimensions of environmental and social responsibility” [2010, p. 163–164].
Reconceptualization of the market orientation towards the sustainability constitutes effect of the synthesis of observation resulting from four various areas of literature. First of all, these are works devoted to the market orientation (MO), in particular within the area concerning its limitations. Meta-analysis of literature devoted to the market orienta-tion [Kirca et al. 2005] encouraged researchers to go beyond the conventional approach to the micromanagement and analyse of the factors affecting its application, including, among others, the environmental changes. It has been enriched with debate on how the powers having infl uence on the market orientation should be identifi ed, measured and assessed [Cadagon et al. 2008, Lawer and Knox 2008]. The second source of the litera-ture on which was based the reconceptualization of the market orientation are the works devoted to the macro-marketing, in particular those devoted to use of the systemic ap-proach towards the marketing activities [Dixon 1984, Layton 2011, Layton 2015]. The third source of the literature are the works devoted to liability of the enterprises towards stockholders [Greenley et al. 2005, Laczniak and Murphy 2012], whilst the fourth source is the literature devoted to management conducted in compliance with social and environ-mental rules [Bansal 2005, Stubbs and Bocklin 2008].
Marketing mix. Apart from the new view on the “uncontrolled” factors of surround-ing the sustainable marketing imposes an obligation to take a new view by a marketing manager on the “controlled” factors, i.e. the marketing instruments commonly used by the marketing managers commonly known as the marketing mix. These instruments dif-fer so substantially from the traditional marketing mix that for the sustainability purposes

70 J. Kamiński
Acta Sci. Pol.
are referred to as 4Cs [Belz and Peattie 2009] contrary to the 4Ps (price, product, place, promotion) used in the classical marketing.
In place of a product (the fi rst P) the emphasis is put on offering the values proposal, i.e. customer solutions (the fi rst C). This is an expression of an assumption that in the sustainable marketing a product does not necessary have to be a physical product and the most material role is to fi nd a solution for a customer, as well as the aim of the sustainable marketing to dematerialize a product or provide customers with solutions that are rather services than goods in the traditional understanding of the material goods [Mish and Miller 2014]. Equipment of cars, hire purchase of devices and equipment are traditional examples, where the ownership is not transferred, but is found a solution to an issue of a customer. This frequently requires correction of the general business strategy of an en-terprise consisting in use of a form of service and production systems which is based on noticing the fact that in the event of use of services instead of products more needs may be satisfi ed with the use of less power and materials. The most known expressions of the dematerialization are the common in numerous countries, including Poland, municipal bike rentals, short-term car rental offered by Zipcar, or the copy offi ces of Xerox consti-tuting an alternative to purchase of a photocopiers of this company [Brzustewicz 2012]. An example of innovations, connected with a product created on a basis of a concept of the sustainable development is also the collaborative consumption otherwise known as co-consumption [Rostek and Zalega 2015] and increasingly more popular “smart shop-ping” [Reformat 2014].
In place of price there is proposed the second C, i.e. the customer cost. Traditionally it is assumed that a market price driven by economic mechanism of demand and supply constitutes an effective tool of making division in the market economy. Due to the fact that the concept of the sustainable development had substantial infl uence on the economy, the new understanding of scarcity (limitation) must be refl ected in the deliberations of the marketing on the value, the refl ection of which is a price. In the traditional marketing one of the most common methods of determining a price is based on costs incurred by the enterprises [Pindakiewicz 2009]. According to the assumption of the sustainable market-ing they should comprise not only economic, but also social and environmental costs that are incurred not only at the production stage, but also in the course of use or disposal of a product. This means that important is not only the price that customer has to pay for the product, but also all costs connected with its use, including utilisation of the product conducted after completion of its use.
Instead of the place there is proposed convenience – the third C. It emphasizes the value for a customer created by sustainable networks of distribution. As far as the tradi-tional marketing is interested in the most effective delivery of product from a producer to a consumer, the most effective construction of a channel and elimination of any confl icts that arise therein, the sustainable marketing broadens this understanding by following the road taken by the product from “a producer to a trash bin” and does not consider waste as external element, but rather an integral element of the marketing system. This approach is closer to the attempt that design, production, use and utilisation of products occurs in a closed circle, namely free from waste and contamination [Borland and Lingreen 2012].
Promotion has been changed into the forth C, i.e. the communication. This is an ex-pression of the view that the purpose of the marketing activities in the sustainable market-

Paradigm of sustainable development in marketing 71
Oeconomia 15 (2) 2016
ing is creation of a specifi c attitude of a consumer, as well as refl ection of the main role of information in creating trust and dialogue in the exchange relations that are present in the sustainable marketing and conviction that the basis of an effective market exchange is both information and trust. In order for a customer to understand and believe that it received both social and environmental benefi ts the proposed values should be communi-cated and presented in a reliable manner.
CONCLUSIONS
Transformation of consumption societies into sustainable societies is one of the main challenges of present day. Particular role in this process plays the marketing. Therefore, there is urgent need of providing further explanation and detail the marketing assumptions from the environmental perspective. Thus, the sustainable marketing and more broadly the relationship of the marketing with the natural environment undoubtedly requires more thorough research serving both the practice and development of the marketing theory. The detailed review of this issue presented in this article shows that the concept of the sustainable marketing means redefi nition of the primary assumptions of the traditional marketing thinking.
The scope of the presented issues of the sustainable marketing, as well as depth of evolution of the traditional marketing shows that the sustainable marketing is most of all a macromarketing term and understood in this manner assumes precedence of the sus-tainable development considering the marketing as a tool to achieve it. This also means that instead of about the sustainable marketing it is better to talk about the marketing in sustainable economic development.
Apart from research at the enterprise level the sustainable marketing requires research explaining to what extent it contributes and may contribute to solving the issue of lack of sustainability and what other actions, including also supporting the marketing (legal regulations at national, international level, certifi cations) should be taken in this regard.
REFERENCES
Assadourian, E. (2010). Transforming Cultures: From Consumerism to Sustainability. Journal of Macromarketing, 30 (6), 186–191.
Bansal, P. (2005). Evolving Sustainably: A Longitudinal Study of Corporate Sustainable Develop-ment. Strategic Management Journal, 26, 197–218.
Belz, F.-M., Peattie, K. (2009). Sustainability Marketing. Wiley, Chichester.Borland, H., Lindgren, A. (2012). Sustainability, Epistemology, Ecocentric Business, and Market-
ing Strategy. Ideology, Reality, and Vision. Journal of Business Ethics, October.Brzustewicz, P. (2012). Systemy produktowo-usługowe jako sposób realizacji rozwoju zrównowa-
żonego w biznesie. Marketing i Rynek, 10, 23–27 (in Polish).Cadogon, J., Souchon, A., Proctor, D. (2008). The Quality of Market Oriented Behaviours: Forma-
tive Index Construction. Journal of Business Research, 61, 1263–1277.Dam van,Y.K., Apeldoorn, P.A.C. (2008). Sustainable Marketing. [In:] M. Tadajewski, D. Brown-
ilie (Eds), Critical Marketing. Contemporary Issues in Marketing, 253–269.

72 J. Kamiński
Acta Sci. Pol.
Dixon, D. (1984). Macromarketing: A Social System Perspective. Journal of Macromarketing, 4, 4–17.
Greenley, G., Hooley, G. Rudd, J. (2005). Market Orientation in a Multiple Stakeholder Orienta-tion Context; Implications for Marketing Capabilities and Assets. Journal of Business Research, 58, 1483–1494.
Grunert, S.C. (1992). Everybody Seems Concerned about the Environment: But Is His Concern Re-fl ected in (Danish) Consumer’s Food Choice? [In:] G.J. Bamossy, W.F. van Raaij (Eds), European Advances in Consumer Research, 1, 428–433.
Kamiński, J. (2009). Nowa defi nicja marketingu AMA. Marketing i Rynek, 5, 7–12 (in Polish).Kamiński, J. (2012). Problems of Implementation Corporate Sustainability in the New EU States
on the Example of Poland. Journal of International Scientifi c Publications: Economy and Business, 6 (4), 98–109.
Kamiński, J. (2014). Marketing a społeczeństwo – obszary oddziaływania – bariery badania. Prace Naukowe Akademii im. Jana Długosza w Częstochowie Pragmata tes Oikonomias, 8, 129–142.
Kirca, A., Jayachandran, S., Bearden, W. (2005). Market Orientation. A Meta-analytic review and Assessment of its Antecedents and Impact on Performance. Journal of Marketing, 69a, 24–41.
Krzyżanowska, M., Wrzosek, W. (2009). Ograniczenia popytowe a marketing. Marketing i Rynek, 5, 2–6 (in Polish).
Laczniak, G.R., Murphy, P.E. (2012). Stakeholder Theory and Marketing: Moving from Firm-Cen-tric to a Societal Perspective. Journal of Public Policy & Marketing, 31 (2), 284–292.
Layton, R.A. (2011). Towards a Theory of Marketing Systems. European Journal of Marketing, 45 (1/2), 259–276.
Layton, R.A. (2015). Formation, Growth and Adaptive Change in Marketing Systems. Journal of Macromarketing, 35 (3), 302–319.
Lawer, C., Knox, S. (2008). Reverse Market Orientation and Corporate Brand Development. Inter-national Studies of Management and Organization, 37, 64–83.
Lewicka-Strzałecka, A. (2015). Mit społecznie odpowiedzialnego konsumenta. Marketing i Rynek, 10, 2–10 (in Polish).
McCarthy, E.J. (1960). Basic Marketing: A Managerial Approach. Irwin, Homewood, Il.Martin, D.M., Schouten, J.W. (2012). Sustainable Marketing. Pearson Prentice Hall, Upper Saddle
River.Martin, D.M., Schouten, J.W. (2014). Sustainable Marketing through the Natural Step. R.J. Varey,
M. Pirson (Eds), Humanistic Marketing. Palgrave Macmilian, New York.Mish, J., Miller, A. (2014). Marketing’s Contributions to Sustainable Society. [In:] P.E. Murphy,
J.F. Sherry Jr (Eds), Marketing and Common Good. Essays from Notre Dame on Societal Impact, 152–174.
Mitchell, R., Wooliscroft B., Higham, J. (2010). Sustainable Market Orientation: New Approach to Managing Marketing Strategy. Journal of Macromarketing, 30 (2), 160–170.
The Natural, Step, (2009). United States Sustainability Primer: Step By Natural Step. Retrieved from www.naturalstepusa.org/storage/case-studies/Primer_USEdition_print_072009.pdf [accessed 25.10.2015].
Perreault, W.D., McCarthy, J. (1999). Basic Marketing: A Global-Managerial Approach. Irwin//McGraw-Hill, Boston, MA.
Perreault, W.D. (Jr), Cannon, J.P., McCarthy, E.J. (2013). Basic Marketing: A Marketing Strategy Planning Approach, McGraw-Hill Education.
Pindakiewicz, J. (2009). Ceny w kształtowaniu wartości dla klientów przez fi rmy działające na polskim rynku. Marketing i Rynek, 12, 25–28 (in Polish).
Reformat, B. (2014). Nowe pokolenie „sprytnych” konsumentów, jako efekt zjawiska „smart-sho-pingu”. Marketing i Rynek, 6, 611–624 (in Polish).

Paradigm of sustainable development in marketing 73
Oeconomia 15 (2) 2016
Rostek, A., Zalega, T. (2015). Konsumpcja kolaboratywna wśród młodych polskich i amerykań-skich konsumentów. Marketing i Rynek, 6, 24–34 (in Polish).
Rotfeld, A.D. (2015). ONZ: między sukcesem a rozczarowaniem. [In:] Rzeczpospolita Polska Mi-nisterstwo Spraw Zagranicznych, „70 Silna ONZ. Lepszy Świat”. Polityka, 43 (3032), 2–3 (in Polish).
Stubbs, W., Bocklin, C. (2008). Conceptualising a „Sustainability Business Model”. Organization and Environment, 21, 103–127.
United Nations (1987). Our Common Future. World Commission of Environment and Develop-ment A/42/427 (June), Geneva, Switzerland. Retrieved from www.un-documents.net/our-common-future.pdf [accessed 9.03.2016].
Wilkie, W.L., Moore, E.S. (2014). A Larger View of Marketing. Marketing’s Contributions to Soci-ety. [In:] P.E. Murphy, J.F. Sherry Jr (Eds), Marketing and Common Good. Essays from Notre Dame on Societal Impact, 13–40.
PARADYGMAT ZRÓWNOWAŻONEGO ROZWOJU W MARKETINGU
Streszczenie. W powszechnym odbiorze dominuje pogląd, że marketing i zrównoważony rozwój to pojęcia od siebie dość odległe, bowiem zgodnie z obowiązującym stereotypem zajmują one przeciwstawne krańce płaszczyzny konsumpcji. W artykule wykazano, że zwią-zek marketingu ze zrównoważonym rozwojem jest wyjątkowo silny. Wynika on z funkcji spełnianych przez marketing w gospodarce rynkowej polegających na kojarzeniu dóbr i po-trzeb na rynku oraz aktywności w sferze kreowania i zaspokojenia pragnień konsumentów w celu osiągania przez nich satysfakcji. Koncepcją, która najpełniej odzwierciedla zain-teresowanie marketingu zrównoważonym rozwojem, jest zrównoważony marketing (ang. sustainable marketing). Pomimo iż jest on w Polsce coraz bardziej popularny, brak jest do tej pory jego omówienia z punktu widzenia szerszego niż punkt widzenia przedsiębiorstwa. W artykule ukazano problematykę zrównoważonego marketingu z makromarketingowego punktu widzenia. Szczególny akcent położono na rolę, jaką odgrywa on z punktu widzenia przedefi niowania założeń tradycyjnej koncepcji marketingowej.
Słowa kluczowe: zrównoważony marketing, marketing w zrównoważonym rozwoju gospo-darczym, makromarketing
Accepted for print: 22.04.2016
For citation: Kamiński J. (2016). Paradigm of sustainable development in marketing. Acta Sci. Pol., Oeconomia, 15 (1), 63–73.


Oeconomia 15 (2) 2016, 75–85
PRODUCT INNOVATIVENESS AND ITS IMPACT ON HEALTH RELATED IMPORTANCE OF FOOD IN THE CATERING BUSINESS
Iwona Kowalczuk, Krystyna Gutkowska, Marta Sajdakowska, Sylwia Żakowska-BiemansWarsaw University of Life Sciences – SGGW
Abstract. The objective of the study was to learn the opinions of representatives of gas-tronomy businesses regarding product innovativeness of the sector, with a focus on healthy solutions. The qualitative study of this issue was conducted with in-depth interviews with owners and managers of food service establishments. It was found, that actions (related to products and production technology) increasing the positive impact of menu on customers’ health are taken, however to a limited degree. It was also recorded, that kitchen staff and waiters alike have little interest in introducing or promoting innovations. The conducted studies reveal a great potential of the gastronomy market in promoting healthy products, however in order to realize it, employees must be educated.
Key words: food service market, innovation, functional foods
INTRODUCTION
In modern economy, in order to gain a competitive advantage one must systematically introduce new or improved solutions in production, processes, marketing and organi-zation [Lewandowska 2014]. Innovativeness is presently a must – according to Littler [1982] entrepreneurs resort to innovation in order to outlast or outdo their competition. Pomykalski states [2001], that lack of innovation is far more dangerous to an enterprise than the risk of its (innovation’s) failure, because it can put in jeopardy not only the enter-prise’s competitive position, but also its very survival in the market. Observations of the market practice confi rm the statements above.
Corresponding author: Iwona Kowalska, Warsaw University of Life Sciences – SGGW, Faculty of Human Nutrition and Consumer Sciences, Department of Organization and Consumption Econom-ics, 02-776 Warszawa, Nowoursynowska 159C, Poland, e-mail: [email protected] © Copyright by Warsaw University of Life Sciences Press, Warsaw 2016
ISSN 1644-0757eISSN 2450-4602
http://acta_oeconomia.sggw.pl

76 I. Kowalczuk et al.
Acta Sci. Pol.
In terms of market success of an enterprise, new products comprise an important group of innovations, due to their increasing signifi cance in marking the level and speed of sales growth, market share and consequently the competitive position of an enterprise [Lemano-wicz 2015]. The driving forces for development of new products are [Krawiec 2000]:
worldwide advancement of the technological base and know-how; changes in consumers’ needs, expectations and preferences; gradual shortening of products’ life cycles; opening of foreign markets, globally increasing competition [Krawiec 2000].According to Surmacka-Szcześniak [1995], in the food market, the practice of in-
novative solutions allows to extract the following categories of new food products: new products complimenting previous product lines e.g. with new fl avors (line extension), new products created by market displacement or new applications of an existing product (changing the product’s image in consumer’s perception), repositioned products, products with new physical form, products with an altered recipe, products with a new package, innovatory products, creative products. Another example of a division which takes into account the specifi cs of food assortment might be the new food categories introduced by Tuorilla [2001] i.e. functional foods, foods with modifi ed composition, genetically modi-fi ed foods, organic foods and ethnic foods. Dekker and Linnemann [1997] extracted four generations of new food products:
Progress in food preservation and production of microbiologically safer food with longer expiration dates.Combining the nutritional value and fl avor requirements.Convenience in using products and preparing food – expansion of convenient food market.Protecting or improving consumers’ health – expansion of functional food market.It should be noted that specifi cally the healthy foods segment sees the most product in-
novations. In Poland and Europe, products with documented positive impact on health are mostly introduced in the cereal and dairy sectors, whereas in the US and Japan functional soft drinks, cereal products and pastries are the most popular ones [Kiedrowski 2007].
THE DIRECTIONS OF CHANGES IN THE FOOD SERVICE MARKET
Food service plays a signifi cant part in the process of food market development, in-cluding its innovativeness. This stems from the unique position of the sector and its ties with different areas of the food market, including:
Maintaining business relations with suppliers from various branches. This in turn al-lows caterers to not only obtain knowledge about the novelties on the market and innovative directions, but also to inspire changes in this area.Processing acquired raw materials and producing dishes, which allows to exercise creativity and innovativeness.Direct contact with the customer through the service process, which allows caterers to acquire information about consumer expectations on one hand, and to propagate information about novelties in the market and encourage consumers to take interest in the innovative offer on the other.
••••
1.
2.3.
4.
1.
2.
3.

Product innovativeness and its impact on health... 77
Oeconomia 15 (2) 2016
Between years 2000 and 2014 Polish food service market has experienced pro-quality changes. Overall number of food service establishments has dropped (by nearly 20%); however, the number of restaurants, which provide a higher standard of food services, has doubled [Roczniki Statystyczne 2001–2015]. According to prognoses, by 2016 all food serv-ice enterprises will record an increase in sales, and the most spectacular growth is predicted for fast-food outlets, home deliveries sector, pizzerias and restaurants [Oksiński 2012].
Changes in the food services market affect various aspects of the business. New con-cepts of food services are introduced (fast casual, upper casual, coffee bars, vegetarian bars or ethnic eateries) [Levytska 2011]. Existing companies systematically expand their menus with dishes from different cuisines and combining them with Polish dishes (fu-sion cuisine). There is also an increase in the number of places offering molecular cuisine dishes [Bartkowska 2013]. New forms of meals are offered as well (lunch, brunch, break-fast offer) [Na dobry… 2008]. Food service businesses employ increasingly new and advanced technologies in the production of dishes, which is made possible by changes in construction and parameters of machines and appliances in gastronomy [Rodgers 2007]. A signifi cant diversifi cation of prices is also taking place in gastronomy – the market hosts inexpensive bars as well as luxurious restaurants, which increases the economic accessibility of this sector. An intensifi ed distribution is also observed – food services are available in workplaces, at schools, entertainment centers and increasingly often in shopping centers [Levytska 2011], catering is growing in popularity as well. A GfK re-search from 2014 found a dynamic growth in additional services such as the Internet access, television or accepting payment cards [Stępniak 2015]. Food service businesses are expanding their area of activities, combining them with other services, which results in such enterprises like bookstores/cafes, children- or animal-friendly places. Computer programs improving work organization are growing in popularity, including those facili-tating customer service.
Due to growing incomes and an expanding offer in food services, Poles are more in-clined to use those services and spend more on them (from 7.6 PLN monthly per person in 2000 up to 26.5 PLN in 2014) [Budżety gospodarstw domowych 2001–2015]. Besides economic factors, the increase in demand is also fostered by demography (increase in number of 1- and 2-person households), socio-professional factors (increase in profes-sional activity among women), culture (lifestyle changes) and marketing.
Growing importance of gastronomy in satisfying the nutritional needs results in an in-creasing infl uence of this sector on consumers’ eating habits, health-awareness included. Gastronomy can play a signifi cant role in promoting healthy eating, e.g. through using and offering functional products, i.e. those with a documented impact on health [Dekker and Linnemann 1997, Tuorila 2001, Świderski 2003, Kiedrowski 2007, Siro et al. 2008, Starling 2010] as well as products with enhanced healthy properties [Cygan et al.].
The goal of the study was to learn the opinions of food service business representa-tives regarding product innovativeness of the sector (including the use of functional foods available on the market), identifying actions taken in food service businesses in order to increase the healthiness of the dishes, as well as to gather information about means of popularizing this kind of products and enticing customers’ interest in healthier menus.

78 I. Kowalczuk et al.
Acta Sci. Pol.
MATERIAL AND METHODS
The qualitative study has been carried out in 2013 using in-depth, partially structured, individual interviews. Owners and managers of selected enterprises were interviewed following an original script. The sample was selected with the gastronomy business struc-ture taken into account (quota selection) (Table 1). The study was realized as a part of the Biofoods – innovative, functional animal products project.
Table 1. Structure of the examined establishments in 2013Type of establishment Sector structure (%) Number of interviewsRestaurants 22.2 5Bars/Pubs 37.9 7Cafeterias and canteens 6.3 2Catering outlets 33.5 6
Source: GUS statistical yearbook 2012, study realized as a part of the Biofoods project.
At a time and place agreed upon with the interviewees, 20 interviews have been con-ducted concerning the issues touched upon in the objective of the study (the interviewees’ characteristics are presented in Table 2). The informative basis for the report was analysis of the notes taken during the interviews.
Table 2. Characteristics of the intervieweesHighlighting Number of interviewees
Number of employeesUp to 5 45–9 1010–19 420–49 250 and more 0
OwnershipPrivate 20Public 0
LocationRural areas 0Town of up to 20 thousand 6Town of 20–99 thousand 3City of 100–499 thousand 4City over 500 thousand 7
Operating timeUp to 5 years 85–10 years 7Over 10 years 5
Source: Study realized as a part of the Biofoods project.

Product innovativeness and its impact on health... 79
Oeconomia 15 (2) 2016
RESULTS
Directions of innovation in gastronomy
Based on the results it may be said, that 2013 was signifi cantly better in terms of prod-uct innovativeness than previous years (2010–2012). However, none of the interviewees has reported new or signifi cantly improved products being created in the enterprise in either of time intervals. In the area of process innovations, in both time intervals about half of the enterprises have introduced new production technologies. Over half of them have employed new or signifi cantly improved methods of supporting processes in the enterprise. The highest number of innovations have been introduced in logistics, with 16 enterprises employing new or signifi cantly improved processes in 2010–2012 and 18 in 2013. Innovations in organization, particularly of work, have been introduced in 13 enterprises in 2010–2012 and 19 in 2013. A similar intensifi cation was observed in the area of information exchange and relations with environment in 2013. As for marketing innovations, the most popular actions were: modifying the appearance of dishes, employ-ing new forms of sales and communication with the customer. Altering the appearance of establishment or its surroundings proved to be less common (Table 3).
Table 3. Directions of innovations in the examined gastronomic enterprises (number of answers, n = 20)
Factor Directions of innovative actions2010–2012 2013Yes No Yes No
Product
new or signifi cantly improved products for the company 10 10 18 2
new or signifi cantly improved products for the market 0 20 0 20
Processes
new or signifi cantly improved production technolo-gies 10 10 9 11
new or signifi cantly improved logistic and distribu-tion processes 16 4 20 0
new or signifi cantly improved methods of supporting processes in the enterprise (supply, bookkeeping) 11 9 13 7
Organiza-tion
new or signifi cantly improved systems for internal exchange of information, knowledge and skills 2 18 16 4
signifi cant changes in work organization 13 7 19 1new or signifi cantly improved relations with other companies (cooperation, outsourcing, subcontract-ing)
9 11 17 3
Marketing
signifi cant changes in appearance of the dishes 19 1 20 0signifi cant changes in the appearance of the estab-lishment and/or its surroundings 18 2 9 11
new or signifi cantly altered sales methods (sales through the Internet, takeaway, franchising etc.) 8 12 20 0
new methods of communicating with the customer 5 15 15 5Source: Study realized as a part of the Biofoods project.

80 I. Kowalczuk et al.
Acta Sci. Pol.
Directions of innovation taken in the examined companies were diversifi ed, however a prevalence of actions related to meat- and giblets-based products were observed. Six interviewees reported, that their enterprises have introduced in general more items con-taining meat to the menu in response to an increasing customers’ interest in such dishes. The same reason was given for introducing meat-based fast-food dishes in four of the examined bars. Four interviewees stated that consumer interest in beef is growing, which might mean an expanding offer of beef-based dishes. Canteens, too, add meat dishes to the menu, and their managers report an increasing popularity of giblets. They also de-clared introducing new dairy-based dishes, stressing the fact, that their main motivation is decreasing the expenses, which met with moderate acceptance among the customers.
The gastronomic offer is also developing towards ethnic foods – six interviewees declared introducing dishes from foreign cuisines, mainly Italian and Chinese. Three in-terviewees (representing restaurants) reported experimenting with molecular cuisine in their establishments.
Actions promoting healthy solutions
Sixteen interviewees declared introducing changes involving healthy solutions, which is an important direction for product innovativeness in gastronomy. Nine of them reported introducing dietetic dishes to the menu, most of which were low-fat. Seven interviewees stated, that the menu has been expanded with dishes based on organic stock – in one case it was organic cottage cheese, and in the other – organic eggs. Ten subjects expressed their opinion, that a growing customers’ interest in lunch salads resulted in expanding the offer with more such items.
During the interviews it became apparent that the interviewees had a problem with de-fi ning what functional foods are. Most of them did not understand the concept, and nearly half associated it with convenience rather than a positive impact on health. Having the term explained, 12 of them concluded that they do not identify many of the healthy prod-ucts, and when asked for examples, pointed mainly to Actimel and low-fat dairy products. The most popular functional animal products used in kitchen were dairy products, espe-cially low-fat yoghurts (6 interviewees) and cottage cheeses (5 interviewees). Two people declared using low-cholesterol eggs, and fi ve stated that they use organic products, which also affects the “healthiness” of the dishes.
According to the interviewees’ answers, healthy solutions in technological processing are taken with moderation degree and in different directions. The most popular ones are reducing the amount of fats (12 answers) and substituting animal fats with vegetable oils. However, further questioning revealed, that these actions are mainly motivated by reduc-ing costs and convenience of using vegetable oils. Reducing the time of heat processing (8 answers) was also found to be caused by economic circumstances (the price of energy) rather than willingness to preserve the nutritional value of a meal.
A signifi cant number (11) of interviewees reported curbing the use of salt. As an ex-planation, they stated that customers have varying preferences in this matter and it is better to let them add salt themselves. Only two interviewees declared using salt enriched with potassium – both of them suffering from hypertension, which is symptomatic.

Product innovativeness and its impact on health... 81
Oeconomia 15 (2) 2016
A considerable portion of answers (9) concerned reducing the use of sugar, and three interviewees declared substituting standard white sugar with its healthier alternatives (brown or cane sugar) in their establishments. Fourteen interviewees claimed to offer brown sugar as well as white for sweetening hot drinks, and in six cases sweeteners were also available.
Nine interviewees confi rmed using fresh spices, most of them representing restau-rants. It was also the restaurant owners/managers who declared limiting the use of so-dium glutamate. A small number of interviewees (7) claimed to avoid using allergenic products (considering those to be mostly nuts, citruses, seafood, dairy products and products with gluten).
In seven of the examined establishments frying is substituted with boiling or stewing. In four of them the reason is health, in the others – economy.
Only one in four interviewees confi rmed, that the time of storing dishes before serv-ing is being limited in their establishments. Admittedly, the main motivation for that was preserving the sensory qualities, however all of the interviewees were aware, that it also reduces the nutritional value loss.
The least popular products in the technological process were those rich in fi ber – only three establishments use them, mostly whole grain breads and pastas.
The structure of the interviewees’ answers regarding healthy solutions they include in preparing the menu is presented by data in Table 4.
Table 4. Healthy solutions included in food processing in catering establishments Types of healthy solutions %Using functional products 40Reducing the use of fat 60Substituting animal fats with vegetable oils in the technological process 65Reducing the use of sugar 45Substituting white sugar 15Reducing the use of salt 55Reducing the use of sodium glutamate 20Using salt with modifi ed composition 10Reducing the use of allergenic products 35Using fi ber-rich products 15Using fresh spices 45Substituting frying with boiling or stewing 35Reducing the time of heat treatment 40Reducing the time of storage before serving 25
Source: Study realized as a part of the Biofoods project.
Popularizing the healthy menu
According to the interviewed managers, kitchen staff has little interest in creating and introducing innovative solutions, which is especially true of employees with long work experience and low education. Employees with secondary and higher education exhibit

82 I. Kowalczuk et al.
Acta Sci. Pol.
more initiative in this area, they are also more open to customers’ suggestions and more eager to realize their custom requests.
A decisive majority of the interviewees shares an opinion, that women are more inter-ested in introducing healthy solutions, while men are more likely to propose dishes with new fl avors, texture or form.
As for the waiters, they are not interested in promoting healthy dishes and mostly do so only when explicitly asked to by manager or a customer. According to the interview-ees, such passive attitude is caused by big staff rotation and lack of commitment to the job, as well as insuffi cient knowledge about nutrition and reluctance to gain it. No specifi c socio-demographic profi le of an innovative waiter could be determined, the only conclu-sion being that women are slightly more active in this area.
Experiences of the interviewees regarding forms of promoting innovative menu point clearly to the key role of waiters in communicating the information about novel-ties and therefore eliciting customers’ purchasing behaviors (average effi ciency rate of 4,2 on a scale from 1 – ineffi cient form, to 5 – very effi cient form). Another effi cient form of encouragement are tastings (3.6), although, according to the interviewees, they are not popular among employees nor customers. As for leafl ets (3.2), the interview-ees consider them an effective form of promoting an establishment, but not so much for promoting new items on the menu. Establishments’ websites (3.0) received similar opinions. The interviewees, particularly the younger ones, stressed the importance of advertising on the Internet (2.7), especially on social media, in propagating informa-tion about innovations. Similarly to leafl ets and websites, outdoor advertising (2.9) is considered a reliable form of promoting an establishment (the interviewees stressed the importance of signboards, distinguishing the entrance, outdoor stands displaying the menu, as well as signposts and banners with directions to the establishment), however ineffective in promoting a new menu. The least effective in the interviewees’ opinion were: advertising in press (2.1), radio (1.9) and television (1.7), due to their high costs and low effi ciency, considering the geographic range of markets, in which individual establishments operate (Table 5).
Table 5. Effi ciency of selected forms of promotion in communicating information about new items on the menu
Forms of promoting Effi ciencya
Personal sales 4.2Website 3.0Tastings 3.6Leafl ets 3.2Advertising in press 2.1Outdoor advertising 2.9Advertising on the Internet 2.7Advertising on the radio 1.9Advertising in television 1.7
a On a scale from 1 – ineffi cient form, to 5 – very effi cient form.Source: Study realized as a part of the Biofoods project.
Product innovativeness and its impact on health... 83
Oeconomia 15 (2) 2016
CUSTOMERS’ REACTIONS TO A HEALTHY MENU
The interviewees stressed, that the actions they take in order to create a healthier menu are mostly a response to consumers’ shifting expectations. However, a vast majority of the interviewees declared, that they would prefer to introduce standard changes to the menu (new ingredients, fl avors, seasonal changes to the menu), since that is the area in which they consider themselves experts and fi nd it easier to predict customers’ reactions, rather than healthy solutions.
According to the interviewees, customers are mostly interested in the fat contents of consumed products (e.g. they ask for cutlets from lean meat, favor poultry dishes over pork, leave out the fat parts of meat, do not add sour cream to soups, or mayonnaise to eggs, request frying with little fat), they are also wary of the amount of sugar they consume (they do not sweeten their tea or coffee, choose sugar-free soft drinks). Older consumers limit the amount of salt in products, and the younger ones are increasingly reluctant to use sodium glutamate. Younger consumers and women also order salads and organic dishes more often.
CONCLUSIONS
Every year gastronomy is growing more innovative. The examined enterprises take innovative actions in various directions, although there is a strong tendency towards prod-ucts and dishes based on meats and giblets. Menus are also developed towards ethnic foods, and there is some interest in introducing molecular cuisine.
Healthy solutions are an important direction of product and process innovativeness (introducing dietetic dishes to the menu, using organic stock, limiting the use of fats, sub-stituting animal fats with vegetable oils, limiting the time of heat treatment and curbing the use of salt and sugar). Consumers’ interest in healthy solutions is moderate and con-cerns mostly the amount of fats, sugar, salt and sodium glutamate in the served dishes.
According to the interviewees, neither kitchen staff nor waiters are interested in intro-ducing or promoting innovations, wherein the level of creativity in this area depends on age, education and gender.
The conducted studies reveal a great potential of the gastronomy market in promoting healthy products, however in order to realize it, employees must be educated.
REFERENCES
Bartkowska, M. (2013). Atelier Amaro. Sukces pod prąd, Nowości Gastronomiczne, 4, 20–23.Budżety gospodarstw domowych [Household budgets] (2000–2014). Zakład Wydawnictw Staty-
stycznych, Warszawa. Cygan, P., Waszkiewicz-Robak, B., Świderski, F. (2003). Żywność funkcjonalna – przyszłość, per-
spektywy, trendy. Przemysł Spożywczy [Functional foods – future, perspectives, trends. Food industry], 3 (57), 12–15, 46.
Dekker, M., Linnemann, A.R. (1997). Product development in the food industry. [In:] W.Y.G. Jon-gen, M.T.G. Meulenberg (Eds), Innovation of food production system: product quality and consumer acceptance. Wageningen Press NL, 70–71.

84 I. Kowalczuk et al.
Acta Sci. Pol.
Kiedrowski, M. (2007). Żywność funkcjonalna – charakterystyka, trendy, perspektywy [Functional foods – characteristics, trends, perspectives]. Retrieved from http://www.poradnikmedy-czny.pl/publikacje/7273 (accessed 10.10.2015).
Krawiec, F. (2000). Zarządzanie projektem innowacyjnym produktu i usługi [Managing innovative projects for products and services]. Difi n, Warszawa.
Levytska, G. (2011). Usługi gastronomiczne – znaczenie i tendencje rozwoju [Food services – im-portance and develpoment tendencies]. Wyd. SGGW, Warszawa.
Littler, C.R. (1982). The Development of the Labour Process in Capitalist Societies. Heinemann, London.
Lemanowicz, M. (2015). Innovation in economic theory and the development of economic thought. Acta Scientiarum Polonorum, Oeconomia, 14 (4), 61–70.
Lewandowska, M.S. (2014). Innovation barriers and international competitiveness of enterprises from polish food processing industry. Research results. Acta Scientiarum Polonorum, Oeconomia, 13 (4), 103–113.
Na dobry początek dnia (2008). Food Sevice, 3, 28–30. Oksiński, M. (2013). Restauracje w stabilnej sytuacji [Restaurants in a stable situation]. Nowości
Gastronomiczne, Wydanie specjalne: Rynek Gastronomiczny w Polsce 2012, 1, 4–6.Pomykalski, A. (2001). Zarządzanie innowacjami [Managing innovations]. Wyd. Naukowe PWN,
Warszawa – Łódź.Roczniki statystyczne [Statistical yearbooks] (2000, 2014). Zakład Wydawnictw Statystycznych,
Warszawa.Rodgers, S. (2007). Innovation in food service technology and its strategic role. Hospitality Man-
agement, 26, 899–912. Siro, I., Kapolna, E., Kapolna, B., Lugasi, A. (2008). Functional food. Product, development, mar-
keting and consumer acceptance – a review. Appetite, 51, 456–467.Starling, S. (2010). US functional foods market to grow 21 percent by 2015. Retrieved from http://
www.nutraingredients-usa.com/Markets/US-functional-foods-market-to-grow-21-per-cent-by-2015 (accessed 4.10.2015).
Stępniak, K. (2015). Mocno w górę. Nowości Gastronomiczne, Wydanie specjalne: Rynek Gastro-nomiczny w Polsce 2014, 1, 20–29.
Surmacka-Szcześniak, A. (1995). Tekstura [Texture]. [In:] J. Czapski (Ed.), Opracowanie nowych produktów żywnościowych [New food producs development]. Wyd. Akademii Rolniczej w Poznaniu, Poznań, 195–206.
Świderski, F. (2003). Towaroznawstwo żywności przetworzonej [Science of commodities for pro-cessed foods]. Wyd. SGGW, Warszawa.
Tuorilla, H. (2001). Keeping up with the change – consumers responses to new and modifi ed foods. Food Chain, Program Abstracts, 39.
INNOWACYJNOŚĆ PRODUKTOWA I JEJ WPŁYW NA PROZDROWOTNE ZNACZENIE ŻYWNOŚCI W SEKTORZE USŁUG GASTRONOMICZNYCH
Streszczenie. Celem przeprowadzonego badania było poznanie opinii przedstawicieli branży gastronomicznej na temat innowacyjności produktowej sektora, ze szczególnym uwzględnieniem rozwiązań prozdrowotnych. Badanie jakościowe dotyczące tej problema-tyki przeprowadzono metodą pogłębionego wywiadu indywidualnego z właścicielami lub managerami placówek gastronomicznych. Stwierdzono, że w gastronomii podejmowane są działania (związane z produktem i technologią wytwarzania) zwiększające pozytywny wpływ oferty na zdrowie klientów, jednak ich skala nie jest duża. Odnotowano, iż za-równo personel kuchenny, jak i obsługa kelnerska są mało zainteresowani wprowadzaniem

Product innovativeness and its impact on health... 85
Oeconomia 15 (2) 2016
i propagowaniem innowacji. Na podstawie przeprowadzonych badań sądzić można, że ist-nieje duży potencjał rynku gastronomicznego w propagowaniu prozdrowotnych produk-tów, ale warunkiem jego wykorzystania jest szeroka edukacja branży w tym zakresie.
Słowa kluczowe: rynek gastronomiczny, innowacyjność, żywność funkcjonalna
Accepted for print: 28.03.2016
For citation: Kowalczuk I., Gutkowska K., Sajdakowska M., Żakowska-Biemans S. (2016). Prod-uct innovativeness and its impact on health related importance of food in the catering business. Acta Sci. Pol., Oeconomia, 15 (2), 75–85.


Oeconomia 15 (2) 2016, 87–101
PURCHASING PLACES OF CONSUMER GOODS IN SELECTED EUROPEAN COUNTRIES
Grzegorz MaciejewskiUniversity of Economics in Katowice
Abstract. The article focuses on the selection of purchasing places of main groups of con-sumer goods and services by the consumers from the selected European countries (Bel-gium, France, Germany, Poland, Romania and Slovakia). The source foundations for this article are constituted by the source literature and the results of fi eld research run within the research project titled Commerce and services in Europe – diagnosis and development perspectives conducted from 2013 to 2015. The presented research results point to imita-tion of consumers’ behaviours from the selected European countries with relation to the selection of shopping centres as a shopping area. In each of the analysed countries, the consumers declaring doing shopping in shopping centres constituted over 3/4 of the group of respondents. The research results also point to imitation of purchasing e-behaviours. Except for Romania, Internet shopping was declared by 2/3 of the questioned consumers. The difference among consumers from particular countries are observable, however, in the selection of a purchasing place for food, cleansing products, radio and TV equipment, household appliances as well as clothing and footwear. Key words: consumer, the retail trade, the place of purchase of goods and services, quan-titative research, Europe
INTRODUCTION
The basic task of retail trade is the creation of suitable conditions for customers to purchase products. The problematic aspects of retail trade as a research fi eld should be then considered not only at the level of the company, but also at the level of the needs of individual consumers, constituting the most signifi cant and numerous group of customers of retail outlets. Due to competitive force which is demonstrated by this group of mar-ket entities, shopping must take place in suitable time and place, in the way consistent with their wishes and on the terms benefi cial for them [Zakrzewski 1977, Czubała 2001,
Corresponding author: Grzegorz Maciejewski, University of Economics in Katowice, Facul-ty of Economics, Market and Consumption Department, 1 Maja 50, 40-287 Katowice, Poland, e-mail: [email protected]© Copyright by Warsaw University of Life Sciences Press, Warsaw 2016
ISSN 1644-0757eISSN 2450-4602
http://acta_oeconomia.sggw.pl

88 G. Maciejewski
Acta Sci. Pol.
Sławińska 2008]. A large amount and diversity of needs, which may be satisfi ed in retail trade, contribute to the simultaneous initiation, by the companies, of different places and ways of providing products for their customers. The result of such activities is a new structure of retail trade, meeting the customers’ expectations, observable in particular European countries.
The objective of the article is to concentrate on the selections of stationary and virtual purchasing places of main groups of consumption products done by the consumers from the selected European countries (Belgium, France, Germany, Poland, Romania and Slo-vakia). The research results, done for the purposes of this article, demonstrate the most preferable trade formats by the consumers [Borusiak 2008], constituting the indicators for further development of retail trade companies, as well as for the basic local government units – the organizers of retail trade networks within a given area.
SOURCE MATERIAL AND RESEARCH METHODS
The considerations presented in this article were collected with the use of logical deduction methods, critical analysis of subject literature, and most of all the conclusions from quantitative studies1.
The quantitative research was conducted in April and May 20142. Its objective was the identifi cation of purchasing behaviours and opinions of the residents on the functioning of commercial and service entities in the selected European countries. The countries with diverse economic and social potential were selected for the study. There were the eco-nomic moguls as well as the representatives of less developed post-communist economies among the analysed countries. The countries of big and low human potential. “Old” and “new” members of the European Union. The countries which have already accepted their common EURO currency and the countries possessing their own currencies. The mem-bers of Shengen Area and the ones remaining out of it. As a result, we found out about places and ways of shopping for main groups of products by the questioned consumers, information about the opinions of the respondents on the structure and the functioning of retail trade and service companies in their places of residence, as well as about the Inter-net as a space for sale and purchase of consumer goods and services3.
The described studies were conducted among the targeted individual consumers [Kędzior 2005]. Adults, shopping for consumer goods and services have been qualifi ed for the sample.
1 The research was conducted within a three-year project titled Trade and services in Europe – diag-nosis and development perspectives, which was managed by the author. The project was fi nanced from the funds of Ministry of Higher Education and Science to maintain a research potential in the years 2013–2015.2 The research was conducted in the following places: Brugge (in Belgium), Seinajoki (in Finland), Grenoble (in France), Berlin and Prenzlau (in Germany), Katowice urban area (in Poland), Bucarest (in Romania), Bratislava (in Slovakia) and Budapest (in Hungary). 3 Only the selected results of the described research concerning Belgium, France, Germany, Poland, Romania and Slovakia were presented in this article. More in: Jaciow et al. [2015], and Kucharska et al. [2015].

Purchasing places of consumer goods in selected European countries 89
Oeconomia 15 (2) 2016
The technique of a distributed questionnaire was used to obtain primary information. The survey questionnaire served as a tool. It contained 32 content-related questions and 5 metrical questions. Metrical questions were predominantly formulated in the form of ordinal, bipolar and seven-degree scales. Moreover, the questions in the form of tables were used as well as dichotomous, branching logic questions. Metrical questions were subject to the research objectives and served for the identifi cation of purchasing behav-iours of the respondents as well as to collect the respondents’ opinions on the functioning of commercial and services companies in their place of residence. Metrical questions en-able to characterize the analysed sample (Table 1).
Table 1. Characteristics of the questioned consumers
Specifi cation Belgium(N = 313)
France(N = 204)
Germany(N = 300)
Poland(N = 300)
Romania(N = 280)
Slovakia(N = 321)
Sex of subjects (%)Woman 53.7 60.8 51.0 50.0 74.6 61.1Men 46.3 39.2 49.0 50.0 25.4 38.9
Professional activity (%)Works 49.7 15.2 77.4 60.0 40.0 64.9Does not work 50.3 84.8 22.6 40.0 60.0 35.1
Size of place of residence (%)To 20 k 39.3 26.0 15.0 13.7 8.2 21.2From 21 to 50 k 22.0 13.2 15.7 15.3 7.9 19.9From 51 to 100 k 17.6 16.7 14.0 22.7 7.1 17.8From 101 to 500 k 20.1 30.9 11.3 48.3 10.4 17.1Over 500 k 1.0 13.2 44.0 – 66.4 24.0
Subjective evaluation of economic position (%)Very bad 1 1.6 5.0 3.5 1.3 0.4 0.92 4.5 10.6 10.4 2.7 0.7 4.43 10.5 21.1 21.5 13.3 26.5 12.34 30.4 30.2 22.2 36.0 38.5 35.25 34.2 25.1 26.7 32.7 20.4 31.16 16.3 6.5 12.5 11.3 10.5 12.9Very good 7 2.6 1.5 3.1 2.7 2.9 3.1
Statistics of subjects’ age (years)Average 35.5 20.0 37.7 34.8 37.6 32.6Mode 19 18 27 21 22 22
Source: Own research.
The intention of the researchers was to obtain a sample at the level of 300 consumers in each of the countries, where the research was conducted. However, as a result of the diffi culties related to conducting the international research and the formal verifi cation of the obtained material, the sample size in particular countries is diversifi ed (Table 1). The obtained results should not be analysed as the results of comparative studies, but as a set of national studies.

90 G. Maciejewski
Acta Sci. Pol.
RESULTS AND DISCUSSION
Belgium
While analysing the declarations of the questioned Belgians related to the most fre-quently selected purchasing places, we may observe the differences in the selection of place depending on a purchased product (Table 2). And hence, in case of purchasing food, the respondents most frequently pointed to a discount store (23.1%) and to supermarket (21.3%). Supermarket was also the most frequent purchasing place for cleansing products by the questioned Belgians (27.4%). On the other hand, the respondents most frequently visited the specialized stores (26.1%) to purchase clothing and footwear. However, which is a bit surprising, the most frequent purchasing place to buy radio and TV equipment as well as household appliances was the Internet (30%), according to the Belgian respondents.
Table 2. The most frequent purchasing places for products – declarations of the questioned Bel-gians (N = 313)
Specifi cationFood Cleaning
products
Household appliances and audio//video devices
Clothes andshoes
%
Discount store 23.1 17.9 4.3 1.9Convenience store/Corner shop 16.0 18.8 9.6 4.1
Specialist shop 2.0 3.2 6.1 26.1
Hypermarket 13.6 19.6 19.6 3.6
Supermarket 21.3 27.4 5.8 1.8
Local shop 7.0 4.6 14.5 25.2
Marketplace/Bazaar 16.1 3.5 10.1 11.8
Internet 0.8 4.9 30.0 25.5Source: Own research.
A separate aspect of the initiated research was the issue of the defi nition of the role of shopping centres as places for shopping. Almost 80% of the questioned Belgians declared the visiting of shopping centres to purchase goods and services. The people visiting shop-ping centres were further asked to indicate the most frequently purchased goods and serv-ices in this type of commercial entities4. While analysing the obtained research results, we may observe that shopping centres are for Belgians the purchasing places for, most of all, such goods as: clothing and footwear (78%), cosmetics (42.4%) as well as sport and rec-reational equipment (32.8%). However, in case of purchasing services, the respondents go to shopping centre to the banking institutions (60.4%), food service outlets (24.4%) and beauty salons (also 24.4%) – Table 3.
4 The respondents in all analysed countries were selecting from a list of 14 groups of goods and 14 groups of services, being able as well to indicate other kinds than the ones mentioned by the researchers.

Purchasing places of consumer goods in selected European countries 91
Oeconomia 15 (2) 2016
Table 3. The most frequently purchased goods and services in shopping centres – declarations of the questioned Belgians
Goods(N = 250) % Services
(N = 217) %
Clothes, shoes 78.0 Banking 60.4Cosmetics 42.4 Cosmetic 24.4Sports and recreational products 32.8 Gastronomy 24.4Groceries 28.0 Optics 12.4Housing equipment 20.8 Information technology 10.1
Source: Own research.
The Internet is the purchasing place gaining popularity year by year [Raport strate-giczny 2015]. According to declarations of the Belgian respondents, almost 3/4 of them declare online shopping. The Internet space should not be treated, however, as a ho-mogenous one. It is, however, the area of many commercial formats such as, e.g. online auctions, Internet shops, group shopping services or the producers’ websites [Sobczyk 2010]. That is why the respondents, declaring online shopping, were asked about the most frequent purchasing “places” of selected groups of products online – Table 4.
Table 4. The most frequent purchasing places of products online – declarations of the questioned Belgians
Specifi cation
Clothes and shoes(N = 171)
Household appliances and audio/
/video devices(N = 139)
Cleaning products(N = 42)
Food(N = 54)
Books and multimedia(N = 165)
Sports and tourism
(N = 125)
Computers and
software(N = 152)
Health and
beauty(N = 77)
%On Internet auctions 8.2 3.6 7.1 3.7 4.8 5.6 3.3 2.6
In Internet shops 62.0 48.9 45.2 63.0 60.0 36.0 49.3 48.1
I use price comparison engines that redi-rect me to the store
9.9 24.5 26.2 13.0 15.2 28.8 19.1 14.3
I use group purchase services
0.6 2.9 4.8 3.7 3.6 4.8 2.6 –
On the producer’s website
19.3 20.1 16.7 16.7 16.4 24.8 25.7 35.1
Source: Own research.Analysing data presented in Table 4, we may observe that the questioned Belgians do
shopping in online shops regardless of the kind of a purchased product. The respondents relatively frequently also use the price comparison websites transferring them to the most preferable purchasing places and the producers’ websites.

92 G. Maciejewski
Acta Sci. Pol.
France
The questioned French respondents look for a comfortable purchase in shops and hy-permarkets (respectively 32.1 and 30.1% of respondents) – Table 5. The diversity of the purchasing places is more visible in case of cleansing products. The questioned French respondents purchase them mainly in hypermarkets (36.9%), but also in convenience stores (21%) and discount stores (20%). On the other hand, the lowest diversity of the purchasing places occurs in case of radio and TV equipment. Almost 3/4 of the respond-ents declared shopping for such goods only in specialized stores. Specialized stores are also most frequently selected purchasing places of clothing and footwear (almost 70%) by the respondents Table 5.
Table 5. The most frequent purchasing places of products – declarations of the questioned French respondents (N = 204)
Specifi cationFood Cleaning
productsHousehold appliances
and audio/video devicesClothes
and shoes%
Discount store 19.9 20.0 – –Convenience store/Corner shop 32.1 21.0 1.0 –Specialist shop – 3.1 72.6 69.7Hypermarket 30.1 36.9 15.2 1.5Supermarket 14.3 16.9 1.0 1.0Local shop 2.6 0.5 – –Marketplace/Bazaar 1.0 0.5 0.5 4.5Internet – 1.0 9.6 23.4
Source: Own research.
Shopping centres are a very important commercial format for the respondents from France. Visiting such kind of retail trade entities was declared by almost 90% of the respondents. The French respondents visit shopping centres to purchase such goods as household equipment (80.8%), books (52%) and food products (42.9%). Hairstyling, banking and gastronomic services comprise the most frequently purchased services in shopping centres (respectively 38.1, 33.3 and 31.7% of the respondents) – Table 6.
Table 6. The most frequently purchased goods and services in shopping centres – declarations of the questioned French respondents
Goods(N = 177) % Services
(N = 126) %
Household appliances 80.8 Hairdressing 38.1Books 52.0 Banking 33.3Groceries 42.9 Gastronomy 31.7Household chemicals 37.3 Photographic 27.8Tools 33.3 Fitness 15.9
Source: Own research.
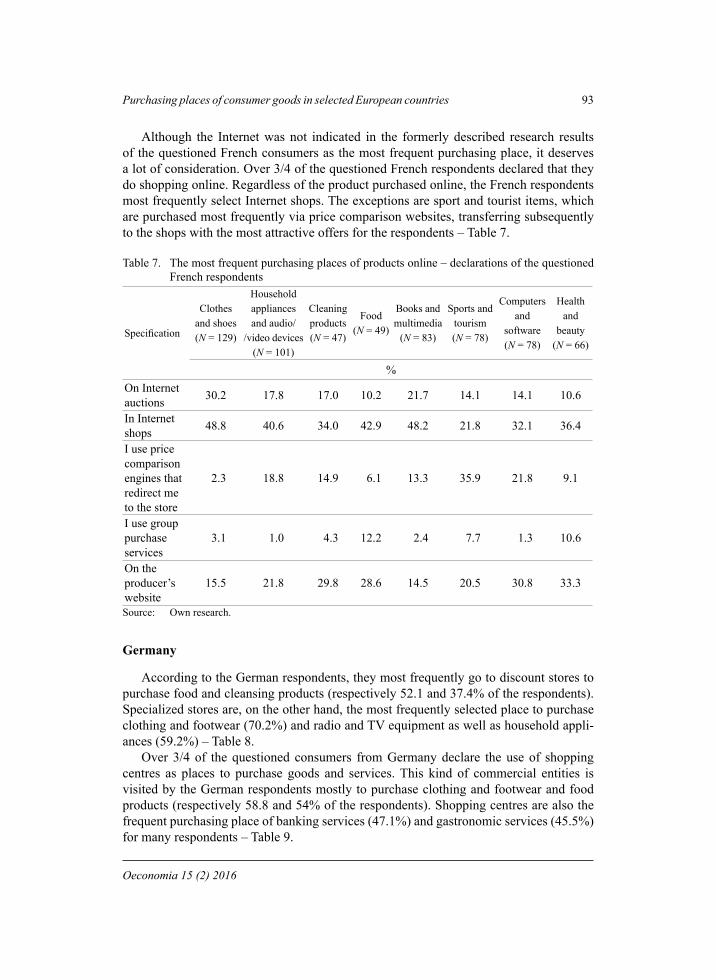
Purchasing places of consumer goods in selected European countries 93
Oeconomia 15 (2) 2016
Although the Internet was not indicated in the formerly described research results of the questioned French consumers as the most frequent purchasing place, it deserves a lot of consideration. Over 3/4 of the questioned French respondents declared that they do shopping online. Regardless of the product purchased online, the French respondents most frequently select Internet shops. The exceptions are sport and tourist items, which are purchased most frequently via price comparison websites, transferring subsequently to the shops with the most attractive offers for the respondents – Table 7.
Table 7. The most frequent purchasing places of products online – declarations of the questioned French respondents
Specifi cation
Clothesand shoes(N = 129)
Householdappliances and audio/
/video devices(N = 101)
Cleaning products(N = 47)
Food(N = 49)
Books and multimedia
(N = 83)
Sports and tourism(N = 78)
Computers and
software(N = 78)
Health and
beauty(N = 66)
%On Internet auctions 30.2 17.8 17.0 10.2 21.7 14.1 14.1 10.6
In Internet shops 48.8 40.6 34.0 42.9 48.2 21.8 32.1 36.4
I use price comparison engines that redirect me to the store
2.3 18.8 14.9 6.1 13.3 35.9 21.8 9.1
I use group purchase services
3.1 1.0 4.3 12.2 2.4 7.7 1.3 10.6
On the producer’s website
15.5 21.8 29.8 28.6 14.5 20.5 30.8 33.3
Source: Own research.
Germany
According to the German respondents, they most frequently go to discount stores to purchase food and cleansing products (respectively 52.1 and 37.4% of the respondents). Specialized stores are, on the other hand, the most frequently selected place to purchase clothing and footwear (70.2%) and radio and TV equipment as well as household appli-ances (59.2%) – Table 8.
Over 3/4 of the questioned consumers from Germany declare the use of shopping centres as places to purchase goods and services. This kind of commercial entities is visited by the German respondents mostly to purchase clothing and footwear and food products (respectively 58.8 and 54% of the respondents). Shopping centres are also the frequent purchasing place of banking services (47.1%) and gastronomic services (45.5%) for many respondents – Table 9.

94 G. Maciejewski
Acta Sci. Pol.
Table 8. The most frequent purchasing places of products – declarations of the questioned Ger-mans (N = 300)
Specifi cationFood Cleaning
products
Household appliances and audio/video
devices
Clothesand shoes
%Discount store 52.1 37.4 9.4 6.4Convenience store//Corner shop 4.2 7.3 2.9 5.7
Specialist shop 4.9 27.6 59.2 70.2Hypermarket 12.8 13.6 10.8 2.1Supermarket 16.7 12.2 1.4 0.7Local shop 5.2 1.4 – 1.1Marketplace/ /Bazaar 4.2 0.3 2.5 1.4
Internet – – 13.7 12.4Source: Own research.
Table 9. The most frequently purchased goods and services in shopping centres – declarations of the questioned Germans
Goods(N = 226) % Services
(N = 189) %
Clothes, shoes 58.8 Banking 47.1Groceries 54.0 Gastronomy 45.5Books 38.9 Cultural 21.7Cosmetics 34.5 Cosmetic 16.4Sports and recreational products 23.5 Fitness 16.4
Source: Own research.
According to the obtained declarations, slightly over 60% of the questioned Germans do online shopping. The respondents from Germany select most online auctions and price comparison websites most frequently when they want to purchase radio and TV equip-ment as well as household appliances. Price comparison websites are also most frequently selected during the purchase of such goods as books and multimedia, computer equip-ment, sport and tourist items and health and beauty products. On the other hand, online shops as purchasing places online are most frequently selected in case of purchasing clothing and footwear, food and cleansing products – Table 10.

Purchasing places of consumer goods in selected European countries 95
Oeconomia 15 (2) 2016
Table 10. The most frequent purchasing places online – declarations of the questioned Germans
Specifi cation
Clothesand shoes(N = 101)
Household appliances and audio/
/video devices(N = 96)
Cleaning products(N = 49)
Food(N = 44)
Books andmultimedia(N = 116)
Sports and tourism(N = 72)
Computers and
software(N = 86)
Health and
beauty(N = 67)
%On Internet auctions 28.7 29.2 18.4 15.9 17.2 13.9 17.4 10.4
In Internet shops 35.6 27.1 26.5 29.5 37.9 27.8 32.6 23.9
I use price comparison engines that redirect me to the store
11.9 29.2 20.4 25.0 39.7 31.9 33.7 26.9
I use group purchase services
3.0 4.2 16.3 18.2 2.6 11.1 2.4 23.9
On the producer’s website
20.8 10.4 18.4 11.4 2.6 15.3 14.0 14.9
Source: Own research.
Poland
Discount stores (59.1%) and hypermarkets (20.1%) are the most frequent purchasing place of food for the questioned Poles. Hypermarkets are also the most frequent purchas-ing place of cleansing products (42.1%). On the other hand, such goods as radio and TV equipment or clothing and footwear are most frequently purchased in specialized stores (respectively 65.8 and 57.2% of the respondents) – Table 11.
Table 11. The most frequent purchasing places of products – declarations of the questioned Poles (N = 300)
Specifi cation Food Cleaning products
Household appliances and audio/video devices
Clothesand shoes
%Discount store 59.1 27.0 1.0 0.4Convenience store//Corner shop 6.0 11.6 1.0 1.1
Specialist shop 1.7 10.2 65.4 57.2
Hypermarket 20.1 42.1 11.4 4.9
Supermarket 3.4 3.5 0.7 2.1
Local shop 8.1 4.2 1.4 2.8
Marketplace/Bazaar 1.3 0.7 2.1 13.8Internet 0.3 0.7 17.0 17.7
Source: Own research.

96 G. Maciejewski
Acta Sci. Pol.
Analysing the research results on the visiting of shopping centres by Poles, we may assume that it is done by 8 out of 10 questioned consumers from Poland. They go to shopping centres mostly to purchase clothes and shoes (68%), food products (64.8%) and cosmetics (49.6%). Shopping centres in Poland are a frequent purchasing place of such services as gastronomic ones, services related to culture and banking services (declara-tions respectively: 64.6, 35 and 28.3% of the respondents) – Table 12.
Table 12. The most frequently purchased goods and services in shopping centres – declarations of the questioned Poles
Goods(N = 250) % Services
(N = 226) %
Clothes, shoes 68.0 Gastronomy 64.6Groceries 64.8 Cultural 35.0Cosmetics 49.6 Banking 28.3Household chemicals 34.8 Hairdressing 16.8Housing equipment 33.2 Laundry 15.0
Source: Own research.
In Poland 7 out 10 citizens declare shopping online. Their purchasing behaviours are not too diversifi ed. If Poles decide to do some online shopping, they do it most frequently in online shops, regardless of the kind of a purchased product. Sport and tourist items are the exception. They are more frequently purchased on the websites of group shopping services – Table 13.
Table 13. The most frequent purchasing places online – declarations of the questioned Poles
Specifi cationClothes
and shoes(N = 161)
Household appliances and audio/
/video devices(N = 176)
Cleaning products(N = 94)
Food(N = 80)
Books and multimedia(N = 159)
Sports and tourism
(N = 138)
Computers and
software(N = 147)
Health and
beauty(N = 110)
On Internet auctions 39.1 21.6 12.8 8.8 26.4 21.7 20.4 16.4
In Internet shops 39.8 34.1 31.9 37.5 41.5 21.7 32.0 37.3
I use price comparison engines that redirect me to the store
8.1 32.9 22.3 25.0 18.9 21.0 23.8 17.3
I use group purchase services
3.1 2.3 14.9 12.5 4.4 22.5 2.7 14.5
On the producer’s website
9.9 9.1 18.1 16.3 8.8 13.0 21.1 14.5
Source: Own research.

Purchasing places of consumer goods in selected European countries 97
Oeconomia 15 (2) 2016
Romania
In accordance with the obtained research results, the Romanian consumers purchase food most frequently in discount stores (48.4%), they purchase cleansing products in convenience stores (34.1%), and radio and TV equipment as well as clothing and foot-wear are purchased by them in specialized stores (respectively 43.6 and 52.8% of the respondents) – Table 14.
Table 14. The most frequent purchasing places of products – declarations of the questioned Roma-nians (N = 280)
Specifi cationFood Cleaning
productsHousehold appliances
and audio/video devicesClothes
and shoes%
Discount store 48.4 15.5 1.9 1.1Convenience store//Corner shop 14.2 34.1 23.9 4.5
Specialist shop – 4.2 43.6 52.8Hypermarket 15.4 27.7 22.7 9.4Supermarket 20.1 10.6 1.1 3.4Local shop 0.8 4.9 0.8 7.9Marketplace/Bazaar 1.2 2.7 – 5.3Internet – 0.4 6.1 15.5
Source: Own research.
Shopping centres constitute a very important purchasing place of goods and services for the questioned consumers from Romania. According to the collected declarations, al-most all respondents (97.7%) were visiting shopping centres. The questioned Romanians were most frequently going to shopping centres to purchase food products (83.8%), fur-niture and fl at equipment (75.7%) and cosmetics (72.8%). As for the purchase of services, these were mostly gastronomic services (61.5%), cosmetic services (52%) and watch-maker services (30.2%) – Table 15.
Table 15. The most frequently purchased goods and services in shopping centres – declarations of the questioned Romanians
Goods (N = 272) % Services (N = 252) %Groceries 83.8 Gastronomy 61.5Housing equipment 75.7 Cosmetics 52.0Cosmetics 72.8 Watchmaker’s 30.2School supplies 59.6 Laundry 28.2Clothes, shoes 56.6 Banking 25.4
Source: Own research.
If we may say about the universality of the visiting of shopping centres by the re-spondents, however we may not say that about their online shopping. Online shopping was declared only by 43.7% of the respondents from Romania. Regardless of the kind

98 G. Maciejewski
Acta Sci. Pol.
of a purchased product online, the respondents pointed to the online shops as the most frequent purchasing place. Only in case of sport and tourist goods, price comparison web-sites are equally popular among the respondents – Table 16.
Table 16. The most frequent purchasing places of products online – declarations of the questioned Romanians
Specifi cation
Clothes&shoes(N = 97)
Household appliances and audio/
/video devices(N = 85)
Cleaning products(N = 44)
Food(N =4 6)
Books and multimedia
(N = 92)
Sports and tourism(N = 60)
Computers and software
(N = 83)
Health and
beauty(N = 49)
%On Internet auctions 10.3 16.5 9.1 6.5 25.0 18.3 22.9 4.1
In Internet shops 49.5 37.6 34.1 30.4 31.5 25.0 30.3 36.7
I use price comparison engines that redirect me to the store
7.2 17.6 20.5 23.9 10.9 25.0 21.7 12.2
I use group purchase services
8.2 9.4 18.2 9.9 18.5 16.7 8.4 16.3
On the producer’s website
24.7 18.8 18.2 28.3 14.1 15.0 16.9 30.6
Source: Own research.
Slovakia
Discount stores (33.7%) and hypermarkets (32.2%) are regarded as the most frequent purchasing places of food in Slovakia, according to the questioned consumers from this country. Hypermarkets are also the most frequent purchasing place of cleansing products (41.5%). However, such groups of goods as radio and TV equipment as well as household appliances, clothing and footwear, according to the respondents’ declarations, are most frequently purchased in specialized stores – Table 17.
Shopping centres are visited by nearly 9 out of 10 questioned Slovaks (88.2%). It is an important purchasing place for the respondents. While going to shopping centres, the questioned Slovaks were purchasing mostly clothing and footwear (81.9%) and food products (72.1%), they also used gastronomic services (67.5%) and banking services (63.5%) – Table 18.
Exactly 78% of the questioned Slovaks do online shopping. Regardless of the kind of product, online shops are the most frequent purchasing place. Home and computer equip-ment are the exception, which is most frequently purchase thanks to price comparison websites, transferring to the most convenient offer for the purchaser – Table 19.

Purchasing places of consumer goods in selected European countries 99
Oeconomia 15 (2) 2016
Table 17. The most frequent purchasing places of products – declarations of the questioned Slovaks (N = 321)
Specifi cationFood Cleaning
productsHousehold appliances
and audio/video devicesClothes
and shoes%
Discount store 33.7 12.7 1.4 2.2Convenience store//Corner shop 5.2 10.3 2.5 2.9
Specialist shop 1.1 17.6 67.0 64.6Hypermarket 32.2 41.5 5.7 4.4Supermarket 21.3 11.6 2.5 2.6Local shop 6.4 5.3 0.7 1.8Marketplace/Bazaar – 0.4 1.1 4.4Internet – 0.7 19.1 17.2
Source: Own research.
Table 18. The most frequently purchased goods and services in shopping centres – declarations of the questioned Slovaks
Goods(N = 287) % Services
(N = 277) %
Clothes, shoes 81.9 Gastronomy 67.5Groceries 72.1 Banking 63.5Cosmetics 55.4 Cultural 42.6Household chemicals 53.7 Cosmetics 22.4Books 46.0 Fitness 22.4
Source: Own research.
Table 19. The most frequently purchased products online – declarations of the questioned Slovaks
Specifi cation
Clothesand shoes(N = 192)
Household appliances and audio/
video devices(N = 211)
Cleaning products(N = 140)
Food(N = 139)
Books and multimedia(N = 199)
Sports and tourism
(N = 160)
Computers and
software(N = 171)
Health and
beauty(N = 163)
%On Internet auctions 17.7 7.6 9.3 7.2 9.5 5.6 7.0 6.1
In Internet shops 44.8 34.6 36.4 32.4 44.7 42.5 29.8 35.0
I use price comparison engines that redirect me to the store
12.5 41.3 25.7 18.7 21.6 23.1 37.4 17.2
I use group purchase services
5.2 2.4 6.4 21.6 6.5 10.0 2.4 19.6
On the producer’s website
19.8 14.2 22.1 20.1 17.6 18.7 23.4 22.1
Source: Own research.

100 G. Maciejewski
Acta Sci. Pol.
CONCLUSIONS
The demonstrated research results, although they are not representative, may consti-tute an assumption to discuss the similarities and differences in purchasing behaviours of the consumers from different European countries.
The obtained research results indicate the imitation of the purchasing behaviours of the consumers from the analysed countries. The purchases of clothing and food are done in specialized stores, radio and TV equipment as well as household appliances are pur-chased in specialized stores as well (except for France), food is purchased in food dis-counts (except for France), and cleansing products in hypermarkets (except for Belgium, Germany and Romania). Shopping centres are an important purchasing place of goods and services. Doing shopping in these commercial formats was declared by 3/4 of the respondents in each of the analysed countries. More and more consumers transfer their shopping to the Internet. Except for the respondents from Romania, online shopping was declared by at least 2/3 of the respondents.
REFERENCES
Borusiak, B. (2008). Modele wzrostu przedsiębiorstw handlu detalicznego [Growth models of reta-il trade companies]. Wydawnictwo AE w Poznaniu, Poznań.
Czubała, A. (2001). Dystrybucja produktów [Product distribution]. PWE, Warszawa.Jaciow, M., Kolny, B., Maciejewski, G., Mikołajczyk, B., Wolny, R. (2015). Services in Europe
– Diagnosis and development perspectives. Wydawnictwo Uniwersytetu Ekonomicznego w Katowicach, Katowice.
Kędzior, Z. (Ed.), (2005). Badania rynku – metody, zastosowania [Market research – methods, applications]. PWE, Warszawa.
Kucharska, B., Kucia, M., Maciejewski, G., Malinowska, M., Stolecka-Makowska, A. (2015). The retail trade in Europe – Diagnosis and futureperspectives. Wydawnictwo Uniwersytetu Ekonomicznego w Katowicach, Katowice.
Raport strategiczny: Internet 2014 [Strategic report: Internet 2014], (2015). IAB Polska, Warszawa.Sławińska, M. (Ed), (2008). Kompendium wiedzy o handlu [Compendium of commercial knowl-
edge]. WN PWN, Warszawa.Sobczyk, G. (Ed.), (2010). Zarządzanie sprzedażą w przedsiębiorstwie handlowym i usługowym
[Sale management in commercial and service company]. PWE, Warszawa.Zakrzewski, Z. (1977). Rola i funkcje handlu wewnętrznego [Role and function of domestic trade].
PWE, Warszawa.
MIEJSCA ZAKUPU DÓBR KONSUMPCYJNYCH W WYBRANYCH KRAJACH EUROPY
Streszczenie. Artykuł zwraca uwagę na wybory miejsc zakupu głównych grup dóbr i usług konsumpcyjnych przez konsumentów z wybranych krajów Europy (Belgii, Francji, Niemiec, Polski, Rumunii i Słowacji). Podstawy źródłowe opracowania stanowi literatura przedmiotu oraz wyniki badań bezpośrednich przeprowadzonych w ramach projektu ba-dawczego pt. Handel i usługi w Europie – diagnoza i perspektywy rozwoju zrealizowanego w latach 2013–2015. Przedstawione wyniki badań wskazują na upodabnianie się zacho-wań konsumentów z badanych krajów Europy odnośnie wyboru centrów handlowych jako miejsca dokonywanych zakupów. W każdym z badanych krajów, konsumenci deklarujący

Purchasing places of consumer goods in selected European countries 101
Oeconomia 15 (2) 2016
dokonywanie zakupów w centrach handlowych stanowili ponad 3/4 ogółu respondentów. Wyniki badań wskazują także na upodobnianie się e-zachowań nabywczych. Z wyjątkiem Rumunii, dokonywanie zakupów przez Internet deklarowało minimum 2/3 badanych kon-sumentów. Różnice między konsumentami z poszczególnych krajów widoczne są nato-miast w wyborach miejsca zakupu żywności, środków czystości, sprzętu RTV i AGD oraz odzieży i obuwia.
Słowa kluczowe: konsument, handel detaliczny, miejsca zakupu dóbr i usług, badania ilo-ściowe, Europa
Accepted for print: 21.04.2016
For citation: Maciejewski G. (2016). Purchasing places of consumer goods in selected European countries. Acta Sci. Pol., Oeconomia, 15 (2), 87–101.


Oeconomia 15 (2) 2016, 103–112
INFORMAL CHANNELS OF COMMUNICATION USED BY ENTERPISES
Grzegorz Mazurek, Jolanta TkaczykKozminski University
Abstract. To date, extant literature on the subject of word of mouth (WOM) has largely been devoted to the process of WOM communication from the consumer’s point of view. However, since companies are able to stimulate as well as employ WOM as one of market-ing communication’s instruments, they may be perceived as both senders and receivers in this process. Therefore, the question is this: Can companies manage the process of word-of-mouth communication within the framework of their structures, and if so, how? This article’s aim is to identify various methods companies can use to exploit WOM on the basis of source literature and our own studies, as well as to discuss opportunities and risks related to the process of management of WOM communication.
Key words: word of mouth, management, marketing communication
INTRODUCTION
Word of mouth (WOM), understood as communication between a non-commercial communicator and a receiver concerning a brand, a product or a service [Anderson 1998], is perceived in today’s world of virtualized market processes as an essential element that can shape consumer decisions [Chu and Kim 2011, Strutton et al. 2011]. The fundamen-tal value of WOM is objectivism and credibility of the conveyed message [Lesáková 2013, Tkaczyk and Awdziej 2013]. Literature on the subject offers evidence that WOM is a paramount infl uencer of consumer decision making, as it enables consumers to share their own experiences, obtain information about others’ experiences, and disseminate this information to others [Lang and Hyde 2013]. The essence of WOM and its signifi cance for organizational management were discovered before the appearance of the phenom-enon of Web 2.0 [Mazurek 2009], and WOM-related studies have been conducted for
Corresponding author: Grzegorz Mazurek, Jolanta Tkaczyk, Kozminski University, Department of Marketing, Jagiellońska 59, 03-301 Warszawa, Poland, e-mail: [email protected]; [email protected]© Copyright by Warsaw University of Life Sciences Press, Warsaw 2016
ISSN 1644-0757eISSN 2450-4602
http://acta_oeconomia.sggw.pl
104 G. Mazurek, J. Tkaczyk
Acta Sci. Pol.
well over 50 years now [Arndt 1967]. It has been documented that WOM is one of the main infl uencers of consumers’ buying decisions [Silvermann 2001, Ertmanska 2015]. The issue seems to be all the more important, because studies show that people are more infl uenced by negative rather than positive word of mouth [Lang 2011].
Although WOM appears to be an activity that occurs independent of a given compa-ny’s actions and is centred on users – clients – exclusively, organisations tend to become involved in the process, taking on the role of one of the many users or actively infl uencing the dynamics of the development of WOM. As Williams and Buttle [2011] argue, WOM can be characterised by valence, focus, timing, solicitation, and the degree of manage-ment intervention. Reference books even mention the process of WOM management, with, for instance, Pruden and Vavra [2004] referring to engineered word of mouth, em-phasising the infl uence of companies on processes which appear to at fi rst glance to be beyond even their control. Another documented issue is the limited possibility of organi-sations to affect WOM, whose main – and fundamental – quality is its voluntary nature [Chew and Wirtz 2001]. Therefore, it is necessary to ask the following question: Can WOM be treated as an immanent component of the marketing mix, and in particular, can it serve as an element of marketing communication that can be managed, measured, and consequently assigned to objectives it should aim to achieve? Put another way, can WOM be treated as an essential element of building customer satisfaction? Opinions in the extant literature can be found on this subject, stressing that the managerial aspect of WOM is not fully understood. This stems primarily from the lack of a coherent strategy, as WOM is often incidentally managed at multiple points in an organisation [Williams and Buttle 2011].
MANAGEMENT ISSUES
The view of word of mouth (WOM) as a promotional instrument has been magnifi ed by the use of contemporary Internet platforms and devices: mobile, social media, and Web 2.0 [Magnini 2011, Mazurek 2012]. Most importantly, the identifi cation of infl uenc-ers across social media has become tremendously important not only in creating WOM but also in attempting to manage this phenomenon. Application of tools from the area of affi liate marketing [Kucia and Mazurek 2011] makes it possible to reward – in a simpli-fi ed, automated way – those clients who make certain products, materials, etc., popular among a given target group. Another interesting phenomenon is the use of mechanisms to promote particular content based on a model where such content is published only after the person interested in gaining access to certain resources (e.g. a report) agrees to have information about their access to such resources published through their social media account. In practice, the mechanism works in the following way: a reader gains access to some resources; in exchange, a notifi cation is posted through social media – their Fa-cebook account, Twitter, etc. – informing readers that the person has just used a certain product [Schmitt et al. 2011]. The above-mentioned examples of using contemporary Internet media demonstrate how it is possible to increase the likelihood of the spread of

Informal channels of communication used by enterprises 105
Oeconomia 15 (2) 2016
information and the generation of recommendations and serve as evidence supporting the thesis regarding attempts to manage the phenomenon in question.
Managers tend to look at WOM in various ways. Quite often, paradoxically, the sig-nifi cant role ascribed to this phenomenon does not necessarily translate into real actions aimed to incorporate it into the management process, which might take on the following forms:
passive approach – when an organisation monitors the content exchanged between users and treats it as an important source of information about its products and services;active approach – when an organisation learns of discussions about its brand and becomes actively involved in such discussions, striving to create signifi cant value for both parties to the dialogue or for the whole community that is debating topics of importance to the company. Both of these approaches require organisations to follow a fl exible organisational
structure and to delegate tasks to low-ranking employees, which stems from the neces-sity of taking prompt quick action in response to signals emanating from the surround-ing environment, especially from social media, where reaction time is of the essence [Mącik et al. 2012]. This last aspect seems to have a real impact on changes that occur in the sphere of organisational marketing activities subject to virtualisation. For example, so-called real-time marketing exemplifi es not only an active approach to the content cre-ated in a virtual environment but also an organisations’ assumption of a managerial per-spective towards WOM, in which organisations use the content created by clients or users to “spark” new discussions and suggest new topics and threads initiated or co-created by companies.
It is also important to underscore the commercial signifi cance of WOM, which may be defi ned by means of the application of commercially incentivized WOM, based on the idea that the origin of the messages is a commercial entry where selected consumers may receive an incentive for promoting a message [De Bruyn and Liline 2008, Brown et al. 2010]. Table 1 describes different views on WOM management.
Despite the large and still growing signifi cance of WOM, many companies – espe-cially small and midsize businesses – do not appreciate its role in shaping the competi-tive position of an organisation and, as a result, are not involved in attempts to manage WOM or the processes that control it [Buttle and Williams 2011]. This does not refer to the use of complex and sophisticated methods of infl uencing the environment, but, rather, focuses on the basics of creating WOM by aiming at a high level of customer satisfaction, customer involvement and – eventually – customer trust [Lang and Hyde 2013]. Directly infl uencing WOM, which is defi ned in this article as active WOM or commercial WOM, involves considerable expenditures to enhance cooperation with key infl uencers and reward clients for communicative support of an organisation. Tak-ing advantage of such tactics may seem attractive, but it entails certain risks, such as, for example, instances when infl uencers reveal the commercial nature of cooperation [Kozinets 2010], which not only casts a negative light on the image of the affected brand but is also unethical.
•
•

106 G. Mazurek, J. Tkaczyk
Acta Sci. Pol.
Table 1. Managerial perspectives of word-of-mouth activitiesManagement Execution Exemplifi cationSeparated WOM communication of WOM-type is auto-
nomic, occurring without the knowl-edge and control of the organisation
no activities
Passive WOM WOM-type communication is auto-nomic, occurring outside the control of a given organisation, which, however, monitors client activities and is aware of the content exchanged among them
implementation of various social media monitoring tools like Ra-dian6, Brand24, Sotrender, etc.
Responsive WOM
WOM-type communication is auto-nomic, takes place outside the control of a given organisation, which moni-tors the web environment in search of discussions/content concerning that organisation and makes attempts to get involved and take the fl oor
implementation of real-time mar-keting concepts based on rapid responsiveness from the organi-sation and on signals initiated by users on social media platforms
Active (commercial) WOM
WOM-type communication may occur after initiation of some content and an attempt to disseminate it according to a pre-designed concept – in exchange for providing users with certain mate-rial benefi ts
advertising and product place-ment campaigns in which key in-fl uencers and new media endors-ers are used to promote specifi c product
Source: Own research.
The process of stimulating WOM, which means managing this activity, may also oc-cur when clients’ knowledge about products is expanded, which in turn strengthens the relationship between an organisation and its customers. Moreover, studies have proven that other elements of the marketing mix, such as clever product distribution or design, as well as product innovation and originality (uniqueness), have a positive impact on further increasing the signifi cance of WOM communication [Lang and Hyde 2013].
SOURCE MATERIAL AND RESEARCH METHODS
We conducted a research study using the computer-assisted web interview (CAWI) method to investigate the forms and types of engagement by companies in word of mouth (WOM) communication, as well as various forms of word of mouth (WOM) utilisation. The project was funded by the National Science Centre on the basis of the decision DEC--2012/07/D/HS4/01761. Data collection took place from November 2–31, 2015. Addi-tionally, 250 requests to fi ll out questionnaires were disseminated to the previously drawn representatives of businesses. We collected 186 responses, of which 89 were enrolled for further analysis. Among the respondents, 48% were female and 52% were male. The average age of the respondents was 35. Some 42% occupied managerial positions in the analysed companies, 8% were owners, and 45% were employees.

Informal channels of communication used by enterprises 107
Oeconomia 15 (2) 2016
The survey was multi-topical, and one of the topics concerned the original scale, which measures the management approach to WOM. The scale includes 13 items (state-ments are measured using a seven-dimensional Likert scale). We calculated Cronbach’s alpha ratio (0.698) to assess the accuracy of the scale, which allowed us to adopt our measurement scale as reliable.
For the classifi cation of enterprises based upon their activities related to WOM man-agement, we used k-means cluster analysis (quick cluster), assuming four clusters.
In addition, we established the following hypotheses:H1: The longer a company operates in a market, the more likely it is willing to ac-tively manage WOM.H2: The greater the size of the company, the more likely it is willing to actively man-age WOM.H3: Companies that are operating in commercial and service industries are willing to actively manage WOM.
RESULTS AND DISCUSSION
After a quick cluster analysis, we obtained a distribution of four types of companies attributable to the approach to WOM management among the surveyed units (Fig. 1).By far the largest analysed group (35% of respondents) was classifi ed as a passive WOM management group. Another group (27% of respondents) was classifi ed as a responsive WOM management group. Some 20% of the analysed companies had not conducted any WOM activity, while 17% of enterprises were very active in this fi eld (active WOM Management). Table 2 presents the characteristics of the different groups of companies.
Fig 1. Distribution of types of companies attributable to their approach to WOM managementSource: Own research.
•
•
•
ResponsiveWOM: 27%
PassiveWOM: 35%
SeparatedWOM: 20%
ActiveWOM: 17%
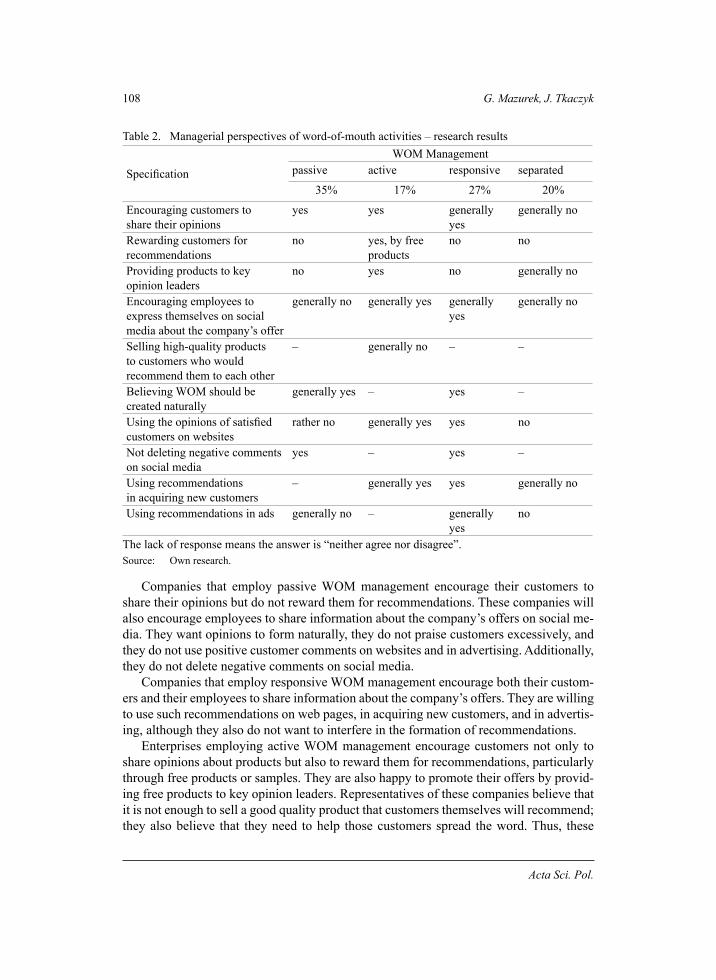
108 G. Mazurek, J. Tkaczyk
Acta Sci. Pol.
Table 2. Managerial perspectives of word-of-mouth activities – research results
Specifi cation
WOM Managementpassive active responsive separated
35% 17% 27% 20%
Encouraging customers to share their opinions
yes yes generally yes
generally no
Rewarding customers for recommendations
no yes, by free products
no no
Providing products to key opinion leaders
no yes no generally no
Encouraging employees to express themselves on social media about the company’s offer
generally no generally yes generally yes
generally no
Selling high-quality products to customers who would recommend them to each other
– generally no – –
Believing WOM should be created naturally
generally yes – yes –
Using the opinions of satisfi ed customers on websites
rather no generally yes yes no
Not deleting negative comments on social media
yes – yes –
Using recommendations in acquiring new customers
– generally yes yes generally no
Using recommendations in ads generally no – generally yes
no
The lack of response means the answer is “neither agree nor disagree”.Source: Own research.
Companies that employ passive WOM management encourage their customers to share their opinions but do not reward them for recommendations. These companies will also encourage employees to share information about the company’s offers on social me-dia. They want opinions to form naturally, they do not praise customers excessively, and they do not use positive customer comments on websites and in advertising. Additionally, they do not delete negative comments on social media.
Companies that employ responsive WOM management encourage both their custom-ers and their employees to share information about the company’s offers. They are willing to use such recommendations on web pages, in acquiring new customers, and in advertis-ing, although they also do not want to interfere in the formation of recommendations.
Enterprises employing active WOM management encourage customers not only to share opinions about products but also to reward them for recommendations, particularly through free products or samples. They are also happy to promote their offers by provid-ing free products to key opinion leaders. Representatives of these companies believe that it is not enough to sell a good quality product that customers themselves will recommend; they also believe that they need to help those customers spread the word. Thus, these

Informal channels of communication used by enterprises 109
Oeconomia 15 (2) 2016
companies are happy to use customer recommendations, particularly on websites, to ac-quire new customers.
We calculated a correlation coeffi cient between its age and a company’s tendency to encourage customers to share their opinions about products (seven-item scale) to verify hypothesis H1; that is, the longer a company operates in a market, the more likely it is willing to actively manage WOM. There were no grounds to accept the hypothesis.
We calculated Spearman’s rho correlation coeffi cient between the variables of com-pany size (micro, small, medium, large) and the tendency of a company to encourage customers to share their opinions about products (seven-item scale) to verify hypothesis H2; that is, the greater the size of the company, the more likely it is willing to actively manage WOM. We obtained the following result: The correlation coeffi cient rho = 0.213 (p = 0.046), which allowed for a positive verifi cation of the hypothesis, indicated a weak positive relationship, although statistically signifi cant, between a company’s size and the tendency to encourage customers to share their opinions about its products.
We calculated the distribution of the tendency to encourage customers to make recom-mendations based on the analysed companies’ industry to verify hypothesis H3; that is, companies that are operating in commercial and service industries are willing to actively manage WOM. Unfortunately, there were no grounds to accept the hypothesis, due to the fact that the sample primarily included companies from the commercial and service sec-tors (over 50%).
Furthermore, we checked for the forms of companies’ WOM management. Eighty per cent of enterprises collect information from satisfi ed customers, and 78% collect infor-mation from dissatisfi ed customers, but recommendations are actively used by only 35% of the analysed companies. Seventy-nine percent companies have a social media pro-fi le, including Facebook (95% of indications), YouTube (35% of indications) LinkedIn (34% of indications), Twitter (31% of indications) and Instagram (19% of indications). Companies operating in the fi eld of B2C are more inclined to use YouTube, Twitter and Instagram, while companies operating in the B2B area more likely rely on LinkedIn. Eighty-two percent of companies employ a dedicated person to manage social media content, while 30% of surveyed enterprises work with bloggers. Forty-eight percent of companies independently monitor the Internet, while 39% monitor traditional media and 20% hire a specialist for this purpose.
CONCLUSIONS
We regard this as a pilot study because of the sample size and because distribution of companies in the sample does not guarantee its representativeness.
We managed to verify an original scale to measure the activities of enterprises in the WOM management arena, and we documented initial company characteristics based upon these activities. As expected, the smallest number of enterprises in the surveyed sample were classifi ed as the active WOM management group. The active WOM man-agement group is found, fi rst of all, in the case of large companies. These companies are more aware of the power of WOM and can not only seize spontaneous opinions but can also, above all, have the means to stimulate positive WOM in the form of free products,

110 G. Mazurek, J. Tkaczyk
Acta Sci. Pol.
product placement, and cooperation with bloggers and key opinion leaders. Active stimu-lation and exploitation of WOM provide companies many opportunities, such as omitting advertising clusters, establishing reliable communication, expanding a company’s target group, and initiating a loyal customer base.
Successful WOM management can yield tangible benefi ts for a company, but only if it is part of the company’s integrated marketing communication strategy. This process requires well-qualifi ed people to support it. WOM should also be a constant rather than an incidental afterthought. The main risk for companies that incorporate WOM manage-ment is the risk associated with ethical issues. It is quite easy to hire “fi ctitious con-sumers” who, for a small fee, speak ably and positively about a brand or create a false complaint about a competitor’s product. However, such activities are sometimes illegal and are defi nitely unethical. It is also easy to build a referral program and pay custom-ers for recommendations, focusing primarily on the acquisition of new customers while neglecting critically needed support for existing ones. Paying for recommendations is not a good idea if the company wants to build a credible message and a positive image in the long run. Remuneration, which is accepted both by businesses and consumers, allows for a product to be made available free of charge.
As we have shown in our study, social media offer the opportunity for small and mid-size businesses to successfully employ WOM. Facebook is now the primary medium for companies, regardless of size or type of activity. It is almost as popular as a company’s own website and, in the case of small businesses, Facebook sometimes successfully re-places the original company website. The prevalence of software, including free monitor-ing of Internet content, enables companies to respond to customer feedback in real time and to involve them in the company’s business. Therefore, it is not worth considering whether WOM management makes sense but, rather, how companies can successfully integrate WOM into the marketing communication process in their enterprise.
ACKNOWLEDGEMENT
The research is a part of the project was funded by the National Science Centre on the basis of the decision DEC-2012/07/D/HS4/01761.
REFERENCES
Anderson, E.W. (1998). Customer Satisfaction and Word of Mouth. Journal of Service Research, 1 (1), 5–17.
Arndt, J.A. (1967). Word of Mouth Advertising. Foundation, New York.Brown, M.R., Bhadury R.K., Pope, N.K.Ll. 2010. The Impact of Comedie Violence on Viral Adver-
tising Effectiveness. Journal of Advertising, 39 (1), 49–65.Buttle, F.A. (1998). Word of Mouth: Understanding and Managing Referral Marketing, Journal of
Strategic Marketing, 6 (3), 241–254.Chew, P., Wirtz, J. (2001). The effects of incentives, satisfaction, tie strength, and deal pronevess on
word-of-mouth behaviour. Asia pacifi c Advences in Consumer Researth 4. Association for Consumer, Duluth MN.

Informal channels of communication used by enterprises 111
Oeconomia 15 (2) 2016
Chu, S.C., Kim, Y. (2011). Determinants of consumer engagement in electronic word-of-mouth (eWOM) in social networking sites. International Journal of Advertising, 30 (1), 47–75.
De Bruyn, A., Lilien, G.L. (2008). A Multi-Stage Model of Word-of-Mouth Infl uence through Viral Marketing, International Journal of Research in Marketing, 25 (3), 151–163.
Ertmanska, K. (2015). Community supported agriculture (CSA) as a form of sustainable consumption. Acta Scientiarum Polonorum, Oeconomia, 14 (2), 51–59.
Kozinets, R.V., de Valck, K., Wojnicki, A.C. Wilner, S.J.S. (2010). Networked Narratives: Under-standing Word-of-Mouth Marketing in Online Communities, Journal of Marketing, 74 (2), 71–89.
Kucia, M., Mazurek, G. (2011). Affi liate marketing and its potential – empirical studies in: Man-agement of Technological Changes. Proceedings of the VII International Conference, Rusu C., Democritus University of Thrace, Aleksandroupolis, 165–169.
Lang, B. (2011). How Word of Mouth Communication Varies across Service Encounters. Managing Service Quality, 21 (6), 583–598.
Lang, B., Hyde, K. (2013). Word of mouth: What we know and what we have yet to learn. Journal of Consumer Satisfaction, Dissatisfaction & Complaining Behavior, 26, 3–18.
Lesáková, D. (2013). Grocery products in senior’s shopping behaviour. Acta Scientiarum Polono-rum, Oeconomia, 12 (2), 55–63.
Magnini, V.P. (2011). The Implications of Company-Sponsored Messages Disguised as Word-of--Mouth. Journal of Services Marketing, 25 (4), 243–251.
Mazurek, G. (2009). Web 2.0 implications on marketing. Management of organisations: Systematic Research, 51, 69–81.
Mazurek, G. (2012). Virtualization of marketing. Contemporary Management Research, 8, 3, 195–204.
Mącik, R., Mazurek, G., Mącik, D. (2012). Channel characteristics’ infl uence on physical vs. virtual channel choice for information search and purchase – the case of Polish young customers. International Journal of Cyber Society and Education, 5, 1, 35–54.
Rosen, E. (2000). Academy of Buzz. New York, Doubleday.Schmitt, Ph., Skiera, B., Van den Bulte, Ch. (2011). Referral Programs and Customer Value. Journal
of Marketing, 75 (1), 46–59.Silverman, G. (2001). The Secrets of Word-of-Mouth Marketing: How to Trigger Exponential Sales
through Runaway Word of Mouth. American Management Association, New York.Strutton, D., Taylor, D.G., Thompson, K. (2011). Investigating Generational Differences in
E-WOM Behaviours. International Journal of Advertising, 30 (4), 559–586.Tkaczyk, J., Awdziej, M. (2013). E-WOM – Findings from the Creative Industries in Poland. Studia
Ekonomiczne, 149, 200–211.Williams, M.F., Buttle, F.A. (2011). The Eight Pillars of WOM Management: Lessons From a Mul-
tiple Case Study. Australasian Marketing Journal, 19 (2), 85–92.Wirtz, J., Chew, P. (2002). The effects of incentives, deal proneness, satisfaction and tie strength
on word-of-mouth behaviour. International Journal of Service Industry Management, 13 (2), 141–162.
WYKORZYSTANIE KOMUNIKACJI NIEFORMALNEJ PRZEZ PRZEDSIĘBIORSTWA
Streszczenie. W literaturze przedmiotu skupiano się do tej pory na procesie komunika-cji nieformalnej z punktu widzenia głównie konsumenta. Skoro przedsiębiorstwo może stymulować, a także wykorzystywać komunikację nieformalną jako jeden z instrumentów komunikacji marketingowej, może być zatem również postrzegane jako nadawca i odbior-ca w tym procesie. Powstaje zatem pytanie, czy i w jaki sposób przedsiębiorstwa mogą zarządzać procesem komunikacji nieformalnej w ramach swoich struktur? Celem artykułu

112 G. Mazurek, J. Tkaczyk
Acta Sci. Pol.
jest zidentyfi kowanie różnych sposobów wykorzystania komunikacji nieformalnej przez przedsiębiorstwa na podstawie literatury oraz badań własnych, jak również przedstawienie szans i zagrożeń związanych z zarządzaniem procesem komunikacji nieformalnej.
Słowa kluczowe: komunikacja nieformalna, zarządzanie, komunikacja marketingowa
Accepted for print: 28.04.2016
For citation: Mazurek G., Tkaczyk J. (2016). Informal channels of communication used by enter-prises. Acta Sci. Pol., Oeconomia, 15 (2), 103–112.

Oeconomia 15 (2) 2016, 113–125
THE COMPETITIVENESS OF AGRICULTUREOF EU MEMBER COUNTRIES OF CENTRAL AND EASTERN EUROPE
Anna NowakUniversity of Life Sciences in Lublin
Abstract. The aim of the study is to assess the competitiveness of agriculture in the coun-tries of Central and Eastern Europe which are members of the European Union in relation to the agriculture of the so-called old EU countries. The partial indicators of productiv-ity of production factors (land, labour, capital) for the years 2007–2014 were adopted as a measure of competitiveness. The research shows that the productivity of land and labour in the group of 11 countries in Central and Eastern Europe is much lower than the average for the 15 countries from the so-called old EU. The lowest competitive position of agricul-ture in terms of labour productivity occurs in countries with low levels of development, measured by GDP per capita (Bulgaria, Romania, Poland). Capital productivity differen-tiated the countries in the group to a lesser degree, as well as in a relation to the average results in the EU-15.
Key words: competitiveness, productivity, agriculture, European Union, countries of Central and Eastern Europe
INTRODUCTION
Competitiveness is considered to be a natural economic phenomenon and the main source of wealth creation. It is a quality that can be attributed to entities/beings of almost all the levels of analysis in the economics [Rosłanowska-Plichcińska and Jarosiński 1996]. Competitiveness also applies to the agriculture, where winning the competitive rivalry is – as in the whole economy – a prerequisite to achieving better op-portunities for the development in the conditions of competition with other participants in the market process.
ISSN 1644-0757eISSN 2450-4602
http://acta_oeconomia.sggw.pl
Corresponding author: Anna Nowak, University of Life Sciences in Lublin, Faculty of Agrobioen-gineering, Department of Economics and Management, Akademicka 13, 20-950 Lublin, Poland, e-mail: [email protected]© Copyright by Warsaw University of Life Sciences Press, Warsaw 2016

114 A. Nowak
Acta Sci. Pol.
Sector-level competitiveness refers to “the performance of a given industry in a given country or region in relation to the same industry in other countries or regions. A sector could be characterized as competitive on the basis of its capacity to grow, to innovate and to produce more and higher-quality goods and services, and to keep or gain market shares in international and domestic markets” [EU Commission 2009]. Kulawik [2012] in turn defi nes competitiveness as the ability of any economic system to function effectively (to endure) and develop under existing competition.
Competitiveness is a relative and gradated category, but it is also a condition that is shaped by many factors. In the short term competitiveness is determined by such factors as sectoral specialization, quality and density of infrastructure and other factors affect-ing the effi ciency of the country/region. In the long term its level depends on the ability to sustain changes of the factors generating an increase in productivity, i.e. technology, human resources, spending on research and the structure of the economy [Huggins and Izushi 2008]. In such context, competitiveness is increasingly conditioned by the level of creativity and creation, circulation and absorption of knowledge [Golejewska and Gajda 2012]. In this context investment in learning and knowledge development play special role. Technologies, also known as innovation, are factor in the creation and introduction of new production techniques, management, and new modern principles of production organization [Jagiełło 2011]. With regard to the agriculture, a particular determinant of competitiveness is the geographical location, natural resources and their quality, the de-gree of market openness, the quality of human capital, institutions, both formal and infor-mal, and innovation. Cebulak et al. [2008] are of the opinion that the competitive ability of agriculture and its individual entities are shaped more by internal resources (e.g. the production technologies, resources, factors of production) rather than by the market. In turn, the basic condition specifi c of studies into the competitiveness of agriculture and its entities is the limited mobility of production factors involved in agriculture [Nosecka et al. 2011], and in particular land, family labour resources but also, to a considerable extent, the capital adapted to the needs of agricultural activity [Nosecka 2014]. The growing im-portance of competitiveness stems from the intensifi cation of globalization processes and liberalization of international trade [Komorowska 2014, Carraresi and Banterle 2015].
Due to the broad meaning of competitiveness and the diversity of factors infl uencing it, there is no uniform measure for its evaluation [Korom and Sági 2005]. Productivity is considered the most reliable indicator of competitiveness in the long term [European Bureau and Butault 1992, Commission 2009]. Trade theory suggests that the competitive-ness of a nation is based on the concept of comparative advantages. Among the factors infl uencing country’s position in the international food trade are mentioned, among oth-ers, costs of production, productivity of labour in agriculture [Nowak 2012] or the use of innovative technologies. Staszczak [2011] emphasizes that the EU supports its own agriculture by protecting it from external competition, but must gradually liberalize trade in food as a result of negotiations within the World Trade Organisation (WTO), which leads to an increase of trade in foreign food. In international comparisons, the competi-tiveness of agriculture is also assessed in terms of costs. According to Latruffe [2010], the

The competitiveness of agriculture of EU member... 115
Oeconomia 15 (2) 2016
evaluation of competitiveness should be decided based on several components. However, the available studies usually include only one aspect of its assessment. Regardless of the adopted measures, competitiveness should be assessed in relation to the reference point due to the fact that it is a relative term. This justifi es the comparison of countries or sec-tors to each other.
MATERIAL AND METHODS
This study aims to evaluate the economic signifi cance of agriculture and its competi-tiveness in the European Union member states situated in Central and Eastern Europe in relation to agriculture of the so-called old Union member states. The partial indicators of productivity of production factors (land, labour, capital) for the years 2007–2014 were adopted as a measure of competitiveness. The selection of measures was determined by the fact that productiveness is a frequently used method of evaluating competitiveness and upon the approval of the Lisbon Strategy the improvement of productiveness be-came one of the main parameters for evaluating the progress of economic development [Floriańczyk et al. 2013]. On the other hand, the role of agriculture for the economies of respective member states was described using indicators such as: GDP per capita, share of agriculture in total gross value added (GVA), share of people employed in agriculture, share in the EU-28’s agricultural output and share in the EU-28’s agricultural area. Thus, the study covered 11 countries of Central and Eastern Europe and a group of 15 countries of the Old EU. The study did not include Cyprus and Malta due to the fact that they are not part of either the group of countries of Central and Eastern Europe, nor a group of countries of the old 15. The competitive analysis was based on Eurostat data from the years 2007–2014.
THE ECONOMIC IMPORTANCE OF AGRICULTURE IN THE EU COUNTRIES
In assessing the competitiveness of the agricultural sector in EU member states, one should pay attention to the specifi c conditions of its development. The results of research of many authors indicate considerable differences in the level of development of indi-vidual member states, including the level of development of agriculture [Arzeni et al. 2001, Serrăo 2003, Fuller and Beghin, Eds 2007, Poczta and Fabisiak 2007]. In the agricultural sector, these differences relate to the economic importance of agriculture, the production potential of this sector and effi ciency of its use. Table 1 presents selected indicators characterizing agriculture of 27 EU countries, as well as a synthetic indicator of socio-economic development – GDP per capita.
According to the indicators presented in Table 1, the importance of agriculture in the individual member states of the European Union presents a strong differentiation. It is suggested by this sector’s part in the gross value added, ranging on average in the years 2007–2014 in the new EU countries from more than 5% in Bulgaria to 0.56% in Slovakia.

116 A. Nowak
Acta Sci. Pol.
Table 1. Selected characteristics of agriculture in the EU member countries of Central and Eastern Europe compared to the countries of the Old EU (the average for 2007–2014)
CountryGDP per
capita (EUR)
Share of agriculture
in total gross value added
(%)a
Share of people
employed in agriculture
(%)
Share in the EU-28’s agricultural output (%)
Share in the EU-28’s agricultural
area (%)
Countries of Central and Eastern EuropeBulgaria 5 262.5 3.96 12.7 0.9 2.7Croatia 10 437.5 2.77 12.2 0.8 0.9Czech Republic 14 787.5 0.68 2.3 1.0 2.0Estonia 12 712.5 1.83 4.3 0.2 0.5Hungary 10 100.0 2.31 11.5 1.7 2.7Latvia 10 300.0 1.57 9.7 0.2 1.1Lithuania 10 300.0 3.21 11.2 0.5 1.6Poland 9 525.0 2.25 13.2 5.0 8.3Romania 6 637.5 5.33 20.0 3.6 7.5Slovenia 17 825.0 1.36 8.5 0.3 0.3Slovakia 12 587.5 0.56 2.9 0.4 1.1UE-11 10 952.3b 2.35b 9.8b 14.7c 28.6c
Countries of the Old EUAustria 36 200.0 0.95 3.2 1.6 1.6Belgium 34 025.0 0.52 1.4 2.0 0.8Denmark 43 975.0 0.82 2.0 2.4 1.5Finland 36 112.5 1.34 3.3 1.1 1.3France 31 225.0 1.61 3.2 19.0 15.9Germany 32 487.5 0.51 1.3 11.8 9.6Greece 19 150.0 3.79 12.2 3.2 2.8Ireland 39 537.5 0.89 8.2 1.6 2.8Italy 26 912.5 1.86 5.0 12.7 6.9Luxembourg 80 050.0 0.25 1.7 0.1 0.1Netherlands 38 337.5 1.79 1.9 6.7 1.1Portugal 16 600.0 1.91 6.5 1.8 2.1Spain 23 050.0 3.19 4.9 13.5 13.4Sweden 40 887.5 0.40 1.4 1.3 1.7United Kingdom 31 312.5 0.40 1.0 6.2 9.8UE-15 35 324.2b 1.35b 3.8b 85.1 71.3
a average for the years 2007–2013; b average for the group of EU countries; c together for a group of EU countries. Source: Own calculations based on data from Eurostat.
In the countries of the old EU this indicator reached the average of 1.35% during the re-searched period, ranging from 3.79% in Greece to 0.25% in Luxembourg. In the EU-15 countries in addition to Greece, only in Spain the share of agriculture in the country’s gross value added exceeded the average index level calculated for a group of 11 new member states.

The competitiveness of agriculture of EU member... 117
Oeconomia 15 (2) 2016
Similar difference as the indicator discussed above is shown by the level of employ-ment in agriculture. The greatest importance of this sector from the point of view of the labour market among the new EU member states is presented in Romania, Poland, Bul-garia and Croatia, where the percentage of people employed in agriculture in the years 2007–2014 reached respectively 20, 13.2, 12.7 and 12.2%. On average, in the group of 11 researched countries almost 10% of people were employed in this sector, with less than 4% achieved for the EU-15. It may also be noticed that a higher share of agriculture in gross added value of the country corresponds with a higher proportion of workers in this sector and the low level of development of the country. In countries such as Romania, Bulgaria, Poland, Croatia, Hungary, and Lithuania, GDP per capita is much lower than the average in the EU-15 and lower than the average in the 11 researched countries. This is accompanied by a relatively high share of agriculture in the creation of gross value added and high levels of employment in agriculture.
The role of agriculture in individual countries is also demonstrated by land resources, which show the production potential in this sector. The largest land resources of the 11 re-searched countries have Polish and Romanian agriculture with 8.3 and 7.5% respectively of the EU-28 agricultural lands. The group of the researched countries have at the dis-posal 28.6% of the EU’s land resources. Among the “old 15” the dominant role in terms of resources of agricultural land plays the French and Spanish agriculture, which have a total of 29.3% of acreage in the European Union.
Factors of production, in addition to economic and organizational conditions, deter-mine the level of agricultural production in different countries. The highest share in the EU’s agricultural production had, in the researched years, the agriculture of Poland (5%) and Romania (3.6%), while the total contribution of 11 countries in Central and Eastern Europe in the production of the whole Community stood on average at 14.7% in the pe-riod 2007–2014. Among the countries of the old EU the production with the highest value was generated by the agriculture of France and Spain, and its share in the total Union production in the period amounted to 19 and 13.5%.
An important role in building the competitiveness of agriculture in national and inter-national markets plays an agrarian structure and changes in its scope. This is due to the fact that the economic power of farms is closely linked to the wealth of individual hold-ings in productive assets, including mainly the land [Sikorska 2013]. European Union countries are characterized by a great diversity of agricultural structures. This is mainly because of the historical and natural factors and the level of sophistication of structural transformation. However, the general trends of these changes can be noted, which point to reduction of the number of farms, as well as stimulate the growth of production units areas. These changes, which are benefi cial from the perspective of the ability to compete on the Community market, are slow processes and they require the mobilization of stimu-lating mechanisms both at EU and national levels. Therefore, the governments of many countries introduce a statutory or even constitutional protection of family farms which are the basis of the agricultural system [Babiak 2010].
Table 2 shows the average area of farms, an area of nutrition (area of arable land per 1 inhabitant of the country) and the level of concentration of land used for agriculture in the 11 researched EU countries against the group of countries of the old 15. The de-gree of concentration of land used for agriculture was determined based on the Lorenz

118 A. Nowak
Acta Sci. Pol.
concentration factor, which adopts the value in the range of <0, 1>. If the ratio is equal to 0, we deal with a lack of concentration, with its value equal to 1, the concentration is complete. It was determined by the following formula [Wysocki and Lira 2003]:
5,0005,000
k M= −
where: (1) (2) 1(2)1
1 ( );2
ki i ii
M u u u −== ⋅ +
ui(1) – a share of the i interval; (2)iu – the sum of cumulated interest.
The indicators presented in Table 2 refer to the year 2010 due to the fact that these are the most recent available data on the structure of farms in the European Union.
Table 2. The average size of farms, the degree of concentration of agricultural land and the area of nutrition in the countries of Central and Eastern Europe which are members of the EU and the group of countries of the Old EU in 2010
CountryThe average size of
farm (ha)The Lorenz
concentration indexThe area of nutrition (ha per 1 inhabitant)
Countries of Central and Eastern EuropeBulgariaa 6.2 0.88 0.7Croatia nd nd 0.3Czech Republic 152.4 0.75 0.3Estonia 48.0 0.79 0.7Hungary 8.1 0.91 0.6Latvia 21.5 0.71 0.8Lithuania 13.1 0.72 0.8Poland 10.5 0.62 0.4Romaniaa 3.5 0.70 0.6Slovenia 6.5 0.52 0.2Slovakia 77.5 0.89 0,3
Countries of the Old EUUE-15 23.1 0.78 0.4
adata for 2002, nd – no data.Source: Own calculations based on data from Eurostat.
The area of arable land per 1 inhabitant (i.e. area of nutrition) is diverse within the researched group of the countries. The largest area of arable land per person was noted in such countries as Latvia and Lithuania. The lowest level of this index occurred in Slov-enia, Slovakia, Croatia and the Czech Republic. The average potential for farms defi ned by the resources of agricultural land ranged in 2010 from more than 150 ha in the Czech Republic to only 3.5 ha in Romania.
The area of agricultural land at the disposal of area groups of individual farms deter-mines the level of concentration of land in agriculture. Lorenz concentration ratio which
The competitiveness of agriculture of EU member... 119
Oeconomia 15 (2) 2016
refl ects this situation received values between 0.52 (Slovenia) to 0.91 (Hungary) in the re-searched group, while for the old EU it reached the level of 0.78. Alongside Slovenia, the largest distribution of agricultural land among farms of the researched group of countries occurred in the Polish agriculture. It points to the necessity for further structural transfor-mation in the agricultural sector of these countries. It seems that the signifi cant drivers of transformations within the agricultural structures are, and will be in longer term, meas-ures implemented both at the level of national policies, as well as in the framework of the Common Agricultural Policy.
THE PRODUCTIVITY OF PRODUCTION FACTORS IN AGRICULTURE
Analysis of productivity is a useful management tool at every economic level. At the level of national and sectoral productivity indicators help to evaluate the performance of management and the quality of social and economic policy [Prokopenko 1987]. The importance of productivity in assessment of the agriculture competitiveness level is also indicated by Latruffe [2010], who lists the measure next to other measures relating to the international trade in agricultural products, as well as to the strategic management (strategic management measures of competitiveness). Productivity can be measured with the help of partial indicators relating to the different factors of production, or as the total productivity. In this research partial indicators of land, labour and capital were calculated (Table 3). Labour productivity was determined as the relation of the value of agricultural production to the number of full-time employees in the sector, the productivity of the land as the value of production per 1 ha of agricultural land, and the capital productivity was determined based on the value of agricultural production relation to the value of total intermediate consumption1.
Labour productivity is generally the most important measure of productivity [Poczta 2003]. The importance of labour productivity stems from the fact that this measure de-termines the income situation, and the possibility of internal accumulation in agriculture [Poczta and Kołodziejczak 2008]. It is an indicator of both economic strength and pros-pects for development [Kowalski 1998]. Labour productivity is also closely related to innovation, in the introduction of new products, services, processes as well as organisa-tional and marketing innovations can increase labour productivity and create further high potential for productivity gains [EU Commission 2009]. Labour productivity index in any of the countries surveyed could not match the level attained on average in the EU-15. In the years 2007–2014 the average value of production per one person employed full-time in agriculture ranged from 6,926.2 in Romania and 7,649.1 in Bulgaria to 31,118.7 EUR per capita in the Czech Republic, thus demonstrating relatively great diversity. Labour productivity in a group of old member states was in the period nearly four times higher than the average in the group of new countries.
1 Total intermediate consumption – total specifi c costs (including inputs produced on the holding) and overheads arising from production in the accounting year.

120 A. Nowak
Acta Sci. Pol.
Table 3. Productivity of land, labour and capital in agriculture countries in Central and Eastern Europe belonging to the EU against the Old EU countries (average for 2007–2014)
CountryProductivity of land
(EUR·ha UAA–1)Productivity of labour
(EUR·AWU–1)Productivity of capital
(EUR·EUR–1)Countries of Central and Eastern Europe
Bulgaria 761.9 7 649.1 1.6Croatia 2 147.4 12 785.4 1.8Czech Republic 988.2 31 118.7 1.4Estonia 629.7 23 046.1 1.6Hungary 1 258.6 12 809.3 1.6Latvia 449.2 9 214.8 1.5Lithuania 660.5 12 300.2 1.7Poland 1 104.6 8 021.5 1.7Romania 890.2 6 926.2 1.8Slovenia 2 000.4 11 985.3 1.8Slovakia 757.0 22 195.3 1.2UE-11 1 058.9 14 368.3 1.6
Countries of the Old EUUE-15 2 846.2 54 038.3 1.8
Source: Own calculations based on data from Eurostat.
The productiveness of land is the central point for all analyses of agricultural produc-tion effectiveness and growth [Bezat-Jarzębowska and Rembisz 2015]. Productivity of land among the countries in Central and Eastern Europe also varied, in four countries (Croatia, Hungary, Poland and Slovenia) its level exceeded the average fi xed for 11 of the countries studied, but none of them could equal the average of the EU-15. The smallest effective use of the land factor was characterized by agriculture of Latvia (449.2 EUR per 1 ha), where the studied indicator was more than two times lower than the average for the entire group.
Differentiation in capital productivity in the surveyed countries and in relation to the average for the whole group (11 countries) is less than for the other two factors of produc-tion – land and labour. Agriculture in Croatia, Romania and Slovenia achieved effi ciency of capital at a level similar to that which occurred in the group of 15 countries of the Old EU, i.e. 1.8 EUR per 1 EUR. The lowest effi ciency of intermediate consumption reached agriculture in Slovakia, where the cost of generating 1.2 EUR worth of production cost 1 EUR. Two-dimensional graph in which the location of each country depends on two sub-indices of productivity – land and labour – was prepared to illustrate the diversity fac-tor productivity in agriculture of the researched countries, as well as its level in relation to the group of countries forming the Old EU (Fig.). Due to the relatively small differences in the productivity of capital in the group, this indicator was not included in the chart. Dis-tribution of countries covered by the research shows the great difference separating them from the average level represented by the countries of the Old 15, especially in terms of the effi cient use of labour in agriculture.

The competitiveness of agriculture of EU member... 121
Oeconomia 15 (2) 2016
Fig. Distribution of countries in Central and Eastern Europe belonging to the EU, depending on labour productivity and land productivity compared to other countries from the Old EU (average for 200–2014)
Source: Own calculations based on data from Table 3.
The competitive position of agriculture of the researched countries, based on partial productivity indicators were determined based on their relationship to the average value calculated for the EU-15. The results are summarized in Table 4.
Table 4. Productivity of land, labour and capital in the agriculture of the EU member states in Central and Eastern Europe in relation to the productivity of the countries of the Old EU (EU-15 = 100) (average for 2007–2014).
CountryLand productivity Labour productivity Capital productivity
Countries of Central and Eastern EuropeBulgaria 26.8 14.2 88.9Croatia 75.4 23.7 100.0Czech Republic 34.7 57.6 77.8Estonia 22.1 42.6 88.9Hungary 44.2 23.7 88.9Latvia 15.8 17.1 83.3Lithuania 23.2 22.8 94.4Poland 38.8 14.8 94.4Romania 31.3 12.8 100.0Slovenia 70.3 22.2 100.0Slovakia 26.6 41.1 66.7UE-11 37.2 26.6 88.9
Countries of the Old EUUE-15 100.0 100.0 100.0
Source: Own calculations based on data from Eurostat.

122 A. Nowak
Acta Sci. Pol.
The analysis of competitive advantages in relation to the factor of land and labour shows that in none of the researched countries in Central and Eastern Europe reached pro-ductivity similar to that which occurred on average in the years 2007–2014 in the group of 15 countries from the Old EU. On average across the group of 11 countries the land productivity reached only 37.2% of the land productivity of the EU-15, and in 6 countries that ratio was even less favourable.
The competitive position of the researched group based on the labour productivity was lower than in the case of competitiveness based on the effectiveness of the use of land, because this factor reached on average the level of 26.6% of the value calculated for the EU-15. Such a large gap between old and new EU countries in terms of labour pro-ductivity should translate to a much lesser level of employment in agriculture and better technical equipment and manpower in the EU-15.
Smaller disparities relate to the productivity of capital, in three of the 11 researched countries, the value of this indicator was the same as in the EU-15 and the average for the entire researched group this ratio stood at 88.9%.
CONCLUSIONS
The presented research assessed the competitiveness of agriculture in 11 EU-member countries in Central and Eastern Europe in relation to the countries of the Old EU by the factors of production. The average values for the 15 countries making up the Community since 1995 were adopted as a reference point for the examined indicators, which made it possible to determine the competitive position of countries that have joined it much later, i.e. 2004, 2007, 2009 and 2013. This also means that these countries operate in a completely different market conditions and undergo different development paths. Each of the 11 surveyed countries has a much lower level of development than the old EU countries, as evidenced by the value of the synthetic development meter, which is GDP per capita. Only Slovenia has achieved in the researched period the level of 50% of the index calculated for the group of EU-15 countries. In the remaining ten countries that ratio was much less favourable. Different levels of development in different countries, diverse role of agriculture in the economy, as well as differences in the resources, form a relatively strong differentiation of competitiveness of the agricultural sector. They should also be explained by the historical and natural determinants, and also the length of be-longing to the European Union, which determines the level of support of the agricultural sector from EU funds.
The analysis of indicators adopted for research show that the competitiveness of agri-culture assessed by the partial productivity of land, labour and capital in the group of 11 countries in Central and Eastern Europe is lower than the average for the 15 countries of the Old EU. This is true particularly for the productivity of labour and land, less for the capital. The absolute difference in average productivity of land between the group of 11 researched countries and the group of 15 old EU countries, averaged over the period 2007 to 2014 to 1,787.3 EUR per 1 ha. In relative terms, the difference was almost three-fold. Even worse competitive position was reached by the countries of Central and Eastern Europe when considering labour productivity in agriculture, which should be associated

The competitiveness of agriculture of EU member... 123
Oeconomia 15 (2) 2016
with structural problems that exist in many countries in this group. In the case of this in-dicator, agriculture of 11 researched countries reached an average level of less than 27% of the level of labour productivity of the Old EU and only in the Czech Republic this ratio exceeded 50%.
It can be assumed that the pace of changes in agriculture in the group of new member states will be faster than in the EU-15 in the coming years, which will be determined by the assumptions of the common agricultural policy and the cohesion policy. The measures implemented under those policies activate structural transformation in the agriculture of each country.
REFERENCES
Arzeni, A., Esposti, R., Sotte, F. (2001). Agriculture in transition countries and The European Mod-el of Agriculture: entrepreneurship and multifunctionality. Report for the World Bank – Project Šibenik-Knin and Zadar Counties: Framework for a Regional Development Vision. University of Ancona.
Babiak, J. (2010). Zmiany w strukturze rolnictwa krajów Unii Europejskiej. Rocznik Integracji Europejskiej, 4, 87–98 (in Polish).
Bezat-Jarzębowska, A., Rembisz, W. (2015). Wprowadzenie do analizy inwestycji, produktyw-ności, efektywności i zmian technicznych w rolnictwie. Raport Programu wieloletniego 2015–2019. IERiGŻ, Warszawa (in Polish).
Bureau, J.C., Butault, J.P. (1992). Productivity gaps, price advantages and competitiveness in EC agriculture. Europ. Rev. Agric. Econ. 19 (1), 25–48.
Carraresi, L., Banterle, A. (2015). Agri-food Competitive Performance in EU Countries: A Fifteen--Year Retrospective. Int. Food Agribus. Man. 18 (2), 37–62.
Cebulak, T., Firlej, K., Juchniewicz, M., Rowiński, J., Szczepaniak, I., Szymański, W., Wiatrak, A.P. (2008). Wybrane aspekty konkurencyjności polskich producentów żywności. IERiGŻ, Warszawa (in Polish).
EU Commission (2009). European Competitiveness Report 2008. Brussels.Floriańczyk, Z., Buks, J., Jarzębowski, S. (2013). Produktywność różnych form rolnictwa zrów-
noważonego i konwencjonalnego. Z badań nad rolnictwem społecznie zrównoważonym. Raport Programu Wieloletniego 2011–2014. IERiGŻ, Warszawa (in Polish).
Fuller, F., Beghin, J.Ch. (Eds), (2007). European Agriculture: Enlargement, Structural Change. CAP Reform and Trade Liberalization. Nova Publishers, New York.
Golejewska, A., Gajda, D. (2012). Analiza potencjału konkurencyjnego polskich regionów. Analizy i Opracowania 05. Uniwersytet Gdański, Gdańsk (in Polish).
Huggins, R., Izushi, H. (2008). Benchmarking the Knowledge Competitiveness of the Globe’s High Performing Regions: A Review of the World Knowledge Competitiveness Index. Compe-titiveness Review, 18 (1/2), 70–86.
Jagiełło, A. (2011). Konkurencyjność regionów na tle zmian społeczno-gospodarczych. Zeszy-ty Naukowe WSEI, Ekonomia, Zeszyt tematyczny: Węzły gordyjskie rozwoju Polski Wschodniej, 3 (1), 383–401 (in Polish).
Komorowska, D. (2014). Prawidłowości rozwoju rolnictwa a rozwój współczesnego rolnictwa. Problemy Rolnictwa Światowego, 14 (3), 98–110 (in Polish).
Korom, E., Sági, J. (2005). Measures of competitiveness in agriculture. J. Cent. Eur. Agr. 6 (3), 375–380.
Kowalski, A. (1998). Czynniki produkcji w agrobiznesie. [In:] A. Woś (Ed.), Encyklopedia agro-biznesu. Wyd. Fundacja Innowacja, Warszawa, 108–114 (in Polish).

124 A. Nowak
Acta Sci. Pol.
Kulawik, J., Wieliczko, B. (2012). Wybrane fi nansowe aspekty konkurencyjności rolnictwa. Za-gadnienia Ekonomiki Rolnej, 4, 36–53 (in Polish).
Latruffe, L. (2010). Competitiveness, Productivity and Effi ciency in the Agricultural and Agri-Food Sectors. OECD Food, Agriculture and Fisheries Papers. OECD Publishing.
Nosecka, B. (2014). Czynniki kształtujące konkurencyjność rolnictwa. [In:] A. Kowalski, M. Wi-gier (Eds), Konkurencyjność polskiej gospodarki żywnościowej w warunkach globaliza-cji i integracji europejskiej. Raport Programu Wieloletniego 2011–2014. IERiGŻ. War-szawa, 13–22 (in Polish).
Nosecka, B., Pawlak, K., Poczta, W. (2011). Wybrane aspekty konkurencyjności rolnictwa. Raport Programu Wieloletniego 2011–2014. IERiGŻ, Warszaw (in Polish).
Nowak, A. (2012). Zasoby w rolnictwie oraz ich wydajność. [In:] D. Kotlorz (Ed.) Ekonomiczne i społeczne aspekty funkcjonowania współczesnego rynku pracy, Studia Ekonomiczne, Zeszyty Naukowe Wydziałowe Uniwersytetu Ekonomicznego w Katowicach, 110, 71–80 (in Polish).
Poczta, W. (2003). Rolnictwo polskie w przededniu integracji z Unią Europejską. Wyd. AR, Poznań.
Poczta, W., Fabisiak, A. (2007). Changes in labour force resources in agriculture in the Central and Eastern European Countries as a result of accession to the European Union. Roczniki Akademii Rolniczej w Poznaniu, 385, Ekonomia, 6, 110–117.
Poczta, W., Kołodziejczak, M. (2008). Regionalne zróżnicowanie produktywności rolnictwa w Unii Europejskiej. J. Agribus. Rural Dev. 1, 1–12 (in Polish).
Prokopenko, J. (1987). Productivity Management. A Practical Handbook. International Labour Of-fi ce, Geneva.
Rosłanowska-Plichcińska, K., Jarosiński, M. (1996). Granice konkurencji. Grupa Lizbońska, Poltext, Warszawa (in Polish).
Serrão, A. (2003). Comparison of Agricultural Productivity among European Countries. NEW MEDIT, 1, 14–20.
Sikorska, A. (2013). Przemiany w strukturze agrarnej indywidualnych gospodarstw rolnych. IERiGŻ, Warszawa (in Polish).
Staszczak, D.E. (2011). Theoretical Interpretations of the European Union Enlargement: Perspecti-ves from a New Global Paradigm. Journal of Knowledge Globalization, 4 (1), 71–92.
Tarnowska, A. (2014). Produktywność wybranych czynników wytwórczych w rolnictwie krajów Unii Europejskiej w latach 2005–2012. Roczniki Naukowe SERiA, 16 (1), 214–219 (in Polish).
Wysocki, F., Lira, J. (2003). Statystyka opisowa. Wyd. Akademii Rolniczej im. Augusta Cieszkow-skiego w Poznaniu, Poznań (in Polish).
KONKURENCYJNOŚĆ ROLNICTWA KRAJÓW EUROPY ŚRODKOWO--WSCHODNIEJ BĘDĄCYCH CZŁONKAMI UNII EUROPEJSKIEJ
Streszczenie. Celem opracowania jest ocena konkurencyjności rolnictwa krajów Europy Środkowo-Wschodniej będących członkami Unii Europejskiej w relacji do rolnictwa kra-jów tzw. starej Unii. Jako miarę konkurencyjności przyjęto cząstkowe wskaźniki produk-tywności czynników produkcji (ziemi, pracy, kapitału) dla lat 2007–2014. Z badań wynika, że produktywność ziemi i pracy w grupie 11 krajów Europy Środkowo-Wschodniej jest

The competitiveness of agriculture of EU member... 125
Oeconomia 15 (2) 2016
znacznie mniejsza niż przeciętnie w 15 krajach tzw. starej Unii. Najniższa pozycja konkuren-cyjna rolnictwa pod względem produktywności pracy występuje w krajach o niskim pozio-mie rozwoju, mierzonego PKB per capita (Bułgaria, Rumunia, Polska). Produktywność kapitału w mniejszym stopniu różnicowała kraje w badanej grupie, a także w relacji do przeciętnych wyników uzyskanych w krajach UE-15.
Słowa kluczowe: konkurencyjność, produktywność, rolnictwo, Unia Europejska, kraje Europy Środkowo-Wschodniej
Accepted for print: 28.04.2016
For citation: Nowak A. (2016). The competitiveness of agriculture of EU member countries of Central and Eastern Europe. Acta Sci. Pol., Oeconomia, 15 (2), 113–125.


Oeconomia 15 (2) 2016, 127–138
CHANGES IN AGEING OF COMMUNES (LAU2s) IN POLAND BETWEEN 1995 AND 2014
Joanna RakowskaWarsaw University of Life Sciences – SGGW
Abstract. The paper presents statistical and spatial analysis of changes in the ageing level in 2,478 LAU2s in Poland occurring between 1995 and 2014. The results show that the average share of the young decreased from 32.4 to 22.1% and the average share of the old increased from 12.5 to 14.1%, both of which resulted in a considerable increase of the average value of the ageing index, i.e. from 39 to 66 old people per 100 young. The share of the young decreased in all LAU2s in Poland, while the share of the old increased in 65% of LAU2s. However, the increase in the share of the old had a stronger impact onto the increase of the ageing index than the decrease of the share of the young. The process of ageing was most intensive in Opolskie and Śląskie Voivodships, in the south-eastern part of Poland and in the south-western part of Podlaskie Voivodship. Population ageing process in other parts of the country had a diversifi ed intensity.
Key words: ageing of population, Poland, LAU2
INTRODUCTION
Population ageing process, meaning the decrease of the share of the old (age 65+), and more and more often also the “very old” (75+) and even “the oldest old” (age of 85+), accompanied by the decrease of the share of the young in the total population, has already been recognised as a global problem [UNFPA no date]. Numerous social and economic implications caused by the population ageing in the global and regional contexts were the reason why the UNO declared it one of the three main challenges of the 21st century – next to global climate changes and global terrorism [Rakowska 2015].
Population ageing causes changes in many social and economic fi elds, both on the national, regional and local levels. The main demographic and societal consequence of
Corresponding author: Joanna Rakowska, Warsaw University of Life Sciences – SGGW, Faculty of Economics Sciences, Nowoursynowska 166, 02-787 Warszawa, Poland, e-mail: [email protected]© Copyright by Warsaw University of Life Sciences Press, Warsaw 2016
ISSN 1644-0757eISSN 2450-4602
http://acta_oeconomia.sggw.pl

128 J. Rakowska
Acta Sci. Pol.
this process is population decline [Bucher and Mai 2005]. Especially in the case of areas lagging behind in social and economic development the ageing of local populations not balanced by the immigration of exogenous population can lead to a signifi cant decrease in the number of inhabitants, and in extreme situations even to depopulation of such areas in a relatively short time [Rakowska 2015]. Together with the demographic consequences, population ageing brings in changes in practically every aspect of social and economic existence of the society [Niewiadomska and Sobolewska-Poniedziałek 2015]. It poses most serious challenges to the national systems due to the decreasing labour force [Lange 2008, MPiPS 2011] generating decreasing tax income and contributions to different so-cial welfare and social protection systems. These will be consequences to the retirement system based on the principle of solidarity of generations and PAYG rule as well as to the health care system and welfare system, which will have to be adjusted to meet the increas-ing needs of the ageing society. Population ageing is also of crucial importance for the local development, where one can observe both the effects of its impact on the national systems as well as on the local markets, local social and economic conditions and most of all on the structure of families and households.
The economic and social effects of population ageing make it a big challenge for planning and realisation of development strategies and policies on all administrative levels – from the national to the local one. To effectively implement such policies it is necessary to analyse the still on-going population ageing process. It should be done both in static approach showing the differentiation of population ageing at a given mo-ment [Rakowska 2015], and in dynamic approach refl ecting changes in the increasing number of the old and the decreasing number of the young in a specifi ed time range [Długosz 1998, Kurek 2008].
The beginning of population ageing in Poland is dated at the early 1990s [Ciura and Szymańczak 2012]. Just like in other Central and East European countries, it coincides with the beginning of the social and political transformation. Although it started in Po-land later than it did in the countries of the West Europe, it is more intense and of wider range [EC 2011, Hoff 2011, Okólski and Fihel 2012, Żołędowski 2012]. Because of the lowest fertility level and high net emigration rate from Poland the perspective of getting out of deep demographic depression seems very distant [MPiPS 2011, Rządowa Rada Ludnościowa 2011], if possible at all. Some analysis even forecast point-black that Polish population ageing will intensify over the next four decades and in 2020 will rank Poland as the second oldest nation in EU, based on the second highest population age median [Giannakouris 2008]1.
The fact that ageing is most diverse on a local level makes a rationale for undertaking the study on ageing at the LAU2 (commune) level2.
1 For 27 member states because the study was carried out in 2008.2 LAU2 (Local Administrative Units 2) in Poland corresponding with NTS 5, i.e. communes [Ra-kowska 2013].

Changes in ageing of communes (LAUS2s) in Poland... 129
Oeconomia 15 (2) 2016
MATERIAL AND METHODS
The presented study is a continuation of the analysis of the level of ageing of Polish population in 2013 [Rakowska 2015]. Its aim is to defi ne the spatial differentiation of population ageing on the local LAU2 level in Poland between 1995 and 2014 as well as to look into the relations between the applied measures. The time range of the study depends on availability of two categories of statistical data: those closest to the transformation, i.e. as of December 31, 1995, and the latest ones available when undertaking the study, i.e. as of December 31, 2014. The spatial range of the study includes 2478 LAU2s, i.e. all communes existing in Poland in 1995–2014. Only Jaśliska LAU2 was excluded from the study because it was established in 2010 and for this reason did not match the time range of the study. The data for the study was obtained from the Local Data Bank of the Central Statistical Offi ce of Poland. The category used is specifi ed there as “population by age and gender, data according to the place of residence”, by the administrative division of Poland as of December 31, 1995 and December 31, 2014.
As this study is a continuation of the analysis of the level of ageing of Polish popula-tion in 2013, the applied methods are optimally coherent. Application of measures [1], [2], [3], [4], [5] and [6] enables defi ning the changes in the share of the old and the young in the population as well as changes in the relation of the old to the young. The statisti-cal data for 1995 aggregate the subpopulation of 70+ into one group, not specifying the functional subgroups. That is why it is impossible to defi ne changes in the sub-population of “the oldest”, which consequently precludes defi ning the changes of the double ageing index between 1995 and 2014.
The applied measures:The share of the old in the total population (ULS) in 1995 and in 2014:
0 1
0 1
0 1
100% and 100%St StLSt LSt
t t
L LU U
L L= ⋅ = ⋅
The indicator of changes of the share of the old in the total population (ZULS) between 1995 and 2014:
1 0 (p.p.)LS LSt LStZU U U= −
The share of the young in the total population (ULM) in 1995 and 2014
0 1
0
0 11100% and 100%Mt Mt
LMtLMtt t
L LU U
L L= ⋅ = ⋅
The indicator of changes of the share of the young in the total population (ZULM) be-tween 1995 and 2014:
1 0 (p.p.)LM LMt LMtZU U U= −
Ageing index by A. Sauvy (WSD) meant as the number of the old per 100 young in 1995 and 2014:
0 1
0 1
0 1
100 and 100St StSDt SDt
Mt Mt
L LW W
L L= ⋅ = ⋅
1.
2.
3.
4.
5.

130 J. Rakowska
Acta Sci. Pol.
Indicator of changes in the ageing index by A. Sauvy (ZWSD) meant as an increase or a decrease in the number of the old per 100 young:
1 0SD SDt SDtZW W W= −
where: L – the total population; LM – the young, i.e. between 0 and 19 years of age; LS – the old (i.e. 65+); t 1 – as of December 31, 2014; t0 – as of December 31, 1995.
The intensity of population ageing shown by ZULS, ZULM and ZWSD indices was classi-fi ed into fi ve groups. In stage one the interval series generated for each analysed variable and including data for each LAU2 were divided into three equal ranges, called:
Range A, if: ZULS , ZULM , ZWSD , ∈ 1 2, ).y yRange B, if: ZULS , ZULM , ZWSD , ∈ 2 3, ).y yRange C, if: ZULS , ZULM , ZWSD , ∈ 3 4, );y y
where: yn – the border values of subsequent ranges, assuming that: y1 – the minimal value of the interval series, y2 = y1 + d, y3 = y2 + d, y4 – the maximal value of the interval series, d – the span of the ranges, independent for each analysed variable, i.e. 4 1( )
.4
y yd −=
In stage two, in cases where the distribution of the analysed LAU2s in specifi ed ranges was signifi cantly uneven, i.e. if any of the basic three ranges included 75% or more of the analysed LAU2s, such range was divided into another three equal sub-ranges, according to the method described above.
The results of such obtained fi ve-range classifi cation are presented in the maps and the distribution of the analysed group of LAU2s by more detailed ranges in histograms.
The statistical average and median were also used to identify the intensity of changes in population ageing. Pearson’s correlation coeffi cient was used to look into the relations between all the applied variables [1], [2], [3], [4], [5] and [6]. The results are shown in correlation matrix.
RESULTS
The results of the analysis prove that values of ZULS, ZULM, ZWSD, ranged as shown in Table 1 and that of them had a cumulation of more than 75% of LAU2s in one of the three general ranges. Thus according to the applied method such ranges were divided into another three sub-ranges presented in Table 2.
6.
1.2.3.

Changes in ageing of communes (LAUS2s) in Poland... 131
Oeconomia 15 (2) 2016
Table 1. The general classifi cation – ranges of the analysed variables and the number of LAU2s
VariableThe ranges The number of LAU2s in
each sub-rangeA B C A B C
ZULS
ZULM
ZWSD
7.1; 0.4)− −22.1; 15.4)− −
22; 40)−
0.4; 6.3)−15.4; 8.7)− −40;102)
6.3;12.98.7; 2− −
102;165
49338
2 103
1 8761 898
371
108541
3
Explanation: in bold the number of LAU2s making 75% or more of the analysed units.Source: Own elaboration.
Table 2. The detailed classifi cation for the ranges of the general classifi cation including 75% or more of the analysed LAU2s, i.e. range B for ZWSD, ZULS, and range A for ZULM
VariableThe sub-ranges The number of LAU2s in
each sub-range 1 2 3 1 2 3
ZULS B 0.4;1.8)− 1.8; 4.1) 4.1; 6.3) 989 589 298
ZULMB 15.4; 13.7)− − 13.7; 10.9)− − 10.9; 8.7)− − 952 820 126
ZWSD A 22.0; 1.3)− − 1.3;19.3)− 19.3; 40.0) 10 885 1 208Source: Own elaboration.
The share of the old in 1995 in Polish LAU2s equalled from 3 to 29%, and in 2014 from 7 to 39%. Both the statistical average and median increased between 1995 and 2014, correspondingly from 12.5 to 14.1% and from 11.9 to 13.9%.
The values of ZULS ranged from –7.1 to 12.9 p.p. The share of the population aged 65+ decreased in 470 LAU2s (19% of all analysed LAU2s), of which the highest decrease of between –7.1 to –4 p.p. was observed only in 14 units located in different parts of Po-land. In 403 LAU2s (16%) no signifi cant changes were observed, while in the remaining 1,605 (65%) communes ZULS increased, of which in 345 of more than 5 p.p., showing the highest intensity of the ageing process. Between 1995 and 2014 both the statistical average and median of ZULS increased from 12 to 14%. Figure 13 shows changes in the distribution of communes by more detailed values of ZULS in 1995 and in 2014. Fig-ure 2 shows the spatial differentiation of ZULS classifi ed as explained in Tables 1 and 2. The spatial analysis proves that LAU2s characterised by the highest (6.3, 12.9 p.p. increase of the share of the old in the total population are located in the near-border part of south-eastern Poland and in the south of Poland in opolskie and śląskie voivodships. Jointly with LAU2s characterised by the increase of ULS of (4.1, 6.3 p.p. , they make the biggest cluster of communes with the highest increase of the old in Poland (Fig. 2).
The share of the young in 1995 ranged from 18 to 43%, and in 2014 from 13 to 33% (Fig. 3). The average and median in 1995 were of quite similar value, correspondingly
3 To better visualise the results, histograms (Figs 1, 3 and 5) show only the values observed in the analysed group, excluding the nominal values not shown in the observations.

132 J. Rakowska
Acta Sci. Pol.
The share of the old 65+ (%) Fig. 1. Histogram of the distribution of LAU2s by the share of the old (65+) in total population
(ULS) in 1995 and 2014Source: Author’s calculation based on data from the Local Data Bank of the CSO.
p.p.p.p.p.p.p.p.p.p.
Fig. 2. Changes in the share of the old (65+) (ZULS) between 1995 and 2014Source: Author’s calculations based on data from the Local Data Bank of the CSO.

Changes in ageing of communes (LAUS2s) in Poland... 133
Oeconomia 15 (2) 2016
32.4 and 32.6%, and they both signifi cantly decreased in 2014 to correspondingly 22.1 and 22.2%. The share of the young declined in all (!) LAU2s in Poland. The values of this index decreased by from 2 to 22 p.p. Clusters of LAU2s with the highest decrease of the share of the young occur only in the near-border part of south-eastern part of Poland and covers mostly the same area as that characterised by the highest increase in the share of the old (Fig. 4). The lowest decrease in the share of the young can be observed in Central Poland. Other values of the index are dispersed all over the country without any identifi -able pattern.
The ageing index by A. Sauvy, showing the number of the old per 100 of the young ranged in 1995 from 9 to 153, and in 2014 from 25 to 306 (Fig. 5). In 1995–2014 the index decreased only in 13 LAU2s, in 6 it did not change and in the remaining 2,459 it increased by different values: from 1 up to 164 old people per 100 of the young (Fig. 5). In 1,811 of the ageing LAU2s the value of the index increased by 2 to 99%, in 551 from 100 to 199%, in 81 from 200 to 299%, in 9 from 300 to 399%, in 2 LAU2s it increased fi ve times and in 1 six times. The average for all LAU2s in 1995 equalled 39 old people per 100 of the young (median 36), and in 2014 it increased by 69.2% to 66 old per 100 young (median 63), which proves that the population ageing process was intensive. The clusters of communes with the highest values of the changes are located in the near-border part of the south-eastern Poland, in the south of the country in Opolskie and Śląskie voivod-ships and in the south-eastern part of Podlaskie Voivodship. This is nearly the same area, as that characterised by the highest increase in the share of the old in the total population (Figs 2 and 6).
The share of the young (aged 0–19) %
Fig. 3. Histogram of the distribution of LAU2s by the share of the young (age 0–19) in total population (ULM) in 1995 and 2014
Source: Author’s calculations based on data from the Local Data Bank of the CSO.
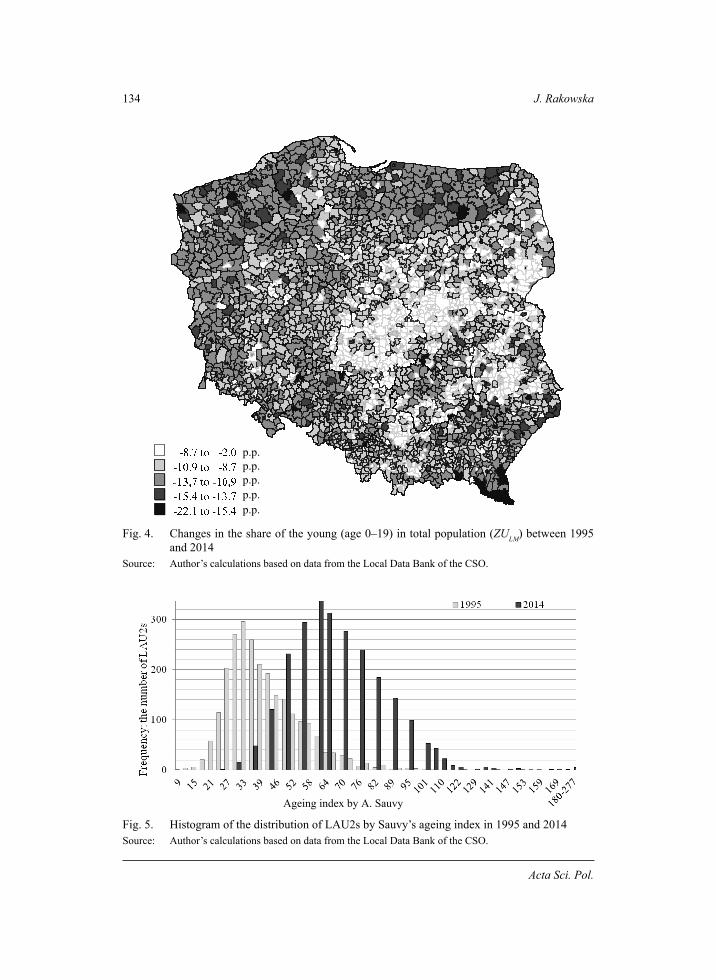
134 J. Rakowska
Acta Sci. Pol.
p.p. p.p. p.p. p.p. p.p.
Fig. 4. Changes in the share of the young (age 0–19) in total population (ZULM) between 1995 and 2014
Source: Author’s calculations based on data from the Local Data Bank of the CSO.
Ageing index by A. Sauvy
Fig. 5. Histogram of the distribution of LAU2s by Sauvy’s ageing index in 1995 and 2014 Source: Author’s calculations based on data from the Local Data Bank of the CSO.

Changes in ageing of communes (LAUS2s) in Poland... 135
Oeconomia 15 (2) 2016
Fig. 6. Changes of the ageing index by A. Sauvy (ZIsd) between 1995 and 2014 Source: Author’s calculations based on data from the Local Data Bank of the CSO.
According to the results shown in Table 3, there is a very high positive correlation between the ageing index in 1995 and the share of the old in 2014, as well as between the changes in the share of the old and changes of the ageing index in 1995–2014. Another very high although negative correlation occurs between the share of the young in 2014 and the ageing index in 2014.
There is nearly perfect positive correlation between the share of the old and the ageing index in 1995 and between the same variables in 2014.
The ageing index correlates stronger with the share of the old (r = 0.96 in 1995 and r = 0.95 in 2014) than with the share of the young (r = –0.76 in 1995 and r = –0.81 in 2014), although both these correlations are signifi cant, correspondingly – very strong and strong. It is also confi rmed by a very strong correlation between the changes in the ageing index and the changes in the share of the old (r = 0.90) as well as strong correlation be-tween the changes in the ageing index with the changes of the share of the (r = –0.68).
The negative correlation between the share of the young and the ageing index is strong and can be explained by a higher ageing index 58% communes in 1995 and in 62% com-munes in 2014.

136 J. Rakowska
Acta Sci. Pol.
Table 3. The matrix of correlations between the analysed variables
× 0LMtU 1LMt
U ZULM0LSt
U 1LStU ZULS
0SDtW 1SDt
W ZWSD
0LMtU 1 0.68 –0.28 –0.35 –0.37 0.04 –0.33 –0.30 0.06
1LMtU 0.68 1 0.20 –0.19 –0.32 –0.10 –0.21 –0.30 –0.09
ZULM –0.59 0.20 1 0.60 0.30 –0.51 0.63 0.15 –0.68
0LStU –0.63 –0.21 0.60 1 0.72 –0.60 0.96 0.57 –0.61
1LStU –0.78 –0.66 0.30 0.72 1 0.13 0.81 0.95 0.02
ZULS 0.00 –0.47 –0.51 –0.60 0.13 1 –0.45 0.28 0.90
0SDtW –0.76 –0.35 0.63 0.96 0.81 –0.45 1 0.71 –0.50
1SDtW –0.79 –0.81 0.15 0.57 0.95 0.28 0.71 1 0.19
ZWSD 0.11 –0.48 –0.68 –0.61 0.02 0.90 –0.50 0.19 1
Explanation of the colours in the table:
no colour r ∈ 0; 0.2) very week correlation, practically noner ∈ 0.2; 0.4) week correlationr ∈ 0.4; 0.6) moderate correlationr ∈ 0.6; 0.8) strong correlation
r ∈ 0.8; 0.9) very strong correlation
r ∈ 0.9; 1.0 nearly perfect and perfect correlationSource: Author’s calculations based on data from the Local Data Bank of the CSO.
CONCLUSIONS
Between 1995 and 2014 the average share of the young fell in the surveyed communes from 32.4 to 22.1%, and the average share of the old increased from 12.5 to 14.1%, which proves that both these factors infl uenced the ageing process in Poland. Consequently, the average value of the Sauvy’s index increased signifi cantly: from 39 old people per 100 young in 1995 to 66 old people per 100 young in 2014.
Analysis of the ageing process in LAU2s in 1995–2014 proves that the share of the young decrease in all communes in Poland, while the share of the old decreased in 65% of communes. However, it is the share of the old, that nearly perfectly positively corre-lates with the ageing index in 1995 and 2014 (the higher share of the old was related to a higher ageing index in 92% of LAU2s in 1995 and in 81% of LAU2s in 2014). On the other hand, there is a very strong negative correlation between the changes in the share of the young and the changes of the ageing index. It implies that the process of population ageing in Poland in 1995–2014 resulted not only from the small share of the young and its further decrease but also from the big share of the old and its further increase.

Changes in ageing of communes (LAUS2s) in Poland... 137
Oeconomia 15 (2) 2016
The spatial analysis shows that the ageing process was most intensive in Opolskie and Śląskie Voivodships, in the south-eastern part of Poland and in the south-eastern part of Podlaskie Voivodship. In the rest of the country values of the analysed ratios vary and do not form visible clusters of municipalities.
REFERENCES
Ciura, G., Szymańczak, J. (2012). Starzenie się społeczeństwa polskiego. Infos, 12126, Biuro Ana-liz Sejmowych.
Długosz, Z. (1998). Próba określania zmian starości demografi cznej Polski in ujęciu przestrzen-nym. Wiadomości Statystyczne, 3, 15–25.
EC (2011). Demography Report 2010. Older, more numerous and diverse Europeans.Giannakouris, K. (2008). Ageing characterises the demographic perspectives of the European soci-
eties. Eurostat, “Statistics in focus” 72.Hoff, A. (Ed.) (2011). Population Ageing in Central and Eastern Europe. Societal and Policy Impli-
cations. Ashgate Publishing. Kurek, S. (2008). Typologia starzenia się ludności Polski in ujęciu przestrzennym. WN AP, Kra-
ków. Lange, M. (2008). Rynek pracy in obliczu starzenia się ludności Polski. [In:] J.T. Kowaleski,
P. Szukalski (Eds), Starzenie się ludności Polski. Między demografi ą a gerontologią spo-łeczną. Wyd. UŁ, Łódź.
MPiPS (2011). Polska 2011. Raport o rynku pracy i zabezpieczeniu społecznym. Ministerstwo Pracy i Polityki Społecznej, Warszawa.
Niewiadomska, A., Sobolewska-Poniedziałek, E. (2015). Utilising the professional potential of the elderly in the process of construction of silver economy in Poland. Acta Scientiarum Po-lonorum, Oeconomia, 14 (1), 81–92.
Okólski, M., Fihel, A. (2012). Demografi a. Współczesne zjawiska i teorie. Wydawnictwo Naukowe Scholar, Warszawa.
Rakowska, J. (2013). Klasyfi kacje obszarów – kryteria, defi nicje, metody delimitacji. Studium me-todyczno-statystyczne. Wydawnictwo Wieś Jutra, Warszawa.
Rakowska, J. (2015). Zróżnicowanie starości demografi cznej Polski in 2014 ujęciu lokalnym. In print.
Rządowa Rada Ludnościowa (2011). Sytuacja demografi czna Polski. Raport 2010–2011. Warszawa.
UNFPA (no date): Population Ageing: Background Review. Technical and Policy Division Re-trieved from http://www.unfpa.org/webdav/site/global/shared/icpd/ageing.pdf.
Żołędowski, C. (2012). Starzenie się ludności – Polska na tle Unii Europejskiej. Problemy Polityki Społecznej 17, 29–43.
ZMIANY POZIOMU STAROŚCI DEMOGRAFICZNEJ (LAU2) POLSKIW LATACH 1995–2014 W UJĘCIU LOKALNYM
Streszczenie. Celem artykułu jest statystyczna i przestrzenna analiza zmian poziomu sta-rości w 2478 gminach (LAU2) w Polsce w latach 1995–2014. Wyniki wskazują, że średni udział ludności młodej spadł z 32,4 do 22,1%, a średni udział ludności starej wzrósł z 12,5 do 14,1%, powodując znaczny wzrost średniej wartości wskaźnika starości z 39 do 66 osób starych na 100 młodych. Udział ludności młodej zmalał we wszystkich gminach w Polsce, natomiast udział ludności starej wzrósł w 65% gmin. Jednak to wzrost udziału ludności sta-rej miał silniejszy wpływ wzrost wskaźnika starości niż malejący udział ludności młodej.

138 J. Rakowska
Acta Sci. Pol.
Proces starzenia był najbardziej intensywny na obszarze województw opolskiego i śląskie-go, w południowo-wschodniej części Polski oraz w południowo-wschodniej części woje-wództwa podlaskiego. W pozostałych częściach kraju proces starzenia był zróżnicowany.
Słowa kluczowe: starzenie ludności, Polska, LAU2
Accepted for print: 07.04.2016
For citation: Rakowska J. (2016). Changes in ageing of communes (LAU2s) in Poland between 1995 and 2014. Acta Sci. Pol., Oeconomia, 15 (2), 127–138.

Oeconomia 15 (2) 2016, 139–149
EQUALITY OF CHANCES FOR PEOPLE WITH DISABILITIES IN THE LABOUR MARKET
Paulina StolarczykWarsaw University of Life Sciences – SGGW
Abstract. Due to their disability people with disabilities, more than others, are exposed to discrimination and social exclusion. The aim of study is to present the situation of people with disabilities in the labour market in Poland from the perspective of equal chances poli-cy. The equality of persons with disabilities contributes to their higher activity in the labour market. The research shows that this social group represents much lower economic activity and employment rate than other professional groups. There are de facto and de jure differ-ences in the perception of equal chances for disabled people. The employment rate among people with disabilities amounts almost to 15%, while in the rest of the population was over 55%. In the national and international regulations, in the ILO Convention on the Rights of Persons with Disabilities, the countries ratifying this document recognize the right of persons with disabilities to work on an equal basis with others.
Key words: labour market, people with disabilities equal chances, Poland
INTRODUCTION
The purpose of a democratic state is to ensure the equal chanes for all citizens of the state. The equal opportunities policy, also called equality policy, aims at providing the appropriate actions, measures and instruments for equal chances for people exposed to social and economic discrimination. The group of people who are subject to this nega-tive phenomenon include, among others, people with disabilities, different race, gender and sexual orientation. Additionally, the factors causing unequal treatment may cover the place of residence, national origin, age, religion, and people with different views than the majority of the population. The equal opportunities policy is intended to enable all people, irrespective of their differences, full participation in every aspect of life and equal treatment.
Corresponding author: Paulina Stolarczyk, Warsaw University of Life Sciences – SGGW, Faculty of Economics Sciences, Nowoursynowska 166, 02-787 Warszawa, Poland, e-mail: [email protected]© Copyright by Warsaw University of Life Sciences Press, Warsaw 2016
ISSN 1644-0757eISSN 2450-4602
http://acta_oeconomia.sggw.pl

140 P. Stolarczyk
Acta Sci. Pol.
The policy of equality is closely related to discrimination. It is a kind of restriction, exclusion or preclusion of the person from the same equal use as the whole of the society of human rights, fundamental freedoms and resources in professional, social and econom-ic life [Sawicka 2013]. The International Labour Organization also defi ned the concept of discrimination in the Discrimination (Employment and Occupation) Convention adopted in Geneva on 25 June 1958 [Convention... 1958].
In the literature you can fi nd several types of discrimination based on chosen criteria. The most common division includes direct and indirect discrimination, the another one is a positive (affi rmative action) and negative discrimination. Any restriction, exclusion or prevention of a group or individual from using all human rights, resources and funda-mental freedoms on equal basis with others means discrimination in a negative sense. In contrast, positive discrimination is deliberate introduction of specifi c solutions (e.g. in the recruitment process the admission priority among candidates with the same qualifi cations have people with disabilities) which are aimed at levelling the chances of a particular occupational group [Sawicka 2012]. Labour market institutions encourage all aspects of positive discrimination which equal the chances of social groups that are in a worse situ-ation in the labour market.
There are three types/aspects of discrimination in the labour market [Kryńska and Kwiatkowski 2013]:
statistical discrimination – occurs when there is incomplete and imperfect information in the labour market; the employers have information about a candidate just as it is about the whole group to which potential candidate/employee belongs;discrimination based on prejudices and preferences applies to employees/clients and employers. It occurs when at the time of contact, for example with women or disabled people, the employers feel the peace of mind;discrimination linked to the existence of different kinds of monopolies in the market, e.g. trade unions, resulting in the law regulations which lead to the formation of bar-riers in hiring people from specifi ed social groups. The equality and improvement of the life standard of specifi c social groups have been
present in economic fi eld for a long time and they concern mainly the theory of welfare as well as the A. Sen’s views. According to Sen “the equality of opportunities can con-tribute to a very uneven income, the equality of income can lead to signifi cant variation of fortunes, the equality of fortunes may be accompanied by a very high inequality of hap-piness, the equality of happiness may include signifi cant amounts in meeting the needs, the equality of meeting the needs may coincide with many aspects of freedom of choice and so on” [Sen 2004]. Sen [2004] believes that not only income, resources and formal freedoms should be equally distributed but also “the capabilities”. These capabilities may include the important aspects related to labour market and equality – these are, among others, the ability to work or freedom of self-fulfi llment enabling sensible and decent life rather than focusing only on the wealth accumulation. These capabilities make it pos-sible to meet basic needs: food, housing, dressing, communication, transport, access to education and health care, as well as the exercise of fundamental freedoms and access to happiness. However, one should keep in mind that all this is not limited to the effective execution of basic needs [Gazon 2008].
•
•
•
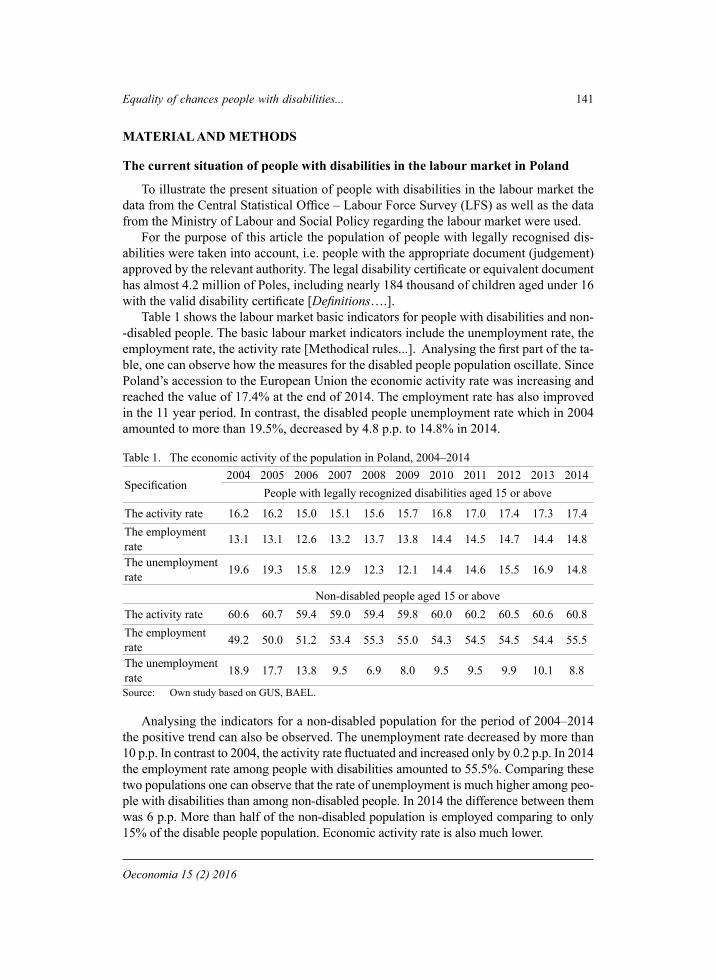
Equality of chances people with disabilities... 141
Oeconomia 15 (2) 2016
MATERIAL AND METHODS
The current situation of people with disabilities in the labour market in Poland
To illustrate the present situation of people with disabilities in the labour market the data from the Central Statistical Offi ce – Labour Force Survey (LFS) as well as the data from the Ministry of Labour and Social Policy regarding the labour market were used.
For the purpose of this article the population of people with legally recognised dis-abilities were taken into account, i.e. people with the appropriate document (judgement) approved by the relevant authority. The legal disability certifi cate or equivalent document has almost 4.2 million of Poles, including nearly 184 thousand of children aged under 16 with the valid disability certifi cate [Defi nitions….].
Table 1 shows the labour market basic indicators for people with disabilities and non--disabled people. The basic labour market indicators include the unemployment rate, the employment rate, the activity rate [Methodical rules...]. Analysing the fi rst part of the ta-ble, one can observe how the measures for the disabled people population oscillate. Since Poland’s accession to the European Union the economic activity rate was increasing and reached the value of 17.4% at the end of 2014. The employment rate has also improved in the 11 year period. In contrast, the disabled people unemployment rate which in 2004 amounted to more than 19.5%, decreased by 4.8 p.p. to 14.8% in 2014.
Table 1. The economic activity of the population in Poland, 2004–2014
Specifi cation2004 2005 2006 2007 2008 2009 2010 2011 2012 2013 2014
People with legally recognized disabilities aged 15 or above
The activity rate 16.2 16.2 15.0 15.1 15.6 15.7 16.8 17.0 17.4 17.3 17.4The employment rate 13.1 13.1 12.6 13.2 13.7 13.8 14.4 14.5 14.7 14.4 14.8
The unemployment rate 19.6 19.3 15.8 12.9 12.3 12.1 14.4 14.6 15.5 16.9 14.8
Non-disabled people aged 15 or aboveThe activity rate 60.6 60.7 59.4 59.0 59.4 59.8 60.0 60.2 60.5 60.6 60.8The employment rate 49.2 50.0 51.2 53.4 55.3 55.0 54.3 54.5 54.5 54.4 55.5
The unemployment rate 18.9 17.7 13.8 9.5 6.9 8.0 9.5 9.5 9.9 10.1 8.8
Source: Own study based on GUS, BAEL.
Analysing the indicators for a non-disabled population for the period of 2004–2014 the positive trend can also be observed. The unemployment rate decreased by more than 10 p.p. In contrast to 2004, the activity rate fl uctuated and increased only by 0.2 p.p. In 2014 the employment rate among people with disabilities amounted to 55.5%. Comparing these two populations one can observe that the rate of unemployment is much higher among peo-ple with disabilities than among non-disabled people. In 2014 the difference between them was 6 p.p. More than half of the non-disabled population is employed comparing to only 15% of the disable people population. Economic activity rate is also much lower.

142 P. Stolarczyk
Acta Sci. Pol.
To present the current situation of people with disabilities in the labour market in ad-dition to the above-described rates, the breakdown of professionally active and inactive people among both populations was shown. In the group of people with disabilities there are more people professionally inactive than active. The 11 year period indicates the downwards trend as the number of professionally passive people is decreasing, whereas the number of the professionally active has not considerably changed and remains at the level of 16–17% (Fig. 1). The professionally active population consists of employed and unemployed people. In recent years the declining trend can be observed as there are sig-nifi cantly less unemployed people than employed.
Fig. 1. People with disabilities broken down into active and inactive persons, 2004–2014Source: Own study based on BAEL.
While analysing a non-disabled community, one can notice a completely opposite situation than in the previous population (Fig. 2). There are much more professionally active than inactive people. The active ones constitute about 60% while the passive ones about 40% of the non-disabled population. One can observe a slightly upward trend of professionally active people.
Fig. 2. The division of non-disabled people into professionally active and inactive, 2004–2014Source: Own study based on BAEL.

Equality of chances people with disabilities... 143
Oeconomia 15 (2) 2016
Legal aspects
The issue of equal treatment and discrimination has been the regulation subject of many international and national acts for a long time. The disabled people are entitled to all civil rights as well as to special permissions in order to improve the functioning of this group in social, professional and economic development. The permissions mainly relate to people with severe and moderate disability. They cover shorter working hours – 7 h a day and 35 hper week, additional annual leave or a fi xed 21 day rehabilitation period [Garbat 2013]. Thanks to these regulations the protection against disability discrimination is ensured. Re-cently in Poland a change in behaviour towards people with disabilities has been observed.
The issue of equal chances and non-discrimination is included in many regulations including i.a. [Guidelines for the implementation... 2015]:
The Polish Constitution of 2 April 1997;The Convention on the Rights of Persons with Disabilities adopted on 13 December 2006 (in Poland since 9 June 2012);International Labour Organization Convention No 111, 1958;The Treaty on European Union (O.J of 2004 No 90, Item 864, as further amended);Act of 3 December 2010 on the Implementation of Certain Provisions of the Eu-ropean Union in the Field of Equal Treatment (J.O. No 254, item 1700, as further amended);Regulation of the European Parliament and of the Council No 1303/2013 of 17 De-cember 2013 laying down common provisions on the European Regional Develop-ment Fund, the European Agricultural Fund for Rural Development, the Cohesion Fund, the European Social Fund, the European Maritime and Fisheries Fund and laying down general provisions on the European Regional Development Fund, the European Social Fund, the Cohesion Fund, the European Maritime and Fisheries Fund (OJ L 347, 20.12.2013, p. 320, as further amended);Regulation (EU) No 1304/2013 of the European Parliament and of the Council of 17 December 2013 on the European Social Fund and repealing Council Regulation (EC) No 1081/2006 (OJ L 347, 20.12.2013, p. 470);Partnership Agreement. Programming of the 2014–2020 fi nancial perspective;The European Disability Strategy for 2010–2020;The Council of Europe Action Plan to promote the rights and full participation of people with disabilities in society: improving the quality of life of people with dis-abilities in Europe in the years 2006–2015;Council Conclusions of 7 March 2011 on European Pact for Gender Equality 2011–2020 (JO C 155, 25.05.2011);The Universal Declaration of Human Rights. The declaration establishes that per-sons with disabilities have the inherent right to respect the human dignity. It should be understood that these people have the right to decent life, like any other person [The Universal Declaration... 1948];
In addition to the above-mentioned regulations the following acts related to people with disabilities should be listed:
Act on Vocational and Social Rehabilitation and Employment of Persons with Dis-abilities of 27 August 1997 with further amendments;
1)2)
3)4)5)
6)
7)
8)9)
10)
11)
12)
1)
144 P. Stolarczyk
Acta Sci. Pol.
Regulation of the Minister of Economy, Labour and Social Policy on disability iden-tifi cation and degree of identifi cation of 15 July 2003.
The Vocational Rehabilitation Act of 1997 developed and expanded the support sys-tem for people with disabilities in the labour market by creating better conditions to un-dertake work by this social group and by supporting skills development and expansion of institutions promoting this community [Ciura 2011].
The position of the United Nations is of considerable importance to the disabled com-munity. The crucial document in this regard is the UN Convention on the Rights of Per-sons with Disabilities which says that people shall have equal rights to live in dignity and independence and also takes into account the issues of full participation in the social life. The European Union is one of the signatories of this Convention [The EU Disability Strategy...].
Another already mentioned document that supports people with disabilities is the Eu-ropean Disability Strategy 2010–2020. It ensures the removal of barriers which make the daily functioning of people with disabilities diffi cult and implementation of privileges and rights which appertain to these people. It also supports all EU countries in the activi-ties and in conducting policies aimed at people with disabilities [Ciura 2011]. In addition to the employment, the Strategy covers other areas where the assistance will be provided. These are: accessibility, participation, equality, education, social protection and inclusion, health. Each fi eld is described in detail in the strategy [The EU Disability Strategy...].
Selected programs relating to the equalization of chances for persons with disabilities
In order to fi ll the principle of equal chances and anti-discrimination, the applicable national and international legislation should be obeyed and the policy tools relating to the disabled population should be used. These include [Branka 2010]:
raising public awareness about discrimination and regulations concerning equal treat-ment;introducing a policy of equality into the mainstream activities in each area;data analysing and collecting of information relating to the social groups vulnerable to exclusion and discrimination;using of specifi c compensatory measures.Countries belonging to the European Union set their own recruitment policy which
includes European guidelines. Signifi cant role in shaping the policy for people with dis-abilities plays also the observation and implementation of various standards aimed at re-solving issues concerning people with disabilities applied by other countries. In particular western countries such as France and Germany should be taken into consideration. The European strategy for 2020 assumes achieving an effective and sustainable growth with the employment rate at the level of 75%. Another aim of the strategy which is the reduc-tion of poverty by 20 million people is closely connected with the activity of persons with disabilities in the labour market.
The European Social Fund is quite a considerable support as it co-fi nances projects that increase employment chances for people at risk of exclusion. The European Regional Development Fund fi nancially supports the development of critical infrastructure in Eu-
2)
•
••
•

Equality of chances people with disabilities... 145
Oeconomia 15 (2) 2016
rope. The European countries are responsible for priorities in the area of funding and se-lection of suitable projects. The projects should be accessible to people with disabilities. Few of projects concerning disability were fi nanced within the program – PROGRESS – relating to the employment and social solidarity since 2007. The PROGRESS program is co-fi nancing the NGOs.
At European Union level there is also a European Employment and Social Innovation Programm (EaSI). This fi nancial instrument aims at promoting a high level quality and sustainable employment. Its task includes also the adequate and decent social protection. Another aspect of EaSI is to combat social exclusion and poverty as well as improving working conditions. In the fi nancial perspective of 2007–2013 the EaSI programm con-sisted of three parts: EURES and PROGRESS and Progress Microfi nance. Since 2014 these programmes form the three axes of EaSI. For the years of 2014–2020 total budget amounts to 919,469,000 (ec.europa.eu).
Fig. 3. The three axes of EaSISource: Own study.
The Operational Programme Knowledge Education Development included in the fi -nancial perspective 2014–2020, is important in the aspect of disabled people support. It strengthens the socio-professional integration of people with disabilities by [The Opera-tional... 2014]:
creating conditions for the development of instruments promoting employment and support of people with disabilities in the labour market;monitoring the activities of the state in the fi eld of disability and the situation and needs of people with disabilities;raising the competence of personnel working in the area of social inclusion and acti-vation of the disabled persons;improving the quality of social and health services as well as the care services for the disabled people. Priority Axis II: Effective public policies for the labour market, economy and educa-
tion includes the action 2.6 High-quality policies for social and work inclusion of people with disabilities which describes in details the objectives to be met by public entities. Imple-mentation of the UN Convention and the public and private entities initiative concentrates
•
•
•
•

146 P. Stolarczyk
Acta Sci. Pol.
on raising professional and social activation of persons with disabilities. The Operational Programme Knowledge Education Development facilitates the implementation of EU regulations into the Polish economy [Detailed Description... 2015].
The Strategy for the Development of Human Capital includes the people with dis-abilities aspect. There are specifi c objectives which cover the employment increase, which, among others, will be executed through overcoming the reluctance of employers and maintaining the employment and professional activity among people with disabili-ties. Another specifi c objective relates to the situation’s improvement of individuals and groups at risk of social exclusion, including people with different disfunctions of the body. This goal is being manifested by functioning of persons with disabilities in the open labour market and their access to the public services [Social Capital...].
Another strategy to support equal chances for people with disabilities is Social Capital Development Strategy. One of the horizontal rules of this strategy is to combat discrimi-nation which, among others, emerges from disability. The important aspect to be men-tioned is the directing of media education toward people at risk of social exclusion. The objectives of the Strategy include the actions aimed at reduction and prevention of digital exclusion [Social Capital...].
In Poland there are different entities, institutions and NGOs, etc. which take part in the professional activation of the disabled people. In accordance with the Article 34 of the Act on occupational and social rehabilitation, the Government Plenipotentiary for Disa-bled People was appointed. His tasks include [Act of 27 August 1997 on Vocational...]:
developing of governmental programmes projects related to solving problems of peo-ple with disabilities;initiating measures aimed at reducing the effects of disabilities and barriers hindering disabled people from taking part in the society;developing and providing opinions on legislation drafts concerning employment, re-habilitation and living conditions of persons with disabilities;cooperation with NGOs and foundations working for people with disabilities;setting the assumptions for the annual material and fi nancial plans relating to the im-plementation of the tasks resulting from the Act.The advisory body to the Government Plenipotentiary for Disabled People is the
National Consultation Council for Disabled Persons. It creates a platform for local au-thorities, government bodies and NGOs to support the functioning of disabled persons [Garbat 2013].
Additionally, a very important institution supporting the activation of disabled people in the country is the State Fund for Rehabilitation of Disabled Persons – PFRON – exist-ing since 1991. It is a state-owned fund for special purposes operating under the Act on occupational and social rehabilitation of 27 August 1997. The income of PFRON consists mainly of funds from the mandatory monthly payments from employers who do not em-ploy suffi cient number of staff members.
Assets of the Fund are aimed at social and vocational rehabilitation of people with disabilities and their employment. Here are some activities – areas supported by PFRON [PFRON 2015]:
compensation to the employers both from protected and open labour market for the higher costs resulting from hiring disabled people;
•
•
•
••
•

Equality of chances people with disabilities... 147
Oeconomia 15 (2) 2016
refund to the employers for the adaptation and equipment costs related to creation of the positions for disabled persons;fi nancing the creation and operation of occupational therapy workshops and voca-tional activity establishments;co-fi nancing of the EU system projects;support of individual disabled persons by:
providing grants to start a business, farm or contributing to a social cooperative,refunding the social security contributions,fi nancing the active labour market instruments for people registered as unem-ployed or seeking employment, etc.
In addition to the programs based on the EU funds, there are social policy instru-ments which can be supportive in equalizing chances for people with disabilities. The so-cial policy instruments can be divided as follows: economic, legal, information, staffi ng (human resources, human capital), space and time management instruments. Among the economic instruments one can fi nd consumer policy, which is regulated, among others, through the access to the paid employment; other instruments are cash benefi ts. Cash ben-efi ts under the social policy can be obtained from the social care, so-called MOPS (social welfare centres). Within these benefi ts there is a permanent allowance, a temporary al-lowance, designated and care benefi ts (including the nursing allowance, nursing benefi t), family allowances and family benefi ts supplements (www.mopr.bytom.pl).
CONCLUSION
The analysis conducted shows that the subject of the equal chances for groups of peo-ple particularly vulnerable to discrimination is still valid. Despite of so many national and international regulations the employment of people with disabilities is much lower than that of the whole society. It proves that the professionally inactive population exceeds the professionally active one in the group of people with disabilities. However, among non--disabled individuals the professionally active dominate over inactive ones. The measure of unemployment – the unemployment rate – is also higher among people with disabili-ties than among non-disabled persons. There are institutions in the Polish labour market supporting vocational activation of people who are at a disadvantage in it.
In addition to the labour offi ces, the signifi cant contribution to the promotion of the social and professional activation has the State Fund for Persons with Disabilities. It is due to supporting of various professional and personal development areas of people with certifi ed degree of disability and imposing sanctions on employers who do not comply with the requirement to employ the adequate number of persons with disabilities.
There are differences between the real situation and the legal status. The international and national documents provide guidelines on equality of chances for disabled people and prevention against professional and social exclusion. The current situation of people with disabilities in the labour market shows that the implementation of regulations is not easy and still does not bring the desired effects.
The Equal Opportunities Policy is facing a very big challenge which is to create the conditions that will guarantee the disabled persons equal chances with non-disabled
•
•
••
–––

148 P. Stolarczyk
Acta Sci. Pol.
persons, the execution of their civil rights and an activation increase in the open labour market. In accordance with the Constitution of the Republic of Poland every person has the right to work and therefore it is important to promote the employment in the labour market.
REFERENCES
Branka, M., Dunaj, M., Dymowska, M., Sekutowicz, K. (2010). Zasada równości szans w projek-tach Programu Operacyjnego Rozwój Polski Wschodniej – raport z badania ewaluacyj-nego [The principle of the equal chances in the projects of the Operational Programme Development of Eastern Poland – the report from the evaluation research]. Ministerstwo Rozwoju Regionalnego, Warszawa.
Ciura, G. (2011). Wyrównywanie szans osób niepełnosprawnych na polskim rynku pracy [Equal opportunities for people with disabilities in the Polish labour market]. Studia BAS 2 (26), 2011, 211–236.
Defi nicje – niepełnosprawność prawna, biologiczna oraz wg kryterium NSP i kryterium unijnego [Defi nitions – Legal disability, biological disability and disability according to the Natio-nal Census criterion and criterion of the EU].
Garbat, M. (2013). Aktywizacja zawodowa osób z niepełnosprawnością, bariery i koszty [Activa-tion of people with disabilities, barriers and costs]. Wyd. Uniwersytetu Zielonogórskiego, Zielona Góra.
Gazon, J. (2008). Ani bezrobocie, ani opieka społeczna. Od wyboru etycznego do ekonomicznej realizacji [Neither unemployment nor welfare. From an ethical choice to the economical implementation]. Wyd. Naukowe PWN, Warszawa.
Konwencja 111 Międzynarodowej Organizacji Pracy dotycząca dyskryminacji w zakresie zatrud-nienia i wykonywania zawodu przyjęta w Genewie dnia 25 czerwca 1958 r. [Convention 111 International Labour Organization concerning Discrimination in Respect of Employ-ment and Occupation, adopted in Geneva on 25 June 1958].
Kryńska, E., Kwiatkowski, E. (2013). Podstawy wiedzy o rynku pracy [Basic knowledge about the labour market]. Wyd. Uniwersytetu Łódzkiego, Łódź.
Powszechna Deklaracja Praw Człowieka z dnia 10.12.1948 r. [The Universal Declaration of Hu-man Rights adopted on December 10, 1948, New York].
Program Operacyjny Wiedza, Edukacja, Rozwój 2014–2020 PO WER 2014–2020 [The Operational Programme Knowledge, Education and Development for 2014–2020 OP KED 2014–2020], (2014). Ministerstwo Infrastruktury i Rozwoju, Warszawa.
Sawicka, J. (2012). Dylematy polityki równości szans kobiet i mężczyzn (polityki gender) w sferze społeczno-gospodarczej [In:] Problemy aktywności zawodowej osób z niepełnospraw-nością zamieszkałych na obszarach wiejskich [Professional activity problems of per-sons with disabilities in the rural areas]. J. Żbikowski, D. Dąbrowski, M. (Eds). Kuźmic-ki. Wyd. PSW, Biała Podlaska.
Sawicka, J. (Ed.), (2013). Rynek pracy na obszarach wiejskich Mazowsza – perspektywa gender [The labour market in rural Mazovian areas – the gender perspective]. Wyd. SGGW, Warszawa.
Sen, A. (2004). L-economie est une science morale. La Decouverte, Development as Freedom. Alfred Kopf, Paris.
Strategia UE w sprawie niepełnosprawności 2010–2020. Osoby niepełnosprawne są równoupraw-nione [The EU Disability Strategy for 2010–2020. People with disabilities have equal rights].
Strategia Rozwoju Kapitału Ludzkiego 2020 […], (2013). Strategy of Human Capital Development 2020 [...]. Ministerstwo Pracy i Polityki Społecznej, Warszawa.

Equality of chances people with disabilities... 149
Oeconomia 15 (2) 2016
Strategia Rozwoju Kapitału Społecznego 2020 […], (2013). Ministerstwo Kultury i Dziedzictwa Narodowego, Warszawa,
Szczegółowy Opis Osi Priorytetowych Programu Operacyjnego Wiedza Edukacja Rozwój 2014–2020 […], (2015). Ministerstwo Infrastruktury i Rozwoju, Warszawa [Detailed Description of Priority Axis of the Operational Programme Knowledge Education Deve-lopment 2014–2020 [...].
Ustawa z dnia 27 sierpnia 1997 r. o rehabilitacji zawodowej i społecznej oraz zatrudnianiu osób niepełnosprawnych [Act of 27 August 1997 on vocational and social rehabilitation and employment of persons with disabilities]. Dz.U. 1997 nr 123, poz. 776.
Wytyczne w zakresie realizacji zasady równości szans i niedyskryminacji, w tym dostępności dla osób z niepełnosprawnościami oraz zasady równości szans kobiet i mężczyzn w ramach funduszy unijnych na lata 2014–2020 [Guidelines for the implementation of the principle of equal chances and non-discrimination, including accessibility for people with disabili-ties and the principle of equal opportunities for women and men within the EU funds for 2014–2020], (2015). Minister Infrastruktury i Rozwoju, Warszawa,
Zasady metodyczne statystyki rynku pracy i wynagrodzeń [Methodical rules for the labour market statistics and salaries], (2008). GUS, Warszawa, p. 21.
RÓWNOŚĆ SZANS OSÓB NIEPEŁNOSPRAWNYCH NA RYNKU PRACY
Streszczenie. Osoby niepełnosprawne ze względu na swoją niepełnosprawność bardziej niż inni narażone są na dyskryminację i wykluczenie społeczne. Celem badań w artykule jest przedstawienie sytuacji osób niepełnosprawnych na rynku pracy w Polsce z perspek-tywy polityki równości szans. Równouprawnienie osób niepełnosprawnych przyczynia się do zwiększenia ich aktywności na rynku pracy. Z badań wynika, że ta grupa społeczna charakteryzuje się niższym współczynnikiem aktywności zawodowej i wskaźnikiem za-trudnienia niż pozostałe grupy zawodowe. Są różnice de facto i de legis w postrzeganiu równości szans osób niepełnosprawnych. De facto wskaźnik zatrudnienia wynosi w grupie osób niepełnosprawnych tylko niecałe 15%, natomiast w pozostałej populacji ponad 55%. W regulacjach prawnych krajowych i międzynarodowych, w konwencji o prawach osób niepełnosprawnych, państwa ratyfi kujące ten dokument uznają prawo osób niepełnospraw-nych do pracy na zasadzie równości z innymi osobami.
Słowa kluczowe: rynek pracy, równość szans osób niepełnosprawnych, Polska
Accepted for print: 21.04.2016
For citation: Stolarczyk P. (2016). Equality of chances for people with disabilities in the labour market. Acta Sci. Pol., Oeconomia, 15 (2), 139–149.

Oeconomia 15 (2) 2016, 151–161
ELECTRONIC MARKETPLACES AS A FORM OF ORGANIZATION OF TRADE IN ENTERPRISES
Dariusz StrzębickiWarsaw University of Life Sciences – SGGW
Abstract. The aim of this article is to assess the impact of new information technologies, in particular electronic marketplaces on the conducted transactions and transaction costs incurred by enterprises. An important goal was also an attempt to evaluate the role of transaction cost economics in explaining the development of B2B electronic marketplaces. The dominant approach in the analysis of this problem in the article was the transaction costs economics. Electronic marketplaces are information systems, which reveal the effect of the electronic broker. However, the economic reality shows that electronic markets also allow the effect of electronic integration. Transaction cost theory is useful in explaining the impact of information technology on transactions between businesses but should also be complemented by the results of research and analysis of other scientifi c theories, such as resources based view.
Key words: information technologies, electronic marketplaces, transaction costs
INTRODUCTION
Business-to-business (B2B) is an important part of the discipline of electronic com-merce. It includes the use of computer networks and other information technology in order to carry out transactions and cooperation between enterprises. Increasingly com-mon form of B2B e-commerce are electronic marketplaces that are such websites through which companies can trade commodity – money or to conduct cooperation in the supply chain. In the scientifi c literature the problem of the development of electronic market-places is considered, i.a. on the theory of transaction costs. Information technologies as a tool for information management are a natural area of interest for the transaction cost economics. Electronic marketplaces should be treated as information technologies
Corresponding author: Dariusz Strzębicki, Warsaw University of Life Sciences – SGGW, Faculty of Economic Sciences, Department of European Policy, Public Finance and Marketing,Nowoursynowska 166, 02-787 Warszawa, Poland, e-mail: [email protected]© Copyright by Warsaw University of Life Sciences Press, Warszawa 2016
ISSN 1644-0757eISSN 2450-4602
http://acta_oeconomia.sggw.pl

152 D. Strzębicki
Acta Sci. Pol.
of an inter-organization nature. The approach based on transaction cost economics can be helpful in the study of the use of information technologies and the changes they entail in the functioning of companies. Thanks to information technology, production and trade enterprises have access to new forms of business, as well as new ways of cooperation and implementation of transactions with trading partners.
The aim of this article is to assess the impact of new information technologies, in particular electronic marketplaces, on transactions and transaction costs incurred by the company. The article also attempt to assess the role of transaction cost economics in ex-plaining the use of information technology in business operations.
RESEARCH METHODS AND SOURCES OF INFORMATION
The paper presents theoretical considerations on the impact of information technol-ogy on the transaction costs of enterprises. The article includes analysis of electronic marketplaces in light of transaction cost economics. The literature review in the fi eld of B2B e-commerce has been conducted. It shows the dominant ideas found in the literature on electronic marketplaces. The main focus is on the functioning of commodity electronic B2B marketplaces. The structure of the paper consists of the following stages:
discussion of the assumptions of transaction cost economics;characteristics of information technologies supporting B2B business transactions;presentation of theoretical concepts related to information technologies with special emphasis on electronic marketplaces;discussion of the analysis and an attempt to assess the suitability of transaction cost economics in explaining the phenomena of the use of electronic marketplaces in trans-actions between enterprises.
ASSUMPTIONS OF TRANSACTION COST ECONOMICS
Transaction cost economics research focuses largely on the cost of organizing an ex-change. It is believed that an enterprise tends to organize transactions within its own organization to reduce the costs of transactions with third parties, the so-called market transaction costs [Williamson 1998]. An example of a departure from the external mar-ket transactions by the company is vertical integration. Vertical integration and the free market are two forms that are located on the two opposite poles of the possible forms of organizing transactions and exchanges by a company [Carlton and Perlof 2005]. Between these two extreme forms there are many possible different forms of contracting, coopera-tion and strategic alliances.
Market transaction costs are the costs of transactions with other market participants. They arise as a result of having to search business partners, monitoring them, and en-forcement of contractual arrangements. They can be divided into ex ante and ex post costs. The ex ante costs include: costs of design, negotiating, securing the contract. On the other hand, ex post costs include: monitoring, dispute resolution, negotiation costs. The ex ante and ex post costs often depend on each other. Lower incurred ex ante costs may result in higher incurred ex post costs and vice versa.
•••
•

Electronic marketplaces as a form of organization... 153
Oeconomia 15 (2) 2016
When an enterprise organizes transaction or exchange within its boundaries, transac-tion costs do not disappear because the market transaction costs are replaced by so-called costs of bureaucracy [Williamson 1998]. They have similar properties to the market trans-action costs, because the organizing transactions within the company is often associated with the coordination and negotiation. In addition, the costs of monitoring trading part-ners are replaced by the costs of monitoring of the company’s employees.
The main features of the transactions affecting the level of transaction costs in enter-prises are [Williamson 1998]:
specifi city of assets – defi ned as investments made to support individual transactions;uncertainty – originating from the diffi culty in predicting future market conditions and the behavior of trading partners;frequency – associated with the volume and repeatability of transactions between en-terprises.Transaction costs may be high for several reasons – uncertainty accompanying the
formulation of contracts, the complexity of the contracts, the need to monitor contracts, the need to enforce contract [Sloman and Hinde 2007].
Important aspects of transaction costs are ownership and coordination. Ownership, in many cases, provides information advantage over transactions with third parties, and thus lower transaction costs. Coordination involves costs for the establishment and operation of information channels. The methods of coordination can be in many cases independent of the ownership, in terms of whether the transaction takes place within the company or outside with trading partners. For example, a company may use market prices in transac-tions between its own departments.
On the commodity perfect markets, coordination of decision usually takes place through the price and quantity. On the other hand, with transactions other than opened market, it is frequently necessary to coordinate through the integration of decision-making processes. Reduction of the costs of such coordination may require special investment, which in turn increases the risk of the transaction. Transaction risk may be due to, among others, the pos-sible emergence of opportunistic behavior of business partners. Therefore, it be necessary to invest in more secure transactions, but these investments, in turn, increase costs.
According to transaction cost economics, in the economy one can observe balancing the economics of production (scale, scope, specialization) with transaction costs. Mar-ket transaction costs for companies constitute the limit of deepening economy of scale. Companies specializing in a particular area of activity reach a point where high market transaction costs are a barrier to further specialization [Bylund 2015].
ELECTRONIC MARKETPLACES AS MEETING POINTS OF BUYERS AND SELLERS IN THE CYBERSPACE
Enterprises use a variety of information technologies for the implementation and support of inter-organizational processes with trading partners. These include the [Bocij et al. 2006]:
network of connected computers and other electronic devices (including the Internet, intranet and extranet);
••
•
•

154 D. Strzębicki
Acta Sci. Pol.
software and website development tools which are e.g. Java and XML;electronic data interchange (EDI);operating information systems (in particular transaction processing systems TPS, of-fi ce automation systems OAS, process control systems);management information systems and data warehousing systems;systems of various departments of the enterprise, such as e-procurement systems, cus-tomer relationship management (CRM), accounting systems;resource planning systems ERP.The use of information technology in transactions takes many different forms and
is widely known as an electronic business (e-business) [Woźniakowski and Jałowiecki 2013]. Information technologies are part of the inter-organizational systems that exceed the boundary of a single company. On the commodity markets, eg. in the agri-food sec-tor most companies are developing in the fi rst place information technology focused on cooperation with other companies (B2B), and only secondarily they use information technologies in relationships with individual consumers (B2C) [Pizło 2007]. Also the websites of companies in the industry are more focused on business partners than on consumers [Strzębicki 2014].
Electronic marketplaces are a kind of inter-organizational information systems (IOS) [Wang et al. 2006]. An electronic marketplace is the system, which connects informa-tion systems of many companies. IOS differ in the degree of integration of information between companies and the degree of transaction completion. In particular, these differ-ences are noticeable among the electronic markets, which differ from one another in the degree of complexity, type and scope of services offered to companies and the scope of support for transaction [Grieger 2003].
In building inter-organizational information systems supporting B2B e-commerce, the increasing role is played by the technologies supporting the development of websites, such as Java and XML, and they reduce the importance of EDI in this regard [Williamson 2007]. As a result, it is more and more easier to create electronic connections between companies and electronic marketplaces using websites.
Electronic market can also be understood as a virtual meeting place for buyers and sellers, and transactions are made using electronic channels [Ganesh et al. 2004]. In con-trast to traditional marketplaces, in electronic markets buyers and sellers are not physi-cally present in these markets and can make transactions from any location with internet access. Goods are not physically present in the electronic marketplace which has to be compensated by an appropriate description of the goods in the electronic catalog. These markets can support all stages of the transaction beginning from the design stage and end-ing with delivery stage [Turban et al. 2006]. At the design stage electronic marketplaces can provide, e.g. supply planning, preparation of offer and description of goods. Informa-tion stage on electronic marketplaces is supported by enabling searching and comparing goods. Negotiation stage e-markets support by enabling electronic communications be-tween the transaction parties, or providing the opportunity to participate in the process of dynamic pricing in the auction. Delivery stage is supported by offering transport services and online tracking of goods.
The organized commodity e-markets play the role of intermediary functioning mainly at the wholesale level. Therefore, they take over many functions of distribution channels
•••
••
•

Electronic marketplaces as a form of organization... 155
Oeconomia 15 (2) 2016
performed by traditional intermediaries, becoming for them competitors and may displace them from the market. However, the process of replacing the traditional middlemen with the new cyber intermediaries is not obvious, because the traditional intermediaries still perform important functions, which are diffi cult to be replaced with new media [Schmitz 2000]. Besides, the traditional intermediaries are seeking to strengthen their position in the distribution system of goods through the use of information technology.
THE IMPACT OF ELECTRONIC MARKETS ON ORGANIZING THE EXCHANGE AND THE TRANSACTION COSTS
Transactions on the enterprise market are characterized by a great diversity. The way they are organized between businesses is often dependent on characteristics such as place of business in the supply chain, characteristics of the purchased goods, importance of the purchased product for the business, organization of row material supply. Trading enter-prises organize supply in a different way comparing to the production enterprises and usu-ally have to deal with a greater number of suppliers. Processing companies usually give greater importance to the purchase of raw material serving production of the fi nal prod-uct, comparing to the purchase of products supporting enterprise operation. What matters is also the quality policy and extent to which the quality and specifi c characteristics of the raw materials affect the quality and performance of the fi nal product. The organization of an exchange may be also affected by the organization of supply. For example, just-in-time supply method usually requires greater coordination with suppliers.
Some goods are subject to frequent and regular exchange with the same known sup-pliers, but some are purchased less frequently, irregularly and from random unknown suppliers. In many markets and in many sectors of the economy, such as food sector, increasingly important are becoming relations of cooperation between business partners [Cheng and Carrillo 2012]. Important reasons for this phenomenon are the demand fac-tors, among them the sophisticated consumer preferences and the associated less numer-ous and more diffi cult to serve market segments. However, some transactions made by the companies are conducted in the conditions in which the prevailing mechanism of coordination is price. Information technology can support different types of organizing transactions and exchange such as within the hierarchy, relations of cooperation, and market transactions. The information technology is seen as a factor having the potential to reduce transaction costs in each stage of a transaction.
Transaction costs are largely the result of a lack of information. Lack of information causes the decision making is accompanied by the risk and uncertainty. In enterprises there are many different kinds of risks associated with: the choice of inadequate vendor, failure to comply with terms of the contract, insuffi cient knowledge about the plans and intentions, incorrect predictions of demand, pursuit of the trading partner to use its posi-tion at the expense of the other party to the transaction, etc.
Information technologies tend to reduce the uncertainty in enterprises through [Leon-ard and Wilkinson 2014]:
increasing the ease and effi ciency of communication between employees of compa-nies approaching it almost to the level of face to face communication;
•

156 D. Strzębicki
Acta Sci. Pol.
greater access to information and sophisticated data analysis tools and the ability to use the digitally stored expertise, e.g. due to a more perfect decision support systems in enterprises;the ability of fi rms to use the data, which would not be available without the use of information technology;fast access to data from all levels of the organization;information on decisions in the enterprise that can be stored in computer memory and be used in future decision making;data mining giving access to information that are diffi cult to discern;the use of portable computers, optical scanners and other electronic devices that make it possible to monitor processes inside and outside the company;common database used by the company’s employees and business partners that con-tributes to reducing information asymmetry. The range of applications of information technology shows that they have the poten-
tial to reduce costs associated with the collection, storage and communication of informa-tion, which are components of the cost of coordination. On the other hand, information technologies have the potential to reduce transaction risk by reducing the specifi city of the transaction. It is believed that such features of information technology as intuitive interfaces, open standards, modularity and compatibility are very specifi c and do not in-crease investment sunk in specifi c relationships between enterprises [Clemons and Row 1992]. Information technologies can enable cost-effective monitoring of the counterparty, thus reducing the likelihood of opportunistic behavior [Cho and Tansuhaj 2011].
It is believed that there are two different effects of information technology having a signifi cant impact on the operation of enterprises in the market [Malone et al. 1987]:
the effect of the electronic broker – that relies on improving fi nding buyers and sellers and matching buy and sell offers;the effect of electronic integration – that relies on strengthening bilateral relations between the seller and the buyer.The brokerage effect is revealed to a large degree on electronic marketplaces. In
many scientifi c studies the development of electronic markets is being considered from the perspective of realization of the brokerage effect. An electronic marketplace is a kind of intermediary, broker, which allows to make business contacts and direct interaction between buyers and sellers. Electronic marketplaces are called “the new intermediar-ies” that perform market functions of matching buyers and sellers and discovering prices [Zwass 1996]. The result of the effi cient implementation of these functions is greater price transparency in the market and decreased price level.
Researchers mention many potential benefi ts of participation in e-marketplaces for businesses which are among other things: reduction of the search costs, more informa-tion on products and less dependence on a small number of suppliers [Dai and Kauffman 2002]. It is believed that if the electronic marketplace is expected to reach a large number of buyers and sellers it should deal with the trade of goods, which are easy to standardize [White et al. 2002]. By standardizing, transactions can be conducted without viewing the goods and there is greater price transparency. For a good operation of electronic market-places, it is important that sold quantities of goods are large and the users are keen on taking part in the dynamic process of pricing [Kaplan and Sawhney 2000].
•
•
••
••
•
•
•

Electronic marketplaces as a form of organization... 157
Oeconomia 15 (2) 2016
For the possibility of obtaining the brokerage effect on electronic marketplaces, com-monly found limiting factor is the market information asymmetry resulting from the fact that certain aspects of the quality of products on the commodity markets are known only to the seller [Varian 2002]. This can lead to negative selection, the reluctance to use the electronic marketplace by buyers and as a consequence to market failure. In addition, in many cases, a large complex description of the products can make the implementation of the electronic marketplace within the industry very diffi cult. Specifi cations of many goods also includes knowledge that can be diffi cult to clearly articulate which may also hinder the development of electronic marketplaces [Hsiao 2007]. So one can believe that the major constraints that make full use of the brokerage on electronic marketplaces is the problem of information asymmetry and the issue of assessment of the quality of products sold in electronic marketplaces.
The second characteristic result of information technology application is the effect of electronic integration. This effect manifests itself in particular in the operation of complex information systems, e.g. ERP (enterprise resource planning). The electronic integration can take place within a company, but also outside a company through the electronic inter-connection with trading partners.
Increasingly, also electronic marketplaces enable electronic integration effect. This is refl ected among other things in the kind and number of services offered for their par-ticipants. Many electronic marketplaces provide technologies that support the integra-tion and cooperation instead or in addition to the brokerage ability. Closer ties between participants in the electronic marketplace has a positive effect on the level of trust and cooperation, and consequently the reduction of transaction costs. Electronic marketplaces which are focused on integration enable cooperation, for example in the development of new products. Some electronic marketplaces function more as supporting processes of companies than as intermediaries of buying and selling [Christianse and Markus 2003]. These markets act as supportig systems for procurement processes and provide services for the integration of processes between businesses, and support cooperation in supply chains [Philipps and Meeker 2000]. The participation of enterprises in these electronic marketplaces can often result in the need to make big changes in business processes of these participating companies.
It is also worth noting that electronic markets also have the possibility of creating a multilateral network connections between businesses [Pagani 2013]. Cooperation in networks effectively determines the competitiveness of enterprises [Siudek and Zawojska 2014]. The result of electronic marketplaces operation may be the formation of verti-cally integrated network of loose connections. In such network companies work closely together using these electronic connections, while not being locked to each other can eas-ily change business partners and if needed quickly establish a new relationship of close cooperation using brokerage effect, which in turn has a large impact on reducing market transaction costs.
The impact of information technologies on the conduct of exchange may also be con-sidered from the perspective of resources based view (RBV). According to this approach, information technologies in enterprises are tools which allow to reap greater benefi ts from valuable assets of a company. This approach assumes that companies with a predomi-nance of high-value assets (which have a high value within a narrow range exchange)
158 D. Strzębicki
Acta Sci. Pol.
will seek to specialization, but companies with widely valuable assets (the value of which can affect a wide range of exchanges and commodities – corporate image, brand, relations with suppliers) will strive for vertical integration or diversifi cation [Miller 2004].
In enterprises with narrowly valuable assets, technologies which reveal the brokerage, such as electronic marketplaces, may enable faster specialization because they allow the companies to reduce the market transaction costs [Chatterjee et al. 2006]. On the other hand in companies with widely valuable asset information technologies that provide elec-tronic integration, e.g. ERP systems, are more likely to accelerate processes of vertical integration or diversifi cation. Enterprises can therefore benefi t from information technol-ogy usage to either specialization or vertical expansion and diversifi cation.
CONCLUSIONS
Information technologies facilitate and improve the exchange of information, goods, and conducting transactions between businesses. They make the communication within the company and outside with trading partners carried more effi ciently. Information tech-nologies have the potential to lower the costs of coordination and reduce risks of a trans-action. They also contribute to lower ex ante and ex post market costs. Therefore, they can support various forms of organizing the exchanges, including two extreme forms, which are hierarchy and market. Thanks to the possibilities of information technology, compa-nies can work closely together, but also fi nd and change business partners effi ciently.
The literature indicates two important effects of information technology, which refl ect the extreme forms of the organization of the transaction according to transaction cost economics. The effect of the electronic broker increases the importance and universality of market transactions. In turn, the effect of electronic integration encourages enterprises to strengthen cooperation with a small number of trading partners, and even to organize transactions within their own company.
An electronic marketplace as a meeting place for business buyers and sellers in cyber-space is based on many types of information technologies that support the implementa-tion of inter-organizational processes and various transaction stages. Electronic market-places represent inter-organizational information systems, which in a special way reveal the effect of the broker of information technology. Many e-marketplaces act as cyber intermediaries taking over the functions of traditional intermediaries and contributing to greater price transparency and expanding base of trading partners for businesses.
Economic reality shows that electronic marketplaces should be also analyzed in the context of electronic integration. Increasingly, electronic marketplaces enable integra-tion of information systems between enterprises and closer cooperation. In some markets electronic integration effect is of paramount importance, and the effect of the electronic broker is less important.
The brokerage effect and electronic integration effect is a manifestation of the impact of information technology on the transaction costs incurred by an enterprise. However, each of these effects has a stronger impact on different types of transaction costs. The electronic brokerage effect has a relatively greater impact on reducing the search costs, and the electronic integration effect on reducing the monitoring costs. The co-existence

Electronic marketplaces as a form of organization... 159
Oeconomia 15 (2) 2016
of these two effects in a single electronic marketplace causes that it becomes a network of cooperating companies that are not dependent on each other and can easily change partners if necessary. Thus, the electronic network of cooperation enables companies to reap the benefi ts of the transparent market, as well as close cooperation, while reducing transaction costs.
Economics of transaction costs is a very useful theoretical approach serving in the study of the effects of the use of information technology in transactions and coopera-tion between enterprises. However, the emergence of many new forms of electronic col-laboration between businesses makes it useful to look on other scientifi c approaches that provide a fuller picture of the role of information technology in organizing exchange in enterprises. An example of the other scientifi c perspective is resources based view, which indicates that the role of information technology in an enterprise is to facilitate the or-ganization of exchanges and transactions within or outside the enterprise, depending on its valuable resources.
REFERENCES
Bocij, P., Chaffey, D., Greasley, A., Hickie, S. (2006). Business Information Systems. III edn. Pear-son Education Limited, Essex, 228–301.
Bylund, P.L. (2015). Explaining fi rm emergence: specialization, transaction costs, and the integra-tion process. Managerial and Decision Economics, 36 (4), 221–238.
Carlton, W.W., Perlof, J.M. (2005). Modern Industrial Organization. IV edn. Pearson 2005, 395–396.
Chatterjee, D., Segars, A., Watson, T. (2006). Realizing the promise of e-business: Developing and leveraging electronic partnering options. California Management Review, 48 (4), 60–83.
Cheng, L., Carrillo, E. (2012). Assessing supplier performances under partnership in project-type procurement. Industrial Management & Data Systems, 112 (2), 290–312.
Cho, G., Tansuhaj, P. (2011). Electronic intermediaries: research and practice of electronic interme-diaries in export marketing. Innovative Marketing, 7 (3), 69.
Christianse, E., Markus, L. (2003). Participation in collaboration electronic marketplaces. Procce-dings of Hawai International Conference on System Science, Hawai, 1–8.
Clemons, E., Row, M. (1992). Information technology and industrial cooperation: the changing economics of coordination and ownership. Journal of Management Information Systems, 9 (2), 18–19.
Dai, Q., Kauffman, R. (2002). Business Models for Internet-based B2B Electronic Markets. Inter-national Journal of Electronic Commerce, 26 (4), 41–72.
Ganesh, J., Madanmohan, T.R., Seshadri, J., Seshadri, S. (2004). Adaptive Strategies of Firms in High-Velocity Environments: The Case of B2B Electronic Marketplaces. Journal of Global Information Management, 12 (1), 41–59.
Grieger, M. (2003). Electronic marketplaces: A literature review and a call for supply chain man-agement research. European Journal of Operational Research, 144, 280–294.
Hsiao, R. (2007). Misaligned market: The importance of industry context in technology-mediated exchanges. Journal of Global Information Management, 15 (3), 69–87.
Kaplanm, S., Sawhneym, M. (2000). E-Hubs: The new B2B marketplaces. Harvard Business Re-view, 78 (3), 97–104.

160 D. Strzębicki
Acta Sci. Pol.
Leonard, J.C., Wilkinson, T.J. (2014). Market and bureaucracy costs: the moderating effect of In-formation technology. Academy of Information and Nanagemen Sciences Journal, 17 (2), 81–97.
Malone, T.W., Yates, J., Benjamin, R. (1987). Electronic Markets and Electronic Hierarchies. Com-munications of the ACM, 30 (6), 484–497.
Miller, D.J. (2004). Firm’s technological resources and the performance effects of diversifi cation: A longitudial study. Strategic Management Journal, 25, 1097–1119.
Pagani, M. (2013). Digital business strategy and value creation: Framing the dynamic cycle of control points. MIS Quarterly, 37 (2), 617–632.
Philipps, C., Meeker, M. (2000). The B2B Internet Report: Collaborative Commerce. Morgan Stan-ley Dean Bitter Research.
Pizło, W. (2007). Możliwości i ograniczenia marketingu internetowego w polskich przedsiębior-stwach przemysłu spożywczego. Acta Scientiarum Polonorum, Oeconomia, 6 (1), 51–60. (English Abstract).
Schmitz, S. (2000). The Effect of Electronic Commerce on the Structure of Intermediation. Journal of Computer-Mediated Communication, 5 (3), 20–21.
Siudek, T., Zawojska, A. (2014). Competitiveness in the economic concepts, theories and empirical research. Acta Scientiarum Polonorum, Oeconomia, 13 (1), 91–108.
Sloman, J., Hinde, K. (2007). Economics for Business. IV edn. Pearson Education Limited. Essex, 42–43.
Strzębicki, D. (2014). The diversity of marketing activities on the websites of Polish dairy coopera-tives. Acta Scientiarum Polonorum, Oeconomia, 13 (2), 127–136.
Turban, E., King, D., Viehland, D., Lee, J. (2006). Electronic Commerce 2006: A Managerial Per-spective. Pearson Prentice Hall, Upper Saddle River, 138–139.
Varian, H. (2002). Mikroekonomia [Microeconomics], PWN, Warszawa.Wang, S., Archer, N., Zheng, W. (2006). An Exploratory Study of Electronic Marketplace Adop-
tion: A Multiple Perspective View. Electronic Markets, 16 (4), 336–338.White, A., Daniel, E., Ward, J. Wilson, H. (2002). The adoption of consorcium B2B e-market places:
an exploratory study. Journal of Strategic Information Systems, 16, 71–103.Williamson, E.A. (2007). An evaluation of inter-organisational information systems development
on business partnership relations. International Journal of Business Science and Applied Management, 2 (3), 37–38.
Williamson, O.E. (1998). Ekonomiczne instytucje kapitalizmu. Wydawnictwo Naukowe PWN, Warszawa.
Woźniakowski,T., Jałowiecki, P. (2013). IT systems adoption and its impact on the foodand agricul-tural sector. Acta Scientiarum Polonorum, Oeconomia, 12 (1), 45–55.
Zwass, V. (1996). Electronic Commerce: Structures and Issues. International Journal of Electronic Commerce, 1 (1), 3–23.
RYNKI ELEKTRONICZNE JAKO FORMA ORGANIZOWANIA WYMIANY HANDLOWEJ W PRZEDSIĘBIORSTWACH
Streszczenie. Celem artykułu jest określenie oddziaływania nowych technologii infor-macyjnych, a w szczególności rynków elektronicznych, na zawierane transakcje oraz po-noszone koszty transakcyjne przez przedsiębiorstwa. Ważnym celem była również pró-ba oceny roli ekonomii kosztów transakcyjnych rozwoju rynków elektronicznych B2B. Dominującym podejściem w analizie tego problemu w artykule jest ekonomia kosztów transakcyjnych. Rynki elektroniczne są systemami informacyjnymi, w których ujawnia się efekt brokera elektronicznego. Jednakże rzeczywistość gospodarcza pokazuje, że rynki
Electronic marketplaces as a form of organization... 161
Oeconomia 15 (2) 2016
elektroniczne umożliwiają także integrację elektroniczną. Teoria kosztów transakcyjnych jest przydatna w wyjaśnianiu wpływu technologii informacyjnych na transakcje między przedsiębiorstwami, lecz powinna być również uzupełniana przez wyniki badań i analiz innych teorii i nurtów naukowych, jak np. podejścia bazującego na zasobach.
Słowa kluczowe: technologie informacyjne, rynki elektroniczne, koszty transakcyjne
Accepted for print: 21.04.2016
For citation: Strzębicki D. (2016). Electronic marketplaces as a form of organization of trade in enterprises. Acta Sci. Pol., Oeconomia, 15 (2), 151–161.


Oeconomia 15 (2) 2016, 163–172
EVALUATING THE POTENTIAL OF SPORTS EVENTS AS TOOLS OF PROMOTION FOR CITIES AND REGIONS ON AN INTERNATIONAL SCALE
Zygmunt WaśkowskiPoznan University of Economics and Business
Abstract. One of the objectives of sports events is to achieve a promotional effect in the host city and to strengthen its international image. Some cities or regions organise sports events regularly, whereas others do it occasionally. Both the former and the latter strategy of using sports for the image-creating purposes has its pros and cons. This article focuses on the potential benefi ts related to the promotion of a place through sport. A typology of sports events based on own elaboration was used for this purpose.
Key words: sport marketing, sports events, marketing communication
INTRODUCTION
More and more cities try to build their image through the organization of sports events. This tendency became even more evident in 1992, when the so-called Barcelona effect was noted – Barcelona became a few hundred percent more popular from a touristic point of view, after the city hosted the Olympic Games. Thus, sport appears to have a consider-able potential with respect to the promotion, not only of sponsors’ brands, but also cities, regions and countries that are actively engaged in its development and popularisation. However, not every event triggers the same positive effects and many cities fi nd it dif-fi cult to exploit this opportunity.
This is why the article’s main goal is to analyse sports events and their promotional po-tential, which could be used for building the international image of their host locations.
Apart from identifying some important characteristics of a sports event which deter-mine its value as a promotional tool, the article also mentions a few threats related to the use of sports for the promotion of a region.
Corresponding author: Zygmunt Waśkowski, Poznan University of Economics and Business, Al. Niepodległości 10, 61-875 Poznań, Poland, e-mail: [email protected]© Copyright by Warsaw University of Life Sciences Press, Warsaw 2016
ISSN 1644-0757eISSN 2450-4602
http://acta_oeconomia.sggw.pl

164 Z. Waśkowski
Acta Sci. Pol.
Information from primary and secondary sources was used in this study. Additionally, it was based on: literature studies, accessible reports from research of the sports market, the results of own research and opinions of experts the author had the opportunity to talk to.
THE PROMOTIONAL ASPECT OF SPORTS EVENTS
A deepened analysis of sports as a part of a broadly defi ned physical culture leads to a conclusion that its importance has changed dramatically over the last few decades [Watt 2003]. The socio-economic aspect of sports has become the subject of research conducted by numerous management, marketing, sociology and psychology specialists. The market behaviour of sports-organising entities, mainly sports clubs, as well as entities that benefi t from the event, increasingly frequently lead to creating not only a sports event, which was once a target on its own, but also more importantly, to its economic, social, cultural, po-litical or even religious use [Polus 2009, Greenwell et al. 2014]. According to B. Mullin, one of the most prominent sports marketing specialists, exercises and sports events are two basic products offered on the sports market. All other tangible and intangible sports products are derived from them and exist for the sake of the creation or the consump-tion of the two basic ones [Mullin 2000]. With reference to the subject of this article, the author will primarily focus on sports events and their potential in the context of the promotional activities of local government units.
According to its defi nition, a sports event is asingle element of a wider programme or a group of elements that combined form a defi ned event [Pope and Turco 2001]. Each sports event has four distinctive features: it necessarily has to have a specifi ed location, named performers, an audience and a set time of duration. Sports contests are organised with rivalry in mind, and their levels may be very diversifi ed. The level, usually com-bined with the range of spatial infl uence, is one of the criteria most frequently used for the division of sports events into categories. As a matter of fact, this factor determines the promotional potential of an event (Fig. 1).
Fig. 1. The promotional potential of sports eventsSource: Own elaboration.

Evaluating the potential of sports events as tools... 165
Oeconomia 15 (2) 2016
It is essential to point out that not all sports events with the same infl uence range have the same promotional potential. The popularity of the sports discipline plays an equally signifi cant role in this respect. For numerous disciplines which are popular only in certain regions of the world (for example: rugby in the Republic of South Africa, cricket in India, judo in Japan), even the world championships will not provide an opportunity for the sponsors to create their brand image globally [Lagae 2005].
Within the classifi cation based on the range of infl uence, regional, national, interna-tional and global events can be distinguished. The last category can be divided into the so-called major events and mega events1 [Mallen and Adams 2013]. The higher the level of sportspeople’s rivalry, the more of a show the event becomes, and consequently, the more attention it receives from the fans. At times their number amounts to thousands of spectators present at the stadiums and arenas and millions of those watching the competi-tion on TV or online. Such quantity of spectators has the potential of affecting numerous stakeholders’ view on these events. From the marketing point of view, the most important segment of the sports events market is made of spectators, who can be divided into those who watch the event directly and indirectly.
The promotional potential of sports events is rather widely acknowledged and docu-mented. For about four decades numerous enterprises have been benefi ting from this po-tential, usually by engaging in sponsorship deals with sportspeople, sports clubs or sports events. At present, it is estimated that globally the expenses related to this form of activity amount to more than fi fty billion dollars. The so-called celebrity endorsement, i.e. using the image of top-range sportspeople in promotional campaigns, is a popular promotion tool among companies. According to estimations, celebrities related to sports, music or fi lms appear in almost 10% of the world’s commercials [Agrawal and Kamasuka 1995].
THE RELATIONSHIPS BETWEEN SPORTS EVENTS AND THE DEVELOPMENT OF SPORTS TOURISM
Local governments attach a special signifi cance to the fact that sports events attract visitors from other regions, as this creates an opportunity of promoting their town, city, or region. These visitors are perceived as current or potential tourists, whose excursions organised as a part of the so-called passive sports tourism can directly translate into a number of benefi ts for the city [Tribe 2003]. It is worth mentioning that for more than ten years sports tourism has been among the fastest developing segments of world tour-ism market (www.businesswire.com). For example, it is estimated that in the United States the total turnover from sports tourism equals nearly thirty billion dollars annually [Greenwell et al. 2014]. One of sub-categories of the widely defi ned sports tourism is sports events tourism. According to literature, this term can be defi ned as “travelling with the main target of competing, seeing or supporting the sportsmen during organised sports
1 Meg-events – are sports events of the global range which are the subject of common interest; they include, for example: the Olympics, championships of the most popular sports, or the football Champions League. Major events – sports events of global range which are the subject of interest of the specifi ed sports’ fans, for example the tennis Grand Slam, Formula 1 car races, the Dakar Rally, or the biggest marathon runs in New York, Chicago, Boston, London, Berlin or Tokyo.

166 Z. Waśkowski
Acta Sci. Pol.
events” [Gibson et al. 1998]. Having this group of tourists in mind, the local governments engage in organising sports events, in hope that this way of promoting the region will result in its wider recognition, popularity as a vacation destination and, indirectly, a better investment potential.
According to B. Pitts, who is a sports marketing specialist, two types of sports tour-ists, that is – passive (watching sports events) and active (participants of competitions), are crucial to the development of tourism [Pitts 1999]. M. Derry, L. Jago and L. Fredline have a similar opinion – they say that more and more frequently organised sports events of different characters is what drives tourist activity in cities [Derry et al. 2004].
SPORTS EVENTS AS A MEANS OF MARKETING COMMUNICATION OF CITIES AND REGIONS
Some time ago sports became another attractive medium used to create the image of cities and regions [Hoyle 2002]. It is related to the fact that local entities, such as cities, voivodeships, or countries, in some areas of their activity have to abide by the market rules, like many other entities. The competition between regions or agglomerations is what successfully accelerates their development – this is an effect that obviously could have not been achieved without the additional encouragement in the form of rival cities’ market activity, aimed at attracting tourists, investors, or even new citizens or the media coverage.
One of the relatively constant elements of a city’s competitive advantage is its posi-tive and strong image, which currently plays a very important role in the enhancing the city’s market position or building and strengthening relationships with stakeholders. This is why, marketing orientation (on the concept level) and promotional activity (on the op-erational level) have become so crucial to local governments over the past several years [Kotler and Lee 2008]. To create a strong and coherent image, not only high expenditure and a wide range marketing tools are needed, but also an idea, time, consistency and co-herence of actions that together form a city’s promotional strategy [Altkorn 2004]. As the image should not be random or incoherent, it is essential to start by defi ning the desired image in terms of the associations it is supposed to evoke in the stakeholders’ minds upon hearing the city’s name. This approach to building to a city’s image requires a thorough selection of promotional tools and actions with a view to the achievement of the desired effect. It is important to be aware of the city’s current image, because it will be an indica-tion of the discrepancy of the present image and the desired one. In a situation when turns out that the desired image is unattainable, even in a long perspective, it is recommended to defi ne a so-called optimal image. Therefore, benchmarking, i.e. referring one’s actions to the solutions of others, is a relatively common strategy in cities’ and regions’ promo-tional policy.
Sports are a part of social life that for a long time has been perceived positively, both by those who practice them and those who watch them. Depending on the discipline, it is usually associated with activity, health, strength, determination, beauty, grace, speed, and above-average skills. Sport is also a source of many, often extreme, emotions. For some people it is a way to relax, deal with stress etc. [Hoye et al. 2006]. Additional incentives
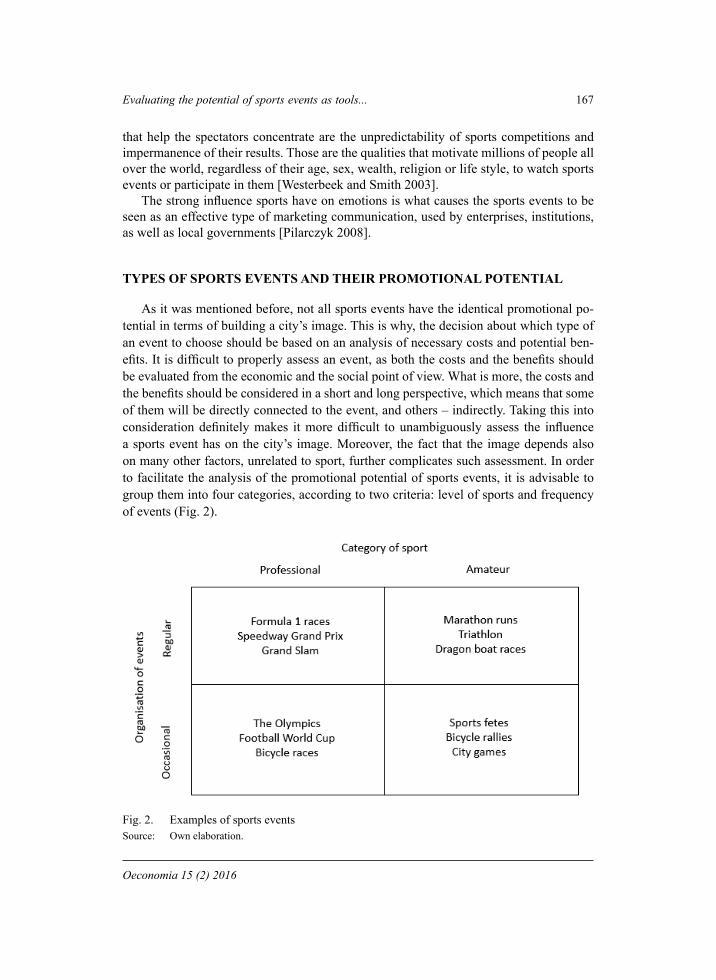
Evaluating the potential of sports events as tools... 167
Oeconomia 15 (2) 2016
that help the spectators concentrate are the unpredictability of sports competitions and impermanence of their results. Those are the qualities that motivate millions of people all over the world, regardless of their age, sex, wealth, religion or life style, to watch sports events or participate in them [Westerbeek and Smith 2003].
The strong infl uence sports have on emotions is what causes the sports events to be seen as an effective type of marketing communication, used by enterprises, institutions, as well as local governments [Pilarczyk 2008].
TYPES OF SPORTS EVENTS AND THEIR PROMOTIONAL POTENTIAL
As it was mentioned before, not all sports events have the identical promotional po-tential in terms of building a city’s image. This is why, the decision about which type of an event to choose should be based on an analysis of necessary costs and potential ben-efi ts. It is diffi cult to properly assess an event, as both the costs and the benefi ts should be evaluated from the economic and the social point of view. What is more, the costs and the benefi ts should be considered in a short and long perspective, which means that some of them will be directly connected to the event, and others – indirectly. Taking this into consideration defi nitely makes it more diffi cult to unambiguously assess the infl uence a sports event has on the city’s image. Moreover, the fact that the image depends also on many other factors, unrelated to sport, further complicates such assessment. In order to facilitate the analysis of the promotional potential of sports events, it is advisable to group them into four categories, according to two criteria: level of sports and frequency of events (Fig. 2).
Fig. 2. Examples of sports eventsSource: Own elaboration.

168 Z. Waśkowski
Acta Sci. Pol.
Sports events with professional participants are defi nitely more effective in creating the city’s image internationally. Such events are popular and as such they have the media’s, sponsors’, business partners’, and sport fans’ support. They are also noticed by the citizens, even those who are not regularly interested in sports, though in most cases they tend see the event negatively. To effectively play their promotional role, such events should be rec-ognised internationally. Other advantages are: the level of competition, the participation of well-known sportspeople and the prize. Barcelona experienced the positive results of the organisation of a big sports event in 1992. After the Olympic Games, which were held there, the city changed from an unattractive and shabby location into a development leader and a Catalonian “must see” for tourists from all over the world. The growth of tourist interest in this city was called “the Barcelona effect” and it became the source of an inspiration for other cities, which from that momenton started to support sports more actively.
Professional sports events can be organised in one place regularly or occasionally, in which case each time the event is held in a different city. Examples of events regularly held in the one place are: the speedway Grand Prix competition (Prague, Gorzów Wielko-polski, Krsko and other), tennis Grand Slam tournaments (Melbourne, Paris, New York, London), Formula 1 races (Monaco, Budapest, Silverstone and others), light athletics Golden League track meetings (Zurich, Berlin, Oslo, Rome and other), or ski jumping tournaments (Zakopane, Obersdorf and other). The Olympics, football EURO Cup, pro-fessional boxing galas or multistage cycling tournaments (with the route going through different cities each year) are examples of events occasionally organised in a place.
Considering the wish to create a city’s/region’s international image, the main ad-vantage of sports events organised regularly is the fact that they are repetitive. Events organised with the constant frequency, usually once a year, are remembered by sports fans, strengthen the association between the event and the city, and successfully transfer the excitement felt during the competition onto the emotional attachment to the location [Mallen and Adams 2008]. Nevertheless, it should be remembered that a city’s image is created not only on the basis of what is happening at its sport arenas. What accompanies the sports events is of an equal importance, for example, available ways of spending free time, the gastronomic offer, or the way in which tourists are seen and treated by the in-habitants. Nice personnel in restaurants, high-standard hotels, effi cient law-enforcement forces (such as the police), transport infrastructure, the city’s marking, volunteers’ sup-port and friendly citizens will play a key role. This means that the city’s image depends on a number of factors, both directly and indirectly related to sports. The prerequisite of success is convincing all the above mentioned entities about the potential benefi ts to the city as a whole and making it clear that these benefi ts will depend on the common organi-sational effort, based on mutual trust and on formerly built partnerships.
If the event is organised in a different place each time, a city’s international image needs to be created by different means. In such cases it is crucial that the event should be on a large scale and have a wide media coverage, otherwise it will not play its promo-tional role. Some examples of such events are the Olympic Games or the football World Cup. What is special about these events is the fact that the media inform people that an event is to be organised long before it actually takes place and its location is frequently presented in a positive way [Davis 2008]. Still, the local government has to put more ef-fort into publicity than it would be necessary if the event was organised regularly. The

Evaluating the potential of sports events as tools... 169
Oeconomia 15 (2) 2016
whole communication strategy has to be based on the way the place is to be perceived and remembered by potential consumers. This is why the organisation of occasional events hosted in different places usually means higher costs and more effort, which only few cities can afford. As for smaller events, for example cyclists participating in a competition passing through a city, their character is rather local. Their main task is to mobilize the citizens, capture their interest, make them feel proud and happy to be able to welcome the sportsmen, even if only for a moment. Promotional infl uence outside the event’s location is usually limited to signalising one’s own tourist attractions, shown for a moment during the TV relation, captured on reporters’ photos or named by radio speakers.
Large-scale, professional sports events receive a wide media coverage. Depending on the level of the event, the information about it appears in the media long before its begin-ning, as well as during the event and after it. It is common for sports journalists to visit the place where an event is to be held and present this location to the spectators or readers, encouraging them to visit it and show their support. For example, the media in more than a hundred countries began talking about the four Polish cities to host the UEFA EURO 2012 as early as two years before the tournament. The event, which lasted three weeks, was watched in more than two hundred countries. Mikołaj Piotrowski, the Communica-tion Director at PL2012+ sp. z o.o. sees the success of the event also in the fact that during the tournament 677 thousand tourists from 123 countries visited Poland. Exactly 79% of them declared they wanted to visit Poland again, and 92% – that they will recommend the country as an attractive tourist destination.Telewizja Polska aired hundreds of hours of transmissions, retransmissions and other programmes related to football matches, thereby strengthening the images of the host cities among fans, journalists, sports activists and politicians. According to Czesław Lang, the director of the Tour de Pologne race, this event always receives a live coverage by Telewizja Polska as well as French Eurosport, which broadcasts in 60 countries and in 20 languages. Tour de Pologne, along with Tour de France or Giro d’Italia, belongs to the 27 most important bicycle races in the world, which together form the so-called World Tour. There are also smaller events that are worth mentioning, such as the Kamila Skolimowska’s Memorial in Warsaw. Usain Bolt, the Jamaican world record-holder participated in it and fans of light athletics from more than 50 countries watched the event either on TV or at the stadium. These three examples demonstrate the reach of the media’s infl uence on sports events, which, in turn, create the image of their host cities.
Undoubtedly local governments are willing to organise big sports events mainly be-cause of the possible promotional and image-creating results they may bring and with the hope for long-term economic and social effects. For example, every year a few dozen cities are interested in having the world’s best cyclist race on their streets apply to be one of the host cities of Tour de France, Giro d’Italia or Tour de Pologne.
Obtaining the right to organise a large-scale sports event is a complicated task and it always involves high expenses for the proper preparation of the sports, hotel, gastronomic and transport infrastructure [Mallen and Adams 2008]. If the event is held in a different place each time, the endeavours begin usually a few years before the event. The neces-sary requirements set by sports federations, which grant the rights to organise an event, are so high that some cities initially interested in the competition decide to resign due to the costs disproportionate to possible benefi ts. The International Olympic Committee

170 Z. Waśkowski
Acta Sci. Pol.
faced such situations on numerous occasions in the process of selecting of the following Olympic Games.
Another group of sports events that can be used to create a city’s image are amateur sports events. In the context of building an international image, the primary focus is on regularly organised events, such as marathon runs or triathlons. These sports that are the most popular among amateur sportsmen, who often travel from very distant countries in order to participate in them [Wicker et al. 2012]. Participants from 100–150 countries run in the marathon runs that are considered the world’s elite ones. Each marathon runner from a different city is usually accompanied by 1–2 people and they spend 3–4 days in the city [Waśkowski 2014a]. According to S. Gammon’s and T. Robinson’s estimations, each year there are a few dozens of million people participating in such events. These research-ers use the name “strong marathon tourists” for the competitors who participate in marathon runs and the name “soft marathon tourists” for those who accompany them [Gammon and Robinson 1997]. Also in Poland the popularity of running resulted in the organisation of numerous marathon runs in cities that wish to build their sports image. Besides the well--known runs in cities such as: Poznań, Warsaw, Cracow and Wrocław, there are others, for example in: Bydgoszcz, Gdańsk, Szczecin, Kołobrzeg, Białystok etc.
Amateur mass sports events have their promotional potential and can be used to build a city’s image. However, it needs to be pointed out that, due to their specifi cs and lesser interest of the media, their role is basically limited to the supporters of a sports discipline [Waśkowski 2014b].
The last category of sports events are those organised sporadically or only once, in most cases meant for the people who wish to spend their free time in an active way. For example, these are sports fetes, competitions held to celebrate a national holiday or re-lated to local traditions. Their level of organisational diffi culty and necessary costs are relatively low, but their effectiveness in promoting the city is proportionally low as well. They defi nitely cannot be treated as the main tool of building the international image.Instead, they should be included in the promotional strategy based on different sports--related and other events and act as a supplement to the strategy. Nevertheless, these events can be used to create an image of an active city among its citizens, which should not be ignored by the government.
THE THREATS TO A CITY’S IMAGE RELATED TO THE ORGANISATION OF A SPORTS EVENT
Unfortunately, there are situations, particularly in professional sports, which may pos-sibly harm the sports’ image, consequently weakening its potential as a promotional tool for various entities. For example, the corruption scandal in the Russian light athletics se-verely harmed the country’s image, and the Russian participants may even not be allowed to participate in the upcoming Olympic Games in Rio de Janeiro. The death of a runner participating in the Poznan Marathon in 2013 negatively affected the international run-ning environment, also due to the wide media coverage of this accident. According to the run’s director, the media were more interested in the accident than in the marathonas such. The numerous casualties of the constructionprocess of the sports arenas prepared for the

Evaluating the potential of sports events as tools... 171
Oeconomia 15 (2) 2016
Olympic Games in Beijing, or the pollution of the natural environment in Brazil (the host of the next Olympic Games) did not go unnoticed, either. The negative associations are always directly related to the sports event itself, but at the same time they indirectly infl u-ence the location where it took place.
CONCLUSIONS
A closer analysis of the image-building effects achieved in the past by cities or regions associated with sports events allows for a conclusion that hosting such events is an effec-tive form of promotion which increases the attractiveness of these places, for example as tourist destinations. These are primarily big cities, such as: London, Berlin, Barcelona, Tokyo, and in Poland: Poznań, Wrocław, Gdańsk, Bydgoszcz, that seize this opportunity of promoting themselves.
It is an exceptionally diffi cult task to assess a promotional potential of sports events in the context of image-building. This is mainly due to the fact that it is problematic to unambiguously relate the effects that have been achieved to merely one event. The image is created by a number of factors, such as: actions, experiences, other people’s opinions, as well as the information presented by the media. The promotional potential of an event depends only on a variety of factors as well, for example: whether a sports discipline is popular in the target group of customers, whether the event will be broadcast by the media, the level and range of rivalry involved in the event, and whether it is organised regularly or only once in a place. It needs to be pointed out that if an event is ill-adapted to the other instruments of the marketing communication in the region, it will not play the expected image-building role by itself.
OCENA POTENCJAŁU WYDARZEŃ SPORTOWYCH JAKO NARZĘDZIA KREOWANIA WIZERUNKU MIAST I REGIONÓW NA ARENIE MIĘDZYNARODOWEJ
Streszczenie. Duże wydarzenia sportowe organizowane są między innymi z nadzieją na uzyskanie przez miasta, w których się odbywają, promocyjnego efektu i wzmocnienie wi-zerunku na arenie międzynarodowej. W niektórych miastach lub regionach takie impre-zy organizowane są okazjonalnie, w innych odbywają się cyklicznie. Zarówno jedna, jak i druga strategia wykorzystania sportu dla celów wizerunkowych ma swoje zalety i wady. W artykule dokonano identyfi kacji potencjalnych korzyści, jakie płyną z promocji destyna-cji poprzez sport w zależności od rodzaju imprezy. Uwzględniono przy tym zaproponowa-ną własną typologię wydarzeń sportowych.
Słowa kluczowe: marketing sportowy, imprezy sportowe, komunikacja marketingowa
REFERENCES
Agrawal, J., Kamasuka, W.A. (1995). The Economic Worth of Celebrity Endorsers. Journal of Marketing, 59.
Altkorn, J. (2004). Wizerunek fi rmy. Wyd. Wyższej Szkoły Biznesu w Dąbrowie Górniczej, Dąbro-wa Górnicza (in Polish).

172 Z. Waśkowski
Acta Sci. Pol.
Budzyński, W., (2002). Wizerunek fi rmy. Poltext, Warszawa (in Polish).Covell, D., Walker, S., Siciliano, J., Hess, P. (2007). Managing Sports Organizations. Butterworth-
-Heinemann, Burlington.Davis, J.A. (2008). The Olympic Games Effect. John Wiley & Sons, Singapore. Deery, M., Jago, L.L., Fredline, L. (2004). Sport Tourism or Event Tourism: Are They One and the
Same? Journal of Sports & Tourism 9 (3), 235–245.Gibson, H., Attle, S., Yiannakis, A. (1998). Segmenting the sport tourist market: A lifespan perspec-
tive. Journal of Vacation Marketing.Gammon, S., Robinson, T. (2003). Sport and tourism: A conceptual framework. Journal of Sport
Tourism, 8 (1), 21–26.Greenwell, T.Ch., Danzey-Bussell, L.A., Shonk, D.J. (2014). Managing Sports Events. Human Ki-
netics, Champaign, IL. Hoye, R., Smith, A., Westerbeek, H., Stewart, B., Nicholson, M. (2006). Sport Management. But-
terworth-Heinemann, Burlington.Hoyle, L.H. (2002). Event Marketing. John Wiley & Sons, New York.Lagae, W. (2005). Sports Sponsorship and Marketing Communications. Pearson Education, Harlow. Mallen, Ch., Adams, L.J. (2008). Sport, Recreation and Tourism Event Management. Butterworth-
-Heinemann, Burlington.Mallen, C., Adams, L.J. (2013). Traditional and niche events in sport, recreation and tourism. [In:]
Event management in sport, recreation and tourism. Routledge, Oxfordshire.Mullin, B.J., Hardy, S., Sutton, W.A. (2000). Sport Marketing, Human Kinetics. Champaign Na-
tional Runner Survey “Running USA” 2013.Pilarczyk, B. (2008). Marketing Communications Strategies. Wyd. Akademii Ekonomicznej w Poz-
naniu, Poznań.Pitts, B., (1999). Sports tourism and niche markets: Identifi cation and analysis of the growing les-
bian and gay sports tourism industry. Journal of Vacation Marketing, 5 (1), 31–50.Polus, A. (2009). Sport w stosunkach międzynarodowych. Wyd. Adam Marszałek, Toruń (in Polish).Pope, N., Turco, D. (2001). Sport & Event Marketing, The McGraw-Hill Companies, Roseville.Tribe, J. (2003). The economics of leisure and tourism. Butterworth-Heinemann, Burlington.Waśkowski, Z., (2014a). Marketing imprez biegowych. Bogucki Wydawnictwo Naukowe, Poznań.Waśkowski, Z. (2014b). Raport z badań: „Profi l polskiego biegacza”. Uniwersytet Ekonomiczny
w Poznaniu, Poznań.Watt, D.C. (2003). Sports management and administration. Routledge, London.Westerbeek, H., Smith, A. (2003). Sport Business in the Global Marketplace. Palgrave Macmillan,
New York.Wicker, P., Hallmann, K., James, J. (2012). What is infl uencing consumer expenditure and intention
to revisit? An investigation of marathon events. Journal of Sport & Tourism, 17, 3.
Accepted for print: 22.04.2016
For citation: Waśkowski Z. (2016). Evaluating the potential of sports events as tools of promotion for cities and regions on an international scale. Acta Sci. Pol., Oeconomia, 15 (2), 163–172.

Oeconomia 15 (2) 2016, 173–185
THE INFLUENCE OF SPECIALIZED TRAINING ON THE QUALITY OF HOTEL CUSTOMERS SERVICE
Julia Wojciechowska-Solis, Anna Mazurek-KusiakUniversity of Life Sciences in Lublin
Andrzej SorokaSiedlce University of National Sciences and Humanities
Abstract. The aim of the study was to identify the changes that have occurred in the qual-ity of hotel services in the past 10 years in the area of eastern Poland. Efforts were made to determine the effect of trainings in managing customer satisfaction on the level of content-ment of hotel visitors. The study was conducted in 50 hotels in eastern Poland in 2004 and 2014 using the Servqual method. It was shown that the specialised trainings of the hotel staff are an essential determinant of improvement of the quality and competitiveness of Polish hotels. The quality of customer service, particularly functional quality, increases thanks to the trainings. Hotels located in eastern Poland need to continue to improve their quality, especially in tangibles, reliability and confi dence areas. The supporting infrastruc-ture in hotels, transportation accessibility of facilities, speed and reliability of customer service should be extended, proper management of relationships in the supply chain serv-ices should be ensured and visitors should be provided with a broadly-understood safety. Data was analyzed using Statistica 10 PL and Servqual method.
Key words: consumer research, customer, relationship, servqual, training for manager
INTRODUCTION
Quality in the hotel industry has become an essential factor distinguishing hotels among competitors [Pendergast 2006]. High quality of service, and particularly main-taining it at a high level is a diffi cult task, especially in the Polish, dynamically changing market [Mey et al. 2006].
Corresponding authors: Julia Wojciechowska-Solis, University of Life Sciences in Lublin, Faculty of Agrobioengineering, Akademicka 13, 20-950 Lublin, Poland, e-mail: [email protected], Andrzej Soroka, Siedlce University of National Sciences and Humanities, Stanisława Konarskiego 2, 08-110 Siedlce, Poland, e-mail: [email protected]© Copyright by Warsaw University of Life Sciences Press, Warsaw 2016
ISSN 1644-0757eISSN 2450-4602
http://acta_oeconomia.sggw.pl

174 J. Wojciechowska-Solis, A. Mazurek-Kusiak, A. Sroka
Acta Sci. Pol.
The emerging new hotels offer customers a wide range of services. This is the reason that it becomes increasingly diffi cult for them to gain a competitive advantage in the market by using familiar marketing tools [Hoecht 2006, Petrick 2013]. Therefore, it has become necessary to focus on monitoring the level of customer satisfaction, which is the most important link in the process of service provision [Jang et al. 2009]. Observation and constant dialogue with customers allows to explore their expectations and fulfi ll their needs and requirements [Akababa 2006].
Quality is a concept of subjective nature, it refers to the characteristics of the object or service that distinguish them and decide on their uniqueness [Spielmann and Larocheb et al. 2012]. It is also the degree to which the product is benefi cial to the potential buyer [Kimes and Robson 2004]. Quality is the ability to meet the external and internal needs and expectations of customers, which should take into account the technical and func-tional elements [Martin 2006]. In the market economy, where supply exceeds demand, the customer always chooses a supplier who offers him a wider range of services and provides greater satisfaction [Brilman 2002].
Technical quality stems from the physical dimension of service and is dependent on the solutions applied in the management of the hotel, both technical and systemic. Func-tional quality, meanwhile, is based on how the service was provided, which means that it is associated with communicativeness, conduct of employees, willingness and ability to provide the service. Functional quality is more important than technical quality and its level determines whether the tourist company will gain the client permanently or will have contact with him only for a limited time. It is defi nitely easier to manage tangibles than the sphere of service, i.e. human skills [Davison 1994].
The concept of TQM (total quality management) applies in the hotel industry, and is based on a comprehensive management of quality, the aim of which is its increase, while reducing costs, which in a longer perspective allows to increase competitiveness [Zopiatis and Theocharous 2013]. Introducing TQM requires the involvement of all em-ployees [Shani and Uriely et al. 2014], mass trainings in the fi eld of quality and marketing orientation focused on the customer. It is important to introduce appropriate programs, techniques and quality tools, which main objective will be customer satisfaction and im-provement of the quality of service [Kachniewska 2002]. Quality management in the hotel industry remains the current area of interest of researchers [Ahmad 2013].
The concept of TQM, widely used in business, has been implemented in hotel enter-prises as a way of monitoring the quality [Becket and Brookes 2008]. Such orientation provides systematic feedback from the customer, allowing managers directing the hotel to pay attention to the level of quality of the service offered [Badri et al. 2006, Lam and Chen 2012].
Marketing literature constantly emphasizes the importance of relational aspects in commercial transactions and recommends the continued development of mutually benefi -cial relationships with customers [Crosby et al. 1990]. Such an approach should increase the repeatability of customer purchases and be profi table [Ok et al. 2005]. In hotel en-terprises, intangibility and inseparability of production from consumption have a unique character, which means that consumer confi dence in the company plays a large role [Ben-dapudi and Berry 1997]. It is the basis for long-term relationships between the hotel company and the client [Frederick and Schefter 2000].

The infl uence of specialized training on the quality... 175
Oeconomia 15 (2) 2016
Customer orientation implies a strict measurement of customer satisfaction [Ariffi n et al. 2011]. In the case of any signs of reduced quality, customers start to consider re-signing from the services, and among the fi rst are the best customers [Ariffi n 2013]. It is of great importance in tourism, because this is about the leisure time, the value of which increases with the income of buyers [Mudie and Cottam 1998].
When it comes to measuring the level of quality, particularly in the service sector, the problem of research objectivity occurs, as a particular service for one person has a high quality, while for another does not meet the assumed standards [Jang-Hyeo and Timothy 2011]. Therefore, quality should be defi ned as meeting the requirements of the client, and not as a defi nition of technical parameters, which in the case of services is very diffi cult to separate [Mong-Yuan et al. 2013].
The Servqual method, which is ready and universal standard of service quality [Teas 1993], is a frequently used tool to measure the quality of services [Dagger and Sweeney 2006, Zeithaml et al. 2009]. The method allows the evaluation of services, with additional assessment of the quality from the standpoint of the person providing the service [Lee and Hing 1995].
The analysis of the quality of services is intended to identify these elements of the process of providing the services that affect customer dissatisfaction [Badri et al. 2006] and sometimes effectively discourage the purchase of hotel services [Smith 2013]. Hotel staff is often not aware of the mistakes they make, and only through research areas can be identifi ed that reduce the level of service provision [Jang et al. 2009].
The aim of the article was to identify the changes that have occurred in the quality of hotel services in the past 10 years in the region of eastern Poland. This is the period between the accession of Poland to the European Union, and the present time. The study also sought to determine the impact of trainings in managing customer satisfaction on the level of satisfaction of hotel visitors. Through the use of the Servqual method it was at-tempted to assess the relevance of the individual dimensions in the evaluation of service by respondents.
METHODS
The fi rst measurements were made in 2004, the year of Poland accession to the Euro-pean Union. Subsequent surveys were carried out in 2014, i.e. after 10 years of Poland in the European structures. Prior to the surveys in 2004, 50 hotels were randomly selected, located in eastern Poland, i.e. in provinces with the lowest GDP per capita in the whole EU.
When selecting hotels to the experimental sample, the confi dence level was set at 0.95, the estimated fraction size was determined at 0.50, and the maximum error was set at 0.05. All hotels had standard of at least three stars and Polish capital. In these hotels, surveys of 1,121 foreign guests were carried out on the principle of respondent availabil-ity. The analysis included 1,040 correctly fi lled out questionnaires.
In 2014, the study was repeated in the same hotels as in 2004. Hotels were further di-vided into two groups. One comprised those where employees have not gone through the trainings. In them, 978 properly completed surveys by foreign guests were collected. The second group consisted of hotels, in which employees and/or managers have undergone

176 J. Wojciechowska-Solis, A. Mazurek-Kusiak, A. Sroka
Acta Sci. Pol.
trainings in customer service (minimum three employees participated in 60-hour special-ized training). In these hotels, also 978 correctly fi lled questionnaires were collected.
The study used the Servqual method with a specially designed questionnaire consist-ing of two parts, 22 questions each. The Servqual method is aimed to indicate differences between the perceived quality of service and the quality provided by a particular company [Ladhari 2009], which allows to estimate the degree of customer satisfaction with the services provided [Juwaheer 2006]. Evaluation is carried out on the basis of fi ve dimen-sions distinguished in service quality: tangibles (I), reliability (II), liability of suppliers (III), confi dence (IV) and affordability (V). Considering individual dimensions, tables were designed in the third part of the survey, which was intended to weigh the tested dimensions [Berry and Parasuraman 1991].
Based on the unweighted Servqual results, one can decide which of the elements of the service provided should be further analyzed in order to achieve its most optimal level of quality. The calculated unweighted Servqual result can have positive, negative or zero value. A positive result means obtaining better quality/satisfaction than the customer expected; a negative result indicates a failure to meet expectations. The most optimal situation is when the result is zero, which means that the service exactly meets customer expectations.
The weighted Servqual index is acquired in the third part of the survey, in which re-spondents weigh particular areas and non-weighted Servqual indices.
Statistica 10.1 PL software was used in statistical analyses. The analysis of descriptive statistics and Student’s t-test were applied. Prior to the analysis, multivariate normality was examine, testing each variable for normal distribution. Slight deviations were omit-ted, due to the number of variables in each group. Means were considered statistically signifi cant differences at the probability less than p <0.05.
ANALYSIS AND INTERPRETATION OF THE RESULTS
The results showed that in 2004 the largest gap occurred between the expectations of guests and observations in the area of employee reactions to their needs (responsive-ness). The problem concerned the sphere of skills of helping guests, counseling and meet-ing their wishes. A large gap was also observed in the area of empathy, which indicated a low level of performance of the hotel staff from the point of view of meeting the needs of guests. This particularly applied to a problem of making contact with the customer and individual treatment.
Comparing ex ante evaluations of the subjects in subsequent years, it was demonstrat-ed that the expectations slightly increased in both hotels which trained employees and those in which such trainings were not used. Comparison of ex post evaluations indicated that the management of the surveyed companies benefi ted from the research conducted in 2004 and implemented corrective and remedial actions.
Quality of service was much better evaluated by guests in hotels, where employees participated in trainings in customer service. Most signifi cantly improved the dimension of empathy, as its gap increased from a negative value to a positive value, and responsive-ness dimension, which showed a similar trend.

The infl uence of specialized training on the quality... 177
Oeconomia 15 (2) 2016
The differences between the ex ante and ex post assessments in hotels, where employ-ees did not undergo trainings were lower in 2014 than in 2004. Quality evaluation was worse in them than in hotels, where employees received specialised training (Table 1).
Table 1. Differences in expectations (ex ante) and perceptions (ex post) of foreign customers in the quality of hotel services and differences in the particular values expressed as absolute values in 2004 and 2014
Dimension/Area
2004 2014Hotels where employees did not undergo trainings
Hotels where employees underwent trainings
ex ante ex post diffe-rence ex ante ex post diffe-
rence ex ante ex post diffe-rence
Tangibility (I) 4.157 3.661 –0.496 4.197 3.992 –0.205 4.187 4.063 –0.124Reliability (II) 4.448 3.852 –0.596 4.475 4.379 –0.096 4.488 4.464 –0.024Responsiveness (III) 4.305 2.841 –1.464 4.322 3.960 –0.362 4.347 4.401 0.054
Confi dence (IV) 4.323 3.645 –0.678 4.156 3.949 –0.207 4.558 4.508 –0.050Empathy (V) 3.954 2.598 –1.356 4.243 3.866 –0.377 4.304 4.391 0.087Average 4.237 3.319 –0.918 4.279 4.029 –0.249 4.377 4.365 –0.011
Source: Based on the study results.
The Servqual analysis also allowed to assess the relevance of the individual dimen-sions in the evaluation of the service investigated. It was shown that consumer prefer-ences have changed over the years. The characteristics, which were desirable in 2004, as reliability and confi dence, depreciated in 2014. This could be a result of globalisation, as well as solicitude of companies operating in the market with a high degree of competi-tiveness, which increased the standard of service in order to remain on the market. Invari-ably, the reaction of staff to their needs and expectations was important for customers. Weighs of dimensions concerning tangibles of the service and empathy were inversely shaped. The possibilities that common Europe brings, the fl ow of knowledge, capital and an increase of visa-free transfer of tourists have signifi cantly raised the level of hotel’s decor (Fig. 1).
It was shown that the hotel management should be interested to the greatest extent in the result of the weighted Servqual score, because this indicator shows the impact of each individual dimension on the fi nal result of the service provided. Evaluation of the quality of hotel services has increased in every dimension over the 10 years surveyed. Assessment of the quality in the hotels, where employees has received specialised train-ing was signifi cantly better. However, evaluation perceived was higher than expected for the third dimension, which concerned workers’ responsiveness to guests’ needs. The fi fth dimension, referring to personnel empathy, also received a positive score. However, it applied only to the hotels that trained employees in customer service. Acquiring a posi-tive average Servqual index jointly for fi ve dimensions, ensures owners of hotel facilities that success can be achieved by conducting systematic monitoring of customer feedback pertaining to the service standards, and by introducing immediate corrective and remedial actions (Fig. 2).

178 J. Wojciechowska-Solis, A. Mazurek-Kusiak, A. Sroka
Acta Sci. Pol.
16.520
27.570
20.260 21.130
14.520
26.442
21.911
18.57117.365
15.712
26.534
22.126
18.939
17.13516.279
tangibles reliability responsivness confidence empathy
2004 2014 without training 2014 with training
Fig. 1. Criteria of relevance – the average results of Servqual dimension weighs in the studied years
Source: Based on the study results.
–6,065
–15,567
–10,853
–15,249
–5,060
–10,559
–5,592
–2,164
–7,035
–3,643
–3,653–4,417
–3,531
–0,5410,887
–1,1230,746
–0,712
tangibles reliability responsivness confidence empathy average
SQw 2004 SQw 2014 without training SQw 2014 with trainingSQW 2004 SQW 2014 without training SQW 2014 with training
Fig. 2. Servqual weighted index (SQW) for hotel services in 2004 and 2014Source: Based on the study results.
Comparisons of the Servqual index for fi ve dimensions were carried out in hotels that trained employees and those, in which such trainings were not conducted. In all instances, signifi cant differences were demonstrated in the evaluated dimensions at p <0.05. In all instances, hotels that conducted staff trainings achieved higher values in individual di-mensions (Table 2).
29.0028.0027.0026.0025.0024.0023.0022.0021.0020.0019.0018.0017.0016.0015.0014.00
20
–2–4–6–8
–10–12–14–16–18

The infl uence of specialized training on the quality... 179
Oeconomia 15 (2) 2016
Table 2. t-Test for weighted Servqual for two groups of hotels in particular areasDimension/Area t-Test p-ValueTangibility (I) –2.0814 0.037a
Reliability (II) –2.5879 0.009a
Responsiveness (III) –9.0754 0.001a
Confi dence (IV) –3.7112 0.001a
Empathy (V) –6.3969 0.001a
a signifi cant difference at p <0.05.Source: Based on the study results.
DISCUSSION AND CONCLUSIONS
The objectives assumed have been achieved. The validity of systematic monitoring of the quality of hotel services have been confi rmed. Earlier studies have indicated that continuous monitoring of services had an impact on the formation of high standards of hotel guest service [Otto et al. 1996]. The consequence of this procedure was an increased level of customer satisfaction with staying in the hotel as well as the prospect of future visits [Phillips et al. 1983].
Research conducted by Fiorentino [1995] indicated that currently bed and breakfast only is not suffi cient for hotel guests. Expectations are directed towards comprehensive services, particularly concerning safety in hotel facilities.
The study confi rmed the need, and at the same time demonstrated, that conducting staff trainings raises the level of services that hotel enterprise is able to provide. This is undoubtedly associated with the need to know and apply the vision and mission by each employee, because it enhances, engages and motivates to increase the effi ciency and quality of service. Such actions have a direct impact on attracting hotel guests as well as their return visits. Organisational culture is also aimed at producing a good fi rst impres-sion on hotel guests [Manhas and Tukamushaba 2015].
It is claimed that each employee is a service provider and an internal client, who is-sues opinions about the hotel on the external market [Boshoff and Mels 1995]. Frederick and Mukesh [2001] also pointed out that employees are internal customers of the hotel, and their attitudes affect the external customer satisfaction. To encourage staff to engage in work, one must take actions to motivate employees. Training directors and hotel man-agers in the team management and personal communication gain great importance in such an approach. Patiar and Mia [2009], Lee [2011] found that the leadership also has a positive effect on employee behavior and motivates to mutual assistance. In addition, the study of MacKenzie [2001] demonstrated that leadership and training have a positive impact on improving employee performance and development of organizational culture of the hotel, and these factors have a direct infl uence on the quality of customer service.
The studies conducted in hotels in eastern Poland confi rmed the results of earlier works. They showed that the hotels where the staff received specialised training in cus-tomer service evidently improved the quality, especially the functional one in the soft skills of staff, in the responsiveness and empathy dimensions.

180 J. Wojciechowska-Solis, A. Mazurek-Kusiak, A. Sroka
Acta Sci. Pol.
The quality of guest service was also affected by the dimension of tangibility, which includes: the attractiveness of the hotel rooms, transport accessibility, modern furnishing, as well as the dimension of reliability, which consists of, among others, quality of food, cleanliness, reliability and neatness of staff [Wuest et al. 1996]. These dimensions in the study still had a negative gap, i.e. hotel guests expected more than they received from the hotel. This problem should be solved through improved coordination and integration with contractors and business partners who are a complementary sphere of hotel service activities. Therefore, skillful management of relationships between hotels and their sup-pliers is such an important issue [Murphy and Smith 2009, Zhang et al. 2009, Fantazy et al. 2010, Ku et al. 2011, Wang et al. 2013]. In order to provide high-quality raw materials and semi-fi nished food, hotel restaurants should cooperate with their suppliers [Akbaba 2006] as well as ensure the provision of high quality table cloths, cleaning products or the dishes and cutlery [Smith and Xiao 2008, Fantazy et al. 2010, Pullman and Rodgers 2010, Song 2011]. The joint teamwork effectively facilitates the relationships in supply chain services, because testing the quality of contractors is also important [Ganesan 1994, Mentzer et al. 2000, Ferguson et al. 2005].
Studies have confi rmed the validity of the Servqual analysis in estimating the quality of the services offered by the hotel companies. This is an excellent method especially in detecting and correcting defi ciencies or errors in service. It is popular not only among researchers from Eastern Europe. Similar studies were conducted in Asia (Japan and Tai-wan) by Mok and Armstrong [1998], by Weiermair [2003], in the mountainous regions of Austria and by Douglas and Connor [2003] in Northern Ireland.
It has been proven that there are no ideal research tools in the social sciences. Gabbie et al. [1997] and Williams [1998] and O’Neill et al. [2001] who previously were among critics of Servqual tool are using it. One of the charges against the method was its gen-eral character, since it applies in psychology, economics and other social sciences. The creators of the method [Parasuraman and Zeithaml et al. 1985, 1991] suggested that the tool should be adapted directly to the tested branch of the service sector. Carman [1990], Pitt [1997] and Williams [1998] proposed generic model that can be used in many indus-tries.
Despite the opinion of critics Servqual model is a useful method. Testing the quality of services is diffi cult to measure because of its subjective nature.
With the need to implement management approaches pursued by management, which is to achieve customer satisfaction, and gaining its loyalty – measurement of the quality of service it is necessary.
Berry et al. [2004] proposed universal tool which, after small modifi cations can be used in any service industry, no matter whether it’s fi nancial services, banking or hospital-ity. The tool is so versatile that it allows to compare the quality of service regardless of the area of research. The only limitation of this method is that you can not make comparisons between different industries and countries with different organizational culture.
Great importance in quality management has the focus on the client in order to pro-vide services at the level expected and ensuring the customer that he also has infl uence on the service, by issuing its opinion. Advocates of the method Servqual who has use it to investigate the expectations of customers in the hospitality sector, Carman [1990], Barbakus and Boller [1992] found that the method is good and reliable. In carrying out
The infl uence of specialized training on the quality... 181
Oeconomia 15 (2) 2016
the study at different times they came to similar conclusions, that the most important in hospitality is: assurances, reliability and tangibles.
The authors of this study conducted a statistical analysis in fi ve respondents dimen-sions. They reaffi rmed the signifi cance of differences, and also checked the adequacy of the application of the method Servqual on the market of hotel services in Poland. The re-sults obtained are similar to the results obtained by other researchers in Northern Ireland and Austria.
This assessment and interpretation of study results allows to evaluate the Servqual method as very useful, and at the same time proper in attempting to verify and assess the level of service provided by hotel companies.
Theoretical conclusions:Accession of Poland to the EU has contributed to improving the quality of hotel serv-ices in eastern Poland. Years 2004–2010 were primarily the period of high invest-ments in this sector. Market growth, and particularly its quality, was accomplished not only by opening new hotels, but through the expansion and modernization of existing facilities. Quality of service is fundamental to the operation of the hotel business. Guest deci-sion of choosing a hotel and satisfaction with the service is dependent on its level. Measuring the quality of services with the Servqual method help detect and correct any defi ciencies in the service. It allows to meet the expectations of potential custom-ers and adjust the level of service to market requirements.Practical conclusions: Specialised training of the hotel staff are an essential determinant of improvement of the quality and competitiveness of Polish hotels. The quality of customer service, particularly functional quality, increases thanks to the trainings. Hotels located in eastern Poland need to continue to improve their quality, especially in tangibles, reliability and confi dence areas. The supporting infrastructure in hotels, accessibility of facilities, speed and reliability of customer service should be extended, proper management of relationships in the supply chain services should be ensured and visitors should be provided with a broadly-understood safety.
REFERENCES
Akbaba, A. (2006). Measuring service quality in the hotel industry: A study in a business hotel in Turkey. Hospitality Management, 25, 170–179.
Ariffi n, A.A.M. (2013). Generic dimensionality of hospitality in the hotel industry: A host–guest rela-tionship perspective. International Journal of Hospitality Management, 35, 171–179.
Ariffi n, A.A.M., Maghzi, A.A., Aziz, N.A. (2011). Understanding hotel hospitality and differences between local and foreign guests. International Review of Business Research Papers, 7 (1), 340–349.
Barbakus, E., Boller, G.W. (1992). An empirical assessment of the Servqual scale. Journal of Busi-ness Research, 24, 3, 253–268.
1.
2.
3.
1.
2.

182 J. Wojciechowska-Solis, A. Mazurek-Kusiak, A. Sroka
Acta Sci. Pol.
Badri, M.A., Selim, H., Alshare, K., Grandon, E.E., Younis, H., Absulla, M. (2006). The Baldrige Education Criteria for performance excellence framework: Empirical test and validation. International Journal of Quality & Reliability Management, 23 (9), 1118–1157.
Becket, N., Brookes, M. (2008). Quality management practice in the higher education. What quality are we actually enhancing? Journal of Hospitality, Leisure, Sport & Tourism Education, 7 (1), 40–54.
Bendapudi, N., Berry, L.L. (1997). Customers’ motivations for maintaining relationships with se-rvice providers. Journal of Retailing, 73 (1), 15–37.
Berry, L.L., Parasuraman, A. (1991). Marketing Services. Competing Through Quality. The Free Press, New York.
Berry, L.L., Parasuraman, A. (2004). Marketing services: Competing through quality. Free Press, New York.
Boshoff, A., Mels G. (1995). A cause model to evaluate the relationships among supervision, role stress, organizational commitment and internal service quality. European Journal of Mar-keting, 29 (2), 23–42.
Brilman, J. (2002). Modern management concepts and methods. PWE, Warszawa.Carman, J.M. (1990). Consumer Perceptions Of Service Quality: An Assessment Of T. Journal of
Retailing, 66, 1, 33–55.Crosby, L.A., Evan, K.R., Cowles, D. (1990). Relationship quality in services selling: an interper-
sonal infl uence perspective. Journal of Marketing, 54 (3), 68–81. Dagger, T.S., Sweeney, J.C. (2006). The effect of service evaluation on behavioral intentions and
quality of life. Journal of Service Research, 9 (1), 2–19. Fantazy, K.A., Kumar, V., Kumar, U. (2010). Supply management practices and performance in
the Canadian hospitality industry. International Journal of Hospitality Management, 29 (4), 685–693.
Ferguson, R.J., Paulin, M., Bergeron, J. (2005). Contractual governance, relational governance, and the performance of inter fi rm service exchanges: the infl uence of boundary – spanner closeness. Journal of the Academy of Marketing Science, 33 (2), 217–234.
Fiorentino, A. (1995). Budget hotels: not just minor hospitality products. Tourism Management, 16 (6), 455–462.
Frederick, A.F., Mukesh, K. (2001). Service quality between internal customers and internal sup-pliers in an international airline. International Journal of Quality & Reliability Manage-ment, 18 (4), 371–386.
Frederick, R.F., Schefter, P. (2000). E-loyalty: your secret weapon on the web. Harvard Business Review, 78 (4), 105–113.
Gabbie, D., O’Neill, M. (1997). Servqual and the Northern Ireland hotel sector: a comparative analysis – part 2. Managing Service Qualty, 17, 1, 43–49.
Ganesan, S. (1994). Determinants of long-term orientation in buyer–seller relationships. Journal of Marketing, 58, 1–19.
Hoecht, A. (2006). Quality assurance in UK higher education. Issues of trust, control, professional autonomy and accountability. Higher Education, 51 (4), 541–563.
Jang, S.C., Ha, A., Silkes, C.A. (2009). Perceived attitudes of Asian foods: from the perspective of the American customers. International Journal of Hospitality Management, 28, 63–70.
Jang-Hyeon, N., Timothy, J.L. (2011). Foreign travelers’ satisfaction with traditional Korean re-staurants. International Journal of Hospitality Management, 30, 982–989.
Juwaheer, T.D. (2006). Exploring international tourists’ perceptions of hotel operations by using a modifi ed Servqual approach: a case study of Mauritius. Managing Service Quality, 14 (5), 350–364.
Kachniewska, M. (2002). Zarządzanie jakością usług hotelarskich. Difi n, Warszawa.

The infl uence of specialized training on the quality... 183
Oeconomia 15 (2) 2016
Kimes, S.E., Robson, S.K.A. (2004). The impact of restaurant table characteristics on meal duration and spending. Cornell Hotel and Restaurant Administration Quarterly, 45 (4), 333–346.
Ku, E.C.S., Wu, W.C., Lin, A.R. (2011). Strategic alignment leverage between hotels and com-panies: the buyer–supplier relationship perspective. International Journal of Hospitality Management, 30 (3), 735–745.
Ladhari, R. (2009). A review of twenty years of Servqual research. International Journal of Quality and Service Sciences, 1, 172–198.
Lam, W., Chen, Z. (2012). When I put my service mask: determinants and outcomes of emotional labor among hotel service providers according to effective event theory. International Journal of Hospitality Management, 31 (1), 3–11.
Lee, Y.K., Hing, N. (1995). Measuring quality in restaurant operations: an application of the Servqual instrument. International Journey Hospitality Management, 14, 3/4, 295–298.
Lee, Y.K., Kim, Y., Son, M.H., Lee, D.J. (2011). Do emotions play a mediating role in the relation-ship between owner leadership styles and manager customer orientation, and performance in service environment? International Journal of Hospitality Management, 30, 942–952.
MacKenzie, S.B., Podsakoff, P.M., Rich, G.A. (2001). Transformational and transactional leadership and salesperson performance. Journal of Academy of Marketing Science, 2, 115–134.
Manhas, G., Tukamushaba, F. (2015). Understanding service experience and its impact on brand image in hospitality sector. International Journal of Hospitality Management, 45, 77–87.
Martin, W. (2006). Zarządzanie jakością obsługi w restauracjach i hotelach. Ofi cyna Ekonomiczna, Wolters Kluwer Polska, Kraków.
Mentzer, J.T., Min, S., Zacharia, Z.G. (2000). The nature of inter fi rm partnering in supply chain management. Journal of Retailing, 76 (4), 549–568.
Mey, L.P., Akbar, A.K., Fie, D.Y.G. (2006). Measuring Service Quality and Customer Satisfaction of the Hotels in Malaysia: Malaysian, Asian and Non-Asian Hotel Guests. Journal of Hospitality and Tourism Management, 13, 144–160.
Mok, C., Armstrong, R.W. (1998). Sources of information used by Hong Kong and Taiwanese leisure travelers. Australian Journal of Hospitality Management, 3, 1, 31–35.
Mong-Yuan, C., Kuanchin, C., Chuan, P., Chien-Min, C., David, C., Yen, A. (2013). A study on the effects of service convenience and service quality on maintenance revisit intentions. Computer Standards & Interfaces, 35, 187–194.
Mudie, P., Cottam, A. (1998). Usługi – zarządzanie i marketing. PWN, Warszawa. Murphy, J., Smith, S. (2009). Chefs and suppliers: an exploratory look at supply chain issues in an
upscale restaurant alliance. International Journal of Hospitality Management, 28, 212–220.O’Neill, M., Palmer, A. (2001). Survey timing and consumer perceptions of service quality: an
overview of empirical evidence. Managing Service Quality, 11, 3, 182–190. Ok, C., Back, K.J., Shankli, C.W. (2005). Modeling roles of service recovery strategy: a relation-
ship-focused view. Journal of Hospitality & Tourism Research, 29 (4), 484–507. Otto, J.E., Ritchie, J.R.B. (1996). The service experience in tourism. Tourism Management, 17 (3),
165–174. Parasuraman, A., Zeithaml, V.A., Berry, L.L. (1985). A conceptual model of service quality and its
implications for future research. Journal of Marketing, 49, 4, 41–50. Patiar, A., Mia, L. (2009). Transformational leadership style, market competition and departmental
performance: evidence from luxury hotels in Australia. International Journal of Hospita-lity Management, 28, 254–262.
Pendergast, D., 2006. Tourist gut reactions: food safety and hygiene issues. [In:] J. Wilks, D. Pen-dergast, P. Leggat (Eds), Tourism in Turbulent Times: Towards Safe Experiences for Vi-sitors. Elsevier, Amsterdam, 143–154.

184 J. Wojciechowska-Solis, A. Mazurek-Kusiak, A. Sroka
Acta Sci. Pol.
Petrick, J.F. (2013). Cruise Operations Management: Hospitality Perspectives. Annals of Tourism Research, 43, 655–657.
Phillips, L.W., Chang, R.D., Buzzel, D.R. (1983). Product quality, cost position and business per-formance: a test of some key hypotheses. Journal of Marketing 47, 26–43.
Pitt, L.F., Watson, R.T., Kavan, C.B. (1997). Measuring information systems service quality: con-cerns for a complete canvas. MIS Quarterly, 21, 2, 209–221.
Pullman, M., Rodgers S., 2010. Capacity management for hospitality and tourism: a review of cur-rent approaches. International Journal of Hospitality Management, 29 (1), 177–187.
Shani, A., Uriely, N., Reichel, A., Ginsburg, L. (2014). Emotional labor in the hospitality industry: The infl uence of contextual factors. International Journal of Hospitality Management, 37, 150–158.
Smith, S.L.J., Xiao, H. (2008). Culinary tourism supply chains: a preliminary examination. Journal of Travel Research, 46 (3), 289–299.
Song, H. (2011). Tourism Supply Chain Management. Routledge, London.Spielmann, N., Larocheb, M., Borgesa, A. (2012). How service seasons the experience: Measuring
hospitality servicescapes. International Journal of Hospitality Management, 31, 361–365.Teas, R.K., 1993. Consumer expectations and the measurement of perceived service quality. Jour-
nal of Professional Services Marketing, 8, 33–54. Wang, Y.F., Chen, S.P., Lee, Tsai, C.T. (2013). Developing green management standards for restau-
rants: an application of green supply chain management. International Journal of Hospi-tality Management, 34, 263–273.
Weiermair, K. (2000). Tourists’ perceptions towards and satisfaction with service quality in the cross-cultural service encounter: implications for hospitality and tourism management. Managing Service Quality, 10, 6, 397–409.
Williams, C. (1998). Is the Servqual model an appropriate management tool for measuring service delivery quality in the UK leisure industry? Managing Leisure, 3, 2, 98–110.
Wuest, B.E.S., Tas, R.F., Emenheiser, D.A. (1996). What do mature travelers perceive as important hotel/motel consumer services? Hospitality Research Journal, 20, 2, 77–92.
Zeithaml, V., Bitner, M.J., Gremler, D.D. (2009). Services marketing: integrating customer focus across the fi rm. (V edn). McGraw Hill, New York.
Zhang, H., Song, H., Huang, G.Q. (2009). Tourism supply chain management: a new research agenda. Tourism Management, 30, 345–358.
Zopiatis, A., Theocharous, A. (2013). Revisiting hospitality internship practices: A holistic investi-gation. Journal of Hospitality, Leisure, Sport & Tourism Education, 13, 33–46.
WPŁYW SPECJALISTYCZNYCH SZKOLEŃ NA JAKOŚĆ OBSŁUGI KLIENTÓW HOTELOWYCH
Streszczenie. Celem artykułu było wskazanie zmian, które dokonały się w jakości usług hotelarskich na przestrzeni ostatnich 10 lat na terenach wschodniej Polski. Starano się okre-ślić wpływ prowadzonych szkoleń z zakresu zarządzania satysfakcją klienta na poziom zadowolenia odwiedzających hotele. Badania przeprowadzono w 50 hotelach wschodniej Polski metodą Servqual w latach 2004 i 2014. Wykazano, iż specjalistyczne szkolenia kadry hotelowej są niezbędnym wyznacznikiem poprawy jakości oraz konkurencyjności polskich hoteli. Dzięki szkoleniom wzrasta jakość obsługi klienta, zwłaszcza jakość funk-cjonalna. Hotele zlokalizowane we wschodniej Polsce nadal muszą poprawiać swoją ja-kość, szczególnie w obszarach materialnych, wiarygodności i zaufania. Należy rozszerzać

The infl uence of specialized training on the quality... 185
Oeconomia 15 (2) 2016
infrastrukturę towarzyszącą w hotelach, dostępność komunikacyjną obiektów, szybkość i niezawodność obsługi gości, zadbać o prawidłowe zarządzanie relacjami w łańcuchach dostaw usług oraz zapewnić gościom szeroko rozumiane bezpieczeństwo. Dane były anali-zowane za pomocą programu Statistica 10 PL i metody Servqual.
Słowa kluczowe: badania zachowań konsumentów, konsument, relacje metody Servqual, specjalistyczne szkolenie menedżerskie
Accepted for print: 18.04.2016
For citation: Wojciechowska-Solis J., Mazurek-Kusiak A., Soroka A. (2016). The infl uence of specialized training on the quality of hotel customers service. Acta Sci. Pol., Oeconomia, 15 (2), 173–185.


Oeconomia 15 (2) 2016, 187–198
TOWARDS SUSTAINABLE FOOD SYSTEM
Romuald I. ZalewskiGniezno College “Milenium”
Eulalia SkawińskaUniversity of Zielona Góra
Abstract. The paper addresses the terms “food safety”, “food security” and “food sys-tem”, from the position of commodity science (in Polish: towaroznawstwo) and economic sciences. The various descriptions of these items in literature are reviewed. Food safety has been described as opposite to food risk. Hence the authors discuss the differences in perception of food risk by customer, producer/supplier and offi cial agencies. The objective safety of food risk (biological, chemical and physical) is measured by producers and offi cial agencies but not by customers. Food security is a mix of availability, access, utilization and stability of supply over time. It is understood by a set of voluntary, obligatory and supple-mentary systems under inspection and control of offi cial institutions on the local, regional or global level. Set of various expected and possible activities to ensure sustainable food system (SFS) in future has been proposed by the authors.
Key words: food security, quality, food system, sustainable food system
INTRODUCTION
Food is most necessary commodity for people and must be safe and secure. There is an increasing concern about the impact of food production systems on the quality of life and on the environment. The evidence of many health problems caused by unsafe food, agriculture/husbandry and the food production chain is well documented. Studies on food security on various levels are numerous and show divergences. The literature on most important food production aspects, food quality and quantity as well as on food losses is substantial and growing.
Corresponding author: Eulalia Skawińska, University of Zielona Góra, Faculty of Economics and Management, Podgórna 50, 65-246 Zielona Góra, Poland, e-mail: [email protected]© Copyright by Warsaw University of Life Sciences Press, Warsaw 2016
ISSN 1644-0757eISSN 2450-4602
http://acta_oeconomia.sggw.pl

188 R.I. Zalewski, E. Skawińska
Acta Sci. Pol.
Food safety and food security are now in the centre of interest of various scientifi c disciplines. This is in line with “the trend towards greater position of safety in other areas such as workplace safety and environmental protection” [Segerson 1999]. Both belongs to different scientifi c disciplines yet partly overlapps. The term “food safety” from the po-sition of natural science, medical sciences, food technology, commodity science describe various aspects of health, probability of illness, poisoning or injury as a consequence of consuming a particular food [Codex Alimentarius 2003]. Food safety from the perspec-tive of economy and social science describe security of production system, supply chain coordination, food availability, continuity and suffi ciency for consumer and industry now and in the future. The issues connecting food safety and food security, as non-separable parts of system, will be discussed in this article. However, they belong to different sci-entifi c disciplines, dominated by competing stakeholders (e.g. governments, suppliers, institutions and politicians).
The aim of this paper is to deliver an analysis of place, signifi cance, relations and dif-ferentiation between the terms “food safety” as a element of quality and “food security”. The question arises if both are parts of the food system (local, regional or global). The additional question addressed in this paper is whether the food system is or could become sustainable in future or not?
FOOD SAFETY AND QUALITY
Food safety is an element of food quality [Świderski 1999, Grunert 2005]. The term “quality” has been defi ned by various authors in different ways. The most comprehensive defi nition states that quality means fulfi lling the needs/requirements of a customer [Juran and Gryna 1974]. According to ISO 9000:2015 international standard “quality is a degree to which a set of inherent characteristics fulfi lls requirements”. There is no doubt that quality is relative and does not exist on its own. Its perception is not constant over time or space because consumers change their needs, habits and preferences due to various circumstances.
Suppliers and producers of food describe the quality targets through market segmen-tation which can be driven by examining the consumer’ structure of quality attributes according to their importance. Some attributes are very important (critical) in eyes of consumers and other not important for a given person or a segment of customers. This segmentation will lead to a defi nition of the “quality of type” which is generally de-scribed by documentation, formulas elaborated by producers or innovators, external or internal standards, specifi cations following the request of clients, results of scientifi c work, tradition etc. Quality of type formation strongly depends on the product concept [Zalewski 2008] and consumer expectations. In developed countries, the number of con-sumers seeking organic or high quality food depends on the actual level of information on the scientifi c results, the quality of raw foodstuffs, ingredients, additives, technology, processes packages and the storage/transportation technology. According to the report

Towards sustainable food system 189
Oeconomia 15 (2) 2016
of Fairtrade from 20131, the fair trade sector is growing dynamically and in 2013 hits 4.3 billion EUR in consumer sales worldwide.
A given quality of type serves as a standard to which actual production is compared, by measurement of various properties of raw materials used to production and proc-esses execution. The growing signifi cance of food quality during last decades has been observed and documented [Zalewski and Skawińska 2004]. The impact of science on quality issues has helped to shift the attention from control of processes to prevention and understanding of processes. People have accepted that it is better to build in the desired product quality at the initial stage of its life-cycle [Zalewski 2008, Roy 2012].
It refers to the decrease of various attributes of food quality mentioned in Figure 1, linked to the degradation of the product, at all stages of the food production chain from harvest to consumption. Food quality, as shown in Figure 1, is a result of various proper-ties and functions of given food.
Fig. 1. Food quality as a function of basic attributes and values for consumersSource: Own illustration after Świderski [1999].
Most consumers ranked the fi rst tier of the food quality attributes in the order: taste, health, convenience [Grunert 2005]. Similar results can be found in numerous research with some regional differentiation for example in Europe [Grunert 2005], Việt Nam [Mu-barik et al. 2006] or USA, Italy and Japan [Bertolini et al. 2003]. Japanese consumers were more directed towards food safety, e.g. irradiation, GMO free, genetically modifi ed food. American and Italian consumers were likely to trust their governments about food quality and safety than Japanese consumers. For simplicity, sensory and disposability are not further developed in Figure 1.
In the second tier, only health attribute is shown as a construct of four values, namely safety, nutrition, energy and dietetics. The last two are less important for further discus-sion. In the third tier only safety and nutrition are described further.
Nutrition value is further split into functional and fortifi ed. Following Ch. Hansen [Joppen 2006] “…all food is functional. That is why I prefer to work with functional food
1http://www.fairtrade.net/fi leadmin/user_upload/content/2009/ resources/2013-14_AnnualReport_FairtradeIntl_web.pdf (access 20.12.2015).

190 R.I. Zalewski, E. Skawińska
Acta Sci. Pol.
that is already recognized as predominantly healthy (e.g. milk products due to hospitable environment), and good staple food consumed in signifi cant amounts and with high fre-quency”. Most food products on the market called functional are actually fortifi ed with certain nutrients (e.g. minerals or vitamins). However, there are some reservations from public against such enhancements.
In literature, there are various defi nitions of food safety distinguished as broad and narrow ones. In the narrow sense, “it can be defi ned as the oposite of food risk, i.e. as the probability of not contracting a disease as a consequence of consuming certain food” [Grunert 2005]. P. Slovic [2002] have shown that perceived risk is both predictable and quantifi able and I. Shaw [2005] sets the risk of food in the broader context of a life’s risk. A description of food safety as protection of food against chemical, biological and physi-cal factors that can endanger human health has been used by Codex Alimentarius [2003], adopted by the HACCP principles (Hazard Analysis and Critical Control Point), the ISO-EN 22000 standard and many others.
Safety value for consumers is further split into three most important sources of health risk: microbiological (presence of pathogen microorganism), chemical (naturally occur-ring, additives allowed but exceeding certain concentration, residues of pesticides, her-bicides, supporting chemicals, drugs, antibiotics, detergents, hydraulic liquids etc.) and physical (as appearance of external materials of various origin).
Unfortunately only few consumers are able to adequately evaluate quality attributes of food products and estimate eventual risk due to their consumption, as a fi rst line of defense against health risk, quality loss or waste. The importance of the sensory attribute (e.g. taste, smell, appearance, texture, sound etc.) comes from experience, culinary herit-age and sensory threshold of the individual food consumer. In many cases one is able rec-ognize non-fresh foodstuffs by taste or smell. However professional knowledge of sen-sory analysis of food is restricted to a small population of people working in laboratories and applying a set of procedures based on generally accepted international standards.
Other food attributes such as infl uence on health and well being, easiness of prepara-tion, chemical constitution or presence or absence of various substances, are diffi cult to examine and less important in the opinion of consumers. However, their role is grow-ing due to better education and increasing awareness of food labeling, which decreases the information asymmetry in the food production chain between the producers and the customers. Some customers “seem to want information to help them achieve a balanced diet, to avoid certain allergens or ingredients that have proved not to agree with them, or to know the origin and environmental, ethical and technological conditions under which the food was processes” [Werbeke 2005]. This information can be used by consumers to choose between alternative products and to maximize their expectations. Such subjective quality is discussed lately in literature [Grunert 2005, Singham, et al. 2015].
Objective quality is a result of evaluation of numerous measurable characteristics and properties of a given food using scientifi c methods based on the highest scientifi c achievements and offi cially approved by independent organizations e.g. Codex Alimen-tarius, FAO, WTO. The execution of such measurement is in the hands of food control laboratories in the industry, supply chain, offi cial control institutions or consumer organi-zations. The accuracy, precision, repeatability, performance etc. of their work is examined by laboratories of the highest expertise (e.g. reference laboratories or notifi ed under EEC directive) [Caroli 2005].

Towards sustainable food system 191
Oeconomia 15 (2) 2016
FOOD SECURITY
In contrast, food security is understood as security of production, supply chain coordi-nation, availability, continuity and suffi ciency for the consumer and the industry and is more interesting for agricultural economists, politicians and the publics concerned about:
product liability, terms of international trade, interactions between risk analysis and economic analysis [Unnevehr et al. 2003]; food regulations and trade development towards an open global system [Pingali 2006, Żurek 2012]; estimation of effects of agricultural policy on poverty in Europe and in developing countries [Schneider and Gugerty 2011];globalization of safety risk and failures [Unnevehr 2006, Maruchecka et al. 2011];or the geography and causes of food insecurity in developed, developing and undevel-oped countries [FAO 2015 report], which were discussed in the literature.According to the FAO defi nition, “food security exists when all people, at all times,
have physical, social and economic access to suffi cient, safe and nutritious food which meets their dietary needs and food preferences for an active and healthy life” (http://www.fao.org/economic/ess/ess-fs/en/). Statistics Division developed a set of indicators which describe opposite – i.e. “food insecurity” – by measuring food availability, access, utilization and stability. S.L. Hendrics describes food insecurity as a continuous range of experiences between starvation and adequate quality and intake, divided into three stages: food insecure, insecure to vulnerable and food secure [Hendrics 2015]. More information about the construction of those indicators can be found in the report on food insecurity. At present “about 795 million people are undernourished globally, down 167 million over the last decade, and 216 million less than in 1990–1992. The decline is more pronounced in developing regions, despite signifi cant population growth. In recent years, progress has been hindered by slower and less inclusive economic growth as well as political instability in some developing regions, such as Central Africa and Western Asia” [Food insecurity… 2015 and previous editions].
The priority of increasing food production was a key focus of agricultural research in the past (e.g. Green Revolution). According to Beintema and Elliot, “Agricultural research was indeed successful in the latter quarter of the 20th century in rapidly and signifi cantly increasing production of staple grains (…) and total food calories”. As consequence, in-vestment in agricultural research and development declined until the next signifi cant food price spike in 2007–2008 [Beintema et al. 2009, World Bank 2014]. In addition, de Car-valho [2015] quotes data on food supply per capita (kcal·capita–1·day–1) and total average growth rate in the period 1961–2007 concluding, that in many regions of the world, the growth rate is geometrical. Simulation results of macroeconomic data demonstrate that higher economic growth infl uences demand more than supply. Emerging economies tend to import food for improvement of their security while the other countries increase the export. In turn, faster economic growth leads to lower world prices, the magnitude of the effects decreases over time, and markets do not regain their baseline levels immedi-ately. Due to such policy, the less developed countries are importing more and increasing their per capita food calorie intake. However, they simultaneously become movulnerable to disruptions and shocks on agricultural world markets [Kavallari et al. 2014]. Most
•
•
•
••

192 R.I. Zalewski, E. Skawińska
Acta Sci. Pol.
probably now “there is a need to focus relatively more on diet quality, which sits at the heart of food systems” [Herforth et al. 2015] and to interfere in food systems.
The current challenges for food security include the impact of climate changes and water shortage on food production. In a well documented research, D. Pimentel et al. concluded that the availability and quality of fresh water has become a major interna-tional problem [1997]. B. Campbell [2015] argues therefore in favor of a “Climate Smart Agriculture”. This strategy incorporates the reduction of CO2 emissions and considers the complexity and diversity of activities as well as a portfolio of options and input from new R&D. According to C. Hawkes [2015], the food system is driven by overconsumption of resources (energy, water) by the industry and people. She suggests four points of action:
prevent the food industry from creating demand for too many of wrong food;intensify solutions that start with consumption problems in food system;improving food systems (FS) governance which will bring together production and consumption;disseminating a food system literacy to all people.A similar reasoning is used by Ingram et al. [2013], who states that “from the perspec-
tive of the food system activities, the need to take into account optimal allocation of natu-ral resources to increase the effi ciency with which inputs are used is emerging as a critical area for further research (…) Key elements of the food security outcomes (including nutrition, food safety and affordability) also emerged as priorities”. Concerns about the future impact of climate change on the food led to a number of signifi cant estimations on the future of food systems [OECD 2008, e.g. Godfrey et al. 2010] which explored pri-ority areas for action, to ensure the world could feed its predicted population in 2050. The report states “For wheat, rice and maize in tropical and temperate regions, climate change without adaptation is projected to negatively impact production. (…) Climate change is projected to reduce renewable surface water and groundwater resources in most dry subtropical regions, intensifying competition for water among sectors” [Cli-mate Change 2014].
ARE FOOD SYSTEMS SUSTAINABLE?
The defi nitions of food systems (FS) in literature are numerous [e.g. Ericksen et al. 2010, Ingram et al. 2013]. In our opinion one very compact and complete defi nition states: “a food system gathers all the elements (environment, people, inputs, processes, infra-structures, institutions etc.) and activities that relate to the production, processing, distri-bution, preparation and consumption of food, and the outputs of these activities, including socio-economic and environmental outcomes” [Food Losses… 2014]. In other words FS includes all steps from agricultural raw production (including crops and animals) up to the food eaten by consumers and includes all losses occurring between the very source up to the consumers’ table. At each stage along the processing chain some losses occur. For example “food waste refers to food appropriate for human consumption being discarded or left to spoil at consumer level – regardless of the cause”, while “food loss and waste refers to a decrease, at all stages of the food chain from harvest to consumption in mass, of food that was originally intended for human consumption, regardless of the cause” [Food Losses… 2014].
•••
•
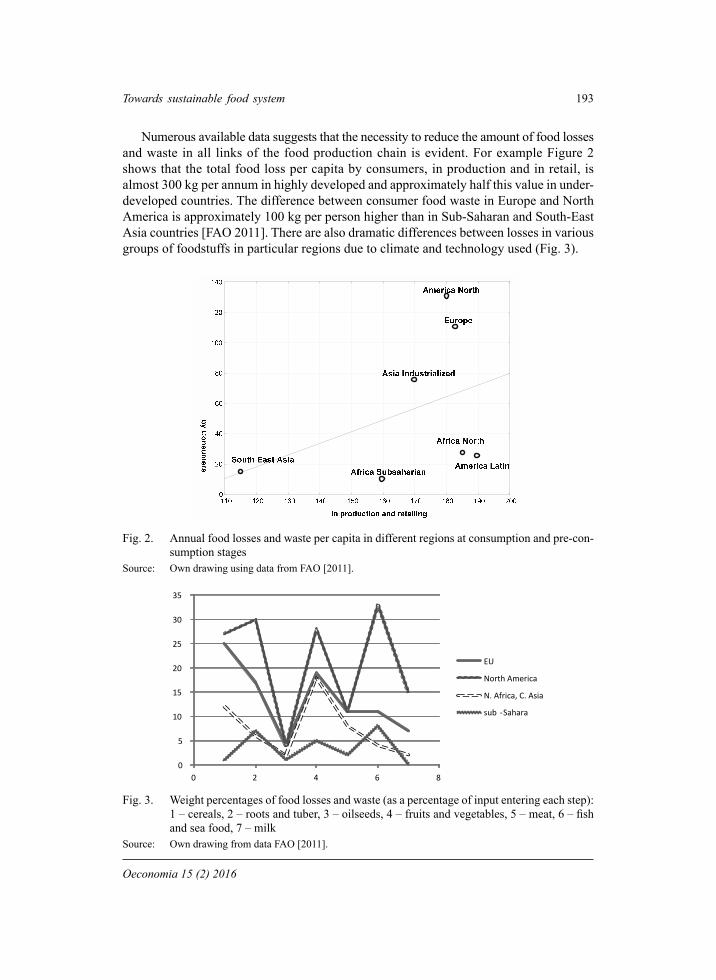
Towards sustainable food system 193
Oeconomia 15 (2) 2016
Numerous available data suggests that the necessity to reduce the amount of food losses and waste in all links of the food production chain is evident. For example Figure 2 shows that the total food loss per capita by consumers, in production and in retail, is almost 300 kg per annum in highly developed and approximately half this value in under-developed countries. The difference between consumer food waste in Europe and North America is approximately 100 kg per person higher than in Sub-Saharan and South-East Asia countries [FAO 2011]. There are also dramatic differences between losses in various groups of foodstuffs in particular regions due to climate and technology used (Fig. 3).
Fig. 2. Annual food losses and waste per capita in different regions at consumption and pre-con-sumption stages
Source: Own drawing using data from FAO [2011].
0
5
10
15
20
25
30
35
0 2 4 6 8
EU
North America
N. Africa, C. Asia
sub -Sahara
Fig. 3. Weight percentages of food losses and waste (as a percentage of input entering each step): 1 – cereals, 2 – roots and tuber, 3 – oilseeds, 4 – fruits and vegetables, 5 – meat, 6 – fi sh and sea food, 7 – milk
Source: Own drawing from data FAO [2011].

194 R.I. Zalewski, E. Skawińska
Acta Sci. Pol.
Similar data on food waste in EU was presented lately [Masar 2015]. He suggested that approximately 30% of edible and healthy food is wasted in the EU – i.e. approxi-mately over 89 million t of food annually or 180 kg of food per capita per annum. Also in Poland food waste is high as indicated in reports published in 2012 and 2013 [Raport Federacji 2013].
It is expected that a sustainable food system will, at last in part, help to decrease the problem. The term sustainability has been proposed, discussed and introduced into sci-ence and praxis in the 1970. The number of defi nitions of sustainability found in literature is vast. In the particular case of the food system, sustainability “ensures food security and nutrition for all in such a way that the economic, social and environmental bases to generate food security and nutrition of future generations are not compromised” [Esnouf et al. 2013, Garnett 2014] and can be visualized by the double-pyramid model (Fig. 4) of drivers and security measures.
Fig. 4. Sustainable food system (SFS) Source: Own drawing.
Among security measures one can mention availability, access, utilization and stabil-ity of supply over time. The discussion on those measures is out of scope of this paper, although all of them are strongly linked to food quality and fi nally to its safety. However, the components in SFS are of economic, social and environmental nature, as discussed above. Unfortunately, their directions frequently are opposite.
The expected by the authors activities of all participants and players in food system, that can help to build SFS in the future, are listed in Figure 5.

Towards sustainable food system 195
Oeconomia 15 (2) 2016
Fig. 5. Expected and possible activities to ensure sustainable food system in futureSource: Own knowledge.
CONCLUSIONS
The authors analyzed the terms of food safety and food security from perspectives of economy and natural science. Food is a necessary everyday commodity and its parameters are evaluated from the position of both the customer (subjective quality, narrow sense of safety) and the producer/supplier (objective quality, broad sense of safety). Food safety pol-icy has been describeded as a construct of voluntary, obligatory and supplementary systems acting along food value chain and being under the impact of offi cial food control.
• implement trainings/informa-tive campaigns to prevent food waste in the whole food chain, from the fi eld to con-sumer’s table
• raise consumer awareness on food waste
• develop salvage networks of unsold food products
• adjust food products (package) size to consumer’s needs
• arrange conventions of food processors, wholesalers, retail-ers, caterers to facilitate, do-nations to charities and needy people
• build closer links between re-gional producers and local con-sumers (promotion of regional, traditional food products)
• changes in eating patterns (pref-erence for fresh and minimally processed foods, eating out), misunderstanding about food safety systems (e.g. HACCP),
• maintaining trust towards food and health authorities and in-stitutions, build public trust
• decreasing information gap between consumer and pro-ducer, introducing strict rules on food labeling and increas-ing knowledge of consumers about food
• improve own skills to become a food quality and safety spe-cialist
• giant producers do not take the worried consumers seriously
• mitigation of climate changes• maintaining biodiversity• maintaining ecosystems • reduction of energy withdrawn
for agriculture and husbandry, • create good food waste prac-
tices and legislative guidelines• recycling non-consumed food
to fodder production or possi-bly heating energy or electric-ity production
• decrease amount of pesticides, herbicides, fertilizers and other chemicals used in agriculture, husbandry and in food process-ing
• improve the collection, utiliza-tion or neutralization of agri-culture (e.g. straw, steam) and husbandry (e.g. manure, meth-ane) waste
• to make use of various by-products and waste in food processing as a valuable food
• impose global/regional effi -cient and effective obligatory and voluntary food safety and security systems
• introduce trust and risk to eco-nomic analysis of agriculture and food production
• the information gaps along food systems
• prevent the food industry from creating demand for too many of wrong food
• create innovative solutions that starts with consumption prob-lems in food system
• analyze possibility of reducing raw production for non-human food uses e.g. rape for fuel, palm oil for cosmetics etc.
• invent and introduce method-ology of FLCA – food life cy-cle assessment (similar to LCA in industrial products)
Social Environmental Economic

196 R.I. Zalewski, E. Skawińska
Acta Sci. Pol.
The food safety policy system is very fl exible and can be shaped by the actual needs and requirements. The role of offi cial control authorities which could mould the shape of the system in a given country will be very important.
Food security has been described as combination of security of production and sup-ply chain coordination, availability, continuity and suffi ciency for consumer and the in-dustry. Various available data, strongly suggest reducing the amount of food losses and waste in various links of food production chain. In addition construction of sustainable food systems on local, regional or global level is strongly recommended.
We conclude that food security, food safety and a sustainable food system all belongs to so-called wicked problems [Dentoni et al. 2012]. All of them are composed of many inde-pendent and dependent variables being in a certain state of equilibrium. The task for the fu-ture is to try to modify and improve the relations between them at the most desirable level.
REFERENCES
Beintema, N., Elliott, H. (2009). Setting meaningful investment targets in agricultural research and development: challenges, opportunities and fi scal realities. [In:] How to feed the World in 2050. Proceedings of a technical meeting of experts, Rome, Italy, 24–26 June 2009. ftp:// ftp.fao.org/docrep/fao/012/ak542e/ak542e00.pdf (accessed 22.11.2015).
Bertolini, P., McGarry, W., Shikama, I., Berger, A. (2003). Attitudes toward food and biotechnology in the US, Japan and Italy. VII ICABR International Conference. Ravello, June 29 – July 3. CD-ROM.
Campbell, B. (2015). Reducing risks to food systems from climate change. 2nd International Confe-rence on Global Food Security, 11–14 Oct. 2015, Ithaca, NY, USA.
Caroli, S. (2005). Residues and contaminants in food of animal origin. The network of community and national reference laboratories. [In:] R. Zieliński (Ed.), Current Trends in Commodity Science. Wyd. AE, Poznań, 945–949.
Climate Change (2014). Synthesis Report Summary for Policymakers. Retrieved from ipcc.ch/pdf/assessment-report/ar5/syr/AR5_SYR_FINAL_SPM.pdf (accessed 15.11.2015).
Codex Alimentarius (2003). Recommended International Code of Practices. General Principles of Food Hygiene, CAC/RCP 1-1969, Rev. 4-2003, 5.
Carvalho de, B.R.P. (2015). Sovereignty. Food Security and Sustainable Development: Environ-mental and Economic Challenges, International Conference, IERiGŻ “Ekonomia versus środowisko – konkurencyjność czy komplementarność”, 23–25 Nov. Jachranka.
Dentoni, D., Hospes, O., Ross, R.B. (2012). Managing wicked problems in agibusiness: the role of multi-stakeholder engagement in value creation, International Food and Agribusiness Management Review, 15 Special Issue B.
Dierks, L.H., Hauf, C.-H. (2006). Trust as a determinant of consumer behaviour in food safety crisis. XXVI IAAE Conference, Gold Coast. Australia, August 12–18.
Ericksen, P.J., et al. (2010). The value of a food system approach. [In:] J. Ingram, P. Ericksen, D. Liverman (Eds), Security and Global Environmental Change. Earthscan, London 25–45.
Esnouf, C., Russel, M., Bricas, N. (Eds). (2013). Food System Sustainability: Insights From du-ALIne. Cambridge University Press, New York, USA.
FAO (2011). Global Food Losses and Food Waste – Extent, Causes and Prevention. Retrieved from www. fao.org/docrep/014/mb060e/ mb060e.pdf (accessed 12.12.2015).
Food Insecurity in the World (2015). www.fao.org/3/a-i4646e.pdf (access 12.12.2015)Food Losses and Waste in the Context of Sustainable Food Systems (2014). A report by The High
Level Panel of Experts on Food Security and Nutrition, 8 HLPE REPORT.

Towards sustainable food system 197
Oeconomia 15 (2) 2016
Garnett, T. (2014). Three perspectives on sustainable food security: effi ciency, demand restraint, food system transformation. What role for life cycle assessment? Journal of Cleaner Pro-duction, 73, 10–18.
Godfrey, Ch.J. et al. (2010). The future of the global food system. Philosophical Transactions B. The Royal Society, August. Retrieved from http://rstb.royalsocietypublishing.org/con-tent/ 365/1554/2769.article-info (accessed 12.12.2015).
Grunert, K.G. (2005). Food quality and safety: consumer perception and demand. European Re-view of Agricultural Economics, 32 (3), 369–391.
Hawkes, C. (2015). Four key actions to move towards a sustainable food system: A “consumption” perspective. II International Conference on Global Food Security, 11–14 Oct. 2015, Itha-ca, NY, USA.
Hendrics, S.L. (2015). The food insecurity continuum; a novel tool for understanding food insecu-rity as a range of experiences. Food Security, 7 (3), 609–619.
Herforth, A., Lidder, P., Gill, M. (2015). Strengthening the links between nutrition and health outcomes and agricultural research (Editorial). Food Security, 7 (3), 457–461.
Ingram, J.S.I. et. al. (2013). Priority research questions for the UK food system. Food Security, 5 (4), 617–636.
Joppen, L. (2006). Early stage of life critical. Food Engineering & Ingredients, 31 (1), 8–10.Juran, J., Gryna, F.M. (1974). Jakość, projektowanie, analiza. WNT, Warszawa.Kavallari Aikaterini, Fellmann T., Gay, S.H. (2014). Shocks in economic growth=shocking effects
for food security? Food Security, 6 (6), 567–583.Maruchecka, A., Greis, N., Menac, C., Linning, C. (2011). Product safety and security in the global
supply chain: Issues, challenges and research opportunities. Journal of Operations Ma-nagement, 29, 709.
Masar, I. (2015). Food waste reduction. Economy versus the environment competitiveness or complementarity. International Conference, IERiGŻ “Ekonomia versus środowisko – konkurencyjność czy komplementarność”, 23–25 Nov., Jachranka.
Mubarik, A., Nguyen The Quan, Ngo Van Naum (2006). Analysis of the impact of the urbanization and enhanced incomes on demand for food quality in Hanoi. XXVI IAAE Conference. Gold Coast. Australia, August 12–18.
OECD (2008). Lang T., Food Matters: An integrative approach to food policy.Pimental, D. et al. (1997). Water resources: Agriculture, the Environment and Society. BioScience,
47 (2). Pingali P. (2006). Agricultural growth and economic development: a view through the globalisation
lens. Presidential address. 26 IAAE Conference. Gold Coast. Australia, August 12–18.Raport Federacji Polskich Banków Żywności (2013). FPBŻ, Warszawa.Roy S., (2012). Quality by design: A holistic concept of building quality in pharmaceuticals. Inter-
nationa. Journal of Pharmaceutical and Biomedical Research, 3 (2), 100–108.Schneider, K., Gugerty, M.K. (2011). Agricultural Productivity and Poverty Reduction: Linkages
and Pathways. The Evans School Review 56, 1.Segerson, K. (1999). Mandatory versus voluntary approaches to food safety. Agribusiness, 15 (1),
53–70.Shaw, I. (2005). It is Safe to Eat? Springer.Singham, P., Birwal, P., Yadav, B.K. (2015). Importance of Objective and Subjective Measure-
ment of Food Quality and their Inter-relationship. Journal of Food Processing Techno-logy 6, 488.
Slovic, P. (2002). Perception of risk. Science, 236, 280–285.Świderski, F. (1999). Towaroznawstwo żywności przetworzonej. Wyd. SGGW, Warszawa.Unnevehr, L., Hogeveen, H., Huirne, R. (2003). New Approaches to Food Safety Economics.
Springer.

198 R.I. Zalewski, E. Skawińska
Acta Sci. Pol.
Werbeke, W. (2005). Agriculture and the food industry in the information age. European Review of Agricultural Economics, 32 (3), 347–368.
WHO (2006). Food safety, foodborne disease. Available at www.who.int/foodsafety/en.World Bank (2014). Learning from world bank history: agriculture and food-based approaches
to address malnutrition (Agricultural and environmental sciences discussion paper 10). World Bank. World Bank Report 88740-GLB, Washington.
Zalewski, R.I. (2008). Zarządzanie jakością w produkcji żywności. Wyd. Akademia Ekonomiczna, Poznań.
Zalewski, R.I., Skawińska, E. (2004). Flexibility is next beyond quality and effi ciency in produc-tion systems. [In:] Wan Rong (Ed.). Focussing New Century. Commodity – Trade – Envi-ronment. China Agriculture Press, 294–300.
Zalewski, R.I., Skawińska, E. (2005). The role of quality management systems issued by ISO in economic growth. [In:] S. Rudolf (Ed.), New World Order: Economic, Social and Politi-cal Tendencies at the beginning of Third Millennium. Lodz University Press, 231–252.
Żurek, K. (2012). European Food Regulation After Enlargement. Facing Challenges of Diversity. Martinuss Nijhoff Publisher.
W KIERUNKU ZRÓWNOWAŻONEGO SYSTEMU ŻYWNOŚCIOWEGO
Streszczenie. W publikacji dokonano, na podstawie analizy literatury, porównania kategorii „bezpieczeństwa zdrowotnego” z punktu widzenia nauk przyrodniczych i „bezpieczeństwa ekonomicznego żywności” oraz z perspektywy konsumenta i producenta. Bezpieczeństwo zdrowotne i jakość żywności są funkcją jej różnorodnych właściwości (mikrobiologicz-nych, chemicznych i fi zycznych), które wpływają na ryzyko jej spożycia. Przedyskutowano różnice jego oceny przez konsumentów, producentów i nadzór nad rynkiem. Bezpieczeń-stwo ekonomiczne dla konsumenta i producenta określono jako mix składający się z do-stępności, stabilności i korzyści w dłuższym okresie. Oba rodzaje bezpieczeństwa tworzą system żywnościowy w skali regionu, kraju, a nawet świata. Przedstawiono wpływ niektó-rych czynników zaburzających jego stabilność (straty i marnotrawstwo żywności w łańcuchu „od pola do stołu”, zmiany klimatyczne i defi cyt wody). Ich ograniczenie może doprowadzić w przyszłości do zrównoważonego systemu żywności. Przedstawiono zbiór oczekiwanychi możliwych działań zmierzających do zrównoważenia systemu w przyszłości.
Słowa kluczowe: bezpieczeństwo żywnościowe, jakość, system żywnościowy, zrównowa-żony system żywnościowy
Accepted for print: 05.04.2016
For citation: Zalewski R.I., Skawińska E. (2016). Towards sustainable food system. Acta Sci. Pol., Oeconomia, 15 (2), 187–198.

CONTENTSSPIS TREŚCI
Dorota Bednarska-OlejniczakCorporate social responsibility as part of company image management in banking institutions ................................................................................................................ 5Społeczna odpowiedzialność biznesu a kształtowanie wizerunku banku
Jadwiga BożekTransformation of agrarian structure in EU countries within the period of 2010–2013 ........................................................................................................... 15Przemiany struktury agrarnej w krajach Unii Europejskiej w okresie 2010–2013
Agnieszka Brelik Valorization of public goods in the environment of agritourism farms – an attempt at modeling ............................................................................... 27Waloryzacja dóbr publicznych w otoczeniu gospodarstw agroturystycznych – próba modelowania
Justyna Franc-Dąbrowska, Małgorzata Porada-Rochoń, Radosław SuwałaEnterprise insolvency and the effects on the local and regional community – the social economy perspective ............................................................................ 37Niewypłacalność przedsiębiorstw a skutki dla społeczności lokalnej i regionalnej – perspektywa ekonomii społecznej
Aleksander Grzelak The importance of selected determinants of assets reproduction in agriculturalholdings in Poland ................................................................................................... 49Znaczenie wybranych determinant procesów reprodukcji majątku gospodarstw rolnych w Polsce
Jacek KamińskiParadigm of sustainable development in marketing ............................................... 63Paradygmat zrównoważonego rozwoju w marketingu
Iwona Kowalczuk, Krystyna Gutkowska, Marta Sajdakowska, Sylwia Żakowska-Biemans
Product innovativeness and its impact on health related importance of food in the catering business ............................................................................... 75Innowacyjność produktowa i jej wpływ na prozdrowotne znaczenie żywnościw sektorze usług gastronomicznych
Grzegorz MaciejewskiPurchasing places of consumer goods in selected European countries ................... 87Miejsca zakupu dóbr konsumpcyjnych w wybranych krajach Europy

Grzegorz Mazurek, Jolanta TkaczykInformal channels of communication used by enterprises .................................... 103Wykorzystanie komunikacji nieformalnej przez przedsiębiorstwa
Anna NowakThe competitiveness of agriculture of EU member countries of Centraland Eastern Europe ................................................................................................ 113Konkurencyjność rolnictwa krajów Europy Środkowo-Wschodniej będących członkami Unii Europejskiej
Joanna Rakowska Changes in ageing of communes (LAU2s) in Poland between 1995 and 2014 .... 127Zmiany poziomu starości demografi cznej (LAU2s) Polski w latach 1995–2014w ujęciu lokalnym
Paulina StolarczykEquality of chances for people with disabilities in the labour market .................. 139Równość szans osób niepełnosprawnych na rynku pracy
Dariusz StrzębickiElectronic marketplaces as a form of organization of trade in enterprises ........... 151Rynki elektroniczne jako forma organizowania wymiany handlowej w przedsiębiorstwach
Zygmunt WaśkowskiEvaluating the potential of sports events as tools of promotion for cities and regions on an international scale .................................................................... 163Ocena potencjału wydarzeń sportowych jako narzędzia kreowania wizerunkumiast i regionów na arenie międzynarodowej
Julia Wojciechowska-Solis, Anna Mazurek-Kusiak, Andrzej SorokaThe infl uence of specialized training on the quality of hotel customers service ...... 173Wpływ specjalistycznych szkoleń na jakość obsługi klientów hotelowych
Romuald I. Zalewski, Eulalia SkawińskaTowards sustainable food system ......................................................................... 187W kierunku zrównoważonego systemu żywnościowego