Embed Size (px)
Citation preview
8/3/2019 Iwwerp Powell
http://slidepdf.com/reader/full/iwwerp-powell 1/8
Tropical cyclone wind records and damage potential
Mark D. Powell*
*
National Oceanic and Atmospheric Administration, AOML Hurricane Research Division Florida State University Center for Ocean-Atmospheric Prediction Studies2035 East Paul Dirac Drive, Tallahassee FL 32310 USA, [email protected]
ABSTRACT
Accurate wind event documentation is a requirement for establishing a reliable tropical cycloneclimatology for use in risk assessment and global climate change applications. Record breakingevents have recently been established on the basis of limited data and "expert" panels. Suchdata need to be open to independent public scrutiny, debate, and peer review.
1. INTRODUCTION
Recently the World Meteorological Organization (WMO) assigned world record wind events for tropical cyclones in Hurricane Gustav (2008, Cuba) and Tropical Cyclone Olivia (1996, Austra-lia). Circumstances surrounding these events have not been published in peer-reviewed litera-ture, rather, the WMO convened panels of experts who reached consensus on the veracity of thewind speed reports and recommended the world record status. Unfortunately the process for de-termining these records was not open and there are serious concerns about their validity. Theclosed process not only affects world record events but many significant events in individualglobal tropical cyclone basins are determined in a similar manner. Its important to open the process up to multiple disciplines who have a stake in the outcome. Stakeholders include the
wind engineering, risk modeling, and climate change research communities. Here we will dis-cuss challenges and potential solutions in determining tropical cyclone wind climates and discussalternative metrics for classifying their destructive potential.
2. HURRICANE GUSTAV
The Cuban Metorological Institute presented a Dines anemometer chart trace for HurricaneGustav (Fig. 1) that was briefly served as a world record wind event. Meteorologist JoseRubiera-Torres provided documentation that is also available on the Weather Underground web
site. The author was asked to provide an opinion on this r ecord shortly after the event. Based onthe location of the station (Fig 2) and the H*Wind wind field analysis there is conflicting evi-dence.
The Dines record shows a series of very sharp gusts well above what might be consideredthe mean of the trace, with the peak of 183 kts reported near 2235 UTC. The gust excursions aremuch farther from the mean than the lulls which hints at inertia effects. The anemometer wasreported to be in good mechanical condition but the mast failed during the eyewall passage. Acontainer truck with a full load of appliances was reported toppled over beneath a highway over-
Presented at the International Workshop on Wind Engineering Research and Practice, May 28-
29, 2010, Chapel Hill, NC, USA
8/3/2019 Iwwerp Powell
http://slidepdf.com/reader/full/iwwerp-powell 2/8
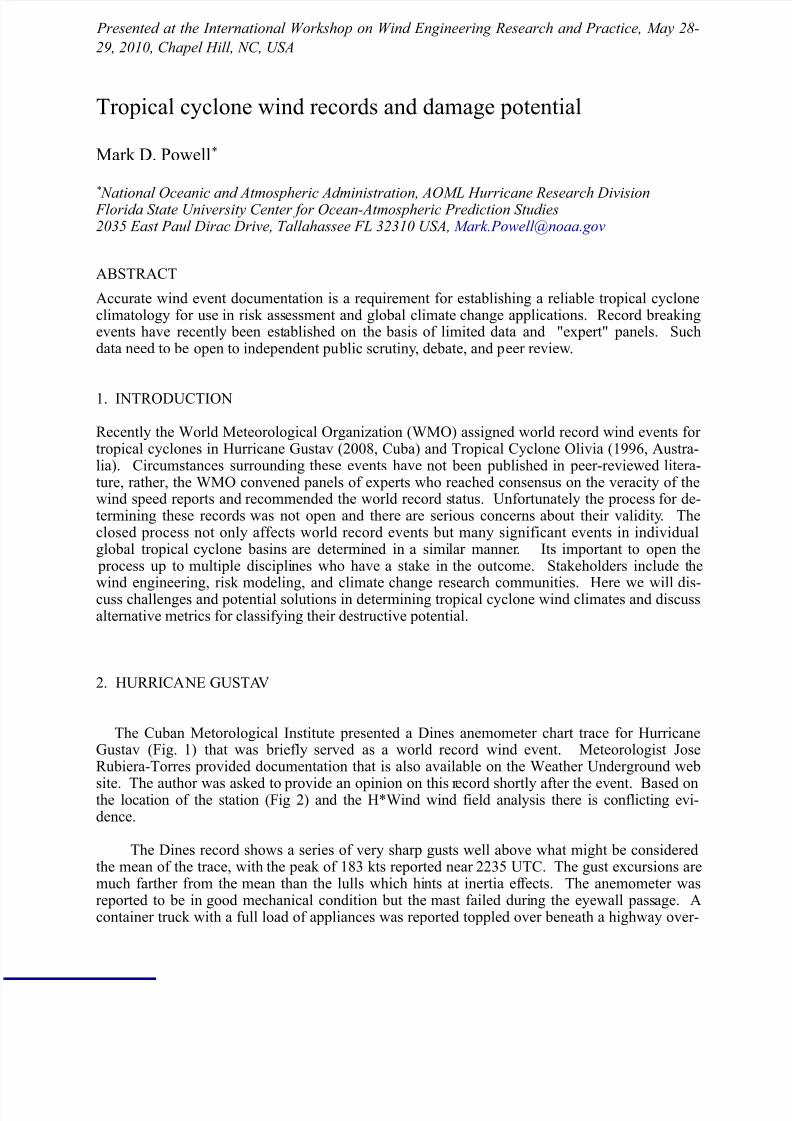
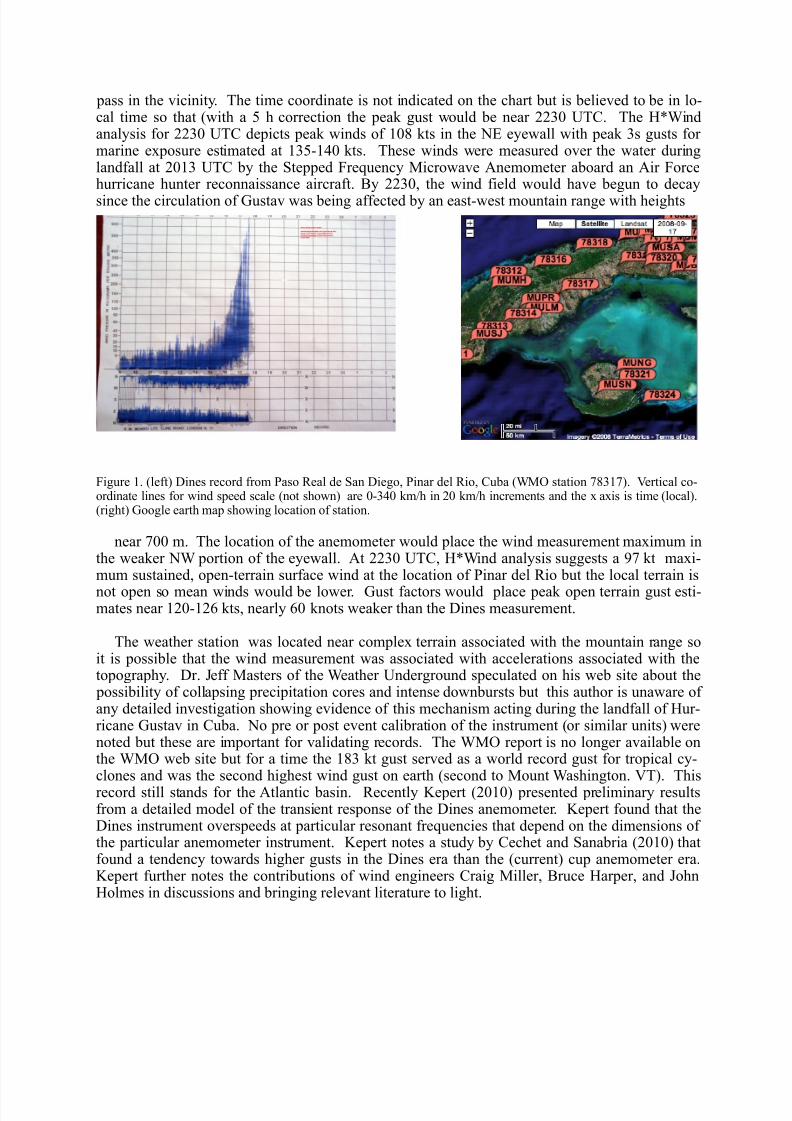
pass in the vicinity. The time coordinate is not indicated on the chart but is believed to be in lo-cal time so that (with a 5 h correction the peak gust would be near 2230 UTC. The H*Windanalysis for 2230 UTC depicts peak winds of 108 kts in the NE eyewall with peak 3s gusts for marine exposure estimated at 135-140 kts. These winds were measured over the water duringlandfall at 2013 UTC by the Stepped Frequency Microwave Anemometer aboard an Air Forcehurricane hunter reconnaissance aircraft. By 2230, the wind field would have begun to decay
since the circulation of Gustav was being affected by an east-west mountain range with heights
Figure 1. (left) Dines record from Paso Real de San Diego, Pinar del Rio, Cuba (WMO station 78317). Vertical co-ordinate lines for wind speed scale (not shown) are 0-340 km/h in 20 km/h increments and the x axis is time (local).(right) Google earth map showing location of station.
near 700 m. The location of the anemometer would place the wind measurement maximum inthe weaker NW portion of the eyewall. At 2230 UTC, H*Wind analysis suggests a 97 kt maxi-mum sustained, open-terrain surface wind at the location of Pinar del Rio but the local terrain is
not open so mean winds would be lower. Gust factors would place peak open terrain gust esti-mates near 120-126 kts, nearly 60 knots weaker than the Dines measurement.
The weather station was located near complex terrain associated with the mountain range soit is possible that the wind measurement was associated with accelerations associated with thetopography. Dr. Jeff Masters of the Weather Underground speculated on his web site about the possibility of collapsing precipitation cores and intense downbursts but this author is unaware of any detailed investigation showing evidence of this mechanism acting during the landfall of Hur-ricane Gustav in Cuba. No pre or post event calibration of the instrument (or similar units) werenoted but these are important for validating records. The WMO report is no longer available onthe WMO web site but for a time the 183 kt gust served as a world record gust for tropical cy-clones and was the second highest wind gust on earth (second to Mount Washington. VT). Thisrecord still stands for the Atlantic basin. Recently Kepert (2010) presented preliminary resultsfrom a detailed model of the transient response of the Dines anemometer. Kepert found that theDines instrument overspeeds at particular resonant frequencies that depend on the dimensions of the particular anemometer instrument. Kepert notes a study by Cechet and Sanabria (2010) thatfound a tendency towards higher gusts in the Dines era than the (current) cup anemometer era.Kepert further notes the contributions of wind engineers Craig Miller, Bruce Harper, and JohnHolmes in discussions and bringing relevant literature to light.
8/3/2019 Iwwerp Powell
http://slidepdf.com/reader/full/iwwerp-powell 3/8
Figure 2. 2230 UTC H*Wind analysis of Hurricane Gustav on 30 August, 2008
3. TROPICAL CYCLONE OLIVIA
The new outright WMO world record wind speed was announced in January 2010 for Tropi-cal Cyclone Olivia, which occurred on Barrow Island, off the northwest part of Australia in 1996.That this record would come 14 years after the event and after an apparently unknown committee process is remarkable in itself. This record was documented through a couple of papers pre-sented at the Offshore Technology Conference in 1999 and has not yet been subjected to peer

8/3/2019 Iwwerp Powell
http://slidepdf.com/reader/full/iwwerp-powell 4/8
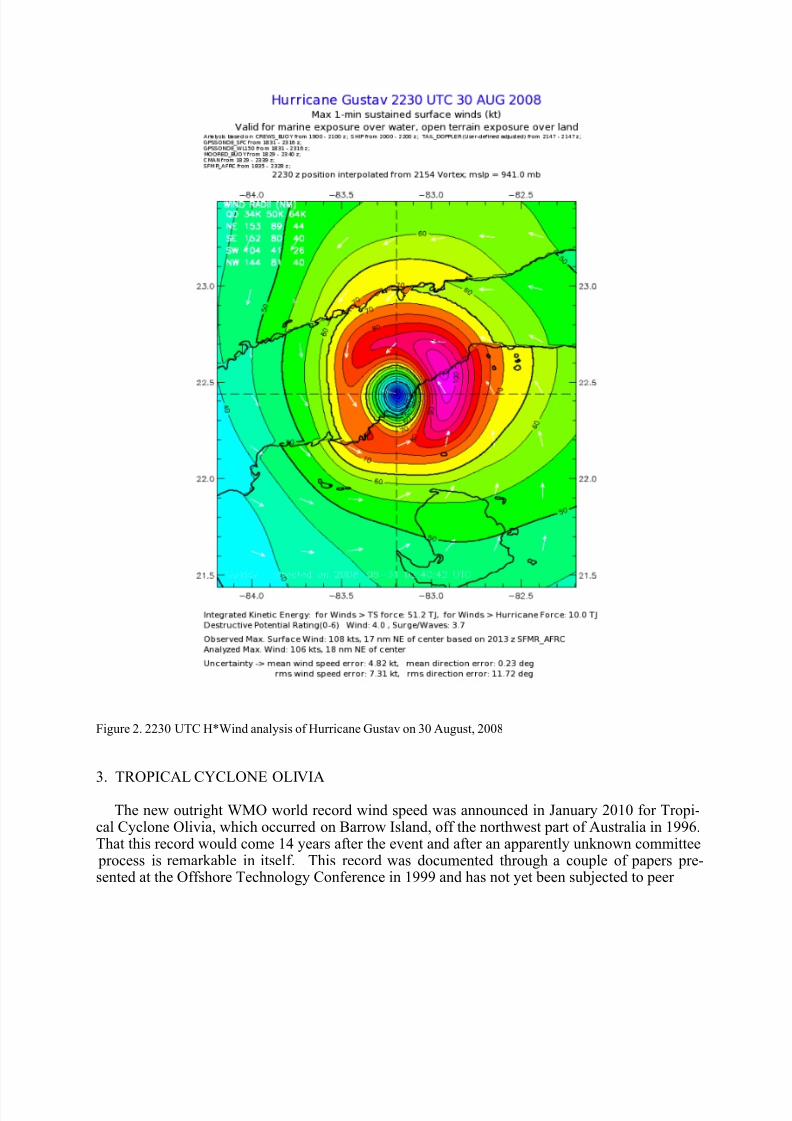
Figure 3. Tropical Cyclone Olivia (Imagery from Japan Meteorological Agency and annotated by Australian Bureau of Meteorology).
review. Buchan et al., 1999 discuss the impact of TC Olivia and Black et al., 1999 speculateon a possible eyewall mesovortex mechanism associated with a peak gust of 220 kt and addi-tional gusts of 199, 202, 187, and 161 over additional 5 min periods measured at Barrow Islandduring Olivia’s landfall. Gust factors over 5 min periods were of order 2.2-2.7, well in excess of the 1.3 mean from the same station and well beyond what is typically seen in hurricane eyewalls.Black et al., 1999 show three Learmonth radar reflectivity sweeps over a 20 min period thatshow Barrow Island on the inner edge of the eyewall but there are only three contours in the ra-dar reflectivity imagery so it’s not possible to see evidence of eyewall mesovortices. While the
relative humidity minimum relative to the two peak gusts suggests the possibility of a mesovor-tex, the evidence is inconclusive. Also puzzling is the apparent lack of any post-event calibrationof the actual instrument or the type of cup anemometer that made the measurements or any fo-rensic engineering investigation to see if the damage to designed structures was representative of what might occur in 220 kt wind gusts. Cup anemometers are known to overspeed at high windsso some correction may have been indicated if a post event wind tunnel calibration were con-ducted and published. The WMO World Weather Extremes archive web report mentions that theanemometer was regularly compared to a hand held anemometer but that fact has no relevance
8/3/2019 Iwwerp Powell
http://slidepdf.com/reader/full/iwwerp-powell 5/8
for extreme winds. It is interesting to note that the Australian Bureau of Meteorology assigns TCOlivia to a Saffir-Simpson Category 4 status despite the world record wind gust.
4. DISCUSSION ON “BEST TRACKING”
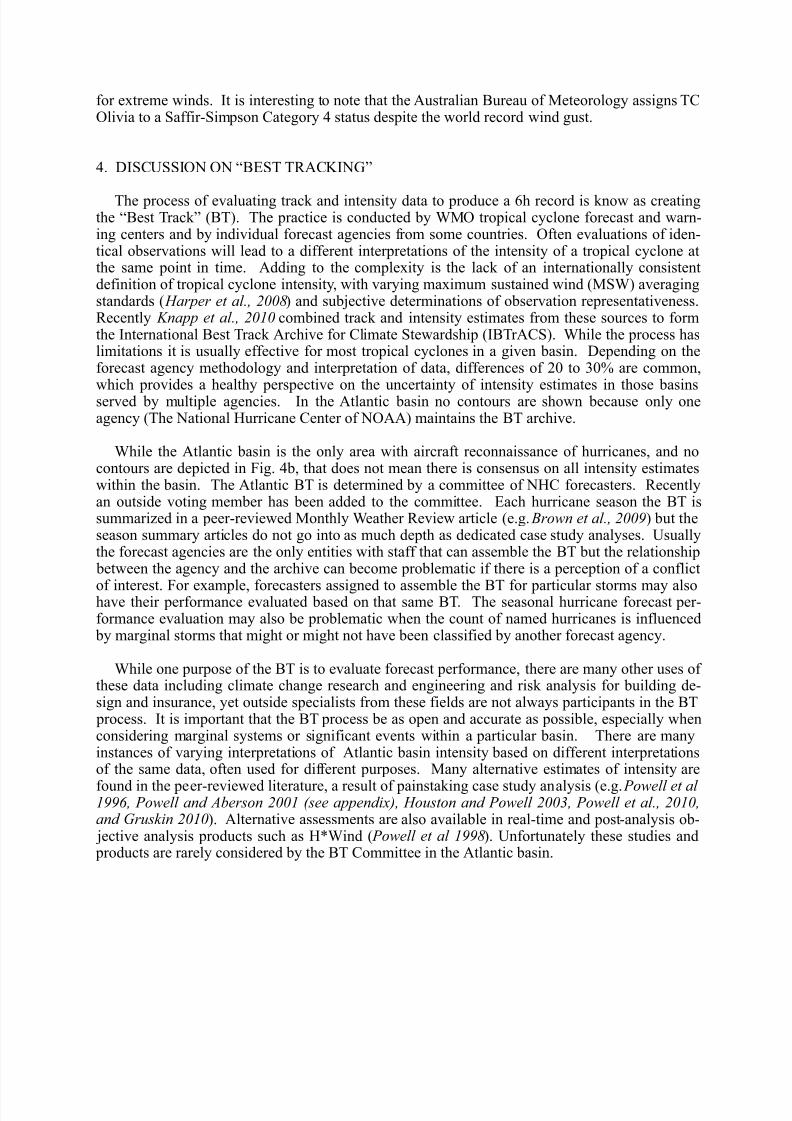
The process of evaluating track and intensity data to produce a 6h record is know as creatingthe “Best Track” (BT). The practice is conducted by WMO tropical cyclone forecast and warn-ing centers and by individual forecast agencies from some countries. Often evaluations of iden-tical observations will lead to a different interpretations of the intensity of a tropical cyclone atthe same point in time. Adding to the complexity is the lack of an internationally consistentdefinition of tropical cyclone intensity, with varying maximum sustained wind (MSW) averagingstandards ( Harper et al., 2008) and subjective determinations of observation representativeness.Recently Knapp et al., 2010 combined track and intensity estimates from these sources to formthe International Best Track Archive for Climate Stewardship (IBTrACS). While the process haslimitations it is usually effective for most tropical cyclones in a given basin. Depending on theforecast agency methodology and interpretation of data, differences of 20 to 30% are common,which provides a healthy perspective on the uncertainty of intensity estimates in those basinsserved by multiple agencies. In the Atlantic basin no contours are shown because only oneagency (The National Hurricane Center of NOAA) maintains the BT archive.
While the Atlantic basin is the only area with aircraft reconnaissance of hurricanes, and nocontours are depicted in Fig. 4b, that does not mean there is consensus on all intensity estimateswithin the basin. The Atlantic BT is determined by a committee of NHC forecasters. Recentlyan outside voting member has been added to the committee. Each hurricane season the BT issummarized in a peer-reviewed Monthly Weather Review article (e.g. Brown et al., 2009) but theseason summary articles do not go into as much depth as dedicated case study analyses. Usuallythe forecast agencies are the only entities with staff that can assemble the BT but the relationship between the agency and the archive can become problematic if there is a perception of a conflict
of interest. For example, forecasters assigned to assemble the BT for particular storms may alsohave their performance evaluated based on that same BT. The seasonal hurricane forecast per-formance evaluation may also be problematic when the count of named hurricanes is influenced by marginal storms that might or might not have been classified by another forecast agency.
While one purpose of the BT is to evaluate forecast performance, there are many other uses of these data including climate change research and engineering and risk analysis for building de-sign and insurance, yet outside specialists from these fields are not always participants in the BT process. It is important that the BT process be as open and accurate as possible, especially whenconsidering marginal systems or significant events within a particular basin. There are manyinstances of varying interpretations of Atlantic basin intensity based on different interpretationsof the same data, often used for different purposes. Many alternative estimates of intensity are
found in the peer-reviewed literature, a result of painstaking case study analysis (e.g. Powell et al 1996, Powell and Aberson 2001 (see appendix), Houston and Powell 2003, Powell et al., 2010,and Gruskin 2010). Alternative assessments are also available in real-time and post-analysis ob- jective analysis products such as H*Wind ( Powell et al 1998). Unfortunately these studies and products are rarely considered by the BT Committee in the Atlantic basin.
8/3/2019 Iwwerp Powell
http://slidepdf.com/reader/full/iwwerp-powell 6/8
Fig. 4 From Knapp et al., 2010 (their Fig. 6) from IBTrACS 1848-2007. a) Mean range of MSW (kt). b) Mean range of MSW normalized by the mean MSW (in percent).
CONCLUSION
Despite the WMO assigning records to wind speeds measured in Hurricane Gustav and TropicalCyclone Olivia, questions remain about the validity of these records and the process followed toassign the records. While these events were significant in their respective basins, the evidencefor records is lacking and includes much speculation. Determination of records and archives of extreme events benefits when many groups are examining the same information in an open proc-ess, resulting in either consensus or an estimate of the uncertainty of the intensity estimate. TheBT process would be improved by forming an open and interdisciplinary committee that givesconsideration to the peer reviewed literature and alternative interpretations of documentary ob-servations. Many of the issues brought up here about Hurricane Gustav and Severe Tropical Cy-clone Olivia could have been addressed by developing a more open and interdisciplinary processfor evaluating wind records.
A variety of observing platforms are now publicly available to help define the magnitude andextent of tropical cyclone wind fields. A variety of damage potential scale approaches may beconsidered in an attempt to synthesize the information to a couple of numbers that can portraythe threat to the public and help compare one event to another, with less sensitivity to the esti-mate of intensity. In addition to the Saffir-Simpson scale, a variety of metrics are available in-cluding Integrated Kinetic Energy based Wind and Storm Surge Destructive Potential ( Powell and Reinhold 2007 ), the Hurricane Destructive Index ( Kantha 2006 ), and some unpublished in-
8/3/2019 Iwwerp Powell
http://slidepdf.com/reader/full/iwwerp-powell 7/8
dices developed for financial risk hedging products (Carvill and Willis (Owen 2010) HurricaneIndices). These approaches will be discussed further in the symposium presentation.
References
Brown, D., J. Beven, J. Franklin, and E. Blake, 2009. The Atlantic hurricane season of 2008. Mon. Wea. Rev., 137.
Cechet, R. P. and L. A. Sanabria, 2010: Extreme-value time-series analysis of Australian Region A gust wind speeds to examine instrument bias. Proceedings of the AMOS Annual Conference, Canberra, Australia, Aus- tralian Meteorological and Oceanographic Society.
Gruskin, Z., 2010. Structure and evolution of a possible U. S. landfalling tropical storm in 2006. Mon. Wea. Rev.,
138, 265-278.
Harper, B., J. Kepert, and J. Ginger, 2008. Guidelines for converting between various wind averaging periods in
tropical cyclone conditions. WMO Report, 54 pp.
Houston, S. H., and M. D. Powell, 2003: Reconstruction of Significant Hurricanes affecting Florida Bay: The Great1935 Hurricane and Hurricane Donna (1960). J. Coastal Research, 19, 503-513.
Kantha, L. 2006: Time to replace the Saffir-Simpson Hurricane Scale? EOS , 87, 3-6.
Kepert, J., 2010. Modeling the transient response of the Dines anemometer in tropical cyclone winds. Proceedingsof the 29th AMS Conference on Hurricanes and Tropical Meteorology, Tuscon, AZ, May 10-14.
Knapp, K., M. Kruk, D. Levinson, H. Diamond, and C. Neumann, 2010. The International Best Track Archive for Climate Stewardship (IBTrACS). Bull. Amer. Meteor. Soc., 91, 363-376.
Masters, J. 2010. Looking back at Hurricane Gustav’s record 211 mph wind gust.http://www.wunderground.com/blog/JeffMasters/comment.html?entrynum=1174
Owens, B. F. 2010. The Willis Hurricane Index. Proceedings of the 29th AMS Conference on Hurricanes andTropical Meteorology, Tuscon, AZ, May 10-14.
Powell, M. D., and S. H. Houston, 1996: Hurricane Andrew's Landfall in South Florida. Part II: Surface WindFields and Potential Real-time Applications. Weather. Forecast., 11, 329-349.
Powell, M. D., S. H. Houston, L. R. Amat, and N Morisseau-Leroy, 1998: The HRD real-time hurricane windanalysis system. J.Wind Engineer. and Indust. Aerodyn. 77&78, 53-64.
Powell, M. D., and S. D. Aberson, 2001: Accuracy of United States tropical cyclone landfall forecasts in the Atlan-tic basin 1976-2000. Bull. Amer. Met. Soc., 82, 2749-2767.
Powell, M. D., S. Murillo, P. Dodge, E. Uhlhorn, J. Gamache, V. Cardone, A. Cox, S. Otero, N. Carrasco, B. An-nane, and R. St. Fleur, 2010: Reconstruction of Hurricane Katrina’s wind fields for storm surge and wave hind-
casting. Ocean Engineering, 37, 26-36.
Powell, M. D., E. Uhlhorn, and J. Kepert, 2009: Estimating maximum surface winds from hurricane reconnaissanceaircraft. Weather Forecast., 24, 868-883.
Powell, M. D. and T. A. Reinhold, 2007: Tropical cyclone destructive potential by integrated kinetic energy. Bull.Amer. Meteor. Soc., 87, 513-526.

8/3/2019 Iwwerp Powell
http://slidepdf.com/reader/full/iwwerp-powell 8/8