Embed Size (px)
Citation preview

Wouter HartmanPrincipal Geotechnical Engineer
B. Lecing, D. Tongue & J. Higgs
10th Coal Operators Conference, Wollongong11‐12th February 2010
11/02/2010 1

Presentation Layout• Introduction• Background to non‐destructive testing • Non‐Destructive Testing Set‐up and Method• Test output• Recent Findings• Tests Results• Conclusions• Future Work
11/02/2010 2
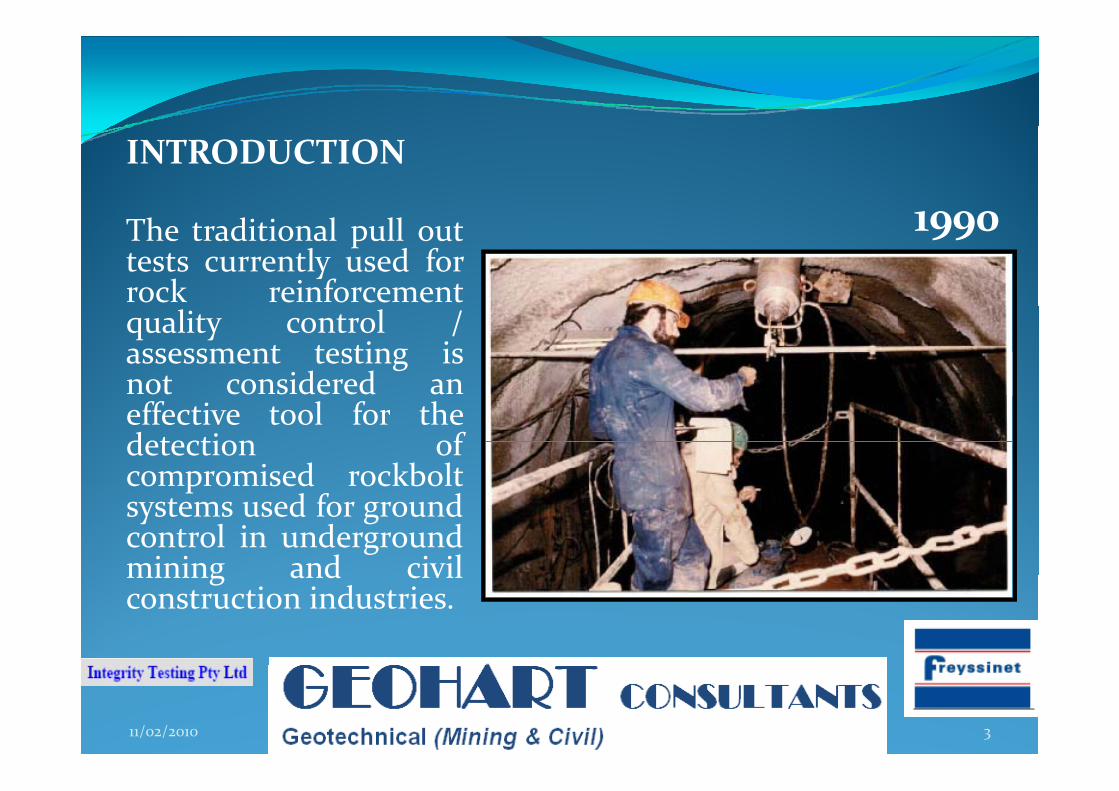
INTRODUCTION
1990The traditional pull outtests currently used forrock reinforcement
1990
quality control /assessment testing isnot considered aneffective tool for thedetection ofcompromised rockboltcompromised rockboltsystems used for groundcontrol in undergroundmining and civilmining and civilconstruction industries.
11/02/2010 3
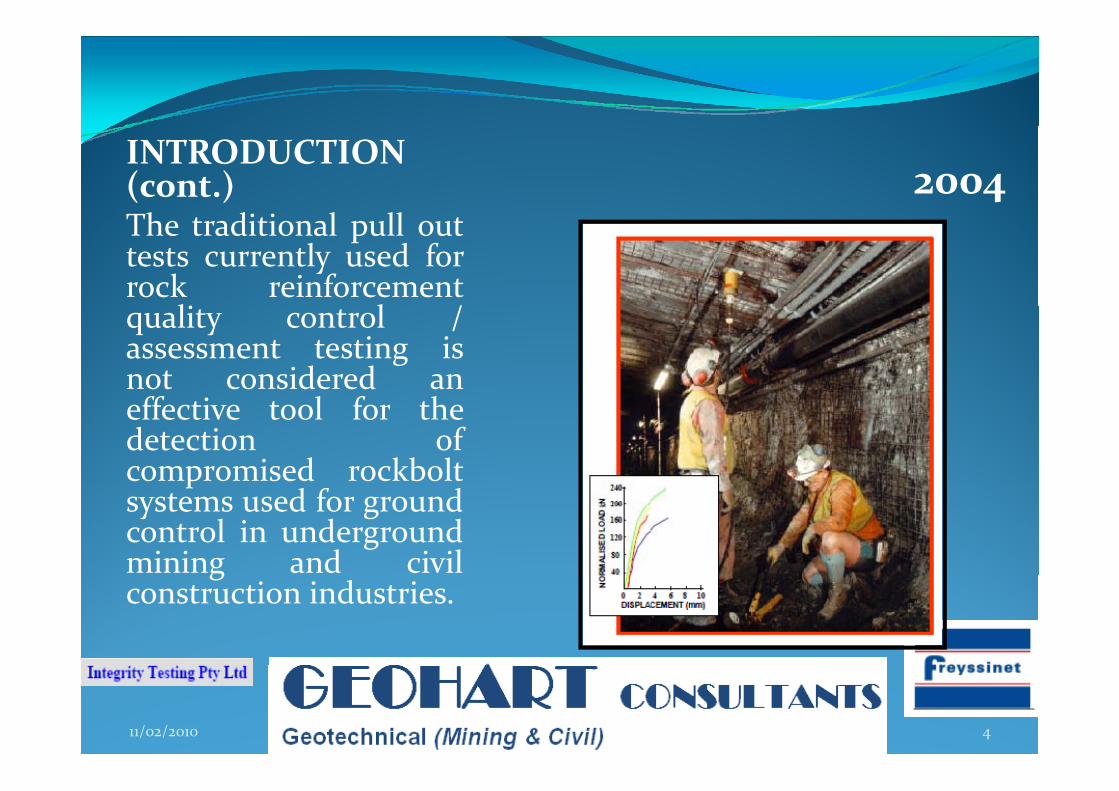
INTRODUCTION (cont.) Th di i l ll
2004The traditional pull outtests currently used forrock reinforcement
li l /quality control /assessment testing isnot considered aneffective tool for thedetection ofcompromised rockboltpsystems used for groundcontrol in undergroundmining and civilgconstruction industries.
11/02/2010 4

INTRODUCTION (cont.) 2009
The traditional pull outtests currently used forrock reinforcement qualitrock reinforcement qualitycontrol /assessmenttesting is not consideredan effective tool for thean effective tool for thedetection of compromisedrockbolt systems used forground control inground control inunderground mining andcivil constructionindustries.
11/02/2010 5

INTRODUCTION (cont.)
It is acknowledged that pull tests have an importantrole to play in static and quasi static ground supportdesi ns in determinin critical bond len ths throu hdesigns in determining critical bond lengths throughshort anchorage testing. However anchorage capacitytesting does not provide an underground operationg p g pwith any reassurance regarding bolt integrity, whichcould have been compromised during installation oraffected by in‐situ aggressive conditions that causeaffected by in‐situ aggressive conditions that causecorrosion.
11/02/2010 6

INTRODUCTION (cont.)
HOW WOULD WE REASURE OURSELFS THAT THEQUALITY OF ROCK REINFORCEMENTINSTALLATION IS FOLLOWING GROUND SUPPORTSTANDARD SPECIFICATION?
• Ongoing training of personnel and supervision how• Ongoing training of personnel and supervision ‐ howeffective is that when complacency steps in…?• Contractor quality management systems …?q y g y• Audits (very superficial as practice winds down tonormal after audit)
11/02/2010 7

INTRODUCTION (cont.)
HOW WOULD WE REASUREOURSELFS THAT THE INTEGRITYOURSELFS THAT THE INTEGRITYOF ROCK REINFORCEMENT IS NOTCOMPROMISED THROUGHCORROSION AND SUBSEQUENTBOLT FAILURE WHICH IS NOTIMMEDIATELY DETECTEDIMMEDIATELY DETECTED.
11/02/2010 8
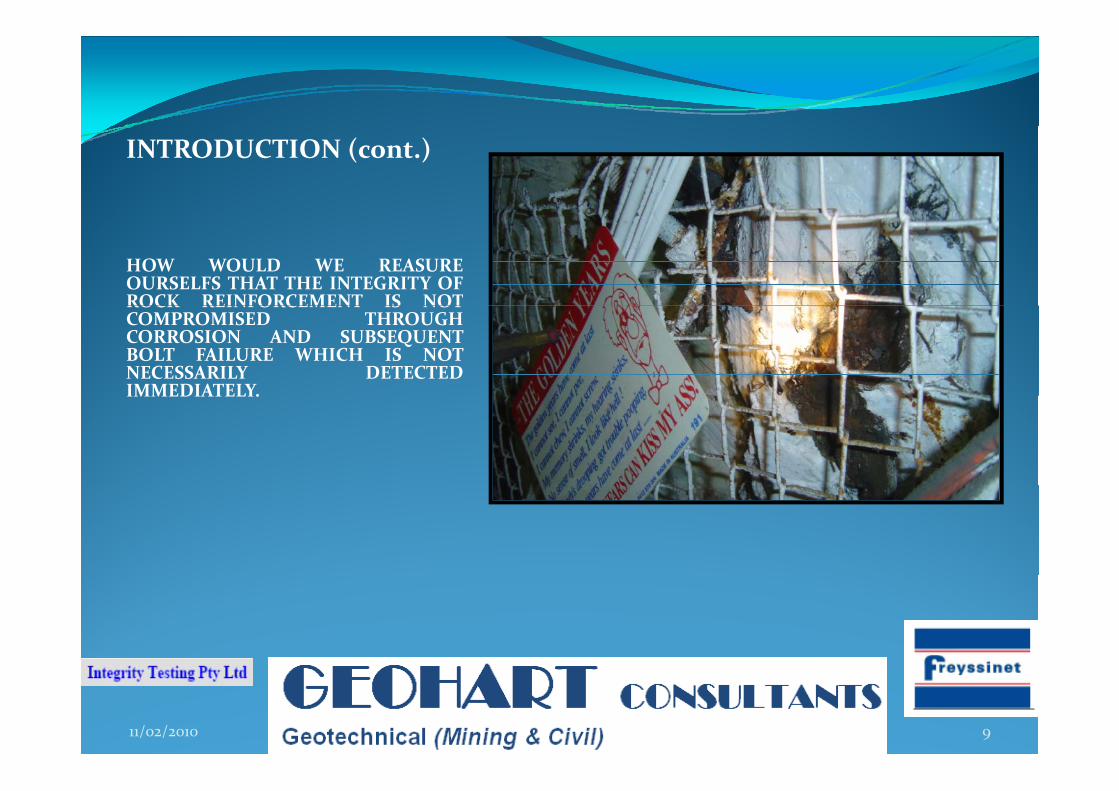
INTRODUCTION (cont.)
HOW WOULD WE REASUREOURSELFS THAT THE INTEGRITY OFROCK REINFORCEMENT IS NOTROCK REINFORCEMENT IS NOTCOMPROMISED THROUGHCORROSION AND SUBSEQUENTBOLT FAILURE WHICH IS NOTNECESSARILY DETECTEDIMMEDIATELY.IMMEDIATELY.
11/02/2010 9
BACKGROUND TO NON‐DESTRUCTIVE INTEGRITY TESTING
In simple terms the modified shock test, which is described by Higgsd T ( ) i i i i h bl h fand Tongue (1999), is a seismic test using a hammer blow as the force
and a transducer to pick up the resultant vibrations. With theapplication of digital filtering techniques an accurate mechanicaladmittance vs frequency plot is obtained which can then beadmittance vs. frequency plot is obtained which can then beinterpreted using the concepts developed by Davis & Dunn (1974).
This non‐destructive method by vibration has its origins from DavisThis non destructive method by vibration has its origins from Davisand Dunn where they carried out various types of non‐destructivepile tests on sites in Western Europe and other French speakingcountries for “The Centre Experimental de Recherches et d’Etudes duB i d T P bli ” (CEBTP) f FBatiment et des Travaux Publics” (CEBTP) of France.
11/02/2010 10

BACKGROUND TO NON‐DESTRUCTIVE INTEGRITY TESTING
Th d l f h A li b d i h d d i h lThe development of the Australian based testing method started in the late80’s and has been used for the correct assessment on a large variety ofelements, which now exceeds well over 1,000,000 tests for more than 20years (Higgs, 1975).Integrity Testing (i.e. developers of the system) hasy gg 975 g y g ( p y )for over 15 years carried out testing of long length steel rods, either asstrand or solid steel bars. Possibly the most notable project being forBHP, when they owned the Whyalla steel works where they testedthe tie rods holding back the crucial steel pile wall of the coalthe tie rods holding back the crucial steel pile wall of the coalhandling jetty.
The rods were tested and not only were the defective rods identifiedThe rods were tested and not only were the defective rods identifiedbut it was indicated at what point the rods had lost a large crosssection. This was located at a point where the rods came close to thebase of the coal handling pit and water was seeping onto the rods
h l f l b k d hg p p g
causing corrosion. Thus a large successful background in the testingof steel embedded elements, generally with the lengths in excess of 5meters.
11/02/2010 11

NON ‐ DESTRUCTIVE TESTING AND SET‐UP
There are four components to the system:There are four components to the system:
(i) A Toughbook / Notebook ‐ thisis used to collect data andproviding power via a USBproviding power via a USBcable for the analogue/digitalconverter
(ii) Analogue/Digital Converter encased inclosed unit ‐ this converts the signalgfrom the transducer into a digitalformat. The converter is soft wired tothe transducer .
(iii) Transducer – which is held at the endof bolt (i.e. collar of hole during theof bolt (i.e. collar of hole during thetest. A signal / pulse is obtained,which is generated by a tapping device/ small hammer.
(iv) The small hammer or tapping devicehas to make contact against the platehas to make contact against the plateor nut of the bolt during the test.
11/02/2010 12
NON ‐ DESTRUCTIVE TESTING AND SET‐UP
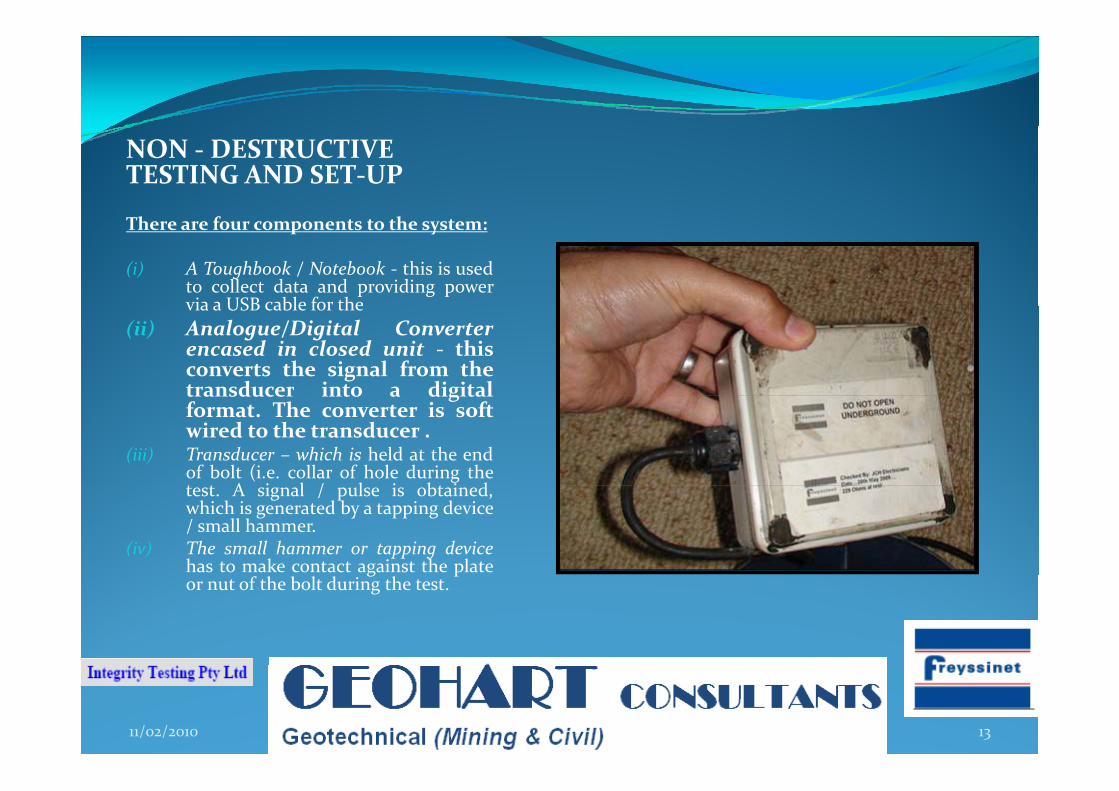
There are four components to the system:
(i) A Toughbook / Notebook ‐ this is usedto collect data and providing powervia a USB cable for thevia a USB cable for the
(ii) Analogue/Digital Converterencased in closed unit ‐ thisconverts the signal from thetransducer into a digitaltransducer into a digitalformat. The converter is softwired to the transducer .
(iii) Transducer – which is held at the endof bolt (i.e. collar of hole during thet t A i l / l i bt i dtest. A signal / pulse is obtained,which is generated by a tapping device/ small hammer.
(iv) The small hammer or tapping devicehas to make contact against the plateg por nut of the bolt during the test.
11/02/2010 13

NON ‐ DESTRUCTIVE TESTING AND SET‐UP
There are four components to thesystem:
(i) A Toughbook / Notebook ‐ this is usedt ll t d t d idito collect data and providing powervia a USB cable for the
(ii) Analogue/Digital Converter encased inclosed unit ‐ this converts the signalfrom the transducer into a digitalgformat. The converter is soft wired tothe transducer .
(iii) Transducer – which is held atthe end of bolt (i.e. collar ofhole during the test A signal /hole during the test. A signal /pulse is obtained, which isgenerated by a tapping device/ small hammer.
(iv) The small hammer or tapping device(iv) The small hammer or tapping devicehas to make contact against the plateor nut of the bolt during the test.
11/02/2010 14

NON ‐ DESTRUCTIVE TESTING AND SET‐UP
There are four components to the system:
(i) A Toughbook / Notebook ‐ this is usedto collect data and providing powervia a USB cable for thevia a USB cable for the
(ii) Analogue/Digital Converter encased inclosed unit ‐ this converts the signalfrom the transducer into a digitalformat. The converter is soft wired tothe transducerthe transducer .
(iii) Transducer – which is held at the endof bolt (i.e. collar of hole during thetest. A signal / pulse is obtained,which is generated by a tapping device/ ll h/ small hammer.
(iv) The small hammer or tappingdevice has to make contactagainst the plate or nut of thebolt during the testbolt during the test.
11/02/2010 15
TEST OUTPUT
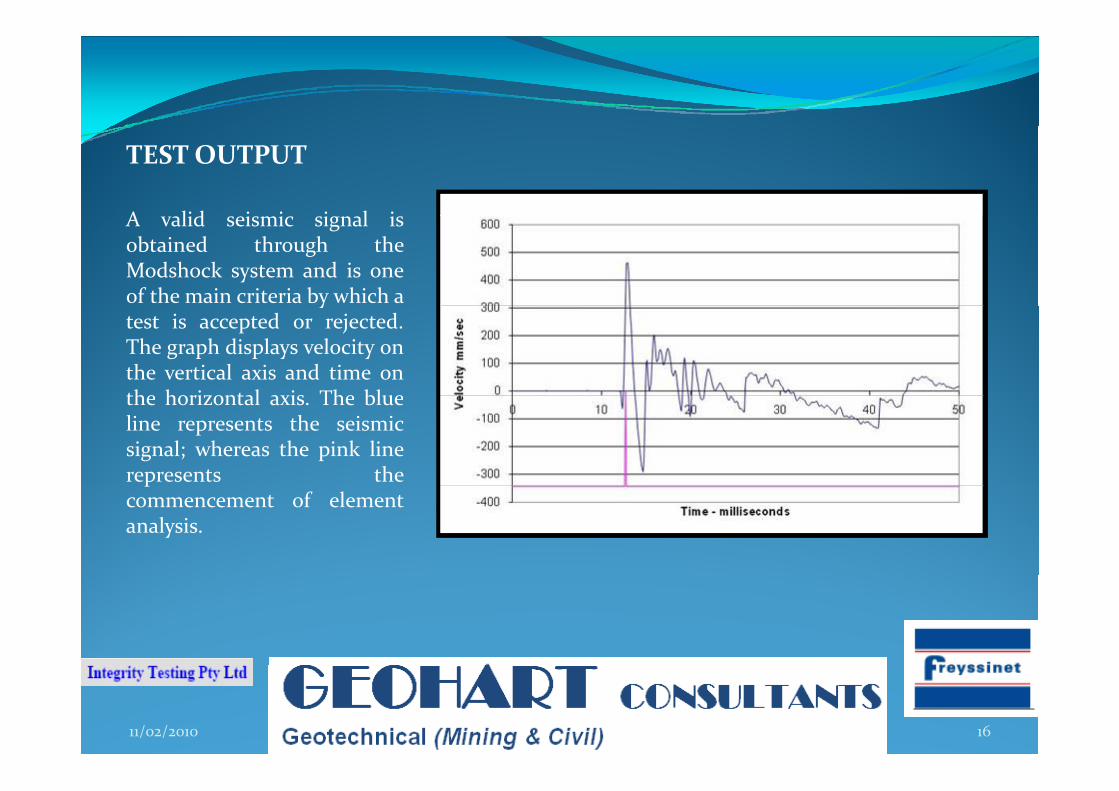
A lid i i i l iA valid seismic signal isobtained through theModshock system and is oneof the main criteria by which aytest is accepted or rejected.The graph displays velocity onthe vertical axis and time onthe horizontal axis The bluethe horizontal axis. The blueline represents the seismicsignal; whereas the pink linerepresents thepcommencement of elementanalysis.
11/02/2010 16
TEST OUTPUT
O f th it l i f i f ti bt i d f th d t ti t t iOne of the vital pieces of information obtained from the non‐destructive test isthe “Head Stiffness” as this is the basis of all the load predictions and it alsoindicates the serviceability of the total bolt system. The head stiffness is the “E”prime of the bolt measured as a direct measurement of the first part of theprime of the bolt, measured as a direct measurement of the first part of the“structural stiffness plot”, and is similar to a load/displacement graph for a pullout test.Th “b lt h d tiff (t / )” i d t th t d l tiffThe “bolt head stiffness (tonnes/mm)” is compared to the two model stiffnessvalues “E” min and “E” max. “E” min is a bolt model with the bolt pinned at itstoe (end anchored) but with no clamping (no resin or grouting) along itslength “E” max is a bolt model with an infinite rigid base and “clamped” (fulllength. E max is a bolt model with an infinite rigid base and clamped (fullcolumn grouted / resin) along its length. These models are based on the workcarried out by Davis & Dunn (1974).
11/02/2010 17
TEST OUTPUTTEST OUTPUT
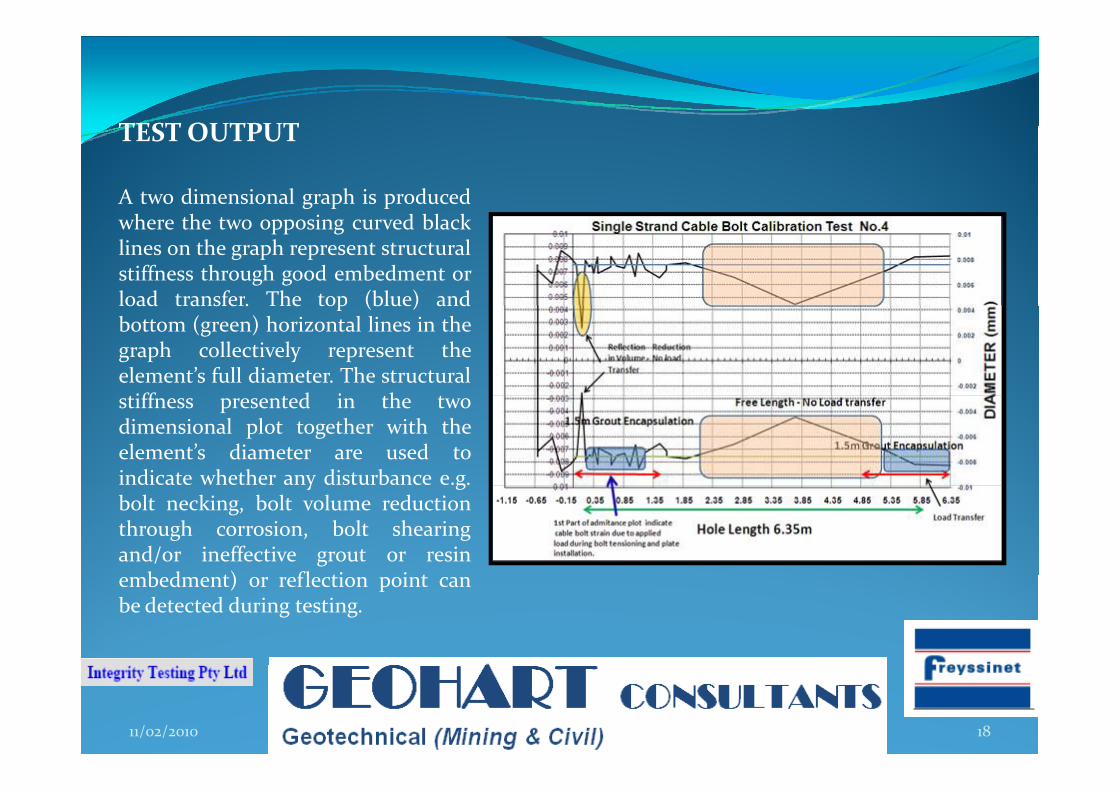
A two dimensional graph is producedh h i d bl kwhere the two opposing curved black
lines on the graph represent structuralstiffness through good embedment orload transfer. The top (blue) andload transfer. The top (blue) andbottom (green) horizontal lines in thegraph collectively represent theelement’s full diameter. The structuraliff d i hstiffness presented in the two
dimensional plot together with theelement’s diameter are used toindicate whether any disturbance e.g.y gbolt necking, bolt volume reductionthrough corrosion, bolt shearingand/or ineffective grout or resin
b d t) fl ti i tembedment) or reflection point canbe detected during testing.
11/02/2010 18
RECENT FINDINGS RECENT FINDINGS
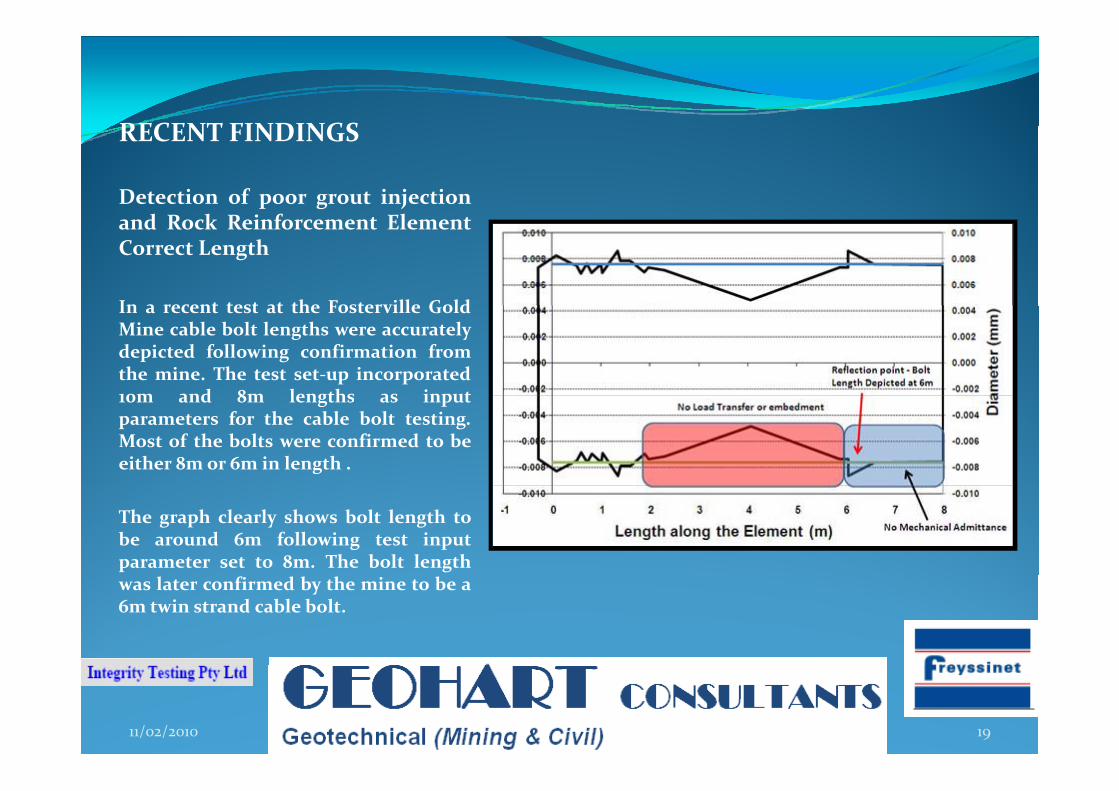
Detection of poor grout injectiond R k R i f Eland Rock Reinforcement Element
Correct Length
In a recent test at the Fosterville GoldIn a recent test at the Fosterville GoldMine cable bolt lengths were accuratelydepicted following confirmation fromthe mine. The test set‐up incorporated10m and 8m lengths as input10m and 8m lengths as inputparameters for the cable bolt testing.Most of the bolts were confirmed to beeither 8m or 6m in length .
The graph clearly shows bolt length tobe around 6m following test inputparameter set to 8m. The bolt lengthwas later confirmed by the mine to be a6m twin strand cable bolt.
11/02/2010 19
RECENT FINDINGS RECENT FINDINGS
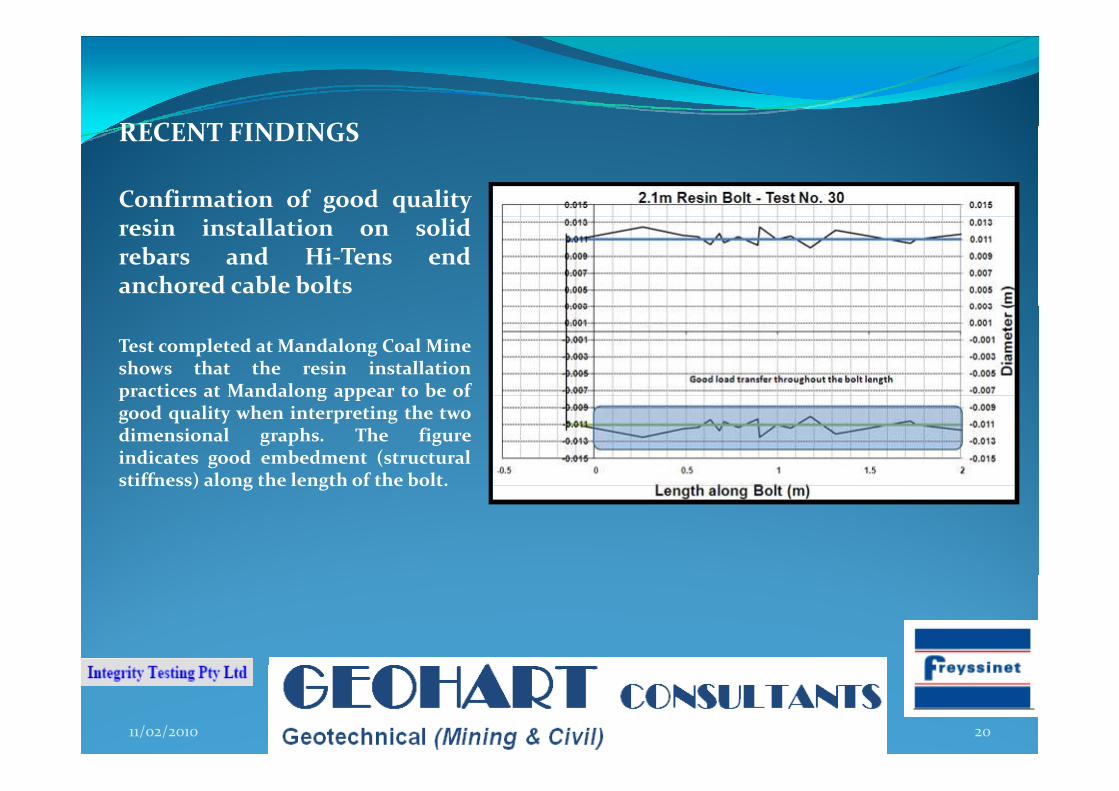
Confirmation of good qualityresin installation on solidrebars and Hi‐Tens endanchored cable bolts
Test completed at Mandalong Coal Mineshows that the resin installationpractices at Mandalong appear to be ofpractices at Mandalong appear to be ofgood quality when interpreting the twodimensional graphs. The figureindicates good embedment (structuralstiffness) along the length of the bolt.stiffness) along the length of the bolt.
11/02/2010 20
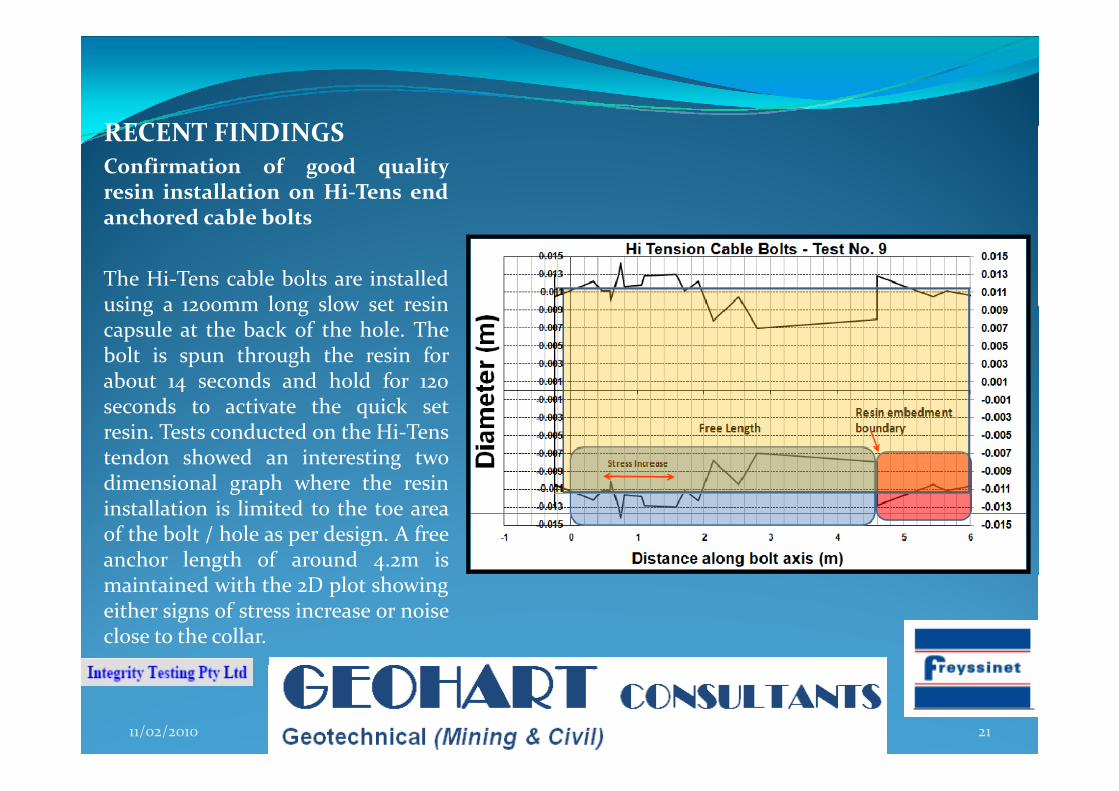
RECENT FINDINGSRECENT FINDINGSConfirmation of good qualityresin installation on Hi‐Tens endanchored cable boltsanchored cable bolts
The Hi‐Tens cable bolts are installedusing a 1200mm long slow set resinusing a 1200mm long slow set resincapsule at the back of the hole. Thebolt is spun through the resin forabout 14 seconds and hold for 120seconds to activate the quick setresin. Tests conducted on the Hi‐Tenstendon showed an interesting twodimensional graph where the resindimensional graph where the resininstallation is limited to the toe areaof the bolt / hole as per design. A freeanchor length of around 4.2m ismaintained with the 2D plot showingeither signs of stress increase or noiseclose to the collar.
11/02/2010 21
TEST RESULTSTEST RESULTS
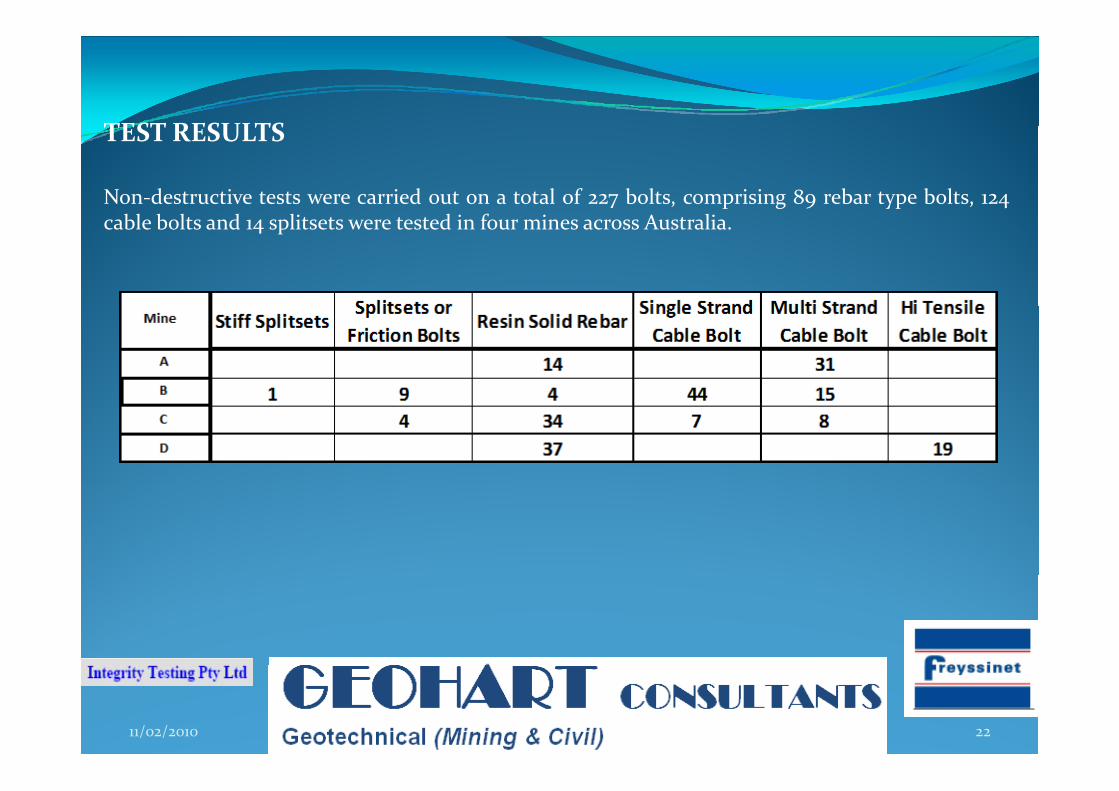
Non‐destructive tests were carried out on a total of 227 bolts, comprising 89 rebar type bolts, 124bl b l d li d i f i A licable bolts and 14 splitsets were tested in four mines across Australia.
11/02/2010 22
TEST RESULTSTEST RESULTS
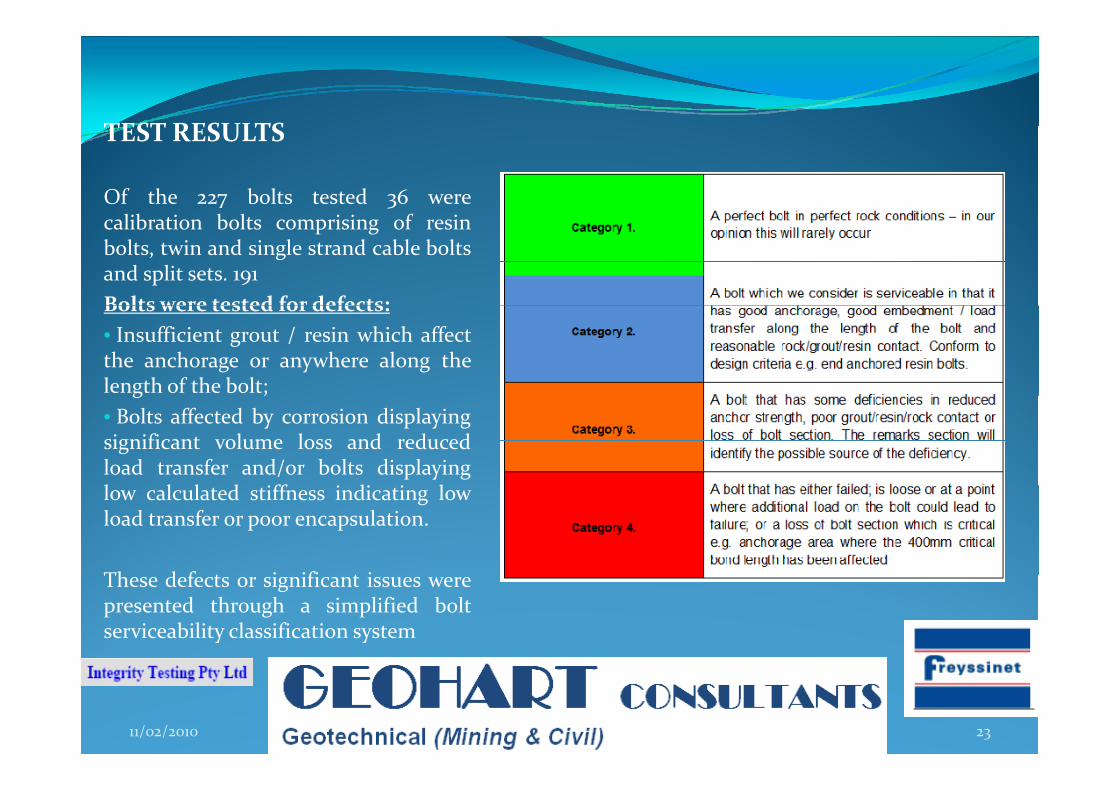
Of the 227 bolts tested 36 werelib i b l i i f icalibration bolts comprising of resin
bolts, twin and single strand cable boltsand split sets. 191Bolts were tested for defects:Bolts were tested for defects:• Insufficient grout / resin which affectthe anchorage or anywhere along thelength of the bolt;g ;• Bolts affected by corrosion displayingsignificant volume loss and reducedload transfer and/or bolts displayingl l l d iff i di i llow calculated stiffness indicating lowload transfer or poor encapsulation.
Th d f t i ifi t iThese defects or significant issues werepresented through a simplified boltserviceability classification system
11/02/2010 23
TEST RESULTSTEST RESULTS
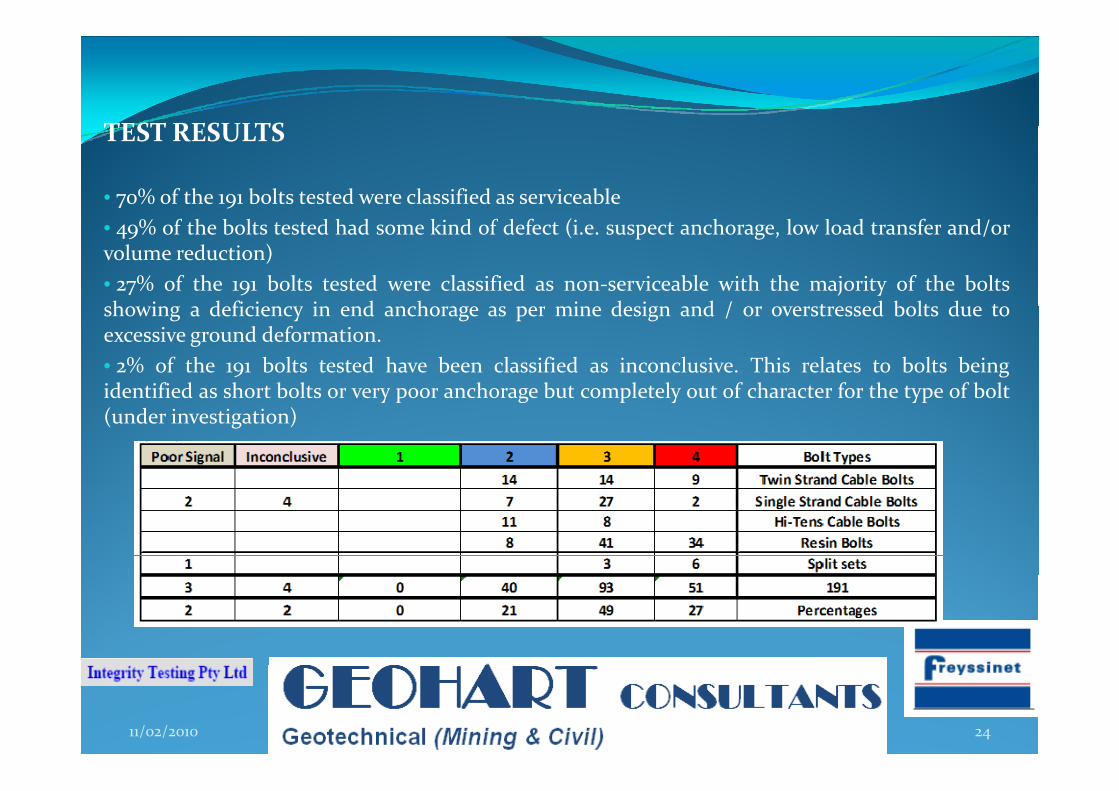
• 70% of the 191 bolts tested were classified as serviceable• 49% of the bolts tested had some kind of defect (i.e. suspect anchorage, low load transfer and/orvolume reduction)• 27% of the 191 bolts tested were classified as non‐serviceable with the majority of the boltsh i d fi i i d h i d i d / t d b lt d tshowing a deficiency in end anchorage as per mine design and / or overstressed bolts due toexcessive ground deformation.• 2% of the 191 bolts tested have been classified as inconclusive. This relates to bolts beingidentified as short bolts or very poor anchorage but completely out of character for the type of boltidentified as short bolts or very poor anchorage but completely out of character for the type of bolt(under investigation)
11/02/2010 24

TEST RESULTSTEST RESULTS
• Comments from Fosterville Gold Mine:
“At this stage the results of the Modshock system are a successful outcome for the qualityof installation of the sites cable bolts. There are several issues to deal with, many of whichh b d th h th l t f C b lt th t i fit f dhave been removed through the employment of a Cabolter that is fit‐for‐purpose andapplies best practice to the cablebolt installation system”.
“The result of the testing is that we did get some useful results Initially the results wereThe result of the testing is that we did get some useful results. Initially the results wereinterpreted without calibration or comparison data from other sites, as there was noneavailable. Later testing at Sunrise Dam (Anglogold Ashanti) and Mandalong Coal Mine(Centennial) provided some perspective. “
11/02/2010 25

CONCLUSIONS
• Ground support quality control has been a high priority for most mines but remained ahigh risk due to the uncertainty in the current bolt integrity testing procedure of pulltesting.
• The use of non‐destructive technology to test for defects (e.g. corrosion, necking) andlower quality installation techniques are showing an enormous opportunity in effectivelymanage this geotechnical risk.manage this geotechnical risk.
• It has been found that verification of rock reinforcement designs (i.e. bolt lengths andfull column resin/grout installations) and integrity confirmation are two of the biggest/g ) g y ggchallenges for geotechnical engineers and mine management. However we are confidentthat this non‐destructive integrity testing technique is a step towards reducing theuncertainty in quality and integrity assessment of rock reinforcement systems.
11/02/2010 26
FUTUREWORK
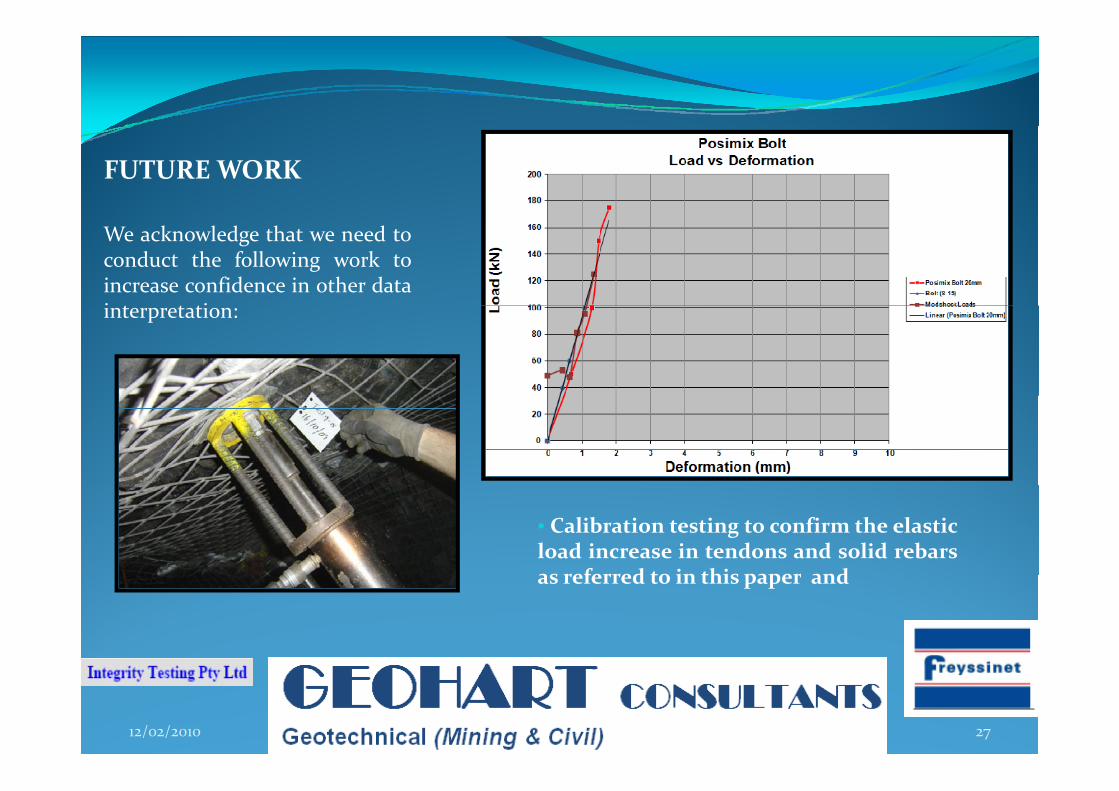
We acknowledge that we need toconduct the following work toincrease confidence in other datai t t tiinterpretation:
• Calibration testing to confirm the elasticload increase in tendons and solid rebarsas referred to in this paper andas referred to in this paper and
12/02/2010 27

FUTUREWORK
C fi ti f t di i l h lit d i d d i ti l i• Confirmation of two dimensional graph amplitude variance and descriptive analysis.
12/02/2010 28
FUTUREWORK ANDQUESTIONS
Th i i f th tt ti d i ti ti ith th th d i l dThe areas requiring further attention and investigationwith the method include:
• Signal/head fixture variability of plate/barrel stiffness and effects on results• Issues with result in first 1.5m of the bolt stress on bolt from tensioning ornoise? Much higher resolution• Error bars is there a confidence range (possibly a variable one depending onamplitude) in which results in this range are OK?• Grout strength how does this affect the results? – It certainly does effect theresults as it shows low structural stiffness• Ground structure how do these affect the results? – Any weaker or lowerdensity material is detected hence an alarm to zone in on particular area• What does corrosion look like?What does corrosion look like?
12/02/2010 29
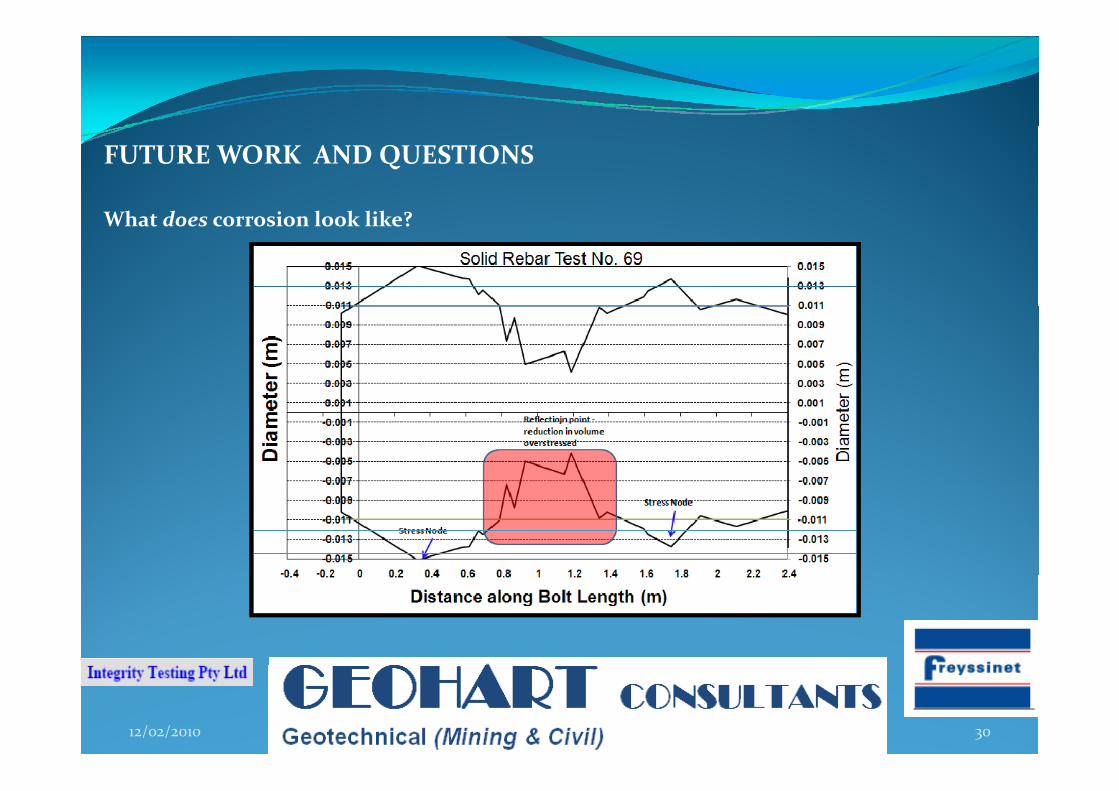
FUTUREWORK ANDQUESTIONS
Wh t d i l k lik ?What does corrosion look like?
12/02/2010 30

ACKNOWLEDGEMENTS
F t ill G ld Mi N th t Mi l• Fosterville Gold Mine – Northgate Minerals• Sunrise Dam Gold Mine – Anglogold Ashanti• Mandalong Coal ‐ Centennial
12/02/2010 31

Questions…?
12/02/2010 32
![Human Resources - Uni of Wollongong 2018 [Read-Only]web/@bus/... · • Enterprise Agreements are the most common method of wage determination in Australia. • Enterprise Agreements](https://img.pdfslide.tips/doc/110x75/5b5d26317f8b9ac6028daae2/human-resources-uni-of-wollongong-2018-read-only-webbus-enterprise.jpg)