Embed Size (px)
Citation preview

JeanMarieRiverWindandSolarEnergyPre‐FeasibilityAnalysis
Prepared for
By
Jean‐Paul Pinard, P. Eng., PhD.
703 Wheeler St., Whitehorse, Yukon Y1A 2P6
Tel. (867) 393‐2977; Email [email protected],
And
John F. Maissan, P. Eng., Leading Edge Projects Inc.
219 Falcon Drive, Whitehorse, Yukon Y1A 0A2
Tel. (867) 668‐3535; Fax (867) 668‐3533; Email [email protected]
March 28, 2012
Source: MACA

2
ExecutiveSummaryThis study provides a preliminary assessment of wind and solar energy potential in the community of
Jean Marie River.
Jean Marie River has about 76 inhabitants and is located on the south shore of the Mackenzie River at
the confluence of the river bearing the community’s name. Jean Marie River is located about 340 km
southwest of Yellowknife and is accessible year round by air and by road, as well as by barge in the
summer. The average power use in the community is 39 kilowatts (kW), based on an annual energy
requirement estimated to be 340 megawatt‐hours (MWh).
The five‐year (2007‐2011) average wind speed in Jean Marie River projected to be 2 m/s at a height of
10 m above ground, which is considered to be very poor for wind energy potential in the community.
Wind energy economics was thus not examined in detail in this study. The mean solar energy potential
according to NASA is 2.9 kWh/m2/day (daily insolation), which is considered to be good for solar
electricity production.
For a potential solar energy project in a net metering home system, the installed cost is estimated to be
from $10,000 per kW (for a fixed solar array) to $12,500 per kW (dual axis tracking). In a utility scale
scenario (12 kW) the installed cost is estimated to be from $9,000 per kW to $11,500 per kW. An off‐grid
summer camp solar system (including battery bank and power equipment) is expected to cost from
$25,000 to $27,500 per kW installed.
The 25‐year levelized cost of energy from grid connected photovoltaic systems is expected to range
from $0.72 per kWh to $0.80 per kWh, which is more expensive than the marginal cost of diesel
generation at $0.526 per kWh (levelized over 20 years). However, since wind energy is not a practical
option in this community, solar PV systems are the only practical alternative.
The diesel fuel savings and the greenhouse gas emissions reduction from a fixed array solar energy
system in Jean Marie River is expected to be 411 litres and 1,233 kg of CO2 equivalent per kW installed,
respectively. With a one axis array configuration, the fuel savings and greenhouse emissions reductions
go up to 537 litres and 1,610 kg of CO2 equivalent per kW installed, respectively.
If Jean Marie River is considering alternative energy developments, the use of solar energy generation
would be a far more attractive option than wind energy. PV systems can be scaled to a community’s
needs and the equipment is far easier to transport, install, and operate than wind systems. Should Jean
Marie River wish to pursue a PV project, subsidies would be required to make the project cost‐effective
compared to continued diesel generation.

3
IntroductionThe cost of diesel fuel to serve northern remote communities continues to rise as world supplies
become scarce. The need for developing renewable energy is becoming more urgent as communities
struggle with rising energy costs. Over the past several years, the authors (JP Pinard, P.Eng., Ph.D. and
John Maissan, P.Eng.) have been retained by the Aurora Research Institute (ARI) to conduct pre‐
feasibility studies for wind energy generation in many diesel‐served communities in the NWT. All of
these studies are found at the ARI website (http://www.nwtresearch.com, search for “wind energy”).
With the decreasing costs of solar technology it has become apparent that solar energy is becoming
more attractive for remote communities in the North. In this study, the economic potential for solar PV
energy for Jean Marie River is assessed.
The community of Jean Marie River has about 76 people and is located on the south shore of the
Mackenzie River at the confluence of the Jean Marie River. Jean Marie River is located about 340 km
southwest of Yellowknife (see Figure 1) and is accessible by air, by summertime barge and by an all
season road connecting to the Mackenzie Highway. The average power use in the community is 39
kilowatts (kW) based on the annual generation requirement estimated at 340 MWh (from the last
general rate application or GRA, 2007/08). We understand that the electrical load may have decreased
in recent years. The community power plant has three diesel generators totalling 230kW of capacity (the
smallest of which we are told is 70 kW, thus the remaining two must be about 80 kW), owned and
operated by Northwest Territories Power Corporation (NTPC). The marginal cost of producing electricity
from diesel (fuel and variable maintenance only) is estimated to be $0.526 per kWh.
No previous wind or solar resource studies (that the authors are aware of) have been done for Jean
Marie River. The Arctic Energy Alliance has, however, produced a summary of the wind and solar
potential for the community. In their online report (resource section at www.aea.nt.ca) it is stated that
the average wind speed is considered low at 2.88 m/s (height was not noted); however the average
solar insolation (radiation) is 2.9 kWh/m2/day, which is considered to provide high solar energy potential
for the community.
The purpose of this study is to examine the economics of wind and solar energy development to diesel‐
generated electricity in Jean Marie River. In this study solar and wind climate data is collected and
analysed. It is also used to model potential energy output of various photovoltaic (PV) array
configurations. Detailed economic analyses were not carried out for wind energy as the wind resource is
too low to be practical for power generation. The economic analyses look at the costs of building and
operating various configurations of solar PV projects in the hamlet. Greenhouse gas emission reductions
from these projects are estimated. An outline of next steps is given regarding the pursuit of wind or
solar energy integration in the hamlet.

4
Figure 1: Jean Marie River is located in the southwest NWT, about 340 km southwest of Yellowknife.
WindClimateAssessmentTo estimate the wind energy potential in Jean Marie River, wind speed measurements are required. The
wind data used for the wind analysis was measured at the JMR administration building and also
extracted from Environment Canada’s (EC) climate data, which is available online at their website
(www.climate.weatheroffice.ec.gc.ca). The data from the EC website contain hourly measurements of
wind speed and direction, temperature, pressure, humidity, and other parameters (solar measurements
are not included in these data sets). The wind measurements at this station appear to be made at 10 m
above ground level (AGL), which is the standard height for airport weather measurements in Canada.
The measurements made at the administration building were on a tripod set up on top of the building at
a total height of 9.7 m AGL. Measurements were averaged to a 10‐minute interval and included wind
speed, direction, temperature and solar insolation.
WindSpeedAccording to EC there was a climate (weather) station located about 21 km south of Jean Marie River on
the Mackenzie Highway. It ran for just under two years (1999‐2000). The two‐year mean wind speed
from this data set is 1.82 m/s from a height of 10 m AGL at a surface elevation of 227 m ASL (above sea
level). Another longer term climate station is at the Fort Simpson Airport, which is located about 40 km
Jean Marie River

5
northwest of Jean Marie River. This station has been collecting data since 2003 and has a mean wind
speed of 2.6 m/s, measured at 10 m ASL on ground that is 168 m ASL.
The weather station on the JMR administration building measured a mean wind speed of 1.9 m/s (at 9.7
m AGL) for the period of September to December, 2011. Using the Fort Simpson station data to make a
correlation, the JMR wind speed was projected to a longer term mean wind speed of 2 m/s. Projected
vertically, this translates into a mean wind speed of about 3 m/s at 40 m AGL. This is considered
inadequate for wind energy production. The nearby community of Trout Lake (see similar report from
Pinard and Maissan, 2012; found at ARI website) has a slightly better a wind regime of 3.3 m/s (at 42.7
m hub height) but a wind project there will produce electricity at a cost of over $5 per kWh, about ten
times the cost of diesel generated electricity. Similarly, wind energy would not be economically feasible
in Jean Marie River. Therefore, the remainder of this study will focus on options for solar energy.
SolarClimateAssessmentThe information for the solar radiation in this study comes from NASA’s Surface Meteorology and Solar
Energy (SSE) website (eosweb.larc.nasa.gov/sse/). This site is a renewable energy resource centre that
keeps a database of compiled solar, wind and other meteorological data for the purpose of evaluating
the renewable energy potential at most locations around the world. This is also the same website from
which solar, wind and other meteorological data is officially used for input into the RETScreen and
HOMER Energy models (both described later). The database at SSE is a combination of meteorological
observations and numerical modeling that provides an estimate of such things as solar radiation for
locations that are lacking in measurements, such as is the case at Jean Marie River.
SolarInsolationatJeanMarieRiverFrom the SSE website solar radiation data was extracted for the Jean Marie River area and it is
compared with actual measurements that were made in the past at other nearby locations such as Fort
Smith, shown in Figure 6 below. These average insolation values represent the monthly average daily
solar radiation onto a horizontal plane at the Earth’s surface. Typically solar radiation is measured with
the sensor pointing straight up on a flat horizontal (leveled) plane. The measurement is given in the
form of energy (kWh) per unit area (m2) per day. Solar photovoltaic panels are typically not set up on a
horizontal plane but rather at an angle that is as close to perpendicular to the sun as possible. Different
photovoltaic (PV) array configurations exist to address this and will be discussed later in this study.
The two nearest locations in the NWT where solar radiation data was collected in the past are Fort
Smith and Norman Wells. Fort Smith collected data from 1971 to 1988, and Norman Wells collected
data from 1967 to 1987. In Figure 6 we can see that the solar radiation estimated by SSE for Jean Marie
River is similar to that of Fort Smith. With respect to latitude, Jean Marie River is 160 km north of Fort
Smith. Norman Wells is about 440 km north of Jean Marie River, and shows slightly more insolation in
the summer and less in the winter compared to other communities to the south. The average annual
insolation for Forth Smith and Norman Wells were 3.01 and 2.66 kWh/m2/day respectively. The average
annual insolation for Jean Marie River was estimated to be 2.90 kWh/m2/day.

6
Figure 2: Monthly average insolation, or solar radiation, on a horizontal surface measured at Fort Nelson, Fort Smith, and Norman Wells, and estimated at Jean Marie River. All were acquired from the SSE website.
SiteSelectionforSolarSystemsWithin the community of Jean Marie River, the insolation values are likely similar anywhere that there is
an open area without obstructions such as trees and buildings to shade the solar installation. Ideally the
solar PV installation would be next to the power grid. If a home PV installation is being considered, it
would be best placed on a south‐facing roof or on the ground if there is clear exposure to the sun. For a
utility scale fixed array installation, the best location is close to a powerline in a large field exposed to
the south. If a tracking system is selected then the area must be exposed to the east, south, and west.
CommunityPowerRequirementsandCostsThe community of Jean Marie River has its electricity requirements supplied by an NTPC diesel power
plant consisting of three generators. The total capacity is 230kW, and we understand that the smallest
one is 70 kW, thus the other two must be about 80 kW. The most recent NTPC GRA (general rate
application) indicates that the fuel efficiency of the diesel plant is 2.749 kWh per litre.
Information available from the most recent GRA indicates that power generation in the community is
about 340 MWh per year. We understand that it may have declined in recent years. This represents an
average diesel plant load of about 39 kW and a peak load of about 78 kW at the GRA load factor. The
authors estimated that the minimum plant load is in the order of 15 kW. Relevant excerpts from the
NTPC GRA documents are attached as Appendix 1. With the diesel plant fuel efficiency provided above,

7
and the expected annual electrical energy produced from diesel, this represents about 123,681 litres of
diesel fuel consumed for electricity production in the community each year.
In modelling the integration of solar energy with the diesel plant, the authors assume that the minimum
allowable load of the smallest diesel generator is 30% (typical) of the generator’s capacity. For the 70
kW generator, this sets the minimum load at 21 kW. If a community’s load drops below this level it
simply means that the generator is producing at a lower efficiency level and power quality may become
more difficult to control. When adding a renewable energy source to the overall system, on occasions
when the community load will be so low (e.g. down to 15 kW in the summer) and the renewable energy
production will be high (e.g. 12 kW), then the diesel generator will produce at less than 30% capacity (3
kW in this example). The plant operator will likely wish to cut back on the renewable energy source to
keep the diesel generator operating at above the 30% load to keep the efficiency up. To cut back on the
renewable energy system one must use power controllers that either dump the excess electric from the
solar system to outdoor heaters or store the excess electric for later use. The storage can take the form
of heat, say, in hot water tanks or in batteries which adds another level of complexity to the system. The
storage of renewable energy has a future in diesel communities like Jean Marie River; however, it is
beyond the scope of this study, which is simply to assess the economics of solar energy production. The
sizing of the renewable energy systems in this study are meant to be optimized so that little storage or
power stabilizing technology is required, thus keeping the renewable energy system integration
relatively simple.
This study examines solar PV opportunities in one generic seasonal (April to September) off‐grid
application (e.g. a camp) involving a 1 kW array, and in two grid connected applications. The grid
connected options are a 5 kW net metering arrangement by a residential consumer and a maximum 12
kW utility owned project. A solar system large than 12 kW may result in the 70 kW diesel generator
being driven below a 30% load, which is NTPC’s stipulated minimum. Larger PV systems would thus
require some form of energy storage (such as batteries) which is beyond the scope of this study. It is
noteworthy that the estimated minimum community load is already well below a 30% loading on the
70kW generator.
Considering this, additional advantages of solar energy over wind energy become evident for Jean Marie
River. PV arrays can be sized in small increments (of about 200W) and projects can easily be expanded,
and unlike wind turbines, solar energy is never available at night when electrical loads are at their
lowest, but is available only in the daytime when electrical loads are at their highest. As well, the
transport and installation of PV equipment is simple compared to wind turbines. The operation of PV
systems is also relatively simple, but the integration of significant PV capacity (e.g. 50 kW) with the
diesel plant may be as challenging as significant wind capacity.
For the purposes of this study it has been assumed that the NTPC diesel power plant would save diesel
fuel at a rate of 1 litre per 2.749 kWh displaced. This diesel plant would produce variable (or
incremental) electrical energy at a levelized cost of $0.526 per kWh over 20 years with diesel fuel
starting at $1.15 per litre and increasing with general inflation (2% in model). These costs include only
8
fuel and $0.03 per kWh for variable operation and maintenance (O&M) costs. The economic model
assumes that the cost of capital is 7.5%.
SolarPVProject
ProjectOwnersThree different solar PV applications were considered in this study, and in each case the ownership was
different. The first application was a small remote camp using a 1 kW PV array. In this case the camp
owner was assumed to own the PV project. The second application was a net metering installation of a
5 kW PV array (i.e. grid connected), assumed to be owned by a private residential power consumer. The
residential consumer was assumed to be acting individually as opposed to being part of a larger project
involving many homes. The third application was a larger grid connected project (e.g. 12 kW) owned
and operated by the utility owning the diesel plant, or an independent power producer operating in
several communities.
PVEquipmentFor the 1 kW off‐grid and the 5 kW net metering grid connected applications, complete system kits were
selected for use in this study. These costs were found to be up to 20% higher than individually sourced
components that could be assembled by an owner with appropriate skills and some professional advice.
However, the complete kit approach was considered to be a good first approximation on systems and
costs. The off‐grid kit would include everything – PV modules, fixed array mounting system, charge
controller, battery bank, sine wave inverter, power panel/centre, and all required cabling.
The 5 kW net metering kit includes PV modules, micro‐inverters, fixed array mounting system, and all
cabling (no batteries). Typical PV module sizes are 170 to 230 Watts. For both the off‐grid and the net
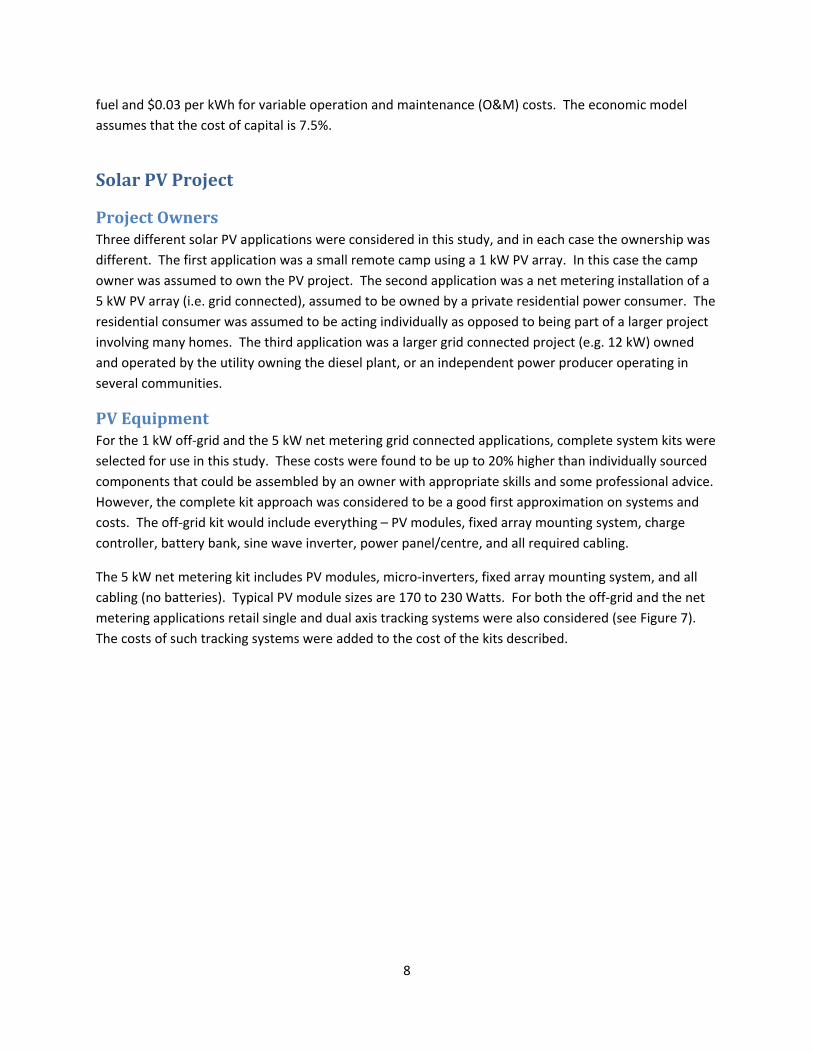
metering applications retail single and dual axis tracking systems were also considered (see Figure 7).
The costs of such tracking systems were added to the cost of the kits described.

9
Figure 3: The two most common tracking modes for a solar system with dynamic tracking. A single‐axis tracker tracks the sun by rotating around an axis located in the plane of the collector. The axis can have any orientation but in the northern latitudes it is usually pointing south with a tilt that is nearly parallel to the earth's axis. The dual‐axis tracker always positions the array surface normal to the beam of the sun by rotating about two axes. Source: www.RETScreen.net.
The 12 kW utility scale project was based on a reduction in cost from a 5kW residential scale net
metering kit (roof or simple self‐ballasted ground mount).
The pricing for PV modules at a wholesale level is very competitive at the moment; some reports
indicate that costs have decreased to nearly $1.00 per watt of capacity (compared to a retail cost of
about $10/watt in 1990s).
EnergyProductionFor the off grid camp and the net metering home applications, energy production from three different
PV array configurations are considered: first, a fixed array that is tilted at about 45° (from the ground)
from April to September and at 90° from October through March; secondly, a single axis tracker set at a
tilt of 55° (optimum angle for Jean Marie River); and thirdly, a dual axis tracker. For the utility scale
system only the fixed array configuration was considered but with the same 45° and 90° settings for
summer and winter. The fixed and single axis tracker configurations are assumed to be facing south. The
tilt angles that are chosen for each configuration are the most optimum angles that maximize the annual
solar energy production in the Jean Marie River area. The reason for choosing to tilt the fixed array to
90° in the winter months is to avoid snow build up and subsequent maintenance cost associated with
snow clearing requirements. A solar array at any angle less than 90° will often build up with snow and
prevent the solar array from producing electricity after a snow fall in the winter. Another advantage to
tilting the array to 90° in the winter is the added effect of snow reflectance from the ground to the
array, which will improve the performance of the system.
If one chooses to use a fixed array at a permanent angle (the optimum angle would be at 50° for Jean
Marie River’s latitude) then the expected losses due to snow cover will be about 12% (based on work
done by Wohlgemuth, 2007) depending on snow fall and weather conditions. It should also be noted

10
that a fixed array configuration set permanently at 50° will produce about 3% less energy than a fixed
array adjusted seasonally as indicated above. The total losses will likely amount to 15% if one chooses to
use a permanently fixed array system as opposed to one that is adjusted seasonally with the 45° tilt in
the summer and 90° tilt in the winter.
The above PV array configurations are analysed for their theoretical performances through the use of
the RETScreen Clean Energy Project Analysis Software. RETScreen (Microsoft Excel ‐ based) is a decision
support tool developed and supported by the CanmetENERGY research centre of Natural Resources
Canada (NRCan). The software is free‐of‐charge and is used worldwide to evaluate the energy
production and savings, costs, emission reductions, financial viability and risk for various types of
Renewable‐energy and Energy‐efficient Technologies (RETs). More information on the software can be
found at www.retscreen.net.
For the utility scale solar system the HOMER Energy model was used to identify the maximum size a
solar system can be without producing excess energy and thus requiring grid power stability equipment
or storage. This situation is most likely to occur during the summer when the community load is smallest
and the solar production is greatest. The HOMER Energy model was developed by the National
Renewable Energy Laboratory of the US Government and is now distributed and supported by HOMER
Energy (www.homerenergy.com). HOMER is a power system analysis and optimization model.
Using the SSE insolation data for Jean Marie River and RETScreen’s modelling capability, the monthly
and annual energy production of each configuration at various tilt angles were evaluated. RETScreen’s
solar modelling tool takes into account such factors as ground (snow) reflectance, inverter efficiency,
solar cell types and sizes to calculate monthly energy production from these difference array
configurations.
The RETScreen energy production calculations are based on an array of generic PV modules with total
power capacity of 1 kW (7 m2 area), with an efficiency of 14.4%, a temperature coefficient of 0.40%, and
a nominal operating cell temperature of 45°C. Losses of 10% from inverter inefficiency (90% efficiency
assumed) and 15% from miscellaneous sources (including module ageing) were assumed in the model.
The model also included additional losses of 10% for snow shading in the winter for the grid connected
home and utility systems on trackers; snow shading losses do not apply to the fixed array scenarios,
which assume a 90‐degree tilt for the winter. Losses are an additional 20% for the off‐grid system which
uses a charge controller (about 5%) and a battery bank (about 15%).
The result of the RETScreen solar array configuration performance evaluation for Jean Marie River are
summarised in Figure 4. Projections of the net energy production per kW of array capacity (after losses)
at Jean Marie River’s latitude are outlined in Table 1.

11
Figure 4: Monthly electricity produced from each type of solar array configuration for Jean Marie River, based on RETScreen analysis. Smr = Summer (April to September); Wtr = Winter (October to March).
Table 1: Projected net energy production in Jean Marie River.
Smr = Summer (April to September); Wtr = Winter (October to March).
System description Use Added losses
(B = battery, S = snow)
Net annual energy
Capacity in kWh / kW
Off grid camp
Fixed array: 45° April ‐ September B: 20% 589
1 axis tracker: 55° April ‐ September B: 20%, S: 10% 853
2 axis tracker April ‐ September B: 20%, S: 10% 878
Net metering home (on grid) 1 kW 5 kW
Fixed array: 45° Smr & 90° Wtr All year 1,130 5,650
1 axis tracker: 55° All year S: 10% 1,475 7,375
2 axis track All year S: 10% 1,524 7,620
Utility 1 kW 18 kW
Fixed array: 45° Smr & 90° Wtr All year 1,130 20,340
As Table 1 shows, a 1 kW system on a fixed array will produce about 1130 kWh per year. The total
energy production for a 5 kW home based system on a roof using the fixed system will translate into
5650 kWh per year. A utility scale 18 kW fixed array system in Jean Marie River will produce 20,340 kWh
per year without producing significant excess electricity (based on the HOMER model).

12
Figure 4 illustrates how a tracking system will have an advantage over a fixed south‐facing configuration.
Because the tracker allows the solar array to face the sun from morning through afternoon, it captures
about 40% more solar energy over the year, mostly during the summertime. Despite the advantage, the
tracking system can be compromised if there is snow build up, shading by buildings, trees, or
neighbouring solar tracking arrays. For all configurations the advantage of snow reflectance is seen for
the months of March to May.
CapitalandOperatingCostsCapital costs for the off‐grid camp and net metering home applications were based on retail kit costs
available on the open market. The authors estimate that knowledgeable owners could buy components
and assemble their own systems (with professional advice as required) for about 20% lower capital cost,
however, for the purposes of this report the retail kit cost was considered to be a good first
approximation. Costs for solar tracking systems for the off‐grid and net metering home application were
taken from retail web site price listings and were simply added to the kit cost.
Capital costs for a small utility scale PV system of 18kW was based on a reduction in cost from a 5kW
residential scale net metering kit (roof or simple self ballasted ground mount). These are higher than
typical costs for larger utility scale installations (50kW or higher) which can be derived from a various
existing cost breakdowns available. These indicated that in southern Canada these size commercial
projects would probably cost about $6,500 per kW at the present time. With increased shipping costs
and higher installation costs in the north, $9,000 per kW would be considered to be a reasonable
estimate for these smaller utility scale projects (excluding tracking systems). With tracking systems the
costs would likely be about $11,000 per kW for single axis and $11,500 for dual axis.
Table 2: Capital and operating costs of PV systems
System description Capital cost
($ per kW)
O&M cost
($ per kW per year)
Off grid camp (1 kW battery based)
Fixed array $25,000 $25
1 axis tracker $27,000 $50
2 axis tracker $27,500 $50
Net metering home (5 kW grid connected)
Fixed array $10,000 $25
1 axis tracker $12,000 $50
2 axis track $12,500 $50
Utility (approximately 12 kW)
Fixed array $9,000 $25

13
In all cases operating and maintenance costs were estimated at $25 per kW of capacity per year for the
PV system, and where trackers were used an additional $25 per year per kW of capacity was applied. A
summary of the operating and capital costs appears in Table 2 below. These costs are probably low for
an off‐grid battery based system but the alternative of a gas or diesel generator would also involve
significant maintenance so these were considered to be off‐setting costs.
CostofPVEnergyandEconomicAnalysisThe levelized cost of energy (LCOE) for PV was examined on the basis of a 25 year project life (some
solar products now carry a 25‐year warranty) using an economic model that assumed that the cost of
capital was 7.5% and that the inflation rate was 2% per year. As well, a modified simple payback was
calculated. This consisted of offsetting the O&M cost on the basis of kWh at the applicable marginal
rate and then using the savings on the remainder to pay off the capital. The resulting costs and payback
are shown in Table 3.
For the off‐grid camp two fuel efficiencies were considered, 2 kWh per litre and 1 kWh per litre, which
corresponds roughly to a small diesel generator reasonably well loaded and a Honda 6,500 watt
generator with the inverter loaded at about 50%, respectively.
For net metering homes, three PV energy value cases were considered: (1) the subsidized Yellowknife
rate of $0.232 per kWh, (2) the unsubsidized community rate of $1.487 per kWh, and (3) the
incremental diesel savings of $0.526 per kWh. Note that the diesel saving of $0.526 per kWh is a 20 year
levelized cost as is commonly used in wind project analyses (and in other NWT community renewable
energy studies). The cost of diesel will be a little higher (by $0.02) if levelized over 25 years, but in order
to be conservative on cost comparisons for the utility scale solar project, only the diesel saving of $0.526
per kWh was considered.
For off‐grid camps, the 25 year LCOE ranged from $2.79 per kWh with the dual axis tracker to $3.74 per
kWh with the fixed array. This compares to $1.22 to $2.43 per kWh from small generators, depending
on fuel efficiencies. The simple payback after O&M expenses ranges from about 13 to 36 years,
depending on the fuel efficiency of the generator and whether a tracker is used on the PV array. A dual
axis tracker and the less fuel efficient generator results in the fastest payback, while the fixed array and
more efficient generator results in the longer payback.
For PV arrays on grid connected homes, the 25 year LCOE ranges from $0.75 per kWh with a tracker, to
$0.80 per kWh with a fixed array (with tilt adjusted twice per year). The modified simple payback at the
unsubsidized community rate is about 6 years, at the LCOE diesel cost is 17 to 18 years, and at the
subsidized Yellowknife rate (applied in Jean Marie River) is about 42 years.
For a Utility scale project, the LCOE of PV energy was $0.72 per kWh for the fixed array configuration
(with tilt adjusted twice per year). The modified simple payback was about 16 years. It is worth noting
that the LCOE was also calculated for single and dual axis trackers for the same utility scale PV array (size
reduced to 12 kW to avoid power instability) and the cost was found to be $0.69 and $0.70 per kWh
respectively; this indicates that there is no significant advantage to using trackers for small utility scale
PV arrays – and fixed arrays are much simpler to install and maintain.

14
For home scale net‐metering the single axis tracker offers a tiny advantage in term of cost per kWh (0.4
cents) over the dual axis tracker and about 4.3 cents per kWh over the fixed array option.
NTPC could consider the installation of smaller diesel generators in Jean Marie River more suited to the
small electrical load there. This would likely make the diesel plant more efficient and would also allow a
higher penetration level of solar PV. Alternatively a battery bank operated on a cycle‐charge basis for
times when the electrical load is low may be an alternative to consider.
Table 3: Summary of PV energy cost and payback ranges.
System
description
LCOE $/kWh LCOE* diesel
$/kWh
Community
rate
Yellowknife
rate
Simple payback
after maintenance
years
Off‐grid camp
Fixed array $3.74 $1.22 to $2.43 18 to 36
Array on tracker $2.79 to $2.82 $1.22 to $2.43 13 to 27
Net metering
home
Fixed array $0.80 $0.526 $1.487 $0.232 6 to 42
Array on tracker $0.75 $0.526 $1.487 $0.232 6 to 42
Utility
Fixed array $0.72 $0.526 16
* the LCOE for camp diesel is over 25 years, for other applications over 20 years
GreenhouseGasReductionsGreenhouse gas (GHG) reductions are directly proportional to the diesel energy displaced. For this
reason, off‐grid applications (where the alternatives are small diesel or gas generators, which have poor
efficiencies compared to utility generators) offer the greatest GHG reductions per unit of capacity. The
GHG reductions at seasonal off‐grid camps using a single axis tracker would range from 1,307 (436 litres
diesel saved) to 2,613 (871 litres of gasoline saved) kg of CO2 equivalent per year per installed kW of
capacity. A dual axis tracker would be marginally better, and a fixed array would save about 32% less.
Table 4: Annual energy productions, fuel savings and GHG reductions from a grid‐connected solar project of 1, 5, or 18 kW in Jean Marie River. The two configurations are fixed frame configuration with 45° tilt in summer and 90° in the winter and a
single axis tracker.
Project Configuration Diesel Electricity
Displaced (kWh)
Diesel Fuel Saved
(litres)
GHG Reductions
(kg CO2 equivalent)
fixed tracker fixed tracker fixed tracker
Grid‐connected – 1 kW 1130 1475 411 537 1,233 1,610
Grid‐connected – 5 kW 5650 7375 2,055 2,683 6,166 8,048
Grid‐connected – 18 kW 20,340 ‐ 7,399 ‐ 22,197 ‐

15
The GHG reductions resulting from three scales of solar systems connected to the grid are shown in
Table 4. Net metering and utility scale projects all displace fuel at utility power plant fuel efficiencies,
which in the case of Jean Marie River is 2.749 kWh per litre. These systems would save 1,233 kg of CO2
equivalent per kW of installed capacity per year when fixed (with tilt adjusted twice per year), 1,610 kg
of CO2 equivalent per year on a single axis tracker, and 1,663 kg of CO2 equivalent per year on a dual axis
tracker. This assumes all of the installed capacity displaces diesel fuel. Larger projects in which some of
the PV energy is surplus to system needs would result in lower GHG reductions.
PVProjectConclusions1. PV systems can be utilized in a variety of applications and scaled in size to meet requirements.
2. Complete PV systems of about 1kW of capacity for off‐grid applications are likely to cost in the order of $25,000 to $27,500 per kW of installed capacity depending on whether fixed arrays or trackers are used.
3. Home size net metering (grid connected) PV systems are likely to cost in the order of $10,000 to $12,500 per kW of installed capacity for fixed and tracker mounted systems, respectively, and corresponding small utility scale projects would likely cost in the order of $9,000 per kW of installed capacity for a fixed array system.
4. The cost of energy from grid connected PV systems at $0.72 to $0.80 per kWh is more expensive than the marginal cost of diesel generation at $0.526 per kWh.
5. It is possible that capital costs for grid connected systems could be reduced with larger scale projects or a larger number of projects, but at present it would appear that the resulting energy would still be more costly than the marginal cost of diesel generation.
NextSteps1. If Jean Marie River is considering alternative energy developments, the use of PV energy generation
would be a far more attractive option than wind energy. PV systems can be scaled to a community’s needs and the equipment is far easier to transport, install, and operate than wind systems.
2. Should Jean Marie River wish to pursue a PV project, a subsidy would be required to make the project cost‐effective compared to continued diesel generation.
3. Given the small size of the Jean Marie River electrical load, installing a few residential scale net metering projects may be more practical than having the utility do an 18 kW project. Alternatively the utility could consider installing smaller diesel generators more suited to the electrical load, which would make a larger utility project possible and probably reduce unit costs.
4. To increase the total capacity addition beyond the maximum size stated in this study (18 kW), further feasibility work with energy and economic modelling would be recommended.
ReferencePinard, JP, and John F. Maissan, 2012. Trout Lake Wind and Solar Energy Pre‐Feasibility Analysis. For
the Aurora Research Institute.
Wohlgemuth, D., 2007. Solar Photovoltaics in the NWT, Jean Marie River Band Office, System
Overview. Summary paper for the Arctic Energy Alliance.

16
Appendix1