Embed Size (px)
Citation preview
8/13/2019 JENTEK API Pipeline Conf SanDiego 2013
http://slidepdf.com/reader/full/jentek-api-pipeline-conf-sandiego-2013 1/26
Slide 1Copyright © 2013 JENTEK Sensors
All Rights Reserved.
Inspection of Pipelines using
High-ResolutionMWM® and MR-MWM-Arrays
Andrew Washabaugh, Vice President of Research & Development
JENTEK Sensors, Inc., 110-1 Clematis Avenue, Waltham, MA 02453-7013Tel: 781-642-9666; Email: [email protected]; web: jenteksensors.com
API Pipeline Conference
April 16-17, 2013Loews Coronado Bay, San Diego, CA
Copyright © 2013 JENTEK Sensors All Rig
hts Reserved.
8/13/2019 JENTEK API Pipeline Conf SanDiego 2013
http://slidepdf.com/reader/full/jentek-api-pipeline-conf-sandiego-2013 2/26
Slide 2Copyright © 2013 JENTEK Sensors
All Rights Reserved.
Outline
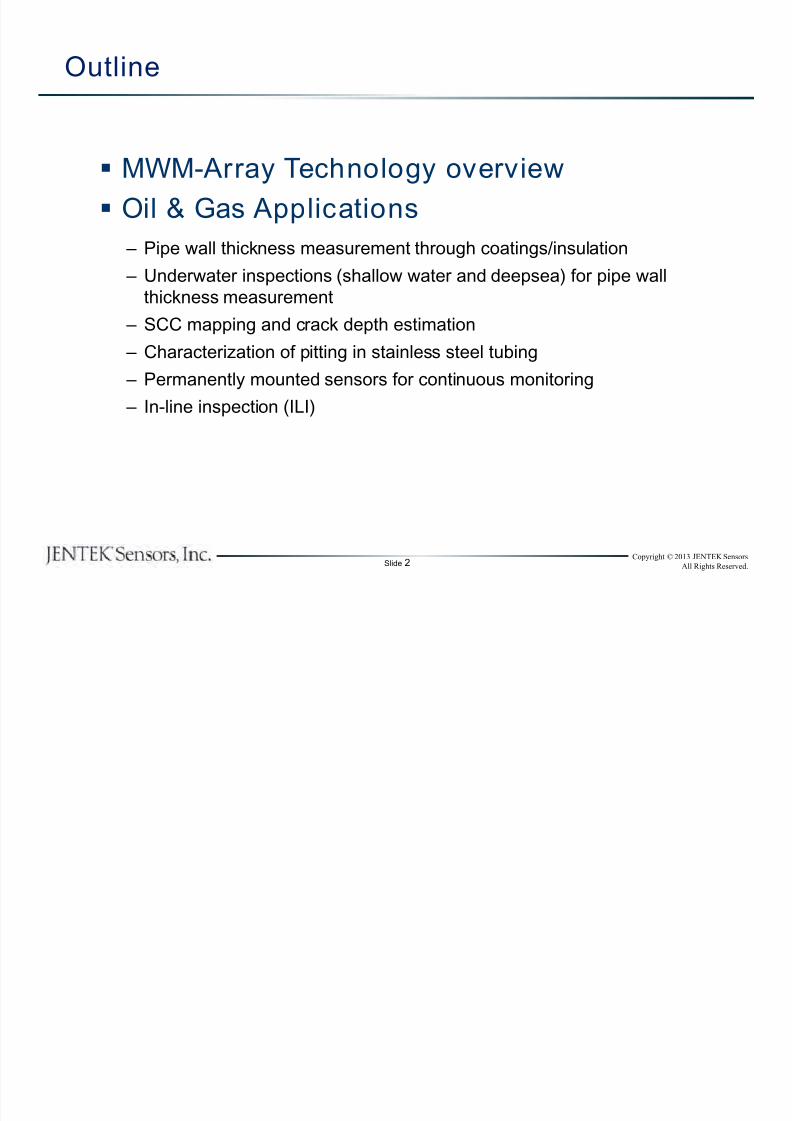
MWM-Array Technology overview
Oil & Gas Applications – Pipe wall thickness measurement through coatings/insulation
– Underwater inspections (shallow water and deepsea) for pipe wall
thickness measurement
– SCC mapping and crack depth estimation
– Characterization of pitting in stainless steel tubing
– Permanently mounted sensors for continuous monitoring
– In-line inspection (ILI)
8/13/2019 JENTEK API Pipeline Conf SanDiego 2013
http://slidepdf.com/reader/full/jentek-api-pipeline-conf-sandiego-2013 3/26
Slide 3Copyright © 2013 JENTEK Sensors
All Rights Reserved.
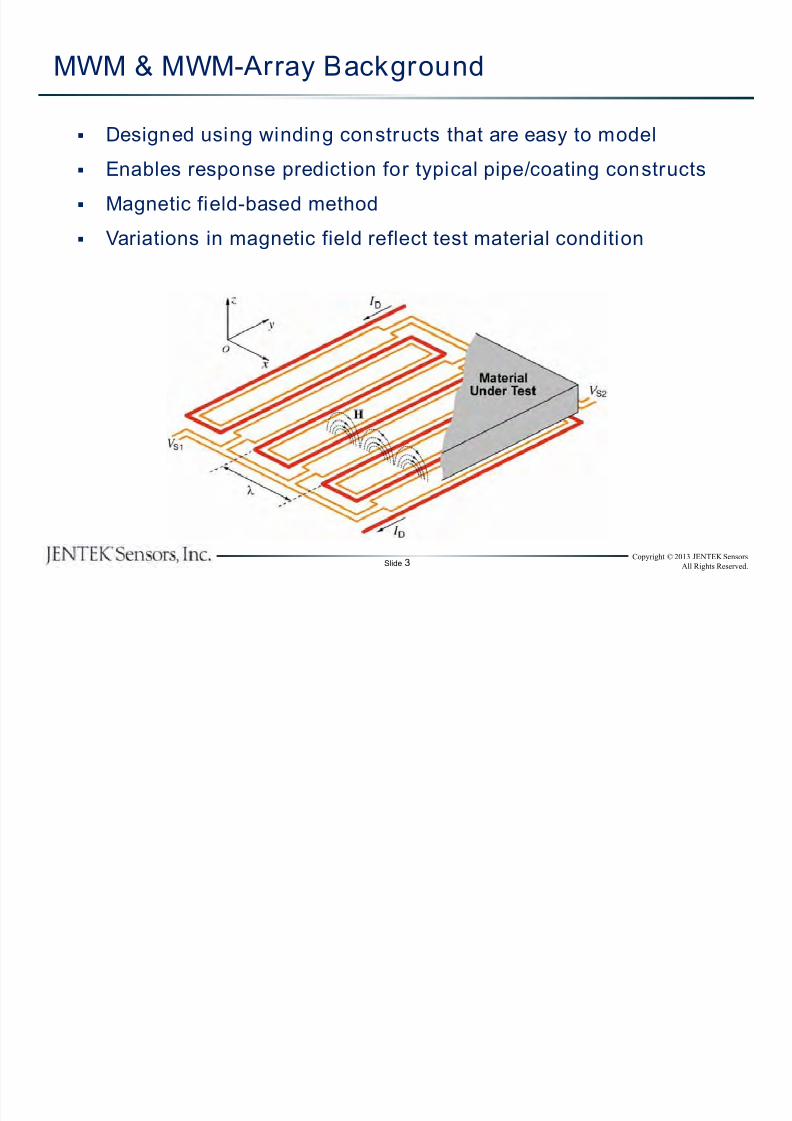
Designed using winding constructs that are easy to model
Enables response predict ion for typical pipe/coating constructs
Magnetic field-based method Variations in magnetic field reflect test material condition
MWM & MWM-Array Background
8/13/2019 JENTEK API Pipeline Conf SanDiego 2013
http://slidepdf.com/reader/full/jentek-api-pipeline-conf-sandiego-2013 4/26
Slide 4Copyright © 2013 JENTEK Sensors
All Rights Reserved.
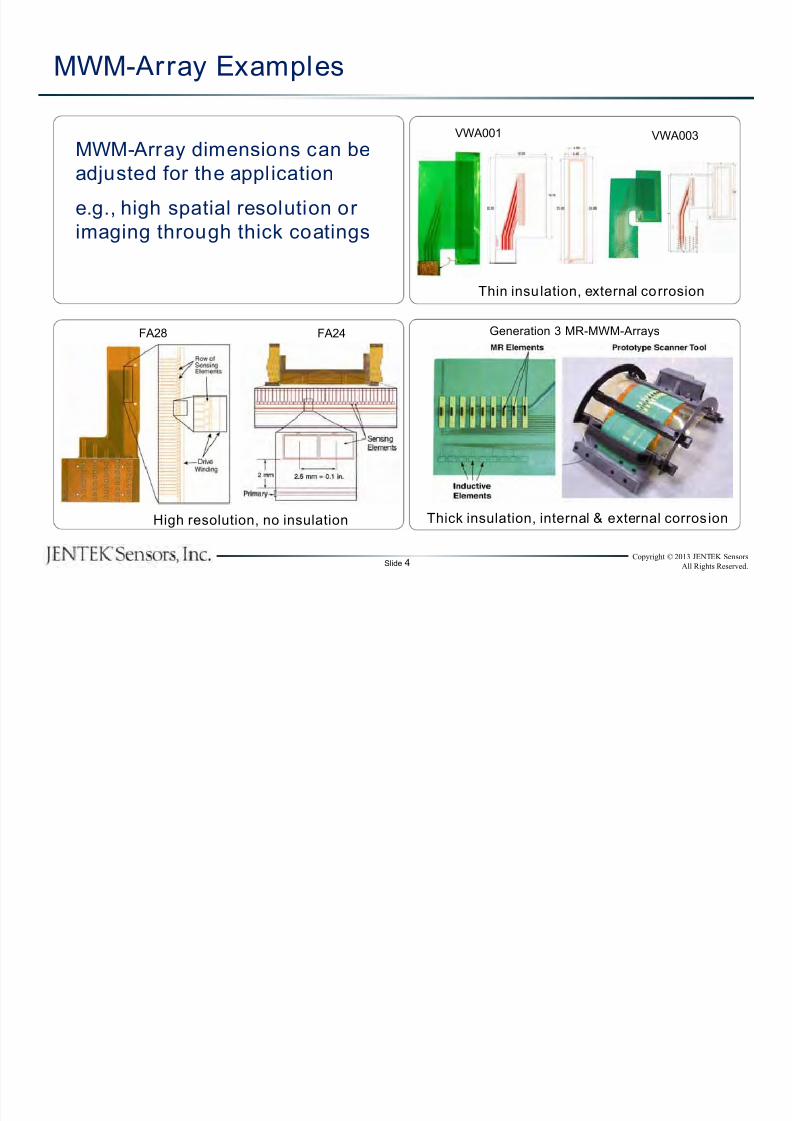
Generation 3 MR-MWM-Arrays
MWM-Array dimensions can be
adjusted for the application
e.g., high spatial resolution orimaging through thick coatings
FA28 FA24
VWA001 VWA003
MWM-Array Examples
High resolution, no insulation Thick insulation, internal & external corros ion
Thin insulation, external corrosion
8/13/2019 JENTEK API Pipeline Conf SanDiego 2013
http://slidepdf.com/reader/full/jentek-api-pipeline-conf-sandiego-2013 5/26
Slide 5Copyright © 2013 JENTEK Sensors
All Rights Reserved.
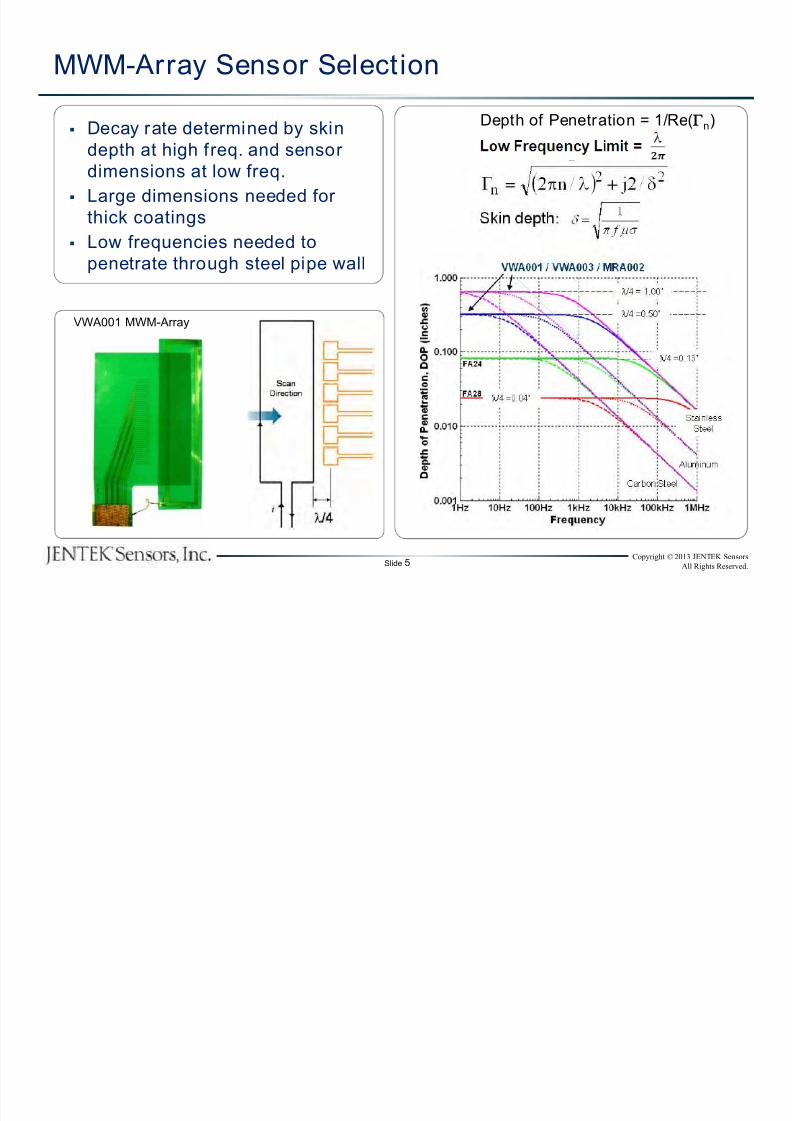
Decay rate determined by skin
depth at high freq. and sensor
dimensions at low freq.
Large dimensions needed for
thick coatings Low frequencies needed to
penetrate through steel pipe wall
MWM-Array Sensor Selection
VWA001 MWM-Array
Depth of Penetration = 1/Re( n)
8/13/2019 JENTEK API Pipeline Conf SanDiego 2013
http://slidepdf.com/reader/full/jentek-api-pipeline-conf-sandiego-2013 6/26
Slide 6Copyright © 2013 JENTEK Sensors
All Rights Reserved.
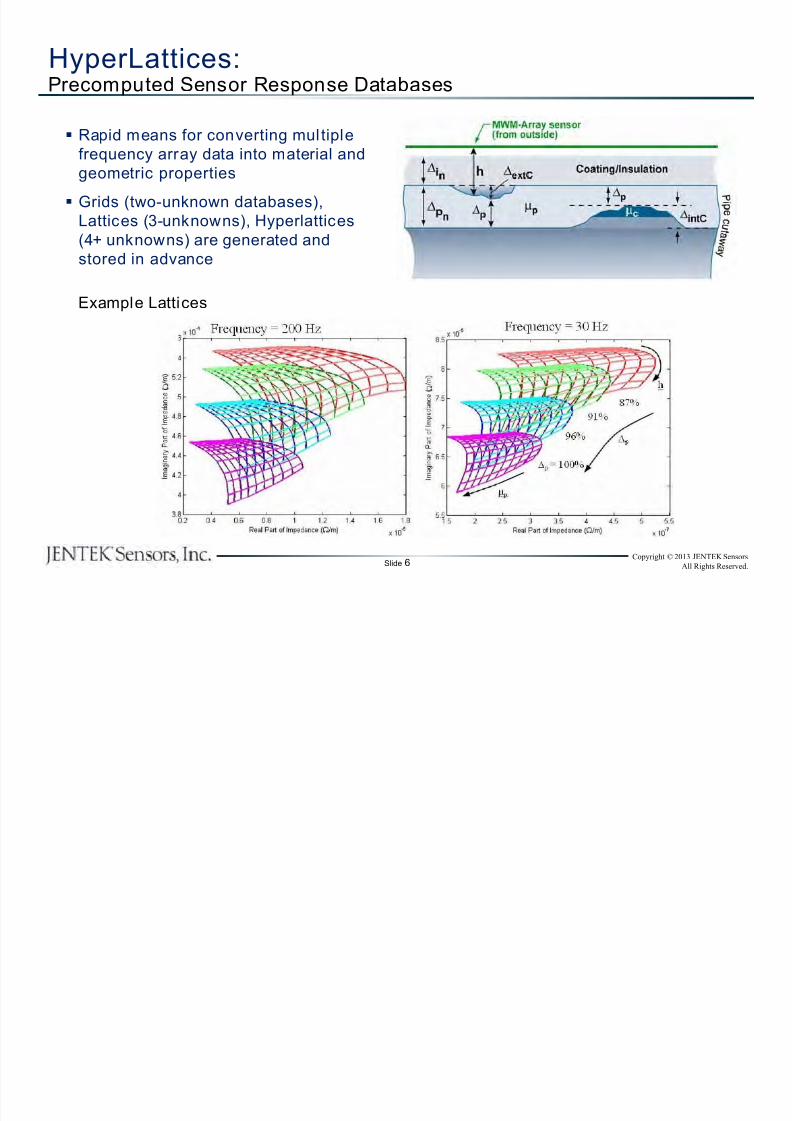
HyperLattices:Precomputed Sensor Response Databases
Rapid means for converting multiple
frequency array data into material and
geometric properties
Grids (two-unknown databases),
Lattices (3-unknowns), Hyperlattices
(4+ unknowns) are generated and
stored in advance
Example Lattices
8/13/2019 JENTEK API Pipeline Conf SanDiego 2013
http://slidepdf.com/reader/full/jentek-api-pipeline-conf-sandiego-2013 7/26
Slide 7Copyright © 2013 JENTEK Sensors
All Rights Reserved.
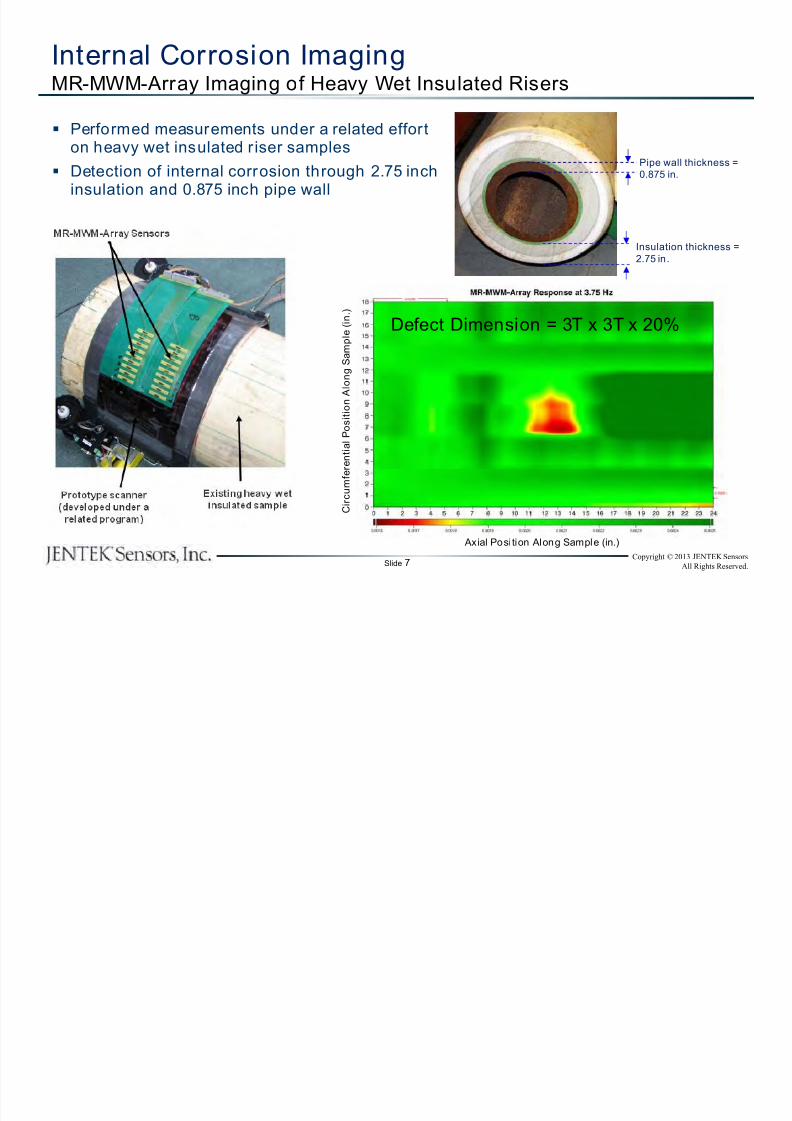
Internal Corrosion ImagingMR-MWM-Array Imaging of Heavy Wet Insulated Risers
Performed measurements under a related efforton heavy wet insulated r iser samples
Detection of internal corrosion through 2.75 inchinsulation and 0.875 inch pipe wall
Axial Posi tion Along Sample (in.)
C i r c u m f e r e n t i a l P o
s i t i o n A l o n g S a m p l e ( i n . )
Pipe wall thickness =
0.875 in.
Insulation thickness =
2.75 in.
Defect Dimension = 3T x 3T x 20%
8/13/2019 JENTEK API Pipeline Conf SanDiego 2013
http://slidepdf.com/reader/full/jentek-api-pipeline-conf-sandiego-2013 8/26
Slide 8Copyright © 2013 JENTEK Sensors
All Rights Reserved.
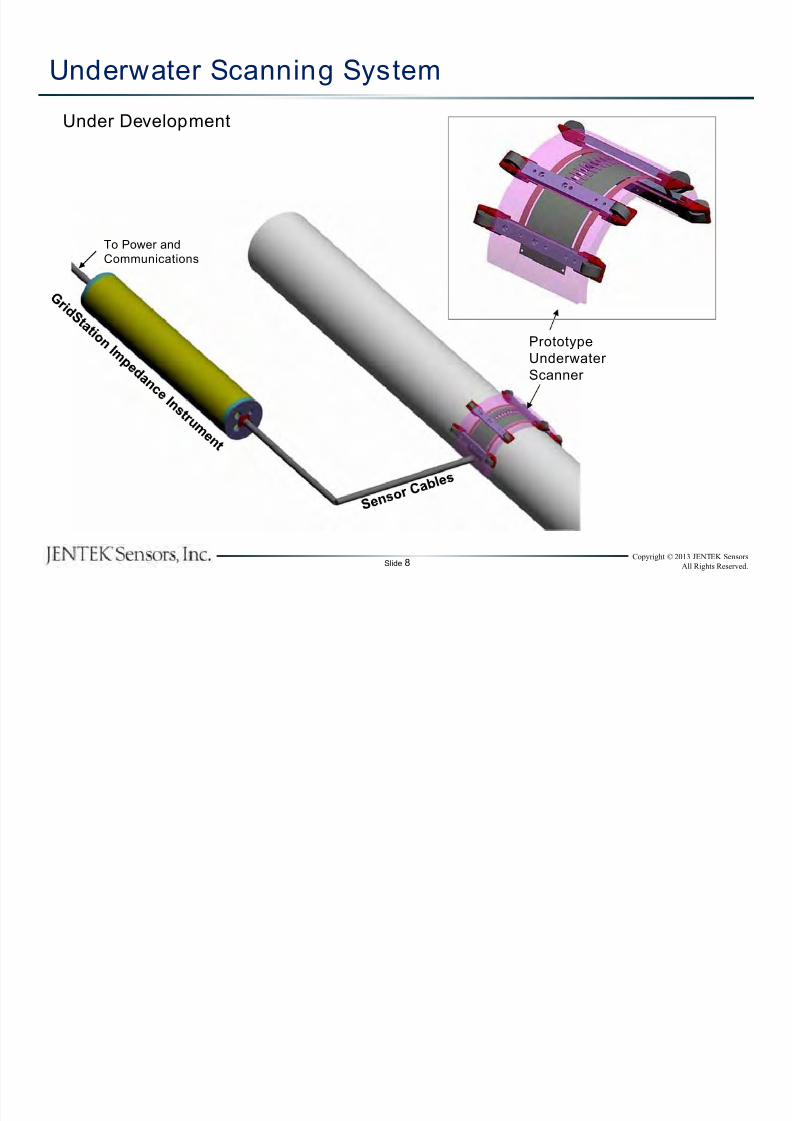
Underwater Scanning System
To Power and
Communications
Prototype
Underwater
Scanner
Under Development
8/13/2019 JENTEK API Pipeline Conf SanDiego 2013
http://slidepdf.com/reader/full/jentek-api-pipeline-conf-sandiego-2013 9/26
Slide 9Copyright © 2013 JENTEK Sensors
All Rights Reserved.
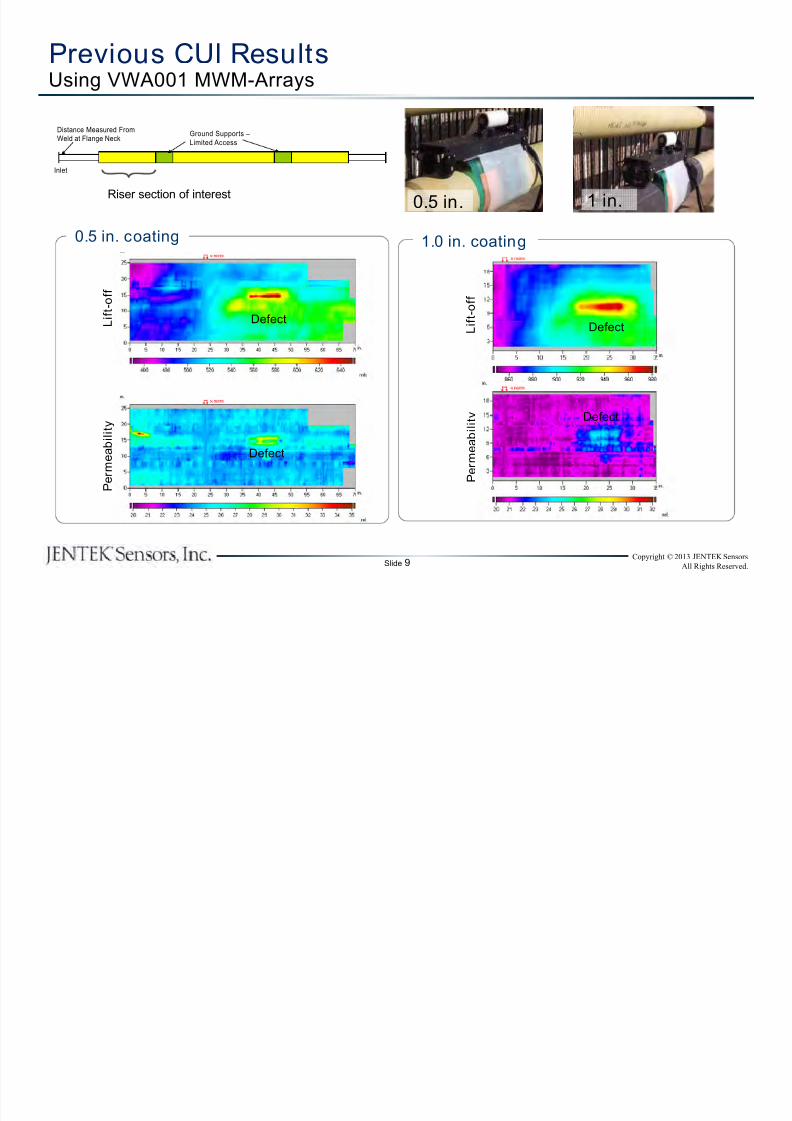
P e r m e a b i l i t y
L i f t - o f f
Defect
P e r m e a b i l i t y
L i f
t - o f f
Defect
0.5 in. coating 1.0 in. coating
Previous CUI ResultsUsing VWA001 MWM-Arrays
Distance Measured From
Weld at Flange NeckGround Supports –
Limited Access
Inlet
Riser section of interest0.5 in. 1 in.
Defect
Defect
8/13/2019 JENTEK API Pipeline Conf SanDiego 2013
http://slidepdf.com/reader/full/jentek-api-pipeline-conf-sandiego-2013 10/26
Slide 10Copyright © 2013 JENTEK Sensors
All Rights Reserved.
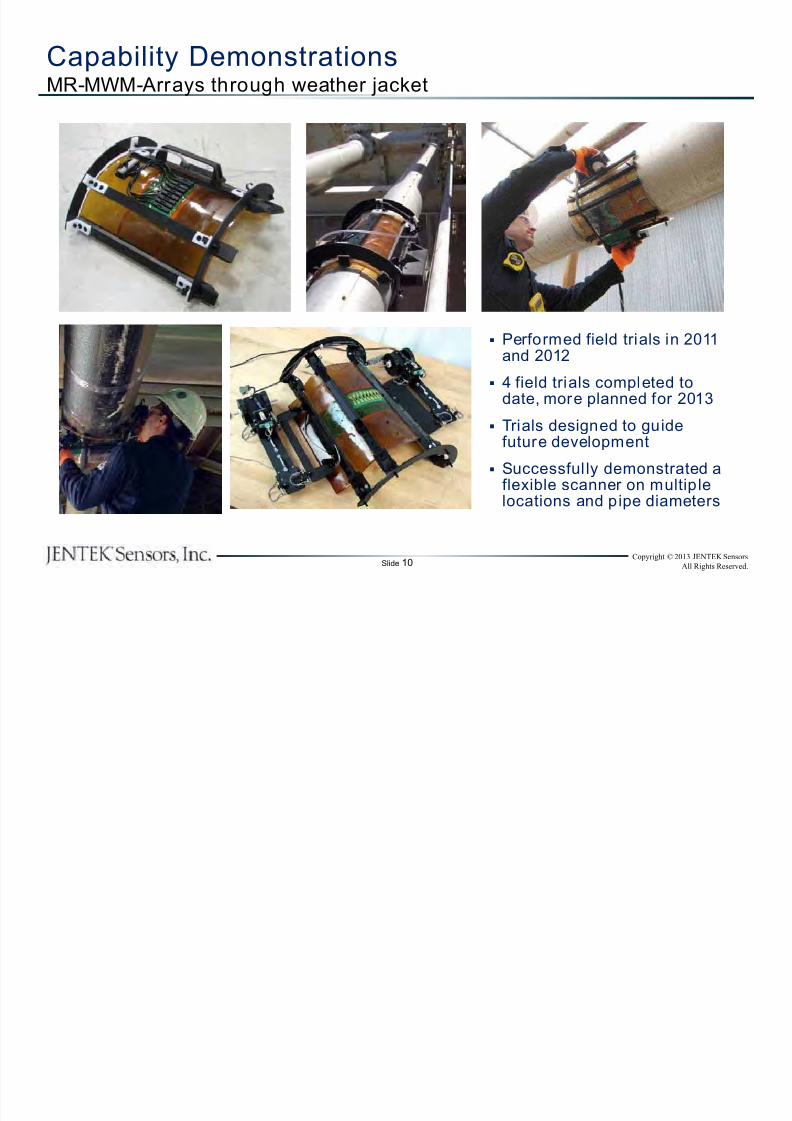
Capability DemonstrationsMR-MWM-Arrays through weather jacket
Performed field trials in 2011and 2012
4 field trials completed todate, more planned for 2013
Trials designed to guidefuture development
Successful ly demonstrated aflexible scanner on multiplelocations and pipe diameters
8/13/2019 JENTEK API Pipeline Conf SanDiego 2013
http://slidepdf.com/reader/full/jentek-api-pipeline-conf-sandiego-2013 11/26
Slide 11Copyright © 2013 JENTEK Sensors
All Rights Reserved.
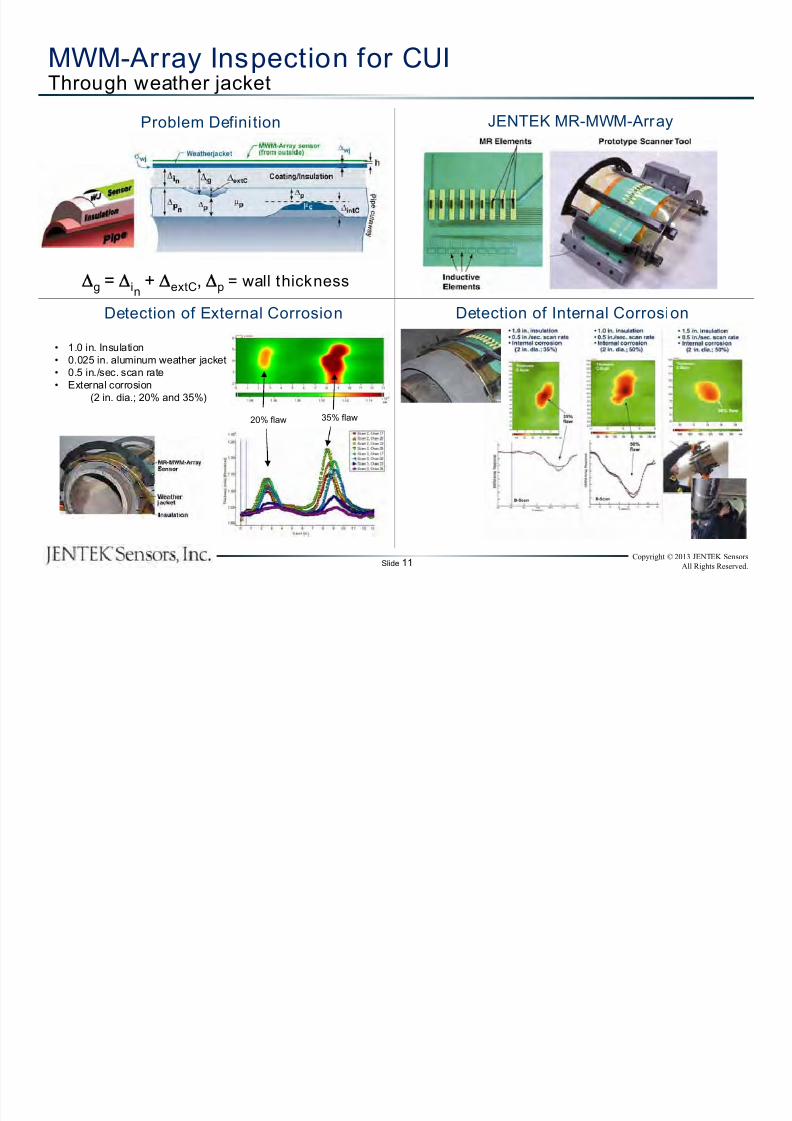
MWM-Array Inspection for CUIThrough weather jacket
Problem Definition
Detection of External Corrosion Detection of Internal Corrosion
JENTEK MR-MWM-Array
g = in+ extC, p = wall thickness
• 1.0 in. Insulation
• 0.025 in. aluminum weather jacket
• 0.5 in./sec. scan rate
• External corrosion
(2 in. dia.; 20% and 35%)
20% flaw 35% flaw
8/13/2019 JENTEK API Pipeline Conf SanDiego 2013
http://slidepdf.com/reader/full/jentek-api-pipeline-conf-sandiego-2013 12/26
Slide 12Copyright © 2013 JENTEK Sensors
All Rights Reserved.
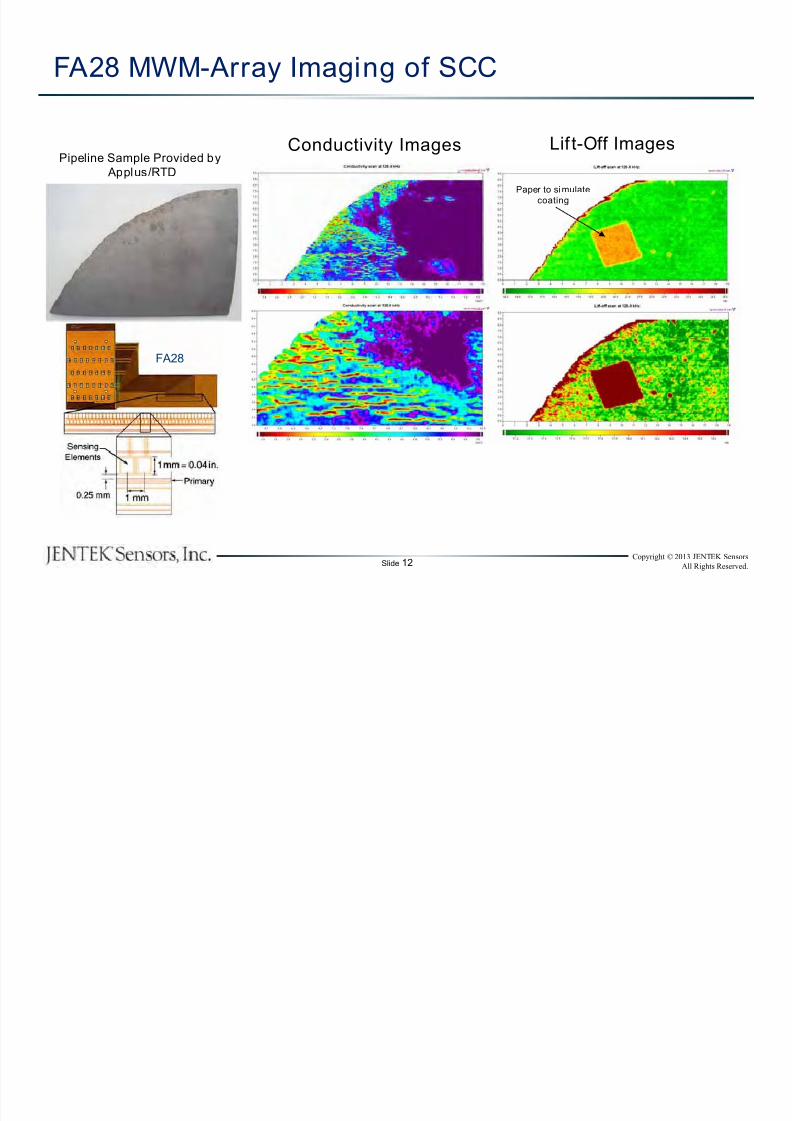
FA28 MWM-Array Imaging of SCC
Pipeline Sample Provided by
Applus/RTD
Paper to simulate
coating
Conductivity Images Lif t-Off Images
FA28
8/13/2019 JENTEK API Pipeline Conf SanDiego 2013
http://slidepdf.com/reader/full/jentek-api-pipeline-conf-sandiego-2013 13/26
Slide 13Copyright © 2013 JENTEK Sensors
All Rights Reserved.
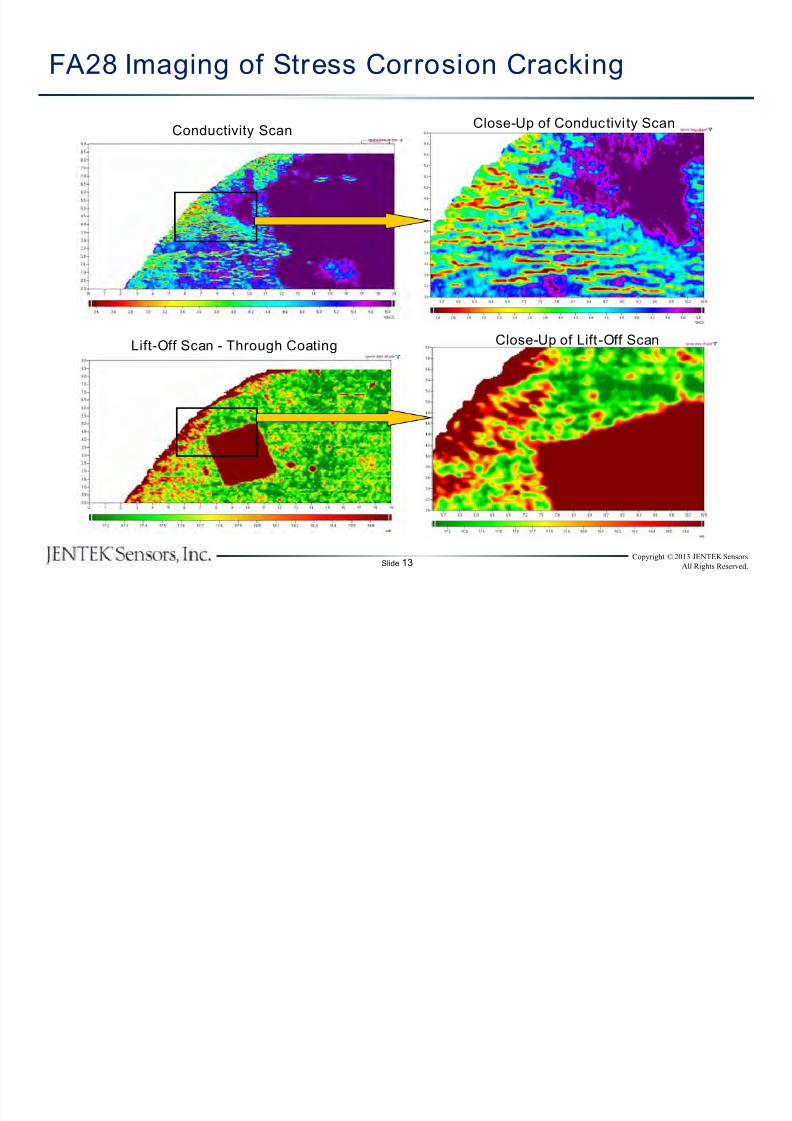
FA28 Imaging of Stress Corrosion Cracking
Lift-Off Scan - Through Coating
Close-Up of Conductivi ty ScanConductivity Scan
Close-Up of Lift -Off Scan
8/13/2019 JENTEK API Pipeline Conf SanDiego 2013
http://slidepdf.com/reader/full/jentek-api-pipeline-conf-sandiego-2013 14/26
Slide 14Copyright © 2013 JENTEK Sensors
All Rights Reserved.
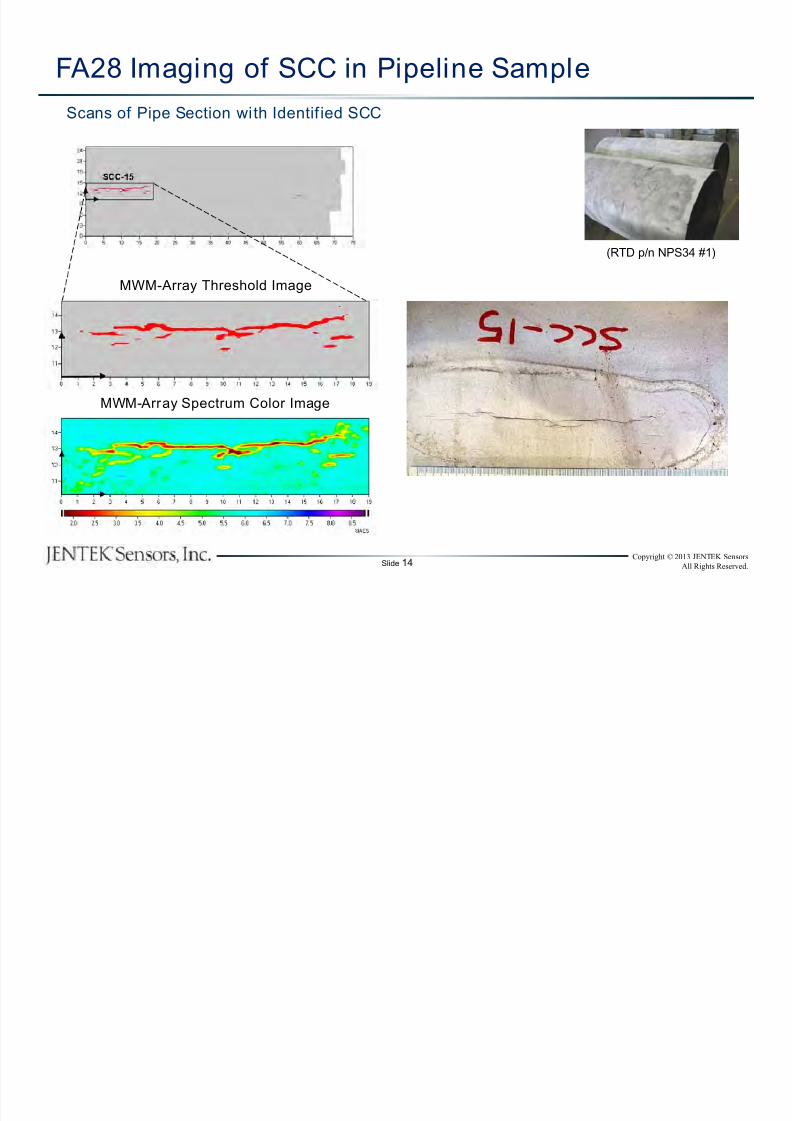
(RTD p/n NPS34 #1)
MWM-Array Threshold Image
MWM-Array Spectrum Color Image
FA28 Imaging of SCC in Pipeline Sample
Scans of Pipe Section with Identif ied SCC
8/13/2019 JENTEK API Pipeline Conf SanDiego 2013
http://slidepdf.com/reader/full/jentek-api-pipeline-conf-sandiego-2013 15/26
Slide 15Copyright © 2013 JENTEK Sensors
All Rights Reserved.
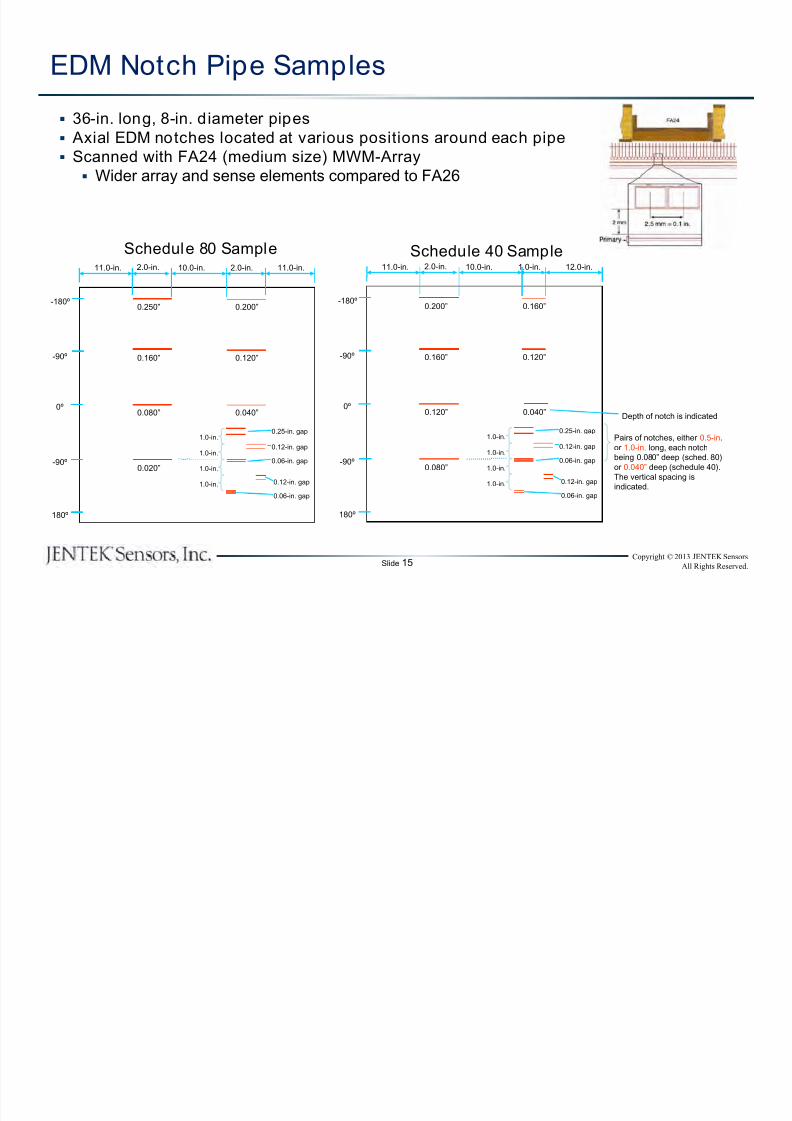
36-in. long, 8-in. diameter pipes
Axial EDM notches located at various positions around each pipe
Scanned with FA24 (medium size) MWM-Array
Wider array and sense elements compared to FA26
EDM Notch Pipe Samples
Schedule 80 Sample Schedule 40 Sample
0.250”
0.160”
0.080”
0.020”
0.040”
11.0-in. 2.0-in. 2.0-in. 11.0-in.10.0-in.
0.200”
0.120”
1.0-in.
1.0-in.
0.25-in. gap
0.12-in. gap
0.06-in. gap1.0-in.
1.0-in. 0.12-in. gap
0.06-in. gap
0º
-90º
-180º
180º
-90º
1.0-in.
0.200”
0.160”
0.120”
0.080”
0.040”
11.0-in. 2.0-in. 12.0-in.10.0-in.
Depth of notch is indicated
0.160”
0.120”
Pairs of notches, either 0.5-in.
or 1.0-in. long, each notch
being 0.080” deep (sched. 80)
or 0.040” deep (schedule 40).
The vertical spacing is
indicated.
1.0-in.
1.0-in.
0.25-in. gap
0.12-in. gap
0.06-in. gap1.0-in.
1.0-in. 0.12-in. gap
0.06-in. gap
0º
-90º
-180º
180º
-90º
8/13/2019 JENTEK API Pipeline Conf SanDiego 2013
http://slidepdf.com/reader/full/jentek-api-pipeline-conf-sandiego-2013 16/26
Slide 16Copyright © 2013 JENTEK Sensors
All Rights Reserved.
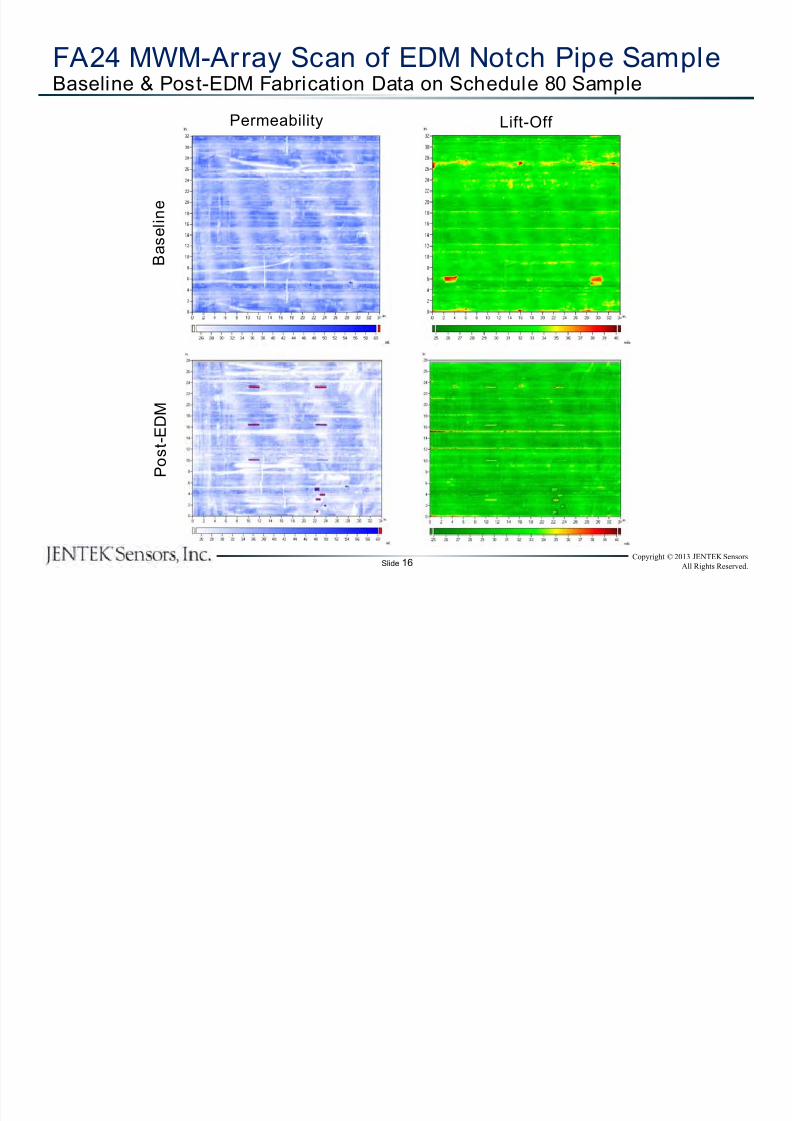
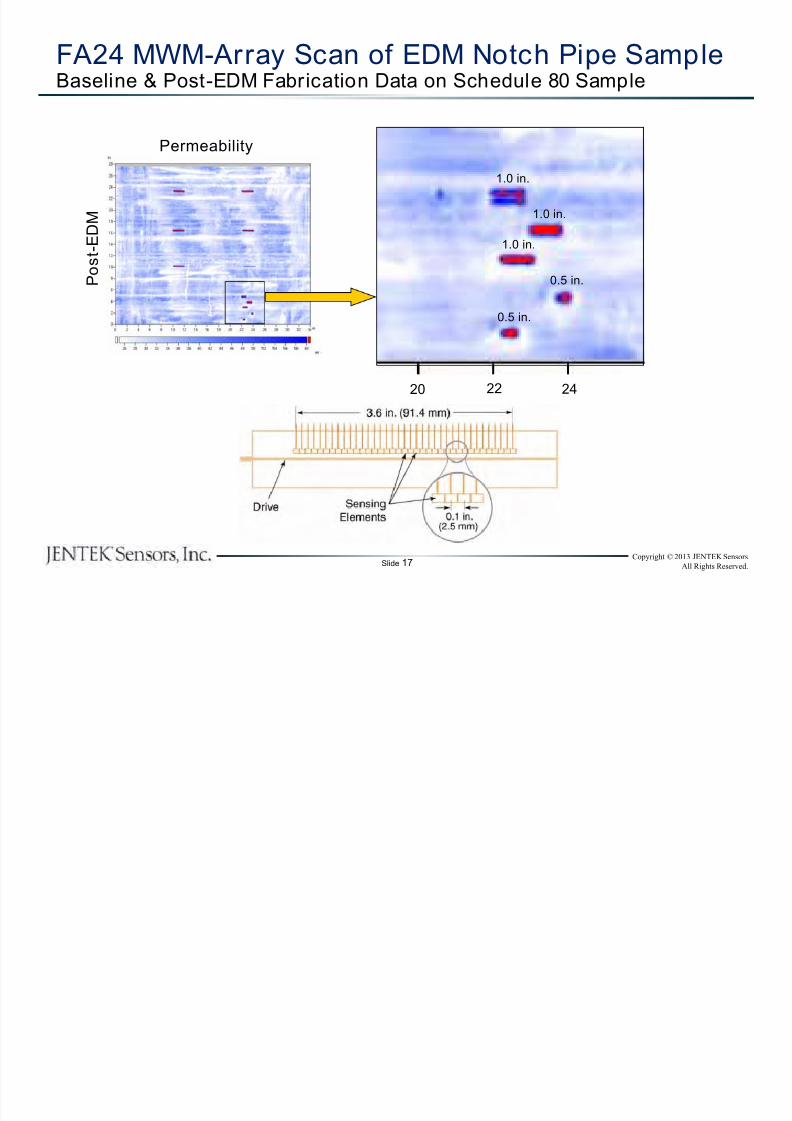
FA24 MWM-Array Scan of EDM Notch Pipe SampleBaseline & Post-EDM Fabrication Data on Schedule 80 Sample
Lift-Off Permeability
B a s e l i n
e
P o s t - E
D M
8/13/2019 JENTEK API Pipeline Conf SanDiego 2013
http://slidepdf.com/reader/full/jentek-api-pipeline-conf-sandiego-2013 17/26
Slide 17Copyright © 2013 JENTEK Sensors
All Rights Reserved.
FA24 MWM-Array Scan of EDM Notch Pipe SampleBaseline & Post-EDM Fabrication Data on Schedule 80 Sample
Permeability
P o s t - E D M
1.0 in.
1.0 in.
1.0 in.
0.5 in.
0.5 in.
20 22 24
8/13/2019 JENTEK API Pipeline Conf SanDiego 2013
http://slidepdf.com/reader/full/jentek-api-pipeline-conf-sandiego-2013 18/26
Slide 18Copyright © 2013 JENTEK Sensors
All Rights Reserved.
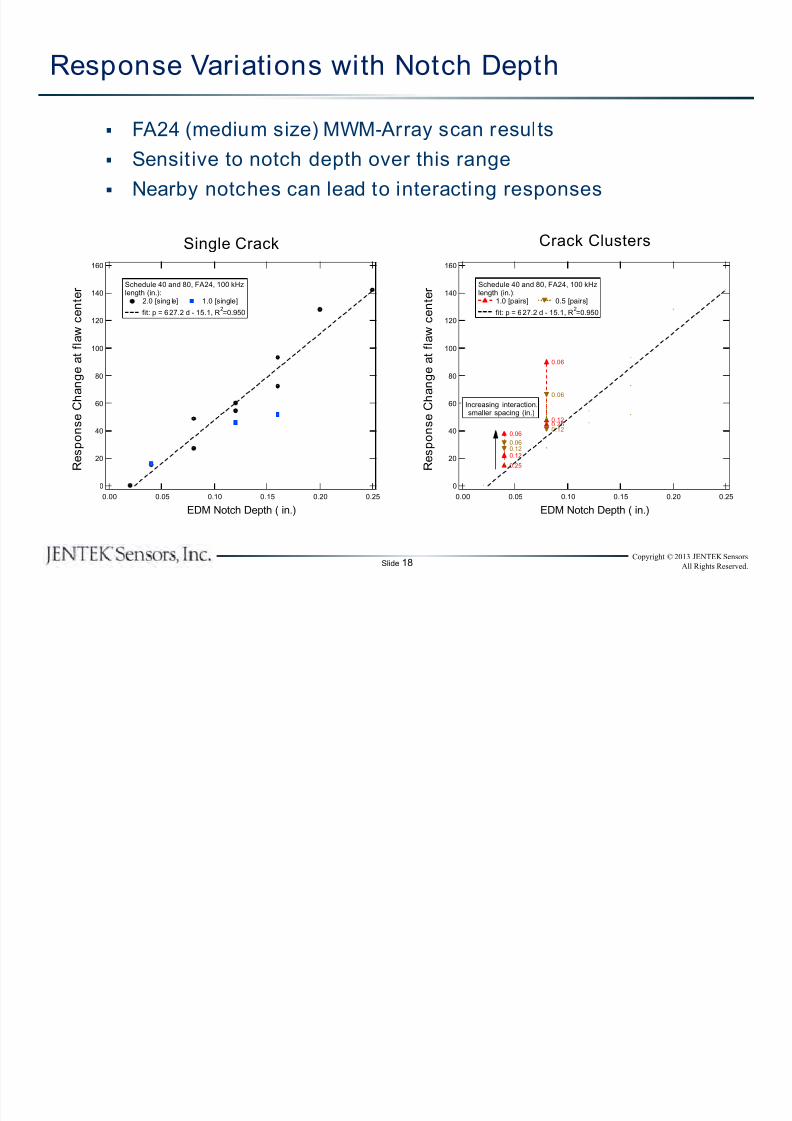
160
140
120
100
80
60
40
20
0
0.250.200.150.100.050.00
EDM Notch Depth ( in.)
Schedule 40 and 80, FA24, 100 kHzlength (in.):
2.0 [sing le] 1.0 [single]
fit: p = 627.2 d - 15.1, R2=0.950
160
140
120
100
80
60
40
20
0
0.250.200.150.100.050.00
EDM Notch Depth ( in.)
0.25
0.12
0.06
0.250.12
0.06
0.120.06
0.12
0.06
Schedule 40 and 80, FA24, 100 kHzlength (in.):
1.0 [pairs] 0.5 [pairs]
fit: p = 627.2 d - 15.1, R2=0.950
Increasing interaction.smaller spacing (in.)
Single Crack Crack Clusters
R e s p o n
s e C h a n g e a t f l a w c e n t e r
R e s p o n
s e C h a n g e a t f l a w c e n t e r
FA24 (medium size) MWM-Array scan results
Sensit ive to notch depth over this range
Nearby notches can lead to interacting responses
Response Variations with Notch Depth
8/13/2019 JENTEK API Pipeline Conf SanDiego 2013
http://slidepdf.com/reader/full/jentek-api-pipeline-conf-sandiego-2013 19/26
Slide 19Copyright © 2013 JENTEK Sensors
All Rights Reserved.
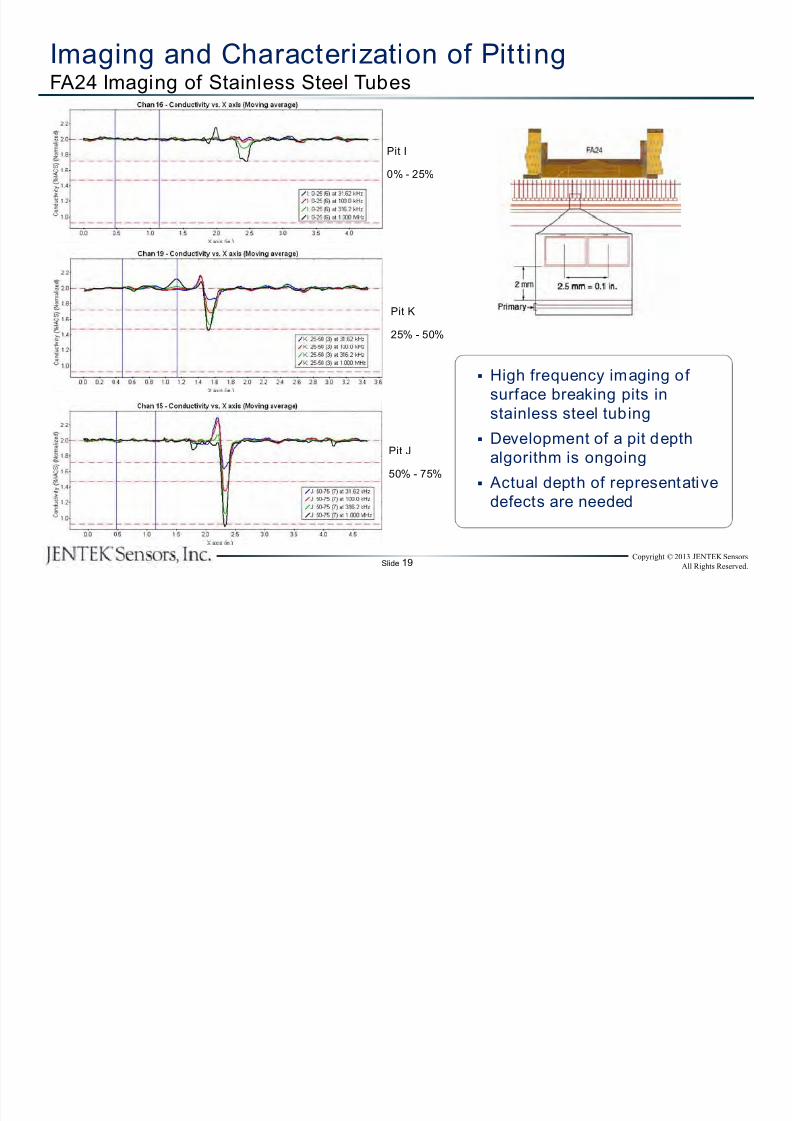
Imaging and Characterization of PittingFA24 Imaging of Stainless Steel Tubes
Pit I
0% - 25%
Pit K
25% - 50%
Pit J
50% - 75%
High frequency imaging of
surface breaking pits in
stainless steel tubing
Development of a pit depth
algorithm is ongoing
Actual depth of representative
defects are needed
8/13/2019 JENTEK API Pipeline Conf SanDiego 2013
http://slidepdf.com/reader/full/jentek-api-pipeline-conf-sandiego-2013 20/26
Slide 20Copyright © 2013 JENTEK Sensors
All Rights Reserved.
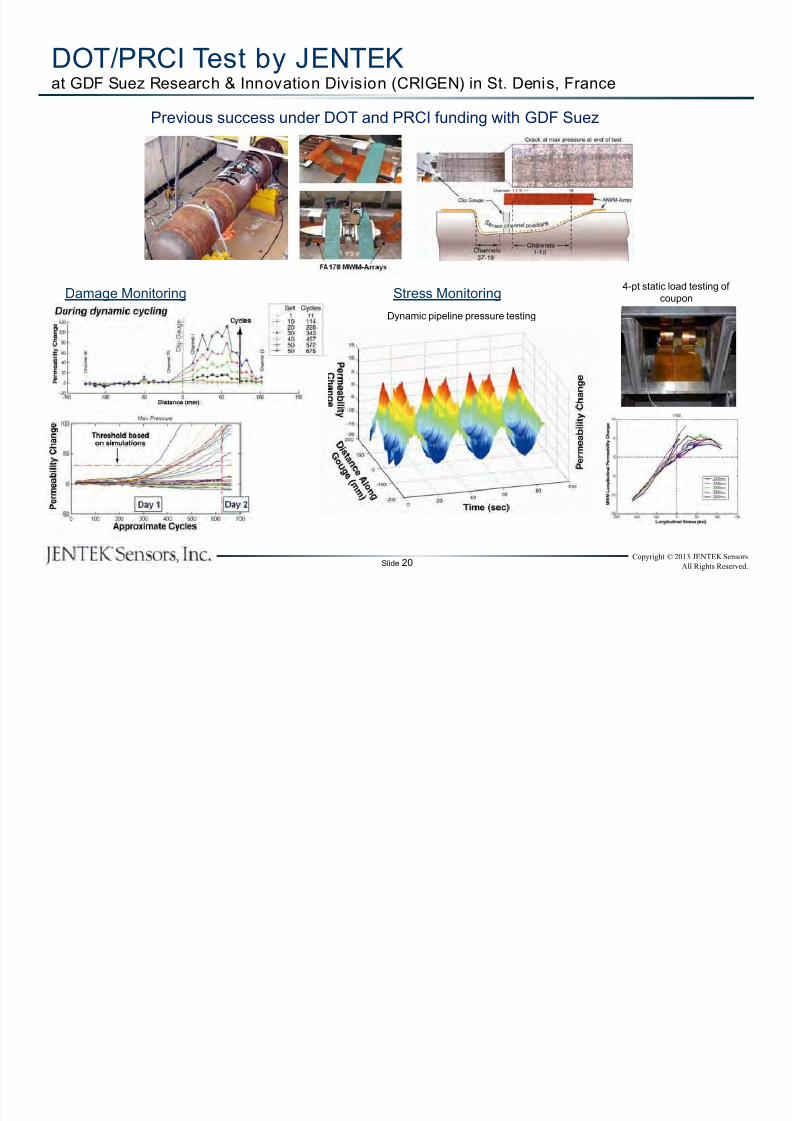
DOT/PRCI Test by JENTEKat GDF Suez Research & Innovation Division (CRIGEN) in St. Denis, France
Previous success under DOT and PRCI funding with GDF Suez
4-pt static load testing of
coupon
Dynamic pipeline pressure testing
Damage Monitoring Stress Monitoring
8/13/2019 JENTEK API Pipeline Conf SanDiego 2013
http://slidepdf.com/reader/full/jentek-api-pipeline-conf-sandiego-2013 21/26
Slide 21Copyright © 2013 JENTEK Sensors
All Rights Reserved.
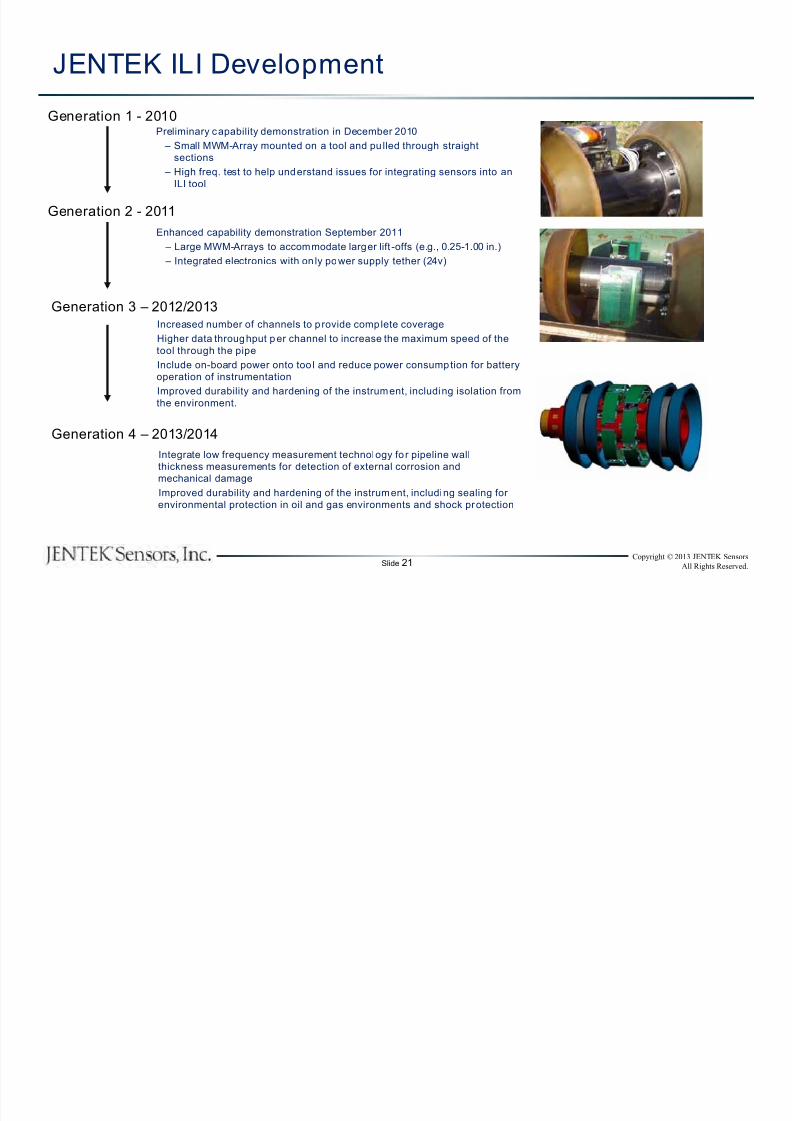
JENTEK ILI Development
Generation 1 - 2010Preliminary capability demonstration in December 2010
– Small MWM-Array mounted on a tool and pu lled through straight
sections
– High freq. test to help understand issues for integrating sensors into an
ILI tool
Enhanced capability demonstration September 2011
– Large MWM-Arrays to accommodate larger lift -offs (e.g., 0.25-1.00 in.)
– Integrated electronics with on ly power supply tether (24v)
Generation 2 - 2011
Generation 3 – 2012/2013
Increased number of channels to provide complete coverageHigher data throughput per channel to increase the maximum speed of the
tool through the pipe
Include on-board power onto too l and reduce power consumption for battery
operation of instrumentation
Improved durability and hardening of the instrument, including isolation from
the environment.
Generation 4 – 2013/2014Integrate low frequency measurement technology for pipeline wall
thickness measurements for detection of external corrosion and
mechanical damage
Improved durability and hardening of the instrument, including sealing for
environmental protection in oil and gas environments and shock protection
8/13/2019 JENTEK API Pipeline Conf SanDiego 2013
http://slidepdf.com/reader/full/jentek-api-pipeline-conf-sandiego-2013 22/26
Slide 22Copyright © 2013 JENTEK Sensors
All Rights Reserved.
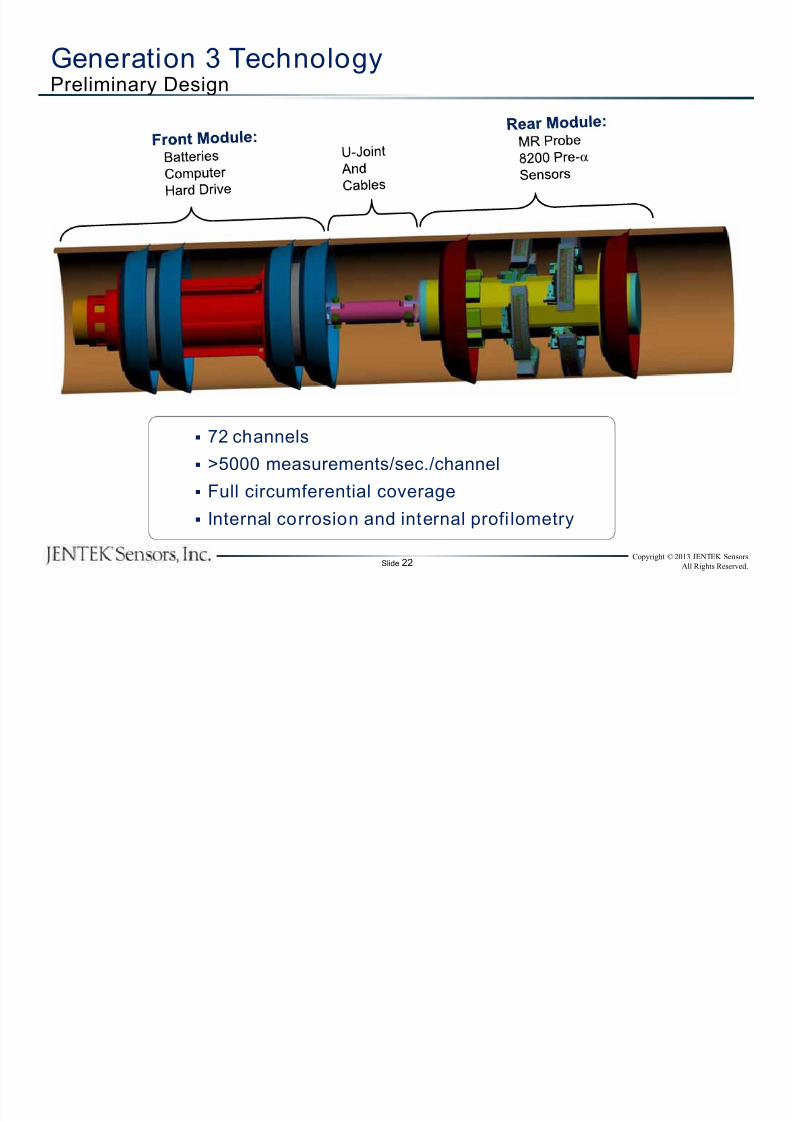
Generation 3 TechnologyPreliminary Design
72 channels
>5000 measurements/sec./channel
Full circumferential coverage
Internal corrosion and internal profi lometry
8/13/2019 JENTEK API Pipeline Conf SanDiego 2013
http://slidepdf.com/reader/full/jentek-api-pipeline-conf-sandiego-2013 23/26
Slide 23Copyright © 2013 JENTEK Sensors
All Rights Reserved.
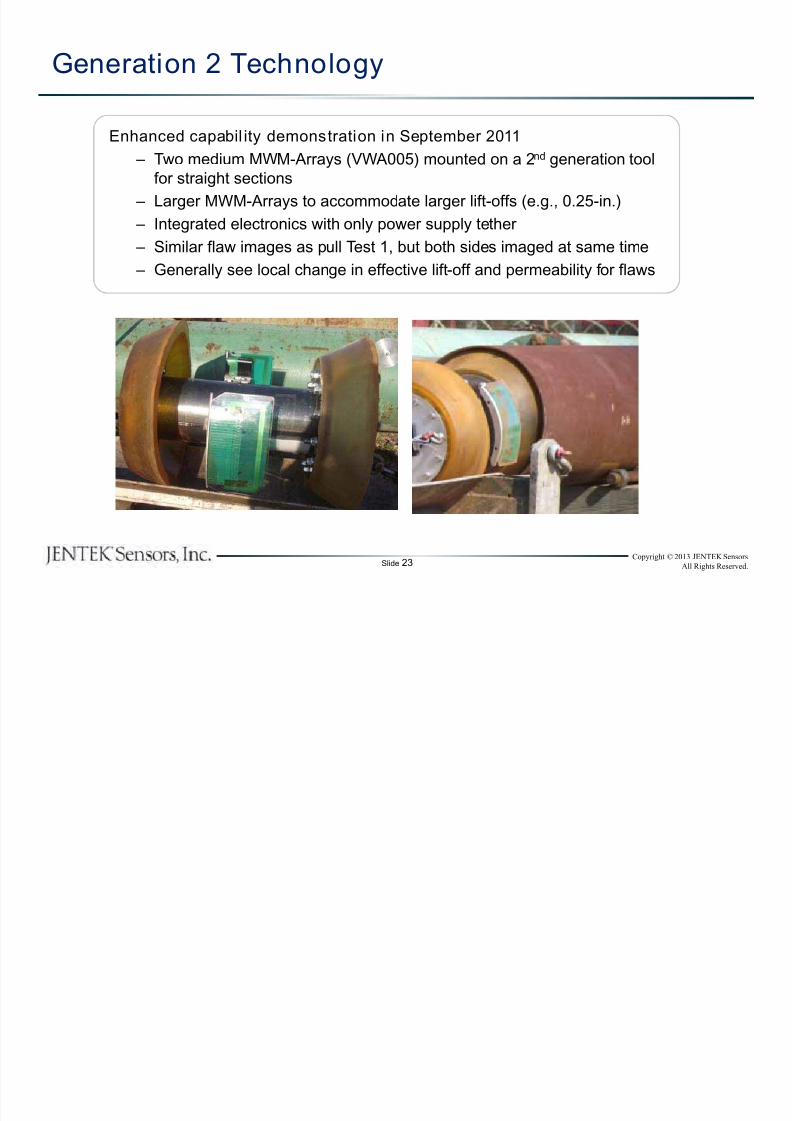
Generation 2 Technology
Enhanced capabil ity demonstration in September 2011
– Two medium MWM-Arrays (VWA005) mounted on a 2nd generation tool
for straight sections
– Larger MWM-Arrays to accommodate larger lift-offs (e.g., 0.25-in.)
– Integrated electronics with only power supply tether
– Similar flaw images as pull Test 1, but both sides imaged at same time
– Generally see local change in effective lift-off and permeability for flaws
8/13/2019 JENTEK API Pipeline Conf SanDiego 2013
http://slidepdf.com/reader/full/jentek-api-pipeline-conf-sandiego-2013 24/26
Slide 24Copyright © 2013 JENTEK Sensors
All Rights Reserved.
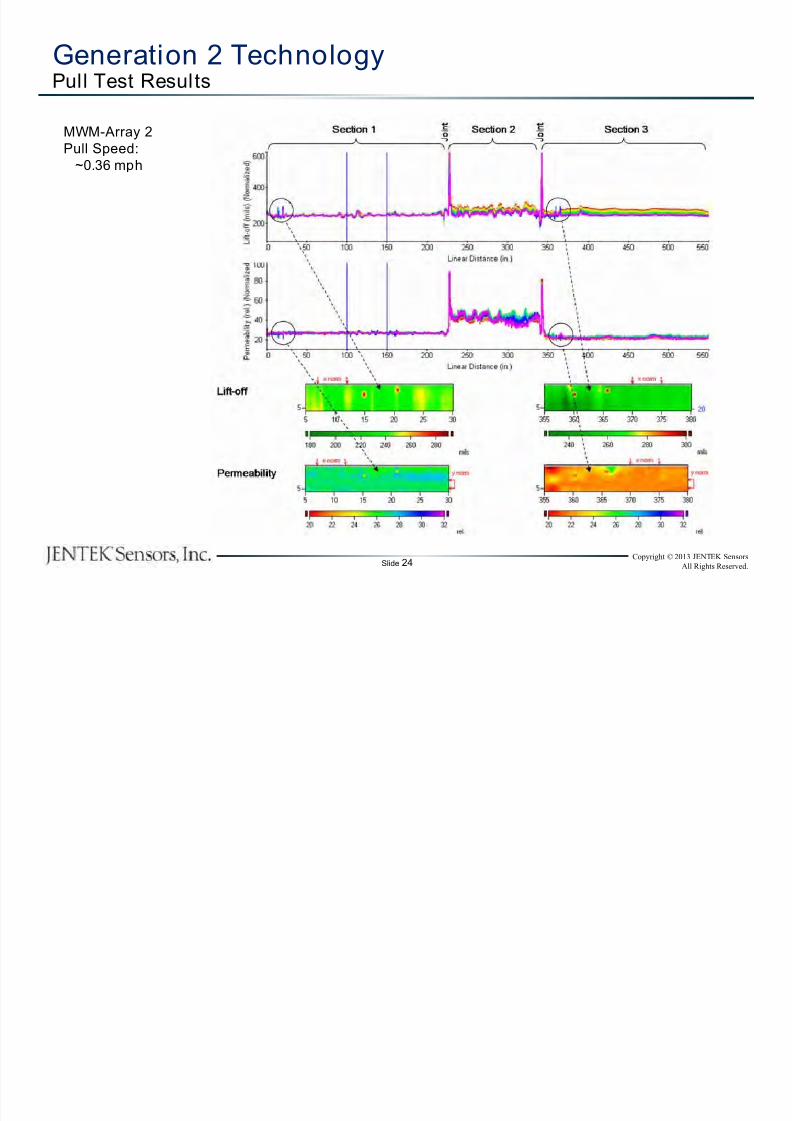
Generation 2 TechnologyPull Test Results
MWM-Array 2
Pull Speed:
~0.36 mph
8/13/2019 JENTEK API Pipeline Conf SanDiego 2013
http://slidepdf.com/reader/full/jentek-api-pipeline-conf-sandiego-2013 25/26
Slide 25Copyright © 2013 JENTEK Sensors
All Rights Reserved.
Summary
MWM-Array technology provides a flexible model-based eddy-
current array for imaging of pipeline material condition
Demonstrated capabilities for numerous applications – Pipe wall thickness measurement through coatings/insulation
– Underwater inspections (shallow water and deepsea) for pipe
wall thickness measurement
– SCC mapping and crack depth estimation
– Characterization of pitting in stainless steel tubing
– Permanently mounted sensors for continuous monitoring
– In-line inspection (ILI)
8/13/2019 JENTEK API Pipeline Conf SanDiego 2013
http://slidepdf.com/reader/full/jentek-api-pipeline-conf-sandiego-2013 26/26
Slide 26Copyright © 2013 JENTEK Sensors
All Rights Reserved.
Phone: 781-642-9666Email: [email protected]
Website: www.jenteksensors.com
Questions?