Embed Size (px)
DESCRIPTION
Jarir Book Store Financial analysis
Citation preview

Particular 2008 2009 2010 2011 2012 2013 2014
Assets
Current Assets
Cash And Bank Balances 24,263 39,660 52,282 59,772 110,904 85,842 128,031
Net Account Receivable 163,176 181,183 211,848 243,494 257,795 256,928 203,969
Net Inventories 390,832 421,424 543,049 600,855 725,918 771,490 817,120
Prepaid Expenses and Other Assets 26,571 36,841 35,671 38,934 38,002 59,241 231,697
Total Current Assets 604,842 679,108 842,850 943,055 1,132,619 1,173,501 1,380,817
Non‐Current Assets
Investment Property 8,193 7,913 7,633 6,664 6,343 5,433 4,955
Investment Available for Sale 27,951 27,951 27,951 27,951 27,951 27,951 27,951
Property and Equipment 521,931 535,444 555,018 742,054 814,136 994,038 1,048,419
Total Non‐Current Assets 558,075 571,308 590,602 776,669 848,430 1,027,422 1,081,325
Total Assets 1,162,917 1,250,416 1,433,452 1,719,724 1,981,049 2,200,923 2,462,142
Liabilities And Shareholders Equity
Current Liabilities
Due to Bank 42,028 37,054 50,111 157 251 ‐ ‐
Long‐term Loans ‐ Current Positions ‐ ‐ ‐ 66,667 16,667 125,000 100,000
Current Portion of Capital Lease Obligition ‐ ‐ ‐ ‐ ‐ 462 462
Account Payables 190,144 277,061 350,904 463,520 568,789 527,428 711,056
Employees Incentive program ‐ Current Portion ‐ ‐ 22,617 29,466 ‐ ‐ 1,178
Deferred Revenues 9,739 10,881 8,035 9,584 10,467 19,128 20,808
Accured Expenses and other liabilities 40,778 44,845 54,846 74,833 77,443 83,970 85,619
Provision for Zakat 10,135 12,498 14,569 19,604 23,419 26,876 25,483
Total Current Liabilities 292,824 382,339 501,082 663,831 697,036 782,864 944,606
Non‐Current Liabilities
Long‐term Loan 150,000 100,000 100,000 108,333 200,000 125,000 25,000
Capital Lease Obligition 13,167 12,705
Deferred Revenue 30,193 23,333
Provision for End‐of‐Service Indemnities 23,878 27,029 34,270 40,051 46,995 56,076 63,226
Employees Incentive Program 9,349 18,210 518 934 10,619 20,961 33,246
Total Non‐Current Liabilities 183,227 145,239 134,788 149,318 257,614 245,397 157,510
Total Liabilities 476,051 527,578 635,870 813,149 954,650 1,028,261 1,102,116
Shareholder's Equity
Capital 300,000.00 400,000.00 400,000.00 600,000.00 600,000.00 900,000 900,000
Statutory Reserve 90,644.00 37,397.00 77,471.00 51,299.00 108,281.00 65,326 139,862 Reserve for Employee's Future Social
Welfare/Stock Option Scheme 13,000.00 13,000.00 ‐ ‐ ‐ ‐ ‐
Retained Earnings 283,222.00 272,441.00 320,111.00 255,276.00 318,118.00 207,336 320,164
Total Shareholder's Equity 686,866.00 722,838.00 797,582.00 906,575.00 1,026,399.00 1,172,662 1,360,026
Total Liabilities And Shareholder's Equity 1,162,917.00 1,250,416.00 1,433,452.00 1,719,724.00 1,981,049.00 2,200,923 2,462,142
Balance Sheet of Jarir Marketing Company for Seven Years
2008 2009 2010 2011 2012 2013 2014
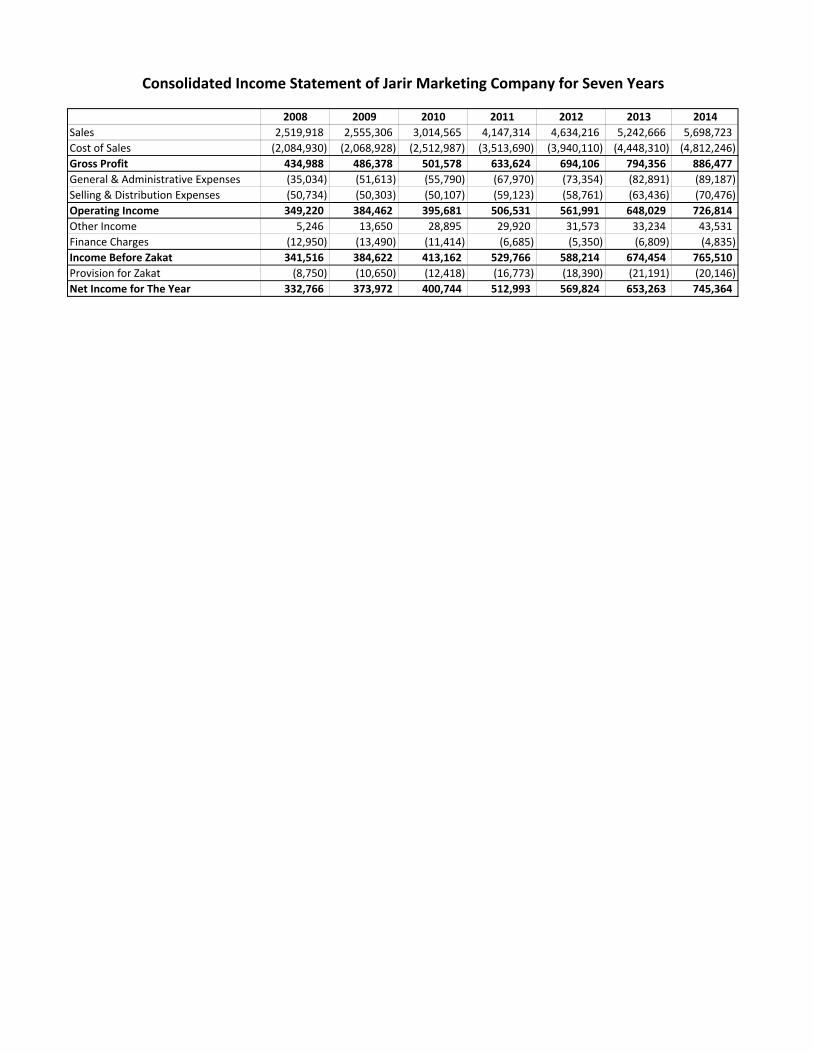
Sales 2,519,918 2,555,306 3,014,565 4,147,314 4,634,216 5,242,666 5,698,723
Cost of Sales (2,084,930) (2,068,928) (2,512,987) (3,513,690) (3,940,110) (4,448,310) (4,812,246)
Gross Profit 434,988 486,378 501,578 633,624 694,106 794,356 886,477
General & Administrative Expenses (35,034) (51,613) (55,790) (67,970) (73,354) (82,891) (89,187)
Selling & Distribution Expenses (50,734) (50,303) (50,107) (59,123) (58,761) (63,436) (70,476)
Operating Income 349,220 384,462 395,681 506,531 561,991 648,029 726,814
Other Income 5,246 13,650 28,895 29,920 31,573 33,234 43,531
Finance Charges (12,950) (13,490) (11,414) (6,685) (5,350) (6,809) (4,835)
Income Before Zakat 341,516 384,622 413,162 529,766 588,214 674,454 765,510
Provision for Zakat (8,750) (10,650) (12,418) (16,773) (18,390) (21,191) (20,146)
Net Income for The Year 332,766 373,972 400,744 512,993 569,824 653,263 745,364
Consolidated Income Statement of Jarir Marketing Company for Seven Years

2013 2014 Difference Percentage
Sales 5,242,666 5,698,723 456,057 8.70%
Cost of Sales (4,448,310) (4,812,246) (363,936) 8.18%
Gross Profit 794,356 886,477 92,121 11.60%
General & Administrative Expenses (82,891) (89,187) (6,296) 7.60%
Selling & Distribution Expenses (63,436) (70,476) (7,040) 11.10%
Operating Income 648,029 726,814 78,785 12.16%
Other Income 33,234 43,531 10,297 30.98%
Finance Charges (6,809) (4,835) 1,974 ‐28.99%
Income Before Zakat 674,454 765,510 91,056 13.50%
Provision for Zakat (21,191) (20,146) 1,045 ‐4.93%
Net Income for The Year 653,263 745,364 92,101 14.10%
Conclusion
Consolidated Income Statement of Comparative 2013 ‐ 2014
1) Sales Revenue was Increased but also cost of sales has increased more but still Gross
profit has increased.
2) General & Administrative Expenses and Selling & Distribution Expenses was increased
but still there was good Operating Income
3) Other Income was increased tremendously and Finance Charges were decreased
tremendously so income before Zakat was still high
4) Provision for Zakat was decreased so net income for the year is still high
‐40.00%
‐30.00%
‐20.00%
‐10.00%
0.00%
10.00%
20.00%
30.00%
40.00%
2012 2013 Difference Percentage
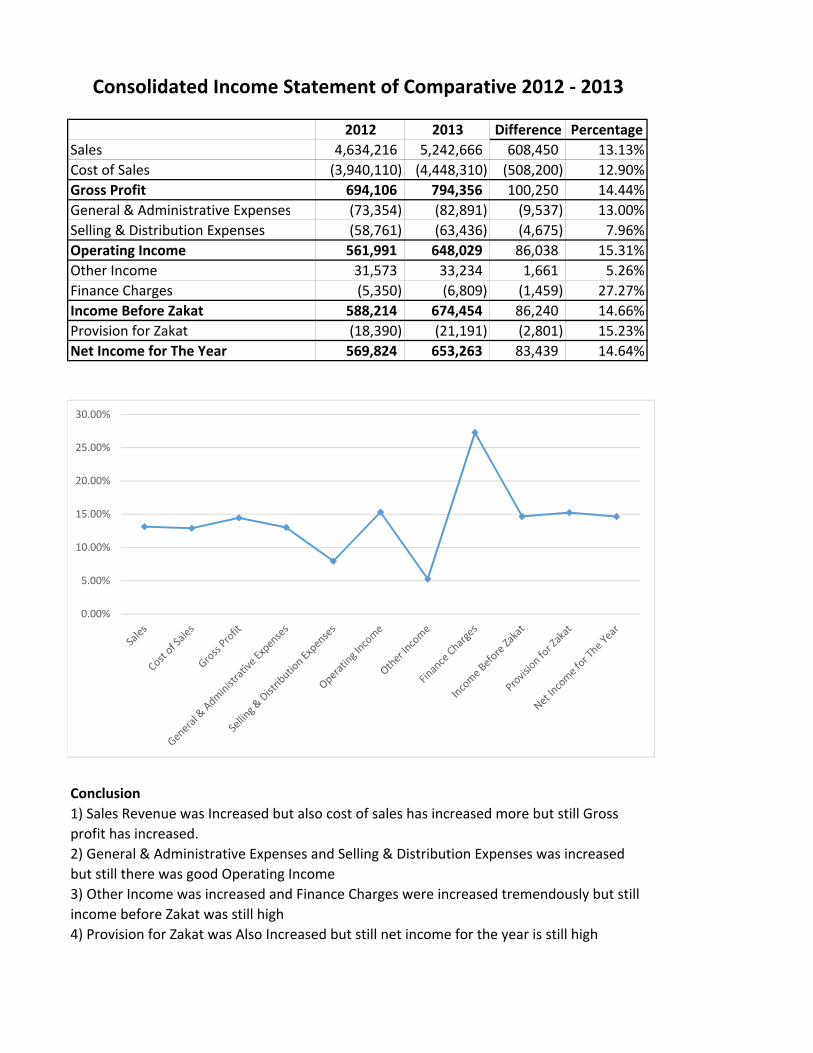
Sales 4,634,216 5,242,666 608,450 13.13%
Cost of Sales (3,940,110) (4,448,310) (508,200) 12.90%
Gross Profit 694,106 794,356 100,250 14.44%
General & Administrative Expenses (73,354) (82,891) (9,537) 13.00%
Selling & Distribution Expenses (58,761) (63,436) (4,675) 7.96%
Operating Income 561,991 648,029 86,038 15.31%
Other Income 31,573 33,234 1,661 5.26%
Finance Charges (5,350) (6,809) (1,459) 27.27%
Income Before Zakat 588,214 674,454 86,240 14.66%
Provision for Zakat (18,390) (21,191) (2,801) 15.23%
Net Income for The Year 569,824 653,263 83,439 14.64%
Conclusion
Consolidated Income Statement of Comparative 2012 ‐ 2013
1) Sales Revenue was Increased but also cost of sales has increased more but still Gross
profit has increased.
2) General & Administrative Expenses and Selling & Distribution Expenses was increased
but still there was good Operating Income
3) Other Income was increased and Finance Charges were increased tremendously but still
income before Zakat was still high
4) Provision for Zakat was Also Increased but still net income for the year is still high
0.00%
5.00%
10.00%
15.00%
20.00%
25.00%
30.00%
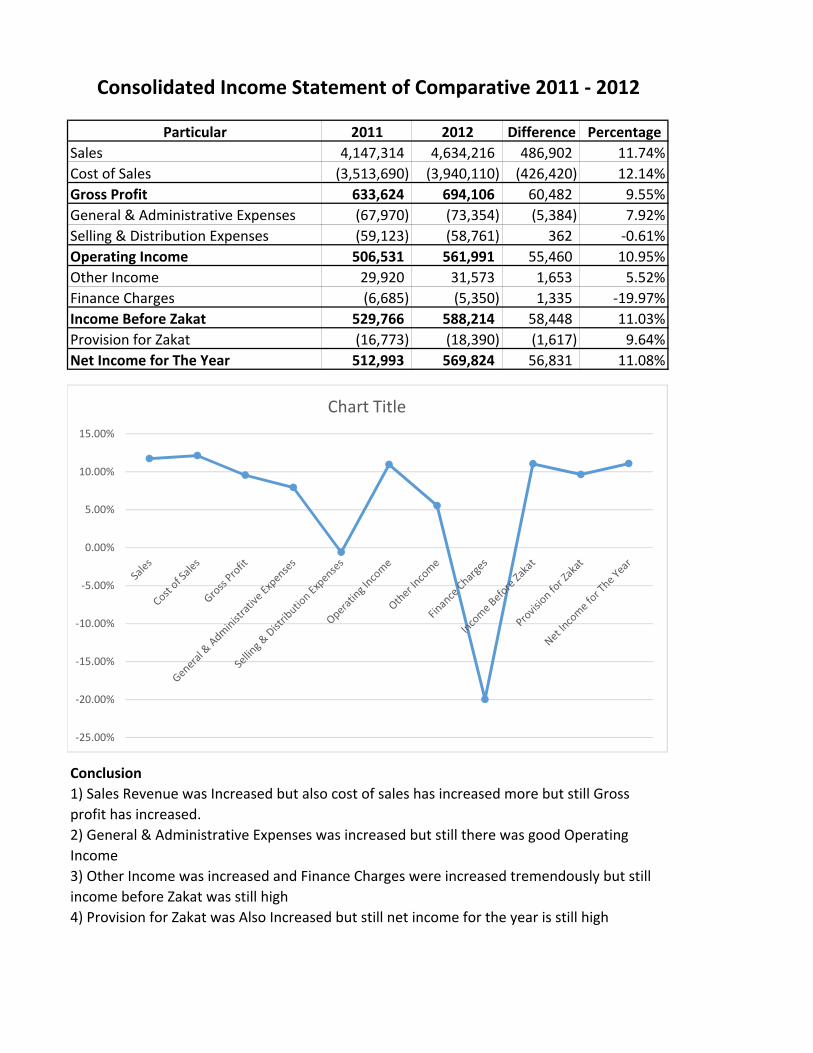
Particular 2011 2012 Difference Percentage
Sales 4,147,314 4,634,216 486,902 11.74%
Cost of Sales (3,513,690) (3,940,110) (426,420) 12.14%
Gross Profit 633,624 694,106 60,482 9.55%
General & Administrative Expenses (67,970) (73,354) (5,384) 7.92%
Selling & Distribution Expenses (59,123) (58,761) 362 ‐0.61%
Operating Income 506,531 561,991 55,460 10.95%
Other Income 29,920 31,573 1,653 5.52%
Finance Charges (6,685) (5,350) 1,335 ‐19.97%
Income Before Zakat 529,766 588,214 58,448 11.03%
Provision for Zakat (16,773) (18,390) (1,617) 9.64%
Net Income for The Year 512,993 569,824 56,831 11.08%
Conclusion
Consolidated Income Statement of Comparative 2011 ‐ 2012
1) Sales Revenue was Increased but also cost of sales has increased more but still Gross
profit has increased.
2) General & Administrative Expenses was increased but still there was good Operating
Income
3) Other Income was increased and Finance Charges were increased tremendously but still
income before Zakat was still high
4) Provision for Zakat was Also Increased but still net income for the year is still high
‐25.00%
‐20.00%
‐15.00%
‐10.00%
‐5.00%
0.00%
5.00%
10.00%
15.00%
Chart Title

Consolidated Income Statement of Comparative 2010 ‐ 2011
Particular 2010 2011 Difference Percentage
Sales 3,014,565 4,147,314 1,132,749 37.58%
Cost of Sales (2,512,987) (3,513,690) (1,000,703) 39.82%
Gross Profit 501,578 633,624 132,046 26.33%
General & Administrative Expenses (55,790) (67,970) (12,180) 21.83%
Selling & Distribution Expenses (50,107) (59,123) (9,016) 17.99%
Operating Income 395,681 506,531 110,850 28.01%
Other Income 28,895 29,920 1,025 3.55%
Finance Charges (11,414) (6,685) 4,729 ‐41.43%
Income Before Zakat 413,162 529,766 116,604 28.22%
Provision for Zakat (12,418) (16,773) (4,355) 35.07%
Net Income for The Year 400,744 512,993 112,249 28.01%
Conclusion
1) Sales Revenue was Increased tremendously but cost of sales has increased more but still
Gross profit was increased.
2) General & Administrative Expenses and Selling & Distribution Expenses was increased but
still there was good Operating Income
3) Other Income was increased and Finance Charges were decreased tremendously so income
before Zakat was still high
4) Provision for Zakat was Also Increased but still net income for the year is still high
‐50.00%
‐40.00%
‐30.00%
‐20.00%
‐10.00%
0.00%
10.00%
20.00%
30.00%
40.00%
50.00%
Chart Title
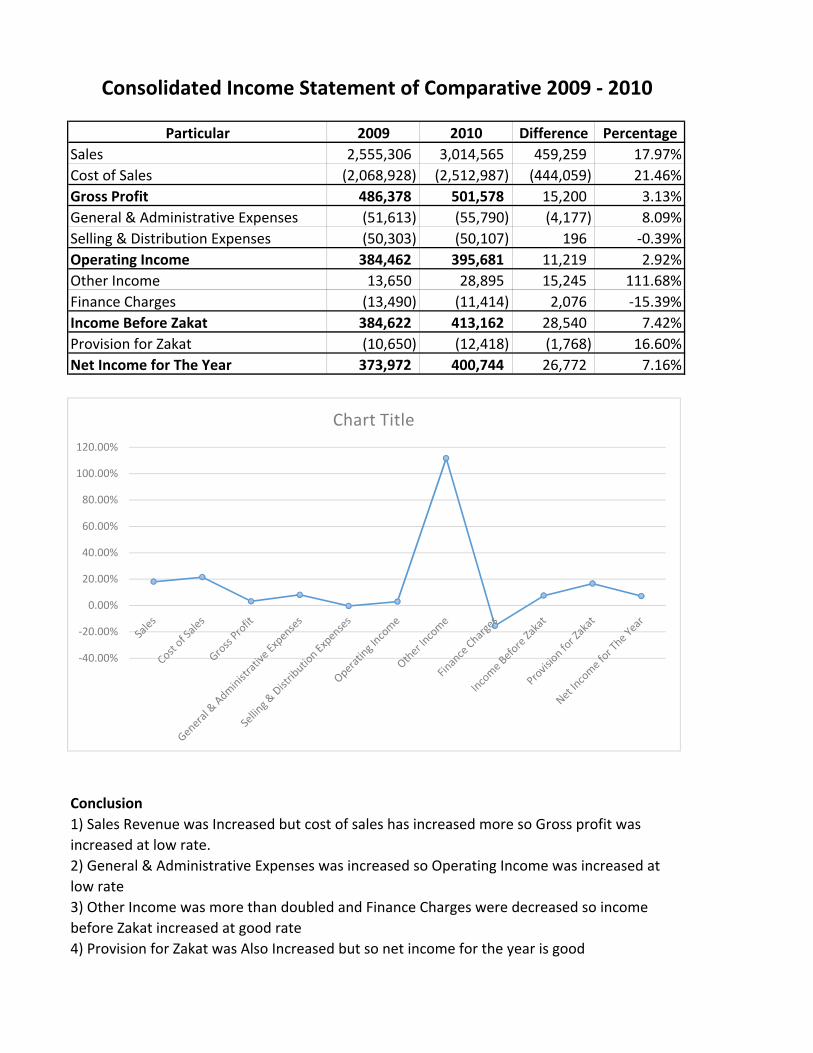
Particular 2009 2010 Difference Percentage
Sales 2,555,306 3,014,565 459,259 17.97%
Cost of Sales (2,068,928) (2,512,987) (444,059) 21.46%
Gross Profit 486,378 501,578 15,200 3.13%
General & Administrative Expenses (51,613) (55,790) (4,177) 8.09%
Selling & Distribution Expenses (50,303) (50,107) 196 ‐0.39%
Operating Income 384,462 395,681 11,219 2.92%
Other Income 13,650 28,895 15,245 111.68%
Finance Charges (13,490) (11,414) 2,076 ‐15.39%
Income Before Zakat 384,622 413,162 28,540 7.42%
Provision for Zakat (10,650) (12,418) (1,768) 16.60%
Net Income for The Year 373,972 400,744 26,772 7.16%
Conclusion
Consolidated Income Statement of Comparative 2009 ‐ 2010
1) Sales Revenue was Increased but cost of sales has increased more so Gross profit was
increased at low rate.
2) General & Administrative Expenses was increased so Operating Income was increased at
low rate
3) Other Income was more than doubled and Finance Charges were decreased so income
before Zakat increased at good rate
4) Provision for Zakat was Also Increased but so net income for the year is good
‐40.00%
‐20.00%
0.00%
20.00%
40.00%
60.00%
80.00%
100.00%
120.00%
Chart Title
Particular 2008 2009 Difference Percentage
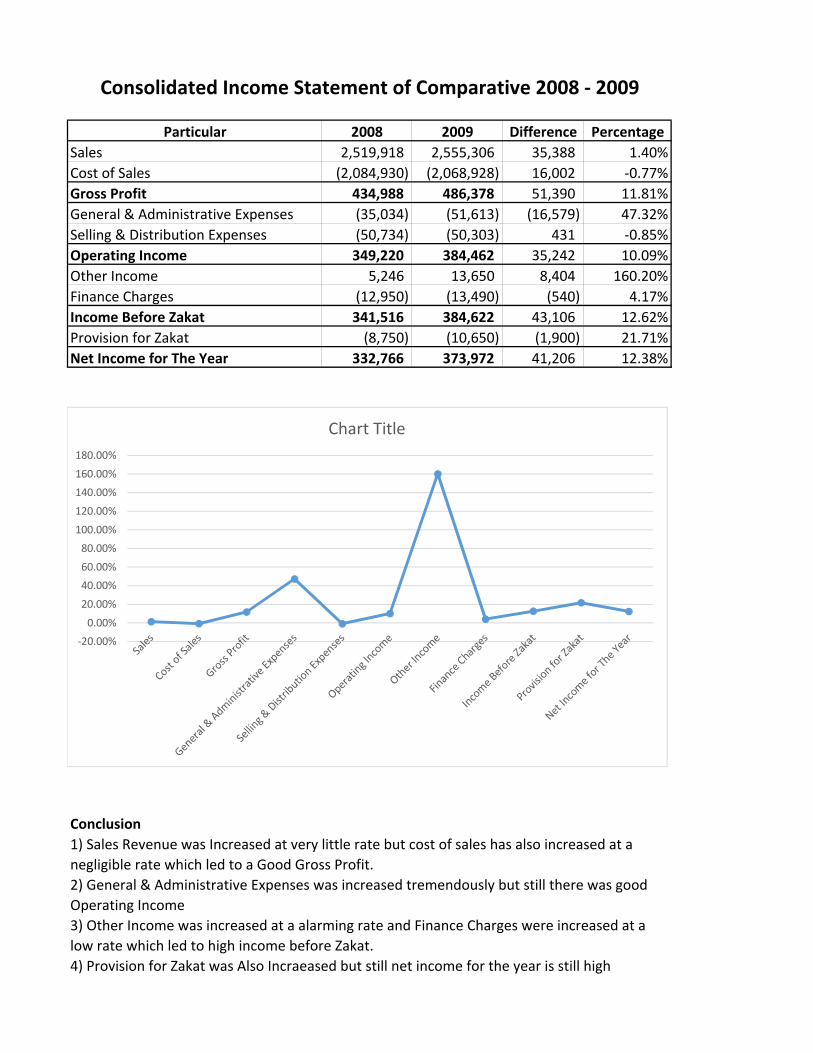
Sales 2,519,918 2,555,306 35,388 1.40%
Cost of Sales (2,084,930) (2,068,928) 16,002 ‐0.77%
Gross Profit 434,988 486,378 51,390 11.81%
General & Administrative Expenses (35,034) (51,613) (16,579) 47.32%
Selling & Distribution Expenses (50,734) (50,303) 431 ‐0.85%
Operating Income 349,220 384,462 35,242 10.09%
Other Income 5,246 13,650 8,404 160.20%
Finance Charges (12,950) (13,490) (540) 4.17%
Income Before Zakat 341,516 384,622 43,106 12.62%
Provision for Zakat (8,750) (10,650) (1,900) 21.71%
Net Income for The Year 332,766 373,972 41,206 12.38%
Conclusion
Consolidated Income Statement of Comparative 2008 ‐ 2009
1) Sales Revenue was Increased at very little rate but cost of sales has also increased at a
negligible rate which led to a Good Gross Profit.
2) General & Administrative Expenses was increased tremendously but still there was good
Operating Income
3) Other Income was increased at a alarming rate and Finance Charges were increased at a
low rate which led to high income before Zakat.
4) Provision for Zakat was Also Incraeased but still net income for the year is still high
‐20.00%
0.00%
20.00%
40.00%
60.00%
80.00%
100.00%
120.00%
140.00%
160.00%
180.00%
Chart Title
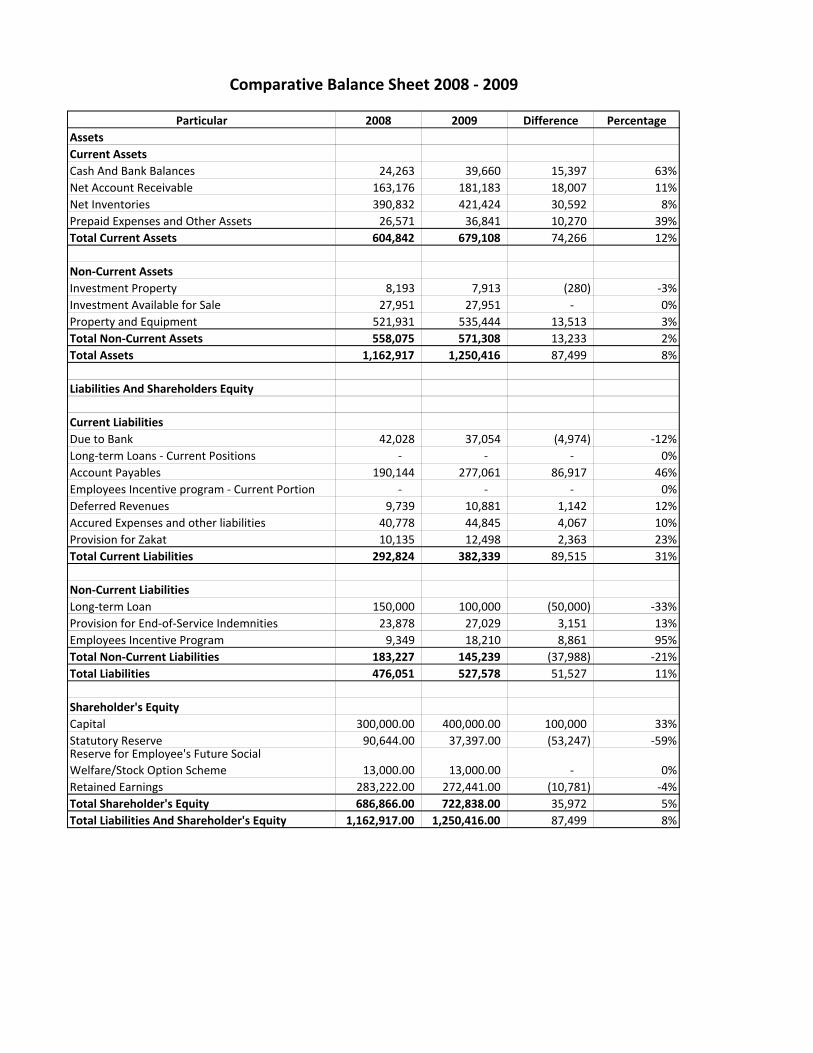
Particular 2008 2009 Difference Percentage
Assets
Current Assets
Cash And Bank Balances 24,263 39,660 15,397 63%
Net Account Receivable 163,176 181,183 18,007 11%
Net Inventories 390,832 421,424 30,592 8%
Prepaid Expenses and Other Assets 26,571 36,841 10,270 39%
Total Current Assets 604,842 679,108 74,266 12%
Non‐Current Assets
Investment Property 8,193 7,913 (280) ‐3%
Investment Available for Sale 27,951 27,951 ‐ 0%
Property and Equipment 521,931 535,444 13,513 3%
Total Non‐Current Assets 558,075 571,308 13,233 2%
Total Assets 1,162,917 1,250,416 87,499 8%
Liabilities And Shareholders Equity
Current Liabilities
Due to Bank 42,028 37,054 (4,974) ‐12%
Long‐term Loans ‐ Current Positions ‐ ‐ ‐ 0%
Account Payables 190,144 277,061 86,917 46%
Employees Incentive program ‐ Current Portion ‐ ‐ ‐ 0%
Deferred Revenues 9,739 10,881 1,142 12%
Accured Expenses and other liabilities 40,778 44,845 4,067 10%
Provision for Zakat 10,135 12,498 2,363 23%
Total Current Liabilities 292,824 382,339 89,515 31%
Non‐Current Liabilities
Long‐term Loan 150,000 100,000 (50,000) ‐33%
Provision for End‐of‐Service Indemnities 23,878 27,029 3,151 13%
Employees Incentive Program 9,349 18,210 8,861 95%
Total Non‐Current Liabilities 183,227 145,239 (37,988) ‐21%
Total Liabilities 476,051 527,578 51,527 11%
Shareholder's Equity
Capital 300,000.00 400,000.00 100,000 33%
Statutory Reserve 90,644.00 37,397.00 (53,247) ‐59%Reserve for Employee's Future Social
Welfare/Stock Option Scheme 13,000.00 13,000.00 ‐ 0%
Retained Earnings 283,222.00 272,441.00 (10,781) ‐4%
Total Shareholder's Equity 686,866.00 722,838.00 35,972 5%
Total Liabilities And Shareholder's Equity 1,162,917.00 1,250,416.00 87,499 8%
Comparative Balance Sheet 2008 ‐ 2009

Analysis
1) Jarir Marketing Company has shown significant growth from 2008 ‐ 2009
2) In Current Assets cash & bank balances & Net Inventories has grown Tremendously.
3) Non Current Assets were constant
4) In Current liability Accounts payable has increased which led to high Current liability.
5) in Total Liability expenses on Employees Incentive Program which was almost doubled and their was
. reduction in long term loans.
6) In Total Shareholder's Equity capital was increased and Statutory Reserve was decreased.
‐80%
‐60%
‐40%
‐20%
0%
20%
40%
60%
80%
100%
120%
Comparative Balance Sheet
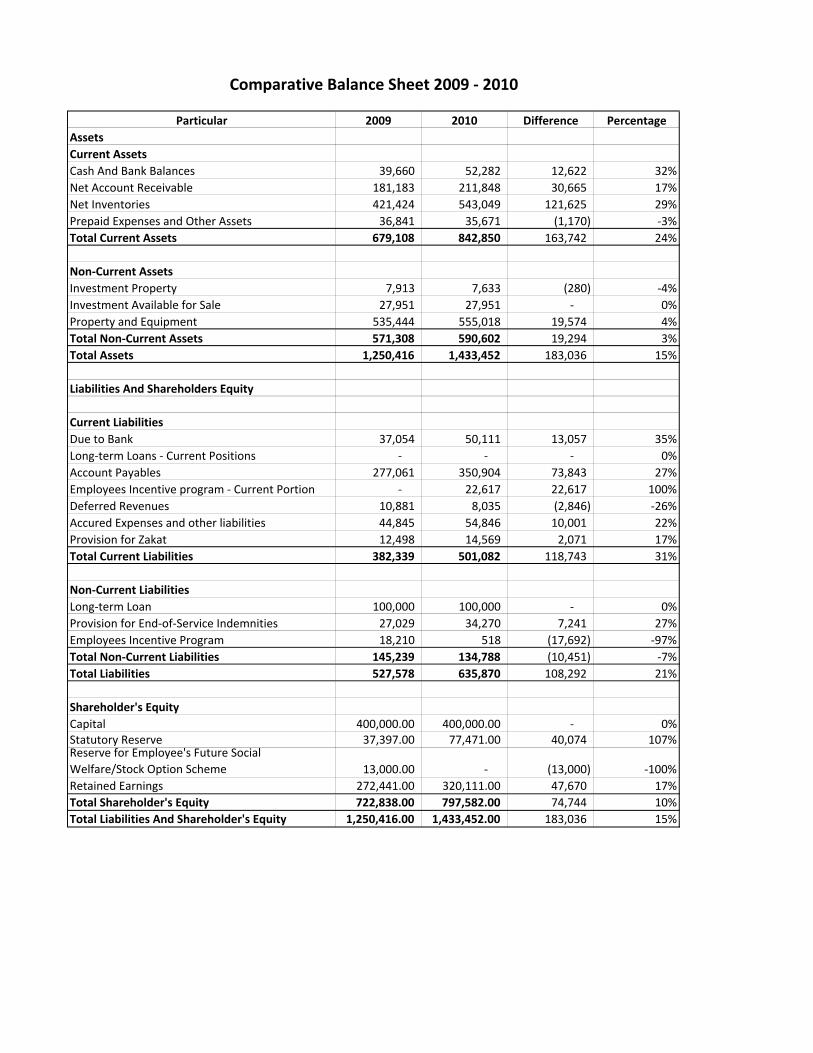
Particular 2009 2010 Difference Percentage
Assets
Current Assets
Cash And Bank Balances 39,660 52,282 12,622 32%
Net Account Receivable 181,183 211,848 30,665 17%
Net Inventories 421,424 543,049 121,625 29%
Prepaid Expenses and Other Assets 36,841 35,671 (1,170) ‐3%
Total Current Assets 679,108 842,850 163,742 24%
Non‐Current Assets
Investment Property 7,913 7,633 (280) ‐4%
Investment Available for Sale 27,951 27,951 ‐ 0%
Property and Equipment 535,444 555,018 19,574 4%
Total Non‐Current Assets 571,308 590,602 19,294 3%
Total Assets 1,250,416 1,433,452 183,036 15%
Liabilities And Shareholders Equity
Current Liabilities
Due to Bank 37,054 50,111 13,057 35%
Long‐term Loans ‐ Current Positions ‐ ‐ ‐ 0%
Account Payables 277,061 350,904 73,843 27%
Employees Incentive program ‐ Current Portion ‐ 22,617 22,617 100%
Deferred Revenues 10,881 8,035 (2,846) ‐26%
Accured Expenses and other liabilities 44,845 54,846 10,001 22%
Provision for Zakat 12,498 14,569 2,071 17%
Total Current Liabilities 382,339 501,082 118,743 31%
Non‐Current Liabilities
Long‐term Loan 100,000 100,000 ‐ 0%
Provision for End‐of‐Service Indemnities 27,029 34,270 7,241 27%
Employees Incentive Program 18,210 518 (17,692) ‐97%
Total Non‐Current Liabilities 145,239 134,788 (10,451) ‐7%
Total Liabilities 527,578 635,870 108,292 21%
Shareholder's Equity
Capital 400,000.00 400,000.00 ‐ 0%Statutory Reserve 37,397.00 77,471.00 40,074 107%Reserve for Employee's Future Social
Welfare/Stock Option Scheme 13,000.00 ‐ (13,000) ‐100%
Retained Earnings 272,441.00 320,111.00 47,670 17%
Total Shareholder's Equity 722,838.00 797,582.00 74,744 10%
Total Liabilities And Shareholder's Equity 1,250,416.00 1,433,452.00 183,036 15%
Comparative Balance Sheet 2009 ‐ 2010

Conclusion
1) Jarir Marketing Company has shown significant growth from 2009 ‐ 2010
2) In Current Assets almost all elements had high rise which led to increased Current Assets.
3) Non Current Assets were constant
4) In Current liability Due to bank & Account Payable was increased. And Employees Incentive program ‐ Current
Portion was added.
5) in Total Liability Provision for End‐of‐Service Indemnities was increased and Employees Incentive Program was
tremendously decreased
6) In Total Shareholder's Equity Statutory Reserve was increased and Reserve for Employee's Future Social
Welfare/Stock Option Scheme was removed.
‐150%
‐100%
‐50%
0%
50%
100%
150%
Chart Title
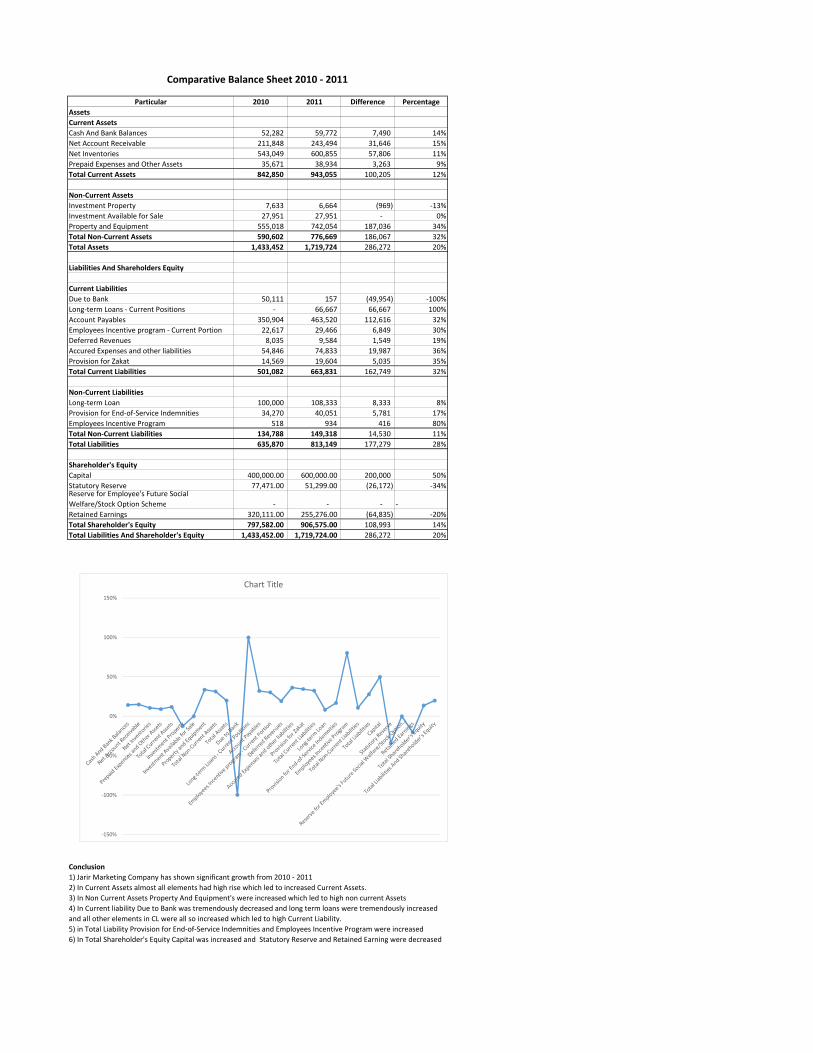
Particular 2010 2011 Difference Percentage
Assets
Current Assets
Cash And Bank Balances 52,282 59,772 7,490 14%
Net Account Receivable 211,848 243,494 31,646 15%
Net Inventories 543,049 600,855 57,806 11%
Prepaid Expenses and Other Assets 35,671 38,934 3,263 9%
Total Current Assets 842,850 943,055 100,205 12%
Non‐Current Assets
Investment Property 7,633 6,664 (969) ‐13%
Investment Available for Sale 27,951 27,951 ‐ 0%
Property and Equipment 555,018 742,054 187,036 34%
Total Non‐Current Assets 590,602 776,669 186,067 32%
Total Assets 1,433,452 1,719,724 286,272 20%
Liabilities And Shareholders Equity
Current Liabilities
Due to Bank 50,111 157 (49,954) ‐100%
Long‐term Loans ‐ Current Positions ‐ 66,667 66,667 100%
Account Payables 350,904 463,520 112,616 32%
Employees Incentive program ‐ Current Portion 22,617 29,466 6,849 30%
Deferred Revenues 8,035 9,584 1,549 19%
Accured Expenses and other liabilities 54,846 74,833 19,987 36%
Provision for Zakat 14,569 19,604 5,035 35%
Total Current Liabilities 501,082 663,831 162,749 32%
Non‐Current Liabilities
Long‐term Loan 100,000 108,333 8,333 8%
Provision for End‐of‐Service Indemnities 34,270 40,051 5,781 17%
Employees Incentive Program 518 934 416 80%
Total Non‐Current Liabilities 134,788 149,318 14,530 11%
Total Liabilities 635,870 813,149 177,279 28%
Shareholder's Equity
Capital 400,000.00 600,000.00 200,000 50%
Statutory Reserve 77,471.00 51,299.00 (26,172) ‐34%Reserve for Employee's Future Social
Welfare/Stock Option Scheme ‐ ‐ ‐ ‐
Retained Earnings 320,111.00 255,276.00 (64,835) ‐20%
Total Shareholder's Equity 797,582.00 906,575.00 108,993 14%
Total Liabilities And Shareholder's Equity 1,433,452.00 1,719,724.00 286,272 20%
Conclusion
Comparative Balance Sheet 2010 ‐ 2011
1) Jarir Marketing Company has shown significant growth from 2010 ‐ 2011
2) In Current Assets almost all elements had high rise which led to increased Current Assets.
3) In Non Current Assets Property And Equipment's were increased which led to high non current Assets
4) In Current liability Due to Bank was tremendously decreased and long term loans were tremendously increased
and all other elements in CL were all so increased which led to high Current Liability.
5) in Total Liability Provision for End‐of‐Service Indemnities and Employees Incentive Program were increased
6) In Total Shareholder's Equity Capital was increased and Statutory Reserve and Retained Earning were decreased
‐150%
‐100%
‐50%
0%
50%
100%
150%
Chart Title

Particular 2011 2012 Difference Percentage
Assets
Current Assets
Cash And Bank Balances 59,772 110,904 51,132 86%
Net Account Receivable 243,494 257,795 14,301 6%
Net Inventories 600,855 725,918 125,063 21%
Prepaid Expenses and Other Assets 38,934 38,002 (932) ‐2%
Total Current Assets 943,055 1,132,619 189,564 20%
Non‐Current Assets
Investment Property 6,664 6,343 (321) ‐5%
Investment Available for Sale 27,951 27,951 ‐ 0%
Property and Equipment 742,054 814,136 72,082 10%
Total Non‐Current Assets 776,669 848,430 71,761 9%
Total Assets 1,719,724 1,981,049 261,325 15%
Liabilities And Shareholders Equity
Current Liabilities
Due to Bank 157 251 94 60%
Long‐term Loans ‐ Current Positions 66,667 16,667 (50,000) ‐75%
Account Payables 463,520 568,789 105,269 23%
Employees Incentive program ‐ Current Portion 29,466 ‐ (29,466) ‐100%
Deferred Revenues 9,584 10,467 883 9%
Accured Expenses and other liabilities 74,833 77,443 2,610 3%
Provision for Zakat 19,604 23,419 3,815 19%
Total Current Liabilities 663,831 697,036 33,205 5%
Non‐Current Liabilities
Long‐term Loan 108,333 200,000 91,667 85%
Provision for End‐of‐Service Indemnities 40,051 46,995 6,944 17%
Employees Incentive Program 934 10,619 9,685 1037%
Total Non‐Current Liabilities 149,318 257,614 108,296 73%
Total Liabilities 813,149 954,650 141,501 17%
Shareholder's Equity
Capital 600,000.00 600,000.00 ‐ 0%
Statutory Reserve 51,299.00 108,281.00 56,982 111%Reserve for Employee's Future Social
Welfare/Stock Option Scheme ‐ ‐ ‐ 0%
Retained Earnings 255,276.00 318,118.00 62,842 25%
Total Shareholder's Equity 906,575.00 1,026,399.00 119,824 13%
Total Liabilities And Shareholder's Equity 1,719,724.00 1,981,049.00 261,325 15%
Conclusion
Comparative Balance Sheet 2011 ‐ 2012
1) Jarir Marketing Company has shown significant growth from 2011 ‐ 2012
2) In Current Assets cash & bank balances & Net Inventories has increased.
3) In Non Current Assets Property And Equipment's were increased which led to high non current Assets
4) In Current liability Due to Bank and Accounts Payable was increased and long term loans‐ Current Position and
Employees Incentive program ‐ Current Portion were tremendously decreased
5) in Total Liability Employee Incentive Program has seen ten times growth and long term loans and Provision for End‐
of‐Service Indemnities were also increased which led to very high Non Current Liability
6) In Total Shareholder's Equity Statutory Reserve was increased tremendously and Retained Earning also increased.
‐200%
0%
200%
400%
600%
800%
1000%
1200%
Chart Title
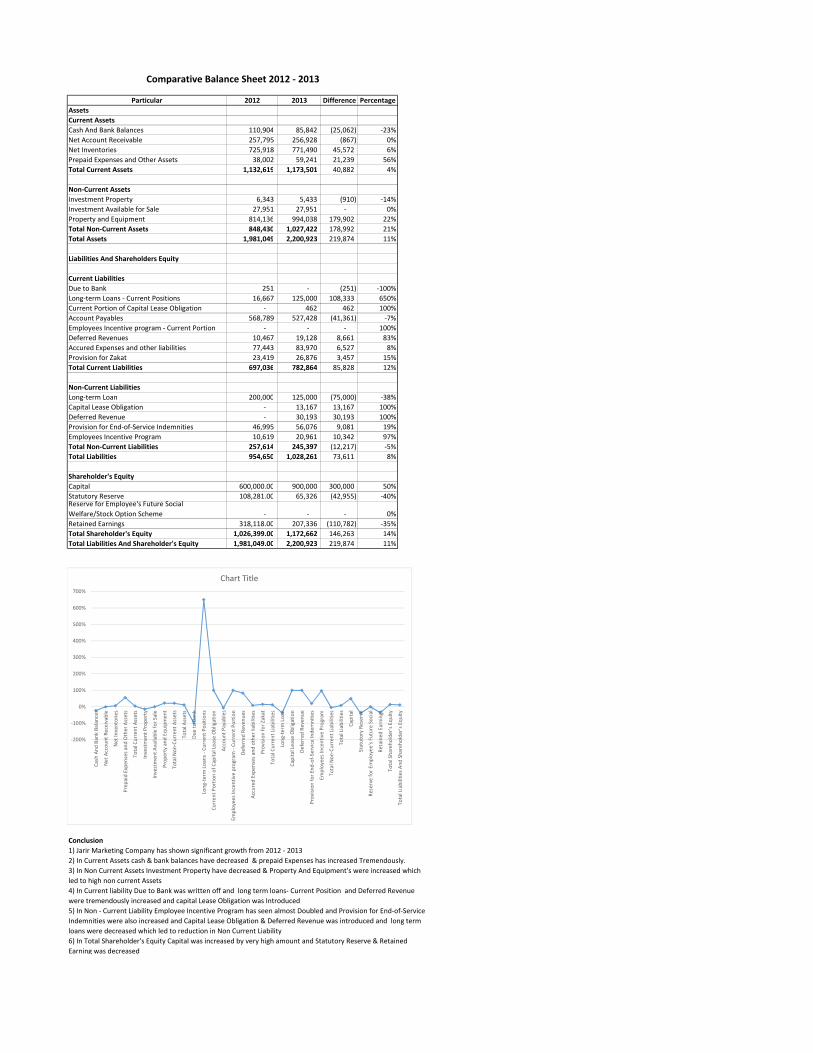
Particular 2012 2013 Difference Percentage
Assets
Current Assets
Cash And Bank Balances 110,904 85,842 (25,062) ‐23%
Net Account Receivable 257,795 256,928 (867) 0%
Net Inventories 725,918 771,490 45,572 6%
Prepaid Expenses and Other Assets 38,002 59,241 21,239 56%
Total Current Assets 1,132,619 1,173,501 40,882 4%
Non‐Current Assets
Investment Property 6,343 5,433 (910) ‐14%
Investment Available for Sale 27,951 27,951 ‐ 0%
Property and Equipment 814,136 994,038 179,902 22%
Total Non‐Current Assets 848,430 1,027,422 178,992 21%
Total Assets 1,981,049 2,200,923 219,874 11%
Liabilities And Shareholders Equity
Current Liabilities
Due to Bank 251 ‐ (251) ‐100%
Long‐term Loans ‐ Current Positions 16,667 125,000 108,333 650%
Current Portion of Capital Lease Obligation ‐ 462 462 100%
Account Payables 568,789 527,428 (41,361) ‐7%
Employees Incentive program ‐ Current Portion ‐ ‐ ‐ 100%
Deferred Revenues 10,467 19,128 8,661 83%
Accured Expenses and other liabilities 77,443 83,970 6,527 8%
Provision for Zakat 23,419 26,876 3,457 15%
Total Current Liabilities 697,036 782,864 85,828 12%
Non‐Current Liabilities
Long‐term Loan 200,000 125,000 (75,000) ‐38%
Capital Lease Obligation ‐ 13,167 13,167 100%
Deferred Revenue ‐ 30,193 30,193 100%
Provision for End‐of‐Service Indemnities 46,995 56,076 9,081 19%
Employees Incentive Program 10,619 20,961 10,342 97%
Total Non‐Current Liabilities 257,614 245,397 (12,217) ‐5%
Total Liabilities 954,650 1,028,261 73,611 8%
Shareholder's Equity
Capital 600,000.00 900,000 300,000 50%
Statutory Reserve 108,281.00 65,326 (42,955) ‐40%Reserve for Employee's Future Social
Welfare/Stock Option Scheme ‐ ‐ ‐ 0%
Retained Earnings 318,118.00 207,336 (110,782) ‐35%
Total Shareholder's Equity 1,026,399.00 1,172,662 146,263 14%
Total Liabilities And Shareholder's Equity 1,981,049.00 2,200,923 219,874 11%
Conclusion
Comparative Balance Sheet 2012 ‐ 2013
1) Jarir Marketing Company has shown significant growth from 2012 ‐ 2013
2) In Current Assets cash & bank balances have decreased & prepaid Expenses has increased Tremendously.
3) In Non Current Assets Investment Property have decreased & Property And Equipment's were increased which
led to high non current Assets
4) In Current liability Due to Bank was written off and long term loans‐ Current Position and Deferred Revenue
were tremendously increased and capital Lease Obligation was Introduced
5) In Non ‐ Current Liability Employee Incentive Program has seen almost Doubled and Provision for End‐of‐Service
Indemnities were also increased and Capital Lease Obligation & Deferred Revenue was introduced and long term
loans were decreased which led to reduction in Non Current Liability
6) In Total Shareholder's Equity Capital was increased by very high amount and Statutory Reserve & Retained
Earning was decreased
‐200%
‐100%
0%
100%
200%
300%
400%
500%
600%
700%
Cash And Bank Balances
Net Account Receivable
Net Inventories
Prepaid Expen
ses and Other Assets
Total Current Assets
Investmen
t Property
Investmen
t Available for Sale
Property and Equipment
Total N
on‐Current Assets
Total A
ssets
Due to Bank
Long‐term
Loans ‐ Current Positions
Current Portion of Capital Lease Obligation
Account Payab
les
Employees Incentive program
‐ Current Portion
Deferred Revenues
Accured Expen
ses and other liabilities
Provision for Zakat
Total Current Liabilities
Long‐term
Loan
Capital Lease Obligation
Deferred Revenue
Provision for End‐of‐Service Indem
nities
Employees Incentive Program
Total N
on‐Current Liabilities
Total Liabilities
Capital
Statutory Reserve
Reserve for Em
ployee's Future Social…
Retained Earnings
Total Shareh
older's Equity
Total Liabilities And Shareholder's Equity
Chart Title

Particular 2013 2014 Difference Percentage
Assets
Current Assets
Cash And Bank Balances 85,842 128,031 42,189 49%
Net Account Receivable 256,928 203,969 (52,959) ‐21%
Net Inventories 771,490 817,120 45,630 6%
Prepaid Expenses and Other Assets 59,241 231,697 172,456 291%
Total Current Assets 1,173,501 1,380,817 207,316 18%
Non‐Current Assets
Investment Property 5,433 4,955 (478) ‐9%
Investment Available for Sale 27,951 27,951 ‐ 0%
Property and Equipment 994,038 1,048,419 54,381 5%
Total Non‐Current Assets 1,027,422 1,081,325 53,903 5%
Total Assets 2,200,923 2,462,142 261,219 12%
Liabilities And Shareholders Equity
Current Liabilities
Due to Bank ‐ ‐ ‐ 0%
Long‐term Loans ‐ Current Positions 125,000 100,000 (25,000) ‐20%
Current Portion of Capital Lease Obligation 462 462 ‐ 0%
Account Payables 527,428 711,056 183,628 35%
Employees Incentive program ‐ Current Portion ‐ 1,178 1,178 100%
Deferred Revenues 19,128 20,808 1,680 9%
Accured Expenses and other liabilities 83,970 85,619 1,649 2%
Provision for Zakat 26,876 25,483 (1,393) ‐5%
Total Current Liabilities 782,864 944,606 161,742 21%
Non‐Current Liabilities
Long‐term Loan 125,000 25,000 (100,000) ‐80%
Capital Lease Obligation 13,167 12,705 (462) ‐4%
Deferred Revenue 30,193 23,333 (6,860) ‐23%
Provision for End‐of‐Service Indemnities 56,076 63,226 7,150 13%
Employees Incentive Program 20,961 33,246 12,285 59%
Total Non‐Current Liabilities 245,397 157,510 (87,887) ‐36%
Total Liabilities 1,028,261 1,102,116 73,855 7%
Shareholder's Equity
Capital 900,000 900,000 ‐ 0%
Statutory Reserve 65,326 139,862 74,536 114%Reserve for Employee's Future Social
Welfare/Stock Option Scheme ‐ ‐ ‐ 0%
Retained Earnings 207,336 320,164 112,828 54%
Total Shareholder's Equity 1,172,662 1,360,026 187,364 16%
Total Liabilities And Shareholder's Equity 2,200,923 2,462,142 261,219 12%
Comparative Balance Sheet 2013 ‐ 2014

Conclusion
1) Jarir Marketing Company has shown significant growth from 2013 ‐ 2014
2) In Current Assets cash & bank balances was almost doubled & Net Account Receivable has decreased and Prepaid
Expenses and Other Assets has incresed by almost 3 times which led to high Current Assets.
3) In Non Current Assets Property And Equipment's were increased which led to incresed non current Assets
4) In Current liability long term loans‐ Current Position were decreased and Account Payables were increased and
Employees Incentive program ‐ Current Portion was Introduced
5) In Non ‐ Current Liability Employee Incentive Program were increased and Deferred Revenue and long term loans
were decreased which led to reduction in Non Current Liability
6) In Total Shareholder's Equity Statutory Reserve was almost doubled & Retained Earning was also increased which
led to high Total Shareholder's Equity
‐100%
‐50%
0%
50%
100%
150%
200%
250%
300%
350%
Chart Title

Particular 2008 Percentage 2009 Percentage 2010 Percentage 2011 Percentage 2012 Percentage 2013 Percentage 2014 Percentage
Assets
Current Assets
Cash And Bank Balances 24,263 2.09% 39,660 3.17% 52,282 3.65% 59,772 3.48% 110,904 5.60% 85,842 3.90% 128,031 5.20%
Net Account Receivable 163,176 14.03% 181,183 14.49% 211,848 14.78% 243,494 14.16% 257,795 13.01% 256,928 11.67% 203,969 8.28%
Net Inventories 390,832 33.61% 421,424 33.70% 543,049 37.88% 600,855 34.94% 725,918 36.64% 771,490 35.05% 817,120 33.19%
Prepaid Expenses and Other Assets 26,571 2.28% 36,841 2.95% 35,671 2.49% 38,934 2.26% 38,002 1.92% 59,241 2.69% 231,697 9.41%
Total Current Assets 604,842 52.01% 679,108 54.31% 842,850 58.80% 943,055 54.84% 1,132,619 57.17% 1,173,501 53.32% 1,380,817 56.08%
Non‐Current Assets
Investment Property 8,193 0.70% 7,913 0.63% 7,633 0.53% 6,664 0.39% 6,343 0.32% 5,433 0.25% 4,955 0.20%
Investment Available for Sale 27,951 2.40% 27,951 2.24% 27,951 1.95% 27,951 1.63% 27,951 1.41% 27,951 1.27% 27,951 1.14%
Property and Equipment 521,931 44.88% 535,444 42.82% 555,018 38.72% 742,054 43.15% 814,136 41.10% 994,038 45.16% 1,048,419 42.58%
Total Non‐Current Assets 558,075 47.99% 571,308 45.69% 590,602 41.20% 776,669 45.16% 848,430 42.83% 1,027,422 46.68% 1,081,325 43.92%
Total Assets 1,162,917 100.00% 1,250,416 100.00% 1,433,452 100.00% 1,719,724 100.00% 1,981,049 100.00% 2,200,923 100.00% 2,462,142 100.00%
Liabilities And Shareholders Equity
Current Liabilities
Due to Bank 42,028 3.61% 37,054 2.96% 50,111 3.50% 157 0.01% 251 0.01% ‐ 0.00% ‐ 0.00%
Long‐term Loans ‐ Current Positions ‐ 0.00% ‐ 0.00% ‐ 0.00% 66,667 3.88% 16,667 0.84% 125,000 5.68% 100,000 4.06%
Current Portion of Capital Lease Obligition ‐ ‐ ‐ ‐ ‐ 462 0.02% 462 0.02%
Account Payables 190,144 16.35% 277,061 22.16% 350,904 24.48% 463,520 26.95% 568,789 28.71% 527,428 23.96% 711,056 28.88%
Employees Incentive program ‐ Current Portion ‐ 0.00% ‐ 0.00% 22,617 1.58% 29,466 1.71% ‐ 0.00% ‐ 0.00% 1,178 0.05%
Deferred Revenues 9,739 0.84% 10,881 0.87% 8,035 0.56% 9,584 0.56% 10,467 0.53% 19,128 0.87% 20,808 0.85%
Accured Expenses and other liabilities 40,778 3.51% 44,845 3.59% 54,846 3.83% 74,833 4.35% 77,443 3.91% 83,970 3.82% 85,619 3.48%
Provision for Zakat 10,135 0.87% 12,498 1.00% 14,569 1.02% 19,604 1.14% 23,419 1.18% 26,876 1.22% 25,483 1.03%
Total Current Liabilities 292,824 25.18% 382,339 30.58% 501,082 34.96% 663,831 38.60% 697,036 35.19% 782,864 35.57% 944,606 38.37%
Non‐Current Liabilities
Long‐term Loan 150,000 12.90% 100,000 8.00% 100,000 6.98% 108,333 6.30% 200,000 10.10% 125,000 5.68% 25,000 1.02%
Capital Lease Obligition ‐ ‐ ‐ ‐ ‐ 13,167 0.60% 12,705
Deferred Revenue ‐ ‐ ‐ ‐ ‐ 30,193 1.37% 23,333
Provision for End‐of‐Service Indemnities 23,878 2.05% 27,029 2.16% 34,270 2.39% 40,051 2.33% 46,995 2.37% 56,076 2.55% 63,226 2.57%
Employees Incentive Program 9,349 0.80% 18,210 1.46% 518 0.04% 934 0.05% 10,619 0.54% 20,961 0.95% 33,246 1.35%
Total Non‐Current Liabilities 183,227 15.76% 145,239 11.62% 134,788 9.40% 149,318 8.68% 257,614 13.00% 245,397 11.15% 157,510 6.40%
Total Liabilities 476,051 40.94% 527,578 42.19% 635,870 44.36% 813,149 47.28% 954,650 48.19% 1,028,261 46.72% 1,102,116 44.76%
Shareholder's Equity
Capital 300,000.00 25.80% 400,000.00 31.99% 400,000.00 27.90% 600,000.00 34.89% 600,000.00 30.29% 900,000 40.89% 900,000 36.55%
Statutory Reserve 90,644.00 7.79% 37,397.00 2.99% 77,471.00 5.40% 51,299.00 2.98% 108,281.00 5.47% 65,326 2.97% 139,862 5.68%Reserve for Employee's Future
Social Welfare/Stock Option Scheme 13,000.00 1.12% 13,000.00 1.04% ‐ 0.00% ‐ 0.00% ‐ 0.00% ‐ 0.00% ‐ 0.00%
Retained Earnings 283,222.00 24.35% 272,441.00 21.79% 320,111.00 22.33% 255,276.00 14.84% 318,118.00 16.06% 207,336 9.42% 320,164 13.00%
Total Shareholder's Equity 686,866.00 59.06% 722,838.00 57.81% 797,582.00 55.64% 906,575.00 52.72% 1,026,399.00 51.81% 1,172,662 53.28% 1,360,026 55.24%
Total Liabilities And Shareholder's Equity 1,162,917.00 100.00% 1,250,416.00 100.00% 1,433,452.00 100.00% 1,719,724.00 100.00% 1,981,049.00 100.00% 2,200,923 100.00% 2,462,142 100.00%
Conclusion
Almost common Size is constant
Common Size Balance Sheet for Five Years

2008 2009 2010 2011 2012
Cash And Bank Balances 2.09% 3.17% 3.65% 3.48% 5.60%
Net Account Receivable 14.03% 14.49% 14.78% 14.16% 13.01%
Net Inventories 33.61% 33.70% 37.88% 34.94% 36.64%
Prepaid Expenses and Other Assets 2.28% 2.95% 2.49% 2.26% 1.92%
Total Current Assets 52.01% 54.31% 58.80% 54.84% 57.17%
Investment Property 0.70% 0.63% 0.53% 0.39% 0.32%
Investment Available for Sale 2.40% 2.24% 1.95% 1.63% 1.41%
Property and Equipment 44.88% 42.82% 38.72% 43.15% 41.10%
Total Non‐Current Assets 47.99% 45.69% 41.20% 45.16% 42.83%
Total Assets 100.00% 100.00% 100.00% 100.00% 100.00%
Due to Bank 3.61% 2.96% 3.50% 0.01% 0.01%
Long‐term Loans ‐ Current Positions 0.00% 0.00% 0.00% 3.88% 0.84%
Current Portion of Capital Lease Obligition 0.00% 0.00% 0.00% 0.00% 0.00%
Account Payables 16.35% 22.16% 24.48% 26.95% 28.71%
Employees Incentive program ‐ Current Portion 0.00% 0.00% 1.58% 1.71% 0.00%
Deferred Revenues 0.84% 0.87% 0.56% 0.56% 0.53%
Accured Expenses and other liabilities 3.51% 3.59% 3.83% 4.35% 3.91%
Provision for Zakat 0.87% 1.00% 1.02% 1.14% 1.18%
Total Current Liabilities 25.18% 30.58% 34.96% 38.60% 35.19%
Long‐term Loan 12.90% 8.00% 6.98% 6.30% 10.10%
Capital Lease Obligition 0.00% 0.00% 0.00% 0.00% 0.00%
Deferred Revenue 0.00% 0.00% 0.00% 0.00% 0.00%
Provision for End‐of‐Service Indemnities 2.05% 2.16% 2.39% 2.33% 2.37%
Employees Incentive Program 0.80% 1.46% 0.04% 0.05% 0.54%
Total Non‐Current Liabilities 15.76% 11.62% 9.40% 8.68% 13.00%
Total Liabilities 40.94% 42.19% 44.36% 47.28% 48.19%
Capital 25.80% 31.99% 27.90% 34.89% 30.29%
Statutory Reserve 7.79% 2.99% 5.40% 2.98% 5.47%
2.09%
14.03%
33.61%
2.28%
52.01%
0.70%
2.40%
44.88%
47.99%
100.00%
3.61%
0.00%
0.00%
16.35%
3.17%
14.49%
33.70%
2.95%
54.31%
2.24%
42.82%
45.69%
100.00%
0.00%
0.00%
22.16%
3.65%
2.49%
0.00%
0.00%
24.48%
3.88%
0.00%
0.84%
0.00% 0.02%
CASH AND BANK BALANCES
NET ACCOUNT RECEIVABLE
NET INVENTORIES
PREPAID EXPENSES AND OTHER ASSETS
TOTAL CURRENT ASSETS
INVESTMENT PROPERTY
INVESTMENT AVAILABLE FOR SALE
PROPERTY AND EQUIPMENT
TOTAL NON ‐CURRENT ASSETS
TOTAL ASSETS
DUE TO BANK
LONG ‐TERM LOANS ‐ CURRENT POSITIONS
CURRENT PORTION OF CAPITAL LEASE OBLIGITION
ACCOUNT PAYABLES
BALANCE SHEET COM2008 2009 2010

Reserve for Employee's Future
Social Welfare/Stock Option Scheme 1.12% 1.04% 0.00% 0.00% 0.00%
Retained Earnings 24.35% 21.79% 22.33% 14.84% 16.06%
Total Shareholder's Equity 59.06% 57.81% 55.64% 52.72% 51.81%
Total Liabilities And Shareholder's Equity 100.00% 100.00% 100.00% 100.00% 100.00%
0.00%
0.84%
3.51%
0.87%
25.18%
12.90%
0.00%
0.00%
2.05%
0.80%
15.76%
40.94%
25.80%
7.79%
1.12%
24.35%
59.06%
100.00%
0.00%
0.87%
3.59%
1.00%
30.58%
0.00%
0.00%
2.16%
1.46%
11.62%
42.19%
31.99%
2.99%
21.79%
57.81%
100.00%
1.58%
34.
0.00%
0.00%
2
0.00%
0.00%
0.00%
0.00%
EMPLOYEES INCENTIVE PROGRAM ‐ CURRENT PORTION
DEFERRED REVENUES
ACCURED EXPENSES AND OTHER L IABIL ITIES
PROVISION FOR ZAKAT
TOTAL CURRENT L IABIL ITIES
LONG ‐TERM LOAN
CAPITAL LEASE OBLIGITION
DEFERRED REVENUE
PROVISION FOR END ‐OF ‐SERVICE INDEMNITIES
EMPLOYEES INCENTIVE PROGRAM
TOTAL NON ‐CURRENT L IABIL ITIES
TOTAL L IABIL ITIES
CAPITAL
STATUTORY RESERVE
RESERVE FOR EMPLOYEE'S FUTURE …
RETAINED EARNINGS
TOTAL SHAREHOLDER'S EQUITY
TOTAL L IABIL ITIES AND SHAREHOLDER'S EQUITY


2013 2014
3.90% 5.20%
11.67% 8.28%
35.05% 33.19%
2.69% 9.41%
53.32% 56.08%
0.25% 0.20%
1.27% 1.14%
45.16% 42.58%
46.68% 43.92%
100.00% 100.00%
0.00% 0.00%
5.68% 4.06%
0.02% 0.02%
23.96% 28.88%
0.00% 0.05%
0.87% 0.85%
3.82% 3.48%
1.22% 1.03%
35.57% 38.37%
5.68% 1.02%
0.60% 0.00%
1.37% 0.00%
2.55% 2.57%
0.95% 1.35%
11.15% 6.40%
46.72% 44.76%
40.89% 36.55%
2.97% 5.68%
0.63%
%
2.96%
14.78%
37.88%
58.80%
0.53%
1.95%
38.72%
41.20%
100.00%
3.50%
%
3.48%
14.16%
34.94%
2.26%
54.84%
0.39%
1.63%
43.15%
45.16%
100.00%
0.01%
26.95%
5.60%
13.01%
36.64%
1.92%
57.17%
0.32%
1.41%
41.10%
42.83%
100.00%
0.01%
%
28.71%
3.90%
11.67%
35.05%
2.69%
53.32%
0.25%
1.27%
45.16%
46.68%
100.00%
0.00%
5.68%
23.96%
5.20%
8.28%
33.19%
9.41%
56.08%
0.20%
1.14%
42.58%
43.92%
100.00%
0.00%
4.06%
0.02%
28.88%
MMON SIZE PROPORTION0 2011 2012 2013 2014

0.00% 0.00%
9.42% 13.00%
53.28% 55.24%
100.00% 100.00%
8.00%
%
1.04%
%
0.56%
3.83%
1.02%
.96%
6.98%
2.39%
0.04%
9.40%
44.36%
27.90%
5.40%
0.00%
22.33%
55.64%
100.00%
1.71%
0.56%
4.35%
1.14%
38.60%
6.30%
2.33%
0.05%
8.68%
47.28%
34.89%
2.98%
0.00%
14.84%
52.72%
100.00%
0.00%
0.53%
3.91%
1.18%
35.19%
10.10%
2.37%
0.54%
13.00%
48.19%
30.29%
5.47%
0.00%
16.06%
51.81%
100.00%
0.00%
0.87%
3.82%
1.22%
35.57%
5.68%
0.60%
1.37%
2.55%
0.95%
11.15%
46.72%
40.89%
2.97%
0.00%
9.42%
53.28%
100.00%
0.05%
0.85%
3.48%
1.03%
38.37%
1.02%
0.00%
0.00%
2.57%
1.35%
6.40%
44.76%
36.55%
5.68%
0.00%
13.00%
55.24%
100.00%


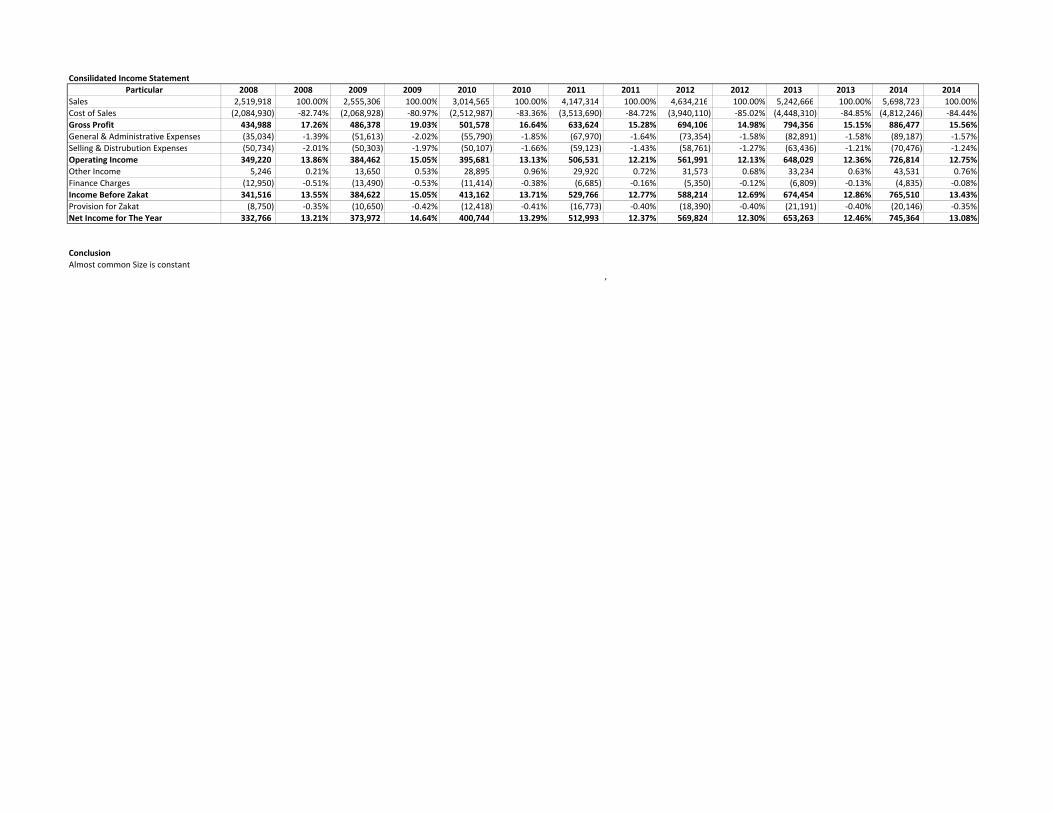
Consilidated Income Statement
Particular 2008 2008 2009 2009 2010 2010 2011 2011 2012 2012 2013 2013 2014 2014
Sales 2,519,918 100.00% 2,555,306 100.00% 3,014,565 100.00% 4,147,314 100.00% 4,634,216 100.00% 5,242,666 100.00% 5,698,723 100.00%
Cost of Sales (2,084,930) ‐82.74% (2,068,928) ‐80.97% (2,512,987) ‐83.36% (3,513,690) ‐84.72% (3,940,110) ‐85.02% (4,448,310) ‐84.85% (4,812,246) ‐84.44%
Gross Profit 434,988 17.26% 486,378 19.03% 501,578 16.64% 633,624 15.28% 694,106 14.98% 794,356 15.15% 886,477 15.56%
General & Administrative Expenses (35,034) ‐1.39% (51,613) ‐2.02% (55,790) ‐1.85% (67,970) ‐1.64% (73,354) ‐1.58% (82,891) ‐1.58% (89,187) ‐1.57%
Selling & Distrubution Expenses (50,734) ‐2.01% (50,303) ‐1.97% (50,107) ‐1.66% (59,123) ‐1.43% (58,761) ‐1.27% (63,436) ‐1.21% (70,476) ‐1.24%
Operating Income 349,220 13.86% 384,462 15.05% 395,681 13.13% 506,531 12.21% 561,991 12.13% 648,029 12.36% 726,814 12.75%
Other Income 5,246 0.21% 13,650 0.53% 28,895 0.96% 29,920 0.72% 31,573 0.68% 33,234 0.63% 43,531 0.76%
Finance Charges (12,950) ‐0.51% (13,490) ‐0.53% (11,414) ‐0.38% (6,685) ‐0.16% (5,350) ‐0.12% (6,809) ‐0.13% (4,835) ‐0.08%
Income Before Zakat 341,516 13.55% 384,622 15.05% 413,162 13.71% 529,766 12.77% 588,214 12.69% 674,454 12.86% 765,510 13.43%
Provision for Zakat (8,750) ‐0.35% (10,650) ‐0.42% (12,418) ‐0.41% (16,773) ‐0.40% (18,390) ‐0.40% (21,191) ‐0.40% (20,146) ‐0.35%
Net Income for The Year 332,766 13.21% 373,972 14.64% 400,744 13.29% 512,993 12.37% 569,824 12.30% 653,263 12.46% 745,364 13.08%
Conclusion
Almost common Size is constant
,

Consilidated Income Statement
2008 2009 2010 2011 2012 2013 2014
Sales 100.00% 100.00% 100.00% 100.00% 100.00% 100.00% 100.00%
Cost of Sales ‐82.74% ‐80.97% ‐83.36% ‐84.72% ‐85.02% ‐84.85% ‐84.44%
Gross Profit 17.26% 19.03% 16.64% 15.28% 14.98% 15.15% 15.56%
General & Administrative Expenses ‐1.39% ‐2.02% ‐1.85% ‐1.64% ‐1.58% ‐1.58% ‐1.57%
Selling & Distrubution Expenses ‐2.01% ‐1.97% ‐1.66% ‐1.43% ‐1.27% ‐1.21% ‐1.24%
Operating Income 13.86% 15.05% 13.13% 12.21% 12.13% 12.36% 12.75%
Other Income 0.21% 0.53% 0.96% 0.72% 0.68% 0.63% 0.76%
Finance Charges ‐0.51% ‐0.53% ‐0.38% ‐0.16% ‐0.12% ‐0.13% ‐0.08%
Income Before Zakat 13.55% 15.05% 13.71% 12.77% 12.69% 12.86% 13.43%
Provision for Zakat ‐0.35% ‐0.42% ‐0.41% ‐0.40% ‐0.40% ‐0.40% ‐0.35%
Net Income for The Year 13.21% 14.64% 13.29% 12.37% 12.30% 12.46% 13.08%
,
‐100%‐80%
‐60%‐40%
‐20%0%
20%40%
60%
80%
100%
Sales
Cost of Sales
Gross Profit
General & Administrative Expenses
Selling & Distrubution Expenses
Operating Income
Other Income
Finance Charges
Income Before Zakat
Provision for Zakat
Net Income for The Year
100.00%
‐82.74%
17.26%
‐1.39%
‐2.01%
13.86%
0.21%
‐0.51%
13.55%
‐0.35%
13.21%
100.00%
‐80.97%19.03%
‐2.02%
‐1.97%
15.05%
0.53%
‐0.53%
15.05%
‐0.42%
14.64%
100.00%
‐83.36% 16.64%
‐1.85%
‐1.66% 13.13%
0.96%
‐0.38% 13.71%
‐0.41%
13.29%
100.00%
‐84.72%
15.28%
‐1.64%
‐1.43%
12.21%
0.72%
‐0.16%12.77%
‐0.40%12.37%
100.00%
‐85.02%
14.98%
‐1.58%
‐1.27%
12.13%
0.68%
‐0.12%
12.69%
‐0.40% 12.30%
Income Statment Common Size Proportion
2008 2009 2010 2011 2012 2013 2014

Particular 2008 2009 2010 2011
Currents Assets 604,842 679,108 842,850 943,055
Current Liability 292,824 382,339 501,082 663,831
Current Ratio 2.07 1.78 1.68 1.42
Conclusion
Usually ideal current ratio should in‐between 1.5 to 3. So JMC is maintain a good Current Ratio
it was declining till 2011 then it escalated in 2012.
‐
0.50
1.00
1.50
2.00
2.50
2008 2009 2010 2011 20
Current Ratio

2012
1,132,619
697,036
1.62
. Since 2008
012

Particular 2008 2009 2010 2011 2012
Currents Assets 604,842 679,108 842,850 943,055 1,132,619
Net Inventories (390,832) (421,424) (543,049) (600,855) (725,918)
Prepaid Expenses & Other Assets (26,571) (36,841) (35,671) (38,934) (38,002)
Quick Assets 187,439 220,843 264,130 303,266 368,699
Current Liability 292,824 382,339 501,082 663,831 697,036
Due to Bank (42,028) (37,054) (50,111) (157) (251)
Liquid Liability 250,796 345,285 450,971 663,674 696,785
Quick Ratio 0.75 0.64 0.59 0.46 0.53
Conclusion
Ideal Quick Ratio or Acid Test Ratio should be above 1:1 but here it is always below which is not a good
sign. Since 2008 it was declining till 2011 then it escalated in 2012.
‐
0.10
0.20
0.30
0.40
0.50
0.60
0.70
0.80
2008 2009 2010 2011 2012
Quick Ratio
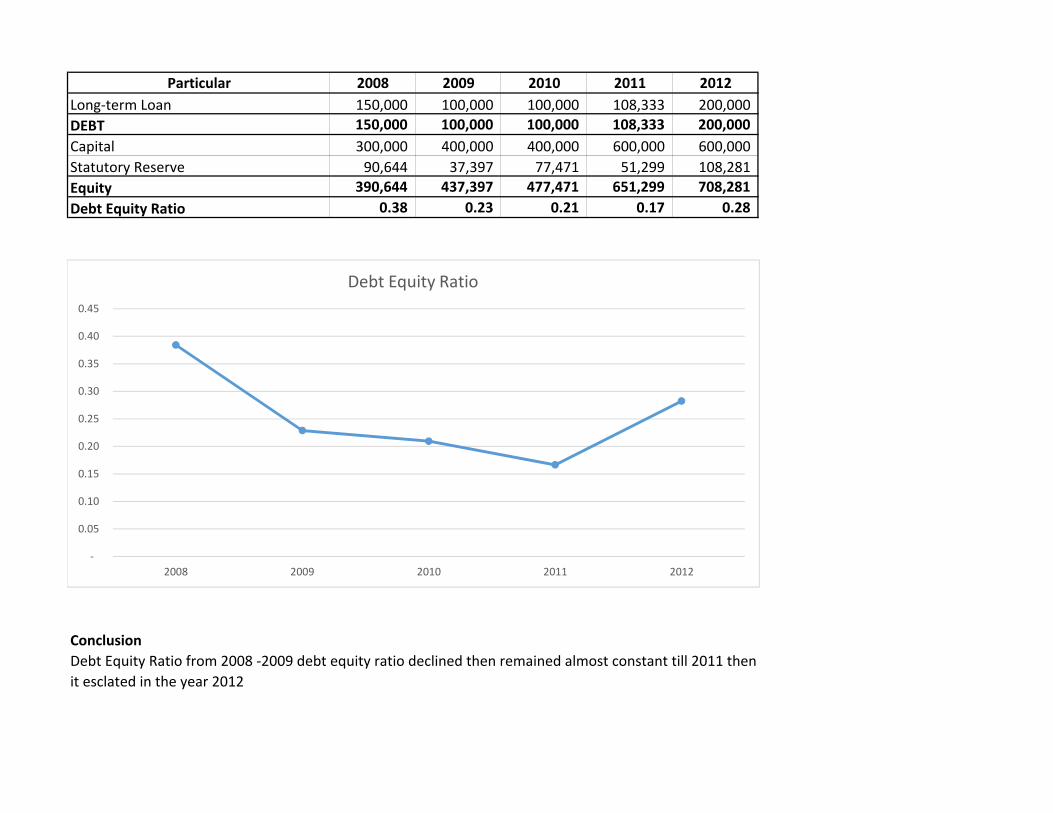
Particular 2008 2009 2010 2011 2012
Long‐term Loan 150,000 100,000 100,000 108,333 200,000
DEBT 150,000 100,000 100,000 108,333 200,000
Capital 300,000 400,000 400,000 600,000 600,000
Statutory Reserve 90,644 37,397 77,471 51,299 108,281
Equity 390,644 437,397 477,471 651,299 708,281
Debt Equity Ratio 0.38 0.23 0.21 0.17 0.28
Conclusion
Debt Equity Ratio from 2008 ‐2009 debt equity ratio declined then remained almost constant till 2011 then
it esclated in the year 2012
‐
0.05
0.10
0.15
0.20
0.25
0.30
0.35
0.40
0.45
2008 2009 2010 2011 2012
Debt Equity Ratio

Particular 2008 2009 2010 2011 2012
Total Shareholder's Equity 686,866 722,838 797,582 906,575 1,026,399
Total Current Assets 604,842 679,108 842,850 943,055 1,132,619
Total Non‐Current Assets 558,075 571,308 590,602 776,669 848,430
Total Assets 1,162,917 1,250,416 1,433,452 1,719,724 1,981,049
Shareholder Equity Ratio 59% 58% 56% 53% 52%
Conclusion
Shareholder Equity Ratio is almost constantly declining at a constant rate throughout 5 years
48%
50%
52%
54%
56%
58%
60%
2008 2009 2010 2011 2012
Shareholder Equity Ratio
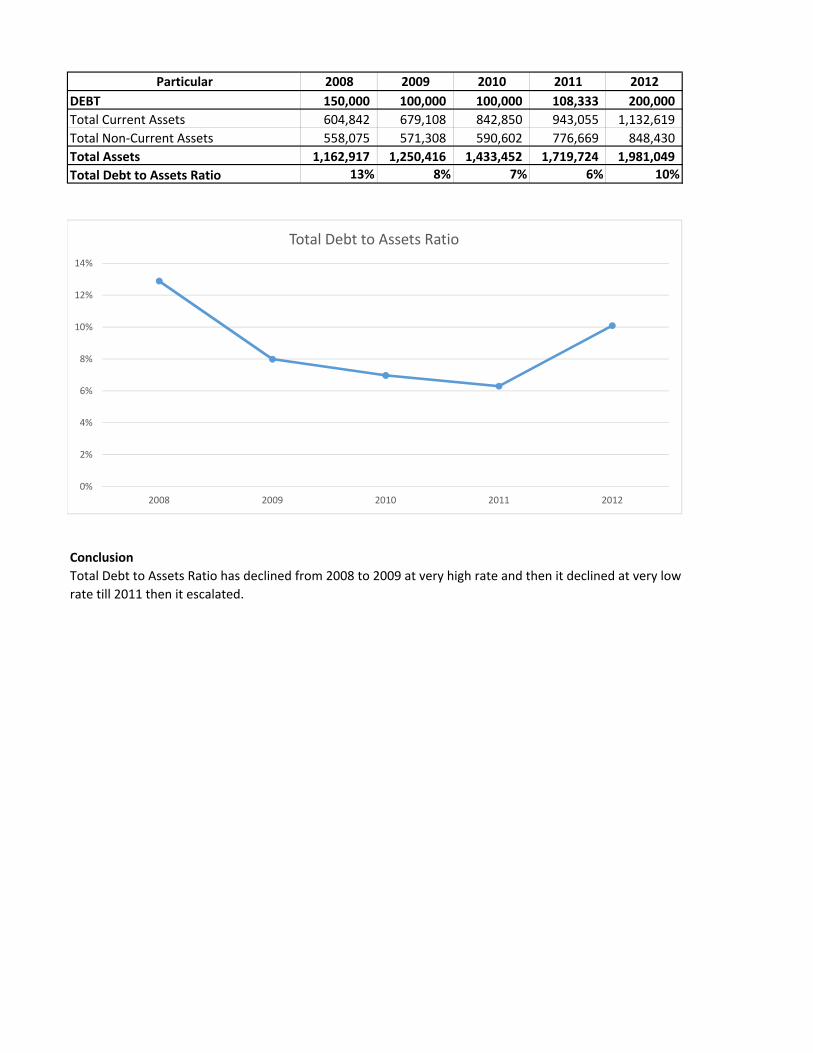
Particular 2008 2009 2010 2011 2012
DEBT 150,000 100,000 100,000 108,333 200,000
Total Current Assets 604,842 679,108 842,850 943,055 1,132,619
Total Non‐Current Assets 558,075 571,308 590,602 776,669 848,430
Total Assets 1,162,917 1,250,416 1,433,452 1,719,724 1,981,049
Total Debt to Assets Ratio 13% 8% 7% 6% 10%
Conclusion
Total Debt to Assets Ratio has declined from 2008 to 2009 at very high rate and then it declined at very low
rate till 2011 then it escalated.
0%
2%
4%
6%
8%
10%
12%
14%
2008 2009 2010 2011 2012
Total Debt to Assets Ratio

Particular 2008 2009 2010 2011 2012
Cost of Sales 2,084,930 2,068,928 2,512,987 3,513,690 3,940,110
Net Inventories 383,963 406,128 482,237 571,952 663,387
Stock Turnover ratio 5.43 5.09 5.21 6.14 5.94
Particular 2008 2009 2010 2011 2012
Opening Stock 377,093 390,832 421,424 543,049 600,855
Closing Stock 390,832 421,424 543,049 600,855 725,918
Net Stocks 767,925 812,256 964,473 1,143,904 1,326,773
Average Stock 383,963 406,128 482,237 571,952 663,387
Conclusion
Stock Turnover ratio is almost constant throughout 5 years.
‐
1.00
2.00
3.00
4.00
5.00
6.00
7.00
2008 2009 2010 2011 2012
Stock Turnover ratio

Particular 2008 2009 2010 2011 2012
Cost of Sales 2,084,930 2,068,928 2,512,987 3,513,690 3,940,110
Net Inventories 383,963 406,128 482,237 571,952 663,387
Stock Turnover ratio 5.43 5.09 5.21 6.14 5.94
Stock Velocity 67 72 70 59 61
Particular 2008 2009 2010 2011 2012
Opening Stock 377093 390832 421424 543049 600855
Closing Stock 390832 421424 543049 600855 725918
Net Stocks 767925 812256 964473 1143904 1326773Average Stock 383962.5 406128 482236.5 571952 663386.5
Conclusion
Stock Velocity is almost constant throughout 5 years.
‐
10
20
30
40
50
60
70
80
2008 2009 2010 2011 2012
Stock Velocity

Particular 2008 2009 2010 2011 2012
Net Sales 2,519,918 2,555,306 3,014,565 4,147,314 4,634,216
Currents Assets 604,842 679,108 842,850 943,055 1,132,619
Current Liability 292,824 382,339 501,082 663,831 697,036
Working Capital 312,018 296,769 341,768 279,224 435,583
Working Capital Turnover Ratio 8.08 8.61 8.82 14.85 10.64
Conclusion
Working Capital Turnover Ratio is almost constant from 2008 to 2010 then it escalated in 2011 and in 2012
it declined
‐
2.00
4.00
6.00
8.00
10.00
12.00
14.00
16.00
2008 2009 2010 2011 2012
Working Capital Turnover Ratio
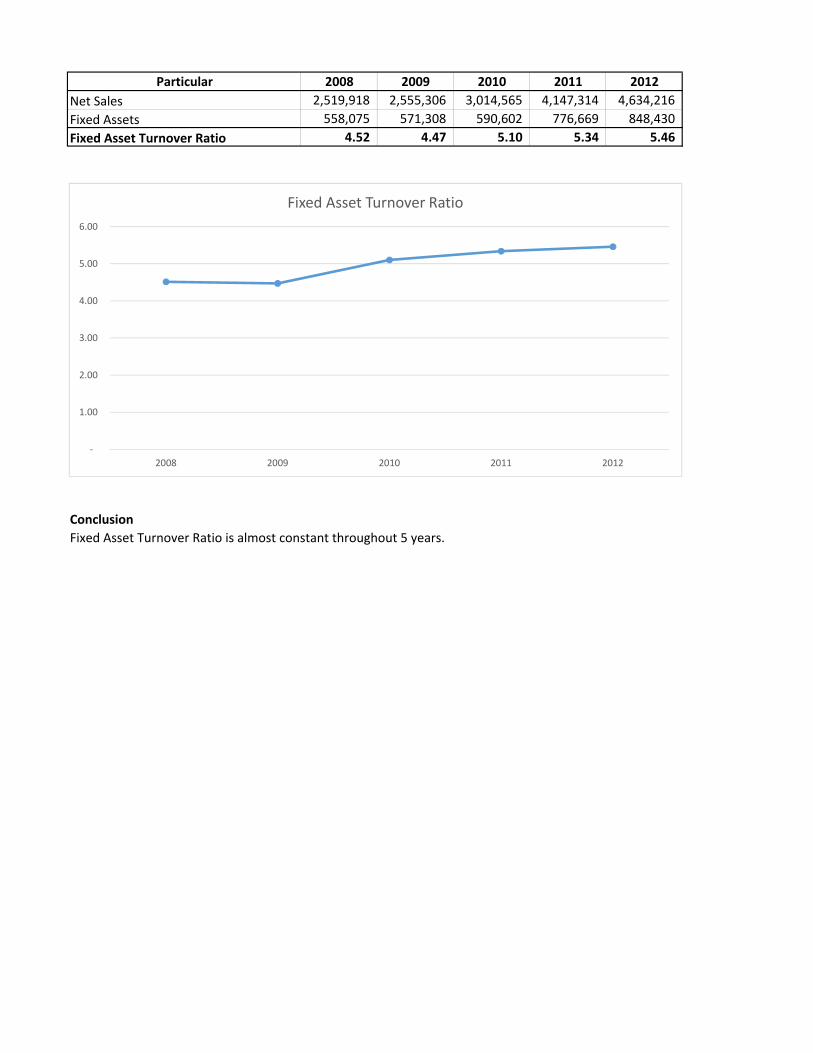
Particular 2008 2009 2010 2011 2012
Net Sales 2,519,918 2,555,306 3,014,565 4,147,314 4,634,216
Fixed Assets 558,075 571,308 590,602 776,669 848,430
Fixed Asset Turnover Ratio 4.52 4.47 5.10 5.34 5.46
Conclusion
Fixed Asset Turnover Ratio is almost constant throughout 5 years.
‐
1.00
2.00
3.00
4.00
5.00
6.00
2008 2009 2010 2011 2012
Fixed Asset Turnover Ratio

Particular 2008 2009 2010 2011 2012
Net Sales 2,519,918 2,555,306 3,014,565 4,147,314 4,634,216
Currents Assets 604,842 679,108 842,850 943,055 1,132,619
Current Liability 292,824 382,339 501,082 663,831 697,036
Working Capital 312,018 296,769 341,768 279,224 435,583
Fixed Assets 558,075 571,308 590,602 776,669 848,430
Capital Employed 870,093 868,077 932,370 1,055,893 1,284,013
Investment Turnover Ratio 2.90 2.94 3.23 3.93 3.61
Conclusion
Investment Turnover Ratio is almost constant from 2008 to 2010 then it escalated and again in 2012 it
declined.
‐
0.50
1.00
1.50
2.00
2.50
3.00
3.50
4.00
4.50
2008 2009 2010 2011 2012
Investment Turnover Ratio
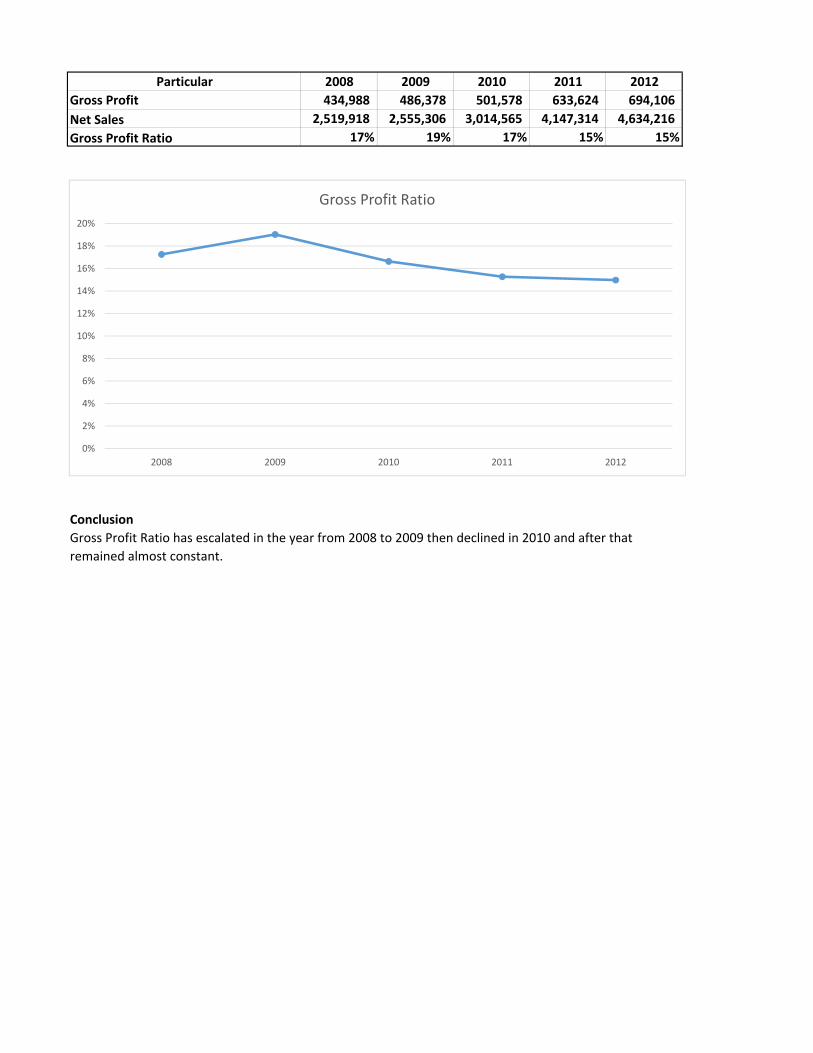
Particular 2008 2009 2010 2011 2012
Gross Profit 434,988 486,378 501,578 633,624 694,106
Net Sales 2,519,918 2,555,306 3,014,565 4,147,314 4,634,216
Gross Profit Ratio 17% 19% 17% 15% 15%
Conclusion
Gross Profit Ratio has escalated in the year from 2008 to 2009 then declined in 2010 and after that
remained almost constant.
0%
2%
4%
6%
8%
10%
12%
14%
16%
18%
20%
2008 2009 2010 2011 2012
Gross Profit Ratio
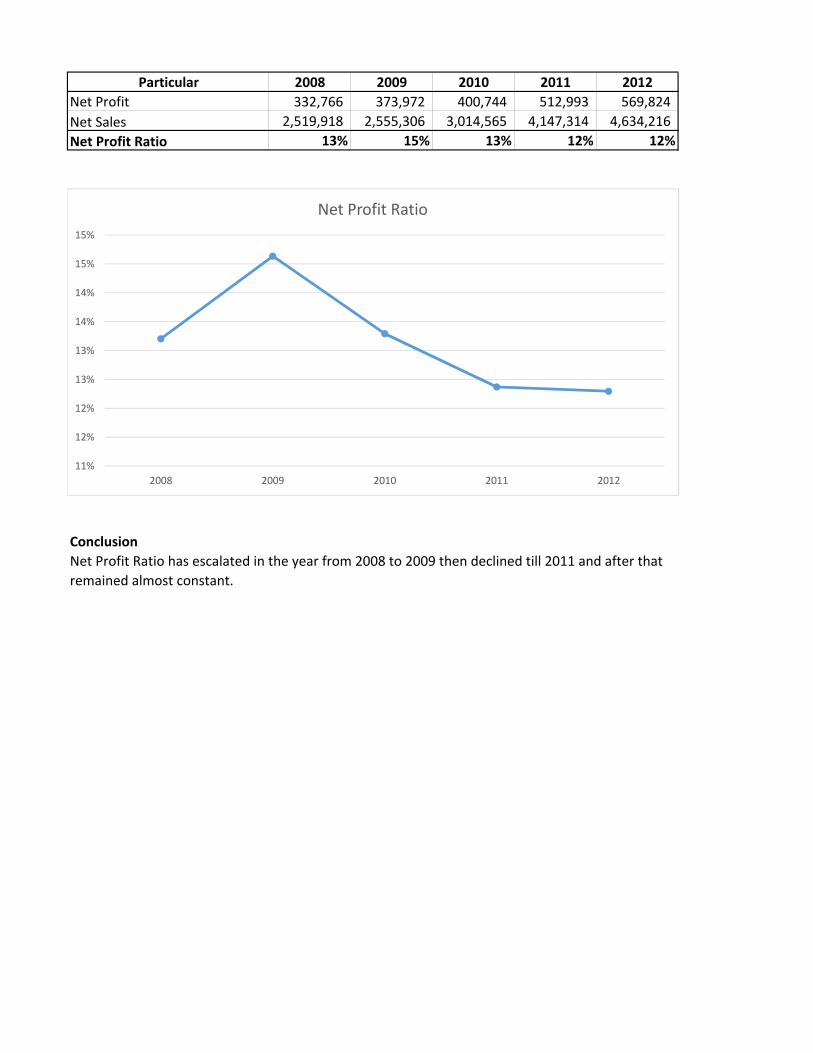
Particular 2008 2009 2010 2011 2012
Net Profit 332,766 373,972 400,744 512,993 569,824
Net Sales 2,519,918 2,555,306 3,014,565 4,147,314 4,634,216
Net Profit Ratio 13% 15% 13% 12% 12%
Conclusion
Net Profit Ratio has escalated in the year from 2008 to 2009 then declined till 2011 and after that
remained almost constant.
11%
12%
12%
13%
13%
14%
14%
15%
15%
2008 2009 2010 2011 2012
Net Profit Ratio
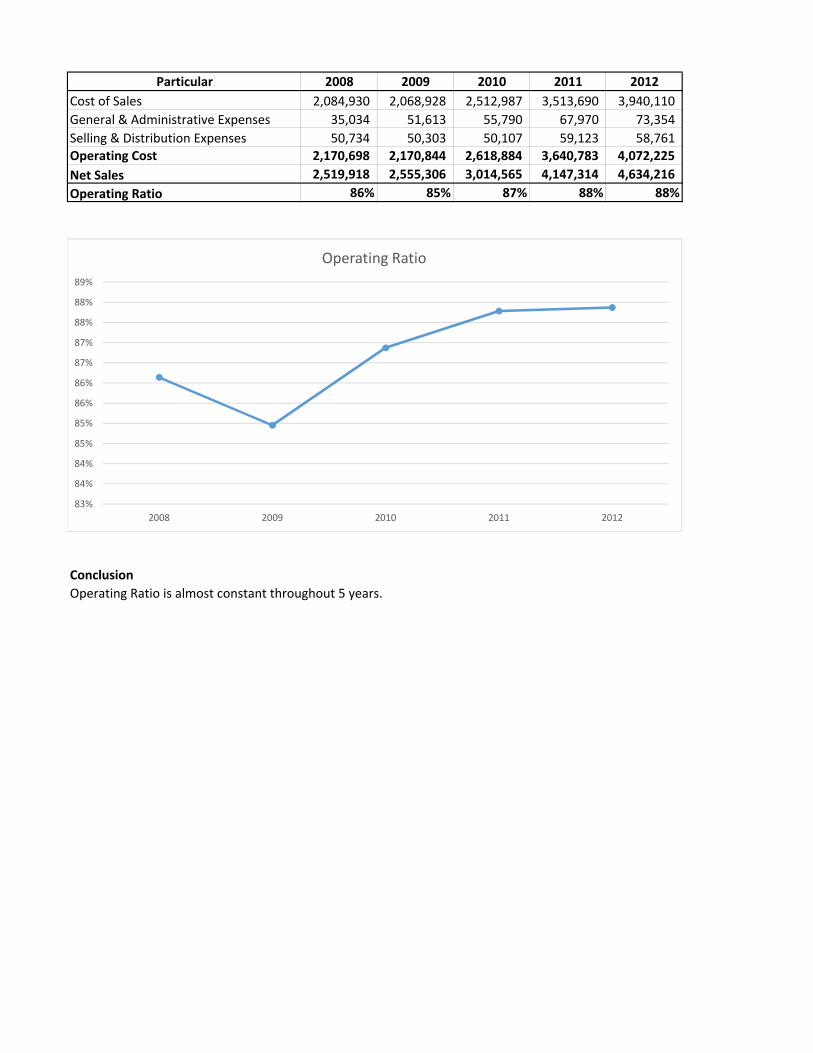
Particular 2008 2009 2010 2011 2012
Cost of Sales 2,084,930 2,068,928 2,512,987 3,513,690 3,940,110
General & Administrative Expenses 35,034 51,613 55,790 67,970 73,354
Selling & Distribution Expenses 50,734 50,303 50,107 59,123 58,761
Operating Cost 2,170,698 2,170,844 2,618,884 3,640,783 4,072,225
Net Sales 2,519,918 2,555,306 3,014,565 4,147,314 4,634,216
Operating Ratio 86% 85% 87% 88% 88%
Conclusion
Operating Ratio is almost constant throughout 5 years.
83%
84%
84%
85%
85%
86%
86%
87%
87%
88%
88%
89%
2008 2009 2010 2011 2012
Operating Ratio
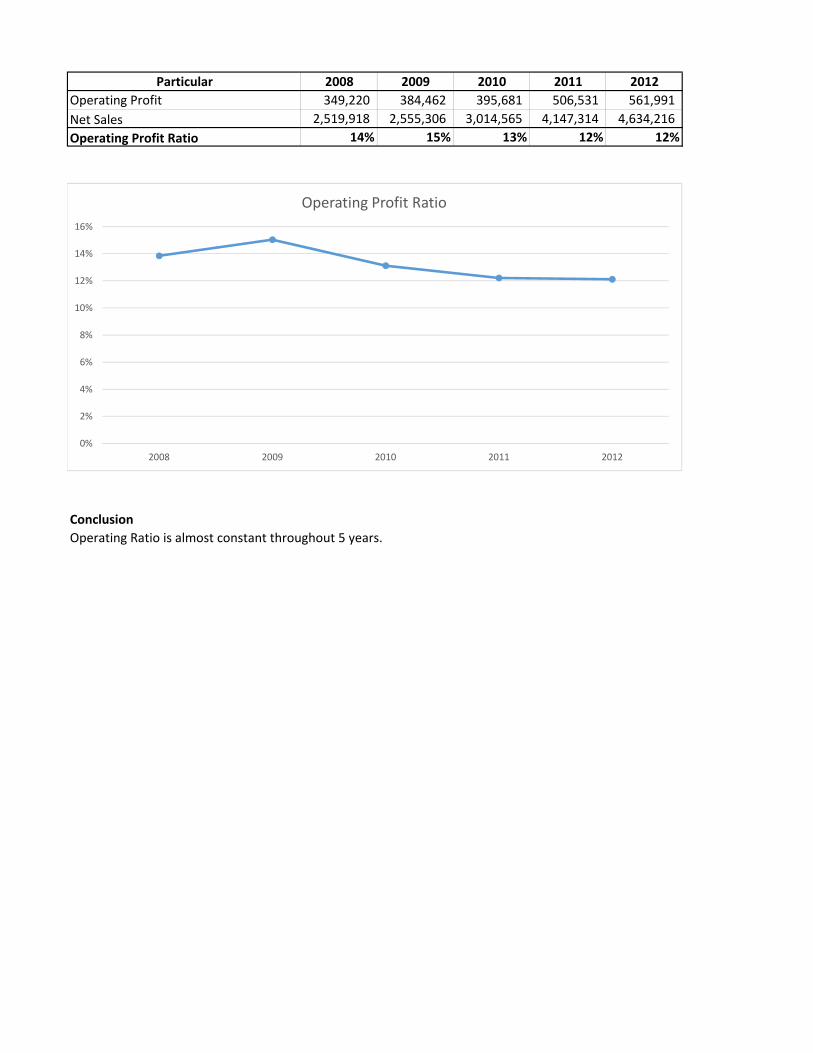
Particular 2008 2009 2010 2011 2012
Operating Profit 349,220 384,462 395,681 506,531 561,991
Net Sales 2,519,918 2,555,306 3,014,565 4,147,314 4,634,216
Operating Profit Ratio 14% 15% 13% 12% 12%
Conclusion
Operating Ratio is almost constant throughout 5 years.
0%
2%
4%
6%
8%
10%
12%
14%
16%
2008 2009 2010 2011 2012
Operating Profit Ratio
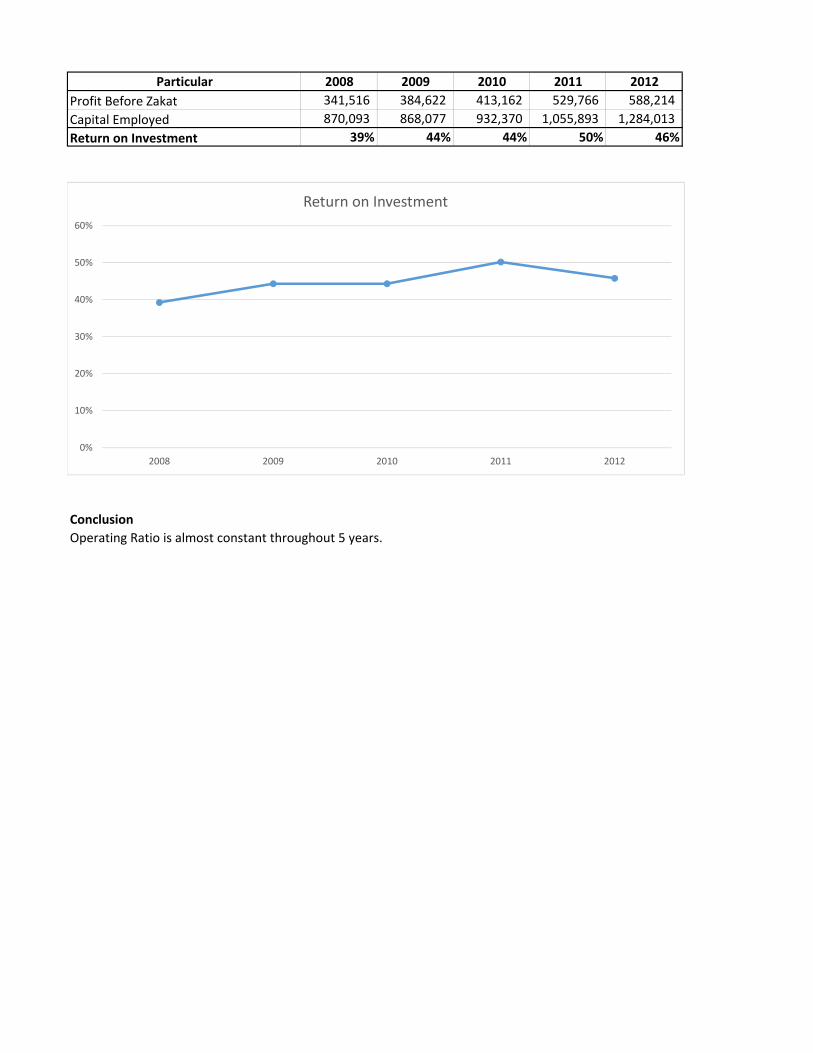
Particular 2008 2009 2010 2011 2012
Profit Before Zakat 341,516 384,622 413,162 529,766 588,214
Capital Employed 870,093 868,077 932,370 1,055,893 1,284,013
Return on Investment 39% 44% 44% 50% 46%
Conclusion
Operating Ratio is almost constant throughout 5 years.
0%
10%
20%
30%
40%
50%
60%
2008 2009 2010 2011 2012
Return on Investment
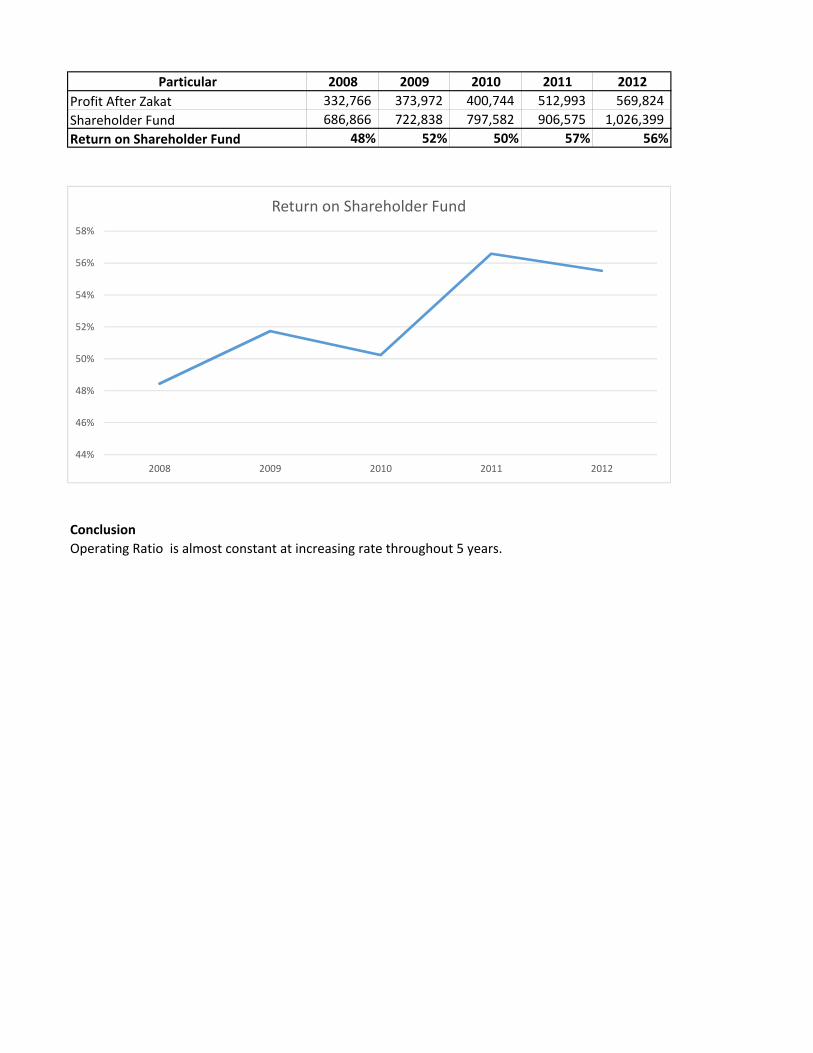
Particular 2008 2009 2010 2011 2012
Profit After Zakat 332,766 373,972 400,744 512,993 569,824
Shareholder Fund 686,866 722,838 797,582 906,575 1,026,399
Return on Shareholder Fund 48% 52% 50% 57% 56%
Conclusion
Operating Ratio is almost constant at increasing rate throughout 5 years.
44%
46%
48%
50%
52%
54%
56%
58%
2008 2009 2010 2011 2012
Return on Shareholder Fund
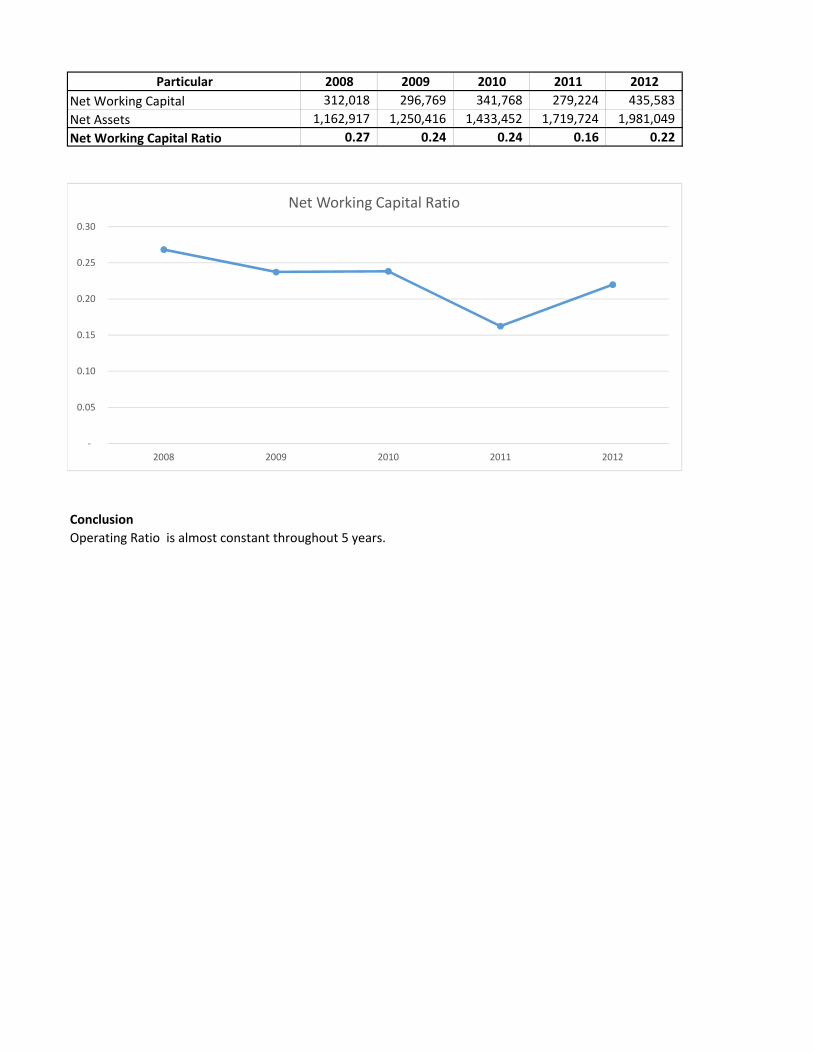
Particular 2008 2009 2010 2011 2012
Net Working Capital 312,018 296,769 341,768 279,224 435,583
Net Assets 1,162,917 1,250,416 1,433,452 1,719,724 1,981,049
Net Working Capital Ratio 0.27 0.24 0.24 0.16 0.22
Conclusion
Operating Ratio is almost constant throughout 5 years.
‐
0.05
0.10
0.15
0.20
0.25
0.30
2008 2009 2010 2011 2012
Net Working Capital Ratio