Embed Size (px)
Citation preview

JETE
M Journal of Economic Theory and Econometrics
The Journal of the Korean Econometric Society
( 계 량 경 제 학 보 )
September 2011
Volume 22. Issue 3. pp.1-29
Stock Market Reaction to Oil Price Shocks: A Comparison between an Oil-exporting Economy and an Oil-importing Economy *
Hansol Jung † Cheolbeom Park‡
Abstract In this study, we assess the responses of aggregate stock returns and their volatility in the face of oil
price shocks in the Norwegian and Korean markets. Both Norway and Korea are small open economies; the former
exports oil, and the latter imports it. We determine herein that the responses of aggregate stock returns and volatility
differ substantially, depending on the underlying cause of the oil price rise and depending on whether an economy
exports or imports oil. Additionally, a larger portion of stock return variations in small open economies can be
explained by the world crude oil market as opposed to the US market; this implies that the small open economies
have more oil-dependent technology and limited access to the global financial market. Finally, the results of our
analysis of the conditional covariance measure indicate that the responses of stock returns and volatility are not based
on a risk-return tradeoff relationship.
Keywords Stock returns, Volatility, Oil prices, Oil demand shocks, Oil supply shocks
JEL Classification G12, Q43
* We wish to thank the referees for their valuable comments. Park acknowledges that this work was
supported by the National Research Foundation of Korea Grant funded by the Korean Government (NRF-
2010-332-B00046).
† Associate, FICC Trading Team, Tong Yang Securities Inc., E-mail: [email protected]
‡ Professor, Department of Economics, Korea University, E-mail: [email protected].
Received March 23, 2011, Revised September 8, 2011, Accepted September 14, 2011
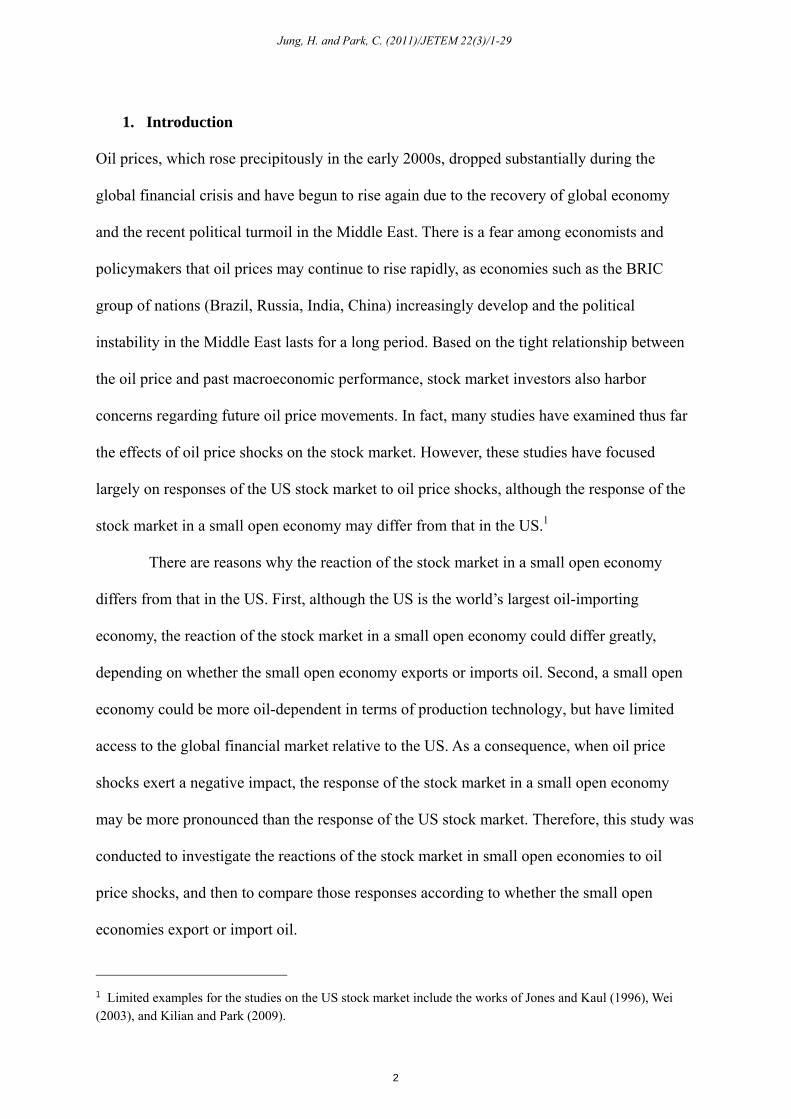
1. Introduction
Oil prices, which rose precipitously in the early 2000s, dropped substantially during the
global financial crisis and have begun to rise again due to the recovery of global economy
and the recent political turmoil in the Middle East. There is a fear among economists and
policymakers that oil prices may continue to rise rapidly, as economies such as the BRIC
group of nations (Brazil, Russia, India, China) increasingly develop and the political
instability in the Middle East lasts for a long period. Based on the tight relationship between
the oil price and past macroeconomic performance, stock market investors also harbor
concerns regarding future oil price movements. In fact, many studies have examined thus far
the effects of oil price shocks on the stock market. However, these studies have focused
largely on responses of the US stock market to oil price shocks, although the response of the
stock market in a small open economy may differ from that in the US.1
There are reasons why the reaction of the stock market in a small open economy
differs from that in the US. First, although the US is the world’s largest oil-importing
economy, the reaction of the stock market in a small open economy could differ greatly,
depending on whether the small open economy exports or imports oil. Second, a small open
economy could be more oil-dependent in terms of production technology, but have limited
access to the global financial market relative to the US. As a consequence, when oil price
shocks exert a negative impact, the response of the stock market in a small open economy
may be more pronounced than the response of the US stock market. Therefore, this study was
conducted to investigate the reactions of the stock market in small open economies to oil
price shocks, and then to compare those responses according to whether the small open
economies export or import oil.
1 Limited examples for the studies on the US stock market include the works of Jones and Kaul (1996), Wei (2003), and Kilian and Park (2009).
2
Jung, H. and Park, C. (2011)/JETEM 22(3)/1-29

To achieve this goal, we have selected and compared the stock markets in Norway
and Korea deliberately. Although Canada and the UK also export oil, studies such as those of
Bjørnland (2009) and Jimenez-Rodriguez and Sanchez (2005) reported that Canada and the
UK behaved in a manner more consistent with that of the oil-importing economies. The
Middle Eastern countries and Russia have been exporting oil, but very limited data is
available regarding their stock markets. Unlike those countries, Norway has been a net oil
exporter for the past three decades, has behaved much more like the oil-exporting economies,
and also has a relatively long history of available stock market data. By way of contrast,
Korea has imported almost 100% of the oil it has consumed, and has a reasonably well-
developed stock market owing to its rapid economic growth.
Recent studies such as those of Kilian (2009) and Kilian and Park (2009) have
demonstrated that the effect of oil price shocks on the macroeconomy or stock market differs
profoundly, depending on the source of the rise in the oil price. Furthermore, the recent
approach of Kilian (2009) and Kilian and Park (2009) would predict that this effect may not
be symmetric between oil-exporting and oil-importing economies, depending on the source of
the oil price shocks. More specifically, when oil prices rise in response to global economic
activities, the stock markets boom initially in both the oil-exporting and oil-importing
economies, but that the effects of oil price shocks will be far more persistent in the oil-
exporting economies than in the oil-importing economies. This is because a positive
innovation to the world economic activity directly stimulates both oil-exporting and oil-
importing economies; however, as the oil price rises, the initial direct effect will be offset in
the oil-importing economy. However, the initial rise in the oil price owing to the aggregate
demand shock (the shock to the global business cycle) further increases aggregate wealth,
consumption, and investment, and strengthens the initial effects in the oil-exporting economy.
Also, when oil prices rise due to the oil-specific demand shock (the demand induced by the
3
Journal of Economic Theory and Econometrics

fear that oil prices will rise more in the future), this effect could evolve into a persistent
negative effect on economic activity and the stock market in oil-importing economies. By
way of contrast, the same oil price shock may initially exert a positive effect (increase in
wealth due to the increase in the oil price), although that effect may be dampened out quickly
in the oil-exporting economy as the oil-specific demand shock slows global economic activity.
The results obtained herein demonstrate that not only the sign of the effects of oil price
shocks, but also the duration of those shocks strongly depends on the sources of oil price
shocks; this implies the importance of identifying the cause of the increase in the oil price in
attempting to understand stock market movements.
In addition to the stock return response, we have also evaluated the response of the
stock return volatility to the oil price shock. We find that the responses of the volatility also
depend on the cause of the oil price rise and the oil export/import status. Furthermore, when
we combine the responses of returns and the responses of volatility, our results show the
difficulty inherent to explaining the comovements between the responses of returns and the
responses of volatility based on the risk-return tradeoff relation.
This paper is organized as follows. Section II provides a brief presentation of the
econometric methodology used herein. The main results from stock markets in Norway and
Korea are presented in Section III. Section IV offers some concluding remarks.
2. Data and Econometric Methodology
2.1. Data Description
Our analysis requires global crude oil market data and financial market data for Norway and
Korea. The data regarding world crude oil production and its price are obtained from the
4
Jung, H. and Park, C. (2011)/JETEM 22(3)/1-29
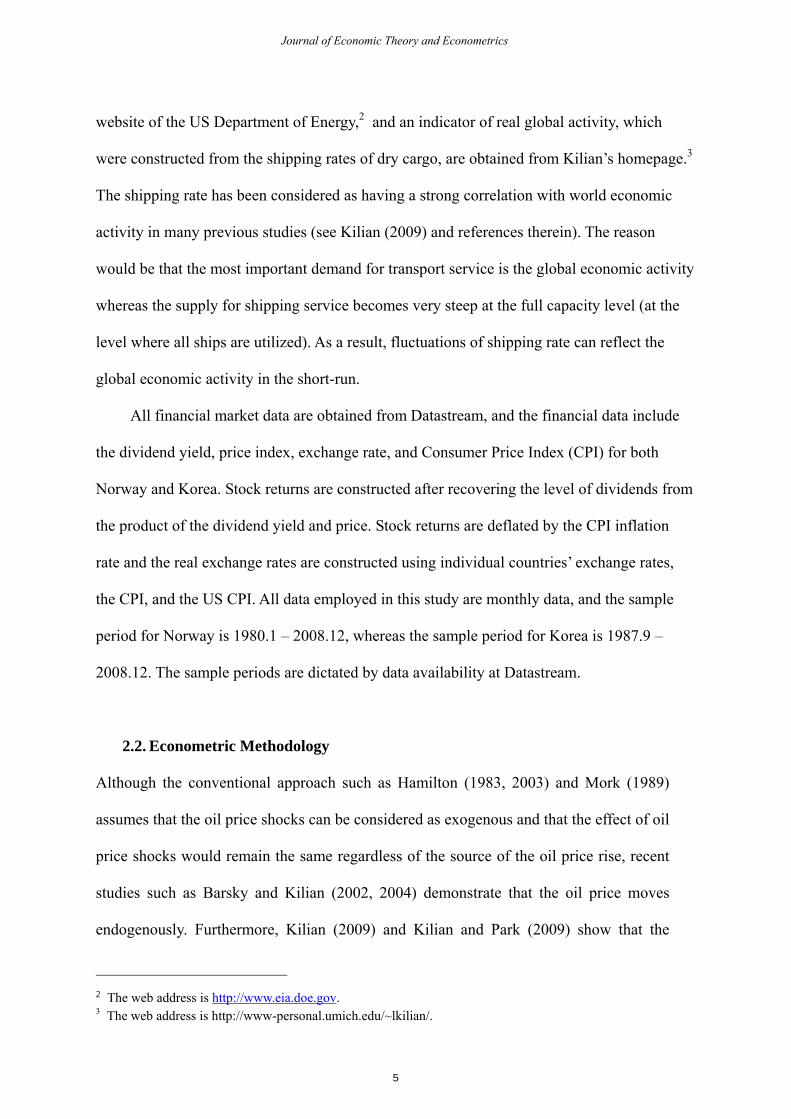
website of the US Department of Energy,2 and an indicator of real global activity, which
were constructed from the shipping rates of dry cargo, are obtained from Kilian’s homepage.3
The shipping rate has been considered as having a strong correlation with world economic
activity in many previous studies (see Kilian (2009) and references therein). The reason
would be that the most important demand for transport service is the global economic activity
whereas the supply for shipping service becomes very steep at the full capacity level (at the
level where all ships are utilized). As a result, fluctuations of shipping rate can reflect the
global economic activity in the short-run.
All financial market data are obtained from Datastream, and the financial data include
the dividend yield, price index, exchange rate, and Consumer Price Index (CPI) for both
Norway and Korea. Stock returns are constructed after recovering the level of dividends from
the product of the dividend yield and price. Stock returns are deflated by the CPI inflation
rate and the real exchange rates are constructed using individual countries’ exchange rates,
the CPI, and the US CPI. All data employed in this study are monthly data, and the sample
period for Norway is 1980.1 – 2008.12, whereas the sample period for Korea is 1987.9 –
2008.12. The sample periods are dictated by data availability at Datastream.
2.2. Econometric Methodology
Although the conventional approach such as Hamilton (1983, 2003) and Mork (1989)
assumes that the oil price shocks can be considered as exogenous and that the effect of oil
price shocks would remain the same regardless of the source of the oil price rise, recent
studies such as Barsky and Kilian (2002, 2004) demonstrate that the oil price moves
endogenously. Furthermore, Kilian (2009) and Kilian and Park (2009) show that the
2 The web address is http://www.eia.doe.gov. 3 The web address is http://www-personal.umich.edu/~lkilian/.
5
Journal of Economic Theory and Econometrics
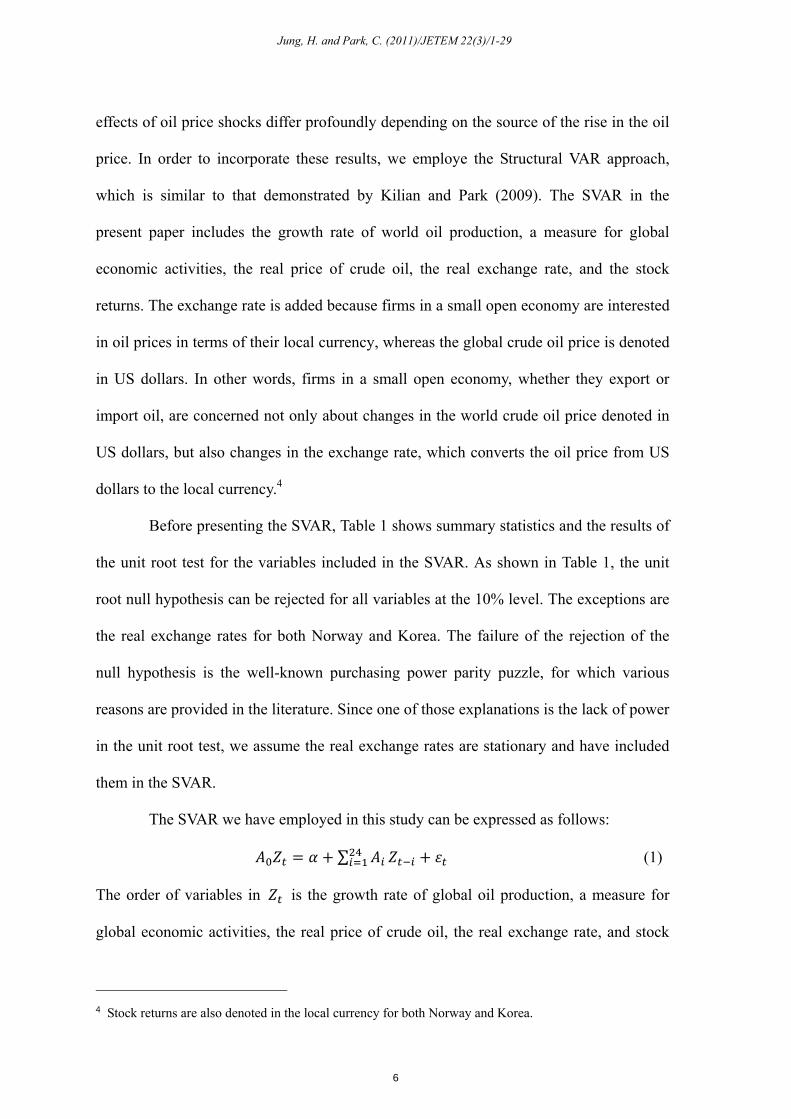
effects of oil price shocks differ profoundly depending on the source of the rise in the oil
price. In order to incorporate these results, we employe the Structural VAR approach,
which is similar to that demonstrated by Kilian and Park (2009). The SVAR in the
present paper includes the growth rate of world oil production, a measure for global
economic activities, the real price of crude oil, the real exchange rate, and the stock
returns. The exchange rate is added because firms in a small open economy are interested
in oil prices in terms of their local currency, whereas the global crude oil price is denoted
in US dollars. In other words, firms in a small open economy, whether they export or
import oil, are concerned not only about changes in the world crude oil price denoted in
US dollars, but also changes in the exchange rate, which converts the oil price from US
dollars to the local currency.4
Before presenting the SVAR, Table 1 shows summary statistics and the results of
the unit root test for the variables included in the SVAR. As shown in Table 1, the unit
root null hypothesis can be rejected for all variables at the 10% level. The exceptions are
the real exchange rates for both Norway and Korea. The failure of the rejection of the
null hypothesis is the well-known purchasing power parity puzzle, for which various
reasons are provided in the literature. Since one of those explanations is the lack of power
in the unit root test, we assume the real exchange rates are stationary and have included
them in the SVAR.
The SVAR we have employed in this study can be expressed as follows:
∑ (1)
The order of variables in is the growth rate of global oil production, a measure for
global economic activities, the real price of crude oil, the real exchange rate, and stock
4 Stock returns are also denoted in the local currency for both Norway and Korea.
6
Jung, H. and Park, C. (2011)/JETEM 22(3)/1-29
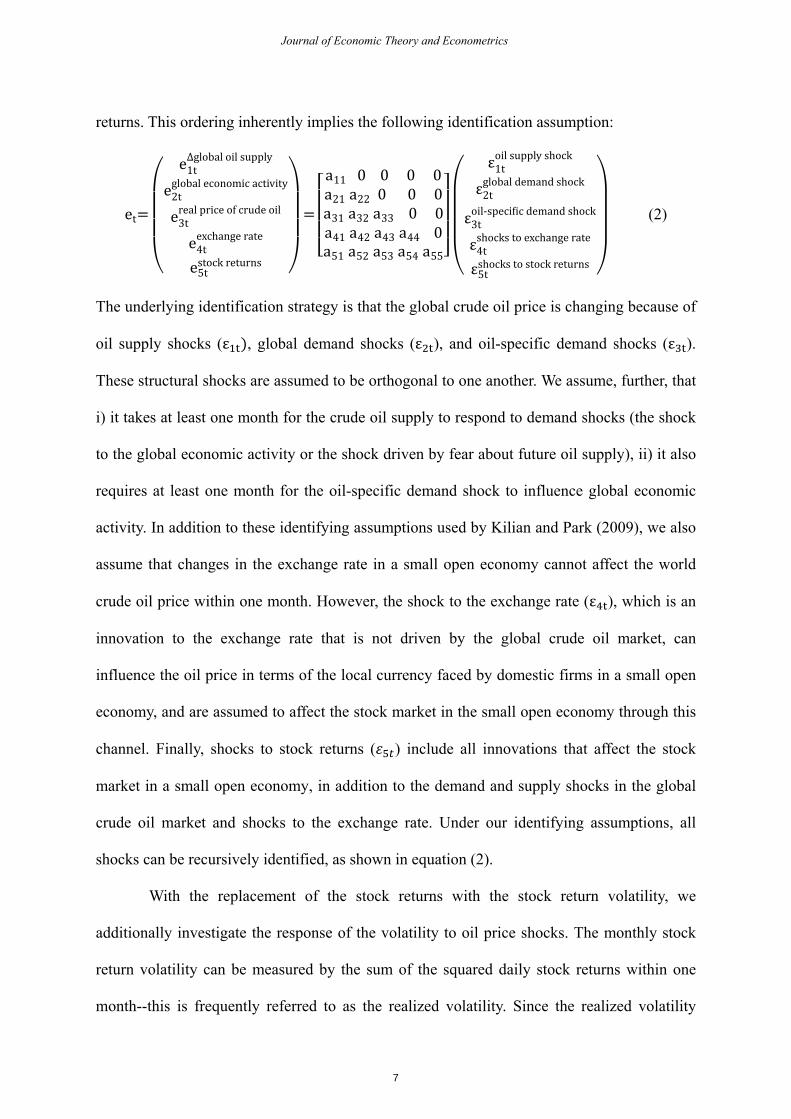
returns. This ordering inherently implies the following identification assumption:
ete1t∆global oil supplye2tglobal economic activitye3treal price of crude oile4texchange ratee5tstock returns
a11 0 0 0 0a21 a22 0 0 0a31 a32 a33 0 0a41 a42 a43 a44 0a51 a52 a53 a54 a55
ε1toil supply shockε2tglobal demand shockε3toil-specific demand shockε4tshocks to exchange rateε5tshocks to stock returns (2)
The underlying identification strategy is that the global crude oil price is changing because of
oil supply shocks (ε , global demand shocks (ε ), and oil-specific demand shocks (ε ).
These structural shocks are assumed to be orthogonal to one another. We assume, further, that
i) it takes at least one month for the crude oil supply to respond to demand shocks (the shock
to the global economic activity or the shock driven by fear about future oil supply), ii) it also
requires at least one month for the oil-specific demand shock to influence global economic
activity. In addition to these identifying assumptions used by Kilian and Park (2009), we also
assume that changes in the exchange rate in a small open economy cannot affect the world
crude oil price within one month. However, the shock to the exchange rate (ε ), which is an
innovation to the exchange rate that is not driven by the global crude oil market, can
influence the oil price in terms of the local currency faced by domestic firms in a small open
economy, and are assumed to affect the stock market in the small open economy through this
channel. Finally, shocks to stock returns ( ) include all innovations that affect the stock
market in a small open economy, in addition to the demand and supply shocks in the global
crude oil market and shocks to the exchange rate. Under our identifying assumptions, all
shocks can be recursively identified, as shown in equation (2).
With the replacement of the stock returns with the stock return volatility, we
additionally investigate the response of the volatility to oil price shocks. The monthly stock
return volatility can be measured by the sum of the squared daily stock returns within one
month--this is frequently referred to as the realized volatility. Since the realized volatility
7
Journal of Economic Theory and Econometrics
measure is a consistent estimate for the volatility of stock returns, the realized volatility is
expected to reflect the average uncertainty in the stock market for a given month.5
3. Results from Structural VAR
3.1. The Response of the Crude Oil Price to Crude Oil Demand and Supply Shocks
We first examine the response of the real crude oil price to oil demand shocks and oil supply
shocks under the SVAR specifications described in the previous section. The oil supply shock
(ε ) is normalized to represent a negative one standard deviation shock, and the oil demand
shocks (ε and ε ) are normalized to represent a positive one standard deviation shock,
such that all these shocks are supposed to raise the crude oil price. The responses of the real
crude oil price to each of these shocks are shown in Figure 1 using the data for Korea.6 The
dotted lines show two-standard error bands, whereas the dashed lines indicate one-standard
error bands. These confidence intervals are computed via the recursive design wild bootstrap
method as described by Gonçalves and Kilian (2004).
As is shown in Figure 1, the oil supply shock can only temporarily raise the real price
of oil, and the magnitude of this rise is never significant at the 5% level over the two-year
horizon. Unlike the effect of the oil supply shock, oil demand shocks (ε and ε ) exert
much larger and longer effects, in terms of their magnitude and duration. The global demand
shock can raise significantly the real price of oil at the level of 5%, and its effect lasts for
approximately one year at the 5% level, or for longer than two years at the 10% level. The
oil-specific demand shock also has a significant effect on raising the real price of oil at the
5% level over several months, although its effect gradually tapers off and peters out. The 5 See Andersen, Bollerslev, and Diebold (2010) and references therein for properties of the realized volatility. 6 Since the data for Korea has slightly shorter sample period, we utilized the data for Korea to show the impulse responses of oil price to three structural shocks for the common sample period (1987.9-2008.12). However, the impulse responses of oil price to those structural shocks with the Norwegian data during the common sample period are qualitatively similar to those in Figure 1. The results are available upon request.
8
Jung, H. and Park, C. (2011)/JETEM 22(3)/1-29
impact of the oil-specific demand shock becomes negative after approximately 15 months
which may be related to the usual increase in the oil supply in response to the oil price hike
by Saudi Arabia. Different structural shocks exert different impacts on the price of crude oil.
All these responses are generally consistent with those reported by Kilian (2009) or Kilian
and Park (2009), although the sample period in this study was 1987.9-2008.12, which
corresponds to the common sample period for Norway and Korea.
3.2. Responses of Stock Returns: Norway vs. Korea
Figures 2 and 3 show the responses of stock returns to oil price shocks for Norway (an oil-
exporting economy) and Korea (an oil-importing economy), respectively. It is apparent that
different causes of oil price increases have heterogeneous effects on stock returns in terms of
the sign and duration of the effect. The effects also differ according to whether an economy
exports or imports oil. The upper left panels in Figures 2 and 3 show the responses of stock
returns to the oil supply shock. Since the oil supply shock exerts no significant impact on the
crude oil price, as shown in Figure 1, it exerts no significant effect on stock returns for either
Norway or Korea. The impulse response never becomes significant at the 5% level. By way
of contrast, the shock originated from the global business cycle exerts a significantly positive
impact on the stock returns for both Norway and Korea, based on two-standard error bands.
Although the sign of the immediate effect from the aggregate demand shock is the same for
both Norway and Korea, the magnitude and duration of this effect differs greatly across those
two economies. The aggregate demand shock has a much more profound and persistent effect
on Norway than on Korea. For example, the impact of the global demand shock is persistent
for approximately 15 months at the 5% level in Norway, whereas its effect becomes
insignificant after 3 months in Korea. The aggregate demand shock initially raises the stock
price and oil price simultaneously. However, the increase in the oil price results in lower
9
Journal of Economic Theory and Econometrics
demand and higher production costs in Korea. Hence, the effect becomes insignificant shortly
following the shock. In Norway, the increase in the oil price raises consumption and
investment further from the oil industry to the rest of the industries, which dominates the
side-effect of the increase in the oil price. As a consequence, the positive effect from the
aggregate demand shock persists for far longer in Norway than in Korea.
The effect of the oil-specific demand shock, which is shown in the lower left panels
in Figures 2 and 3, also differs substantially between Norway and Korea. The increase in the
oil price resulting from the oil-specific demand shock raises stock returns on impact and one
month after the shock occurrence in Norway, but becomes insignificant for the remaining
horizons (up to two years). This might be because the initial positive effect derived primarily
from the oil industry is offset by the increase in the production cost or reduction in the
demand from other industries or from other oil-importing countries. However, the increase in
the crude oil price owing to the oil-specific demand shock has a negative effect only in Korea,
since the majority of industries therein are expected to experience lower demand and higher
production costs from the rise in the oil price deriving from the oil-specific demand shock. As
a consequence, the effect of the oil-specific demand shock becomes significantly negative
following the impact until at least the 16-month horizon.
The dynamics of the effect of the exchange rate shock also differs between oil-
exporting and oil-importing economies. The exchange rate shock has a significantly positive
effect for the first three months in Norway, whereas it has a negative impact for the first 10
months, becomes insignificant, and exerts a positive impact after 20 months in Korea. In
Norway, the increase in the oil price owing to the exchange rate shock initially raises oil
industry earnings, but reduces demand and increases costs in other industries. Owing to this
conflicting channel, the effect of the exchange rate shock is significant at short horizons only
in Norway. In Korea, however, the increase in the exchange rate initially lowers domestic
10
Jung, H. and Park, C. (2011)/JETEM 22(3)/1-29
demand and raises production costs for most industries. As time elapses, the weak exchange
rate stimulates exports from Korea, which gradually dominates the negative effects from
higher domestic oil prices and generates a positive impact on stock returns. All plots in
Figures 2 and 3 suggest strongly that identifying the cause of higher oil prices is particularly
important when the effects of oil price shocks on stock returns are discussed for an oil-
exporting small open economy or for an oil-importing small open economy.
Finally, the variance decomposition in Tables 2 and 3 quantifies the average
importance of each of the relevant structural shocks on Norwegian and Korean stock returns.
Whereas approximately 6-7% of the variations in stock returns from both countries can be
explained by structural shocks in the world crude oil market on impact, approximately 33%
(60%) of the variations in stock returns are associated with these shocks in the long run for
Norway (Korea). The explanatory power of the structural shocks is far higher than that for the
US, as shown in the study of Kilian and Park (2009), and this is probably associated with the
more oil-dependent technology and limited access to global financial markets in these
countries relative to the US. Aggregate demand shock accounts for 17% of stock return
variations in Norway, and has the largest explanatory power. Almost 50% of stock return
variations in Korea are accounted for by both aggregate demand shock and oil-specific
demand shock.
3.3. Responses of Stock Return Volatility: Norway vs. Korea
In this study, we address the responses of stock return volatility to oil price shocks in Norway
and Korea. First, we show, in Figure 4, the plots of estimated realized stock return volatility
for both markets. The Norwegian stock market evidences extremely high volatilities during
October 1987 (when the US stock market experienced crash), and during the recent global
financial crisis. The Korean stock market evidences a sizeable spike in volatility during the
11
Journal of Economic Theory and Econometrics
period of the Asian financial crisis. The volatility had declined gradually since that time, but
evidenced another large spike during the recent global financial crisis.
Figures 5 and 6 show the responses of stock return volatility to oil price shocks for
Norway and Korea, respectively. In a manner similar to the stock return response, the
dynamics of the effect of oil price shocks differ substantially depending on the cause of the
rise in the crude oil price. Additionally, whether an economy exports or imports oil is clearly
relevant to understanding the responses of stock return volatility. Sudden oil production
disruptions do not exert a significant impact on the volatility for either market, owing to the
limited effects of oil supply shocks on the crude oil price. However, aggregate demand shock
can induce a substantial reduction of the volatility in an oil-exporting country, because of its
sustained positive impact on the Norwegian stock market. The effect of the global demand
shock is significantly negative for an approximate one-year horizon. Aggregate demand
shock can reduce volatility in the Korean stock market, but its effect is significant upon
impact and after the one-month horizon. This short-lived effect might be due to the fact that
the aggregate demand shock simultaneously generates booming global activity and high oil
prices.
The oil-specific demand shock and exchange rate shock do not induce any sustained
and significant impacts on stock market volatility in Norway over the two-year horizon. In
other words, these shocks have largely insignificant effects on Norwegian stock market
volatility, with the exception of the brief but positive effect from the exchange rate shock,
which persists for two to three months. By way of contrast, these two types of shocks are
capable of significantly and persistently raising the levels of volatility in the Korean stock
market. These responses indicate that these two shocks tend to negatively affect demand and
production costs, which causes the stock returns to fall and the uncertainty to rise in Korea.
Interestingly, although it requires approximately 20 months for the exchange rate shock to
12
Jung, H. and Park, C. (2011)/JETEM 22(3)/1-29
stimulate the export from Korea and exerts a positive effect on stock returns, the response of
the volatility in the Korean stock market continues to remain at a significantly positive level,
even after 20 months.
The variance decomposition is provided in Tables 4 and 5 to compute the average
contribution of each type of structural shock on the level of volatility. Whereas shocks in the
world crude oil market together are responsible for less than 5% of variations in the volatility
on impact, their contributions increase with the horizon, and in the long-run the three shocks
collectively explain approximately 40% of variations in the volatility in the Norwegian
market. The aggregate demand shock has the highest level of explanatory power (26%) and
the exchange rate shock can explain 11% of movements in the volatility. In the Korean
market, shocks in the world crude oil market together account for merely 3% of variations in
the volatility on impact, but their contributions rise rapidly and three shocks together explain
approximately 47% of variations in the volatility in the Korean market in the long-run.
Unlike the case of Norway, however, the oil-specific demand shock has the largest
contribution (25%). Interestingly, the exchange rate shock has a very large explanatory power
in the short-run, but its explanatory power converges to a level of approximately 25% in the
long-run.
3.4. Comovements between Stock Returns and Volatility
Many finance theories predict a positive relation between stock returns and volatility. As risk-
averse investors tend to dislike high volatility, stock returns must necessarily increase with
increases in volatility or uncertainty. Without this compensation (high returns with high
volatility), there would be no demand for stocks in the market. However, financial
economists have experienced great difficulties in finding this tradeoff between risk and return
from time series data. The majority of GARCH models have provided weak evidence for this
13
Journal of Economic Theory and Econometrics

prediction from the theory (see Lundblad (2007) and references therein). In this sub-section,
we attempt to determine whether the responses of stock returns and volatility to oil price
shocks can be explained by the risk-return tradeoff. In service of this objective, we employ
the following measure of the conditional covariance based on the estimated impulse
responses in previous sub-sections.
· (3)
where denotes the impulse response coefficient of real stock returns at horizon h to a
given shock, and denotes the corresponding response of the stock return volatility.
This comovement measure was proposed by Den Haan (2000) and Den Haan and Summer
(2004), and was also employed in the studies of Kilian (2009) and Kilian and Park (2009).
Figure 7 presents the conditional covariance measure for the Norwegian market.
Unlike the implication from the risk-return theories, no pronounced positive comovements
occur between stock returns and volatility. In fact, the conditional covariance measure is
significantly negative at the one-month horizon for the aggregate demand shock. These plots
would appear to suggest that it is difficult to explain the comovements of the impulse
responses on the basis of the risk-return tradeoff relationship. This conjecture is more
pronounced in Figure 8, which demonstrates the conditional covariance measure for the
Korean market. In Figure 8, we can detect strong negative comovements between stock
return responses and volatility responses in many cases. This implies that when the aggregate
demand shock (the oil-specific demand shock or the exchange rate shock) has a positive
(negative) impact on the demand and cost of products in the short run, the shock also tends to
reduce (raise) the level of uncertainty in the Korean market. This strongly implies that the
risk-return tradeoff is limited in terms of providing insight vis-à-vis the impact of oil price
shocks on stock returns or volatility. Instead, the source of oil price increase and the oil
14
Jung, H. and Park, C. (2011)/JETEM 22(3)/1-29
export/import status are important in understanding the effect of oil price shocks on stock
returns and volatility.
4. Conclusion
In this study, we have investigated the responses of aggregate stock returns and volatility to
oil price shocks in both the Norwegian and Korean markets. Both Norway and Korea are
small open economies, although the former is an oil exporter and the latter is an oil importer.
We find that the responses of aggregate stock returns and volatility differ substantially,
depending on the underlying cause of the rise in oil price and also on whether the given
economy is an oil exporter or an oil importer. Additionally, a larger portion of stock return
variations in small open economies can be explained by the world crude oil market than that
in the US, which implies that the small open economies possess more oil-dependent
technology and more limited access to the global financial market. Finally, the analysis of the
conditional covariance measure indicates that the responses of stock returns and volatility are
not predicated on the risk-return tradeoff relationship. These findings must bear some
important implications for investors who wish to adjust their portfolio in response to oil price
shocks.
15
Journal of Economic Theory and Econometrics
References Andersen, T. G., T. Bollerslev, and F. X. Diebold, 2010, Parametric and Nonparametric
Volatility Measurement, in Handbook of Financial Econometrics edited by Aϊt-Sahalia and Hansen, North-Holland, 1, 67-138,.
Barsky, R. B., and L. Kilian, 2002, Do We Really Know that Oil Caused the Great Stagflation? A Monetary Alternative, NBER Macroeconomics Annual 2001, 137-183.
Barsky, R. B., and L. Kilian, 2004, Oil and the Macroeconomy since the 1970s, Journal of
Economic Perspectives 18, 115-134. Bjørnland, H. C., 2009, Oil Price Shocks and Stock Market Booms in an Oil Exporting
Country, Scottish Journal of Political Economy 56, 232-254. Den Haan, W. J., 2000, The Comovement between Output and Prices, Journal of Monetary
Economics 46, 3-30. Den Haan, W.J., and S.W. Summer, 2004, The Comovement between Real Activity and
Prices in the G7, European Economic Review 48, 1333-1347. Gonçalves, S., and L. Kilian, 2004, Bootstrapping Autoregressions with Conditional
Heteroskedasticity of Unknown Form, Journal of Econometrics 123, 89-120. Hamilton, J.D., 1983, Oil and the Macroeconomy since World War II, Journal of Political
Economy 91, 228-248. Hamilton, J.D., 2003, What is an Oil Shock?, Journal of Econometrics 113, 363-398. Jimenez-Rodriguez, 2005, R. and M. Sanchez, Oil Price Shocks and Real GDP Growth:
Empirical Evidence for Some OECD Countries, Applied Economics 37, 201-228. Jones, C., and G. Kaul, 1996, Oil and the Stock Markets, Journal of Finance 51, 463-491. Kilian, L., 2009, Not All Oil Price Shocks Are Alike: Disentangling Demand and Supply
Shocks in the Crude Oil Market, American Economic Review 99, 1053-1069. Kilian, L. and C. Park, 2009, The Impact of Oil Price Shocks on the US Stock Market,
International Economic Review 50, 1267-1287. Lundblad, C., 2007, The Risk Return Tradeoff in the Long Run: 1863-2003, Journal of
Financial Economics 85, 123-150. Mork, K. A., 1989, Oil and the Macroeconomy when Prices Go Up and Down: an Extension
of Hamiton’s Results, Journal of Political Economy 91, 740-744. Wei, C., 2003, Energy, the Stock Market, and the Putty-Clay Investment model, American
Economic Review 93, 311-323.
16
Jung, H. and Park, C. (2011)/JETEM 22(3)/1-29
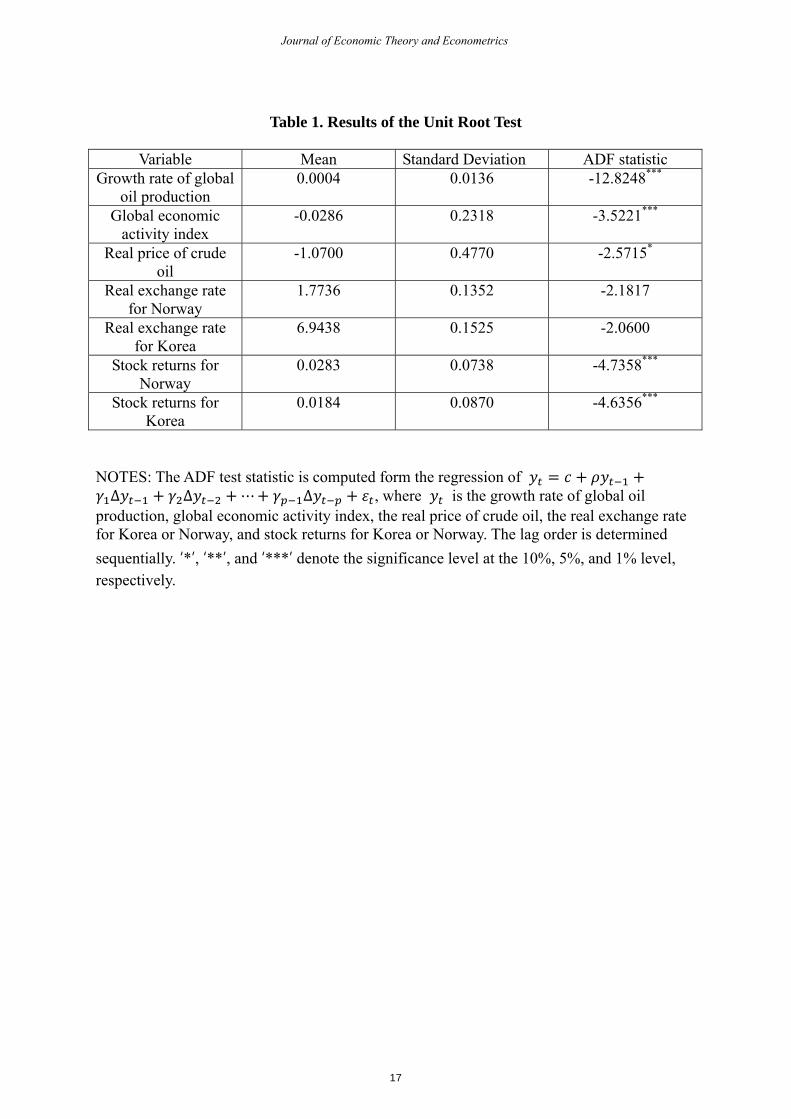
Table 1. Results of the Unit Root Test
Variable Mean Standard Deviation ADF statistic Growth rate of global
oil production 0.0004 0.0136 -12.8248***
Global economic activity index
-0.0286 0.2318 -3.5221***
Real price of crude oil
-1.0700 0.4770 -2.5715*
Real exchange rate for Norway
1.7736 0.1352 -2.1817
Real exchange rate for Korea
6.9438 0.1525 -2.0600
Stock returns for Norway
0.0283 0.0738 -4.7358***
Stock returns for Korea
0.0184 0.0870 -4.6356***
NOTES: The ADF test statistic is computed form the regression of ∆ ∆ ∆ , where is the growth rate of global oil production, global economic activity index, the real price of crude oil, the real exchange rate for Korea or Norway, and stock returns for Korea or Norway. The lag order is determined sequentially. ‘*’, ‘**’, and ‘***’ denote the significance level at the 10%, 5%, and 1% level, respectively.
17
Journal of Economic Theory and Econometrics
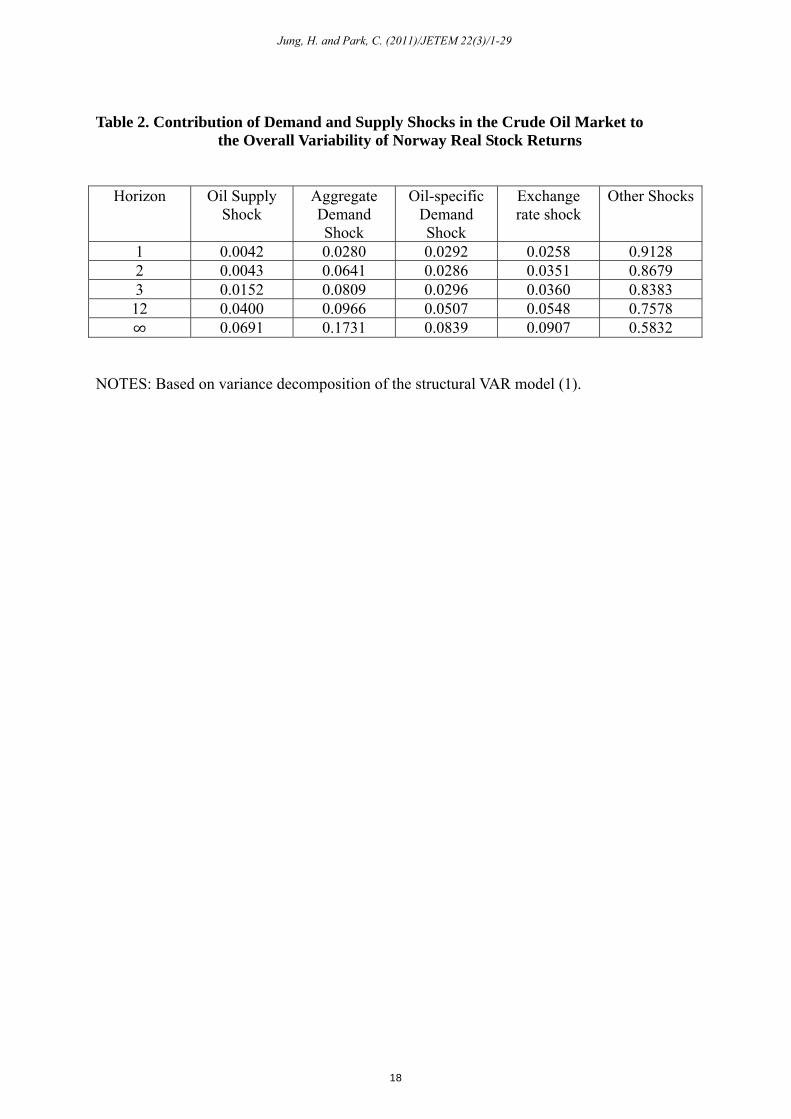
Table 2. Contribution of Demand and Supply Shocks in the Crude Oil Market to the Overall Variability of Norway Real Stock Returns
Horizon Oil Supply
Shock Aggregate Demand Shock
Oil-specific Demand Shock
Exchange rate shock
Other Shocks
1 0.0042 0.0280 0.0292 0.0258 0.9128 2 0.0043 0.0641 0.0286 0.0351 0.8679 3 0.0152 0.0809 0.0296 0.0360 0.8383 12 0.0400 0.0966 0.0507 0.0548 0.7578 ∞ 0.0691 0.1731 0.0839 0.0907 0.5832
NOTES: Based on variance decomposition of the structural VAR model (1).
18
Jung, H. and Park, C. (2011)/JETEM 22(3)/1-29

Table 3. Contribution of Demand and Supply Shocks in the Crude Oil Market to
the Overall Variability of Korea Real Stock Returns
Horizon Oil Supply
Shock Aggregate Demand Shock
Oil-specific Demand Shock
Exchange rate shock
Other Shocks
1 0.0315 0.0433 0.0082 0.0199 0.8971 2 0.0272 0.0784 0.0233 0.0966 0.7746 3 0.0246 0.0688 0.1125 0.1060 0.6881 12 0.0277 0.1318 0.1638 0.1384 0.5384 ∞ 0.1034 0.2385 0.2618 0.1367 0.2597
NOTES: Based on variance decomposition of the structural VAR model (1).
19
Journal of Economic Theory and Econometrics

Table 4. Contribution of Demand and Supply Shocks in the Crude Oil Market to the Overall Variability of Norway Real Stock Return Volatility
Horizon Oil Supply
Shock Aggregate Demand Shock
Oil-specific Demand Shock
Exchange rate shock
Other Shocks
1 0.0012 0.0431 0.0017 0.0012 0.9528 2 0.0118 0.0968 0.0041 0.0020 0.8853 3 0.0164 0.1221 0.0196 0.0153 0.8266 12 0.0374 0.1655 0.0491 0.0529 0.6952 ∞ 0.0425 0.2634 0.1002 0.1112 0.4827
NOTES: Based on variance decomposition of the structural VAR model (1).
20
Jung, H. and Park, C. (2011)/JETEM 22(3)/1-29
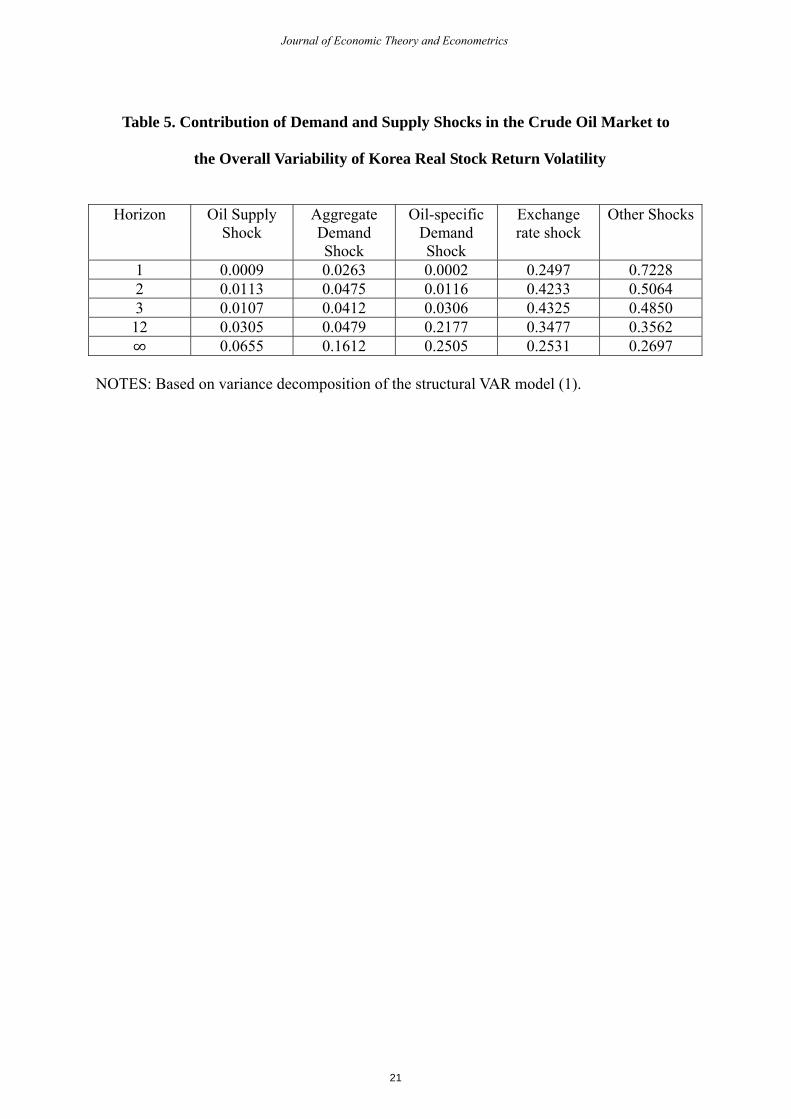
Table 5. Contribution of Demand and Supply Shocks in the Crude Oil Market to
the Overall Variability of Korea Real Stock Return Volatility
Horizon Oil Supply
Shock Aggregate Demand Shock
Oil-specific Demand Shock
Exchange rate shock
Other Shocks
1 0.0009 0.0263 0.0002 0.2497 0.7228 2 0.0113 0.0475 0.0116 0.4233 0.5064 3 0.0107 0.0412 0.0306 0.4325 0.4850 12 0.0305 0.0479 0.2177 0.3477 0.3562 ∞ 0.0655 0.1612 0.2505 0.2531 0.2697
NOTES: Based on variance decomposition of the structural VAR model (1).
21
Journal of Economic Theory and Econometrics

Figure 1. Responses of the Real Price of Crude Oil to One-Standard Deviation Structural Shocks: Point Estimates with One- and Two-Standard Error Bands
0 5 10 15 20
-0.1
-0.05
0
0.05
0.1
Oil supply shock
Rea
l pric
e of
oil
Months0 5 10 15 20
-0.1
-0.05
0
0.05
0.1
Aggregate demand shock
Rea
l pric
e of
oil
Months0 5 10 15 20
-0.1
-0.05
0
0.05
0.1
Oil-specific demand shock
Rea
l pric
e of
oil
Months
NOTES: Estimates based on the VAR model described in text. The confidence intervals were constructed using a recursive-design wild bootstrap (see Gonçalves and Kilian, 2004).
22
Jung, H. and Park, C. (2011)/JETEM 22(3)/1-29
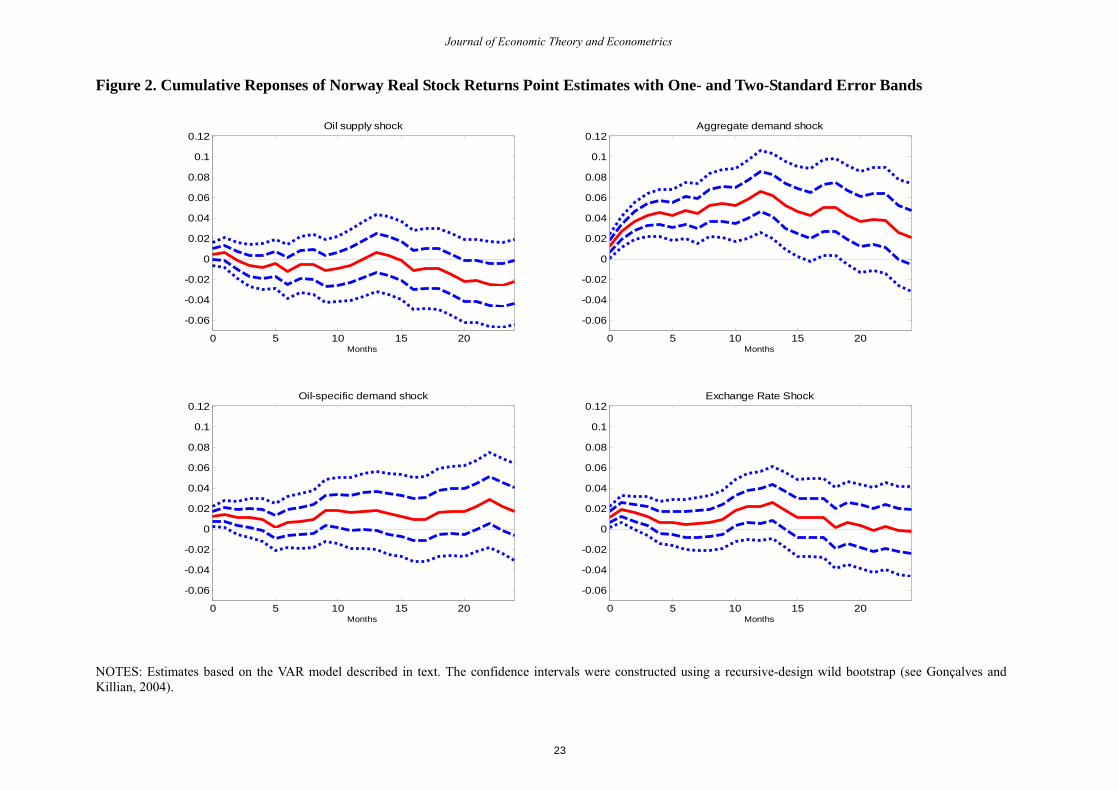
Figure 2. Cumulative Reponses of Norway Real Stock Returns Point Estimates with One- and Two-Standard Error Bands
0 5 10 15 20
-0.06
-0.04
-0.02
0
0.02
0.04
0.06
0.08
0.1
0.12Oil supply shock
Months0 5 10 15 20
-0.06
-0.04
-0.02
0
0.02
0.04
0.06
0.08
0.1
0.12Aggregate demand shock
Months
0 5 10 15 20
-0.06
-0.04
-0.02
0
0.02
0.04
0.06
0.08
0.1
0.12Oil-specific demand shock
Months0 5 10 15 20
-0.06
-0.04
-0.02
0
0.02
0.04
0.06
0.08
0.1
0.12Exchange Rate Shock
Months
NOTES: Estimates based on the VAR model described in text. The confidence intervals were constructed using a recursive-design wild bootstrap (see Gonçalves and Killian, 2004).
23
Journal of Economic Theory and Econometrics

Figure 3. Cumulative Reponses of Korea Real Stock Returns Point Estimates with One- and Two-Standard Error Bands
0 5 10 15 20
-0.1
-0.05
0
0.05
Oil supply shock
Months0 5 10 15 20
-0.1
-0.05
0
0.05
Aggregate demand shock
Months
0 5 10 15 20
-0.1
-0.05
0
0.05
Oil-specific demand shock
Months0 5 10 15 20
-0.1
-0.05
0
0.05
Exchange Rate Shock
Months
NOTES: Estimates based on the VAR model described in text. The confidence intervals were constructed using a recursive-design wild bootstrap (see Gonçalves and Killian, 2004).
24
Jung, H. and Park, C. (2011)/JETEM 22(3)/1-29

Figure 4. Stock Market Volatilities: Norway and Korea Volatility in the Norwegian Stock Market
1980 1985 1990 1995 2000 2005 20100
0.01
0.02
0.03
0.04
0.05
0.06
0.07
0.08
Volatility in the Korean Stock Market
1985 1990 1995 2000 2005 20100
0.01
0.02
0.03
0.04
0.05
0.06
0.07
25
Journal of Economic Theory and Econometrics

Figure 5. Cumulative Reponses of Norway Real Stock Return Volatility Point Estimates with One- and Two-Standard Error Bands
0 5 10 15 20-0.015
-0.01
-0.005
0
0.005
0.01Oil supply shock
Months0 5 10 15 20
-0.015
-0.01
-0.005
0
0.005
0.01Aggregate demand shock
Months
0 5 10 15 20-0.015
-0.01
-0.005
0
0.005
0.01Oil-specific demand shock
Months0 5 10 15 20
-0.015
-0.01
-0.005
0
0.005
0.01Exchange Rate Shock
Months
NOTES: Estimates based on the VAR model described in text. The confidence intervals were constructed using a recursive-design wild bootstrap (see Gonçalves and Killian, 2004).
26
Jung, H. and Park, C. (2011)/JETEM 22(3)/1-29

Figure 6. Cumulative Reponses of Korea Real Stock Return Volatility Point Estimates with One- and Two-Standard Error Bands
0 5 10 15 20
-0.02
-0.01
0
0.01
0.02
0.03
0.04Oil supply shock
Months0 5 10 15 20
-0.02
-0.01
0
0.01
0.02
0.03
0.04Aggregate demand shock
Months
0 5 10 15 20
-0.02
-0.01
0
0.01
0.02
0.03
0.04Oil-specific demand shock
Months0 5 10 15 20
-0.02
-0.01
0
0.01
0.02
0.03
0.04Exchange Rate Shock
Months
NOTES: Estimates based on the VAR model described in text. The confidence intervals were constructed using a recursive-design wild bootstrap (see Gonçalves and Killian, 2004).
27
Journal of Economic Theory and Econometrics
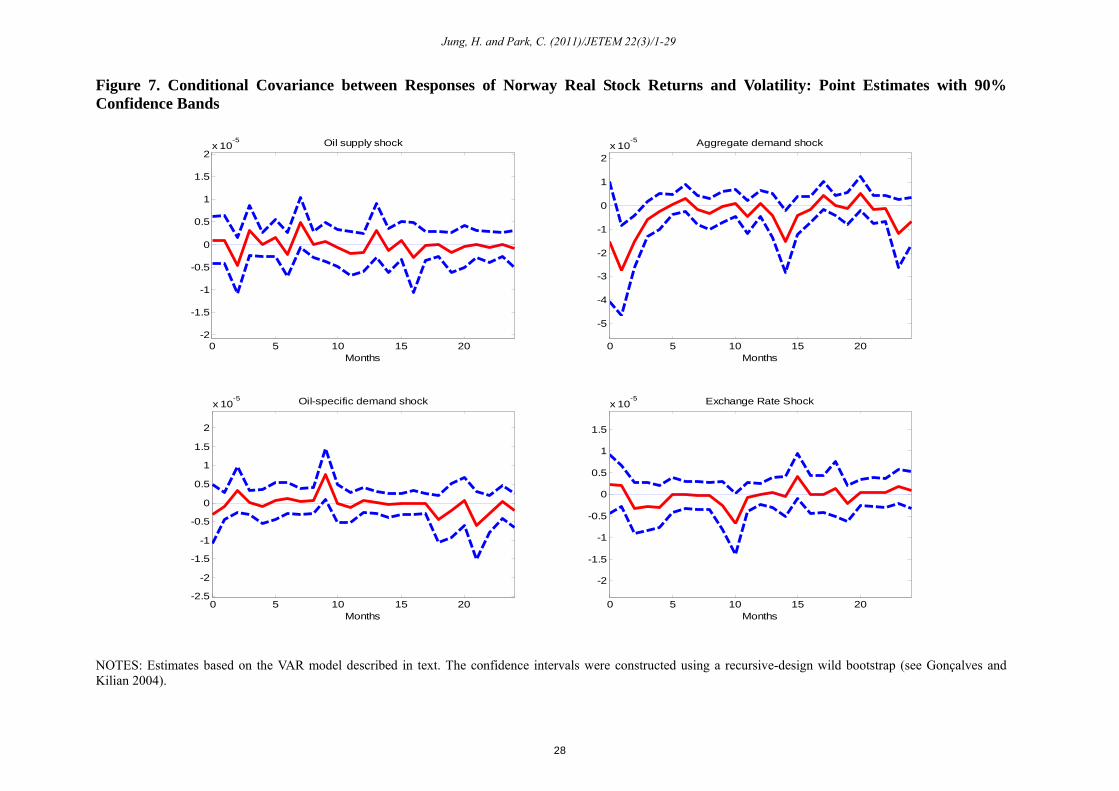
Figure 7. Conditional Covariance between Responses of Norway Real Stock Returns and Volatility: Point Estimates with 90% Confidence Bands
0 5 10 15 20-2
-1.5
-1
-0.5
0
0.5
1
1.5
2x 10
-5 Oil supply shock
Months0 5 10 15 20
-5
-4
-3
-2
-1
0
1
2x 10
-5 Aggregate demand shock
Months
0 5 10 15 20-2.5
-2
-1.5
-1
-0.5
0
0.5
1
1.5
2
x 10-5 Oil-specific demand shock
Months0 5 10 15 20
-2
-1.5
-1
-0.5
0
0.5
1
1.5
x 10-5 Exchange Rate Shock
Months
NOTES: Estimates based on the VAR model described in text. The confidence intervals were constructed using a recursive-design wild bootstrap (see Gonçalves and Kilian 2004).
28
Jung, H. and Park, C. (2011)/JETEM 22(3)/1-29

Figure 8. Conditional Covariance between Responses of Korea Real Stock Returns and Volatility: Point Estimates with 90% Confidence Bands
NOTES: Estimates based on the VAR model described in text. The confidence intervals were constructed using a recursive-design wild bootstrap (see Gonçalves and Killian, 2004).
0 5 10 15 20
-2
-1
0
1
2
3
x 10-5 Oil supply shock
Months0 5 10 15 20
-4
-2
0
2
4
6x 10
-5 Aggregate demand shock
Months
0 5 10 15 20
-6
-4
-2
0
2
x 10-5 Oil-specific demand shock
Months0 5 10 15 20
-14
-12
-10
-8
-6
-4
-2
0
2
4
x 10-5 Exchange Rate Shock
Months
29
Journal of Economic Theory and Econometrics