Embed Size (px)
Citation preview
April 11, 2014
F I N A N C I A L R E S U L T S
1Q14
F I N
A N
C I A
L
R E
S U
L T
S
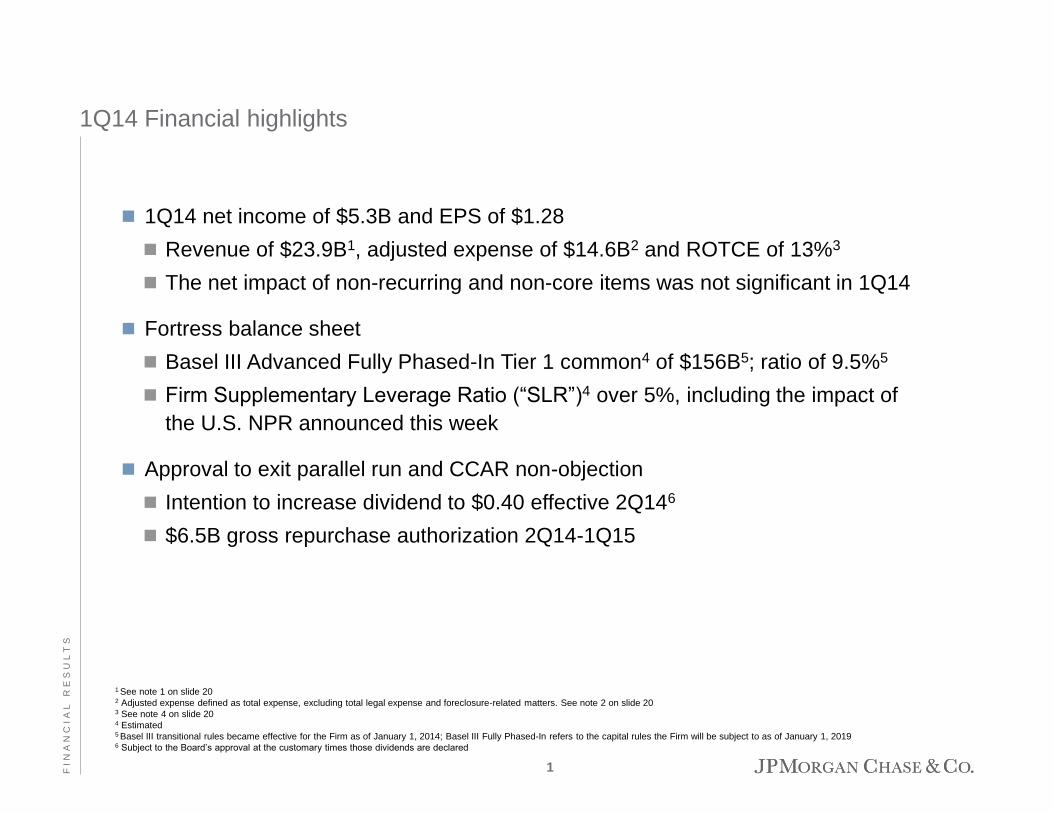
1Q14 Financial highlights
1 See note 1 on slide 20 2 Adjusted expense defined as total expense, excluding total legal expense and foreclosure-related matters. See note 2 on slide 20 3 See note 4 on slide 20 4 Estimated 5 Basel III transitional rules became effective for the Firm as of January 1, 2014; Basel III Fully Phased-In refers to the capital rules the Firm will be subject to as of January 1, 2019 6 Subject to the Board’s approval at the customary times those dividends are declared
1Q14 net income of $5.3B and EPS of $1.28
Revenue of $23.9B1, adjusted expense of $14.6B2 and ROTCE of 13%3
The net impact of non-recurring and non-core items was not significant in 1Q14
Fortress balance sheet
Basel III Advanced Fully Phased-In Tier 1 common4 of $156B5; ratio of 9.5%5
Firm Supplementary Leverage Ratio (“SLR”)4 over 5%, including the impact of
the U.S. NPR announced this week
Approval to exit parallel run and CCAR non-objection
Intention to increase dividend to $0.40 effective 2Q146
$6.5B gross repurchase authorization 2Q14-1Q15
1
F I N
A N
C I A
L
R E
S U
L T
S
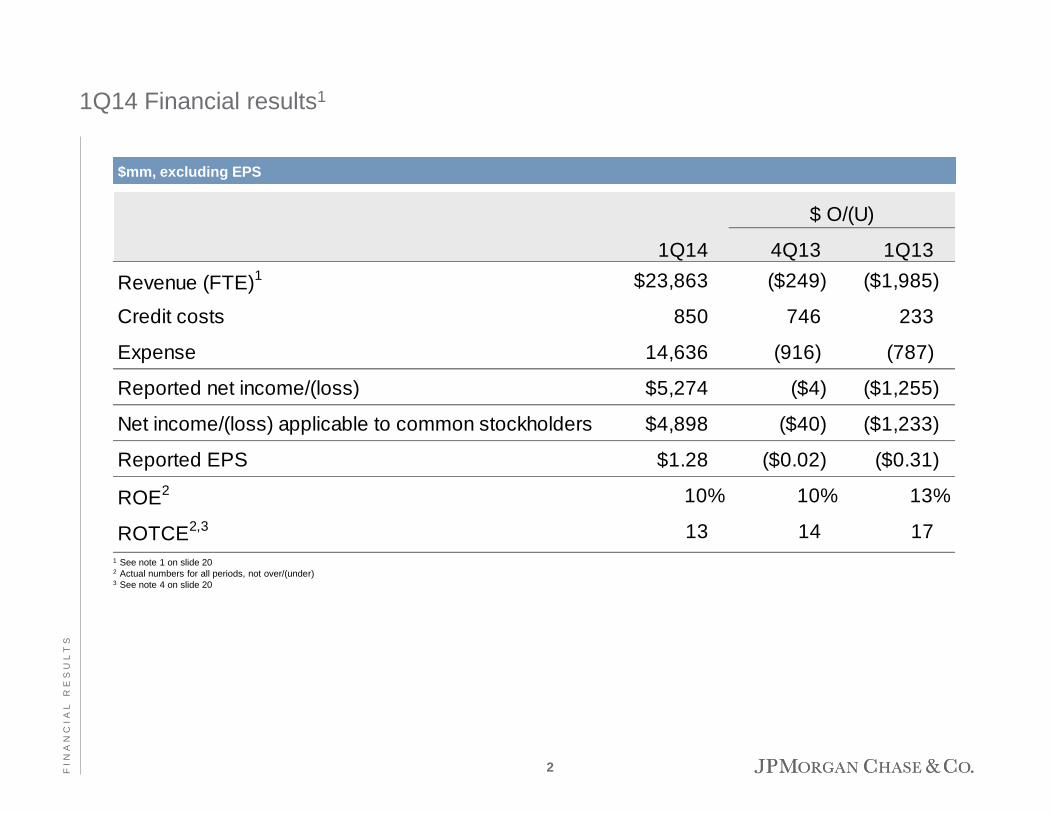
1Q14 Financial results1
1 See note 1 on slide 20 2 Actual numbers for all periods, not over/(under) 3 See note 4 on slide 20
$mm, excluding EPS
$ O/(U)
1Q14 4Q13 1Q13
Revenue (FTE)1 $23,863 ($249) ($1,985)
Credit costs 850 746 233
Expense 14,636 (916) (787)
Reported net income/(loss) $5,274 ($4) ($1,255)
Net income/(loss) applicable to common stockholders $4,898 ($40) ($1,233)
Reported EPS $1.28 ($0.02) ($0.31)
ROE2 10% 10% 13%
ROTCE2,3 13 14 17
2
F I N
A N
C I A
L
R E
S U
L T
S
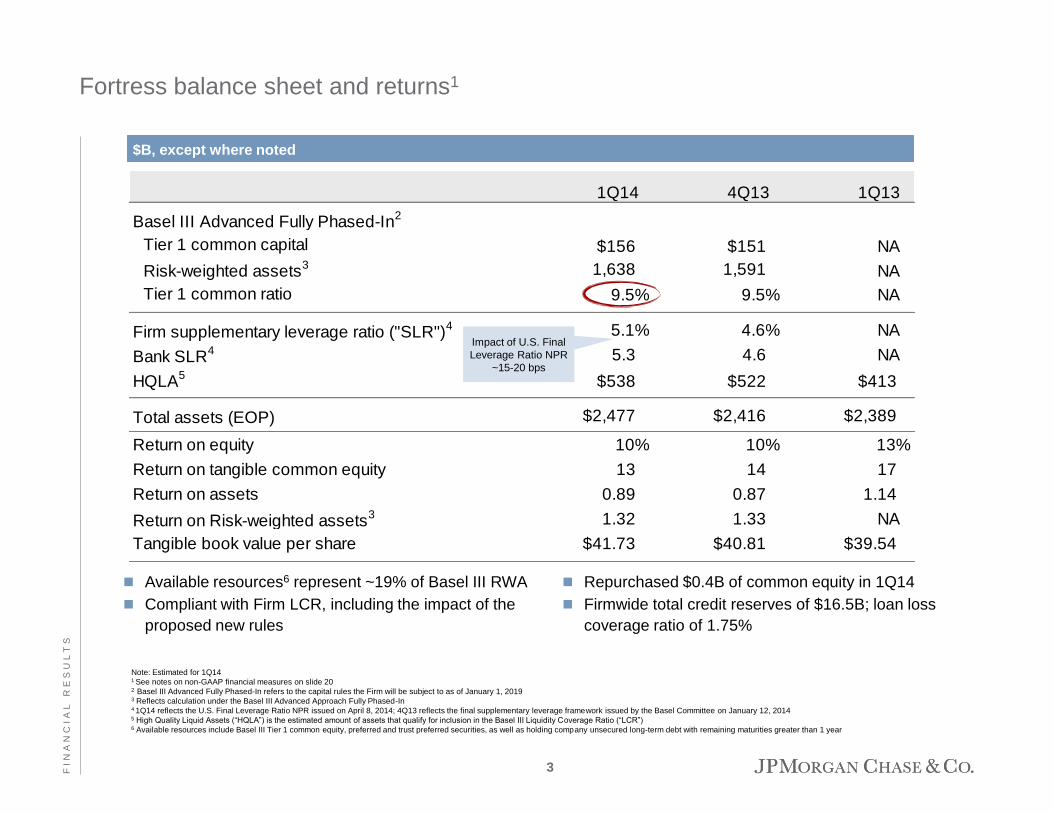
1Q14 4Q13 1Q13
Basel III Advanced Fully Phased-In2
Tier 1 common capital $156 $151 NA
Risk-weighted assets3 1,638 1,591 NA
Tier 1 common ratio 9.5% 9.5% NA
Firm supplementary leverage ratio ("SLR")4 5.1% 4.6% NA
Bank SLR4 5.3 4.6 NA
HQLA5
$538 $522 $413
Total assets (EOP) $2,477 $2,416 $2,389
Return on equity 10% 10% 13%
Return on tangible common equity 13 14 17
Return on assets 0.89 0.87 1.14
Return on Risk-weighted assets3 1.32 1.33 NA
Tangible book value per share $41.73 $40.81 $39.54
$B, except where noted
Fortress balance sheet and returns1
Available resources6 represent ~19% of Basel III RWA
Compliant with Firm LCR, including the impact of the
proposed new rules
Repurchased $0.4B of common equity in 1Q14
Firmwide total credit reserves of $16.5B; loan loss
coverage ratio of 1.75%
Note: Estimated for 1Q14 1 See notes on non-GAAP financial measures on slide 20
2 Basel III Advanced Fully Phased-In refers to the capital rules the Firm will be subject to as of January 1, 2019 3 Reflects calculation under the Basel III Advanced Approach Fully Phased-In 4 1Q14 reflects the U.S. Final Leverage Ratio NPR issued on April 8, 2014; 4Q13 reflects the final supplementary leverage framework issued by the Basel Committee on January 12, 2014 5 High Quality Liquid Assets (“HQLA”) is the estimated amount of assets that qualify for inclusion in the Basel III Liquidity Coverage Ratio (“LCR”) 6 Available resources include Basel III Tier 1 common equity, preferred and trust preferred securities, as well as holding company unsecured long-term debt with remaining maturities greater than 1 year
3
Impact of U.S. Final
Leverage Ratio NPR
~15-20 bps
F I N
A N
C I A
L
R E
S U
L T
S
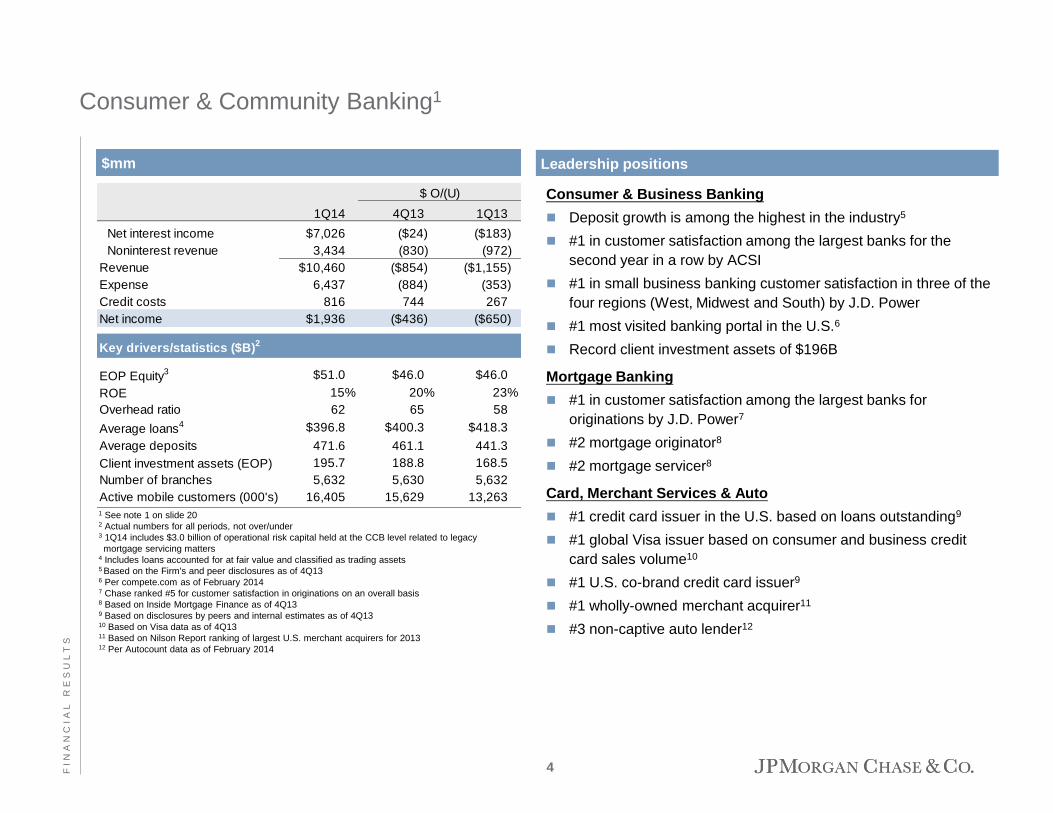
Consumer & Community Banking1
Consumer & Business Banking
Deposit growth is among the highest in the industry5
#1 in customer satisfaction among the largest banks for the
second year in a row by ACSI
#1 in small business banking customer satisfaction in three of the
four regions (West, Midwest and South) by J.D. Power
#1 most visited banking portal in the U.S.6
Record client investment assets of $196B
Mortgage Banking
#1 in customer satisfaction among the largest banks for
originations by J.D. Power7
#2 mortgage originator8
#2 mortgage servicer8
Card, Merchant Services & Auto
#1 credit card issuer in the U.S. based on loans outstanding9
#1 global Visa issuer based on consumer and business credit
card sales volume10
#1 U.S. co-brand credit card issuer9
#1 wholly-owned merchant acquirer11
#3 non-captive auto lender12
Leadership positions
1 See note 1 on slide 20
2 Actual numbers for all periods, not over/under 3 1Q14 includes $3.0 billion of operational risk capital held at the CCB level related to legacy
mortgage servicing matters 4 Includes loans accounted for at fair value and classified as trading assets 5 Based on the Firm's and peer disclosures as of 4Q13 6 Per compete.com as of February 2014 7 Chase ranked #5 for customer satisfaction in originations on an overall basis 8 Based on Inside Mortgage Finance as of 4Q13 9 Based on disclosures by peers and internal estimates as of 4Q13 10 Based on Visa data as of 4Q13 11 Based on Nilson Report ranking of largest U.S. merchant acquirers for 2013 12 Per Autocount data as of February 2014
$mm
$ O/(U)
1Q14 4Q13 1Q13
Net interest income $7,026 ($24) ($183)
Noninterest revenue 3,434 (830) (972)
Revenue $10,460 ($854) ($1,155)
Expense 6,437 (884) (353)
Credit costs 816 744 267
Net income $1,936 ($436) ($650)
Key drivers/statistics ($B)2
EOP Equity3 $51.0 $46.0 $46.0
ROE 15% 20% 23%
Overhead ratio 62 65 58
Average loans4 $396.8 $400.3 $418.3
Average deposits 471.6 461.1 441.3
Client investment assets (EOP) 195.7 188.8 168.5
Number of branches 5,632 5,630 5,632
Active mobile customers (000's) 16,405 15,629 13,263
4
F I N
A N
C I A
L
R E
S U
L T
S
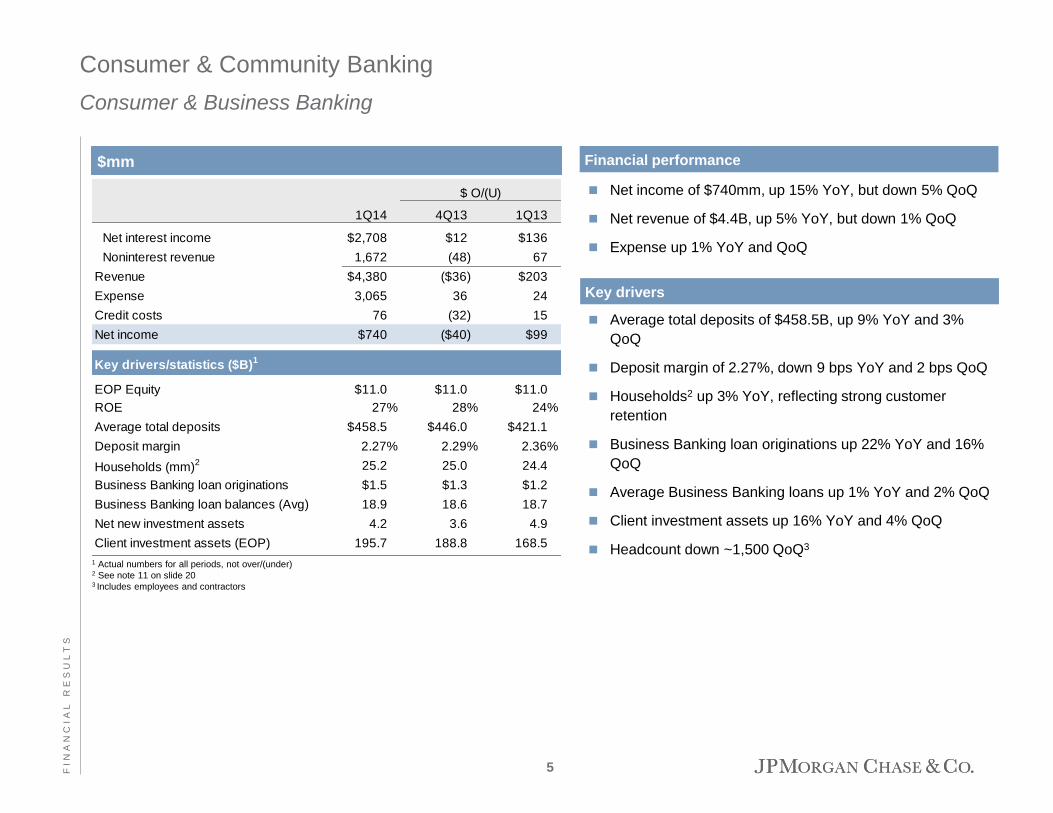
Consumer & Community Banking
Consumer & Business Banking
1 Actual numbers for all periods, not over/(under) 2 See note 11 on slide 20 3 Includes employees and contractors
Net income of $740mm, up 15% YoY, but down 5% QoQ
Net revenue of $4.4B, up 5% YoY, but down 1% QoQ
Expense up 1% YoY and QoQ
Average total deposits of $458.5B, up 9% YoY and 3%
QoQ
Deposit margin of 2.27%, down 9 bps YoY and 2 bps QoQ
Households2 up 3% YoY, reflecting strong customer
retention
Business Banking loan originations up 22% YoY and 16%
QoQ
Average Business Banking loans up 1% YoY and 2% QoQ
Client investment assets up 16% YoY and 4% QoQ
Headcount down ~1,500 QoQ3
Financial performance
Key drivers
$mm
$ O/(U)
1Q14 4Q13 1Q13
Net interest income $2,708 $12 $136
Noninterest revenue 1,672 (48) 67
Revenue $4,380 ($36) $203
Expense 3,065 36 24
Credit costs 76 (32) 15
Net income $740 ($40) $99
Key drivers/statistics ($B)1
EOP Equity $11.0 $11.0 $11.0
ROE 27% 28% 24%
Average total deposits $458.5 $446.0 $421.1
Deposit margin 2.27% 2.29% 2.36%
Households (mm)2 25.2 25.0 24.4
Business Banking loan originations $1.5 $1.3 $1.2
Business Banking loan balances (Avg) 18.9 18.6 18.7
Net new investment assets 4.2 3.6 4.9
Client investment assets (EOP) 195.7 188.8 168.5
5
F I N
A N
C I A
L
R E
S U
L T
S
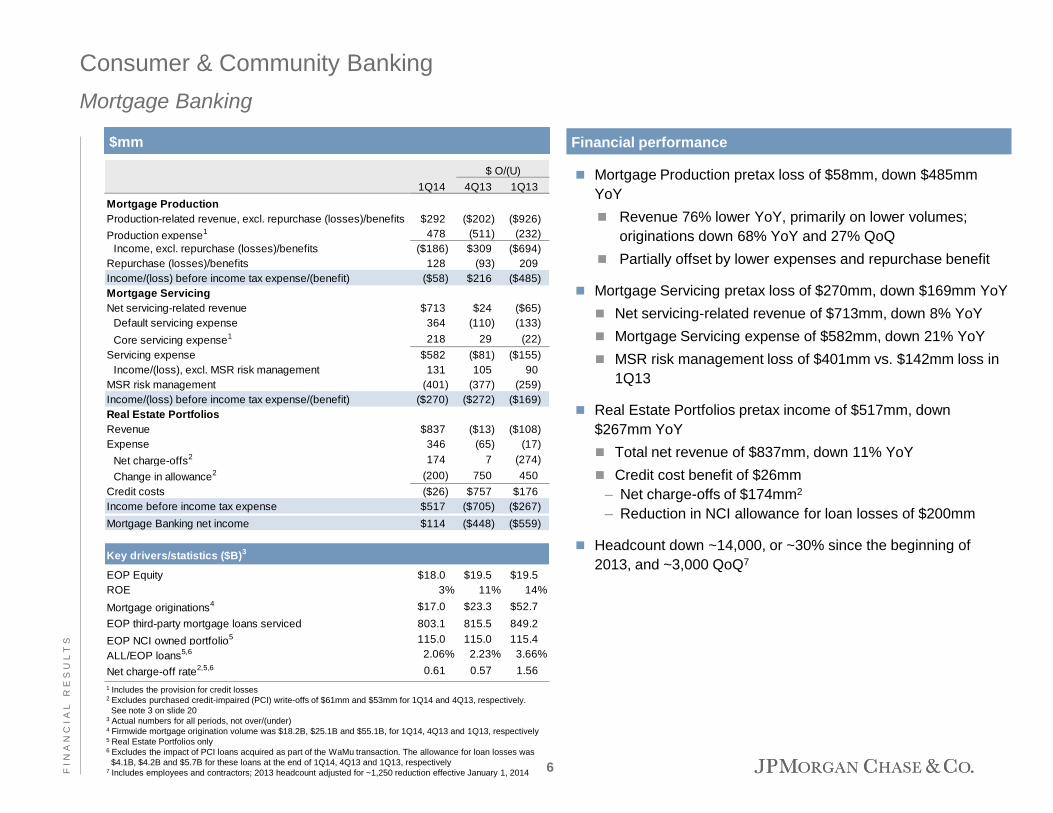
Consumer & Community Banking
Mortgage Banking
1 Includes the provision for credit losses 2 Excludes purchased credit-impaired (PCI) write-offs of $61mm and $53mm for 1Q14 and 4Q13, respectively.
See note 3 on slide 20
3 Actual numbers for all periods, not over/(under) 4 Firmwide mortgage origination volume was $18.2B, $25.1B and $55.1B, for 1Q14, 4Q13 and 1Q13, respectively 5 Real Estate Portfolios only
6 Excludes the impact of PCI loans acquired as part of the WaMu transaction. The allowance for loan losses was
$4.1B, $4.2B and $5.7B for these loans at the end of 1Q14, 4Q13 and 1Q13, respectively 7 Includes employees and contractors; 2013 headcount adjusted for ~1,250 reduction effective January 1, 2014
Financial performance $mm
Mortgage Production pretax loss of $58mm, down $485mm
YoY
Revenue 76% lower YoY, primarily on lower volumes;
originations down 68% YoY and 27% QoQ
Partially offset by lower expenses and repurchase benefit
Mortgage Servicing pretax loss of $270mm, down $169mm YoY
Net servicing-related revenue of $713mm, down 8% YoY
Mortgage Servicing expense of $582mm, down 21% YoY
MSR risk management loss of $401mm vs. $142mm loss in
1Q13
Real Estate Portfolios pretax income of $517mm, down
$267mm YoY
Total net revenue of $837mm, down 11% YoY
Credit cost benefit of $26mm
– Net charge-offs of $174mm2
– Reduction in NCI allowance for loan losses of $200mm
Headcount down ~14,000, or ~30% since the beginning of
2013, and ~3,000 QoQ7
$ O/(U)
1Q14 4Q13 1Q13
Mortgage Production
Production-related revenue, excl. repurchase (losses)/benefits $292 ($202) ($926)
Production expense1 478 (511) (232)
Income, excl. repurchase (losses)/benefits ($186) $309 ($694)
Repurchase (losses)/benefits 128 (93) 209
Income/(loss) before income tax expense/(benefit) ($58) $216 ($485)
Mortgage Servicing
Net servicing-related revenue $713 $24 ($65)
Default servicing expense 364 (110) (133)
Core servicing expense1 218 29 (22)
Servicing expense $582 ($81) ($155)
Income/(loss), excl. MSR risk management 131 105 90
MSR risk management (401) (377) (259)
Income/(loss) before income tax expense/(benefit) ($270) ($272) ($169)
Real Estate Portfolios
Revenue $837 ($13) ($108)
Expense 346 (65) (17)
Net charge-offs2 174 7 (274)
Change in allowance2 (200) 750 450
Credit costs ($26) $757 $176
Income before income tax expense $517 ($705) ($267)
Mortgage Banking net income $114 ($448) ($559)
Key drivers/statistics ($B)3
EOP Equity $18.0 $19.5 $19.5
ROE 3% 11% 14%
Mortgage originations4 $17.0 $23.3 $52.7
EOP third-party mortgage loans serviced 803.1 815.5 849.2
EOP NCI owned portfolio5 115.0 115.0 115.4
ALL/EOP loans5,6 2.06% 2.23% 3.66%
Net charge-off rate2,5,6 0.61 0.57 1.56
6
F I N
A N
C I A
L
R E
S U
L T
S
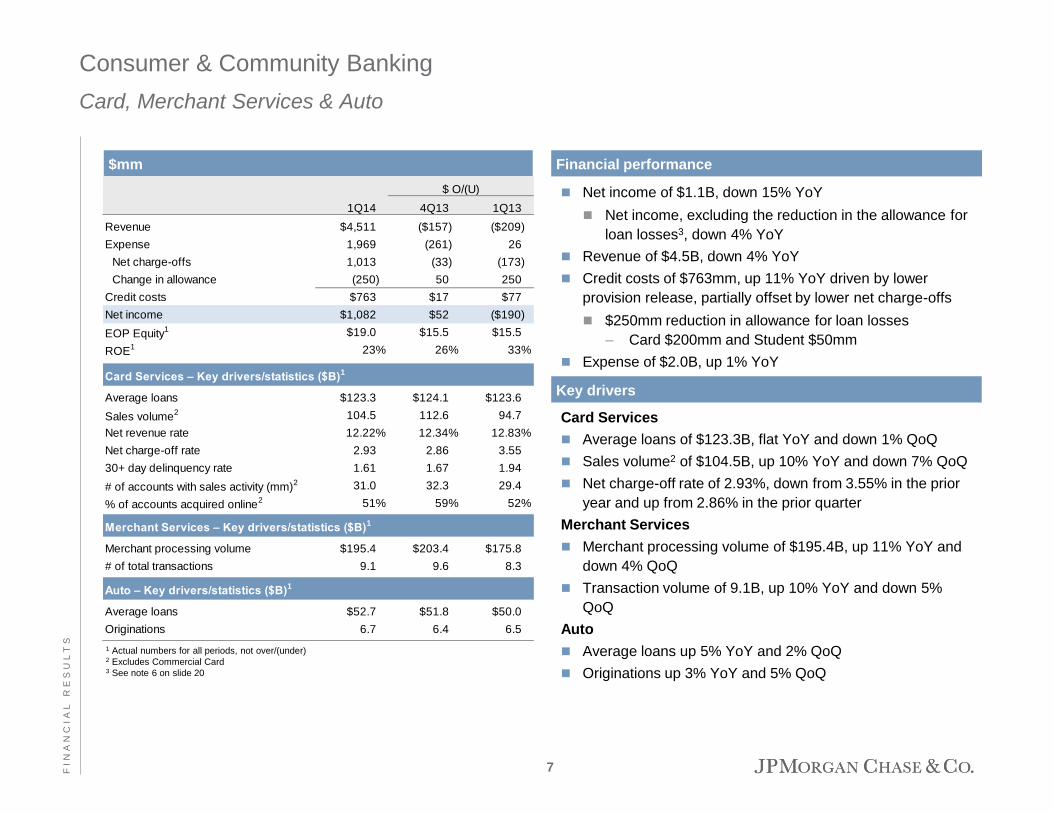
Net income of $1.1B, down 15% YoY
Net income, excluding the reduction in the allowance for
loan losses3, down 4% YoY
Revenue of $4.5B, down 4% YoY
Credit costs of $763mm, up 11% YoY driven by lower
provision release, partially offset by lower net charge-offs
$250mm reduction in allowance for loan losses
– Card $200mm and Student $50mm
Expense of $2.0B, up 1% YoY
1 Actual numbers for all periods, not over/(under) 2 Excludes Commercial Card 3 See note 6 on slide 20
Card Services
Average loans of $123.3B, flat YoY and down 1% QoQ
Sales volume2 of $104.5B, up 10% YoY and down 7% QoQ
Net charge-off rate of 2.93%, down from 3.55% in the prior
year and up from 2.86% in the prior quarter
Merchant Services
Merchant processing volume of $195.4B, up 11% YoY and
down 4% QoQ
Transaction volume of 9.1B, up 10% YoY and down 5%
QoQ
Auto
Average loans up 5% YoY and 2% QoQ
Originations up 3% YoY and 5% QoQ
Consumer & Community Banking
Card, Merchant Services & Auto
$mm Financial performance
Key drivers
1Q14 4Q13 1Q13
Revenue $4,511 ($157) ($209)
Expense 1,969 (261) 26
Net charge-offs 1,013 (33) (173)
Change in allowance (250) 50 250
Credit costs $763 $17 $77
Net income $1,082 $52 ($190)
EOP Equity1 $19.0 $15.5 $15.5
ROE1 23% 26% 33%
Card Services – Key drivers/statistics ($B)1
Average loans $123.3 $124.1 $123.6
Sales volume2 104.5 112.6 94.7
Net revenue rate 12.22% 12.34% 12.83%
Net charge-off rate 2.93 2.86 3.55
30+ day delinquency rate 1.61 1.67 1.94
# of accounts with sales activity (mm)2 31.0 32.3 29.4
% of accounts acquired online2 51% 59% 52%
Merchant Services – Key drivers/statistics ($B)1
Merchant processing volume $195.4 $203.4 $175.8
# of total transactions 9.1 9.6 8.3
Auto – Key drivers/statistics ($B)1
Average loans $52.7 $51.8 $50.0
Originations 6.7 6.4 6.5
$ O/(U)
7
F I N
A N
C I A
L
R E
S U
L T
S
Corporate & Investment Bank1
1 See note 1 on slide 20 2 Lending revenue includes net interest income, fees, gains or losses on loan sale activity, gains or losses on securities
received as part of a loan restructuring and the risk management results related to the credit portfolio (excluding trade
finance) 3 Primarily credit portfolio credit valuation adjustments (“CVA”), FVA and DVA on OTC derivatives and structured notes,
and nonperforming derivative receivable results. Results are presented net of associated hedging activities. 4 Actual numbers for all periods, not over/under 5 Calculated based on average equity; period-end equity and average equity are the same. Return on equity excluding
both FVA (effective 4Q13) and DVA, a non-GAAP financial measure, was 15% and 18% for 4Q13 and 1Q13,
respectively 6 Overhead ratio excluding FVA (effective 4Q13) and DVA, a non-GAAP financial measure, was 61% and 61% for 4Q13
and 1Q13, respectively 7 Compensation expense as a percentage of total net revenue excluding both FVA (effective 4Q13) and DVA, a non-
GAAP financial measure, was 27% and 34% for 4Q13 and 1Q13, respectively 8 ALL/EOP loans as reported was 1.23%, 1.15% and 1.11% for 1Q14, 4Q13 and 1Q13, respectively 9 Pro forma results exclude FVA (effective 4Q13) and DVA in 4Q13 and 1Q13; 2014 reported results include FVA/DVA,
net of hedges. See note 8 on slide 20
$mm
Financial performance
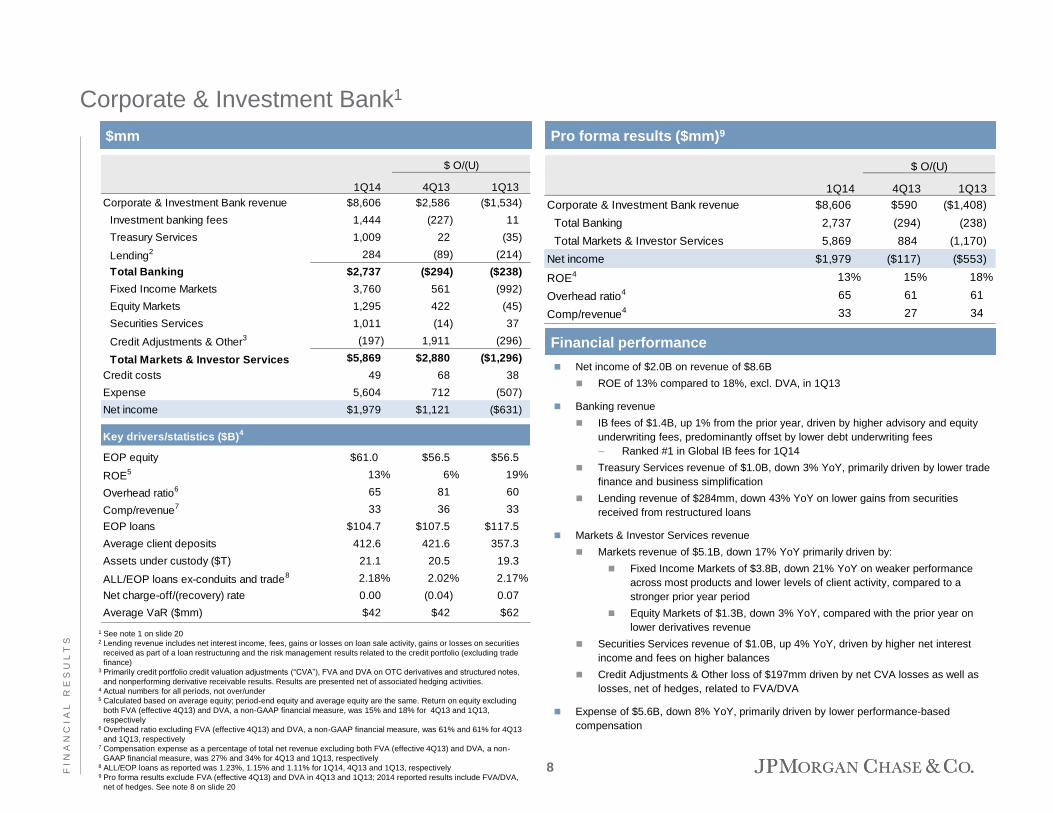
Net income of $2.0B on revenue of $8.6B
ROE of 13% compared to 18%, excl. DVA, in 1Q13
Banking revenue
IB fees of $1.4B, up 1% from the prior year, driven by higher advisory and equity
underwriting fees, predominantly offset by lower debt underwriting fees
– Ranked #1 in Global IB fees for 1Q14
Treasury Services revenue of $1.0B, down 3% YoY, primarily driven by lower trade
finance and business simplification
Lending revenue of $284mm, down 43% YoY on lower gains from securities
received from restructured loans
Markets & Investor Services revenue
Markets revenue of $5.1B, down 17% YoY primarily driven by:
Fixed Income Markets of $3.8B, down 21% YoY on weaker performance
across most products and lower levels of client activity, compared to a
stronger prior year period
Equity Markets of $1.3B, down 3% YoY, compared with the prior year on
lower derivatives revenue
Securities Services revenue of $1.0B, up 4% YoY, driven by higher net interest
income and fees on higher balances
Credit Adjustments & Other loss of $197mm driven by net CVA losses as well as
losses, net of hedges, related to FVA/DVA
Expense of $5.6B, down 8% YoY, primarily driven by lower performance-based
compensation
$ O/(U)
1Q14 4Q13 1Q13
Corporate & Investment Bank revenue $8,606 $2,586 ($1,534)
Investment banking fees 1,444 (227) 11
Treasury Services 1,009 22 (35)
Lending2 284 (89) (214)
Total Banking $2,737 ($294) ($238)
Fixed Income Markets 3,760 561 (992)
Equity Markets 1,295 422 (45)
Securities Services 1,011 (14) 37
Credit Adjustments & Other3 (197) 1,911 (296)
Total Markets & Investor Services $5,869 $2,880 ($1,296)
Credit costs 49 68 38
Expense 5,604 712 (507)
Net income $1,979 $1,121 ($631)
Key drivers/statistics ($B)4
EOP equity $61.0 $56.5 $56.5
ROE5 13% 6% 19%
Overhead ratio6 65 81 60
Comp/revenue7 33 36 33
EOP loans $104.7 $107.5 $117.5
Average client deposits 412.6 421.6 357.3
Assets under custody ($T) 21.1 20.5 19.3
ALL/EOP loans ex-conduits and trade8 2.18% 2.02% 2.17%
Net charge-off/(recovery) rate 0.00 (0.04) 0.07
Average VaR ($mm) $42 $42 $62
Pro forma results ($mm)9
$ O/(U)
1Q14 4Q13 1Q13
Corporate & Investment Bank revenue $8,606 $590 ($1,408)
Total Banking 2,737 (294) (238)
Total Markets & Investor Services 5,869 884 (1,170)
Net income $1,979 ($117) ($553)
ROE4 13% 15% 18%
Overhead ratio4 65 61 61
Comp/revenue4 33 27 34
8
F I N
A N
C I A
L
R E
S U
L T
S
Commercial Banking1
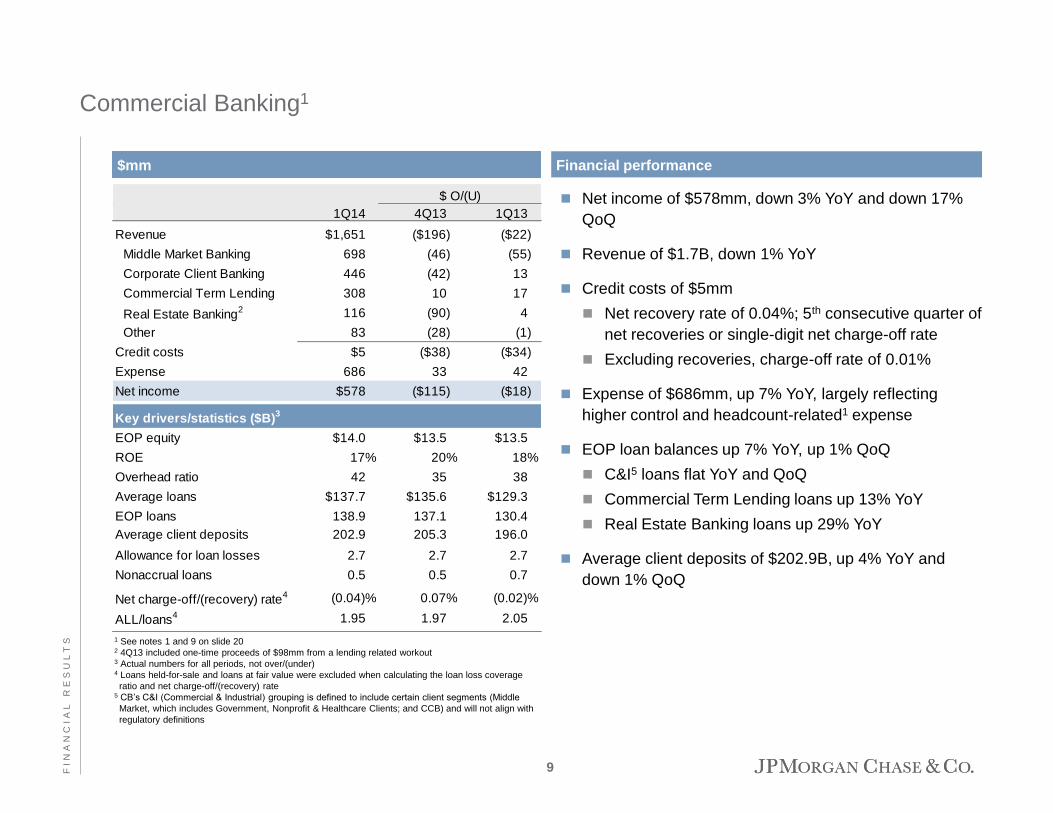
Net income of $578mm, down 3% YoY and down 17%
QoQ
Revenue of $1.7B, down 1% YoY
Credit costs of $5mm
Net recovery rate of 0.04%; 5th consecutive quarter of
net recoveries or single-digit net charge-off rate
Excluding recoveries, charge-off rate of 0.01%
Expense of $686mm, up 7% YoY, largely reflecting
higher control and headcount-related1 expense
EOP loan balances up 7% YoY, up 1% QoQ
C&I5 loans flat YoY and QoQ
Commercial Term Lending loans up 13% YoY
Real Estate Banking loans up 29% YoY
Average client deposits of $202.9B, up 4% YoY and
down 1% QoQ
1 See notes 1 and 9 on slide 20 2 4Q13 included one-time proceeds of $98mm from a lending related workout 3 Actual numbers for all periods, not over/(under) 4 Loans held-for-sale and loans at fair value were excluded when calculating the loan loss coverage
ratio and net charge-off/(recovery) rate 5 CB’s C&I (Commercial & Industrial) grouping is defined to include certain client segments (Middle
Market, which includes Government, Nonprofit & Healthcare Clients; and CCB) and will not align with
regulatory definitions
$mm
1Q14 4Q13 1Q13
Revenue $1,651 ($196) ($22)
Middle Market Banking 698 (46) (55)
Corporate Client Banking 446 (42) 13
Commercial Term Lending 308 10 17
Real Estate Banking2 116 (90) 4
Other 83 (28) (1)
Credit costs $5 ($38) ($34)
Expense 686 33 42
Net income $578 ($115) ($18)
Key drivers/statistics ($B)3
EOP equity $14.0 $13.5 $13.5
ROE 17% 20% 18%
Overhead ratio 42 35 38
Average loans $137.7 $135.6 $129.3
EOP loans 138.9 137.1 130.4
Average client deposits 202.9 205.3 196.0
Allowance for loan losses 2.7 2.7 2.7
Nonaccrual loans 0.5 0.5 0.7
Net charge-off/(recovery) rate4 (0.04)% 0.07% (0.02)%
ALL/loans4 1.95 1.97 2.05
$ O/(U)
Financial performance
9
F I N
A N
C I A
L
R E
S U
L T
S
Asset Management1
1 See note 1 on slide 20 2 Actual numbers for all periods, not over/(under) 3 See note 10 on slide 20
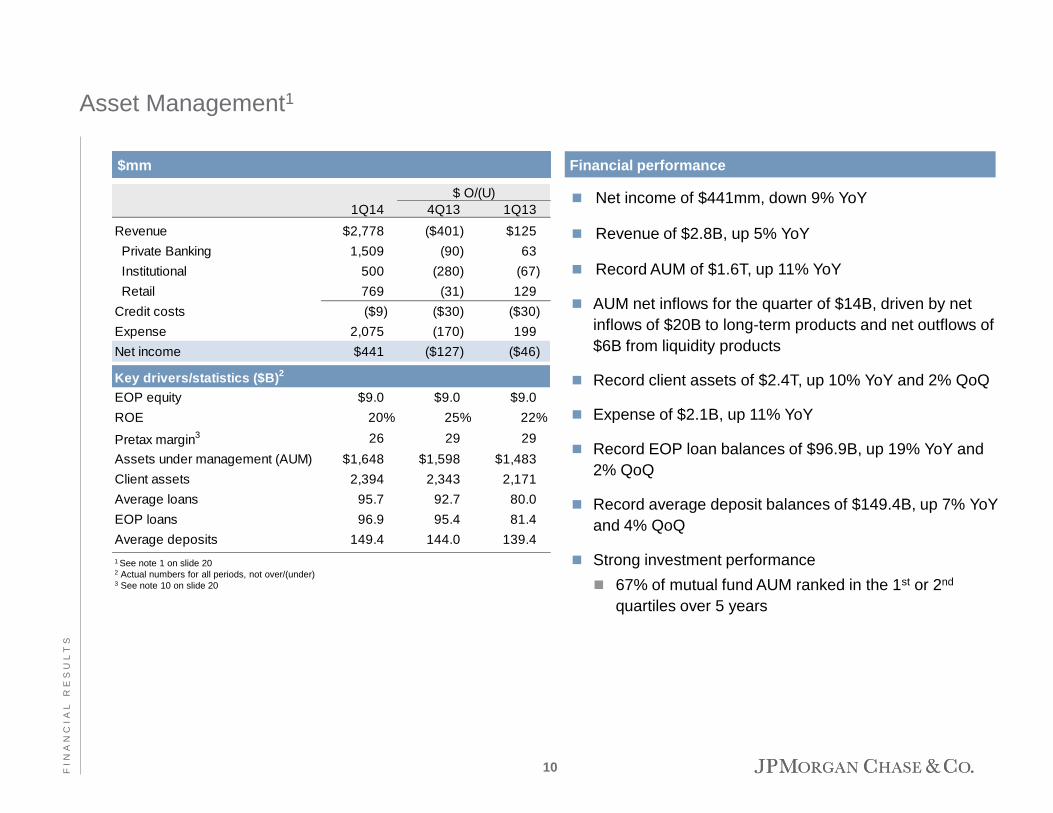
Net income of $441mm, down 9% YoY
Revenue of $2.8B, up 5% YoY
Record AUM of $1.6T, up 11% YoY
AUM net inflows for the quarter of $14B, driven by net
inflows of $20B to long-term products and net outflows of
$6B from liquidity products
Record client assets of $2.4T, up 10% YoY and 2% QoQ
Expense of $2.1B, up 11% YoY
Record EOP loan balances of $96.9B, up 19% YoY and
2% QoQ
Record average deposit balances of $149.4B, up 7% YoY
and 4% QoQ
Strong investment performance
67% of mutual fund AUM ranked in the 1st or 2nd
quartiles over 5 years
$mm
1Q14 4Q13 1Q13
Revenue $2,778 ($401) $125
Private Banking 1,509 (90) 63
Institutional 500 (280) (67)
Retail 769 (31) 129
Credit costs ($9) ($30) ($30)
Expense 2,075 (170) 199
Net income $441 ($127) ($46)
Key drivers/statistics ($B)2
EOP equity $9.0 $9.0 $9.0
ROE 20% 25% 22%
Pretax margin3 26 29 29
Assets under management (AUM) $1,648 $1,598 $1,483
Client assets 2,394 2,343 2,171
Average loans 95.7 92.7 80.0
EOP loans 96.9 95.4 81.4
Average deposits 149.4 144.0 139.4
$ O/(U)
Financial performance
10
F I N
A N
C I A
L
R E
S U
L T
S
1Q14 4Q13 1Q13
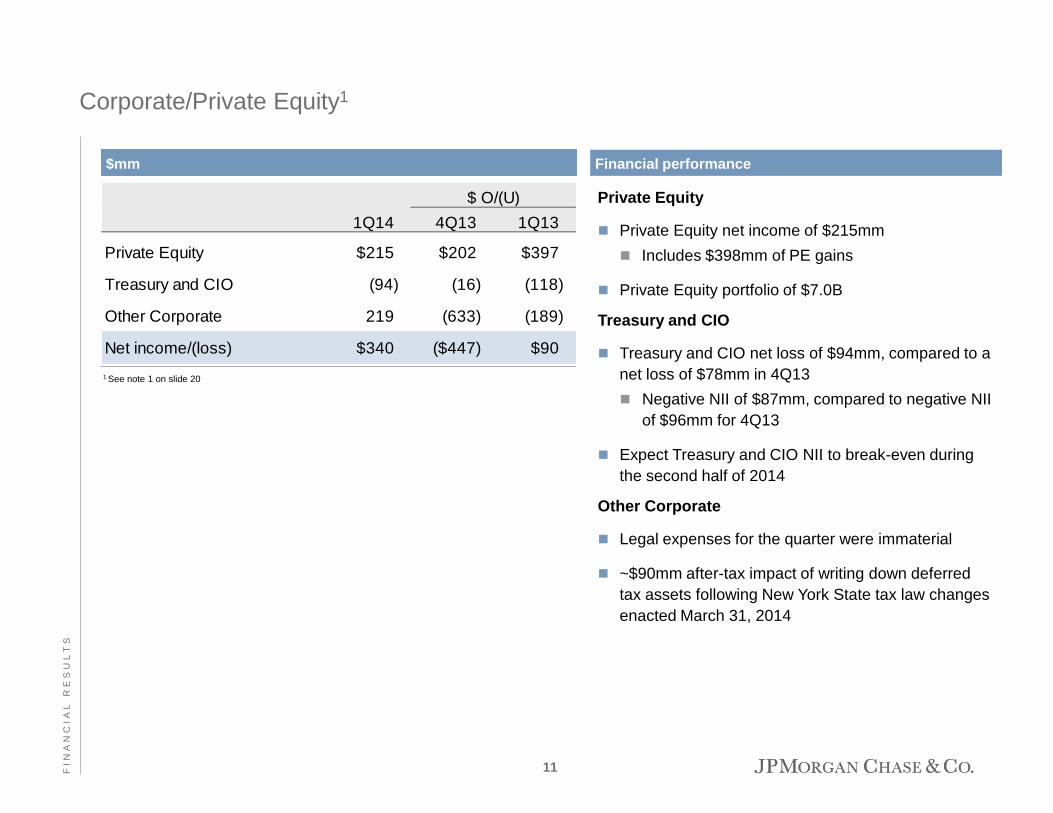
Private Equity $215 $202 $397
Treasury and CIO (94) (16) (118)
Other Corporate 219 (633) (189)
Net income/(loss) $340 ($447) $90
$ O/(U) Private Equity
Private Equity net income of $215mm
Includes $398mm of PE gains
Private Equity portfolio of $7.0B
Treasury and CIO
Treasury and CIO net loss of $94mm, compared to a
net loss of $78mm in 4Q13
Negative NII of $87mm, compared to negative NII
of $96mm for 4Q13
Expect Treasury and CIO NII to break-even during
the second half of 2014
Other Corporate
Legal expenses for the quarter were immaterial
~$90mm after-tax impact of writing down deferred
tax assets following New York State tax law changes
enacted March 31, 2014
1 See note 1 on slide 20
$mm
Corporate/Private Equity1
Financial performance
11
F I N
A N
C I A
L
R E
S U
L T
S
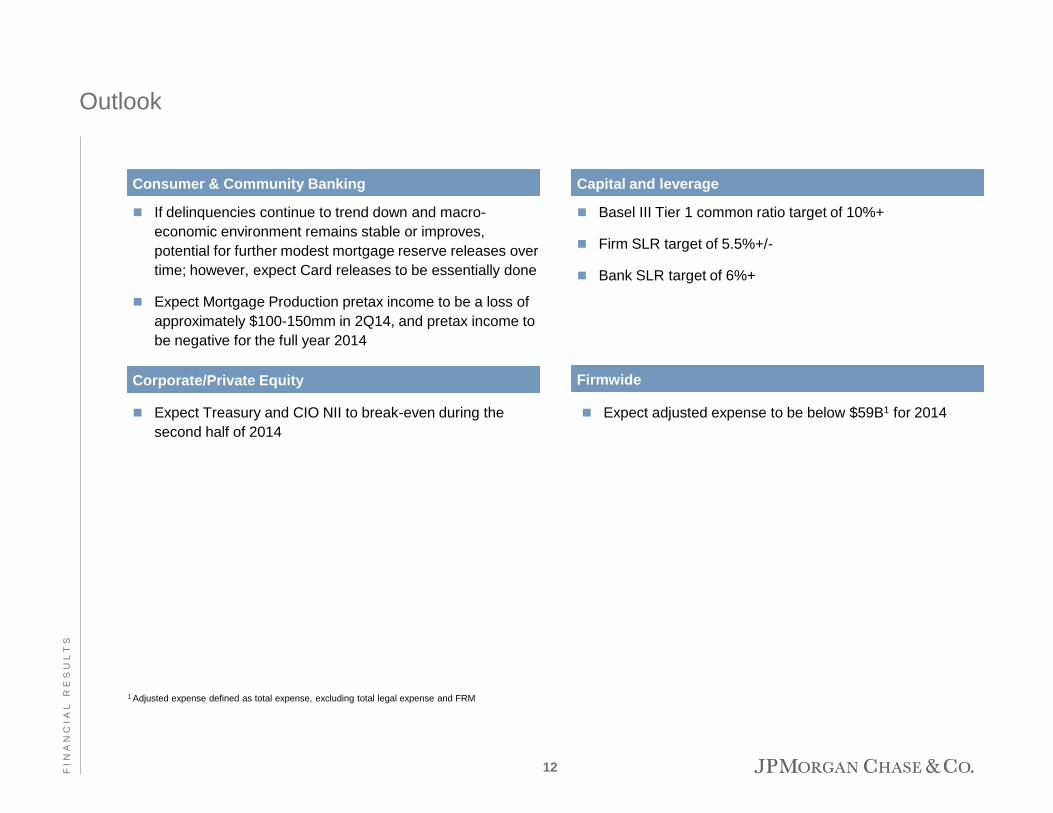
If delinquencies continue to trend down and macro-
economic environment remains stable or improves,
potential for further modest mortgage reserve releases over
time; however, expect Card releases to be essentially done
Expect Mortgage Production pretax income to be a loss of
approximately $100-150mm in 2Q14, and pretax income to
be negative for the full year 2014
Outlook
Consumer & Community Banking
Basel III Tier 1 common ratio target of 10%+
Firm SLR target of 5.5%+/-
Bank SLR target of 6%+
Capital and leverage
Corporate/Private Equity
Expect Treasury and CIO NII to break-even during the
second half of 2014
Firmwide
Expect adjusted expense to be below $59B1 for 2014
1 Adjusted expense defined as total expense, excluding total legal expense and FRM
12
Agenda
Page
F I N
A N
C I A
L
R E
S U
L T
S
13
Appendix
13
A P
P E
N D
I X
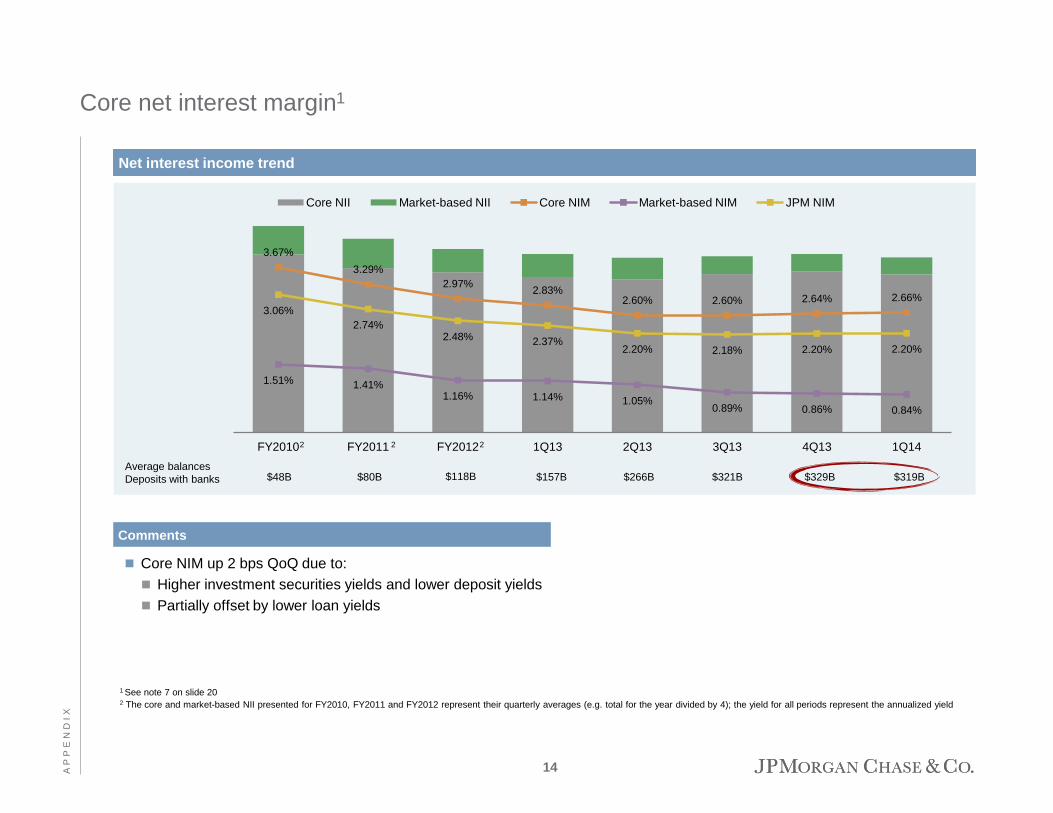
Core NIM up 2 bps QoQ due to:
Higher investment securities yields and lower deposit yields
Partially offset by lower loan yields
Core net interest margin1
1 See note 7 on slide 20 2 The core and market-based NII presented for FY2010, FY2011 and FY2012 represent their quarterly averages (e.g. total for the year divided by 4); the yield for all periods represent the annualized yield
3.67%
3.29%
2.97% 2.83%
2.60% 2.60% 2.64% 2.66%
1.51% 1.41% 1.16% 1.14% 1.05%
0.89% 0.86% 0.84%
3.06%
2.74% 2.48% 2.37%
2.20% 2.18% 2.20% 2.20%
FY2010 FY2011 FY2012 1Q13 2Q13 3Q13 4Q13 1Q14
Core NII Market-based NII Core NIM Market-based NIM JPM NIM
Net interest income trend
Comments
2
Average balances
Deposits with banks $80B $157B $266B $321B $329B $319B $48B
2
$118B
2
14
A P
P E
N D
I X
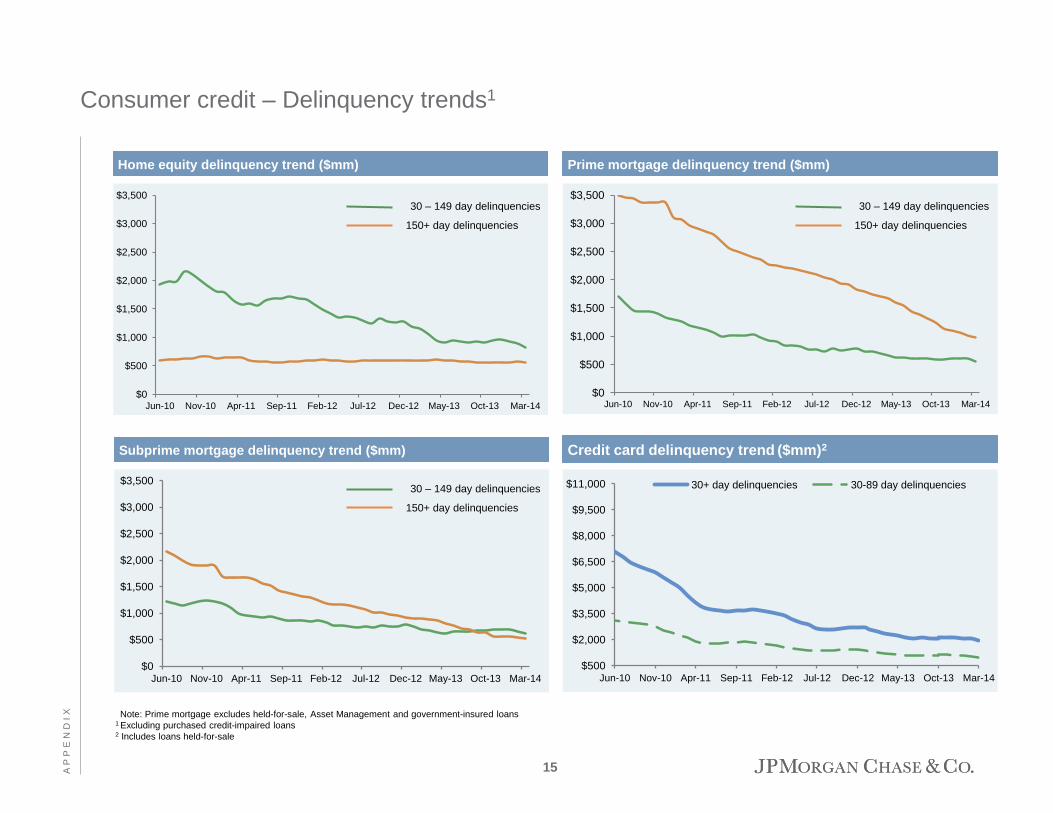
Consumer credit – Delinquency trends1
Note: Prime mortgage excludes held-for-sale, Asset Management and government-insured loans 1 Excluding purchased credit-impaired loans 2 Includes loans held-for-sale
Credit card delinquency trend ($mm)2
Prime mortgage delinquency trend ($mm) Home equity delinquency trend ($mm)
Subprime mortgage delinquency trend ($mm)
$0
$500
$1,000
$1,500
$2,000
$2,500
$3,000
$3,500
Jun-10 Nov-10 Apr-11 Sep-11 Feb-12 Jul-12 Dec-12 May-13 Oct-13 Mar-14
$0
$500
$1,000
$1,500
$2,000
$2,500
$3,000
$3,500
Jun-10 Nov-10 Apr-11 Sep-11 Feb-12 Jul-12 Dec-12 May-13 Oct-13 Mar-14
30 – 149 day delinquencies
150+ day delinquencies
30 – 149 day delinquencies
150+ day delinquencies
$0
$500
$1,000
$1,500
$2,000
$2,500
$3,000
$3,500
Jun-10 Nov-10 Apr-11 Sep-11 Feb-12 Jul-12 Dec-12 May-13 Oct-13 Mar-14
30 – 149 day delinquencies
150+ day delinquencies
$500
$2,000
$3,500
$5,000
$6,500
$8,000
$9,500
$11,000
Jun-10 Nov-10 Apr-11 Sep-11 Feb-12 Jul-12 Dec-12 May-13 Oct-13 Mar-14
30+ day delinquencies 30-89 day delinquencies
15
A P
P E
N D
I X
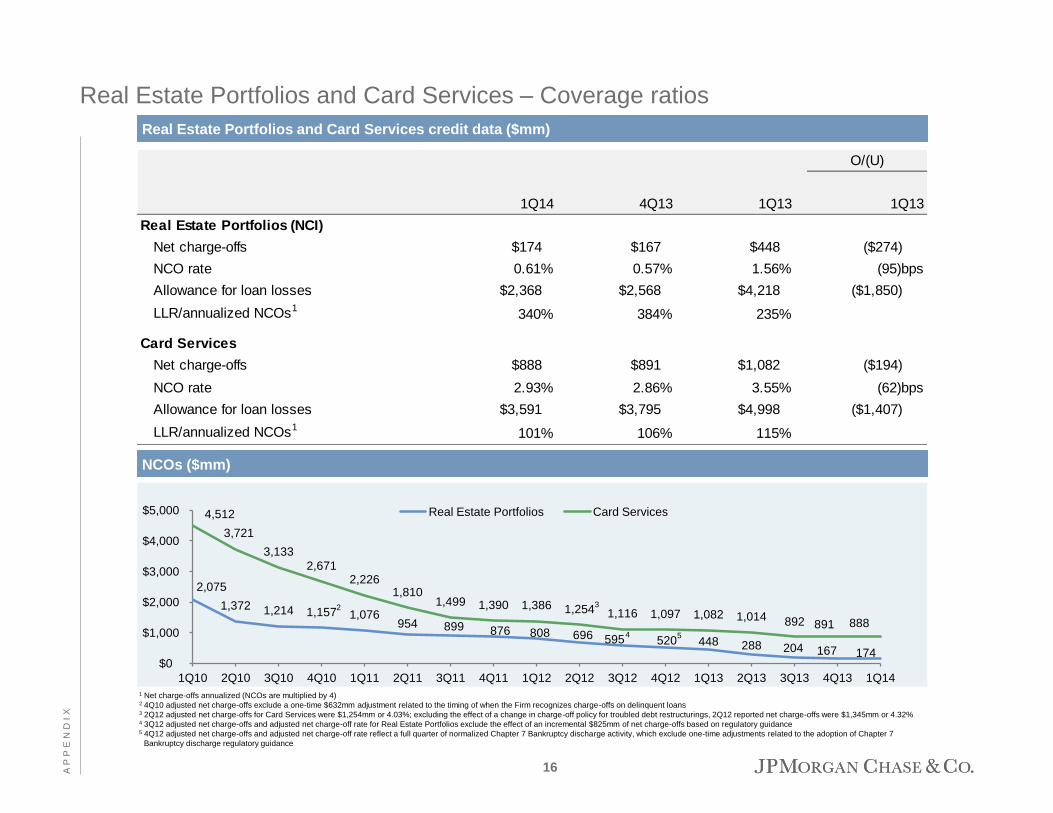
O/(U)
1Q14 4Q13 1Q13 1Q13
Real Estate Portfolios (NCI)
Net charge-offs $174 $167 $448 ($274)
NCO rate 0.61% 0.57% 1.56% (95)bps
Allowance for loan losses $2,368 $2,568 $4,218 ($1,850)
LLR/annualized NCOs1340% 384% 235%
Card Services
Net charge-offs $888 $891 $1,082 ($194)
NCO rate 2.93% 2.86% 3.55% (62)bps
Allowance for loan losses $3,591 $3,795 $4,998 ($1,407)
LLR/annualized NCOs1101% 106% 115%
Real Estate Portfolios and Card Services – Coverage ratios
Real Estate Portfolios and Card Services credit data ($mm)
1 Net charge-offs annualized (NCOs are multiplied by 4)
2 4Q10 adjusted net charge-offs exclude a one-time $632mm adjustment related to the timing of when the Firm recognizes charge-offs on delinquent loans 3 2Q12 adjusted net charge-offs for Card Services were $1,254mm or 4.03%; excluding the effect of a change in charge-off policy for troubled debt restructurings, 2Q12 reported net charge-offs were $1,345mm or 4.32% 4 3Q12 adjusted net charge-offs and adjusted net charge-off rate for Real Estate Portfolios exclude the effect of an incremental $825mm of net charge-offs based on regulatory guidance 5 4Q12 adjusted net charge-offs and adjusted net charge-off rate reflect a full quarter of normalized Chapter 7 Bankruptcy discharge activity, which exclude one-time adjustments related to the adoption of Chapter 7
Bankruptcy discharge regulatory guidance
NCOs ($mm)
2,075
1,372 1,214 1,157 1,076 954 899 876 808 696 595 520 448 288 204 167 174
4,512
3,721
3,133
2,671 2,226
1,810 1,499 1,390 1,386 1,254 1,116 1,097 1,082 1,014 892 891 888
$0
$1,000
$2,000
$3,000
$4,000
$5,000
1Q10 2Q10 3Q10 4Q10 1Q11 2Q11 3Q11 4Q11 1Q12 2Q12 3Q12 4Q12 1Q13 2Q13 3Q13 4Q13 1Q14
Real Estate Portfolios Card Services
2 3
4 5
16
A P
P E
N D
I X
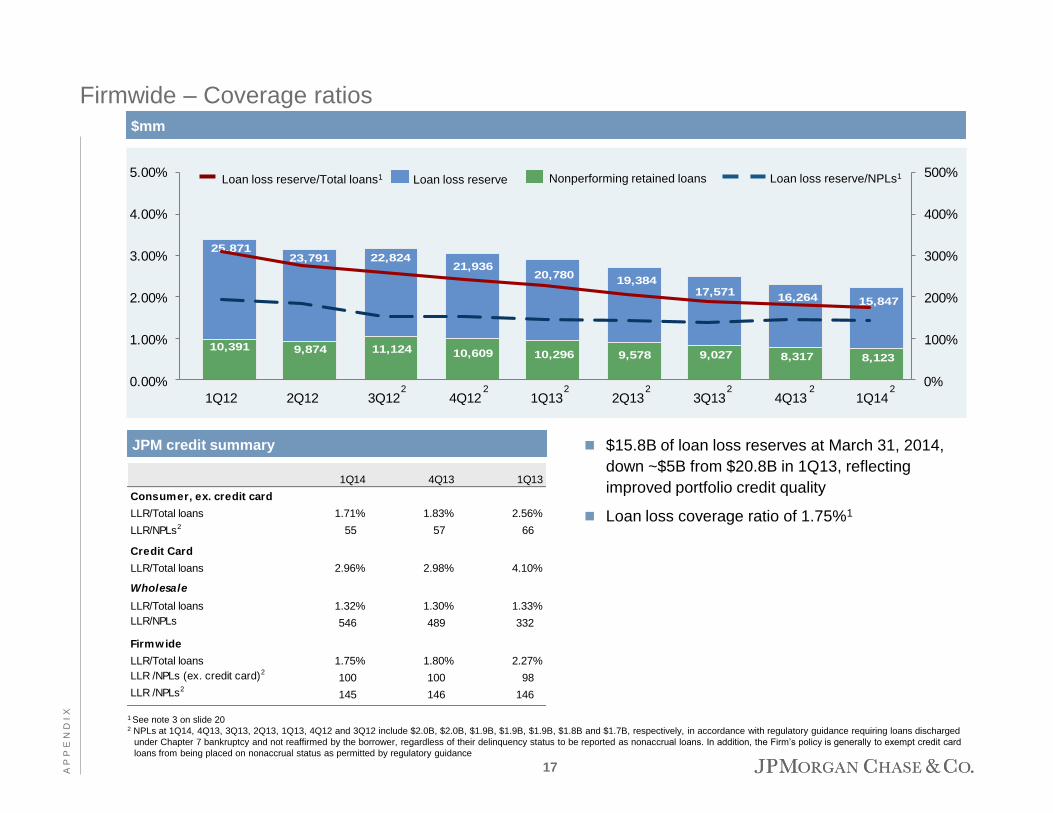
Firmwide – Coverage ratios
$15.8B of loan loss reserves at March 31, 2014,
down ~$5B from $20.8B in 1Q13, reflecting
improved portfolio credit quality
Loan loss coverage ratio of 1.75%1
1 See note 3 on slide 20 2 NPLs at 1Q14, 4Q13, 3Q13, 2Q13, 1Q13, 4Q12 and 3Q12 include $2.0B, $2.0B, $1.9B, $1.9B, $1.9B, $1.8B and $1.7B, respectively, in accordance with regulatory guidance requiring loans discharged
under Chapter 7 bankruptcy and not reaffirmed by the borrower, regardless of their delinquency status to be reported as nonaccrual loans. In addition, the Firm’s policy is generally to exempt credit card
loans from being placed on nonaccrual status as permitted by regulatory guidance
$mm
JPM credit summary
1Q14 4Q13 1Q13
Consumer, ex. credit card
LLR/Total loans 1.71% 1.83% 2.56%
LLR/NPLs2 55 57 66
Credit Card
LLR/Total loans 2.96% 2.98% 4.10%
Wholesale
LLR/Total loans 1.32% 1.30% 1.33%
LLR/NPLs 546 489 332
Firmwide
LLR/Total loans 1.75% 1.80% 2.27%
LLR /NPLs (ex. credit card)2100 100 98
LLR /NPLs2145 146 146
10,391 9,874 11,124 10,609 10,296 9,578 9,027 8,317 8,123
25,871 23,791 22,824
21,936 20,780
19,384 17,571
16,264 15,847
0.00%
1.00%
2.00%
3.00%
4.00%
5.00%
1Q12 2Q12 3Q12 4Q12 1Q13 2Q13 3Q13 4Q13 1Q14
0%
100%
200%
300%
400%
500%Loan loss reserve Nonperforming retained loans Loan loss reserve/Total loans1 Loan loss reserve/NPLs1
2 2 2 2 2 2 2
17
A P
P E
N D
I X
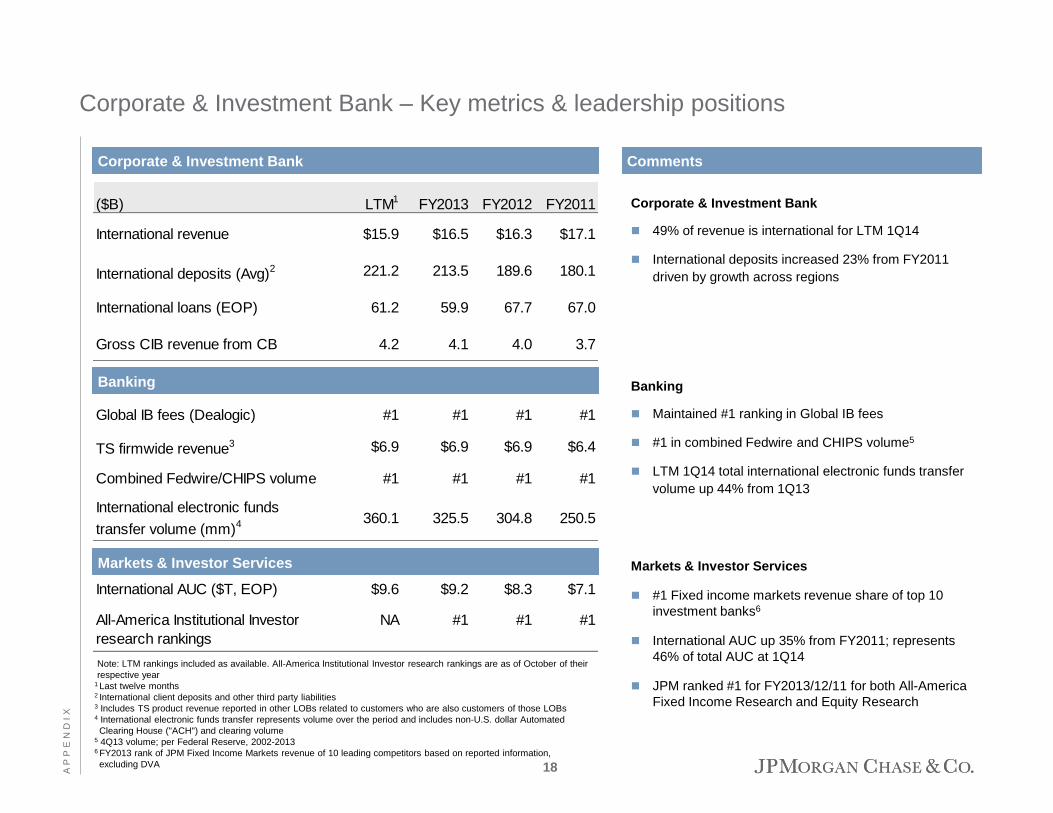
Corporate & Investment Bank – Key metrics & leadership positions
Comments
Corporate & Investment Bank
49% of revenue is international for LTM 1Q14
International deposits increased 23% from FY2011
driven by growth across regions
Banking
Maintained #1 ranking in Global IB fees
#1 in combined Fedwire and CHIPS volume5
LTM 1Q14 total international electronic funds transfer
volume up 44% from 1Q13
Markets & Investor Services
#1 Fixed income markets revenue share of top 10
investment banks6
International AUC up 35% from FY2011; represents
46% of total AUC at 1Q14
JPM ranked #1 for FY2013/12/11 for both All-America
Fixed Income Research and Equity Research
Note: LTM rankings included as available. All-America Institutional Investor research rankings are as of October of their
respective year 1 Last twelve months 2 International client deposits and other third party liabilities 3 Includes TS product revenue reported in other LOBs related to customers who are also customers of those LOBs 4 International electronic funds transfer represents volume over the period and includes non-U.S. dollar Automated
Clearing House ("ACH") and clearing volume 5 4Q13 volume; per Federal Reserve, 2002-2013 6 FY2013 rank of JPM Fixed Income Markets revenue of 10 leading competitors based on reported information,
excluding DVA
Corporate & Investment Bank
Banking
Markets & Investor Services
International AUC ($T, EOP) $9.6 $9.2 $8.3 $7.1
All-America Institutional Investor
research rankings
NA #1 #1 #1
($B) LTM1 FY2013 FY2012 FY2011
International revenue $15.9 $16.5 $16.3 $17.1
International deposits (Avg)2 221.2 213.5 189.6 180.1
International loans (EOP) 61.2 59.9 67.7 67.0
Gross CIB revenue from CB 4.2 4.1 4.0 3.7
Global IB fees (Dealogic) #1 #1 #1 #1
TS firmwide revenue3 $6.9 $6.9 $6.9 $6.4
Combined Fedwire/CHIPS volume #1 #1 #1 #1
International electronic funds
transfer volume (mm)4 360.1 325.5 304.8 250.5
18
A P
P E
N D
I X
Source: Dealogic. Global Investment Banking fees reflects ranking of fees and market share. Remainder
of rankings reflects transaction volume rank and market share. Global announced M&A is based on
transaction value at announcement; because of joint M&A assignments, M&A market share of all
participants will add up to more than 100%. All other transaction volume-based rankings are based on
proceeds, with full credit to each book manager/equal if joint 1 Global Investment Banking fees rankings exclude money market, short-term debt and shelf deals 2 Long-term debt rankings include investment-grade, high-yield, supranational, sovereigns, agencies,
covered bonds, asset-backed securities (“ABS”) and mortgage-backed securities (“MBS”); and exclude
money market, short-term debt and U.S. municipal securities 3 Global Equity and equity-related ranking includes rights offerings and Chinese A-Shares 4
Announced M&A reflects the removal of any withdrawn transactions. U.S. announced M&A represents
any U.S. involvement ranking
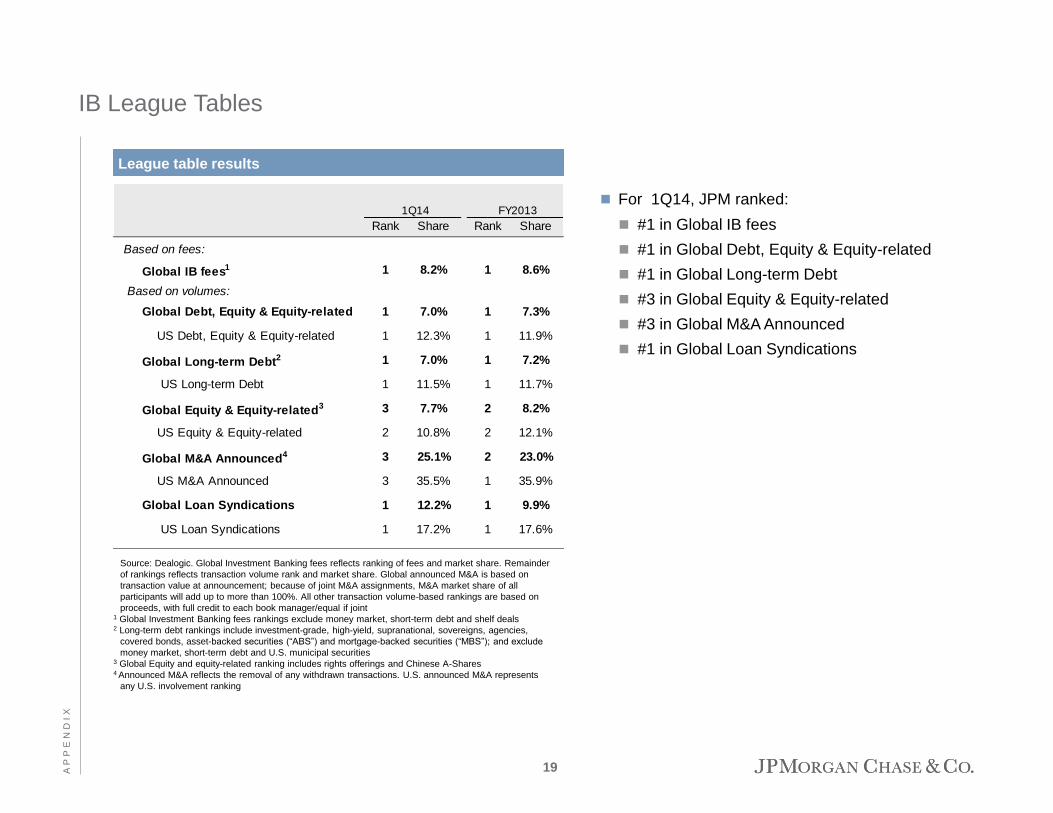
IB League Tables
For 1Q14, JPM ranked:
#1 in Global IB fees
#1 in Global Debt, Equity & Equity-related
#1 in Global Long-term Debt
#3 in Global Equity & Equity-related
#3 in Global M&A Announced
#1 in Global Loan Syndications
League table results
19
1Q14 FY2013
Rank Share Rank Share
Based on fees:
Global IB fees1 1 8.2% 1 8.6%
Based on volumes:
Global Debt, Equity & Equity-related 1 7.0% 1 7.3%
US Debt, Equity & Equity-related 1 12.3% 1 11.9%
Global Long-term Debt2 1 7.0% 1 7.2%
US Long-term Debt 1 11.5% 1 11.7%
Global Equity & Equity-related3 3 7.7% 2 8.2%
US Equity & Equity-related 2 10.8% 2 12.1%
Global M&A Announced4 3 25.1% 2 23.0%
US M&A Announced 3 35.5% 1 35.9%
Global Loan Syndications 1 12.2% 1 9.9%
US Loan Syndications 1 17.2% 1 17.6%
F I N
A N
C I A
L
R E
S U
L T
S
Notes on non-GAAP financial measures 1. In addition to analyzing the Firm’s results on a reported basis, management reviews the Firm’s results and the results of the lines of business on a “managed” basis, which is a
non-GAAP financial measure. The Firm’s definition of managed basis starts with the reported U.S. GAAP results and includes certain reclassifications to present total net revenue for the Firm (and each of the business segments) on a fully taxable-equivalent (“FTE”) basis. Accordingly, revenue from investments that receive tax credits and tax exempt securities is presented in the managed results on a basis comparable to taxable securities and investments. This non-GAAP financial measure allows management to assess the comparability of revenue arising from both taxable and tax-exempt sources. The corresponding income tax impact related to tax-exempt items is recorded within income tax expense. These adjustments have no impact on net income as reported by the Firm as a whole or by the lines of business.
2. Adjusted expense, a non-GAAP financial measure, excludes firmwide legal expense and expense related to foreclosure-related matters (“FRM”). Management believes this information helps investors understand the effect of these items on reported results and provides an alternate presentation of the Firm’s performance.
3. The ratio of the allowance for loan losses to end-of-period loans excludes the following: loans accounted for at fair value and loans held-for-sale; purchased credit-impaired (“PCI”) loans; and the allowance for loan losses related to PCI loans. Additionally, Real Estate Portfolios net charge-offs and net charge-off rates exclude the impact of PCI loans.
4. Tangible common equity (“TCE”), return on tangible common equity (“ROTCE”) and tangible book value per share (“TBVPS”), are each non-GAAP financial measures. TCE represents the Firm’s common stockholders’ equity (i.e., total stockholders’ equity less preferred stock) less goodwill and identifiable intangible assets (other than MSRs), net of related deferred tax liabilities. ROTCE measures the Firm’s earnings as a percentage of TCE. TBVPS represents the Firm’s tangible common equity divided by period-end common shares. TCE, ROTCE, and TBVPS are meaningful to the Firm, as well as analysts and investors in assessing the Firm’s use of equity and are used in facilitating comparisons of the Firm with competitors.
5. Basel III rules under the transitional Standardized Approach became effective on January 1, 2014. The Firm presents the following non-GAAP measures: Tier 1 common capital, risk-weighted assets (“RWA”) and return on RWA, and the Tier 1 common ratio under the Basel III Advanced Fully Phased-In rules, and the supplementary leverage ratio (“SLR”) under Basel III rules. These measures are used by management, bank regulators, investors and analysts to assess and monitor the Firm’s capital position. For additional information on these measures, see Regulatory capital on pages 161-165 of JPMorgan Chase & Co.’s Annual Report on Form 10-K for the year ended December 31, 2013.
6. Within Consumer & Community Banking, Card, Merchant Services and Auto presents its change in net income excluding the change in the allowance for loan losses (assuming a tax rate of 38%). This non-GAAP financial measure is used by management to facilitate a more meaningful comparison with prior periods.
7. In addition to reviewing JPMorgan Chase's net interest income on a managed basis, management also reviews core net interest income to assess the performance of its core lending, investing (including asset-liability management) and deposit-raising activities (which excludes the impact of Corporate & Investment Bank's ("CIB") market-based activities). The core net interest income data presented are non-GAAP financial measures due to the exclusion of CIB’s market-based net interest income and the related assets. Management believes this exclusion provides investors and analysts a more meaningful measure by which to analyze the non-market-related business trends of the Firm and provides a comparable measure to other financial institutions that are primarily focused on core lending, investing and deposit-raising activities.
8. The CIB provides certain non-GAAP financial measures, as such measures are used by management to assess the underlying performance of the business and for comparability with peers: The ratio for the allowance for loan losses to end-of-period loans is calculated excluding the impact of consolidated Firm-administered multi-seller conduits and trade
finance loans, to provide a more meaningful assessment of CIB’s allowance coverage ratio. Prior to January 1, 2014, the CIB provided several non-GAAP financial measures excluding the impact of FVA (effective fourth quarter 2013) and DVA on: net
revenue, net income, compensation and overhead ratios, and return on equity. Beginning in the first quarter 2014, the Firm does not exclude FVA and DVA from its assessment of business performance; however, the Firm continues to present these non-GAAP measures for the periods prior to January 1, 2014, as they reflected how management assessed the underlying business performance of the CIB in those prior periods.
Additional notes on financial measures 9. Headcount-related expense includes salary and benefits (excluding performance-based incentives), and other non-compensation costs related to employees.
10. Pretax margin represents income before income tax expense divided by total net revenue, which is, in management’s view, a comprehensive measure of pretax performance
derived by measuring earnings after all costs are taken into consideration; it is, therefore, another basis that management uses to evaluate the performance of AM against the performance of its peers.
11. A household is a collection of individuals or entities aggregated together by name, address, tax identifier and phone. CBB households are households that have a personal or business deposit, personal investment or business credit relationship with Chase. Reported on a one-month lag.
Notes
20
F I N
A N
C I A
L
R E
S U
L T
S
Forward-looking statements
This presentation contains forward-looking statements within the meaning of the Private Securities
Litigation Reform Act of 1995. These statements are based on the current beliefs and expectations of
JPMorgan Chase & Co.’s management and are subject to significant risks and uncertainties. Actual results
may differ from those set forth in the forward-looking statements. Factors that could cause JPMorgan
Chase & Co.’s actual results to differ materially from those described in the forward-looking statements can
be found in JPMorgan Chase & Co.’s Annual Report on Form 10-K for the year ended December 31, 2013,
which has been filed with the Securities and Exchange Commission and is available on JPMorgan Chase &
Co.’s website (http://investor.shareholder.com/jpmorganchase), and on the Securities and Exchange
Commission’s website (www.sec.gov). JPMorgan Chase & Co. does not undertake to update the forward-
looking statements to reflect the impact of circumstances or events that may arise after the date of the
forward-looking statements.
21