Embed Size (px)
Citation preview
Confidential and Proprietary Innovation & Culture
www.jusung.com
240 Opo-ro, Opo-eup, Gwangju-si
Gyeonggi-do, Korea
World 1St Technology
Only 1 In The World
JUSUNG ENGINEERING
ASIA NDR
0
JUNE 13 ~ 16, 2016
Confidential and Proprietary Innovation & Culture
Disclaimer
All information regarding management performance and financial results of JUSUNG ENGINEERING (the “Company”)
during the 1st quarter of 2016 as contained herein has been prepared on a Non-consolidated basis in accordance with
International Financial Reporting Standards (“IFRS”).
The information regarding results of 1st quarter of 2016 has been prepared in advance, prior to being reviewed by
outside auditors, solely for the convenience of investors of the Company, and is subject to change in the process of
final reviewing by external auditors.
The information contained herein includes forward-looking statements in respect to future plans, prospects, and
performances of the Company. These forward-looking statements also refer to the Company’s performance on Non-
consolidated base, as indicated.
The aforementioned forward-looking statements are influenced by changes in the management environment and
relative events, and by their nature, these statements refer to uncertain circumstances. Consequently, due to these
uncertainties, the Company’s actual future results may differ materially from those expressed or implied by such
statements.
Please note that as the forward-looking statements contained herein are based on the current market situation and
the Company’s management direction, they are subject to change according to the changes in future market
environment and business strategy.
The information contained herein should not be utilized for any legal purposes in regards to investors’ investment
results. The Company hereby expressly disclaims any and all liability for any loss or damage resulting from the
investors’ reliance on the information contained herein.
1
Confidential and Proprietary Innovation & Culture 2
Table of Contents
1. Company Overview
2. Market Trend & Competitiveness
3. Financial Status
Confidential and Proprietary Innovation & Culture
1-1. Vision
Culture Spirit
Innovate Technology!
Create New Industry!
Make Happiness!
3
Confidential and Proprietary Innovation & Culture
1-2. Mission
First Mover & Market Developer
Semiconductor, Display, Solar Cell Technology Integration
World’s 1 Technology
Only 1 in the World
st
4
Confidential and Proprietary Innovation & Culture
1-3. Spirit & Culture
Think for the First !
Work for the No.1 !
Make New Records !
1. Creative · Innovative People
5
2. Success-Sharing Culture
Mutual Success of JUSUNG & Its
Customer
Confidential and Proprietary Innovation & Culture 6
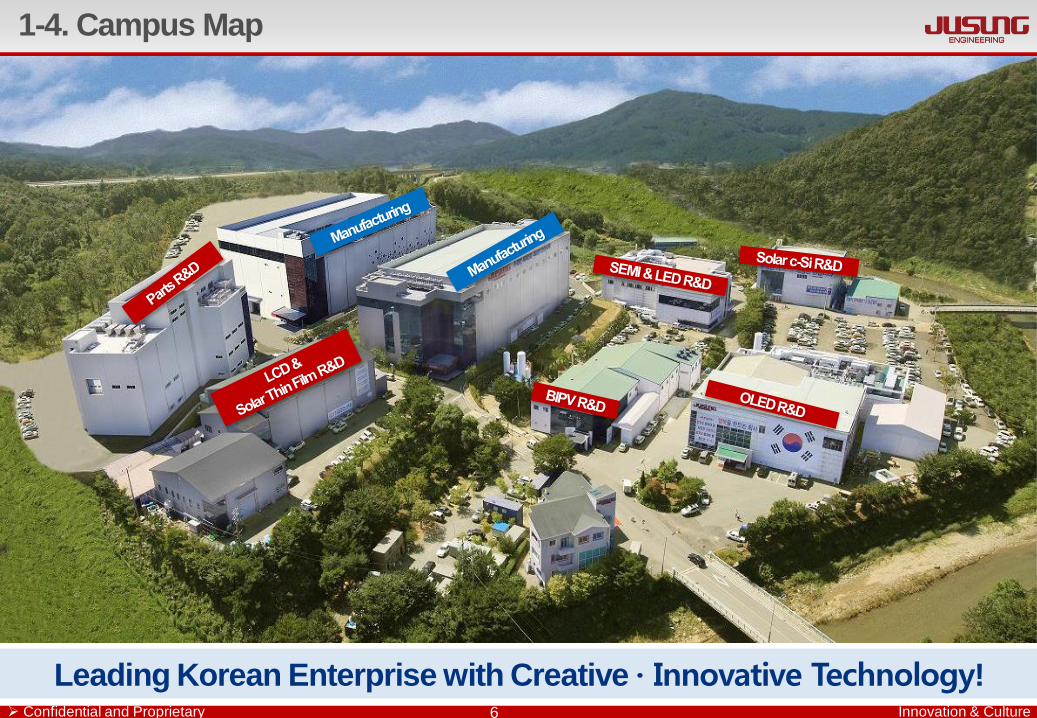
1-4. Campus Map
Leading Korean Enterprise with Creative · Innovative Technology!
Confidential and Proprietary Innovation & Culture
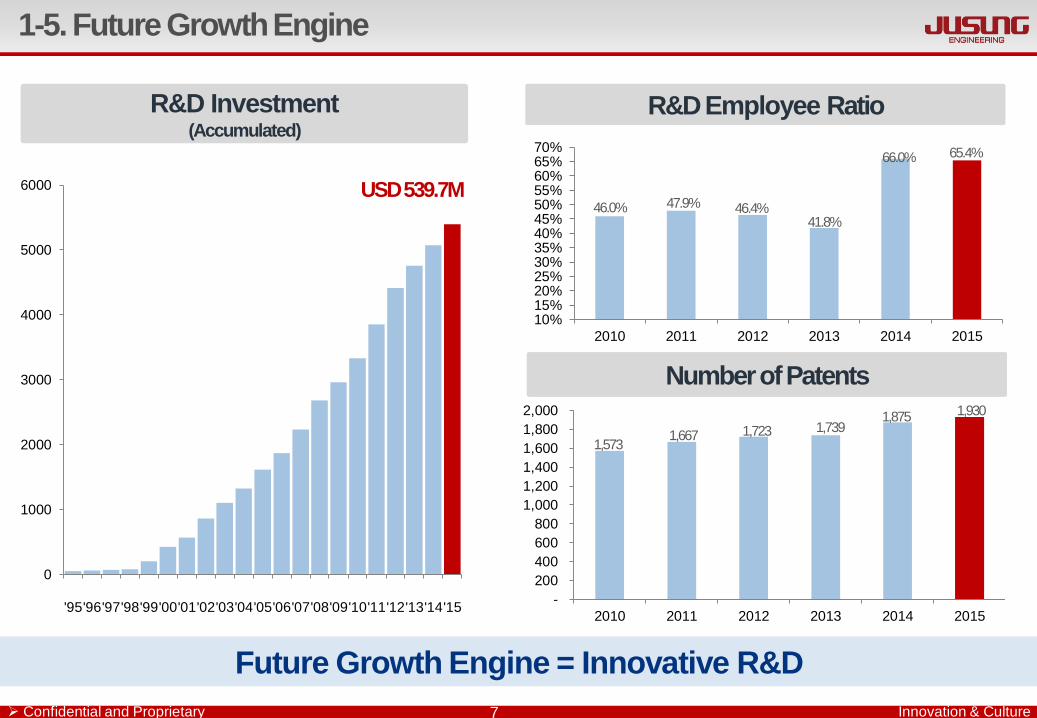
1-5. Future Growth Engine
Future Growth Engine = Innovative R&D
7
R&D Employee Ratio
USD 539.7M
Number of Patents
R&D Investment (Accumulated)
Number of Patents
0
1000
2000
3000
4000
5000
6000
'95'96'97'98'99'00'01'02'03'04'05'06'07'08'09'10'11'12'13'14'15
46.0% 47.9% 46.4% 41.8%
66.0% 65.4%
10%15%20%25%30%35%40%45%50%55%60%65%70%
2010 2011 2012 2013 2014 2015
1,573 1,667 1,723 1,739
1,875 1,930
-
200
400
600
800
1,000
1,200
1,400
1,600
1,800
2,000
2010 2011 2012 2013 2014 2015
Confidential and Proprietary Innovation & Culture
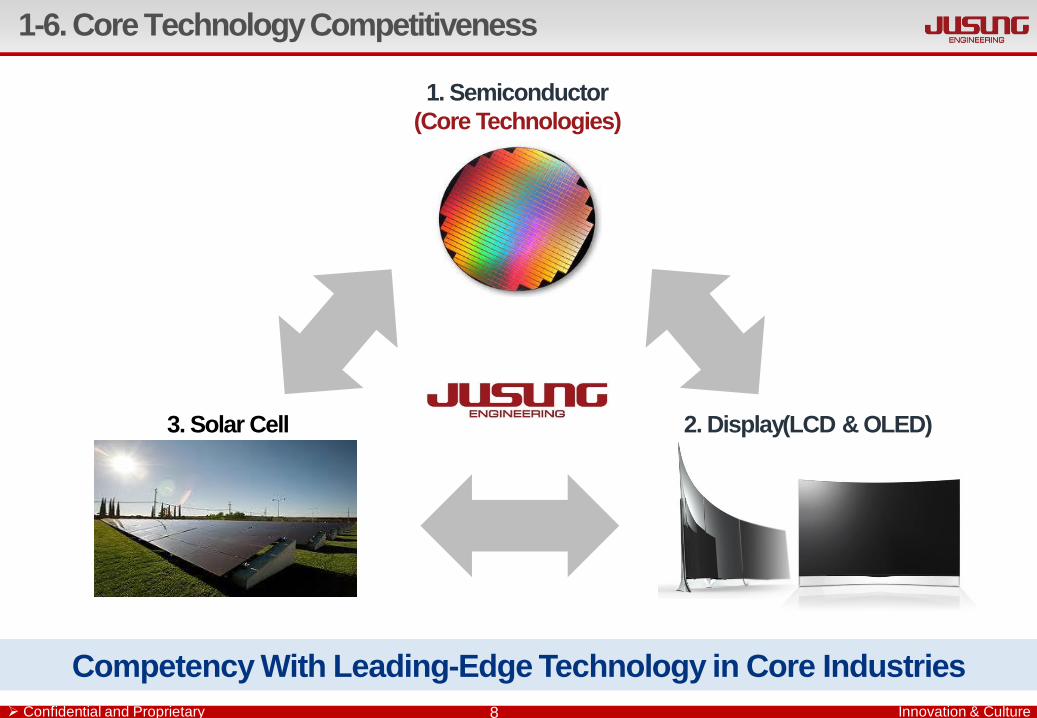
1-6. Core Technology Competitiveness
Competency With Leading-Edge Technology in Core Industries
8
1. Semiconductor
(Core Technologies)
3. Solar Cell 2. Display(LCD & OLED)
Confidential and Proprietary Innovation & Culture
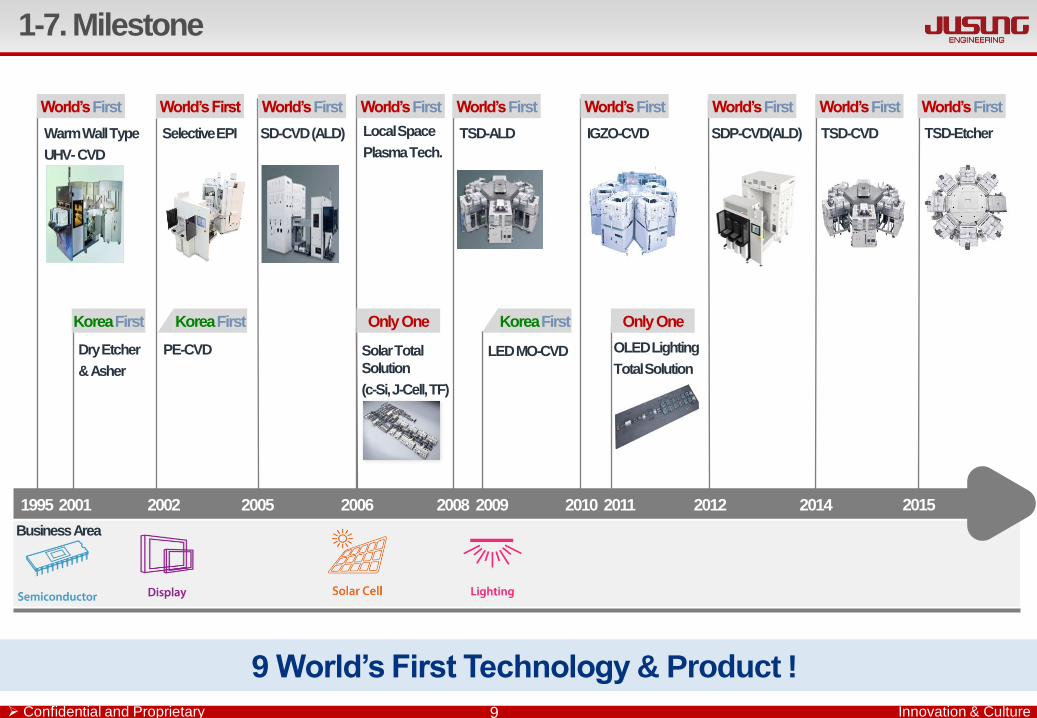
9 World’s First Technology & Product !
1-7. Milestone
9
Korea First
1995 2001 2002 2005 2006 2009 2010 2011 2012 2014
World’s First
Warm Wall Type
UHV- CVD
Korea First
Dry Etcher
& Asher
World’s First
Selective EPI
PE-CVD
World’s First
SD-CVD (ALD)
World’s First
Local Space
Plasma Tech.
Korea First
LED MO-CVD
World’s First
IGZO-CVD
OLED Lighting
Total Solution
World’s First
SDP-CVD(ALD)
World’s First
TSD-ALD
World’s First
TSD-CVD
Business Area
Solar Total
Solution
(c-Si, J-Cell, TF)
Only One Only One
2015
World’s First
TSD-Etcher
2008
Confidential and Proprietary Innovation & Culture
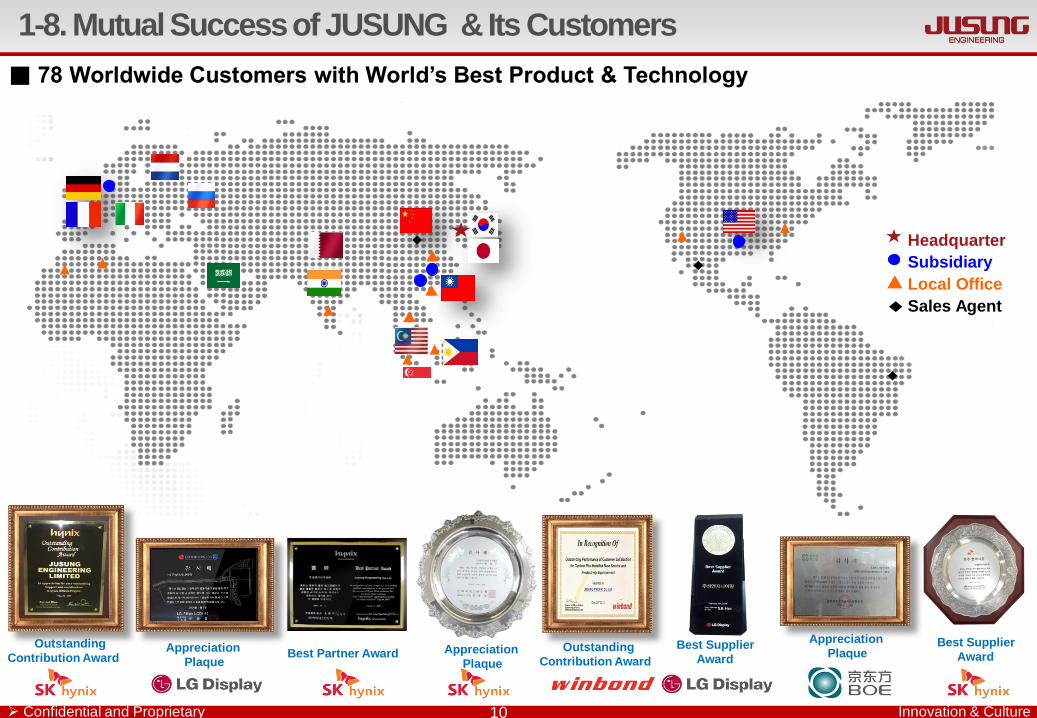
1-8. Mutual Success of JUSUNG & Its Customers
■ 78 Worldwide Customers with World’s Best Product & Technology
Outstanding
Contribution Award Best Partner Award Best Supplier
Award Outstanding
Contribution Award
◆
◆
◆
10
Headquarter
Subsidiary
Local Office
Sales Agent
Appreciation
Plaque Appreciation
Plaque
Appreciation
Plaque Best Supplier
Award

Confidential and Proprietary Innovation & Culture 11
Table of Contents
1. Company Overview
2. Market Trend & Competitiveness
3. Financial Status
Confidential and Proprietary Innovation & Culture
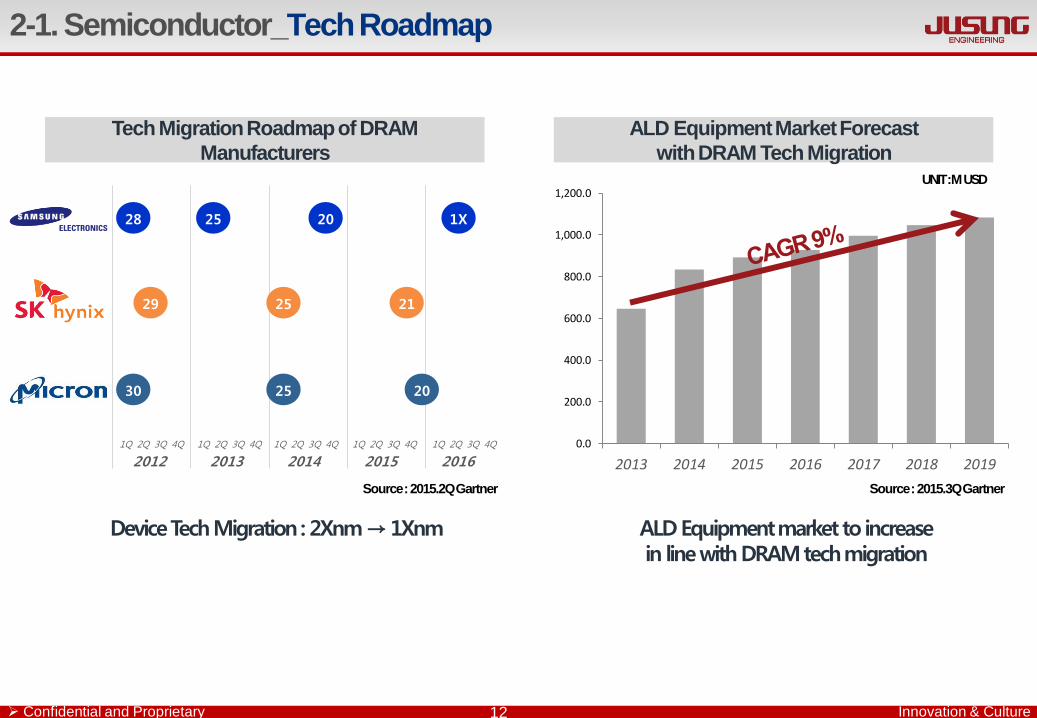
2-1. Semiconductor_Tech Roadmap
12
Tech Migration Roadmap of DRAM
Manufacturers
ALD Equipment market to increase in line with DRAM tech migration
Device Tech Migration : 2Xnm → 1Xnm
2012 2013 2014 2015 2016
1Q 2Q 3Q 4Q 1Q 2Q 3Q 4Q 1Q 2Q 3Q 4Q 1Q 2Q 3Q 4Q 1Q 2Q 3Q 4Q
28 25 20 1X
29 25 21
30 25 20
ALD Equipment Market Forecast
with DRAM Tech Migration
0.0
200.0
400.0
600.0
800.0
1,000.0
1,200.0
2013 2014 2015 2016 2017 2018 2019
UNIT : M USD
Source : 2015.3Q Gartner Source : 2015.2Q Gartner
Confidential and Proprietary Innovation & Culture
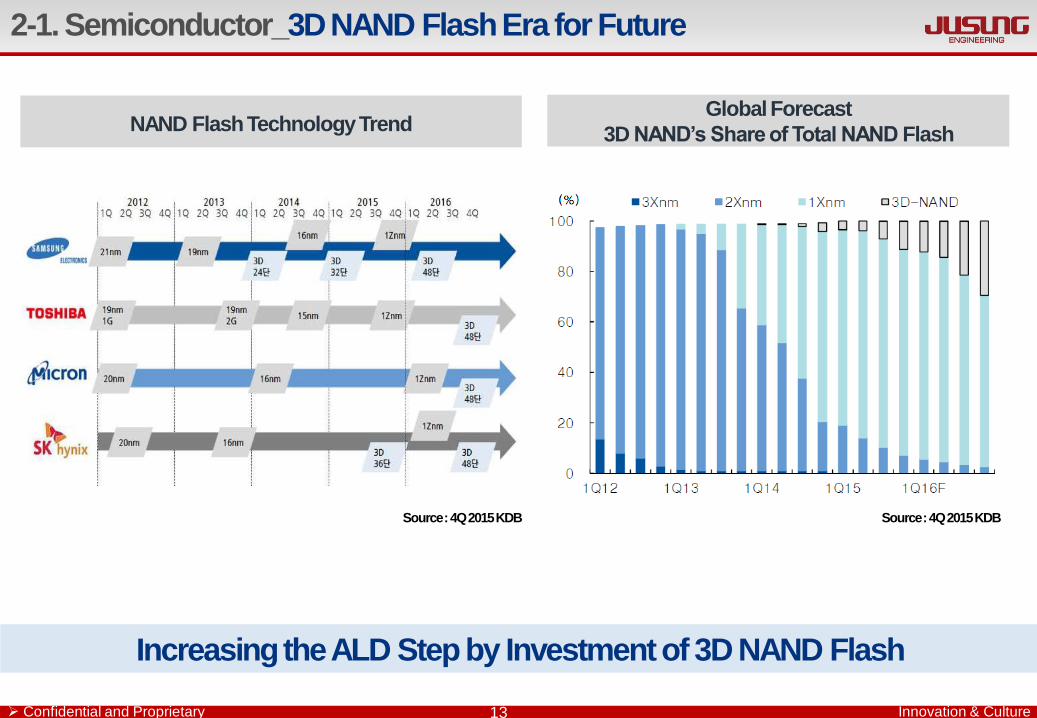
Increasing the ALD Step by Investment of 3D NAND Flash
2-1. Semiconductor_3D NAND Flash Era for Future
NAND Flash Technology Trend Global Forecast
3D NAND’s Share of Total NAND Flash
13
Source : 4Q 2015 KDB Source : 4Q 2015 KDB
Confidential and Proprietary Innovation & Culture
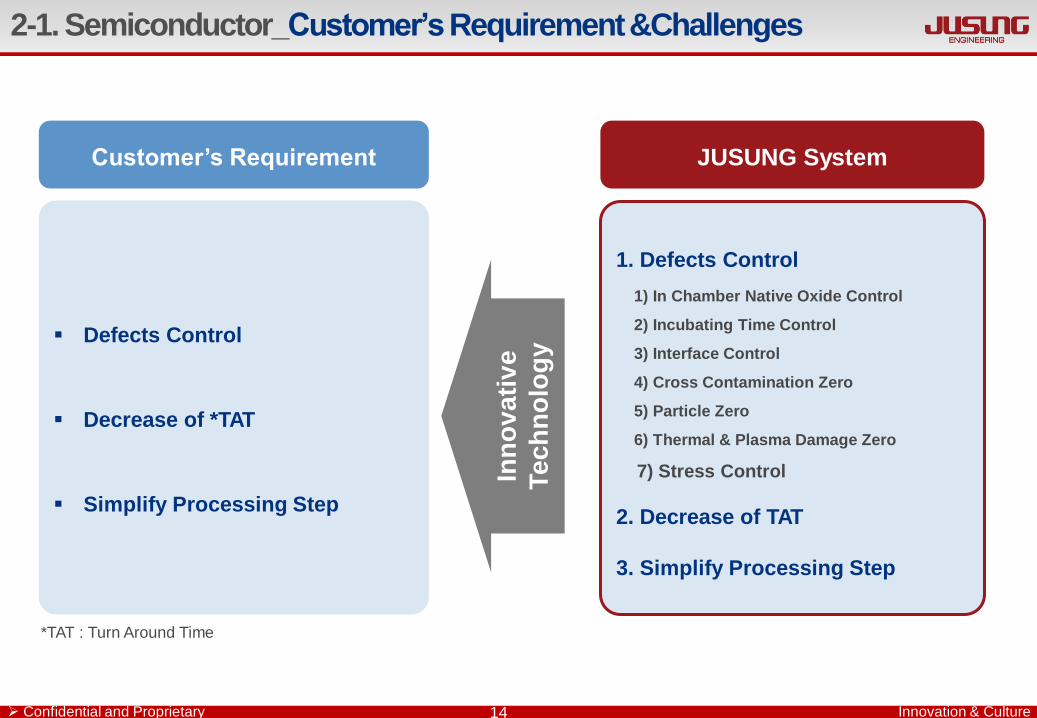
Defects Control
Decrease of *TAT
Simplify Processing Step
Customer’s Requirement JUSUNG System
1. Defects Control
1) In Chamber Native Oxide Control
2) Incubating Time Control
3) Interface Control
4) Cross Contamination Zero
5) Particle Zero
6) Thermal & Plasma Damage Zero
7) Stress Control
2. Decrease of TAT
3. Simplify Processing Step
Inn
ov
ati
ve
Tech
no
log
y
2-1. Semiconductor_Customer’s Requirement &Challenges
*TAT : Turn Around Time
14
Confidential and Proprietary Innovation & Culture 15
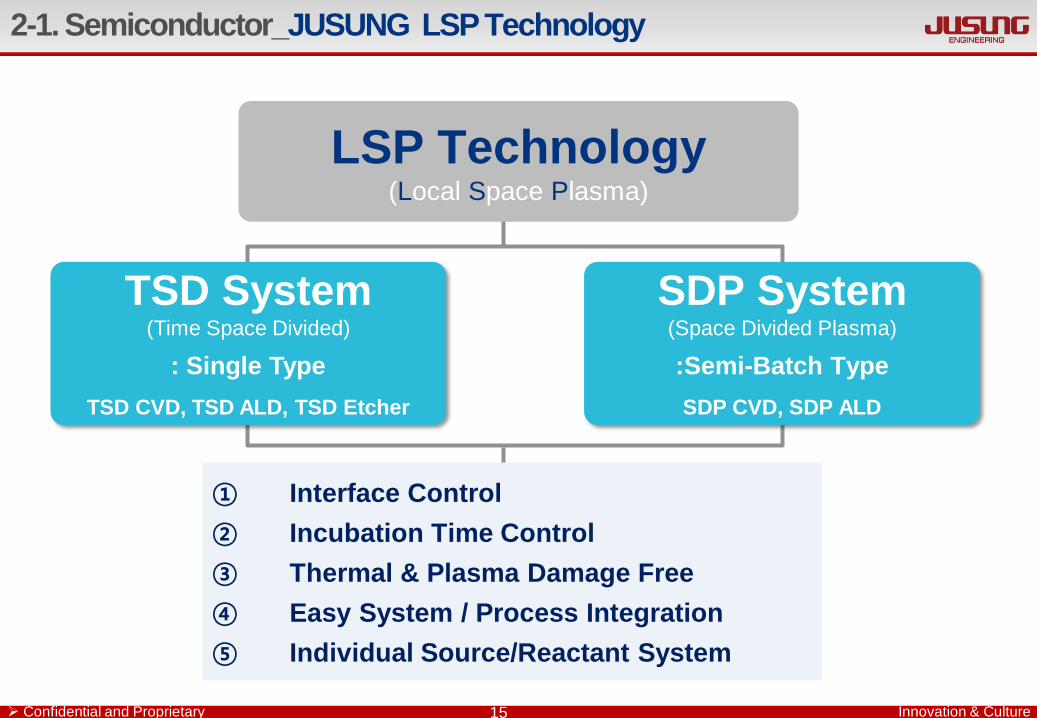
2-1. Semiconductor_JUSUNG LSP Technology
LSP Technology (Local Space Plasma)
① Interface Control
② Incubation Time Control
③ Thermal & Plasma Damage Free
④ Easy System / Process Integration
⑤ Individual Source/Reactant System
SDP System (Space Divided Plasma)
:Semi-Batch Type
SDP CVD, SDP ALD
TSD System (Time Space Divided)
: Single Type
TSD CVD, TSD ALD, TSD Etcher
Confidential and Proprietary Innovation & Culture
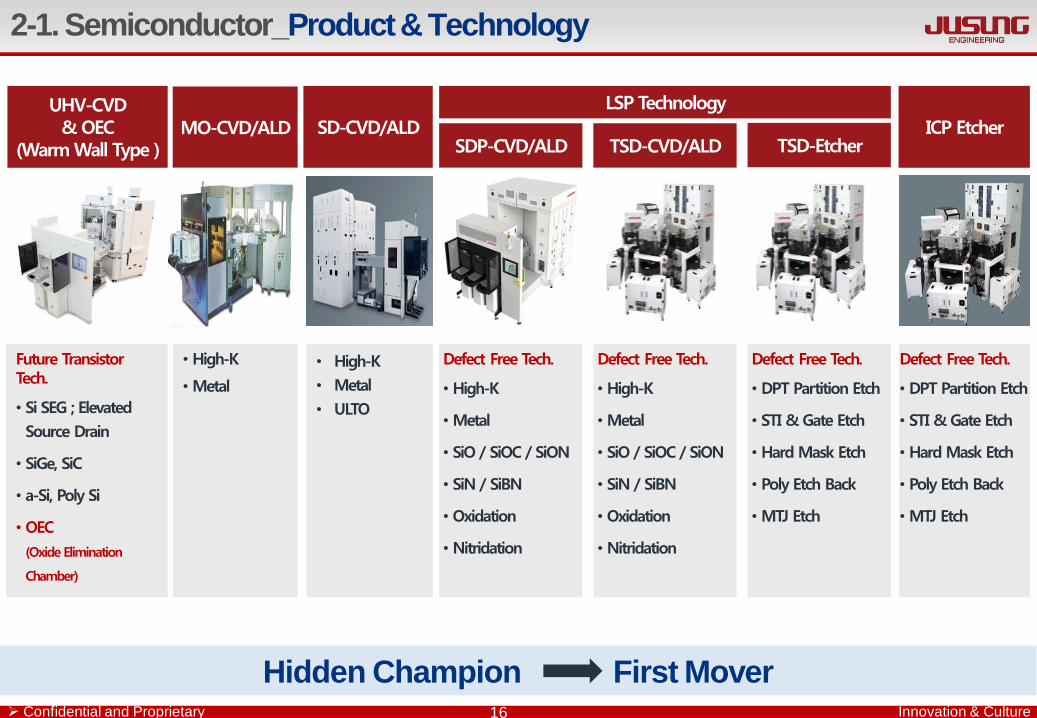
Hidden Champion First Mover
2-1. Semiconductor_Product & Technology
16
Future Transistor Tech.
• Si SEG ; Elevated
Source Drain
• SiGe, SiC
• a-Si, Poly Si
• OEC
(Oxide Elimination
Chamber)
UHV-CVD & OEC
(Warm Wall Type )
LSP Technology
• High-K
• Metal
• ULTO
Defect Free Tech.
• High-K
• Metal
• SiO / SiOC / SiON
• SiN / SiBN
• Oxidation
• Nitridation
• High-K
• Metal
ICP Etcher SDP-CVD/ALD TSD-CVD/ALD
Defect Free Tech.
• High-K
• Metal
• SiO / SiOC / SiON
• SiN / SiBN
• Oxidation
• Nitridation
SD-CVD/ALD MO-CVD/ALD TSD-Etcher
Defect Free Tech.
• DPT Partition Etch
• STI & Gate Etch
• Hard Mask Etch
• Poly Etch Back
• MTJ Etch
Defect Free Tech.
• DPT Partition Etch
• STI & Gate Etch
• Hard Mask Etch
• Poly Etch Back
• MTJ Etch
Confidential and Proprietary Innovation & Culture
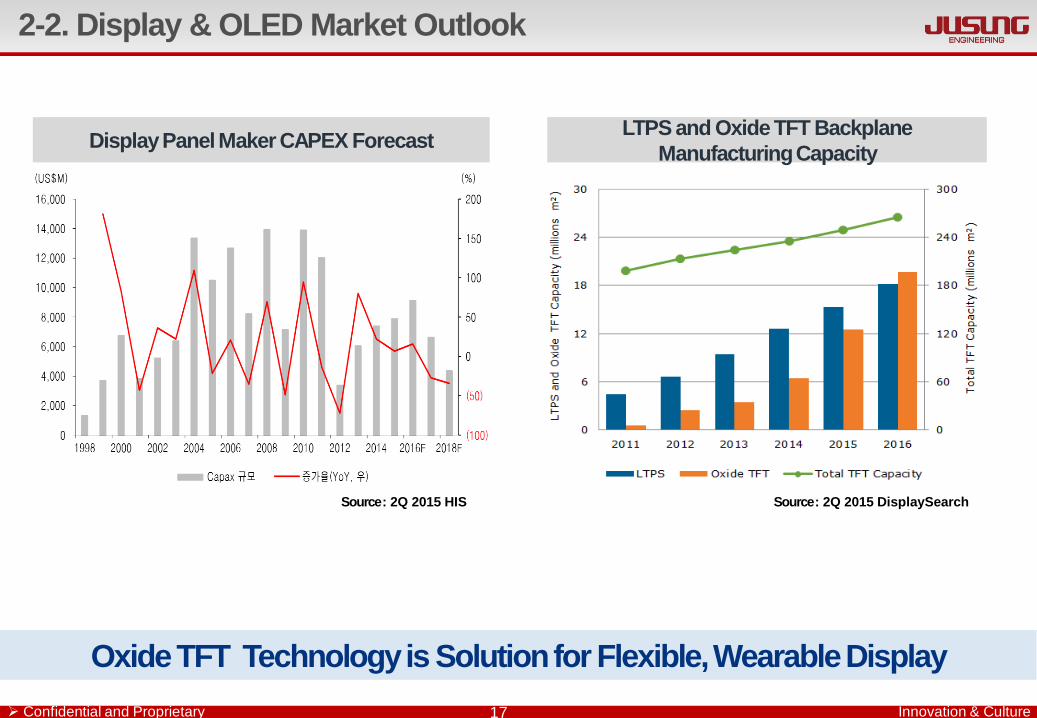
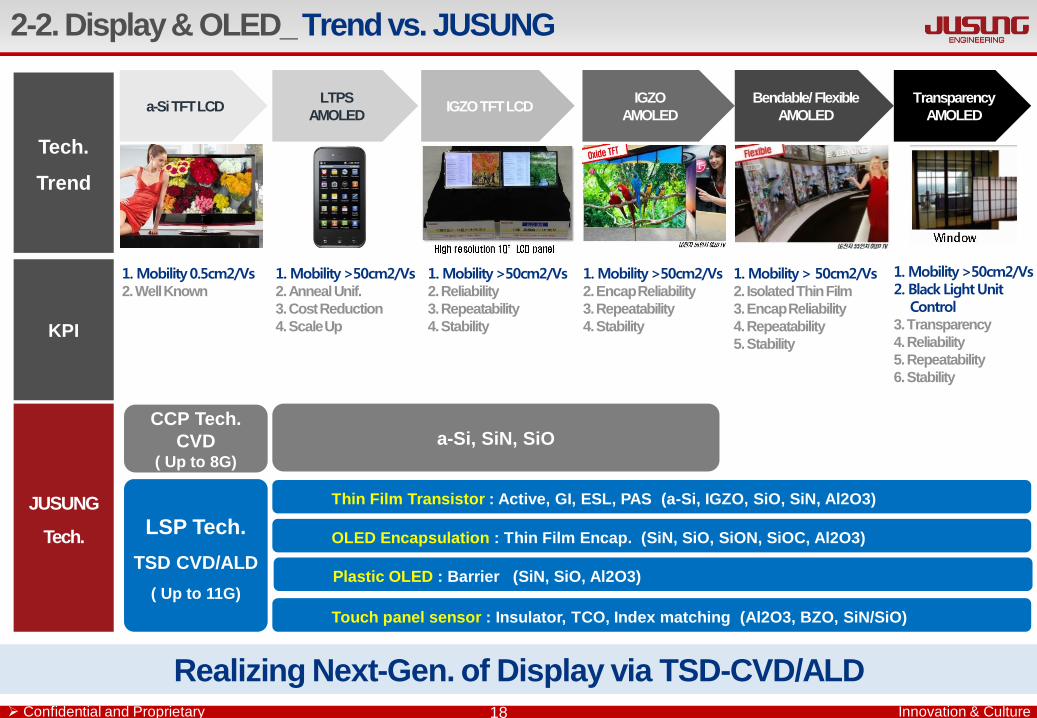
2-2. Display & OLED Market Outlook
17
Oxide TFT Technology is Solution for Flexible, Wearable Display
LTPS and Oxide TFT Backplane
Manufacturing Capacity Display Panel Maker CAPEX Forecast
Source : 2Q 2015 HIS Source : 2Q 2015 DisplaySearch
Confidential and Proprietary Innovation & Culture
Realizing Next-Gen. of Display via TSD-CVD/ALD
a-Si TFT LCD IGZO TFT LCD IGZO
AMOLED
Bendable/ Flexible
AMOLED
Transparency
AMOLED
Tech.
Trend
KPI
LTPS
AMOLED
1. Mobility 0.5cm2/Vs 2. Well Known
1. Mobility >50cm2/Vs 2. Anneal Unif.
3. Cost Reduction
4. Scale Up
1. Mobility >50cm2/Vs 2. Reliability
3. Repeatability
4. Stability
1. Mobility >50cm2/Vs 2. Encap Reliability
3. Repeatability
4. Stability
1. Mobility > 50cm2/Vs 2. Isolated Thin Film
3. Encap Reliability
4. Repeatability
5. Stability
1. Mobility >50cm2/Vs 2. Black Light Unit Control 3. Transparency
4. Reliability
5. Repeatability
6. Stability
2-2. Display & OLED_ Trend vs. JUSUNG
18
JUSUNG
Tech.
a-Si, SiN, SiO
OLED Encapsulation : Thin Film Encap. (SiN, SiO, SiON, SiOC, Al2O3)
Touch panel sensor : Insulator, TCO, Index matching (Al2O3, BZO, SiN/SiO)
LSP Tech.
TSD CVD/ALD
( Up to 11G)
CCP Tech.
CVD ( Up to 8G)
Thin Film Transistor : Active, GI, ESL, PAS (a-Si, IGZO, SiO, SiN, Al2O3)
Plastic OLED : Barrier (SiN, SiO, Al2O3)
Confidential and Proprietary Innovation & Culture
First Mover & Market Developer
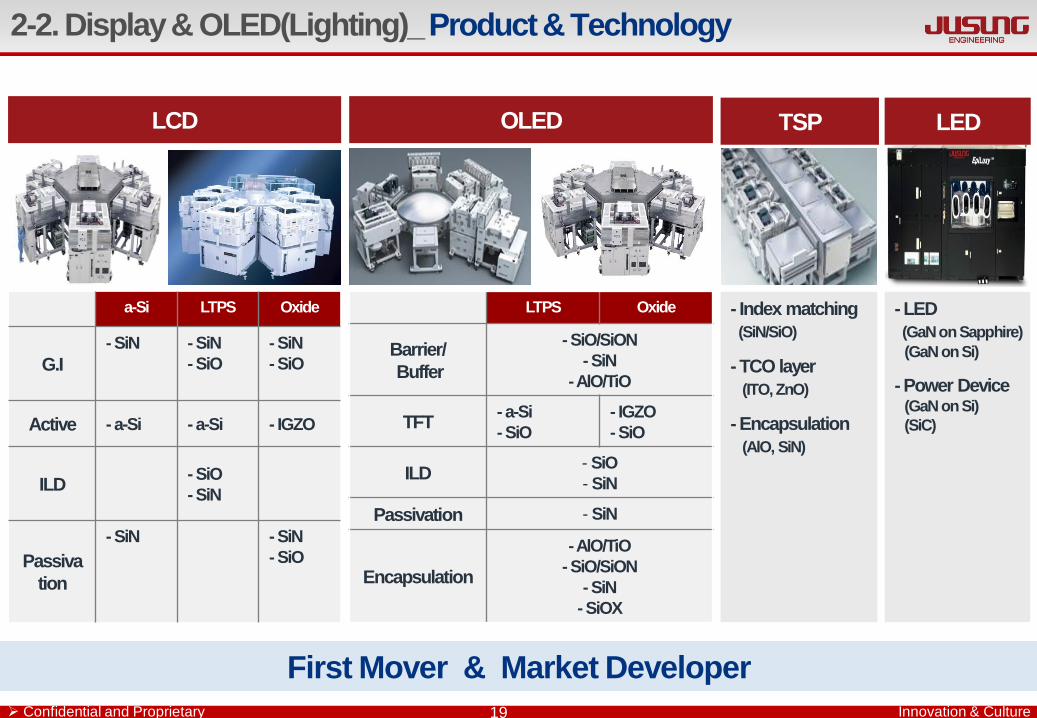
2-2. Display & OLED(Lighting)_ Product & Technology
19
First Mover & Market Developer
OLED TSP LED
- Index matching
(SiN/SiO)
- TCO layer
(ITO, ZnO)
- Encapsulation
(AlO, SiN)
- LED
(GaN on Sapphire)
(GaN on Si)
- Power Device (GaN on Si)
(SiC)
LTPS Oxide
Barrier/
Buffer
- SiO/SiON
- SiN
- AlO/TiO
TFT - a-Si
- SiO
- IGZO
- SiO
ILD - SiO
- SiN
Passivation - SiN
Encapsulation
- AlO/TiO
- SiO/SiON
- SiN
- SiOX
LCD
a-Si LTPS Oxide
G.I
- SiN - SiN
- SiO
- SiN
- SiO
Active - a-Si - a-Si - IGZO
ILD - SiO
- SiN
Passiva
tion
- SiN - SiN
- SiO
Confidential and Proprietary Innovation & Culture 20
Table of Contents
1. Company Overview
2. Market Trend & Competitiveness
3. Financial Status
Confidential and Proprietary Innovation & Culture
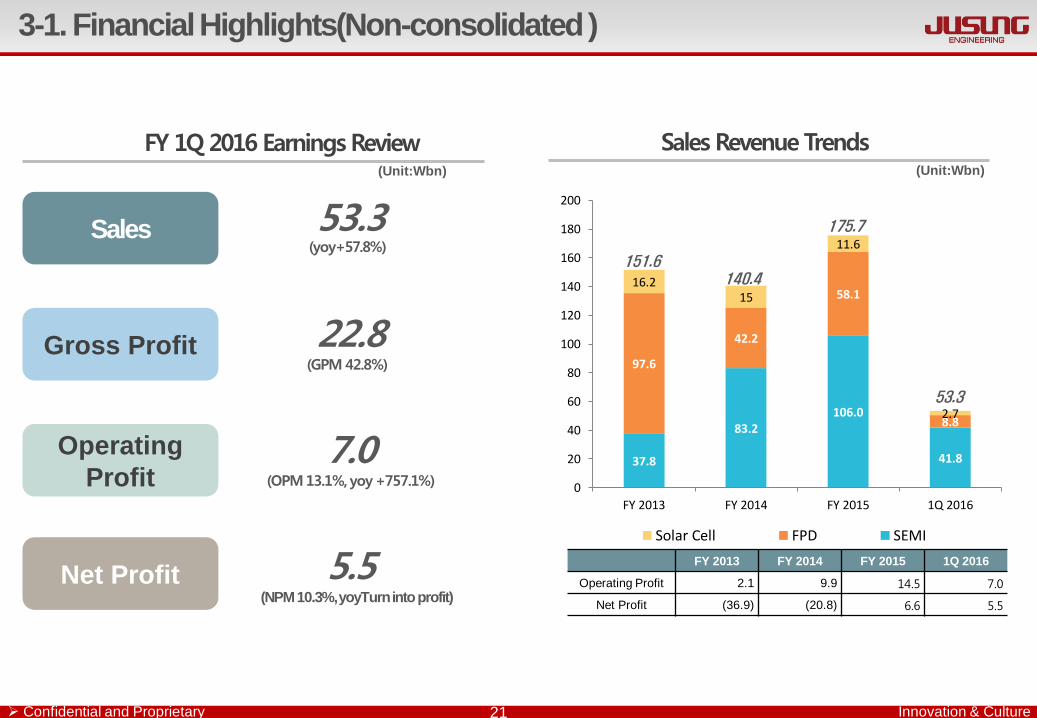
3-1. Financial Highlights(Non-consolidated )
21
Sales
Gross Profit
Operating
Profit
Net Profit
(Unit:Wbn)
Sales Revenue Trends (Unit:Wbn)
FY 2013 FY 2014 FY 2015 1Q 2016
Operating Profit 2.1 9.9 14.5 7.0
Net Profit (36.9) (20.8) 6.6 5.5
408
76.8
37.8
83.2 106.0
41.8
97.6
42.2
58.1
8.8
16.2 15
11.6
2.7
0
20
40
60
80
100
120
140
160
180
200
FY 2013 FY 2014 FY 2015 1Q 2016
Solar Cell FPD SEMI
151.6 140.4
175.7
53.3
FY 1Q 2016 Earnings Review
53.3 (yoy+57.8%)
22.8 (GPM 42.8%)
7.0 (OPM 13.1%, yoy +757.1%)
5.5 (NPM 10.3%, yoyTurn into profit)
Confidential and Proprietary Innovation & Culture 22
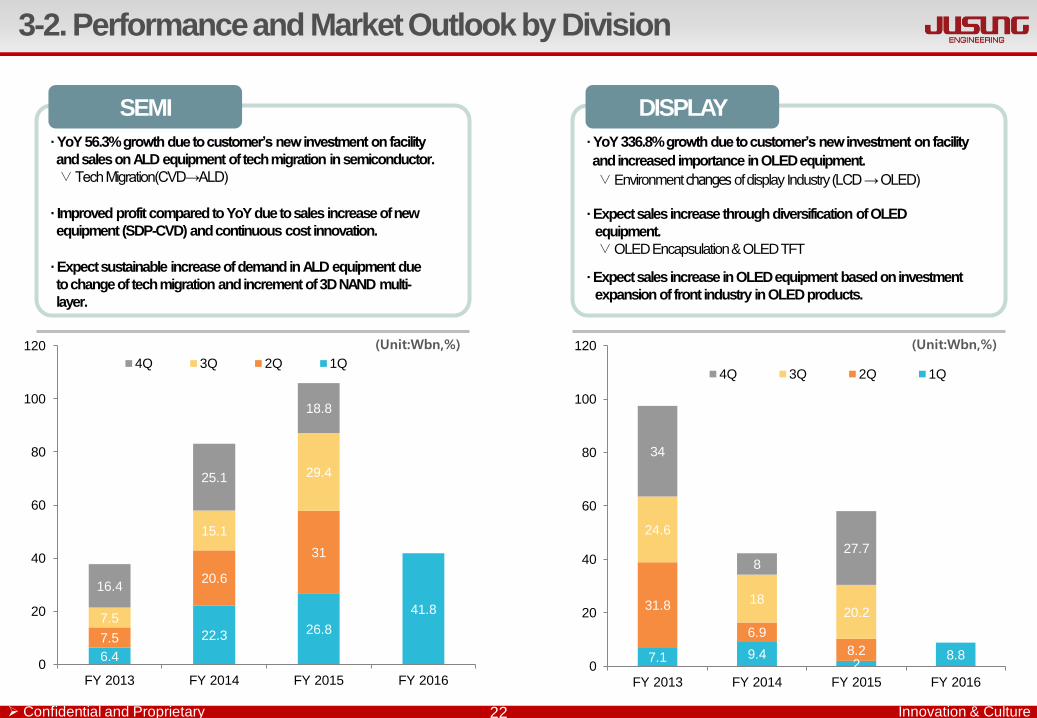
3-2. Performance and Market Outlook by Division
· YoY 56.3% growth due to customer’s new investment on facility
and sales on ALD equipment of tech migration in semiconductor.
∨ Tech Migration(CVD→ALD)
· Improved profit compared to YoY due to sales increase of new
equipment (SDP-CVD) and continuous cost innovation.
SEMI
· Expect sustainable increase of demand in ALD equipment due
to change of tech migration and increment of 3D NAND multi-
layer.
· YoY 336.8% growth due to customer’s new investment on facility
and increased importance in OLED equipment. ∨ Environment changes of display Industry (LCD → OLED)
· Expect sales increase through diversification of OLED
equipment.
∨ OLED Encapsulation & OLED TFT
· Expect sales increase in OLED equipment based on investment
expansion of front industry in OLED products.
DISPLAY
(Unit:Wbn,%) (Unit:Wbn,%)
6.4
22.3 26.8
41.8
7.5
20.6
31
7.5
15.1
29.4
16.4
25.1
18.8
0
20
40
60
80
100
120
FY 2013 FY 2014 FY 2015 FY 2016
4Q 3Q 2Q 1Q
7.1 9.4 2
8.8
31.8
6.9
8.2
24.6
18 20.2
34
8
27.7
0
20
40
60
80
100
120
FY 2013 FY 2014 FY 2015 FY 2016
4Q 3Q 2Q 1Q
Confidential and Proprietary Innovation & Culture
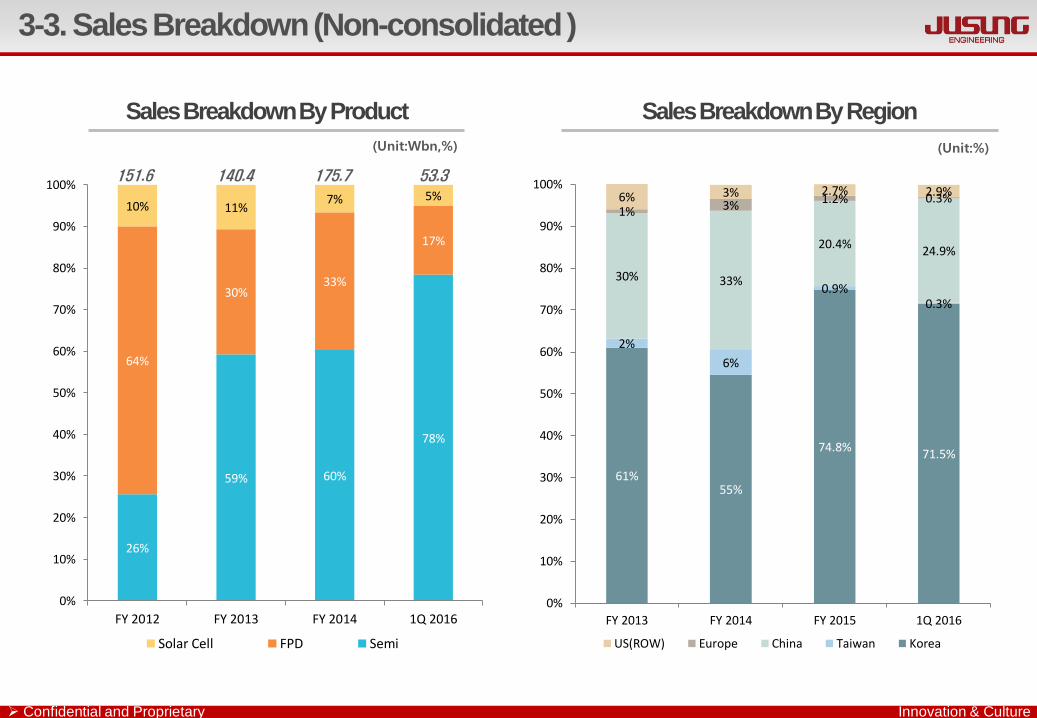
3-3. Sales Breakdown (Non-consolidated )
(Unit:Wbn,%)
Sales Breakdown By Product Sales Breakdown By Region
(Unit:%)
53.3 151.6 140.4 175.7
26%
59% 60%
78%
64%
30% 33%
17%
10% 11% 7% 5%
0%
10%
20%
30%
40%
50%
60%
70%
80%
90%
100%
FY 2012 FY 2013 FY 2014 1Q 2016
Solar Cell FPD Semi
61% 55%
74.8% 71.5%
2%
6%
0.9% 0.3%
30% 33%
20.4% 24.9%
1% 3% 1.2% 0.3% 6% 3% 2.7% 2.9%
0%
10%
20%
30%
40%
50%
60%
70%
80%
90%
100%
FY 2013 FY 2014 FY 2015 1Q 2016
US(ROW) Europe China Taiwan Korea
Confidential and Proprietary Innovation & Culture 24
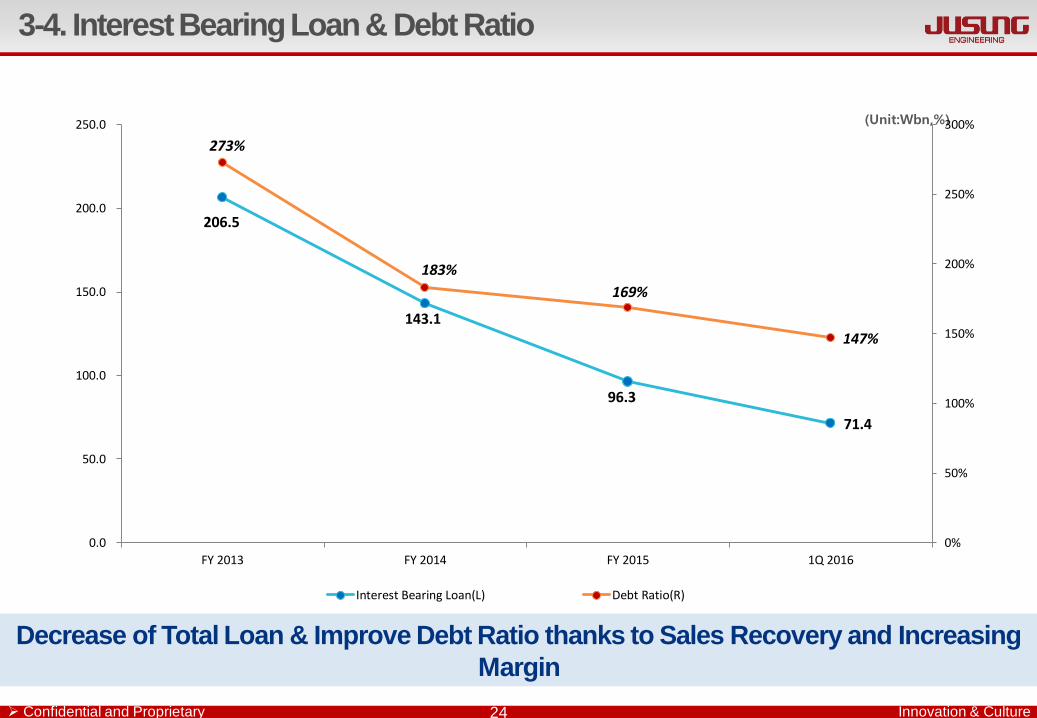
Decrease of Total Loan & Improve Debt Ratio thanks to Sales Recovery and Increasing
Margin
(Unit:Wbn,%)
3-4. Interest Bearing Loan & Debt Ratio
206.5
143.1
96.3
71.4
273%
183%
169%
147%
0%
50%
100%
150%
200%
250%
300%
0.0
50.0
100.0
150.0
200.0
250.0
FY 2013 FY 2014 FY 2015 1Q 2016
Interest Bearing Loan(L) Debt Ratio(R)
Confidential and Proprietary Innovation & Culture
World 1st Technology Only
www.jusung.com
1 in the World
Confidential and Proprietary Innovation & Culture 26
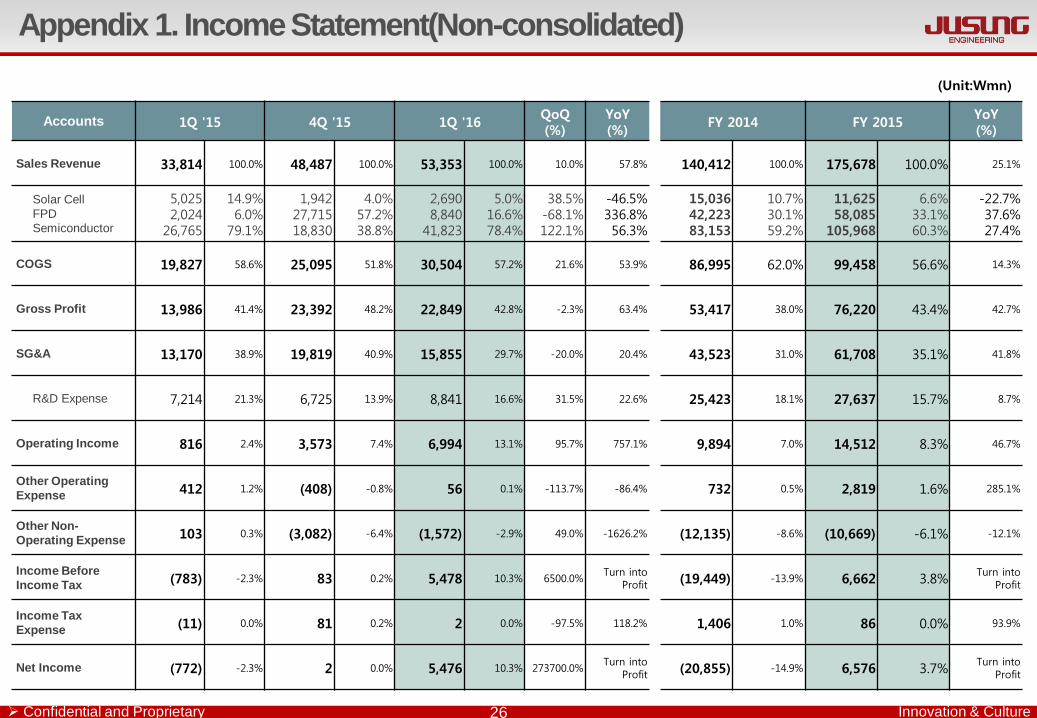
Accounts 1Q '15 4Q '15 1Q '16 QoQ (%)
YoY (%)
FY 2014 FY 2015 YoY (%)
Sales Revenue 33,814 100.0% 48,487 100.0% 53,353 100.0% 10.0% 57.8% 140,412 100.0% 175,678 100.0% 25.1%
Solar Cell
FPD
Semiconductor
5,025 2,024
26,765
14.9% 6.0%
79.1%
1,942 27,715 18,830
4.0% 57.2% 38.8%
2,690 8,840
41,823
5.0% 16.6% 78.4%
38.5% -68.1% 122.1%
-46.5% 336.8% 56.3%
15,036 42,223 83,153
10.7% 30.1% 59.2%
11,625 58,085
105,968
6.6% 33.1% 60.3%
-22.7% 37.6% 27.4%
COGS 19,827 58.6% 25,095 51.8% 30,504 57.2% 21.6% 53.9% 86,995 62.0% 99,458 56.6% 14.3%
Gross Profit 13,986 41.4% 23,392 48.2% 22,849 42.8% -2.3% 63.4% 53,417 38.0% 76,220 43.4% 42.7%
SG&A 13,170 38.9% 19,819 40.9% 15,855 29.7% -20.0% 20.4% 43,523 31.0% 61,708 35.1% 41.8%
R&D Expense 7,214 21.3% 6,725 13.9% 8,841 16.6% 31.5% 22.6% 25,423 18.1% 27,637 15.7% 8.7%
Operating Income 816 2.4% 3,573 7.4% 6,994 13.1% 95.7% 757.1% 9,894 7.0% 14,512 8.3% 46.7%
Other Operating
Expense 412 1.2% (408) -0.8% 56 0.1% -113.7% -86.4% 732 0.5% 2,819 1.6% 285.1%
Other Non-
Operating Expense 103 0.3% (3,082) -6.4% (1,572) -2.9% 49.0% -1626.2% (12,135) -8.6% (10,669) -6.1% -12.1%
Income Before
Income Tax (783) -2.3% 83 0.2% 5,478 10.3% 6500.0%
Turn into Profit (19,449) -13.9% 6,662 3.8%
Turn into Profit
Income Tax
Expense (11) 0.0% 81 0.2% 2 0.0% -97.5% 118.2% 1,406 1.0% 86 0.0% 93.9%
Net Income (772) -2.3% 2 0.0% 5,476 10.3% 273700.0% Turn into
Profit (20,855) -14.9% 6,576 3.7% Turn into
Profit
Appendix 1. Income Statement(Non-consolidated)
(Unit:Wmn)
Confidential and Proprietary Innovation & Culture
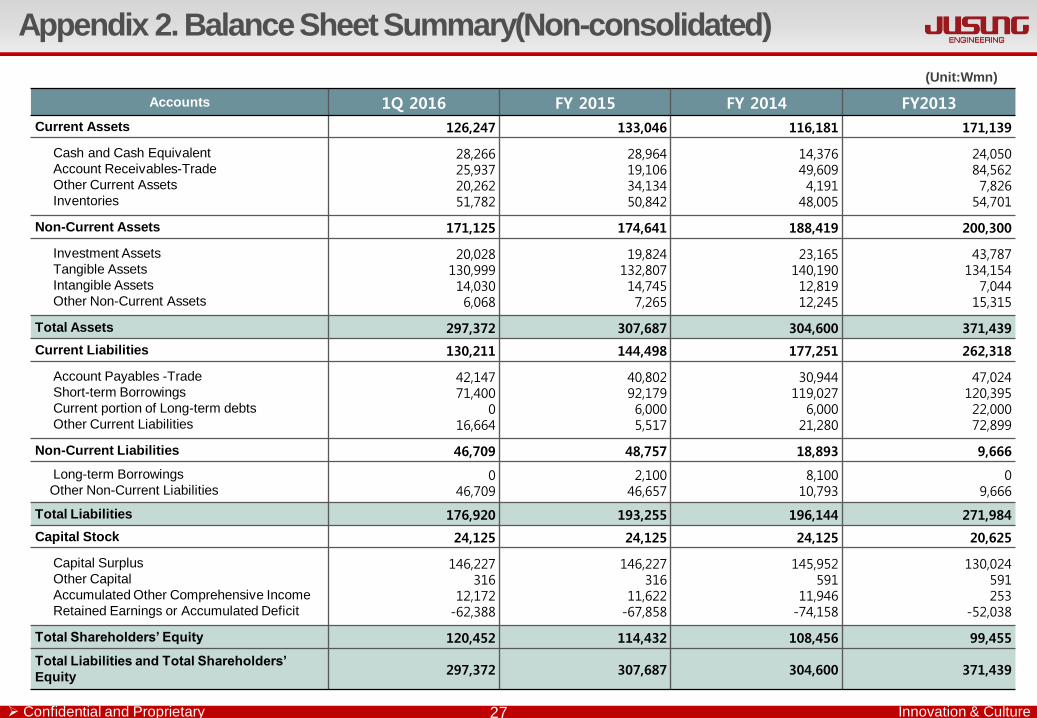
Accounts 1Q 2016 FY 2015 FY 2014 FY2013
Current Assets 126,247 133,046 116,181 171,139
Cash and Cash Equivalent
Account Receivables-Trade
Other Current Assets
Inventories
28,266 25,937 20,262 51,782
28,964 19,106 34,134 50,842
14,376 49,609 4,191
48,005
24,050 84,562
7,826 54,701
Non-Current Assets 171,125 174,641 188,419 200,300
Investment Assets
Tangible Assets
Intangible Assets
Other Non-Current Assets
20,028 130,999 14,030 6,068
19,824 132,807 14,745 7,265
23,165 140,190 12,819 12,245
43,787 134,154 7,044 15,315
Total Assets 297,372 307,687 304,600 371,439
Current Liabilities 130,211 144,498 177,251 262,318
Account Payables -Trade
Short-term Borrowings
Current portion of Long-term debts
Other Current Liabilities
42,147 71,400
0 16,664
40,802 92,179 6,000 5,517
30,944 119,027
6,000 21,280
47,024 120,395 22,000
72,899
Non-Current Liabilities 46,709 48,757 18,893 9,666
Long-term Borrowings
Other Non-Current Liabilities 0
46,709 2,100
46,657 8,100
10,793 0
9,666
Total Liabilities 176,920 193,255 196,144 271,984
Capital Stock 24,125 24,125 24,125 20,625
Capital Surplus
Other Capital
Accumulated Other Comprehensive Income
Retained Earnings or Accumulated Deficit
146,227 316
12,172 -62,388
146,227 316
11,622 -67,858
145,952 591
11,946 -74,158
130,024 591 253
-52,038
Total Shareholders’ Equity 120,452 114,432 108,456 99,455
Total Liabilities and Total Shareholders’
Equity 297,372 307,687 304,600 371,439
27
(Unit:Wmn)
Appendix 2. Balance Sheet Summary(Non-consolidated)


![AMOLED TV 기술itfind.or.kr/COMIN/file55584-AMOLED TV 기술.pdf · 2012-06-14 · AMOLED TV 기술 2011년 제12권 제4호 7 [그림 2] 출시된 OLED TV 제품 [그림 3] Fine](https://img.pdfslide.tips/doc/110x75/5e8f531e3d26c532e81ac0d9/amoled-tv-e-tv-epdf-2012-06-14-amoled-tv-e-2011e-oe12eoe.jpg)