Embed Size (px)
Citation preview
Kana Iwakunia,b,c, Sho Okubob,c, Hajime Inabab,c, Kazumoto Hosakab,c, Atsushi Onaeb,c, Hiroyuki Sasadaa,c, Feng-Lei Hongb,c
Keio University a, NMIJ, AIST b, ERATO Minoshima Intelligent Optical Synthesizer Project, JST c
69th International Symposium on Molecular Spectroscopy, 17 June 2014, Champaign-Urbana, the University of Illinois
1
TJ03
Dual-Comb Spectroscopy of C2H2, CH4 and H2O over 1.0 – 1.7 μm
Outline
1. Optical frequency comb as a light source for spectroscopy
2. Principle of dual-comb spectroscopy3. Observed spectra and absolute frequency measurements
2
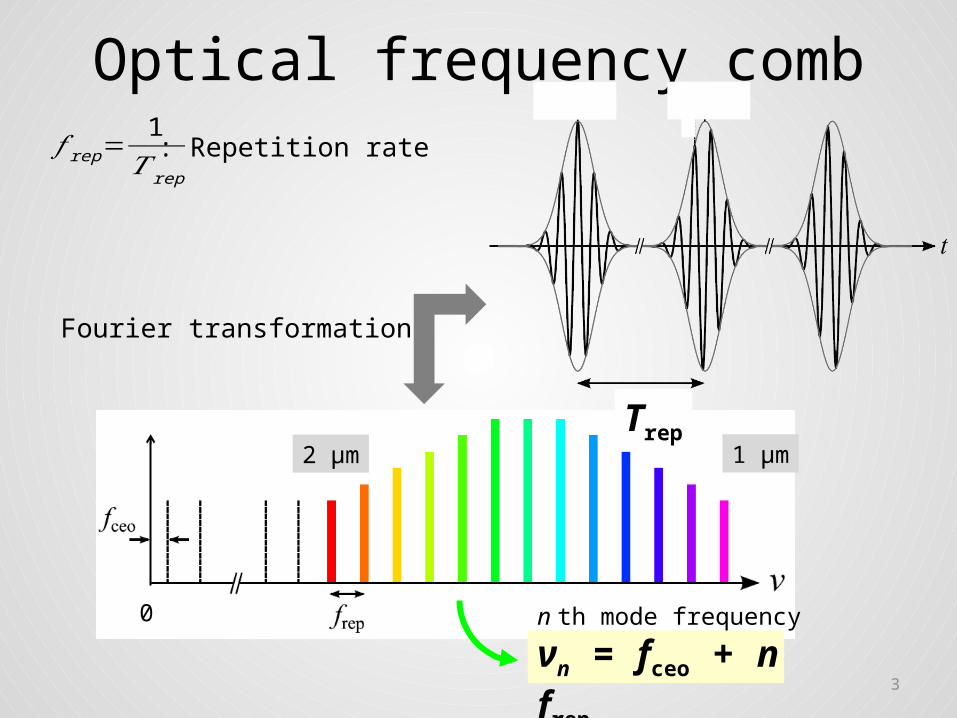
Optical frequency comb
Fourier transformation
n th mode frequency
νn = fceo + n frep
: Repetition rate
0
3
Trep
𝑓 rep=1𝑇 rep
1 μm2 μm
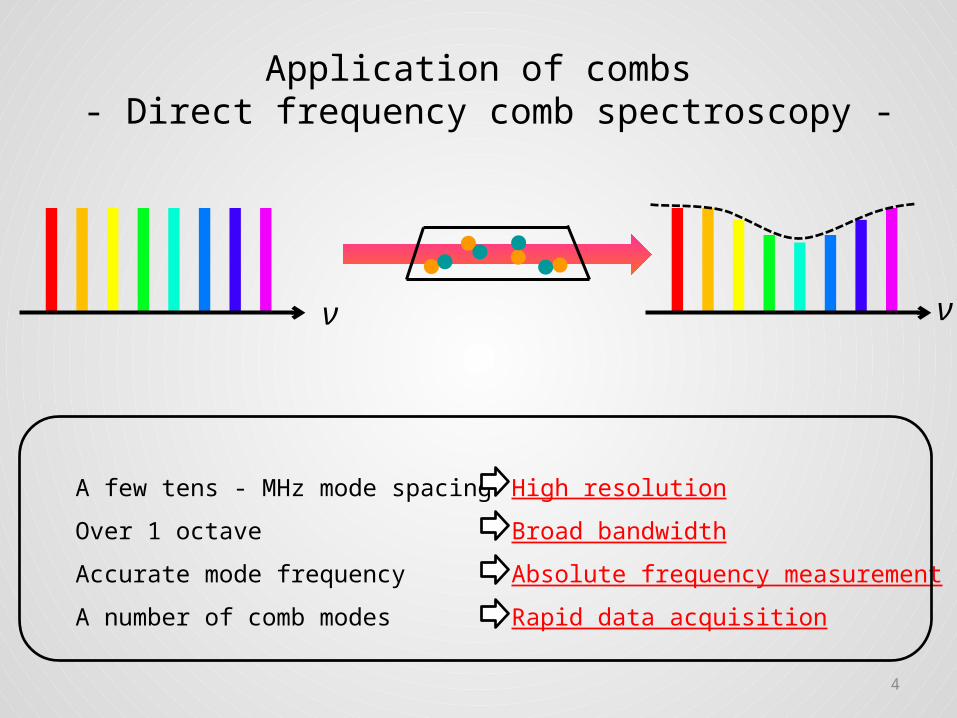
A few tens - MHz mode spacing
Over 1 octave
Accurate mode frequency
A number of comb modes
High resolution
Broad bandwidth
Absolute frequency measurement
Rapid data acquisition
4
Application of combs - Direct frequency comb spectroscopy -
ν ν
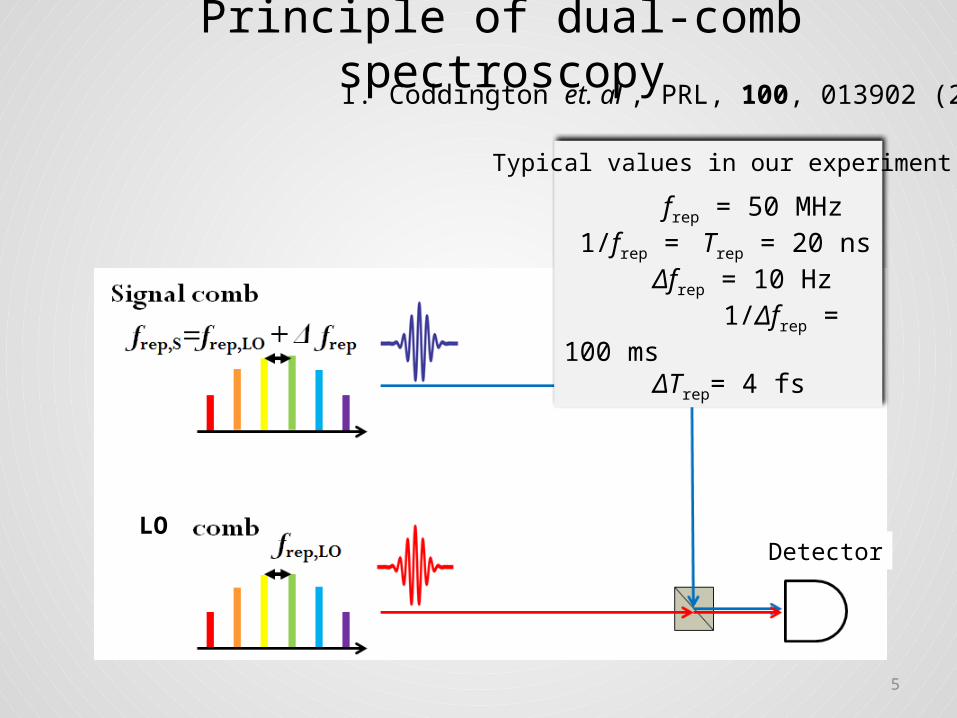
frep = 50 MHz 1/frep = Trep = 20 ns Δfrep = 10 Hz 1/Δfrep = 100 ms ΔTrep= 4 fs
Principle of dual-comb spectroscopy
Detector
I. Coddington et. al , PRL, 100, 013902 (2008)
5
Typical values in our experiment
LO
Δfrep
6
RF
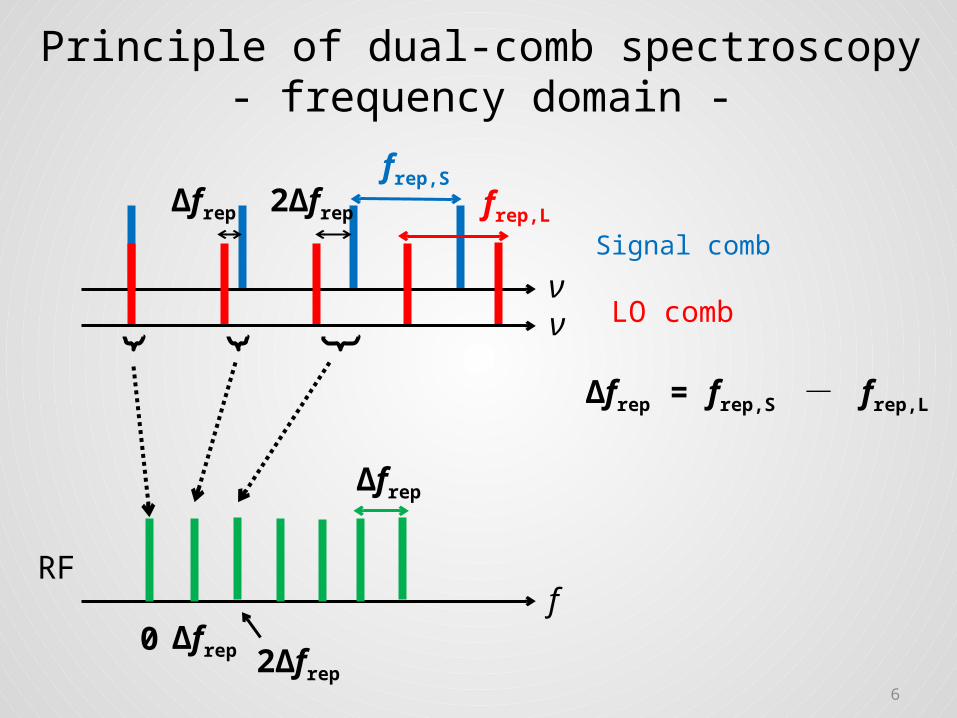
Principle of dual-comb spectroscopy- frequency domain -
Signal comb
LO comb
frep,S
frep,LΔfrep 2Δfrep
νν
Δfrep = frep,S - frep,L
f
2Δfrep
Δfrep
0
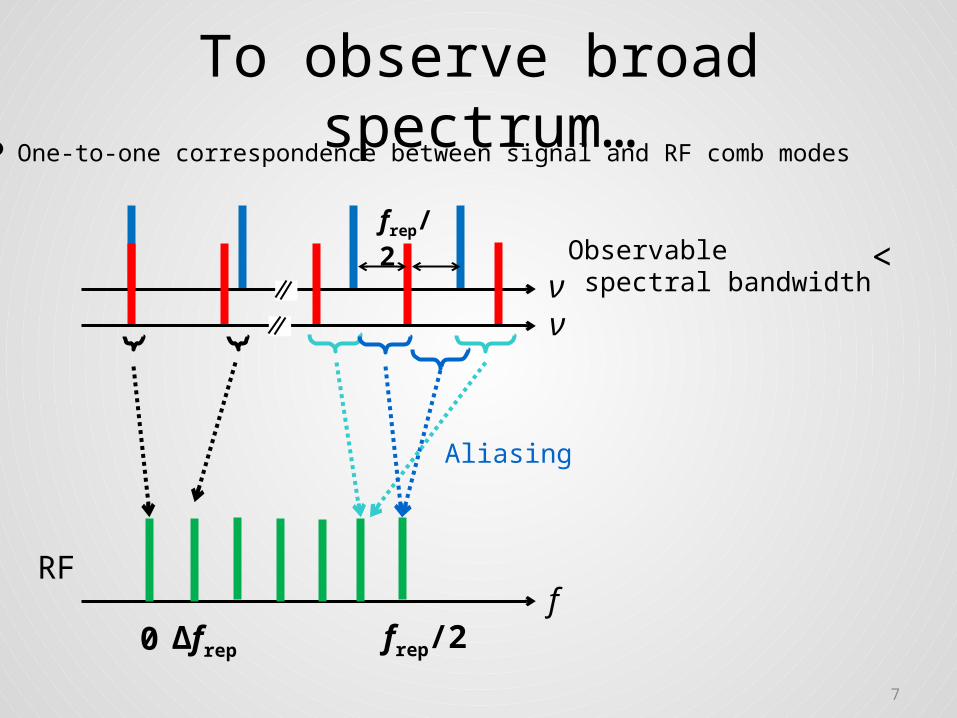
To observe broad spectrum…
frep/2
One-to-one correspondence between signal and RF comb modes
< Observable spectral bandwidth
7
νν
Δfrep
RFf
frep/20
Aliasing
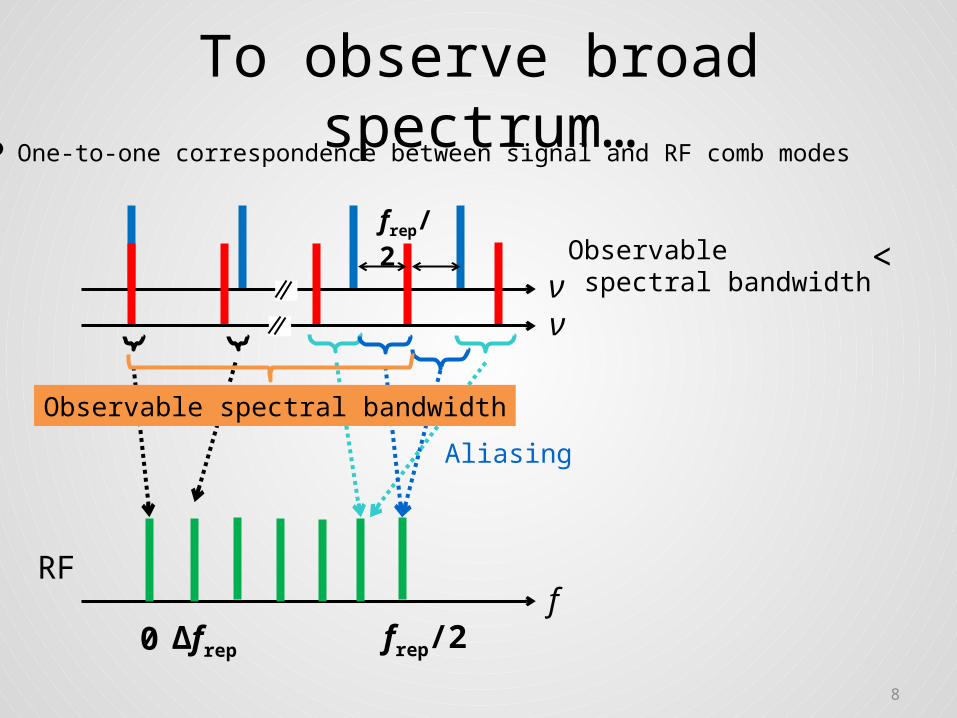
To observe broad spectrum…
frep/2
One-to-one correspondence between signal and RF comb modes
< Observable spectral bandwidth
8
νν
Δfrep
RFf
frep/20
Aliasing
Observable spectral bandwidth
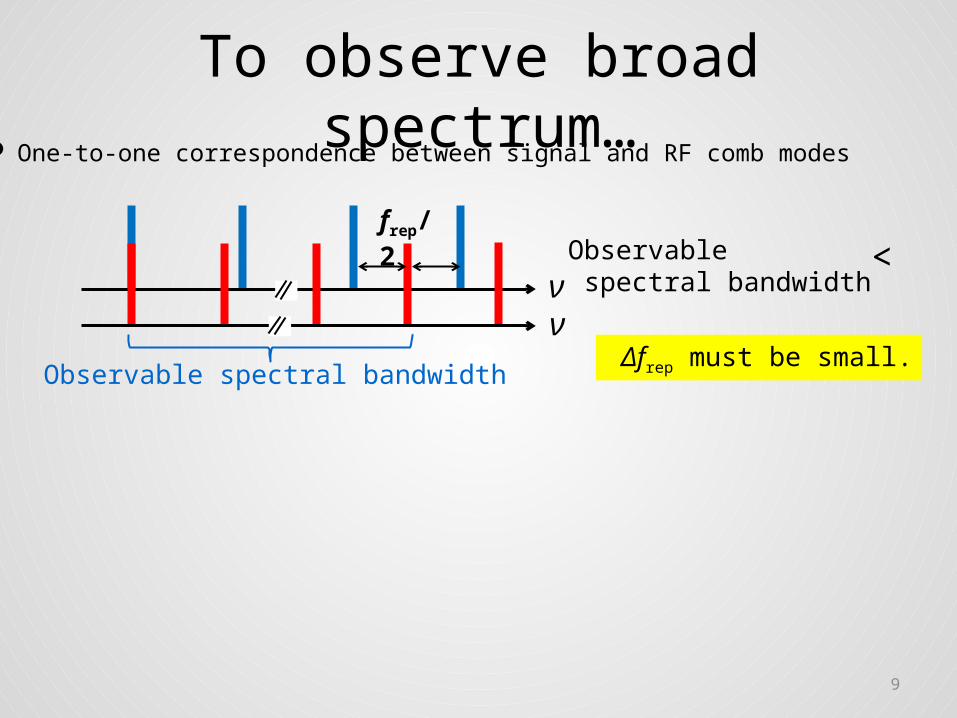
To observe broad spectrum…
frep/2
One-to-one correspondence between signal and RF comb modes
< Observable spectral bandwidth
Observable spectral bandwidth
νν
9
Δfrep must be small.
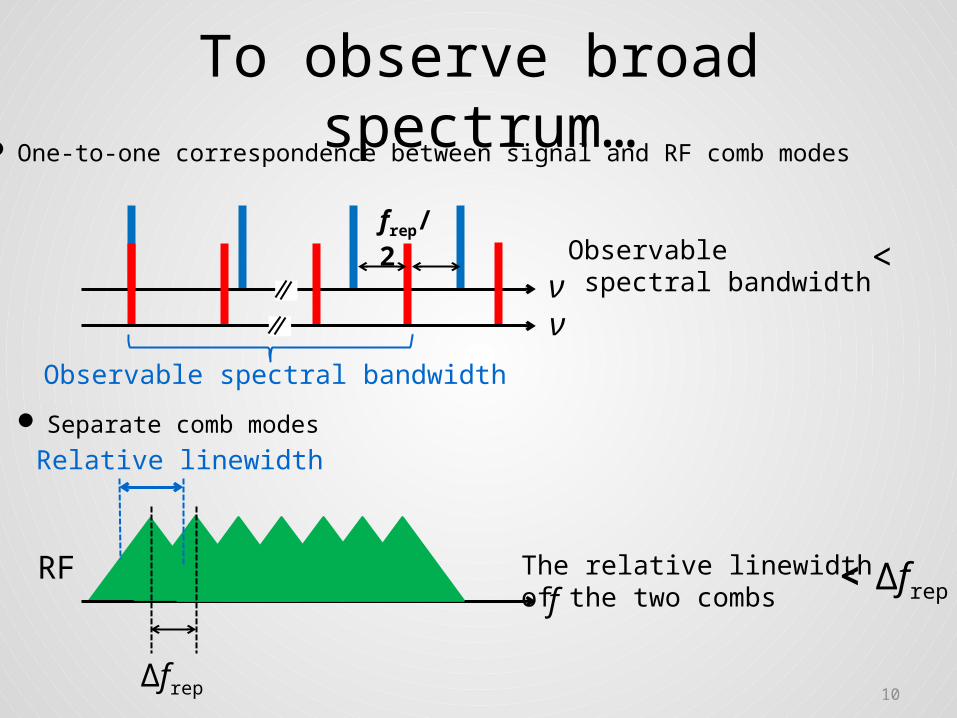
To observe broad spectrum…
frep/2
One-to-one correspondence between signal and RF comb modes
<
Separate comb modes
Δfrep
< Δfrep
Observable spectral bandwidth
The relative linewidth of the two combs
10
Observable spectral bandwidth
RF
Relative linewidth
νν
f
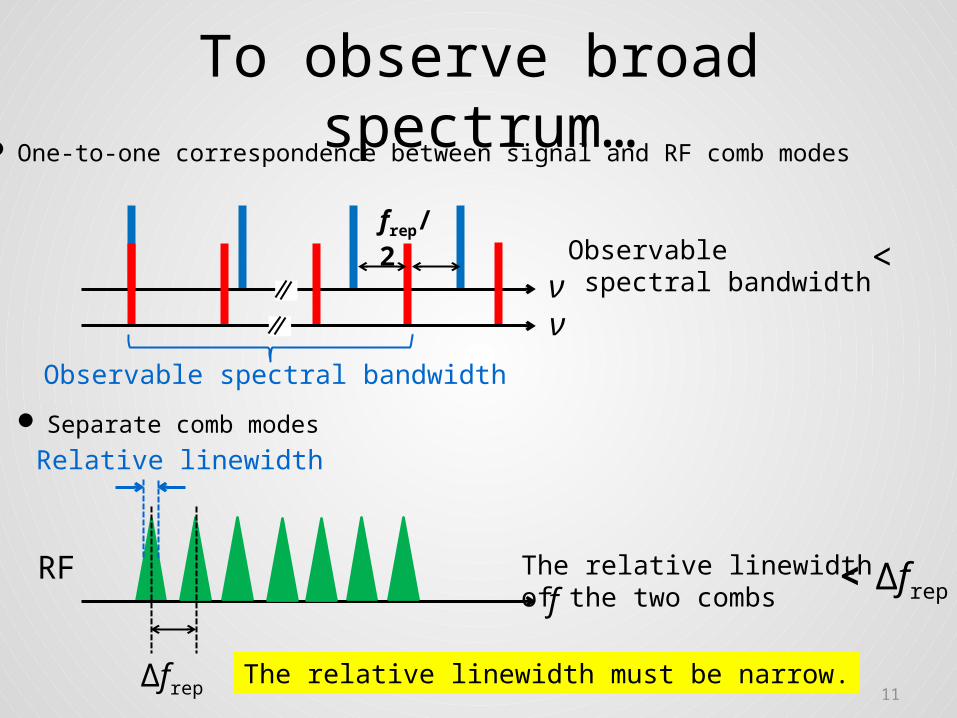
To observe broad spectrum…
frep/2
One-to-one correspondence between signal and RF comb modes
ΔfrepThe relative linewidth must be narrow.
11
Observable spectral bandwidth
RF
Relative linewidth
νν
f
<
< Δfrep
Observable spectral bandwidth
The relative linewidth of the two combs
Separate comb modes
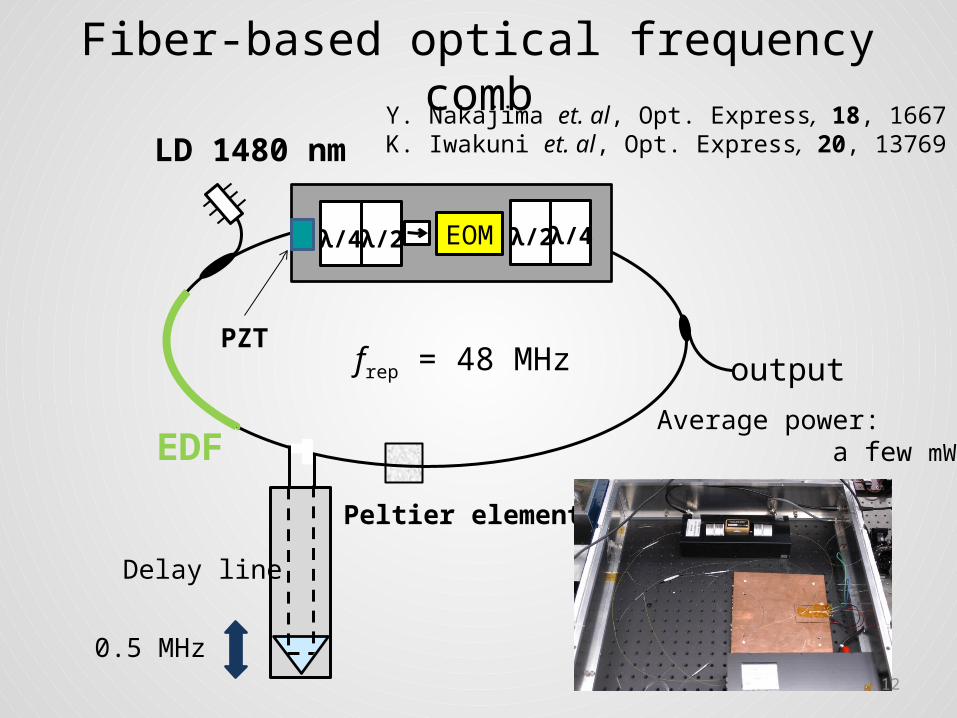
Fiber-based optical frequency comb
EDF
frep = 48 MHz
EOM λ/2λ/2λ/4
LD 1480 nm
PZT
Peltier element
λ/4
Y. Nakajima et. al, Opt. Express, 18, 1667 (2010)K. Iwakuni et. al, Opt. Express, 20, 13769 (2012)
Average power: a few mW
0.5 MHz12
Delay line
output
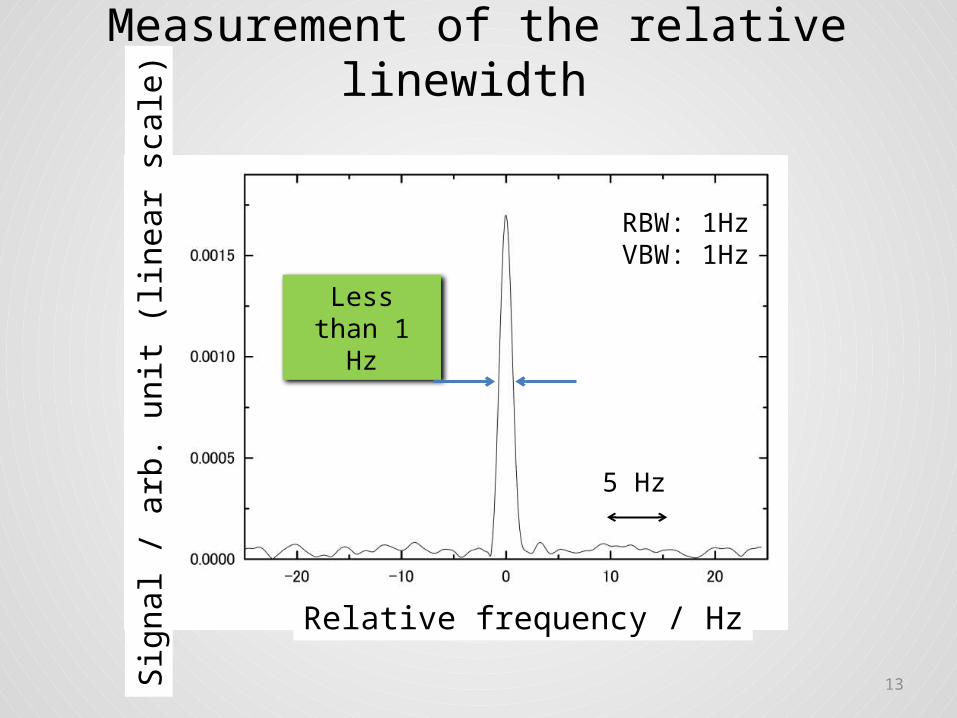
13
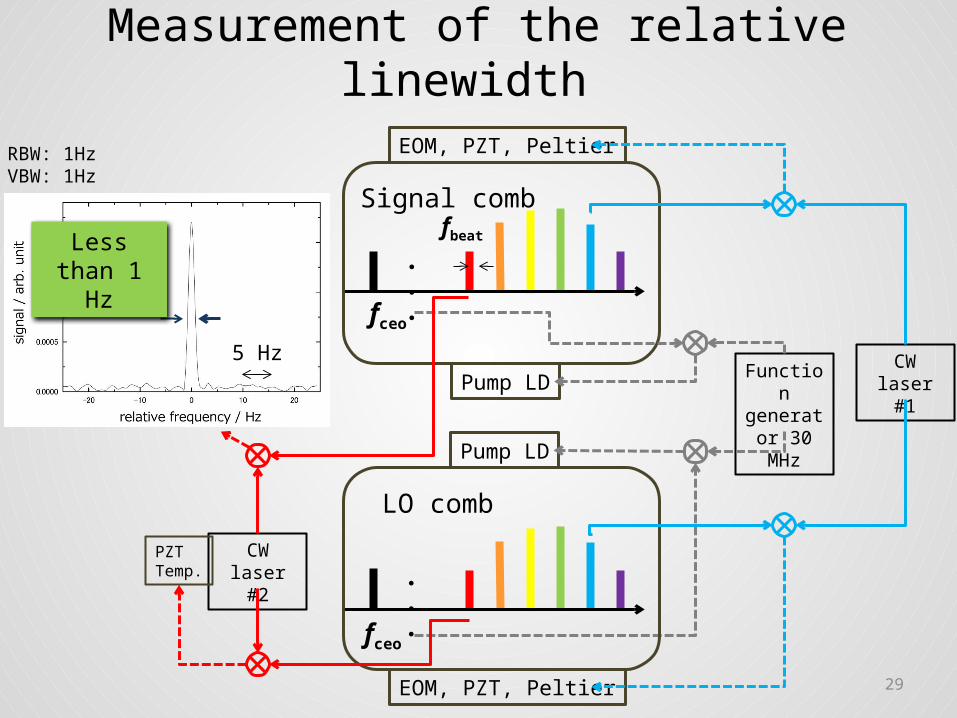
RBW: 1HzVBW: 1Hz
Less than 1 Hz
5 Hz
Measurement of the relative linewidth
Sign
al /
arb.
uni
t (lin
ear s
cale
)
Relative frequency / Hz
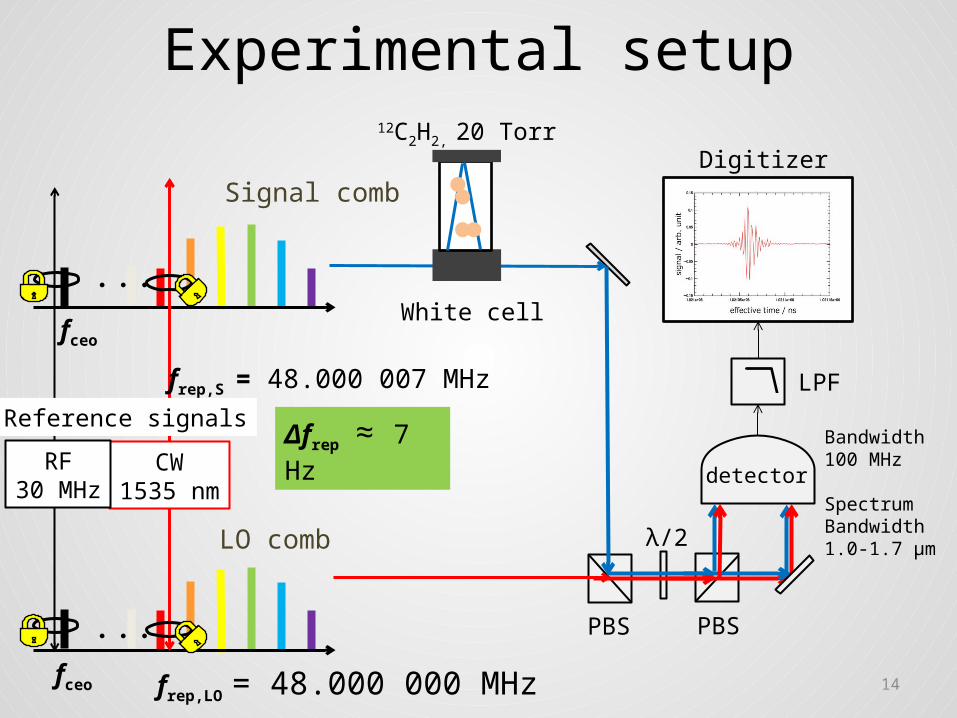
Experimental setup
・・・
・・・
CW1535 nm
RF30 MHz
Signal comb
LO comb
fceo
fceo
detector
frep,LO = 48.000 000 MHz
frep,S = 48.000 007 MHz
Bandwidth 100 MHz
SpectrumBandwidth1.0-1.7 μm
White cell
Digitizer
LPF
Δfrep ≈ 7 Hz
λ/2
PBS PBS
14
Reference signals
12C2H2, 20 Torr
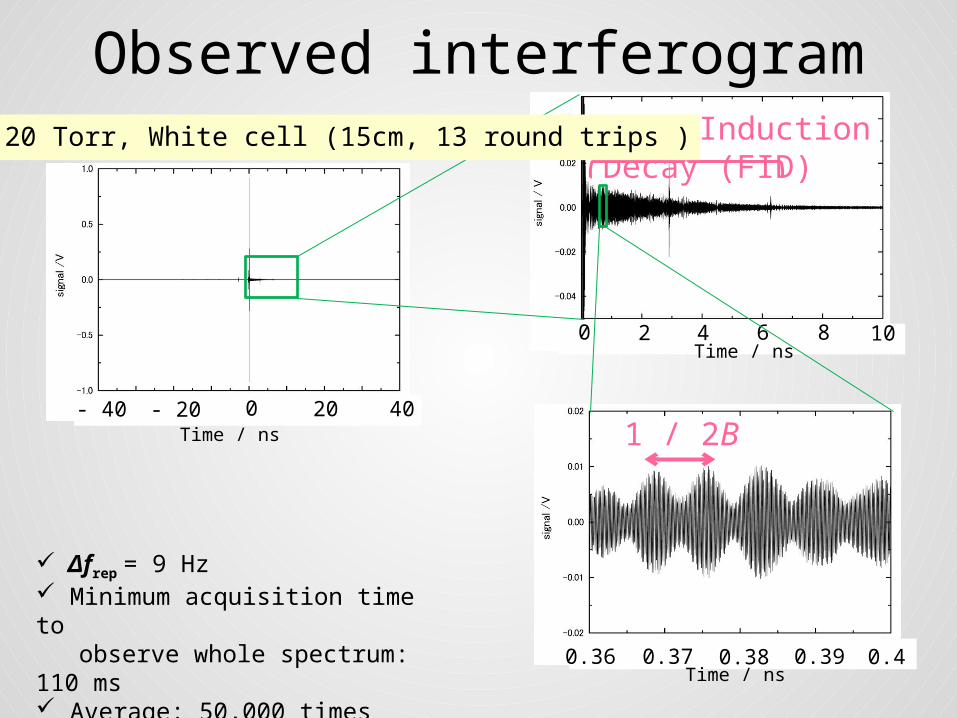
Observed interferogram
Δfrep = 9 Hz Minimum acquisition time to observe whole spectrum: 110 ms Average: 50,000 times Total measurement time: 90 min
Free Induction Decay (FID)12C2H2, 20 Torr, White cell (15cm, 13 round trips )
Time / ns0 20 40- 20- 40
Time / ns0 2 4 6 8 10
Time / ns0.36 0.37 0.38 0.39 0.4
1 / 2B
16
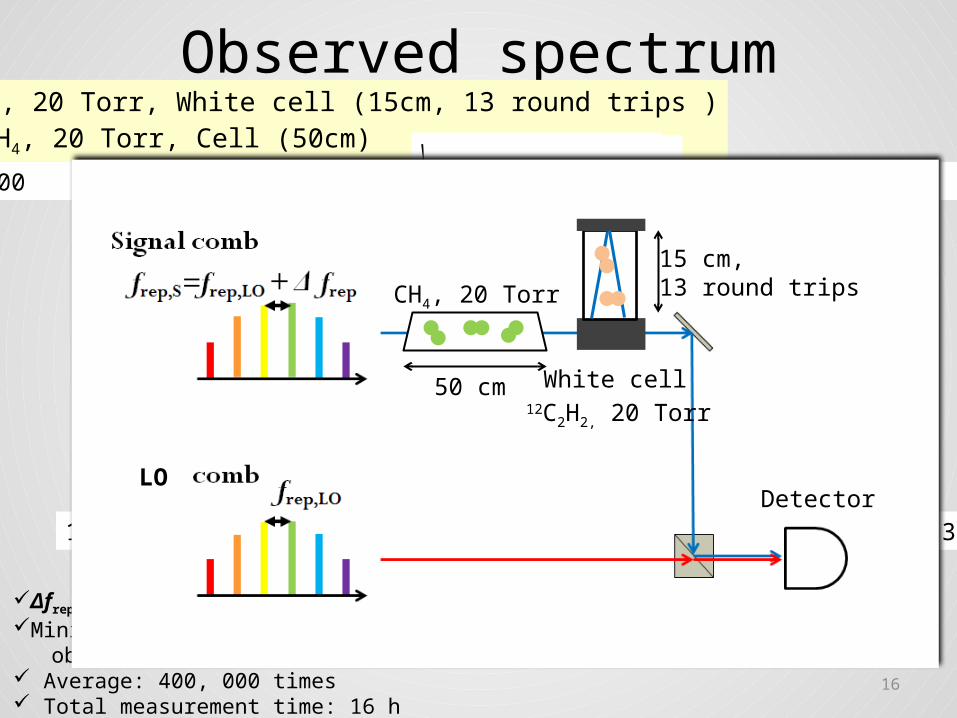
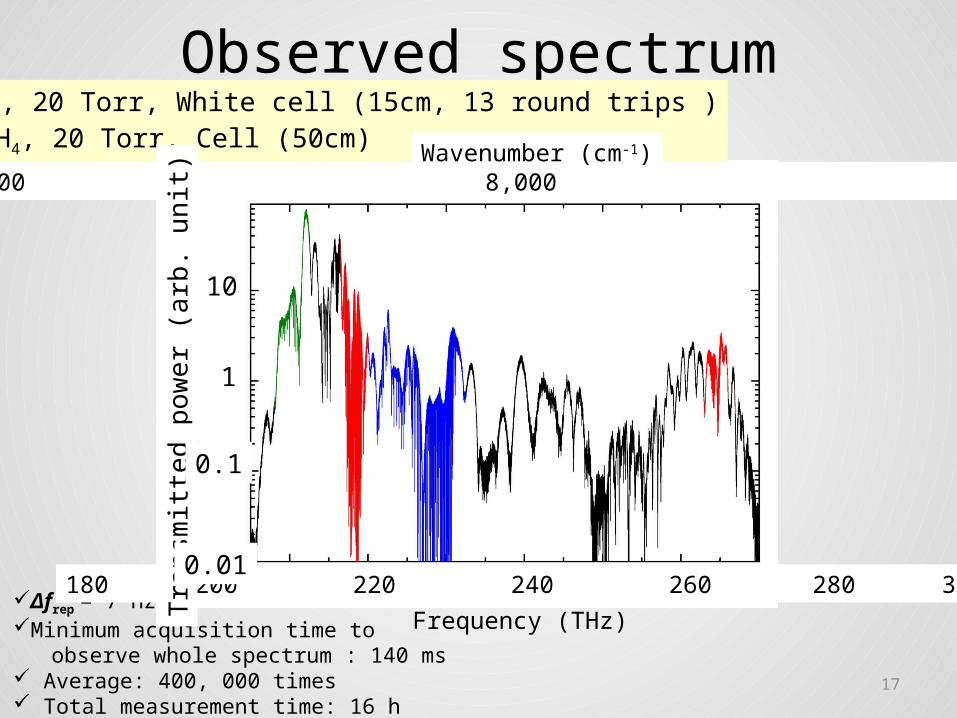
Observed spectrum
Δfrep = 7 Hz Minimum acquisition time to observe whole spectrum : 140 ms Average: 400, 000 times Total measurement time: 16 h
12C2H2, 20 Torr, White cell (15cm, 13 round trips ) CH4, 20 Torr, Cell (50cm)
6,000 8,000 10,000Wavenumber (cm-1)
180 200 220 240 260 280 300Frequency (THz)
CH4, 20 Torr
White cell50 cm12C2H2, 20 Torr
15 cm, 13 round trips
Detector LO
17
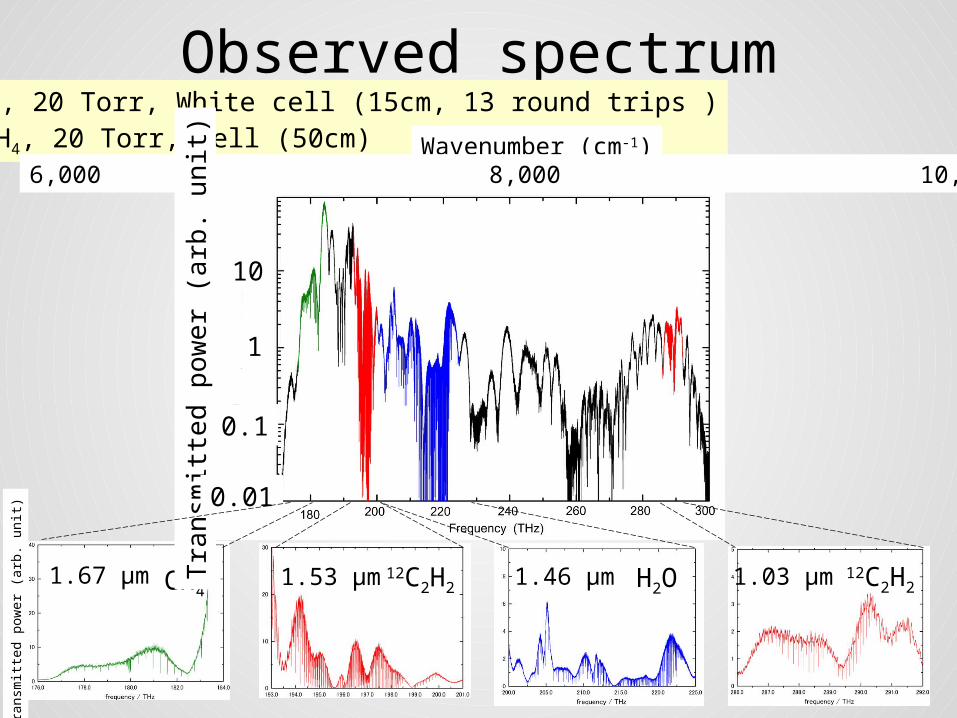
Observed spectrum
Δfrep = 7 Hz Minimum acquisition time to observe whole spectrum : 140 ms Average: 400, 000 times Total measurement time: 16 h
12C2H2, 20 Torr, White cell (15cm, 13 round trips ) CH4, 20 Torr, Cell (50cm)
6,000 8,000 10,000Wavenumber (cm-1)
180 200 220 240 260 280 300Frequency (THz)
Tran
smitt
ed p
ower
(arb
. uni
t)
10
1
0.1
0.01
180 200 220 240 260 280 300
18
Frequency (THz)176 178 180 182 184Tr
ansm
itted
pow
er (a
rb. u
nit)
40
30
20
10
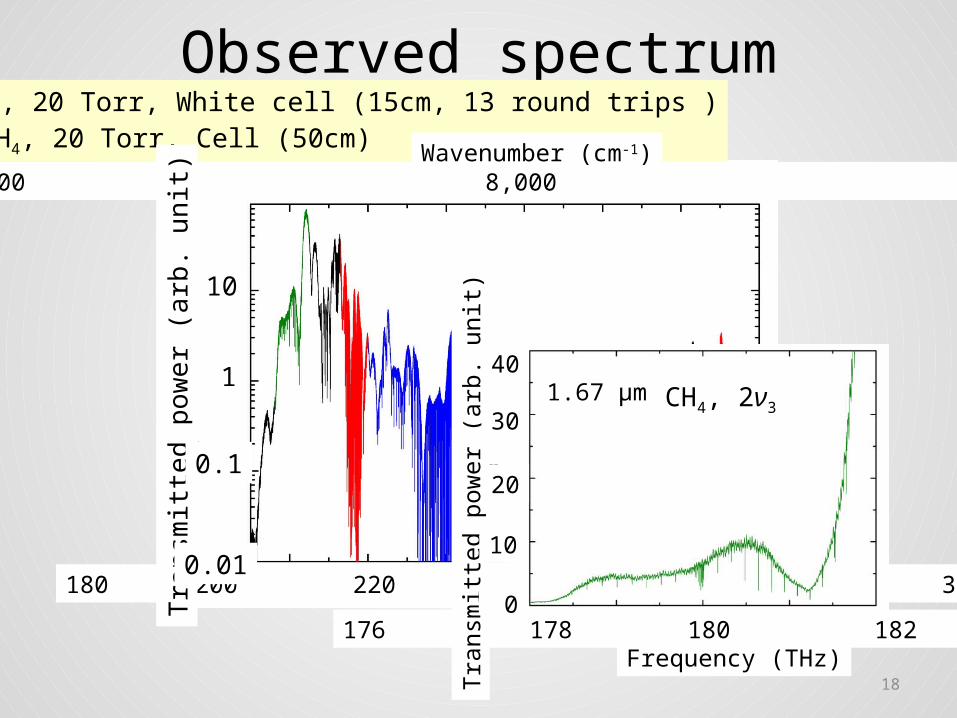
Observed spectrum12C2H2, 20 Torr, White cell (15cm, 13 round trips ) CH4, 20 Torr, Cell (50cm)
0
CH4, 2ν31.67 μm
6,000 8,000 10,000Wavenumber (cm-1)
Tran
smitt
ed p
ower
(arb
. uni
t)
10
1
0.1
0.01
180 200 220 240 260 280 300
19
30
20
10
0
Frequency (THz) 194 196 198 200
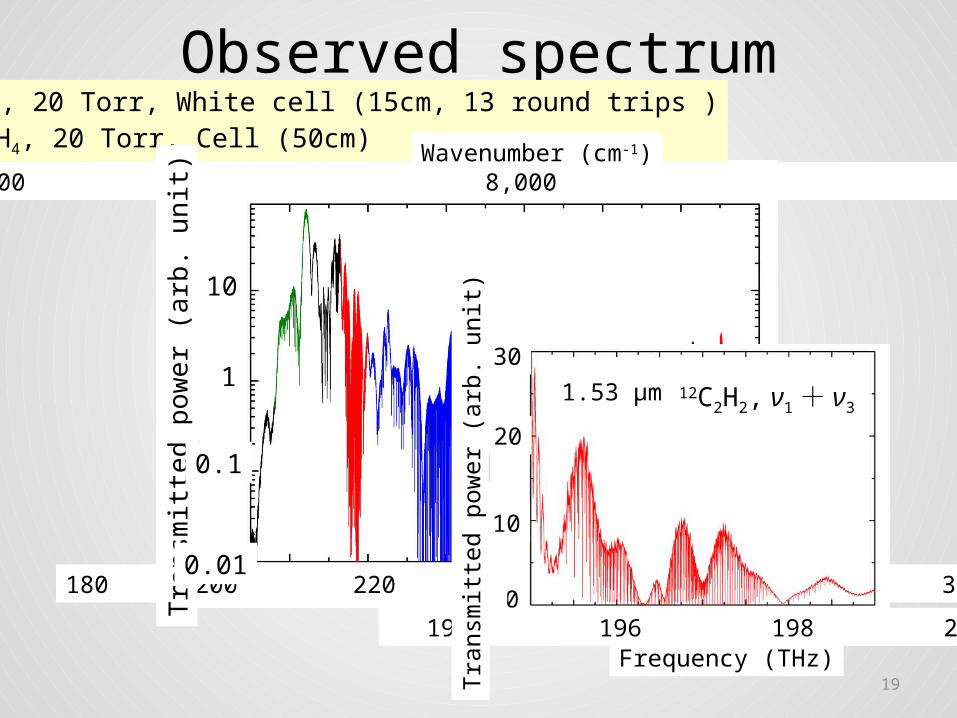
Observed spectrum12C2H2, 20 Torr, White cell (15cm, 13 round trips ) CH4, 20 Torr, Cell (50cm)
12C2H2, ν1 + ν3
Tran
smitt
ed p
ower
(arb
. uni
t)
1.53 μm
6,000 8,000 10,000Wavenumber (cm-1)
Tran
smitt
ed p
ower
(arb
. uni
t)
10
1
0.1
0.01
180 200 220 240 260 280 300
20
6
4
2
0
8
10
200 205 210 215 220 225 Frequency (THz)
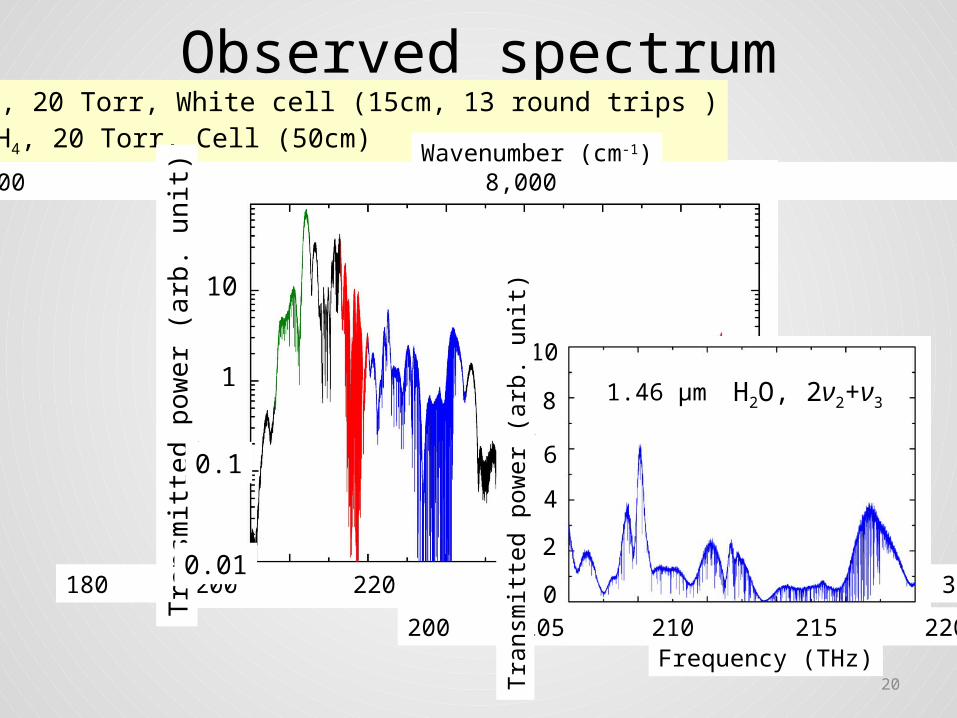
Observed spectrum12C2H2, 20 Torr, White cell (15cm, 13 round trips ) CH4, 20 Torr, Cell (50cm)
Tran
smitt
ed p
ower
(arb
. uni
t)
1.46 μm H2O, 2ν2+ν3
6,000 8,000 10,000Wavenumber (cm-1)
Tran
smitt
ed p
ower
(arb
. uni
t)
10
1
0.1
0.01
180 200 220 240 260 280 300
21
Tran
smitt
ed p
ower
(arb
. uni
t)
10
1
0.1
0.01
Observed spectrum12C2H2, 20 Torr, White cell (15cm, 13 round trips ) CH4, 20 Torr, Cell (50cm)
3
2
1
4
5
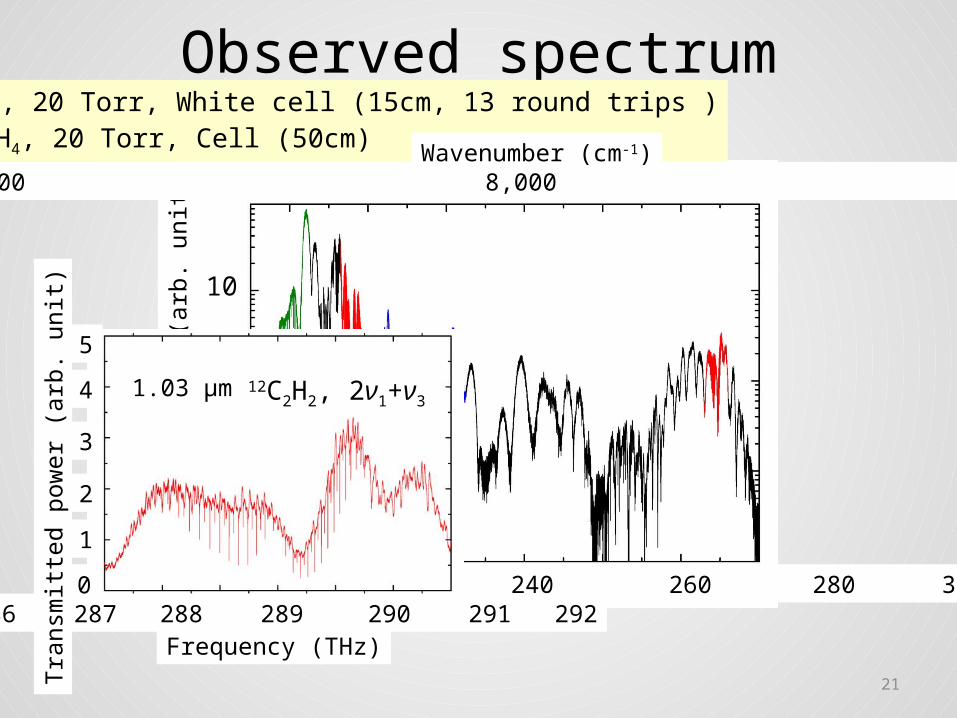
286 287 288 289 290 291 292Frequency (THz)
0
Tran
smitt
ed p
ower
(arb
. uni
t)
12C2H2, 2ν1+ν31.03 μm
6,000 8,000 10,000Wavenumber (cm-1)
22Tran
smitt
ed p
ower
(arb
. uni
t)
Observed spectrum12C2H2, 20 Torr, White cell (15cm, 13 round trips ) CH4, 20 Torr, Cell (50cm)
12C2H2 1.46 μm H2O 12C2H21.53 μm 1.03 μmCH41.67 μm
Wavenumber (cm-1)6,000 8,000 10,000
Tran
smitt
ed p
ower
(arb
. uni
t)
10
1
0.1
0.01
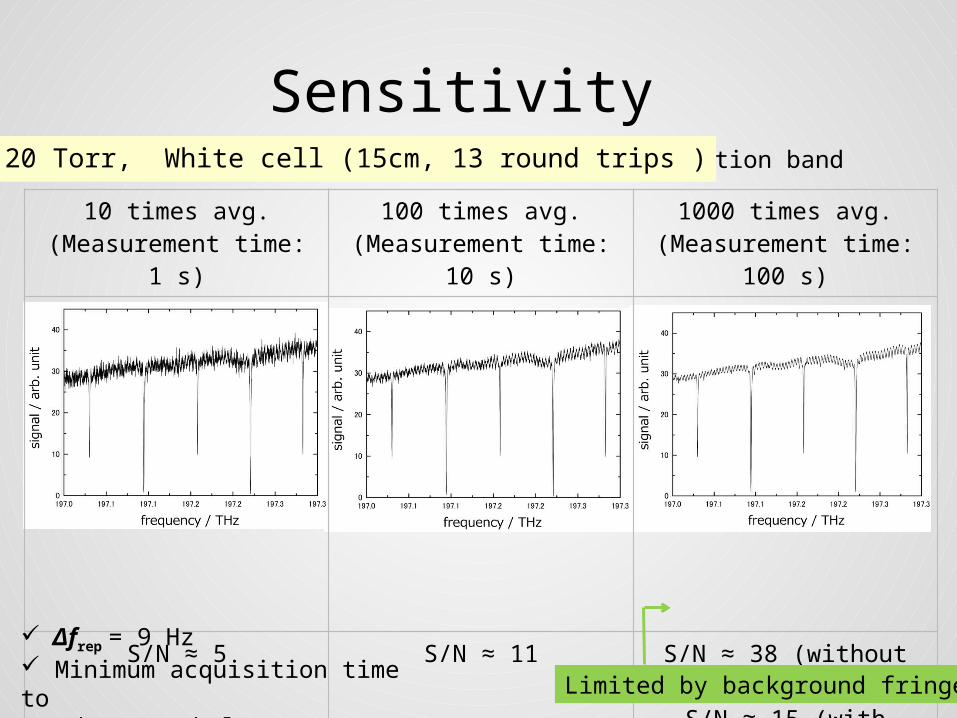
Sensitivity
23
10 times avg.(Measurement time: 1 s)
100 times avg.(Measurement time: 10 s)
1000 times avg.(Measurement time: 100 s)
S/N ≈ 5 S/N ≈ 11 S/N ≈ 38 (without fringes)S/N ≈ 15 (with fringes)
ν1+ν3 vibration band12C2H2, 20 Torr, White cell (15cm, 13 round trips )
Δfrep = 9 Hz Minimum acquisition time to observe whole spectrum: 110 ms
Limited by background fringes
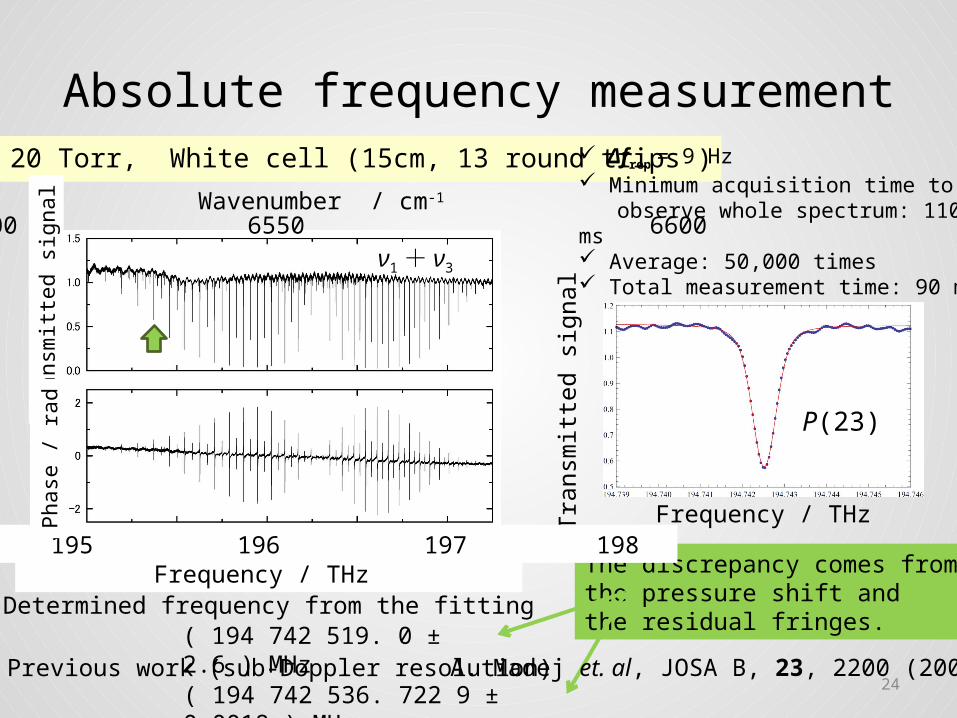
Absolute frequency measurement
24
( 194 742 519. 0 ± 2.6 ) MHz
P(23)
Frequency / THz
Tran
smitt
ed s
igna
l
( 194 742 536. 722 9 ± 0.0018 ) MHz
Determined frequency from the fitting
Previous work (sub-Doppler resolution)
The discrepancy comes from the pressure shift and the residual fringes.
A. Madej et. al, JOSA B, 23, 2200 (2006)
12C2H2, 20 Torr, White cell (15cm, 13 round trips ) Δfrep = 9 Hz Minimum acquisition time to observe whole spectrum: 110 ms Average: 50,000 times Total measurement time: 90 minν1 + ν3
194 195 196 197 198 Frequency / THz
6500 6550 6600 Wavenumber / cm-1
Tran
smitt
ed s
igna
lPh
ase
/ rad
Summary
AcknowledgmentsWe are grateful to Dr. K. M. T. Yamada for his helps to this research. This research is financially supported by Grand-in-Aid for Scientific Research (A)of the Ministry of Education, Culture, Sports, Science and Technology, Japan.
25
We developed the dual-comb spectrometer using two combs with narrow relative linewidth, and simultaneously observed absorption spectrum of 12C2H2, CH4 and H2O over 1.0 - 1.7 μm in 140 ms.
The sensitivity is currently limited by the residual fringes.
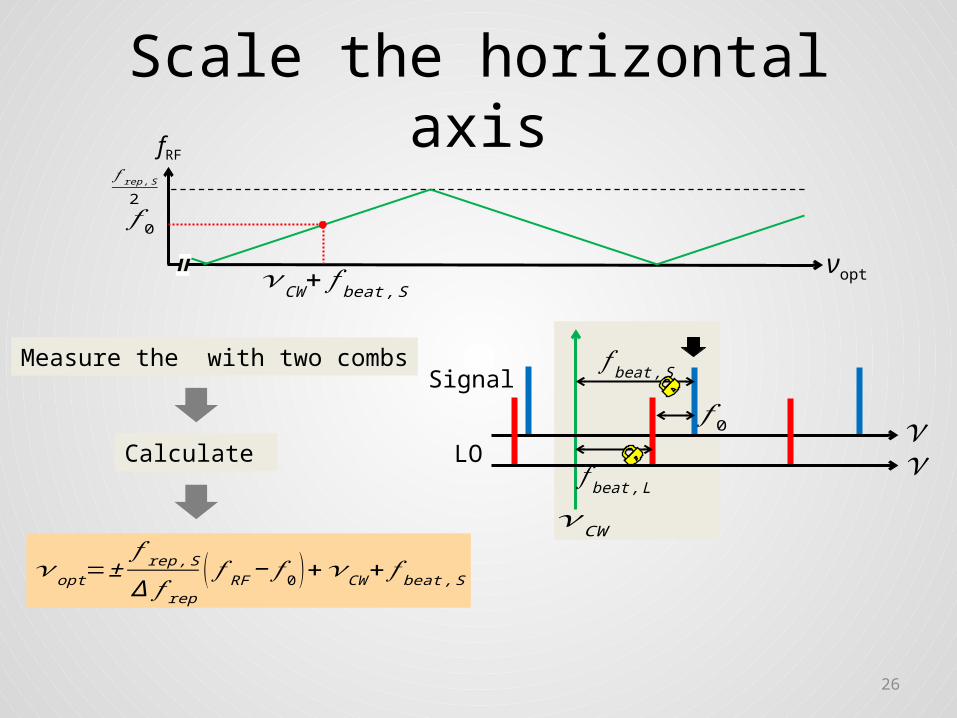
Scale the horizontal axis𝑓 rep , S
2
fRF
νopt
Measure the with two combs
Calculate
𝜈CW + 𝑓 beat , S
𝑓 0
𝑓 beat ,S
𝜈CW
Signal
LO
𝑓 0 𝜈𝜈𝑓 beat , L
𝜈opt=±𝑓 rep , S
Δ 𝑓 rep( 𝑓 RF − 𝑓 0 )+𝜈CW+ 𝑓 beat , S
26
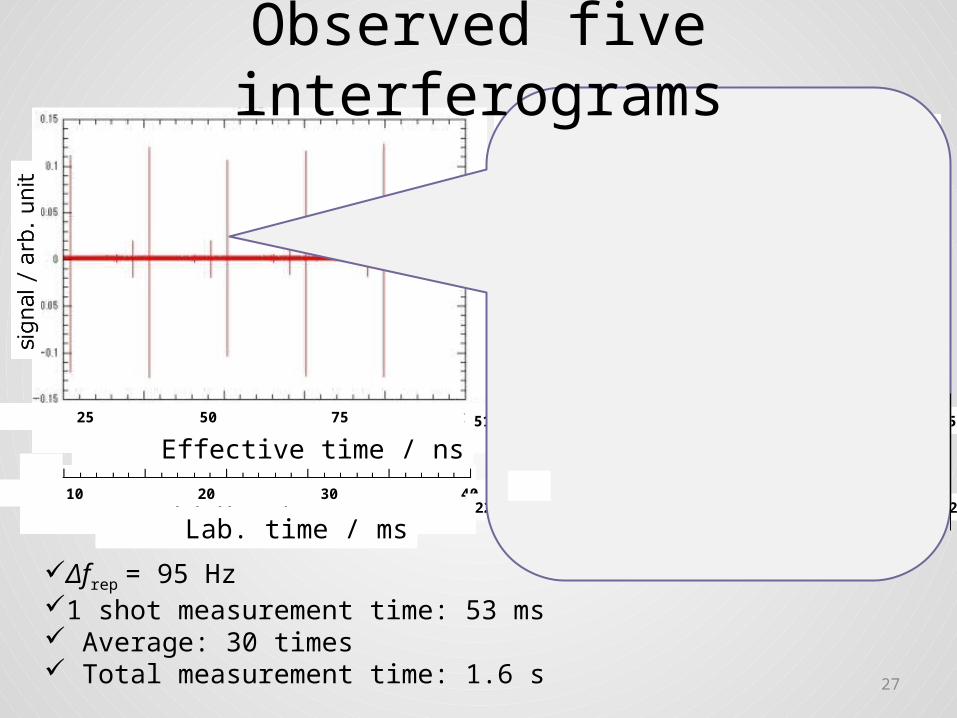
0 10 20 30 40 50
Lab. time / ms
0 25 50 75 100 125
Effective time / ns51.05 51.0525 51.055 51.0575
effective time / ns
lab. time / ms22.462 22.463 22.464 22.465
Observed five interferograms
Δfrep = 95 Hz 1 shot measurement time: 53 ms Average: 30 times Total measurement time: 1.6 s 27
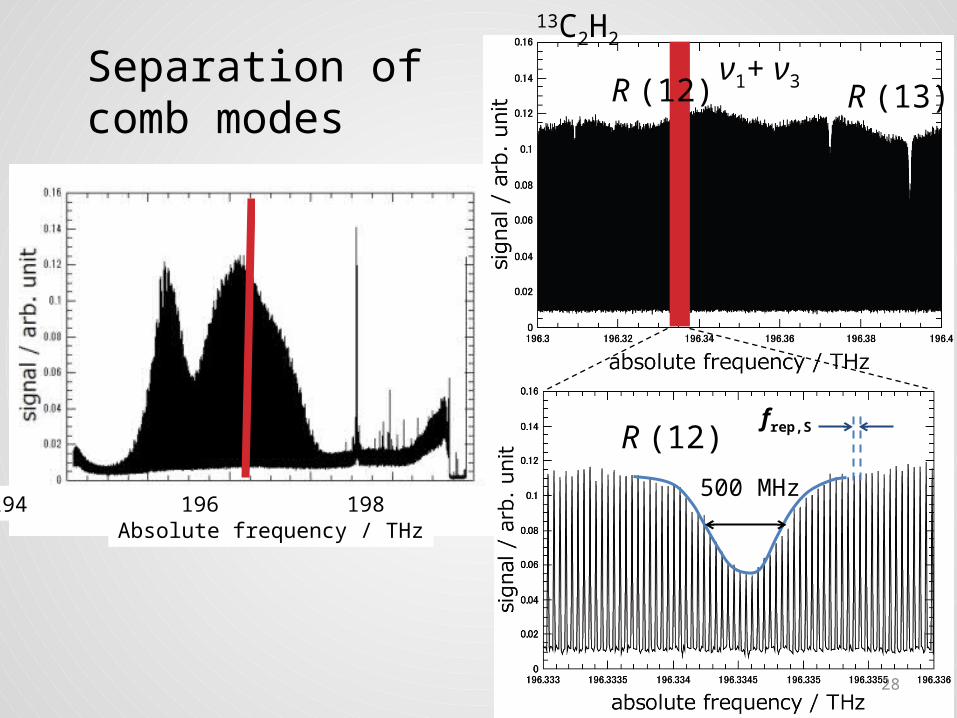
Separation of comb modes
R (12) R (13)ν1+ ν3
192 194 196 198 200 202 Absolute frequency / THz
frep,SR (12)
500 MHz
13C2H2
28
・・・
・・・fceo
fceo
CW laser #1
Function generator 30 MHz
Pump LD
fbeat
29
Signal comb
LO comb
Pump LD
EOM, PZT, Peltier
EOM, PZT, Peltier
CW laser #2
RBW: 1HzVBW: 1Hz
Less than 1 Hz
5 Hz
PZTTemp.
Measurement of the relative linewidth
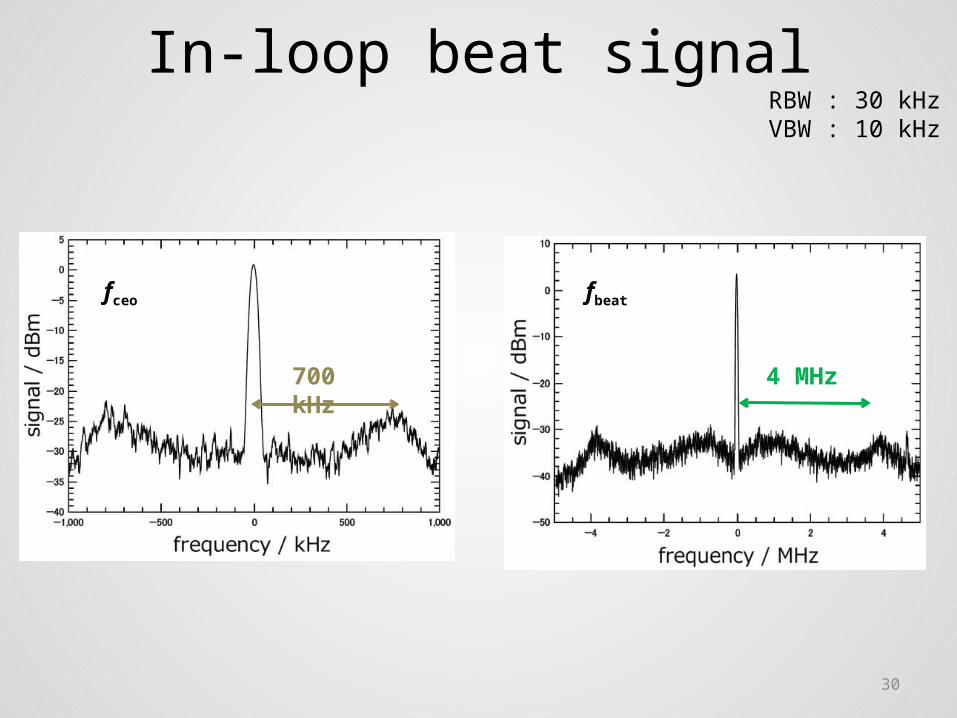
700 kHz
In-loop beat signal
4 MHz
RBW : 30 kHzVBW : 10 kHz
fceo fbeat
30
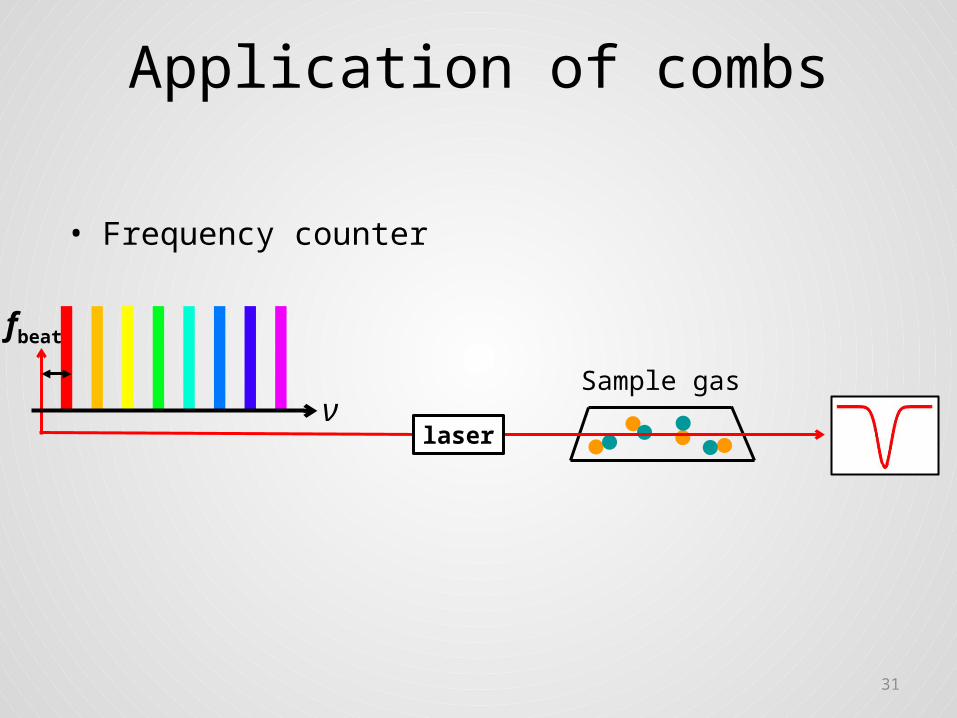
Application of combs
• Frequency counter
fbeat
laser
Sample gas
31
ν


![Finale 2005 - [Êxodus]€¦ · b b b b b b b bbb bbb bbb bbb b c c c c c c c c c c c c c c c c..... Requinta (Eb) 1º Clarinete (Bb) 2º Clarinete (Bb) 3º Clarinete (Bb) Sax-Alto](https://img.pdfslide.tips/doc/110x75/5e8db1d8e79ae379b8122648/finale-2005-xodus-b-b-b-b-b-b-b-bbb-bbb-bbb-bbb-b-c-c-c-c-c-c-c-c-c-c-c-c.jpg)
![Finale 2003 - [Untitled1] · B & & V? &?? b b bbb bbb # # b b b b b b b b b b b c c c c c c c c c c c c c c c c c Bb-Klarinette 1 Bb-Klarinette 2 Horn in F 1 Horn in F 2 Bb-Trompete](https://img.pdfslide.tips/doc/110x75/5ed198800fa647477a71b28d/finale-2003-untitled1-b-v-b-b-bbb-bbb-b-b-b-b-b-b-b.jpg)


![C C!C!C B]B B¥BlB·BrB¢B®B B¤B~B B BdB·B - Fujitsu...C C!C!C B]B B¥BlB·BrB¢B®B1.3. B 4?" B 1 !ªB1 2 ¸ {AîBpB·B Bt / 0 C C!C!C Ñ!ª(*B1 Ñ " H 0 B BpB·B Bt Ñ!ª o 0](https://img.pdfslide.tips/doc/110x75/60a9b5ef1dcf032ca5305f6d/c-ccc-bb-bblbbrbbb-bbb-b-bdbb-fujitsu-c-ccc-bb-bblbbrbbb13.jpg)


![(Finale 2007 - [Grof .6.MUS]) · 2019. 7. 16. · bb bb bb bb bb bb bb b b b b b b b b b b bb bb bb bb bb bb bb bb bb bb bb bbb bb bbb c c c c c c c c c c c c c c c c c c c c c c](https://img.pdfslide.tips/doc/110x75/60d0170622ccf9590372dea8/finale-2007-grof-6mus-2019-7-16-bb-bb-bb-bb-bb-bb-bb-b-b-b-b-b-b-b.jpg)