Embed Size (px)
Citation preview
KARAYOLLARI GENEL MÜDÜRLÜĞÜ (2017) General Directorate Of Highways
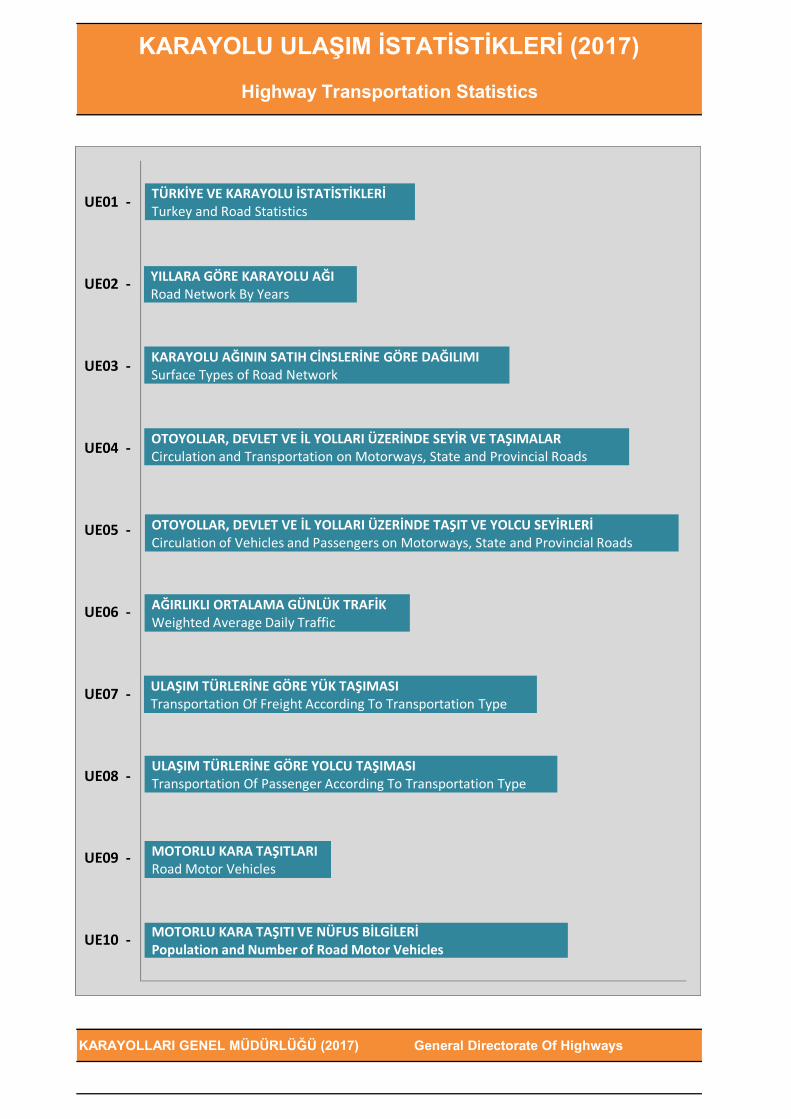
KARAYOLU ULAŞIM İSTATİSTİKLERİ (2017)
Highway Transportation Statistics
UE10 -
UE09 -
UE08 -
UE07 -
UE06 -
UE05 -
UE04 -
UE03 -
UE02 -
UE01 - TÜRKİYE VE KARAYOLU İSTATİSTİKLERİ Turkey and Road Statistics
YILLARA GÖRE KARAYOLU AĞIRoad Network By Years
KARAYOLU AĞININ SATIH CİNSLERİNE GÖRE DAĞILIMISurface Types of Road Network
OTOYOLLAR, DEVLET VE İL YOLLARI ÜZERİNDE SEYİR VE TAŞIMALARCirculation and Transportation on Motorways, State and Provincial Roads
OTOYOLLAR, DEVLET VE İL YOLLARI ÜZERİNDE TAŞIT VE YOLCU SEYİRLERİ Circulation of Vehicles and Passengers on Motorways, State and Provincial Roads
AĞIRLIKLI ORTALAMA GÜNLÜK TRAFİK Weighted Average Daily Traffic
MOTORLU KARA TAŞITLARIRoad Motor Vehicles
MOTORLU KARA TAŞITI VE NÜFUS BİLGİLERİ Population and Number of Road Motor Vehicles
ULAŞIM TÜRLERİNE GÖRE YÜK TAŞIMASITransportation Of Freight According To Transportation Type
ULAŞIM TÜRLERİNE GÖRE YOLCU TAŞIMASITransportation Of Passenger According To Transportation Type

TÜRKİYE YÜZÖLÇÜMÜ (Km²) VE NÜFUS Area of Turkey(Sq.Km) and Population
YÜZÖLÇÜM (**) 780 043 Area
NÜFUS (*) 80 810 525 Population
KARAYOLU AĞI (Km) Road Networks (Km)
OTOYOLLAR 2 157 Motorways
DEVLET YOLLARI 31 066 State Roads
İL YOLLARI 33 896 Provincial Roads
TOPLAM 67 119 Total
KAPLAMALI YOL YÜZDESİ %94 Percentage of Paved Roads
Km² ALANA DÜŞEN YOL YOĞUNLUĞU (m) 86 Density of Total Network in meters per sq . Km
MOTORLU KARA TAŞITLARI (*) Road Motor Vehicles
OTOMOBİL 12 035 978 Passenger Car
MİNİBÜS 478 618 Minibus
OTOBÜS 221 885 Buses and Coaches
KAMYONET 3 642 625 Pickup
KAMYON 838 718 Truck
MOTOSİKLET 3 102 800 Motorcycle
ÖZEL AMAÇLI TAŞITLAR 60 099 Special Purpose Vehicles
TRAKTÖR 1 838 222 Tractor
TOPLAM 22 218 945 Total
YILLIK YENİ TAŞIT KAYDI (*) Vehicles Registered for the First Time
OTOMOBİL 741 902 Passenger Car
MİNİBÜS 16 758 Minibus
OTOBÜS 10 993 Buses and Coaches
KAMYONET 212 616 Pickup
KAMYON 23 995 Truck
MOTOSİKLET 157 779 Motorcycle
ÖZEL AMAÇLI TAŞITLAR 7 613 Special Purpose Vehicles
TRAKTÖR 75 793 Tractor
TOPLAM 1 247 449 Total
TAŞIT SAHİPLİLİĞİ Ownership Of Vehicle
1000 KİŞİYE DÜŞEN OTOMOBİL ADEDİ 149 Number of Cars per 1000 People
1000 KİŞİYE DÜŞEN ARAÇ SAYISI 275 Number of Vehicles per 1000 People
KAYNAKLAR VE AÇIKLAMALAR Sources and Explanations
* Türkiye İstatistik Kurumu Turkish Statistical Institute
** Harita Genel Müdürlüğü General Directorate of Mapping
Veriler 2017 yıl sonu değerleridir All figures are given as the end of 2017
UE01. TÜRKİYE VE KARAYOLU İSTATİSTİKLERİ - 2017
Turkey and Road Statistics - 2017

YIL OTOYOLLAR DEVLET YOLLARI İL YOLLARI TOPLAM
Year Motorways State Roads Provincial Roads Total
1923 - 18.335 - 18.335
1930 - 29.636 - 29.636
1940 - 41.582 - 41.582
1950 - 24.306 22.774 47.080
1960 - 26.711 34.831 61.542
1970 - 35.016 24.437 59.453
1980 24 31.976 28.785 60.785
1990 241 31.149 27.979 59.369
1995 1.243 31.422 28.577 61.242
2000 1.674 31.397 29.693 62.764
2001 1.696 31.376 29.929 63.001
2002 1.714 31.318 30.050 63.082
2003 1.753 31.358 30.133 63.244
2004 1.662 31.446 30.368 63.476
2005 1.667 31.371 30.568 63.606
2006 1.908 31.335 30.429 63.672
2007 1.908 31.333 30.579 63.820
2008 1.922 31.311 30.712 63.945
2009 2.036 31.271 30.948 64.255
2010 2.080 31.395 31.390 64.865
2011 2.119 31.372 31.558 65.049
2012 2.127 31.375 31.880 65.382
2013 2.127 31.341 32.155 65.623
2014 2.155 31.280 32.474 65.909
2015 2.159 31.213 33.065 66.437
2016 2.155 31.106 33.513 66.774
2017 2.157 31.066 33.896 67.119
KAYNAKLAR VE AÇIKLAMALAR Sources and Explanations
Veriler yıl sonu itibarıyladır. Values are given by the end of year.
YOL UZUNLUKLARI - Km Length of Roads - Km
UE02. YILLARA GÖRE KARAYOLU AĞI
Road Network By Years

YOL UZUNLUKLARI - Km
YILASFALT BETON
SATHİ KAPLAMA
PARKE YOLLAR
STABİLİZE YOLLARTOPRAK YOLLAR
GEÇİT VERMEYEN YOLLAR
TOPLAM UZUNLUK
YearAsphaltic Concrete
Surface Treatment
Stone Block Roads
Stabilized Roads Earth Roads Primitive Roads Total Length
1923 - - - 13.885 2.450 2.000 18.335
1930 - - - 13.696 8.819 7.121 29.636
1940 - 352 - 17.879 13.171 10.180 41.582
1950 336 1.111 177 22.590 10.311 12.555 47.080
1960 216 6.677 156 34.990 9.168 10.335 61.542
1970 1.534 17.481 211 28.899 8.517 2.811 59.453
1980 2.846 32.848 140 18.508 4.605 1.838 60.785
1990 4.502 43.200 136 8.803 1.356 1.372 59.369
1995 6.078 45.849 121 6.552 1.330 1.312 61.242
2000 7.731 49.709 134 3.026 1.144 1.020 62.764
2001 8.148 50.028 139 2.615 1.113 958 63.001
2002 8.591 49.943 126 2.605 1.025 792 63.082
2003 8.683 50.218 132 2.441 1.018 752 63.244
2004 8.692 50.461 136 2.236 1.214 737 63.476
2005 8.747 50.302 133 2.207 1.329 888 63.606
2006 9.112 50.159 135 2.132 1.226 908 63.672
2007 9.314 50.619 158 1.796 947 986 63.820
2008 9.926 50.305 168 1.600 862 1.084 63.945
2009 10.717 49.782 180 1.490 783 1.303 64.255
2010 12.277 48.929 212 1.314 782 1.351 64.865
2011 13.680 47.912 212 1.077 721 1.447 65.049
2012 15.277 46.462 256 1.069 666 1.652 65.382
2013 16.997 45.294 261 852 632 1.587 65.623
2014 18.077 44.277 273 891 599 1.792 65.909
2015 19.254 43.726 262 744 631 1.820 66.437
2016 20.801 42.131 297 593 503 2.449 66.774
2017 22.950 40.183 314 668 520 2.484 67.119
KAYNAKLAR VE AÇIKLAMALAR Sources and Explanations
Veriler yıl sonu itibarıyladır. Values are given by the end of year.
Length of Roads - Km
UE03. KARAYOLU AĞININ SATIH CİNSLERİNE GÖRE DAĞILIMI
Surface Types of Road Network
YIL OTOYOLLAR DEVLET YOLLARI
İL YOLLARI TOPLAM OTOYOLLAR DEVLET YOLLARI
İL YOLLARI TOPLAM OTOYOLLAR DEVLET YOLLARI
İL YOLLARI TOPLAM
Year MotorwaysState Roads
Provincial Roads
Total MotorwaysState Roads
Provincial Roads
Total MotorwaysState Roads
Provincial Roads
Total
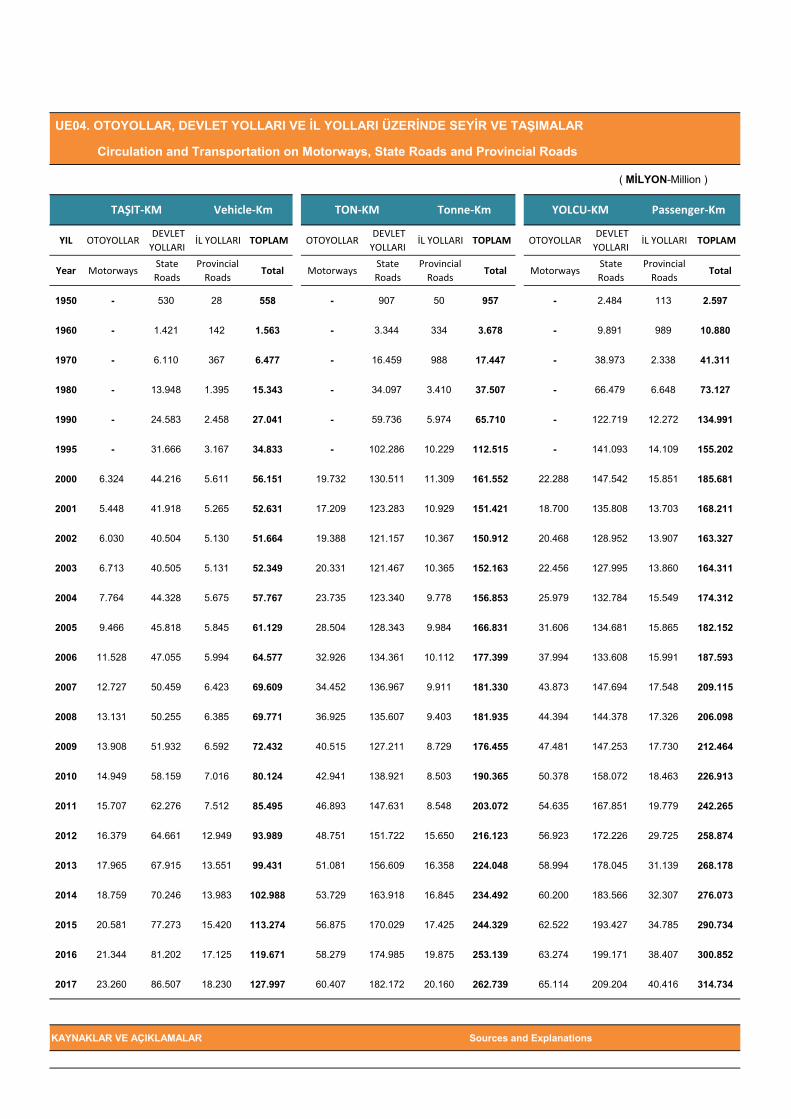
1950 - 530 28 558 - 907 50 957 - 2.484 113 2.597
1960 - 1.421 142 1.563 - 3.344 334 3.678 - 9.891 989 10.880
1970 - 6.110 367 6.477 - 16.459 988 17.447 - 38.973 2.338 41.311
1980 - 13.948 1.395 15.343 - 34.097 3.410 37.507 - 66.479 6.648 73.127
1990 - 24.583 2.458 27.041 - 59.736 5.974 65.710 - 122.719 12.272 134.991
1995 - 31.666 3.167 34.833 - 102.286 10.229 112.515 - 141.093 14.109 155.202
2000 6.324 44.216 5.611 56.151 19.732 130.511 11.309 161.552 22.288 147.542 15.851 185.681
2001 5.448 41.918 5.265 52.631 17.209 123.283 10.929 151.421 18.700 135.808 13.703 168.211
2002 6.030 40.504 5.130 51.664 19.388 121.157 10.367 150.912 20.468 128.952 13.907 163.327
2003 6.713 40.505 5.131 52.349 20.331 121.467 10.365 152.163 22.456 127.995 13.860 164.311
2004 7.764 44.328 5.675 57.767 23.735 123.340 9.778 156.853 25.979 132.784 15.549 174.312
2005 9.466 45.818 5.845 61.129 28.504 128.343 9.984 166.831 31.606 134.681 15.865 182.152
2006 11.528 47.055 5.994 64.577 32.926 134.361 10.112 177.399 37.994 133.608 15.991 187.593
2007 12.727 50.459 6.423 69.609 34.452 136.967 9.911 181.330 43.873 147.694 17.548 209.115
2008 13.131 50.255 6.385 69.771 36.925 135.607 9.403 181.935 44.394 144.378 17.326 206.098
2009 13.908 51.932 6.592 72.432 40.515 127.211 8.729 176.455 47.481 147.253 17.730 212.464
2010 14.949 58.159 7.016 80.124 42.941 138.921 8.503 190.365 50.378 158.072 18.463 226.913
2011 15.707 62.276 7.512 85.495 46.893 147.631 8.548 203.072 54.635 167.851 19.779 242.265
2012 16.379 64.661 12.949 93.989 48.751 151.722 15.650 216.123 56.923 172.226 29.725 258.874
2013 17.965 67.915 13.551 99.431 51.081 156.609 16.358 224.048 58.994 178.045 31.139 268.178
2014 18.759 70.246 13.983 102.988 53.729 163.918 16.845 234.492 60.200 183.566 32.307 276.073
2015 20.581 77.273 15.420 113.274 56.875 170.029 17.425 244.329 62.522 193.427 34.785 290.734
2016 21.344 81.202 17.125 119.671 58.279 174.985 19.875 253.139 63.274 199.171 38.407 300.852
2017 23.260 86.507 18.230 127.997 60.407 182.172 20.160 262.739 65.114 209.204 40.416 314.734
KAYNAKLAR VE AÇIKLAMALAR Sources and Explanations
UE04. OTOYOLLAR, DEVLET YOLLARI VE İL YOLLARI ÜZERİNDE SEYİR VE TAŞIMALAR
Circulation and Transportation on Motorways, State Roads and Provincial Roads
( MİLYON-Million )
Tonne-Km Vehicle-KmTAŞIT-KM YOLCU-KM Passenger-KmTON-KM
YIL Otomobil Otobüs Kamyon TOPLAM Otomobil Otobüs Kamyon TOPLAM
Year Passenger Car Bus Truck TOTAL Passenger Car Bus Truck TOTAL
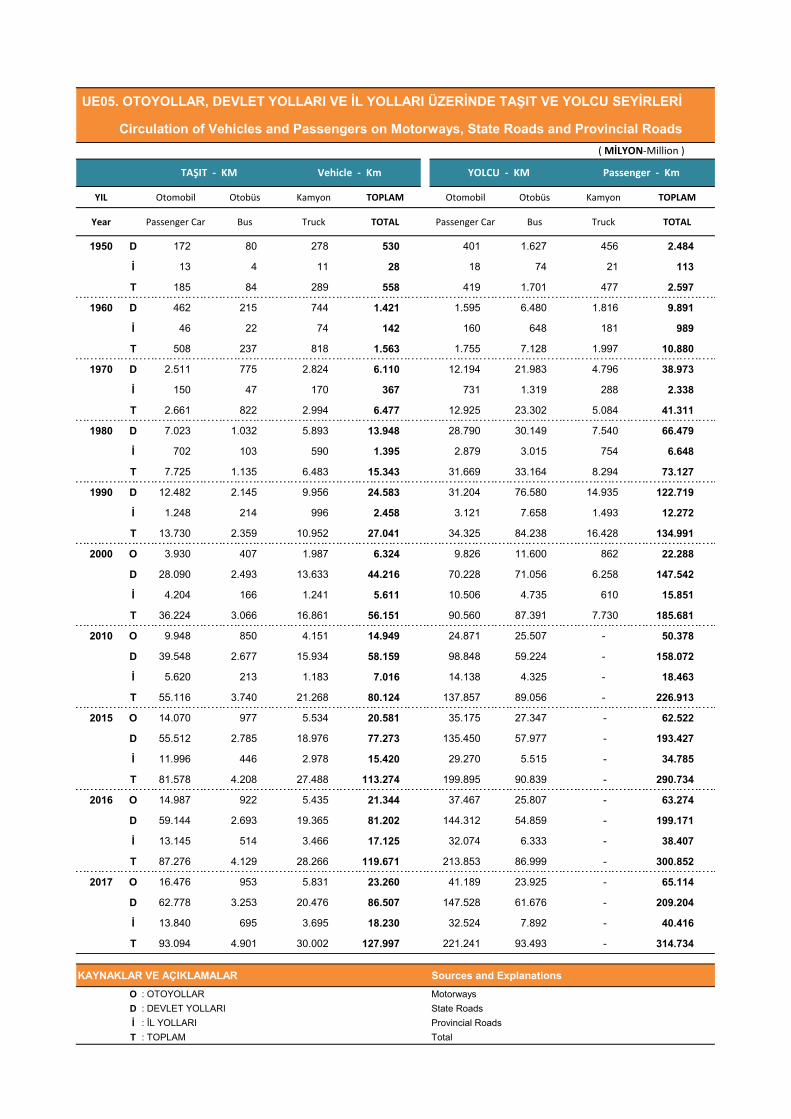
1950 D 172 80 278 530 401 1.627 456 2.484
İ 13 4 11 28 18 74 21 113
T 185 84 289 558 419 1.701 477 2.597
1960 D 462 215 744 1.421 1.595 6.480 1.816 9.891
İ 46 22 74 142 160 648 181 989
T 508 237 818 1.563 1.755 7.128 1.997 10.880
1970 D 2.511 775 2.824 6.110 12.194 21.983 4.796 38.973
İ 150 47 170 367 731 1.319 288 2.338
T 2.661 822 2.994 6.477 12.925 23.302 5.084 41.311
1980 D 7.023 1.032 5.893 13.948 28.790 30.149 7.540 66.479
İ 702 103 590 1.395 2.879 3.015 754 6.648
T 7.725 1.135 6.483 15.343 31.669 33.164 8.294 73.127
1990 D 12.482 2.145 9.956 24.583 31.204 76.580 14.935 122.719
İ 1.248 214 996 2.458 3.121 7.658 1.493 12.272
T 13.730 2.359 10.952 27.041 34.325 84.238 16.428 134.991
2000 O 3.930 407 1.987 6.324 9.826 11.600 862 22.288
D 28.090 2.493 13.633 44.216 70.228 71.056 6.258 147.542
İ 4.204 166 1.241 5.611 10.506 4.735 610 15.851
T 36.224 3.066 16.861 56.151 90.560 87.391 7.730 185.681
2010 O 9.948 850 4.151 14.949 24.871 25.507 - 50.378
D 39.548 2.677 15.934 58.159 98.848 59.224 - 158.072
İ 5.620 213 1.183 7.016 14.138 4.325 - 18.463
T 55.116 3.740 21.268 80.124 137.857 89.056 - 226.913
2015 O 14.070 977 5.534 20.581 35.175 27.347 - 62.522
D 55.512 2.785 18.976 77.273 135.450 57.977 - 193.427
İ 11.996 446 2.978 15.420 29.270 5.515 - 34.785
T 81.578 4.208 27.488 113.274 199.895 90.839 - 290.734
2016 O 14.987 922 5.435 21.344 37.467 25.807 - 63.274
D 59.144 2.693 19.365 81.202 144.312 54.859 - 199.171
İ 13.145 514 3.466 17.125 32.074 6.333 - 38.407
T 87.276 4.129 28.266 119.671 213.853 86.999 - 300.852
2017 O 16.476 953 5.831 23.260 41.189 23.925 - 65.114
D 62.778 3.253 20.476 86.507 147.528 61.676 - 209.204
İ 13.840 695 3.695 18.230 32.524 7.892 - 40.416
T 93.094 4.901 30.002 127.997 221.241 93.493 - 314.734
KAYNAKLAR VE AÇIKLAMALAR Sources and Explanations
O : OTOYOLLAR Motorways D : DEVLET YOLLARI State Roads İ : İL YOLLARI Provincial RoadsT : TOPLAM Total
UE05. OTOYOLLAR, DEVLET YOLLARI VE İL YOLLARI ÜZERİNDE TAŞIT VE YOLCU SEYİRLERİ
Circulation of Vehicles and Passengers on Motorways, State Roads and Provincial Roads
Passenger - KmYOLCU - KMVehicle - KmTAŞIT - KM
( MİLYON-Million )

YIL OTOMOBİL % OTOBÜS % KAMYON % TOPLAM
Year Passenger Car % Bus % Truck % Total
1950 19 32,2 9 15,3 31 52,5 59
1960 47 32,4 22 15,2 76 52,4 145
1970 196 41,0 61 12,8 221 46,2 478
1980 602 50,4 88 7,4 505 42,3 1.195
1990 1.105 50,9 195 9,0 873 40,2 2.173
1995 1.685 60,4 206 7,4 899 32,2 2.790
2000 2.482 63,7 220 5,6 1.192 30,6 3.894
2001 2.363 63,8 211 5,7 1.132 30,5 3.706
2002 2.266 63,3 206 5,8 1.109 31,0 3.581
2003 2.273 63,3 204 5,7 1.113 31,0 3.590
2004 2.565 65,7 233 6,0 1.109 28,4 3.907
2005 2.636 65,4 233 5,8 1.163 28,8 4.032
2006 2.730 65,8 221 5,3 1.196 28,8 4.147
2007 2.953 66,5 227 5,1 1.262 28,4 4.442
2008 2.958 67,0 220 5,0 1.238 28,0 4.416
2009 3.080 67,4 225 4,9 1.263 27,6 4.568
2010 3.309 67,3 230 4,7 1.378 28,0 4.917
2011 3.704 68,3 237 4,4 1.485 27,4 5.426
2012 3.900 69,1 235 4,2 1.511 26,8 5.647
2013 4.136 69,7 237 4,0 1.564 26,3 5.937
2014 4.342 70,6 235 3,8 1.575 25,6 6.152
2015 4.873 71,8 244 3,6 1.666 24,6 6.783
2016 5.209 72,8 237 3,3 1.706 23,9 7.152
2017 5.558 72,5 290 3,8 1.822 23,8 7.670
KAYNAKLAR VE AÇIKLAMALAR Sources and Explanations
DEVLET YOLLARI State Roads
UE06. AĞIRLIKLI ORTALAMA GÜNLÜK TRAFİK
Weighted Average Daily Traffic
TON-KM - Tonne-Km
YIL
Year
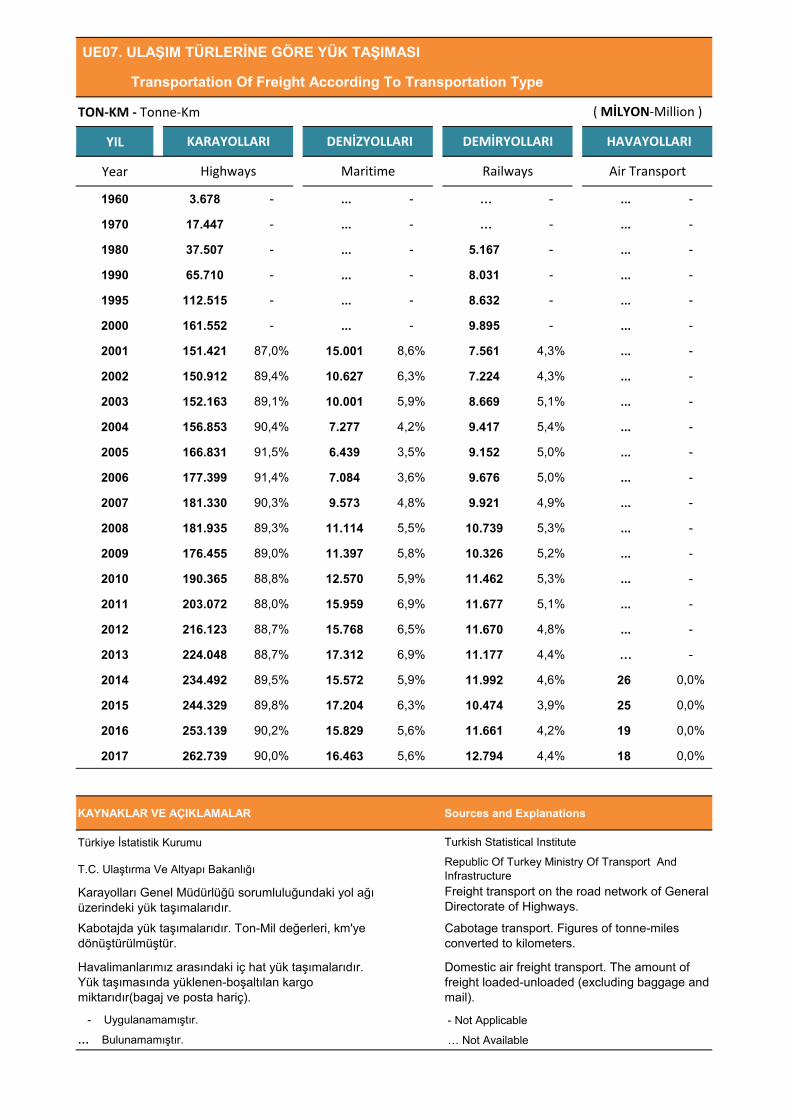
1960 3.678 - ... - … - ... -
1970 17.447 - ... - … - ... -
1980 37.507 - ... - 5.167 - ... -
1990 65.710 - ... - 8.031 - ... -
1995 112.515 - ... - 8.632 - ... -
2000 161.552 - ... - 9.895 - ... -
2001 151.421 87,0% 15.001 8,6% 7.561 4,3% ... -
2002 150.912 89,4% 10.627 6,3% 7.224 4,3% ... -
2003 152.163 89,1% 10.001 5,9% 8.669 5,1% ... -
2004 156.853 90,4% 7.277 4,2% 9.417 5,4% ... -
2005 166.831 91,5% 6.439 3,5% 9.152 5,0% ... -
2006 177.399 91,4% 7.084 3,6% 9.676 5,0% ... -
2007 181.330 90,3% 9.573 4,8% 9.921 4,9% ... -
2008 181.935 89,3% 11.114 5,5% 10.739 5,3% ... -
2009 176.455 89,0% 11.397 5,8% 10.326 5,2% ... -
2010 190.365 88,8% 12.570 5,9% 11.462 5,3% ... -
2011 203.072 88,0% 15.959 6,9% 11.677 5,1% ... -
2012 216.123 88,7% 15.768 6,5% 11.670 4,8% ... -
2013 224.048 88,7% 17.312 6,9% 11.177 4,4% … -
2014 234.492 89,5% 15.572 5,9% 11.992 4,6% 26 0,0%
2015 244.329 89,8% 17.204 6,3% 10.474 3,9% 25 0,0%
2016 253.139 90,2% 15.829 5,6% 11.661 4,2% 19 0,0%
2017 262.739 90,0% 16.463 5,6% 12.794 4,4% 18 0,0%
KAYNAKLAR VE AÇIKLAMALAR Sources and Explanations
Türkiye İstatistik Kurumu
T.C. Ulaştırma Ve Altyapı Bakanlığı
- Not Applicable
… Not Available
Domestic air freight transport. The amount of freight loaded-unloaded (excluding baggage and mail).
Freight transport on the road network of General Directorate of Highways.
- Uygulanamamıştır.
… Bulunamamıştır.
UE07. ULAŞIM TÜRLERİNE GÖRE YÜK TAŞIMASI
Transportation Of Freight According To Transportation Type
( MİLYON-Million )
KARAYOLLARI DENİZYOLLARI DEMİRYOLLARI
Havalimanlarımız arasındaki iç hat yük taşımalarıdır. Yük taşımasında yüklenen-boşaltılan kargo miktarıdır(bagaj ve posta hariç).
Kabotajda yük taşımalarıdır. Ton-Mil değerleri, km'ye dönüştürülmüştür.
Republic Of Turkey Ministry Of Transport And Infrastructure
HAVAYOLLARI
Cabotage transport. Figures of tonne-miles converted to kilometers.
Karayolları Genel Müdürlüğü sorumluluğundaki yol ağı üzerindeki yük taşımalarıdır.
Turkish Statistical Institute
Highways Maritime Railways Air Transport

YOLCU-KM - Passenger-Km
YIL
Year
1960 10.880 - … - … - … -
1970 41.311 - … - … - … -
1980 73.127 - … - … - … -
1990 134.991 - … - … - … -
1995 155.202 - ... - … - … -
2000 185.681 - ... - … - … -
2001 168.211 95,2% 57 0,0% 5.568 3,2% 2.859 1,6%
2002 163.327 95,4% 39 0,0% 5.204 3,0% 2.706 1,6%
2003 164.311 95,0% 41 0,0% 5.878 3,4% 2.752 1,6%
2004 174.312 94,8% 1.150 0,6% 5.237 2,8% 3.223 1,8%
2005 182.152 94,7% 1.241 0,6% 5.036 2,6% 3.992 2,1%
2006 187.593 96,6% 1.393 0,7% 5.277 2,7% ... -
2007 209.115 96,7% 1.561 0,7% 5.553 2,6% ... -
2008 206.098 96,9% 1.570 0,7% 5.097 2,4% ... -
2009 212.464 96,8% 1.643 0,7% 5.374 2,4% ... -
2010 226.913 97,0% 1.570 0,7% 5.491 2,3% ... -
2011 242.265 90,5% 1.570 0,6% 5.882 2,2% 18.016 6,7%
2012 258.874 91,0% 1.417 0,5% 4.598 1,6% 19.731 6,9%
2013 268.178 90,5% 1.667 0,6% 3.020(*) 1,0% 23.357 7,9%
2014 276.073 89,8% 1.806 0,6% 3.458(*) 1,1% 26.204 8,5%
2015 290.734 89,2% 1.836 0,6% 3.708(*) 1,1% 29.790 9,1%
2016 300.852 89,0% 2.059 0,6% 3.323 1,1% 31.730 9,4%
2017 314.734 88,8% 1.833 0,5% 3.683 1,0% 34.018 9,6%
KAYNAKLAR VE AÇIKLAMALAR Sources and Explanations
Türkiye İstatistik Kurumu
T.C. Ulaştırma ve Altyapı Bakanlığı
Havalimanlarımız arasındaki iç hat yolcu taşımalarıdır.
- Not Applicable
… Not Available
- Uygulanamamıştır
… Bulunamamıştır
Kabotajda yolcu taşımalarıdır. Yolcu-Mil değerleri, km'ye dönüştürülmüştür.
Karayolları Genel Müdürlüğü sorumluluğundaki yol ağı üzerindeki yolcu taşımalarıdır.
Passenger transport on the road network of General Directorate of Highways.
(*) TCDD'ye ait yolcu taşımalarıdır. Yolcu taşımalarında banliyö hariç tutulmuştur.
(*) Passenger transport by Turkish State Railways (TCDD). Suburban lines are not included.
Cabotage transport. Figures of tonne-miles converted to kilometers.
Domestic air passenger transport.
Republic Of Turkey Ministry Of Transport And Infrastructure
UE08. ULAŞIM TÜRLERİNE GÖRE YOLCU TAŞIMACILIĞI
Transportation Of Passenger According To Transportation Type
KARAYOLLARI
Turkish Statistical Institute
( MİLYON-Million )
Highways Maritime Railways Air Transport
HAVAYOLLARI DENİZYOLLARI DEMİRYOLLARI
(*)
(*)

YIL OTOMOBİL MİNİBÜS OTOBÜS KAMYONET KAMYON MOTOSİKLET Ö.A.T. Y.İ.M* TRAKTÖR TOPLAM
YearPassenger
CarMinibus Bus Small truck Truck Motorcy. S.P.V. R.W.M.* Tractor Total
1950 13.405 - 3.755 - 15.404 3.464 - - - 36.028
1960 45.767 - 10.981 - 57.460 9.380 - - - 123.588
1970 137.771 20.916 15.980 52.152 70.730 60.994 5.070 6.195 - 369.808
1980 742.252 64.707 32.783 165.821 164.893 137.931 11.777 24.090 352.427 1.696.681
1990 1.649.879 125.399 63.700 263.407 257.353 531.941 26.519 63.024 769.456 3.750.678
1995 3.058.511 173.051 90.197 397.743 321.421 819.922 37.272 87.214 937.528 5.922.859
2000 4.422.180 235.885 118.454 794.459 394.283 1.011.284 55.677 129.157 1.159.070 8.320.449
2001 4.534.803 239.381 119.306 833.175 396.493 1.031.221 57.490 131.019 1.179.068 8.521.956
2002 4.600.140 241.700 120.097 875.381 399.025 1.046.907 58.790 133.003 1.180.127 8.655.170
2003 4.700.343 245.394 123.500 973.457 405.034 1.073.415 60.511 137.933 1.184.256 8.903.843
2004 5.400.440 318.954 152.712 1.259.867 647.420 1.218.677 28.004 - 1.210.283 10.236.357
2005 5.772.745 338.539 163.390 1.475.057 676.929 1.441.066 30.333 - 1.247.767 11.145.826
2006 6.140.992 357.523 175.949 1.695.624 709.535 1.822.831 34.260 - 1.290.679 12.227.393
2007 6.472.156 372.601 189.128 1.890.459 729.202 2.003.492 38.573 - 1.327.334 13.022.945
2008 6.796.629 383.548 199.934 2.066.007 744.217 2.181.383 35.100 - 1.358.577 13.765.395
2009 7.093.964 384.053 201.033 2.204.951 727.302 2.303.261 34.104 - 1.368.032 14.316.700
2010 7.544.871 386.973 208.510 2.399.038 726.359 2.389.488 35.492 - 1.404.872 15.095.603
2011 8.113.111 389.435 219.906 2.611.104 728.458 2.527.190 34.116 - 1.466.208 16.089.528
2012 8.648.875 396.119 235.949 2.794.606 751.650 2.657.722 33.071 - 1.515.421 17.033.413
2013 9.283.923 421.848 219.885 2.933.050 755.950 2.722.826 36.148 - 1.565.817 17.939.447
2014 9.857.915 427.264 211.200 3.062.479 773.728 2.828.466 40.731 - 1.626.938 18.828.721
2015 10.589.337 449.213 217.056 3.255.299 804.319 2.938.364 45.732 - 1.695.152 19.994.472
2016 11.317.998 463.933 220.361 3.442.483 825.334 3.003.733 50.818 - 1.765.764 21.090.424
2017 12.035.978 478.618 221.885 3.642.625 838.718 3.102.800 60.099 - 1.838.222 22.218.945
KAYNAKLAR VE AÇIKLAMALAR Sources and Explanations
Türkiye İstatistik Kurumu Turkish Statistical InstituteÖ.A.T. : Özel Amaçlı Taşıtlar S.P.V. : Special Purpose VehiclesY.İ.M. : Yol ve İş Makinaları R.W.M. : Road & Work Machinery
Road Motor Vehicles
UE09. MOTORLU KARA TAŞITLARI
* Since 2004, vehicles covered under work machinery andheavy vehicles covered under special purpose vehicles areshown under "Truck" figures.
*2004 yılından itibaren iş makinaları kapsamında yayımlanan taşıtlarile özel amaçlı taşıtlar içinde yer alan ağır tonajlı taşıtlar “Kamyon”başlığı altında gösterilmiştir.

YIL NÜFUS (BİN) (1) MOTORLU KARA TAŞITLARI SAYISI
1000 KİŞİYE DÜŞEN TAŞIT SAYISI
1000 KİŞİYE DÜŞEN OTOMOBİL SAYISI
Year Population (Thousand)Number of Road Motor
VehiclesNumber of Vehicles Per
1000 PeopleNumber of Cars Per 1000
People
1970 35.605 369.808 10 4
1980 44.737 1.696.681 38 17
1990 56.473 3.750.678 66 29
1995 59.756 5.922.859 99 51
2000 64.730 8.320.449 129 68
2001 65.603 8.521.956 130 69
2002 66.402 8.655.170 130 69
2003 67.187 8.903.843 133 70
2004 68.010 10.236.357 151 79
2005 68.861 11.145.826 162 84
2006 69.730 12.227.393 175 88
2007 70.586 13.022.945 184 92
2008 71.517 13.765.395 192 95
2009 72.561 14.316.700 197 98
2010 73.723 15.095.603 205 102
2011 74.724 16.089.528 215 109
2012 75.627 17.033.413 225 114
2013 76.668 17.939.447 234 121
2014 77.696 18.828.721 242 127
2015 78.741 19.994.472 254 134
2016 79.815 21.090.424 264 142
2017 80.811 22.218.945 275 149
KAYNAKLAR VE AÇIKLAMALAR Sources and Explanations
Turkish Statistical Institute
UE10. MOTORLU KARA TAŞITI VE NÜFUS BİLGİLERİ
Population and Number of Road Motor Vehicles
Türkiye İstatistik Kurumu
(1)Genel Nüfus Sayımları, 1927-1995 TÜİK Nüfus Tahminleri, 2000-2006 Adrese Dayalı Nüfus Kayıt Sistemi (ADNKS), 2007-2017
(1)Population Census, 1927-1995 TURKSTAT Population Estimates, 2000-2006 Address Based Population Registration System (ABPRS), 2007-2017

Otomobil Kamyonet Motosiklet Traktör Kamyon Minibüs Otobüs Özel AmaçlıTaşıtlar
54,2%
16,4%14,0%
8,3% 3,8% 2,2% 1,0% 0,3%
TRAFİĞE KAYITLI MOTORLU KARA TAŞITLARININ DAĞILIMI- 2017 Distribution of Road Motor Vehicles Registered to Traffic - 2017
0
5.000.000
10.000.000
15.000.000
20.000.000
25.000.000
2000 2001 2002 2003 2004 2005 2006 2007 2008 2009 2010 2011 2012 2013 2014 2015 2016 2017
YILLARA GÖRE MOTORLU KARA TAŞITLARI (TOPLAM)Number of Road Motor Vehicles by years (Total)
Passenger car Pickup Motorcycle Tractor Truck Minibus Bus Special Purpose Vehicles

*2004 yılından itibaren yol iş makinaları kapsamında yayımlanan taşıtlar ile özel amaçlı taşıtlar içinde yer alan ağır tonajlı taşıtlar "Kamyon" başlığı altında gösterilmiştir.*Since 2004, vehicles covered under work machinery and heavy vehicles covered under special purpose vehicles are shown under "Truck" figures.
0
2.000.000
4.000.000
6.000.000
8.000.000
10.000.000
12.000.000
14.000.000
2000 2001 2002 2003 2004 2005 2006 2007 2008 2009 2010 2011 2012 2013 2014 2015 2016 2017
YILLARA GÖRE OTOMOBİL SAYISINumber of Passenger Cars by Years
0
25.000
50.000
75.000
100.000
125.000
150.000
175.000
200.000
225.000
250.000
2000 2001 2002 2003 2004 2005 2006 2007 2008 2009 2010 2011 2012 2013 2014 2015 2016 2017
YILLARA GÖRE OTOBÜS SAYISINumber of Buses by Years
0
100.000
200.000
300.000
400.000
500.000
600.000
700.000
800.000
900.000
2000 2001 2002 2003 2004 2005 2006 2007 2008 2009 2010 2011 2012 2013 2014 2015 2016 2017
YILLARA GÖRE KAMYON SAYISINumber of Trucks by years

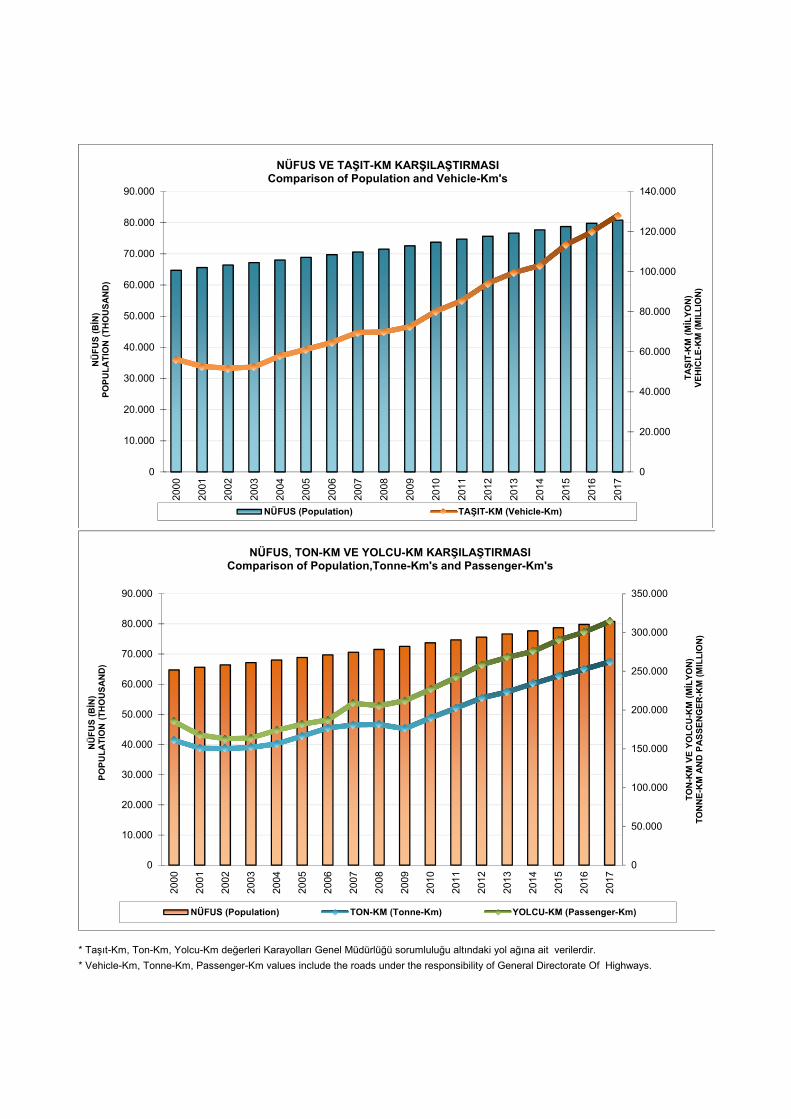
* Taşıt-Km, Ton-Km, Yolcu-Km değerleri Karayolları Genel Müdürlüğü sorumluluğu altındaki yol ağına ait verilerdir.
* Vehicle-Km, Tonne-Km, Passenger-Km values include the roads under the responsibility of General Directorate Of Highways.
56.1
51
52.6
31
51.6
64
52.3
49
57.7
67
61.1
29
64.5
77
69.6
09
69.7
71
72.4
32
80.1
24
85.4
95
93.9
89
99.4
31
102.
988
113.
274
119.
671
127.
997
0
20.000
40.000
60.000
80.000
100.000
120.000
140.000
2000 2001 2002 2003 2004 2005 2006 2007 2008 2009 2010 2011 2012 2013 2014 2015 2016 2017
Taşı
t -Km
(Mily
on)
Vehi
cle-
Km (M
illio
n)
YILLARA GÖRE TAŞIT-KM DEĞERLERİ(Vehicle-Km values by years)
161.
552
151.
421
150.
912
152.
163
156.
853
166.
831
177.
399
181.
330
181.
935
176.
455
190.
365
203.
072
216.
123
224.
048
234.
492
244.
329
253.
139
262.
739
0
50.000
100.000
150.000
200.000
250.000
300.000
2000 2001 2002 2003 2004 2005 2006 2007 2008 2009 2010 2011 2012 2013 2014 2015 2016 2017
Ton
-Km
(Mily
on)
Tonn
e-Km
(Mill
ion)
YILLARA GÖRE TON-KM DEĞERLERİ(Tonne-Km values by years)
185.
681
168.
211
163.
327
164.
311
174.
312
182.
152
187.
593
209.
115
206.
098
212.
464
226.
913
242.
265
258.
874
268.
178
276.
073
290.
734
300.
852
314.
734
0
50.000
100.000
150.000
200.000
250.000
300.000
350.000
2000 2001 2002 2003 2004 2005 2006 2007 2008 2009 2010 2011 2012 2013 2014 2015 2016 2017
Yolc
u -K
m (M
ilyon
)Pa
ssen
ger K
m (M
illio
n)
YILLARA GÖRE YOLCU-KM DEĞERLERİ(Passenger-Km values by years)
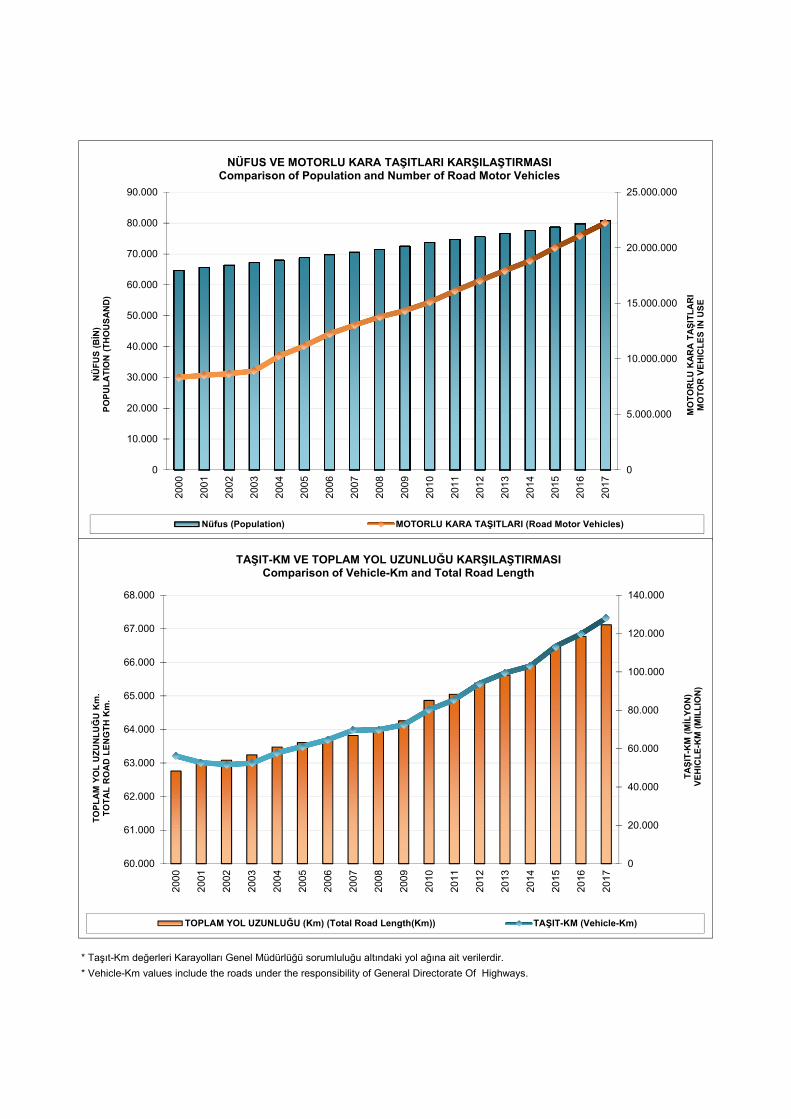
* Taşıt-Km değerleri Karayolları Genel Müdürlüğü sorumluluğu altındaki yol ağına ait verilerdir. * Vehicle-Km values include the roads under the responsibility of General Directorate Of Highways.
0
5.000.000
10.000.000
15.000.000
20.000.000
25.000.000
0
10.000
20.000
30.000
40.000
50.000
60.000
70.000
80.000
90.00020
00
2001
2002
2003
2004
2005
2006
2007
2008
2009
2010
2011
2012
2013
2014
2015
2016
2017
MO
TOR
LU K
AR
A T
AŞI
TLA
RI
MO
TOR
VEH
ICLE
S IN
USE
NÜ
FUS
(BİN
)PO
PULA
TIO
N (T
HO
USA
ND
)
NÜFUS VE MOTORLU KARA TAŞITLARI KARŞILAŞTIRMASIComparison of Population and Number of Road Motor Vehicles
Nüfus (Population) MOTORLU KARA TAŞITLARI (Road Motor Vehicles)
0
20.000
40.000
60.000
80.000
100.000
120.000
140.000
60.000
61.000
62.000
63.000
64.000
65.000
66.000
67.000
68.000
2000
2001
2002
2003
2004
2005
2006
2007
2008
2009
2010
2011
2012
2013
2014
2015
2016
2017
TAŞI
T-K
M (M
İLYO
N)
VEH
ICLE
-KM
(MIL
LIO
N)
TOPL
AM
YO
L U
ZUN
LUĞ
U K
m.
TOTA
L R
OA
D L
ENG
TH K
m.
TAŞIT-KM VE TOPLAM YOL UZUNLUĞU KARŞILAŞTIRMASI Comparison of Vehicle-Km and Total Road Length
TOPLAM YOL UZUNLUĞU (Km) (Total Road Length(Km)) TAŞIT-KM (Vehicle-Km)
* Taşıt-Km, Ton-Km, Yolcu-Km değerleri Karayolları Genel Müdürlüğü sorumluluğu altındaki yol ağına ait verilerdir.* Vehicle-Km, Tonne-Km, Passenger-Km values include the roads under the responsibility of General Directorate Of Highways.
0
20.000
40.000
60.000
80.000
100.000
120.000
140.000
0
10.000
20.000
30.000
40.000
50.000
60.000
70.000
80.000
90.00020
00
2001
2002
2003
2004
2005
2006
2007
2008
2009
2010
2011
2012
2013
2014
2015
2016
2017
TAŞI
T-K
M (M
İLYO
N)
VEH
ICLE
-KM
(MIL
LIO
N)
NÜ
FUS
(BİN
)PO
PULA
TIO
N (T
HO
USA
ND
)
NÜFUS VE TAŞIT-KM KARŞILAŞTIRMASIComparison of Population and Vehicle-Km's
NÜFUS (Population) TAŞIT-KM (Vehicle-Km)
0
50.000
100.000
150.000
200.000
250.000
300.000
350.000
0
10.000
20.000
30.000
40.000
50.000
60.000
70.000
80.000
90.000
2000
2001
2002
2003
2004
2005
2006
2007
2008
2009
2010
2011
2012
2013
2014
2015
2016
2017
TON
-KM
VE
YOLC
U-K
M (M
İLYO
N)
TON
NE-
KM
AN
D P
ASS
ENG
ER-K
M (M
ILLI
ON
)
NÜ
FUS
(BİN
)PO
PULA
TIO
N (T
HO
USA
ND
)
NÜFUS, TON-KM VE YOLCU-KM KARŞILAŞTIRMASIComparison of Population,Tonne-Km's and Passenger-Km's
NÜFUS (Population) TON-KM (Tonne-Km) YOLCU-KM (Passenger-Km)

* Taşıt-Km değerleri Karayolları Genel Müdürlüğü sorumluluğu altındaki yol ağına ait verilerdir. * Vehicle-Km values include the roads under the responsibility of General Directorate Of Highways.
0
5.000.000
10.000.000
15.000.000
20.000.000
25.000.000
0
20.000
40.000
60.000
80.000
100.000
120.000
140.000
2000
2001
2002
2003
2004
2005
2006
2007
2008
2009
2010
2011
2012
2013
2014
2015
2016
2017
MO
TOR
LU K
AR
A T
AŞI
TLA
RI
MO
TOR
VEH
ICLE
S IN
USE
TAŞI
T-K
M (M
İLYO
N)
VEH
ICLE
-KM
(MIL
LIO
N)
TAŞIT-KM VE MOTORLU KARA TAŞITLARI KARŞILAŞTIRMASIComparison of Vehicle-Km's and Number of Road Motor Vehicles
TAŞIT-KM (Vehicle-Km) MOTORLU KARA TAŞITLARI (Road Motor Vehicles)
0,00
50,00
100,00
150,00
200,00
250,00
300,00
0
10.000
20.000
30.000
40.000
50.000
60.000
70.000
80.000
90.000
2000
2001
2002
2003
2004
2005
2006
2007
2008
2009
2010
2011
2012
2013
2014
2015
2016
2017
1000
KİŞ
İYE
DÜ
ŞEN
MO
TOR
LU K
AR
A T
AŞI
TLA
RI S
AYI
SITH
E N
UM
BER
OF
RO
AD
MO
TOR
VEH
İCLE
S PE
R 1
000
PEO
PLE
NÜ
FUS
(BİN
)PO
PULA
TIO
N (T
HO
USA
ND
)
NÜFUS VE 1000 KİŞİYE DÜŞEN MOTORLU KARA TAŞITLARI KARŞILAŞTIRMASIComparison Of Population and Road Motor Vehicles Per 1000 People
NÜFUS (Population) OTOMOBİL (Passenger Cars) TOPLAM MOTORLU KARA TAŞITLARI (Total Road Motor Vehicles)

* 2004 yılından itibaren yol iş makinaları kapsamında yayımlanan taşıtlar ile özel amaçlı taşıtlar içinde yer alan ağır tonajlı taşıtlar "Kamyon" başlığı altında gösterilmiştir. Taşıt-Km değerleri Karayolları Genel Müdürlüğü sorumluluğu altındaki yol ağına ait verilerdir.
* Since 2004, vehicles covered under work machinery and heavy vehicles covered under special purpose vehicles are shown under "Truck" figures. Vehicle-Km values include the roads under the responsibility of General Directorate Of Highways.
0
2.000.000
4.000.000
6.000.000
8.000.000
10.000.000
12.000.000
14.000.000
0
10.000
20.000
30.000
40.000
50.000
60.000
70.000
80.000
90.000
100.000
2000
2001
2002
2003
2004
2005
2006
2007
2008
2009
2010
2011
2012
2013
2014
2015
2016
2017
OTO
MO
BİL
SA
YISI
NU
MB
ER O
F PA
SSEN
GER
CA
RS
OTO
MO
BİL
-KM
(MİL
YON
)PA
SSEN
GER
CA
R-K
M (M
ILLI
ON
)
OTOMOBİL-KM VE KULLANIMDAKİ OTOMOBİL SAYISIComparison of Passenger Car-Km's and Number of Passenger Cars
OTOMOBİL-KM (Passenger Car-Km) OTOMOBİL (Passenger Car)
0
50.000
100.000
150.000
200.000
250.000
0
500
1.000
1.500
2.000
2.500
3.000
3.500
4.000
4.500
5.000
2000
2001
2002
2003
2004
2005
2006
2007
2008
2009
2010
2011
2012
2013
2014
2015
2016
2017
OTO
BÜ
S SA
YISI
NU
MB
ER O
F B
USE
S
OTO
BÜ
S-K
M (M
İLYO
N)
BU
S-K
M (M
ILLI
ON
)
OTOBÜS-KM VE KULLANIMDAKİ OTOBÜS SAYISIComparison of Bus-Km's and Number of Buses
OTOBÜS-KM (Bus-Km) OTOBÜS (Bus)
0
100.000
200.000
300.000
400.000
500.000
600.000
700.000
800.000
900.000
0
2.500
5.000
7.500
10.000
12.500
15.000
17.500
20.000
22.500
25.000
27.500
30.000
2000
2001
2002
2003
2004
2005
2006
2007
2008
2009
2010
2011
2012
2013
2014
2015
2016
2017
KA
MYO
N S
AYI
SIN
UM
BER
OF
TRU
CK
S
KA
MYO
N-K
M (M
İLYO
N)
TRU
CK
-KM
(MIL
LIO
N)
KAMYON-KM VE KULLANIMDAKİ KAMYON SAYISIComparison of Truck-Km's and Number of Trucks
KAMYON-KM (Truck-Km) KAMYON (Truck)

General Directorate Of Highways
Department Of Traffic Safety
Division Of Transportation Studies
KARAYOLLARI GENEL MÜDÜRLÜĞÜ
TRAFİK GÜVENLİĞİ DAİRESİ BAŞKANLIĞI
Eylül - 2018
Web Sayfası : http://www.kgm.gov.tr
E Posta : [email protected]
KARAYOLU ULAŞIM İSTATİSTİKLERİHighway Transportation Statistics
T.C. ULAŞTIRMA VE ALTYAPI BAKANLIĞI
Ministry Of Transport And Infrastructure
ULAŞIM ETÜTLERİ ŞUBESİ MÜDÜRLÜĞÜ