Embed Size (px)
Citation preview
Research ArticleAqueous Colloidal Stability of Graphene Oxide andChemically Converted Graphene
Swarnima Kashyap,1 Shashank Mishra,2 and Shantanu K. Behera1
1 Department of Ceramic Engineering, National Institute of Technology Rourkela, Odisha 769 008, India2Department of Ceramic Engineering, Indian Institute of Technology BHU, Varanasi, Uttar Pradesh 221 005, India
Correspondence should be addressed to Shantanu K. Behera; [email protected]
Received 6 August 2014; Revised 24 October 2014; Accepted 24 October 2014; Published 13 November 2014
Academic Editor: Vijaya Rangari
Copyright © 2014 Swarnima Kashyap et al. This is an open access article distributed under the Creative Commons AttributionLicense, which permits unrestricted use, distribution, and reproduction in any medium, provided the original work is properlycited.
Graphene oxide (GO) was prepared by modified Hummer’s method, and chemically converted graphene (CCG) was prepared byfurther reduction of the aqueous GO colloid. The effect of pH on particle size, particle charge, and light absorption of the aqueouscolloids of GO and CCG was studied with titration against HCl or NaOH, to find the ideal characteristics for a stable dispersion.The GO colloid was stable in the pH range of 4–11, whereas the CCG colloid gained stability at a relatively narrower pH rangeof 7–10. Poor stability of the colloids was observed for both GO and CCG colloids at both extremes of the pH scale. Both of thecolloids exhibited average size of ∼1 micron in the low pH range, whereas for higher pH the size ranged between 300 and 500 nm.The UV-Vis spectra showed absorption peak at 230 nm for GO colloids that shifted to 260 nm for the CCG colloid. Such shift canbe ascribed to restoring of electronic conjugation of the C=C bonds in CCG.
1. Introduction
Graphene is a flat 2D layer of carbon atoms packed in a hon-eycomb lattice and is the basal building block in all graphiticmaterials [1]. Its different synthesis routes and the possessionof unique mechanical, thermal, and electrical propertiesmake it a material of great interest [2–7]. In spite of the viablestructure-property relationship, large volume production ofgraphene is still a challenge. Graphene oxide syntheses viachemical methods using acids and oxidants are the mostwidely followed procedures, which can be further reduced toproduce graphene [8–10]. Graphene oxide (GO) can be bestdescribed as a single layer planar hexagonal array of carbonatoms to which functional groups, including carboxylicacid, hydroxyl, epoxy, and carbonyl groups, are attached.According to the Lerf-Klinowski model, the carbonyl andcarboxylic groups remain attached to the edges of the sheet,while the hydroxyl and epoxy groups are found on the basalplane [11]. These groups render the GO sheets hydrophilicdue to the H-bonding present between the carboxylic andhydroxyl groups.This property opens upmany opportunities
for chemical reactions and schemes, including self-assemblyand thin films processing, to exploit the beneficial propertiesof graphene oxide. On the contrary, graphene sheets that aredevoid of any O-containing functional groups are insolublein water, thus posing a challenge for the exploitation ofgraphene in aqueous processing methods. Several methods,including functionalization [12–14], in situ reduction [15, 16],or polymeric reduction [17] ofGO sheets in aqueousmedium,can be used to obtain graphene based colloids. Therefore, toafford graphene based nanostructures, the foremost task is todevelop aqueous dispersions of graphene sheets by chemicalreduction of GO sheets, generally termed as chemicallyconverted graphene (CCG).
The behaviour of graphene oxide colloids is influencedby various parameters, including pH, particle size, and zetapotential. An understanding of these parameters and theirinfluence on the stability of the colloids is key to exploitingaqueous synthesis routes for the fabrication of graphenebased hybrids and composites. In this work we report thechange in zeta potential, light absorption, and equivalentparticle size of graphene oxide and chemically converted
Hindawi Publishing CorporationJournal of NanoparticlesVolume 2014, Article ID 640281, 6 pageshttp://dx.doi.org/10.1155/2014/640281
2 Journal of Nanoparticles
graphene colloids over a range of pH. Both CCG andGO sheets are negatively charged colloidal particles carry-ing varying concentration of functional groups. Oxygen-containing functional groups present on the graphene oxidesheets make GO highly hydrophilic. On the other hand,CCG, or partially reduced colloid of graphene oxide, usesthe remnant oxygen-containing groups for displaying thestability of mildly oxidised graphene oxide sheets. As thecolloid is titrated with NaOH/HCl, the ensuing change inthe pH of the colloid leads to agglomeration of the graphenebased colloidal particles. With very few reports elucidatingthe individual behaviour of CCG or GO colloids over size,stability, or conjugation studies [18, 19], a comparative studyof both of the colloids on the said parameters has not beenreported. In the current work, the effect of pH on the zetapotential, optical absorption, and equivalent particle size ofgraphene oxide and chemically converted graphene colloidsis reported.
2. Experimental Details
Flake graphite (98%), sulphuric acid (98%), hydrochloricacid (37%), hydrogen peroxide (30wt%), potassium perman-ganate, hydrazine monohydrate (98wt% in water), ammonia(35%), and sodium hydroxide were obtained from com-mercial sources and used without any further purifica-tion. Graphene oxide was prepared by modified Hummer’smethod as described by Chen et al. [20]. Graphite powder(2 g) was poured into concentrated H
2SO4(46mL) at 0∘C
and stirred for about 30min. Thereafter, KMnO4(6 g) was
added gradually while stirring the batch for about 30minutes.Continuous cooling was ensured so that the temperature ofthe mixture does not exceed 20∘C. The reaction betweenH2SO4and KMnO
4leads to the formation of metal and
sulphate ions that help in exfoliating the graphite layers [21].The mixture was then heated up to 35∘C and was kept formore than 30min. Deionized water (92mL) was graduallyadded. After 60min of further stirring, the reaction wasterminated by the addition of a large amount of deionizedwater and 30% H
2O2solution (5mL). This caused violent
effervescence and an increase in temperature (up to 100∘C),after which the color of the suspension changed to brightyellow. The suspension was then washed with 1 : 10 HClsolution (5 L) in order to remove metal ions by filter paperand funnel. The paste collected from the filter paper is driedat 60∘C until it became agglomerated. This agglomerate wasdispersed into deionized water in static state for 2-3 h andslightly stirred by a glass rod. The suspension was washedwithmore deionized water several times until the pH reacheda value of 7. The collected paste was ultrasonicated for about1 h for better dispersion in water. The obtained brown GOhydrosol was then centrifuged at 4000 rpm for 30min inorder to remove any unexfoliated GO. Scanning electronmicroscopy of a drop of the colloid (after drying) exhibitedcrumpled graphene oxide sheets.
Chemically converted graphene (CCG) was prepared asper the process described by Li et al. [22]. In short, 5mggraphene oxide powder was dispersed in 100mL of distilledwater by ultrasonication until a yellowish-brown colloid was
obtained. The GO colloid was then transferred to a 250mLround bottom flask and stirred for a few minutes. Subse-quently, few drops of ammonia solution (35%) were added toincrease the pH up to 8 allowing stability of the sheets. 5 𝜇Lhydrazine hydrate (0.1M) solution was added to the abovesolution and refluxed at 98∘C for 1 hour in a water bath.The process afforded a black colloidal dispersion, hereaftercalledCCGcolloid.TheGOcolloid and theCCGcolloidwerefiltered and dried separately for additional characterizations.
The as-synthesized GO powder (0.2mg/mL) was sus-pended in distilled water by bath sonication for 30 minutes,affording the formation of a uniformly dispersed yellowish-brown colloid. The stable colloid had pH of around 6.7indicating that the GO sheets bore strong –OH bond affinitywith the water molecules. At this stage, it can be assumedthat the GO colloid was devoid of any metallic impurityor salt. The colloid was then divided into two halves. Onehalf of the GO colloid was titrated with 0.1M HCl solutionto progressively decrease the pH from 6.7 to 1. The secondhalf was titrated with 0.1M NaOH solution to increase thepH from 6.7 to 13. Every integral change in the pH of GOcolloid was recorded by a pH meter (Mettler Toledo) andcollected in 5mL vials. GO colloids with pH ranging from1 to 12 were obtained for further characterization. Similarprocedures were followed to obtain CCG colloids with pHfrom 1 to 12. To ensure a better dispersion, the samples weresonicated for 15 minutes before each characterization.
Size and morphology of the GO powders were measuredby scanning electron microscopy (JEOL XL 30). Surfacecharge of the colloidal dispersion (GO and CCG) wasmeasured by zeta potential meter (Zetasizer, Malvern, UK)between the pH ranges of 2–12, and the average particlesize of the colloidal particles was measured by dynamiclight scattering technique. UV-Vis absorption spectra wererecorded by a spectrometer (Lambda 45, Perkin Elmer)within the wavelength range of 200–900 nm.
3. Results and Discussion
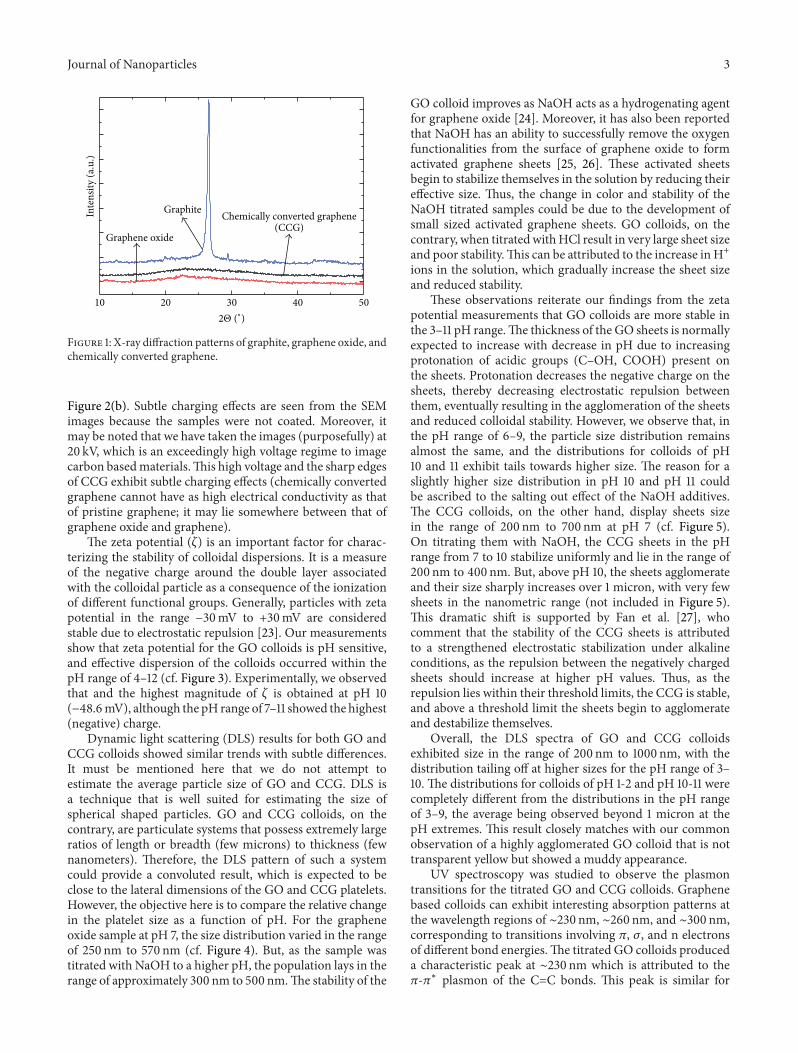
X-ray diffraction (XRD) of the graphite precursors, GO,and CCG was carried out over the range of 5 to 50∘ of2Θ with a scan rate of 2∘min−1 (cf. Figure 1). The XRDpattern of graphite exhibited the characteristic peak at 26∘corresponding to (200) reflections. The XRD pattern forGO showed a peak at ∼11∘, corresponding to an expandedinterlayer distance of 7.6 A. This is due to the intercalationof acidic functional groups in between the graphitic layersthat causes an increase in the interplanar distance. In sucha case, the (200) graphite peak shifts to lower 2Θ regionin the vicinity of 10∘. However, if the graphene layers arefully expanded and exfoliated to single layers, such a peakmay not be observed for graphene oxide. In addition, theCCG powders (after filtration and drying) do not seem torestack, which is evident by the absence of peaks for CCGin the X-ray diffractogram (Figure 1). Single drops of theas-prepared GO colloid and CCG colloid (at pH ∼7) werecast onmetallic stubs, and scanning electronmicroscopy wasperformed. Figure 2(a) shows a representative image of theGO sheets. Similarly, the morphology of CCG is shown in
Journal of Nanoparticles 3
Inte
nsity
(a.u
.)
Graphite
Graphene oxide
Chemically converted graphene(CCG)
10 20 30 40 50
2Θ (∘)
Figure 1: X-ray diffraction patterns of graphite, graphene oxide, andchemically converted graphene.
Figure 2(b). Subtle charging effects are seen from the SEMimages because the samples were not coated. Moreover, itmay be noted that we have taken the images (purposefully) at20 kV, which is an exceedingly high voltage regime to imagecarbon basedmaterials.This high voltage and the sharp edgesof CCG exhibit subtle charging effects (chemically convertedgraphene cannot have as high electrical conductivity as thatof pristine graphene; it may lie somewhere between that ofgraphene oxide and graphene).
The zeta potential (𝜁) is an important factor for charac-terizing the stability of colloidal dispersions. It is a measureof the negative charge around the double layer associatedwith the colloidal particle as a consequence of the ionizationof different functional groups. Generally, particles with zetapotential in the range −30mV to +30mV are consideredstable due to electrostatic repulsion [23]. Our measurementsshow that zeta potential for the GO colloids is pH sensitive,and effective dispersion of the colloids occurred within thepH range of 4–12 (cf. Figure 3). Experimentally, we observedthat and the highest magnitude of 𝜁 is obtained at pH 10(−48.6mV), although the pH range of 7–11 showed the highest(negative) charge.
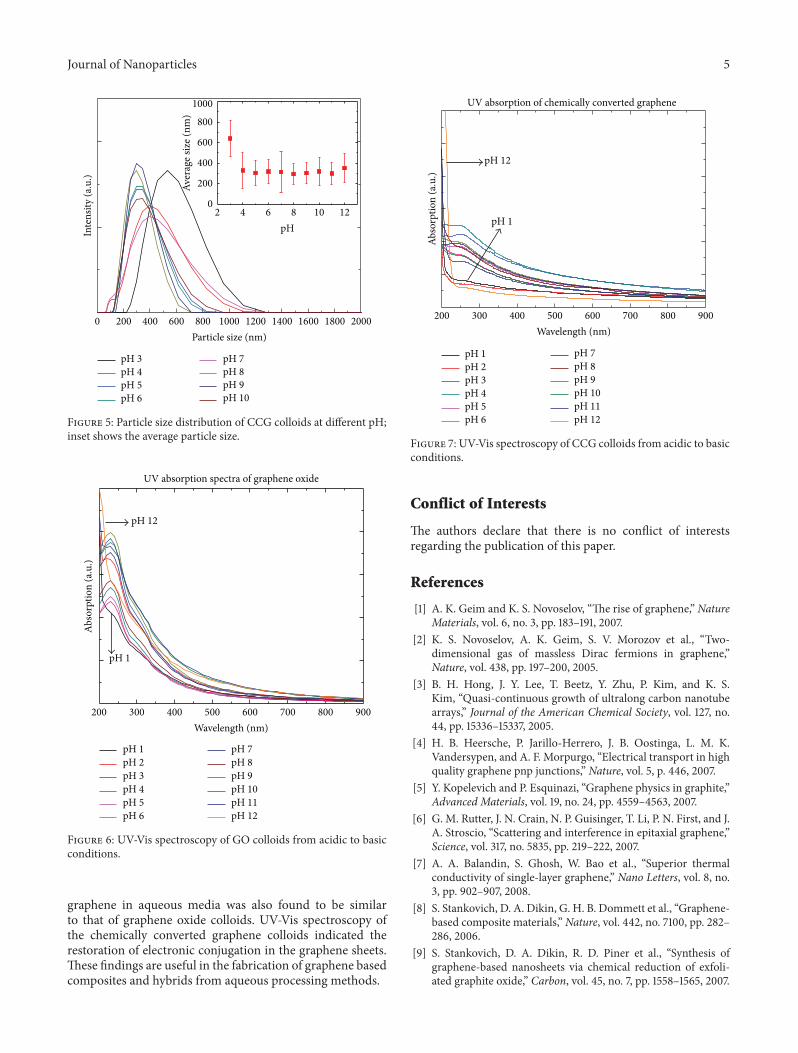
Dynamic light scattering (DLS) results for both GO andCCG colloids showed similar trends with subtle differences.It must be mentioned here that we do not attempt toestimate the average particle size of GO and CCG. DLS isa technique that is well suited for estimating the size ofspherical shaped particles. GO and CCG colloids, on thecontrary, are particulate systems that possess extremely largeratios of length or breadth (few microns) to thickness (fewnanometers). Therefore, the DLS pattern of such a systemcould provide a convoluted result, which is expected to beclose to the lateral dimensions of the GO and CCG platelets.However, the objective here is to compare the relative changein the platelet size as a function of pH. For the grapheneoxide sample at pH 7, the size distribution varied in the rangeof 250 nm to 570 nm (cf. Figure 4). But, as the sample wastitrated with NaOH to a higher pH, the population lays in therange of approximately 300 nm to 500 nm.The stability of the
GO colloid improves as NaOH acts as a hydrogenating agentfor graphene oxide [24]. Moreover, it has also been reportedthat NaOH has an ability to successfully remove the oxygenfunctionalities from the surface of graphene oxide to formactivated graphene sheets [25, 26]. These activated sheetsbegin to stabilize themselves in the solution by reducing theireffective size. Thus, the change in color and stability of theNaOH titrated samples could be due to the development ofsmall sized activated graphene sheets. GO colloids, on thecontrary, when titratedwithHCl result in very large sheet sizeand poor stability.This can be attributed to the increase inH+ions in the solution, which gradually increase the sheet sizeand reduced stability.
These observations reiterate our findings from the zetapotential measurements that GO colloids are more stable inthe 3–11 pH range.The thickness of the GO sheets is normallyexpected to increase with decrease in pH due to increasingprotonation of acidic groups (C–OH, COOH) present onthe sheets. Protonation decreases the negative charge on thesheets, thereby decreasing electrostatic repulsion betweenthem, eventually resulting in the agglomeration of the sheetsand reduced colloidal stability. However, we observe that, inthe pH range of 6–9, the particle size distribution remainsalmost the same, and the distributions for colloids of pH10 and 11 exhibit tails towards higher size. The reason for aslightly higher size distribution in pH 10 and pH 11 couldbe ascribed to the salting out effect of the NaOH additives.The CCG colloids, on the other hand, display sheets sizein the range of 200 nm to 700 nm at pH 7 (cf. Figure 5).On titrating them with NaOH, the CCG sheets in the pHrange from 7 to 10 stabilize uniformly and lie in the range of200 nm to 400 nm. But, above pH 10, the sheets agglomerateand their size sharply increases over 1 micron, with very fewsheets in the nanometric range (not included in Figure 5).This dramatic shift is supported by Fan et al. [27], whocomment that the stability of the CCG sheets is attributedto a strengthened electrostatic stabilization under alkalineconditions, as the repulsion between the negatively chargedsheets should increase at higher pH values. Thus, as therepulsion lies within their threshold limits, the CCG is stable,and above a threshold limit the sheets begin to agglomerateand destabilize themselves.
Overall, the DLS spectra of GO and CCG colloidsexhibited size in the range of 200 nm to 1000 nm, with thedistribution tailing off at higher sizes for the pH range of 3–10. The distributions for colloids of pH 1-2 and pH 10-11 werecompletely different from the distributions in the pH rangeof 3–9, the average being observed beyond 1 micron at thepH extremes. This result closely matches with our commonobservation of a highly agglomerated GO colloid that is nottransparent yellow but showed a muddy appearance.
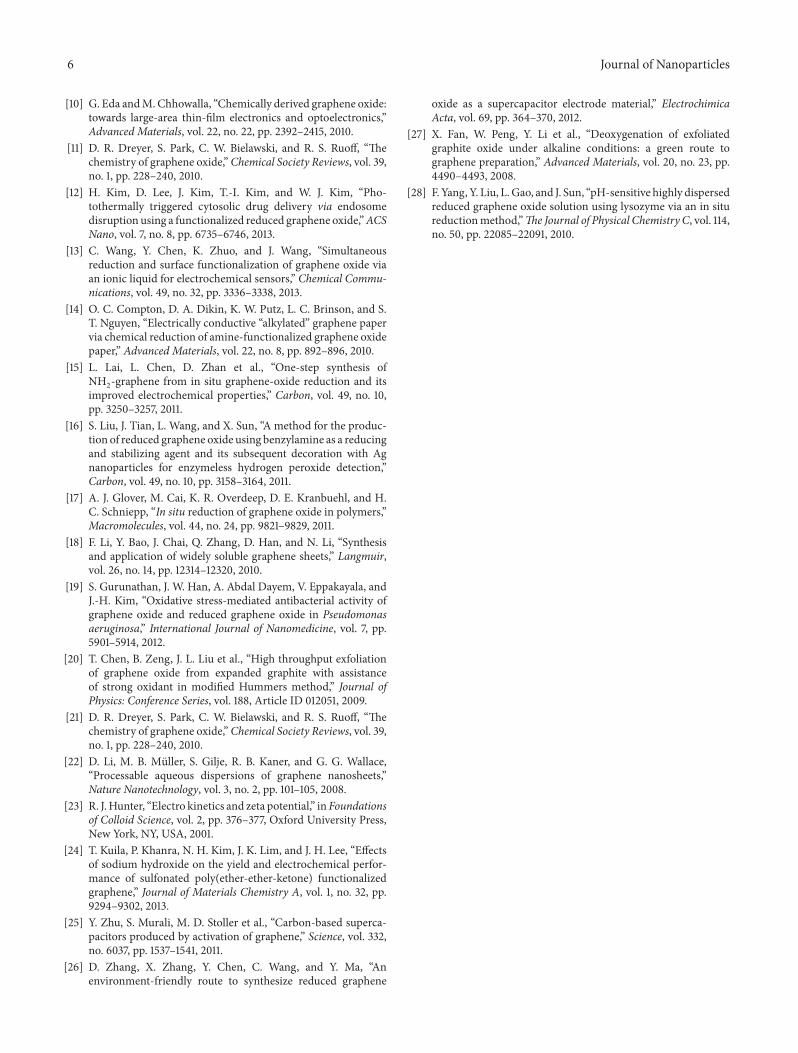
UV spectroscopy was studied to observe the plasmontransitions for the titrated GO and CCG colloids. Graphenebased colloids can exhibit interesting absorption patterns atthe wavelength regions of ∼230 nm, ∼260 nm, and ∼300 nm,corresponding to transitions involving 𝜋, 𝜎, and n electronsof different bond energies.The titrated GO colloids produceda characteristic peak at ∼230 nm which is attributed to the𝜋-𝜋∗ plasmon of the C=C bonds. This peak is similar for

4 Journal of Nanoparticles
(a) (b)
Figure 2: Scanning electron micrographs of (a) graphene oxide and (b) chemically converted graphene.
Zeta
pot
entia
l (𝜁
) (m
V)
10
0
−10
−20
−30
−40
−50
pH0 2 4 6 8 10 12
CCGGO
Figure 3: Zeta potential of GO and CCG colloids at different pH.
samples in the pH range of 2 to 11 (cf. Figure 6). However, atpH 1 and pH 12, the absorption pattern appeared completelydifferent, roughly indicating a continual decay of absorptionwithwavelength. At pH 1, this arises as a result of high amountof sedimentation that takes place due to the aggregationand low repulsion within the sheets. As for pH 12, thesedimentation occurs due to the salting out of the excesssodium ions. The UV-Vis spectra for the CCG colloids,on the other hand, displayed the plasmon peak at 260 nm,which is a considerable peak shift to a higher wavelength (cf.Figure 7). This is due to the reduction of the C=O groupsand restoration of conjugation in the graphene sheets thatlowers the energy required, thus increasing the wavelength ofthe 𝜋-𝜋∗ transitions. This also predicts that CCG possessessubstantially decreased oxygen content and higher sheet sizefor which the value of 𝜆max shifts to a higher wavelength.With the restoration of the conjugation in the hexagonalcarbon sheets, the material is more graphene-like and isexpected to show high thermal and electrical conductivity(also evident from the absorbing black color of the colloid).
Inte
nsity
(a.u
.)
Particle size (nm)0 200 400 600 800 1000 1200 1400 1600 1800 2000
pH 3pH 4pH 5pH 6pH 7
pH 8pH 9pH 10pH 11pH 12
Aver
age s
ize (
nm)
1400
1200
1000
800
600
400
200
pH2 4 6 8 10 12
Figure 4: Particle size distribution of GO colloids at different pH;inset shows the average particle size.
For the GO colloids, we also observed a shoulder peak at300 nm (cf. Figure 6). Literature suggests that there existsa bond excitation value at ∼300 nm corresponding to then-𝜋∗ transition of the C=O chromophores for aldehyde andketone molecule [28]. However, this peak can shift slightlydue to the increased solvent polarity of graphene oxide as it istitratedwithNaOH/HCl. On the other hand, this peak almostvanishes for the titrated CCG colloids indicating the absenceof the C=O chromophores in the colloid.
4. Summary
Aqueous dispersions of graphene oxide were found to bestable in the pH range of 4–12, with excellent dispersibilityin the range of 7–11, as evidenced by highly negative zetapotential. The colloidal stability of chemically converted
Journal of Nanoparticles 5In
tens
ity (a
.u.)
Particle size (nm)0 200 400 600 800 1000 1200 1400 1600 1800 2000
pH 3pH 4pH 5pH 6
pH 7pH 8pH 9pH 10
Aver
age s
ize (
nm)
1000
800
600
400
200
0
pH2 4 6 8 10 12
Figure 5: Particle size distribution of CCG colloids at different pH;inset shows the average particle size.
Abso
rptio
n (a
.u.)
Wavelength (nm)200 300 400 500 600 700 800 900
UV absorption spectra of graphene oxide
pH 1
pH 12
pH 1pH 2pH 3pH 4pH 5pH 6
pH 7pH 8pH 9pH 10pH 11pH 12
Figure 6: UV-Vis spectroscopy of GO colloids from acidic to basicconditions.
graphene in aqueous media was also found to be similarto that of graphene oxide colloids. UV-Vis spectroscopy ofthe chemically converted graphene colloids indicated therestoration of electronic conjugation in the graphene sheets.These findings are useful in the fabrication of graphene basedcomposites and hybrids from aqueous processing methods.
Abso
rptio
n (a
.u.)
Wavelength (nm)200 300 400 500 600 700 800 900
UV absorption of chemically converted graphene
pH 1
pH 12
pH 1pH 2pH 3pH 4pH 5pH 6
pH 7pH 8pH 9pH 10pH 11pH 12
Figure 7: UV-Vis spectroscopy of CCG colloids from acidic to basicconditions.
Conflict of Interests
The authors declare that there is no conflict of interestsregarding the publication of this paper.
References
[1] A. K. Geim and K. S. Novoselov, “The rise of graphene,” NatureMaterials, vol. 6, no. 3, pp. 183–191, 2007.
[2] K. S. Novoselov, A. K. Geim, S. V. Morozov et al., “Two-dimensional gas of massless Dirac fermions in graphene,”Nature, vol. 438, pp. 197–200, 2005.
[3] B. H. Hong, J. Y. Lee, T. Beetz, Y. Zhu, P. Kim, and K. S.Kim, “Quasi-continuous growth of ultralong carbon nanotubearrays,” Journal of the American Chemical Society, vol. 127, no.44, pp. 15336–15337, 2005.
[4] H. B. Heersche, P. Jarillo-Herrero, J. B. Oostinga, L. M. K.Vandersypen, and A. F. Morpurgo, “Electrical transport in highquality graphene pnp junctions,” Nature, vol. 5, p. 446, 2007.
[5] Y. Kopelevich and P. Esquinazi, “Graphene physics in graphite,”Advanced Materials, vol. 19, no. 24, pp. 4559–4563, 2007.
[6] G. M. Rutter, J. N. Crain, N. P. Guisinger, T. Li, P. N. First, and J.A. Stroscio, “Scattering and interference in epitaxial graphene,”Science, vol. 317, no. 5835, pp. 219–222, 2007.
[7] A. A. Balandin, S. Ghosh, W. Bao et al., “Superior thermalconductivity of single-layer graphene,” Nano Letters, vol. 8, no.3, pp. 902–907, 2008.
[8] S. Stankovich, D. A. Dikin, G. H. B. Dommett et al., “Graphene-based composite materials,” Nature, vol. 442, no. 7100, pp. 282–286, 2006.
[9] S. Stankovich, D. A. Dikin, R. D. Piner et al., “Synthesis ofgraphene-based nanosheets via chemical reduction of exfoli-ated graphite oxide,” Carbon, vol. 45, no. 7, pp. 1558–1565, 2007.
6 Journal of Nanoparticles
[10] G. Eda andM.Chhowalla, “Chemically derived graphene oxide:towards large-area thin-film electronics and optoelectronics,”Advanced Materials, vol. 22, no. 22, pp. 2392–2415, 2010.
[11] D. R. Dreyer, S. Park, C. W. Bielawski, and R. S. Ruoff, “Thechemistry of graphene oxide,”Chemical Society Reviews, vol. 39,no. 1, pp. 228–240, 2010.
[12] H. Kim, D. Lee, J. Kim, T.-I. Kim, and W. J. Kim, “Pho-tothermally triggered cytosolic drug delivery via endosomedisruption using a functionalized reduced graphene oxide,”ACSNano, vol. 7, no. 8, pp. 6735–6746, 2013.
[13] C. Wang, Y. Chen, K. Zhuo, and J. Wang, “Simultaneousreduction and surface functionalization of graphene oxide viaan ionic liquid for electrochemical sensors,” Chemical Commu-nications, vol. 49, no. 32, pp. 3336–3338, 2013.
[14] O. C. Compton, D. A. Dikin, K. W. Putz, L. C. Brinson, and S.T. Nguyen, “Electrically conductive “alkylated” graphene papervia chemical reduction of amine-functionalized graphene oxidepaper,” Advanced Materials, vol. 22, no. 8, pp. 892–896, 2010.
[15] L. Lai, L. Chen, D. Zhan et al., “One-step synthesis ofNH2-graphene from in situ graphene-oxide reduction and its
improved electrochemical properties,” Carbon, vol. 49, no. 10,pp. 3250–3257, 2011.
[16] S. Liu, J. Tian, L. Wang, and X. Sun, “A method for the produc-tion of reduced graphene oxide using benzylamine as a reducingand stabilizing agent and its subsequent decoration with Agnanoparticles for enzymeless hydrogen peroxide detection,”Carbon, vol. 49, no. 10, pp. 3158–3164, 2011.
[17] A. J. Glover, M. Cai, K. R. Overdeep, D. E. Kranbuehl, and H.C. Schniepp, “In situ reduction of graphene oxide in polymers,”Macromolecules, vol. 44, no. 24, pp. 9821–9829, 2011.
[18] F. Li, Y. Bao, J. Chai, Q. Zhang, D. Han, and N. Li, “Synthesisand application of widely soluble graphene sheets,” Langmuir,vol. 26, no. 14, pp. 12314–12320, 2010.
[19] S. Gurunathan, J. W. Han, A. Abdal Dayem, V. Eppakayala, andJ.-H. Kim, “Oxidative stress-mediated antibacterial activity ofgraphene oxide and reduced graphene oxide in Pseudomonasaeruginosa,” International Journal of Nanomedicine, vol. 7, pp.5901–5914, 2012.
[20] T. Chen, B. Zeng, J. L. Liu et al., “High throughput exfoliationof graphene oxide from expanded graphite with assistanceof strong oxidant in modified Hummers method,” Journal ofPhysics: Conference Series, vol. 188, Article ID 012051, 2009.
[21] D. R. Dreyer, S. Park, C. W. Bielawski, and R. S. Ruoff, “Thechemistry of graphene oxide,”Chemical Society Reviews, vol. 39,no. 1, pp. 228–240, 2010.
[22] D. Li, M. B. Muller, S. Gilje, R. B. Kaner, and G. G. Wallace,“Processable aqueous dispersions of graphene nanosheets,”Nature Nanotechnology, vol. 3, no. 2, pp. 101–105, 2008.
[23] R. J.Hunter, “Electro kinetics and zeta potential,” inFoundationsof Colloid Science, vol. 2, pp. 376–377, Oxford University Press,New York, NY, USA, 2001.
[24] T. Kuila, P. Khanra, N. H. Kim, J. K. Lim, and J. H. Lee, “Effectsof sodium hydroxide on the yield and electrochemical perfor-mance of sulfonated poly(ether-ether-ketone) functionalizedgraphene,” Journal of Materials Chemistry A, vol. 1, no. 32, pp.9294–9302, 2013.
[25] Y. Zhu, S. Murali, M. D. Stoller et al., “Carbon-based superca-pacitors produced by activation of graphene,” Science, vol. 332,no. 6037, pp. 1537–1541, 2011.
[26] D. Zhang, X. Zhang, Y. Chen, C. Wang, and Y. Ma, “Anenvironment-friendly route to synthesize reduced graphene
oxide as a supercapacitor electrode material,” ElectrochimicaActa, vol. 69, pp. 364–370, 2012.
[27] X. Fan, W. Peng, Y. Li et al., “Deoxygenation of exfoliatedgraphite oxide under alkaline conditions: a green route tographene preparation,” Advanced Materials, vol. 20, no. 23, pp.4490–4493, 2008.
[28] F. Yang, Y. Liu, L.Gao, and J. Sun, “pH-sensitive highly dispersedreduced graphene oxide solution using lysozyme via an in situreductionmethod,”The Journal of Physical Chemistry C, vol. 114,no. 50, pp. 22085–22091, 2010.

Submit your manuscripts athttp://www.hindawi.com
ScientificaHindawi Publishing Corporationhttp://www.hindawi.com Volume 2014
CorrosionInternational Journal of
Hindawi Publishing Corporationhttp://www.hindawi.com Volume 2014
Polymer ScienceInternational Journal of
Hindawi Publishing Corporationhttp://www.hindawi.com Volume 2014
Hindawi Publishing Corporationhttp://www.hindawi.com Volume 2014
CeramicsJournal of
Hindawi Publishing Corporationhttp://www.hindawi.com Volume 2014
CompositesJournal of
NanoparticlesJournal of
Hindawi Publishing Corporationhttp://www.hindawi.com Volume 2014
Hindawi Publishing Corporationhttp://www.hindawi.com Volume 2014
International Journal of
Biomaterials
Hindawi Publishing Corporationhttp://www.hindawi.com Volume 2014
NanoscienceJournal of
TextilesHindawi Publishing Corporation http://www.hindawi.com Volume 2014
Journal of
NanotechnologyHindawi Publishing Corporationhttp://www.hindawi.com Volume 2014
Journal of
CrystallographyJournal of
Hindawi Publishing Corporationhttp://www.hindawi.com Volume 2014
The Scientific World JournalHindawi Publishing Corporation http://www.hindawi.com Volume 2014
Hindawi Publishing Corporationhttp://www.hindawi.com Volume 2014
CoatingsJournal of
Advances in
Materials Science and EngineeringHindawi Publishing Corporationhttp://www.hindawi.com Volume 2014
Smart Materials Research
Hindawi Publishing Corporationhttp://www.hindawi.com Volume 2014
Hindawi Publishing Corporationhttp://www.hindawi.com Volume 2014
MetallurgyJournal of
Hindawi Publishing Corporationhttp://www.hindawi.com Volume 2014
BioMed Research International
MaterialsJournal of
Hindawi Publishing Corporationhttp://www.hindawi.com Volume 2014
Nano
materials
Hindawi Publishing Corporationhttp://www.hindawi.com Volume 2014
Journal ofNanomaterials