Embed Size (px)
Citation preview

1
KDIGO CLINICAL PRACTICE GUIDELINE FOR ANEMIA IN CHRONIC KIDNEY DISEASE
KDIGO Online Supplemental Tables August 2012

2
ABBREVIATIONS AND ACRONYMS FOR SUPPLEMENTAL TABLES
5D CKD Stage 5, Dialysis L Liter α Alfa LVD Left ventricular dilation AE Adverse event LVH Left ventricular hypertrophy AKI Acute kidney disease μg Microgram Anti-HT Antihypertensive M Male AV Arteriovenous MACE Major adverse cardiac event AVR Arteriovenous fistula MAP Mean arterial pressure β Beta mg Milligram BP Blood pressure MI Myocardial infarction CHD Coronary heart disease mL Milliliter CHF Congestive heart failure NA Not applicable CI Confidence interval nd Not documented CKD Chronic kidney disease ng Nanogram CKD:5D CKD Stage 5-Dialysis Non-inf Non-inferior Cum Fe dose Cumulative iron dose NOS Not otherwise specified CV Cardiovascular NS Not significant CV Hosp Cardiovascular hospitalization OR Odds ratio CVA Cerebrovascular accident PD Peritoneal dialysis CVD Cardiovascular disease pmol Picomole DBP Diastolic blood pressure PO Oral D/C Discontinued PP Per-protocol dL Deciliter pt Patient DVT Deep vein thrombosis PTH Parathyroid hormone eGFR estimated GFR QoL Quality of life EPO Epoetin QW Once weekly ERT Evidence review team Q2W Once every 2 weeks ESA Erythropoiesis-stimulating
agent Q4W Once every 4 weeks
ESA vs. Pl ESA versus Placebo RBC Red blood cell ESRD End-stage renal disease rHuEPO Recombinant human erythropoietin EU Europe RR Relative risk F Female RRT Renal replacement therapy Fe Iron SAE Serious adverse event g Gram SBP Systolic blood pressure GFR Glomerular filtration rate SC Subcutaneous GI Gastrointestinal θ Theta H vs. L High versus Low T Transplant h Hour TIW Three times per week Hb Hemoglobin TSAT Transferrin saturation U Unit Hct Hematocrit UI Unique identifier HD Hemodialysis UK United Kingdom HR Hazards ratio US United States HTN Hypertension UTI Urinary tract infection HX575 Recombinant human epoetin
alfa wk Week
ITT Intention-to-treat XS Cross-sectional IU International units y Year IV Intravenous ζ Zeta kg Kilogram All articles can be identified by the PubMed IDs following UI prefix .
3
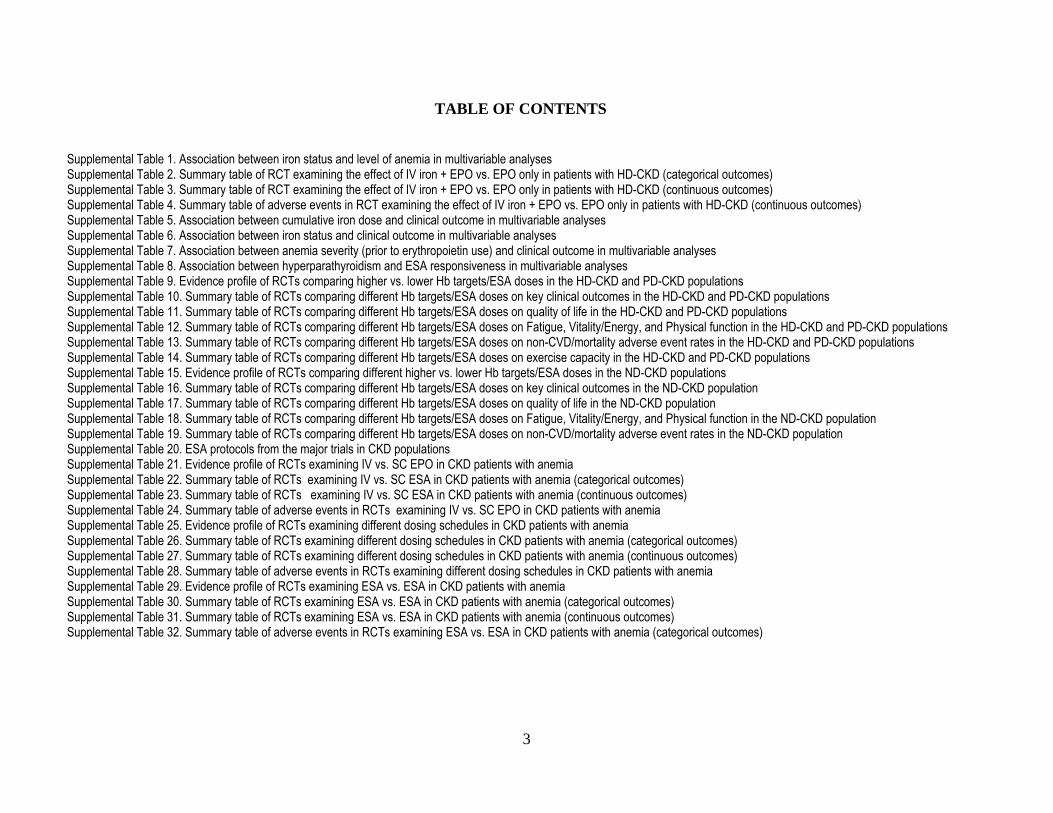
TABLE OF CONTENTS
Supplemental Table 1. Association between iron status and level of anemia in multivariable analyses Supplemental Table 2. Summary table of RCT examining the effect of IV iron + EPO vs. EPO only in patients with HD-CKD (categorical outcomes) Supplemental Table 3. Summary table of RCT examining the effect of IV iron + EPO vs. EPO only in patients with HD-CKD (continuous outcomes) Supplemental Table 4. Summary table of adverse events in RCT examining the effect of IV iron + EPO vs. EPO only in patients with HD-CKD (continuous outcomes) Supplemental Table 5. Association between cumulative iron dose and clinical outcome in multivariable analyses Supplemental Table 6. Association between iron status and clinical outcome in multivariable analyses Supplemental Table 7. Association between anemia severity (prior to erythropoietin use) and clinical outcome in multivariable analyses Supplemental Table 8. Association between hyperparathyroidism and ESA responsiveness in multivariable analyses Supplemental Table 9. Evidence profile of RCTs comparing higher vs. lower Hb targets/ESA doses in the HD-CKD and PD-CKD populations Supplemental Table 10. Summary table of RCTs comparing different Hb targets/ESA doses on key clinical outcomes in the HD-CKD and PD-CKD populations Supplemental Table 11. Summary table of RCTs comparing different Hb targets/ESA doses on quality of life in the HD-CKD and PD-CKD populations Supplemental Table 12. Summary table of RCTs comparing different Hb targets/ESA doses on Fatigue, Vitality/Energy, and Physical function in the HD-CKD and PD-CKD populations Supplemental Table 13. Summary table of RCTs comparing different Hb targets/ESA doses on non-CVD/mortality adverse event rates in the HD-CKD and PD-CKD populations Supplemental Table 14. Summary table of RCTs comparing different Hb targets/ESA doses on exercise capacity in the HD-CKD and PD-CKD populations Supplemental Table 15. Evidence profile of RCTs comparing different higher vs. lower Hb targets/ESA doses in the ND-CKD populations Supplemental Table 16. Summary table of RCTs comparing different Hb targets/ESA doses on key clinical outcomes in the ND-CKD population Supplemental Table 17. Summary table of RCTs comparing different Hb targets/ESA doses on quality of life in the ND-CKD population Supplemental Table 18. Summary table of RCTs comparing different Hb targets/ESA doses on Fatigue, Vitality/Energy, and Physical function in the ND-CKD population Supplemental Table 19. Summary table of RCTs comparing different Hb targets/ESA doses on non-CVD/mortality adverse event rates in the ND-CKD population Supplemental Table 20. ESA protocols from the major trials in CKD populations Supplemental Table 21. Evidence profile of RCTs examining IV vs. SC EPO in CKD patients with anemia Supplemental Table 22. Summary table of RCTs examining IV vs. SC ESA in CKD patients with anemia (categorical outcomes) Supplemental Table 23. Summary table of RCTs examining IV vs. SC ESA in CKD patients with anemia (continuous outcomes) Supplemental Table 24. Summary table of adverse events in RCTs examining IV vs. SC EPO in CKD patients with anemia Supplemental Table 25. Evidence profile of RCTs examining different dosing schedules in CKD patients with anemia Supplemental Table 26. Summary table of RCTs examining different dosing schedules in CKD patients with anemia (categorical outcomes) Supplemental Table 27. Summary table of RCTs examining different dosing schedules in CKD patients with anemia (continuous outcomes) Supplemental Table 28. Summary table of adverse events in RCTs examining different dosing schedules in CKD patients with anemia Supplemental Table 29. Evidence profile of RCTs examining ESA vs. ESA in CKD patients with anemia Supplemental Table 30. Summary table of RCTs examining ESA vs. ESA in CKD patients with anemia (categorical outcomes) Supplemental Table 31. Summary table of RCTs examining ESA vs. ESA in CKD patients with anemia (continuous outcomes) Supplemental Table 32. Summary table of adverse events in RCTs examining ESA vs. ESA in CKD patients with anemia (categorical outcomes)

4
Supplemental Table 1. Association between iron status and level of anemia in multivariable analyses Country N Study Years Mean Follow-up Duration Baseline Predictor Outcome Association Hb (g/dL) CKD Stage Fe Status
US [UI18469314] 1499 2005 XS 12.1 CKD 5D: HD Fe deficiency 31%1 Fe deficiency2 Hb <11 g/dL UK [UI16595586] 878 2004 XS 12.9 CKD Stage1-4 T Ferritin <100 µg/L: 47% Lower Ferritin Lower Hb
US [UI9375826 139 1990-1994 1-5 y Hct 24% CKD 5D: HD initiation TSAT 22%3 TSAT
Hct ↔
Ferritin 235 U/L Ferritin ↔ Serum Fe 55 U/L Serum Fe ↔
↔ Predictor not statistically significantly associated with outcome (p<0.05). Significant “positive” association between predictor value (as described) and increased likelihood of outcome. Significant “negative” association between predictor value (as described) and decreased likelihood of outcome.
1 (1) Ferritin <200 ng/mL or (2) ferritin <800 ng/mL and saturation <20%. Mean ferritin = 628 ng/mL, mean transferrin saturation = 26%, mean transferrin = 176 µg/dL. 2 Serum transferrin 2.6 , serum iron 20 , TSAT 37%. 3 Total iron binding capacity 254

5
Supplemental Table 2. Summary table of RCT examining the effect of IV iron + EPO vs. EPO only in patients with HD-CKD (categorical outcomes)
Outcome Author, Year, Country
Outcome Assessment
Time (Treatment Duration)
Treatments (Number Analyzed / Enrolled)
CKD Stage
Baseline TSAT/ Ferritin Arm 1
(Arm 2)
Mean ESA dose Arm 1
(Arm 2)
Hemoglobin (g/dL) Results P-
value Quality Arm 1 (Intervention)
Arm 2 (Comparator)
Baseline Arm 1
(Arm 2)
Achieved Arm 1
(Arm 2)
Events No (%) Arm 1
[Arm 2]
RR/OR/HR (95% CI)
↑Hb >2g/dL DRIVE 2007 UI172677140 US
6 wk (6 wk)
IV Ferric gluconate
[125 mg X 8] + ↑25% EPO
66/68
↑25% EPO 66/66 CKD 5D: HD
18%/759 ng/mL
(19%/765 ng/mL)
33498 IU/wk
(35128 IU/wk)
10.4 (10.2)
11.9 (11.3)
47% (29%) -- 0.041 Good

6
Supplemental Table 3. Summary table of RCT examining the effect of IV iron + EPO vs. EPO only in patients with HD-CKD (continuous outcomes)
Outcome Author, Year, Country
Outcome Assessmen
t Time (Treatment Duration)
Treatments (Number Analyzed / Enrolled)
CKD Stage
Baseline TSAT/ Ferritin Arm 1
(Arm 2)
Mean ESA dose Arm 1
(Arm 2)
Hemoglobin (g/dL) Results P-value Quality Arm 1
(Intervention) Arm 2
(Comparator) Baseline
Arm 1 (Arm 2)
Achieved Arm 1
(Arm 2)
Baseline Arm 1
(Arm 2)
∆ (95% CI) Arm 1
(Arm 2) Hb
∆Hb, g/dL DRIVE 2007 UI172677140 US
6 wk (6 wk)
IV Ferric gluconate
[125 mg X 8] + ↑25% EPO
66/68
↑25% EPO 66/66 CKD 5D: HD
18%/759 ng/mL
(19%/765 ng/mL)
33498 IU/wk
(35128 IU/wk)
10.4 (10.2)
11.9 (11.3)
10.4 (10.2)
1.6 (1.1) 0.014 Good
∆Hb, g/dL DRIVE 2008 UI18216316 US
12 wks (6 wks)
IV Ferric gluconate
[125 mg X 8] + ↑25% EPO
56/ 64
↑25% EPO 56/65 CKD 5D: HD
26%/934 ng/mL
(21%/582 ng/mL)
37500 IU/wk
(37700 IU/wk)
11.9 (11.4)
12.1 (11.6) nd 0.2
(0.2) NS
(0.43) Good
ESA
Median ∆ESA dose, IU/wk
DRIVE 2008 UI18216316 US
12 wks (6 wks)
IV Ferric gluconate
[125 mg X 8] + ↑25% EPO
56/ 64
↑25% EPO 56/65 CKD 5D: HD
26%/934 ng/mL
(21%/582 ng/mL)
37500 IU/wk
(37700 IU/wk)
11.9 (11.4)
12.1 (11.6)
37500 (37700)
-7600 (+700) 0.017 Good
Median ∆ESA dose, IU/kg/wk
DRIVE 2008 UI18216316 US
12 wks (6 wks)
IV Ferric gluconate
[125 mg X 8] + ↑25% EPO
56/ 64
↑25% EPO 56/65 CKD 5D: HD
26%/934 ng/mL
(21%/582 ng/mL)
568 IU/wk (639
IU/wk) 11.9
(11.4) 12.1
(11.6) 568
(639) -102 (5) nd Good
Median∆ ESA dose in patients with a ferritin <800, IU/wk
DRIVE 2008 UI18216316 US
12 wks (6 wks)
IV Ferric gluconate
[125 mg X 8] + ↑25% EPO
33/34
↑25% EPO 31/33 CKD 5D: HD
24%/698 ng/mL
(20/453 ng/mL)
548 IU/wk (679
IU/wk) 11.9
(11.4) 12.0 (11.5
548 (679)
445 (671) nd Good
Median (IQR) ∆EPO dose in patients with a ferritin >800 ng/mL, IU/kg/wk
DRIVE 2008 UI18216316 US
12 wks (6 wks)
IV Ferric gluconate
[125 mg X 8] + ↑25% EPO
22/23
↑25% EPO 22/22 CKD 5D: HD
26%/1139 ng/mL
(23%/762 ng/mL)
582 IU/wk (600
IU/wk) 12.0
(11.4) 12.3
(11.7) 582
(600) 605
(500) nd Good

7
Supplemental Table 4. Summary table of adverse events in RCT examining the effect of IV iron + EPO vs. EPO only in patients with HD-CKD (adverse events)
Adverse Event Author, Year,
Country
Outcome Assessmen
t Time (Treatment Duration)
Treatments (Number Analyzed / Enrolled)
CKD Stage
Baseline TSAT/ Ferritin Arm 1
(Arm 2)
Mean ESA dose Arm 1
(Arm 2)
Hemoglobin (g/dL) Results
P-value Arm 1 (Intervention)
Arm 2 (Comparator)
Baseline Arm 1
(Arm 2)
Achieved Arm 1
(Arm 2) Definition
Events No (%)
Arm 1 [Arm 2]
SAEs (patients) since beginning of DRIVE
DRIVE 2008 UI18216316 US
12 wks (6 wks)
IV Ferric gluconate
[125 mg X 8] + ↑25% EPO
66/68
↑25% EPO 66/66
CKD 5D: HD 18%/759
ng/mL (19%/765
ng/mL)
33498 IU/wk
(35128 IU/wk)
10.4 (10.2)
11.9 (11.3)
nd 15 (23%) [20 (30%)]
NS (>0.05)
Cardiac AEs since beginning of DRIVE
Cardiac arrest, CHF, cardiorespiratory
arrest, endocarditis, MIs, pulmonary
edema, and arrhythmias
6 (9%) [9 (14%)]
NS (>0.05)
GI Disorders since beginning of DRIVE
Abdominal pain, ischemic colitis, gastric erosions,
acute pancreatitis, and peritonitis
1 (2%) [4 (2%)]
NS (>0.05)
Vascular Disorders since beginning of DRIVE
Gangrene, hematoma, HTN,
hypotension, and TIA 3 (5%)
[4 (6%)] NS
(>0.05)
Infections since beginning of DRIVE
Cellulitis, clostridial gastroenteritis,
implant infections, pneumonia, sepsis,
and skin and SC abscesses
4 (6%) [10 (15%)]
NS (>0.05)
SAEs (events) since beginning of DRIVE
IV Ferric gluconate
[125 mg X 8] + ↑25% EPO
15/68
↑25% EPO 20/66 nd 224
[38] NS
(>0.05)
SAEs since end of DRIVE
6 wks (6 wks)
IV Ferric gluconate
[125 mg X 8] + ↑25% EPO
56/ 64
↑25% EPO 56/65
37500 IU/wk
(37700 IU/wk)
11.9 (11.4)
12.1 (11.6) nd 8 (14%)
[13 (23%)] NS
(>0.05)
4 Total SAE’s were significantly higher in the “no iron” arm over 12 weeks (Kapoian CJASN 2007), and also that those who never received iron during the 12 weeks had the highest rate of SAE’s while those randomized to IV iron had the lowest rate of SAE’s (Coyne NDT 2011)

8
Adverse Event Author, Year,
Country
Outcome Assessmen
t Time (Treatment Duration)
Treatments (Number Analyzed / Enrolled)
CKD Stage
Baseline TSAT/ Ferritin Arm 1
(Arm 2)
Mean ESA dose Arm 1
(Arm 2)
Hemoglobin (g/dL) Results
P-value Arm 1 (Intervention)
Arm 2 (Comparator)
Baseline Arm 1
(Arm 2)
Achieved Arm 1
(Arm 2) Definition
Events No (%)
Arm 1 [Arm 2]
Blood disorders DRIVE 2007 UI172677140 US
6 wk (6 wk)
IV Ferric gluconate
[125 mg X 8] + ↑25% EPO
66/68
↑25% EPO 66/66 CKD 5D: HD
18%/759 ng/mL
(19%/765 ng/mL)
33498 IU/wk
(35128 IU/wk)
10.4 (10.2)
11.9 (11.3)
Anemia and coagulation disorders
1 (2%) [4 (6%)]
NS (>0.05)

9
Supplemental Table 5. Association between cumulative iron dose and clinical outcome in multivariable analyses
Country N Study Years Mean Follow-up Duration
Baseline Predictor (Comparator)
Association Hb
(g/dL) CKD Stage Cum Fe Dose (mg) Death CVD ESRD Other
US [UI15153574 31,095 96-975 ~1.3 y6 (6 mo analysis) <10: 39% 5 HD >1800: 25%
>1800 mg ↑7
1000-1800 mg ↑8 700-1000 mg ↔ 1-700 mg ↔ (vs. 0 mg)
US [UI11856779] 16,736 93 (enrollment) nd nd 5 HD ≥19 100-mg vials billed for:
7.5%
>1000 mg ↑ Hospitalization
↑ 1-1000 mg ↔ ↔ (vs. 0 mg)
US [UI19245700] 1774 98-07 1-9 y 11.4 5 HD >455 mg/mo: 59%
(vs. >455 mg/mo) 9
202-455 mg/mo ↓10 1-202 mg/mo ↓11 0 mg/mo ↔12
Romania [UI18677909]
71 children
↔ Predictor not statistically significantly associated with outcome (P<0.05). ↑ and ↓ Predictor associated with <2 times more or less risk of outcome (e.g., hazard ratio 0.5-2.0), statistically significant. ↑↑ and ↓↓ Predictor associated with 2-5 times more or less risk of outcome (e.g., hazard ratio 2-5 or 0.2-0.5), statistically significant. ↑↑↑ and ↓↓↓ Predictor associated with >5 times more or less risk of outcome (e.g., hazard ratio >5 or <0.2), statistically significant.
5 Enrollment period 6 39,725 patient-years at risk 7 Various time dependent models found no statistically significant associations. 8 Various time dependent models found no statistically significant associations. 9 Analysis was of survival with the highest doses of iron used as the reference. Results have been inverted for the outcome mortality. 10 Analysis was of survival with the highest doses of iron used as the reference. Results have been inverted for the outcome mortality. 11 Analysis was of survival with the highest doses of iron used as the reference. Results have been inverted for the outcome mortality. 12 Analysis was of survival with the highest doses of iron used as the reference. Results have been inverted for the outcome mortality.

10
Supplemental Table 6. Association between iron status and clinical outcome in multivariable analyses
Country N Study Years Mean
Follow-up Duration
Baseline Predictor (Comparator)
Association Hb
(g/dL) CKD Stage Fe Status Death CVD ESRD Other
US [UI19245700] 1774 1998-2007 1-9 y 11.4 CKD 5D: HD
TSAT 30.6%13
≤16% ↔
16-20% ↔ 20-25% ↑ (vs. >25%)
Ferritin 594 µg/L
≤100 µg/L ↑↑
101-300 ↑↑ 301-600 ↑ 601-1000 ↔ (vs. >1000)
US [UI15042544] 1283 2001 1 y 11.9 CKD 5D: HD Serum Fe
63.6 µg/dL14 Lower Fe (continuous) Hospitalization
Fe saturation ratio 31.2% Lower Fe saturation ratio (continuous)
US [UI19118116 453 1990-2005 3 y 11.7 CKD Stage 2-5
Fe saturation 19% Ferritin 123 ng/mL15
Fe saturation <15 & Ferritin <100 ng/mL ↑
Fe saturation <15 & Ferritin ≥100 ng/mL ↔
Fe saturation ≥15 & Ferritin <100 ng/mL ↔
(vs. Fe saturation ≥15 & Ferritin ≥100 ng/mL)
Taiwan [UI19282675] 187 2006-2007 1 y 10.1 CKD 5D: HD TSAT TSAT <30.6% ↔ Ferritin Lower Ferritin16 (continuous) 17 ↔ Predictor not statistically significantly associated with outcome (P<0.05). ↑ and ↓ Predictor associated with <2 times more or less risk of outcome (e.g., hazard ratio 0.5-2.0), statistically significant. ↑↑ and ↓↓ Predictor associated with 2-5 times more or less risk of outcome (e.g., hazard ratio 2-5 or 0.2-0.5), statistically significant. ↑↑↑ and ↓↓↓ Predictor associated with >5 times more or less risk of outcome (e.g., hazard ratio >5 or <0.2), statistically significant.
Significant “positive” association between continuous predictor (as described) and increased risk of outcome (e.g., relative risk expressed per ng/dL difference in ferritin) Significant “negative” association between continuous predictor (as described) and decreased risk of outcome (e.g., relative risk expressed per ng/dL difference in ferritin)
13 Serum iron 15.3 µmol/L, total iron binding capacity 44%. 14 Total iron binding capacity 200 µg/dL; Ferritin 685 ng/mL 15 Serum iron 58 µg/dL, Total iron binding capacity 321 µg/dL 16 Direction of analysis inverted to be consistent with other studies. 17 Related largely to infection-related deaths

11
Supplemental Table 7. Association between anemia severity (prior to erythropoietin use) and clinical outcome in multivariable analyses Country N Study Years Mean Follow-up
Duration Baseline Predictor
(Comparator) Association
Hb (g/dL) CKD Stage18 Death CVD ESRD Other
US [UI18930570[ 78,420 2003-200419 10 y 11.8 CKD 5D: HD5 HD
Lower Hb (continuous) Hospitalization
US [UI19207866] 5885 1997-2005 1-8 y <10.5: 10% CKS Stage 3-4
Hb <10.5 ↑↑ CV hosp
↑ ↔ Hb 10.5-12.5 ↑ ↔ ↑
(vs. ≥12.5)
US [UI12883982] 1942 children 1992-2001 3 y Hct <33%:
68% CKD 5D Hct <33% (vs. ≥33%) ↑
US [UI15327408] 1513 <2001 3 y <11.3: 25% CKD Stage 2-4
Hb <11.3
↑ ESRD or
Death
↑ Hb 11.3-12.5 ↑ ↔ Hb 12.5-13.8 ↑ ↔ (vs. ≥13.8)
France20 [UI7121651] 1453 1972-1978 nd Hct 23.6% CKD 5D: HD Hct <21.6% ↑
Hct 21.6-25.2% ↔ (vs. Hct ≥25.2)
US [UI14569102] 1269 1986-198921 9 y 13.5 CKD Stage 2-4
Hb <12 [F], <13 [M] (vs no anemia) MI or CHD
death ↑↑22‡
Hong Kong [UI17065681] 606 1995-2000 3 y nd CKD Stage
3-4
Group V23
MACE24
↔
Group IV ↔ Group III ↔ Group II ↔ (vs. Group I)
↔ Predictor not statistically significantly associated with outcome (P<0.05). ↑ Predictor associated with <2 times greater risk of outcome (e.g., hazard ratio 0.5-2.0), statistically significant. ↑↑ Predictor associated with 2-5 times greater risk of outcome (e.g., hazard ratio 2-5 or 0.2-0.5), statistically significant. ↑↑↑ Predictor associated with >5 times greater risk of outcome (e.g., hazard ratio >5 or <0.2), statistically significant.
Significant association between continuous predictor (as described) and increased risk of outcome (e.g., hazard ratio expressed per g/dL difference in Hb). 5 HD, CKD stage 5 on hemodialysis.; 5D, CKD stage 5 on dialysis (hemo- or peritoneal); CHD, coronary heart disease; CV Hosp, cardiovascular hospitalization; CVD, cardiovascular disease (incident); ESRD, end-stage renal disease (incident); F, female; M, male; MACE, major adverse cardiac event including cardiovascular death or incident myocardial infarction, acute coronary syndrome, revascularization, heart failure, and stroke.; MI, myocardial infarction; XS, cross-sectional.
18 5D: hemo- or peritoneal 19 Dates of enrollment 20 Univariable analysis. Included because this was the only study found with N≥500 performed prior to the introduction of ESA 21 Dates of enrollment 22 Statistical significance not reported 23 Group I: Hct <39% (male), <32% (female). Group II: ≥39-43% (male), ≥32-36% (female). Group III: ≥43-47% (male), ≥36-40% (female). Group IV: ≥47-50% (male), ≥40-43% (female). Group V: ≥50% (male), ≥43% (female). 24 Including cardiovascular death or incident MI, acute coronary syndrome, revascularization, heart failure, and stroke

12
Supplemental Table 8. Association between hyperparathyroidism and ESA responsiveness in multivariable analyses Country N Study Years Mean Follow-up
Duration Baseline Predictor Outcome Association Hb CKD Stage PTH
US [UI19339087] 38,393 2001-2002 1 y ≤11.4: 25% CKD 5D: HD 234 Higher PTH25 Hyporesponsive26 US [UI18469314] 1499 2005 XS 12.1 CKD 5D: HD 423 Higher PTH27 Treated Hb <11 g/dL28 Canada [UI11199321] 135 <2000 XS 11.0 CKD 5D: HD 2164 Higher PTH29 EPO U/kg/wk Sweden [UI16183417] 166 1997-2004 XS 10.3 CKD 5D: HD 253 Higher PTH30 EPO U/kg/wk ↔ Predictor not statistically significantly associated with outcome (p<0.05).
Significant “positive” association between higher predictor value and increased risk of outcome (e.g., under Hb target) or higher outcome value (e.g., EPO dose).
25 PTH in pg/mL 26 Lowest quartile of Hb slopes over time 27 PTH in pg/mL 28 Target 11-12.5 g/dL 29 PTH in pg/mL 30 PTH in pg/mL
13
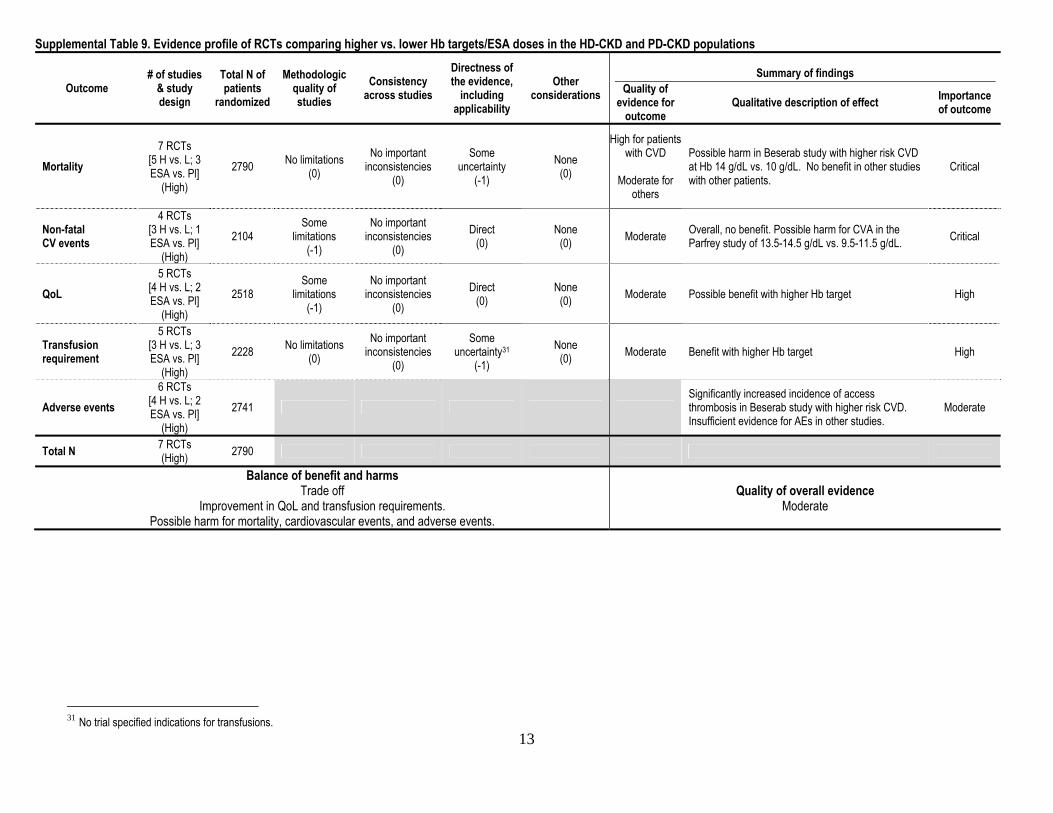
Supplemental Table 9. Evidence profile of RCTs comparing higher vs. lower Hb targets/ESA doses in the HD-CKD and PD-CKD populations
Outcome # of studies
& study design
Total N of patients
randomized
Methodologic quality of studies
Consistency across studies
Directness of the evidence,
including applicability
Other considerations
Summary of findings Quality of
evidence for outcome
Qualitative description of effect Importance of outcome
Mortality 7 RCTs
[5 H vs. L; 3 ESA vs. Pl]
(High) 2790 No limitations
(0) No important
inconsistencies
(0)
Some uncertainty
(-1) None
(0)
High for patients with CVD
Moderate for
others
Possible harm in Beserab study with higher risk CVD at Hb 14 g/dL vs. 10 g/dL. No benefit in other studies with other patients.
Critical
Non-fatal CV events
4 RCTs [3 H vs. L; 1 ESA vs. Pl]
(High) 2104
Some limitations
(-1)
No important inconsistencies
(0) Direct
(0) None
(0) Moderate Overall, no benefit. Possible harm for CVA in the Parfrey study of 13.5-14.5 g/dL vs. 9.5-11.5 g/dL. Critical
QoL 5 RCTs
[4 H vs. L; 2 ESA vs. Pl]
(High) 2518
Some limitations
(-1)
No important inconsistencies
(0) Direct
(0) None
(0) Moderate Possible benefit with higher Hb target High
Transfusion requirement
5 RCTs [3 H vs. L; 3 ESA vs. Pl]
(High) 2228 No limitations
(0) No important
inconsistencies (0)
Some uncertainty31
(-1) None
(0) Moderate Benefit with higher Hb target High
Adverse events 6 RCTs
[4 H vs. L; 2 ESA vs. Pl]
(High) 2741
Significantly increased incidence of access thrombosis in Beserab study with higher risk CVD. Insufficient evidence for AEs in other studies.
Moderate
Total N 7 RCTs (High) 2790
Balance of benefit and harms Trade off
Improvement in QoL and transfusion requirements. Possible harm for mortality, cardiovascular events, and adverse events.
Quality of overall evidence Moderate
31 No trial specified indications for transfusions.

14
Supplemental Table 10. Summary table of RCTs comparing different Hb targets/ESA doses on key clinical outcomes in the HD-CKD and PD-CKD populations
Author Year N
CKD
stag
e
Base
line H
b (g
/dL)
Mea
n fo
llow-
upm
onth
s
Arm 1 Mean Hb (g/dL) target
(achieved)
Clinical outcomes
Quali
ty
Arm 2 CVD event (%)
Mortality (%)
Transfusion (%) QoL32
Arm 3 ESA v ESA
Besarab 1998 UI9718377 US33 1233 HD-CKD 10.2 14
(median)
ESA High 14.0 (12.7-13.3) *Non Fatal MI
19 (3%) vs. 14 (2%) NS34
*183 (30%) vs. 150 (24%) NS35
129 (21%) vs. 192 (31%) P=0.001 See QoL Table Good
ESA Low 10.0 (10.0)
Parfrey 2005 UI15901766, Foley 2008 UI18922988 & 2009 UI19339412 Canada & UK
59636 HD-CKD 11.0 18.5
ESA High 13.5 - 14.5 (13.1) CVA
12 (4%) vs. 4 (1%) P=0.045
Other CVD NS
13 (3%) vs. 20 (5%) per 100 pt-yr
NS 0.26 vs. 0.66 per pt-yr
<0.0001 See QoL Table Good ESA Low 9.5 - 11.5
(10.8)
Foley 2000 UI10972697 Canada
14637 HD-CKD 10.4 12
ESA High 13 – 14 (13)38 10 (14%) vs. 10 (14%)
NS 4 (5%) vs. 3 (4%)
NS — See QoL Table Good ESA Low 9.5 - 10.5
(10.5)39
CanEPO 1990-1991 UI2108751, UI2048574, UI2192412 Canada
118 HD-CKD 7.0 6
ESA High 11.5 - 13 (11.7)
— 0 (0%) vs.0 (0%) vs.1 (3%) NS
1 (2%) vs. 1 (2%) vs. 23 (60%) ESA vs. Placebo
P<0.0540 See QoL Table Good ESA Low 9.5 – 11
(10.2)
Placebo (7.4)
Furuland 2003 UI12543892 Multi 416
4-5 PD-CKD HD-CKD41
10.9 12 ESA High 13.5–16.0
(13.6) — 29 (13%) vs. 27 (14%) NS — See QoL Table Poor
ESA Low 9-12 (11.3-11.7)
32 Refer to Hb Targets Quality of Life Table for details of quality of life measurements 33 The data and safety monitoring board recommended that the study be terminated at the time of the third interim analysis because of concern about safety even though the futility boundary corresponding to an overall 5% level of significance had not been crossed. 34 The primary outcome was a composite of non-fatal MI or death. RR 1.3 (95% CI 0.9; 1.8) p> 0.05. 35 The primary outcome was a composite of non-fatal MI or death. RR 1.3 (95% CI 0.9; 1.8) p> 0.05. 36 Of the 596 patients enrolled, 324 remained in the study for 96 weeks and were evaluated for outcomes of LVH and quality of life. 37 121 patients had follow-up for echocardiographic outcomes. 94 patients were evaluated for the quality of life outcome at week 48. 38 Estimated from graph during maintenance phase 39 Estimated from graph during maintenance phase 40 Data at 8 weeks 41 294 HD-CKD, 51 PD-CKD, 72 ND-CKD patients

15
Author Year N
CKD
stag
e
Base
line H
b (g
/dL)
Mea
n fo
llow-
upm
onth
s
Arm 1 Mean Hb (g/dL) target
(achieved)
Clinical outcomes
Quali
ty
Arm 2 CVD event (%)
Mortality (%)
Transfusion (%) QoL32
Arm 3 ESA v Placebo
Nissenson 1995 UI7703390 US 152 PD-CKD 8 6-9 ESA 10.7-12.7
(11.2) — 2 (3%) vs. 1 (1%) NS
∆U/pt/4 wk -0.21 vs. +0.42
P=0.04 — Fair
Placebo (8.0)
Bahlmann 1991 UI2040200 Multi 129 HD-CKD 7.7 6
ESA 10-11.7 (10.6-10.9) 5 (8%) vs. 11 (16%)
NS 2 (3%) vs. 2 (3%)
NS 9 (14%) vs. 60 (90%)
P<0.05 — Fair Placebo (7.8)
ESA v Placebo in Pediatric Patients
Morris 1993
UI8257180 UK 11 PD-CKD HD-CKD 7.3 6
ESA 10.5 -12 (11.2) — — — See QoL
Table Poor Placebo (7)
Annotations: *Primary Outcome Coding of Outcomes: Mortality: all cause mortality CVD event: Includes CHF exacerbation, MI, arrythmias, angina, interventional procedure such as CABG or angioplasty, sudden death, CVA

16
Supplemental Table 11. Summary table of RCTs comparing different Hb targets/ESA doses on quality of life in the HD-CKD and PD-CKD populations
Author Year N CKD stage Follow-
up
Arm 1 Mean Hb (g/dL) target
(achieved)
Quality of life
Quality Arm 2 Scale/Test (range) Subscale Time
point Favors Net Difference42 P Baseline
Hb (g/dL) Arm 3
Parfrey 2005 UI15901766, Foley 2009 UI19339412 Canada & UK
59643 5 (HD)
24 mo
ESA High 13.5-14.5 (13.1)
KDQOL (0-100)
Energy/Fatigue
24 wk ESA High 4.3 <0.01
Good
36 wk ESA High 3.8 <0.01 48 wk ESA High 1.9 <0.05
11.0 ESA Low 9.5-11.5 (10.8)
60 wk ESA High 3.4 <0.01 72 wk ESA High 5.8 <0.001 84 wk ESA High 3.3 <0.05
Quality of social interaction 96 wk Neither -- NS
Burden of kidney disease 72 wk ESA High 2.7 <0.05
Cognitive function 60 wk ESA High 2.9 <0.01 Symptoms/Problems 96 wk Neither -- NS
Effects of kidney disease 96 wk Neither -- NS
Sexual function 72 wk ESA High 3.3 <0.05 Sleep 96 wk Neither -- NS Social support 96 wk Neither -- NS Work status 96 wk Neither -- NS
Dialysis staff encouragement 96 wk Neither -- NS
Patient satisfaction rating 96 wk Neither -- NS
Overall health rating 96 wk Neither -- NS
Physical function 72 wk ESA High 2.3 <0.05 84 wk ESA High 2.9 <0.05
Role limitations-physical 84 wk ESA high 4.9 <0.05 Pain 96 wk Neither -- NS
General health 72 wk ESA High 2.2 <0.05
Emotional well-being 48 wk ESA high 2.1 <0.05 72 wk ESA high 2.6 <0.05
Role limitations-emotional 96 wk Neither -- NS
Social function 60 wk ESA High 3.3 <0.05
SF-36 (0-100) Vitality
24 wk ESA High 4.1 0.001 36 wk ESA High 3.9 0.008 48 wk ESA High 3.7 0.014 60 wk ESA High 3.5 0.035
42 Net difference is not reported when neither intervention is favored and therefore difference is NS 43 324 of the 596 patients were evaluated at 96 weeks for quality of life.

17
Author Year N CKD stage Follow-
up
Arm 1 Mean Hb (g/dL) target
(achieved)
Quality of life
Quality Arm 2 Scale/Test (range) Subscale Time
point Favors Net Difference42 P Baseline
Hb (g/dL) Arm 3
FACIT (0-52) Fatigue 24 mo Neither -- NS
CanEPO 1990-1991 UI2108751, UI2048574, UI2192412 Canada
118 5 (HD)
6 mo ESA High 11.5-13 (11.7) KDQ (1-7)
Fatigue
6 mo
Neither -- NS
Good
Physical symptoms Neither -- NS Relationships Neither -- NS
7.0 Depression Neither -- NS Frustration Neither -- NS
ESA Low 9.5-11 (10.2)
SIP (0-100) Global QoL
6 mo Neither -- NS
Physical Neither -- NS Psychosocial Neither -- NS
TTO (0, 1) 6 mo Neither -- NS
ESA High plus ESA
Low
11.5-13 (11.7) plus
9.5-11 (10.2)
KDQ (1-7)
Fatigue44
6 mo
ESA High or Low 1.6 or 1.4 vs. 0.4 <0.001
Physical symptoms45 ESA High or Low 1.1 or 0.9 vs. 0.1 <0.001
Relationships ESA High or Low nd 0.001 Depression46 ESA High or Low nd 0.018 Frustration Neither -- NS
Placebo (7.4) SIP (0-100) Global QoL
6 mo ESA High or Low -7.8 or -5.3 vs.
-2.9 0.024
Physical ESA High or Low nd 0.005 Psychosocial Neither -- NS
TTO (0,1) 6 mo Neither -- NS
Besarab 1998 UI9718377 US
1233 5 (HD) 14 mo
ESA High 14.0 (12.7-13.3)
SF-36 (0-100)
Vitality
12 mo
Neither -- NS
Good
Physical function ESA High nd 0.0347
10.2 ESA Low 10.0 (10.0)
General health Neither -- NS Bodily pain Neither -- NS
Social functioning Nether -- NS Emotional Role Nether -- NS Mental health Nether -- NS Physical role Nether -- NS
Foley 2000 UI10972697 Canada
94 5 (HD) 48 wk ESA High 13-14 (13) KDQ (1-7)
Fatigue 12 mo
ESA High nd 0.00948 Good Physical symptoms Neither -- NS
10.1 ESA Low 9.5-10.5 Depression ESA High nd 0.0249
44 A post hoc analysis [Keown 2010] using mixed-model repeated measures at 2, 4 and 6 mo showed consistent results. 45 A post hoc analysis [Keown 2010] using mixed-model repeated measures at 2, 4 and 6 mo found no significance after applying a Bonferroni multiplicity adjustment (p<0.0031). 46 A post hoc analysis [Keown 2010] using mixed-model repeated measures at 2, 4 and 6 mo found no significance after applying a Bonferroni multiplicity adjustment (p<0.0031). 47 The physical-function score on the quality-of-life questionnaire at 12 months increased by 0.6 point for each percentage-point increase in Hct 48 Using repeated measures of ANOVA 49 Using repeated measures of ANOVA

18
Author Year N CKD stage Follow-
up
Arm 1 Mean Hb (g/dL) target
(achieved)
Quality of life
Quality Arm 2 Scale/Test (range) Subscale Time
point Favors Net Difference42 P Baseline
Hb (g/dL) Arm 3
(10.5) Relationships ESA High nd 0.00450 Frustration Neither -- NS
Physical function Neither -- NS General health Neither -- NS
SF-36 (0-100)
Vitality
12 mo
Neither -- NS Bodily pain Neither -- NS
Social functioning Neither -- NS Emotional role Neither -- NS Mental health Neither -- NS Physical role Neither -- NS
HUI (0,1) 12 mo Neither -- NS
Furuland 2003 UI12543892 Multi
117 4-5 (PD,HD)
48 wk ESA High 13.5–16.0
(13.6) KDQ (1-7)
Fatigue
12 mo
ESA High 0.49 0.05
Fair Physical symptoms ESA High 0.41 0.02
Relationship Neither -- NS
10.9 ESA Low 9-12 (11.4)
Depression ESA High 0.40 0.02 Frustration ESA High 0.0 0.05
Pediatric Patients
Morris 1993
UI8257180 UK
10 5 (PD,HD)
8 mo
ESA 10.5 -12 (11.2)
25-part Parental
Questionnaire51
(0-100)
Global QoL
36 wk of treatment
Neither -- NS
Fair
Physical performance / General health
(includes school attendance)
ESA nd <0.02
7.0 Placebo (~6.5)
Sleep Neither -- NS Diet Neither -- NS
School performance Neither -- NS Psychosocial Neither -- NS
KEY to Quality of Life Measurement Scales/Tests: 36-item Medical Outcomes Study Short-Form Health Survey (SF-36): higher scores indicate better health FACT-Fatigue (Functional Assessment of Cancer Therapy-Fatigue): higher scores indicate less fatigue Health Utilities Index (HUI): 0 (death) and 1 (perfect health). Kidney Disease Quality of Life (KDQOL): See SF-36 Kidney Diseases Questionnaire (KDQ): increased score reflects better quality of life Sickness Impact Profile (SIP): lower scores better quality of life. Time Trade-off (TTO): 1.0 (full health) to 0 (patient is indifferent between life and death)
50 Using repeated measures of ANOVA 51 25-Part Parental Questionnaire, modified from a previously used questionnaire. [1873-appendix] Questions covered various aspects of the child’s wellbeing and behavior including mood and psychological behavior, social interaction, somatic complaints and general health, sleep, diet, school functioning and physical performance. Used a VAS scale of 0-100 cm

19
Supplemental Table 12. Summary table of RCTs comparing different Hb targets/ESA doses on Fatigue, Vitality/Energy, and Physical function in the HD-CKD and PD-CKD populations
Author Year N CKD stage Follow-
up
Arm 1 Mean Hb (g/dL) target
(achieved)
Quality of life
Quality Arm 2 Scale/Test (range) Subscale Time
point Favors Net Difference52 P Baseline
Hb (g/dL) Arm 3
Parfrey 2005 UI15901766, Foley 2009 UI19339412 Canada & UK
59653
5 (HD)
24 mo
ESA High 13.5-14.5 (13.1)
KDQOL (0-100) Energy/Fatigue
24 wk ESA High 4.3 <0.01
Good
36 wk ESA High 3.8 <0.01 48 wk ESA High 1.9 <0.05 60 wk ESA High 3.4 <0.01 72 wk ESA High 5.8 <0.001 84 wk ESA High 3.3 <0.05
SF-36 (0-100) Vitality
24 wk ESA High 4.1 0.001
11.0 ESA Low 9.5-11.5 (10.8)
36 wk ESA High 3.9 0.008 48 wk ESA High 3.7 0.014 60 wk ESA High 3.5 0.035
FACIT (0-52) Fatigue 24 mo Neither -- NS
CanEPO 1990-1991 UI2108751, UI2048574, UI2192412 Canada
118
5 (HD)
6 mo
ESA High 11.5-13 (11.7) KDQ (1-7) Fatigue 6 mo Neither -- NS
Good
ESA Low
ESA High plus ESA
Low
11.5-13 (11.7) plus
9.5-11 (10.2)
KDQ (1-7) Fatigue54 6 mo ESA High or Low 1.6 or 1.4 vs. 0.4 <0.001
7.0 Placebo (7.4)
Besarab 1998 UI9718377 US55
1233 5 (HD)
14 mo ESA High 14.0
(12.7-13.3) SF-36 (0-100)
Vitality
12 mo
Neither -- NS
Good Physical function ESA High nd 0.0356 10.2 ESA Low 10.0 (10.0)
Foley 2000 UI10972697 Canada
94 5 (HD)
48 wk ESA High 13-14
(13) KDQ (1-7) Fatigue 12 mo
ESA High nd 0.00957 Good
10.1 ESA Low 9.5-10.5 (10.5) SF-36 (0-100) Vitality Neither -- NS
Physical role Neither -- NS
Furuland 2003 UI12543892 Multi
117
4-5 (PD,HD) 48 wk
ESA High 13.5–16.0 (13.6) KDQ (1-7) Fatigue 12 mo ESA High 0.49 0.05 Fair
10.9 ESA Low 9-12 (11.4)
52 Net difference is not reported when neither intervention is favored and therefore difference is NS 53 324 of the 596 patients were evaluated at 96 weeks for quality of life. 54 A post hoc analysis [Keown 2010] using mixed-model repeated measures at 2, 4 and 6 mo showed consistent results. 55 The data and safety monitoring board recommended that the study be terminated at the time of the third interim analysis because of concern about safety even though the futility boundary corresponding to an overall 5% level of significance had not been crossed. 56 The physical-function score on the quality-of-life questionnaire at 12 months increased by 0.6 point for each percentage-point increase in Hct 57 Using repeated measures of ANOVA

20
KEY to Quality of Life Measurement Scales/Tests: 36-item Medical Outcomes Study Short-Form Health Survey (SF-36): higher scores indicate better health FACT-Fatigue (Functional Assessment of Cancer Therapy-Fatigue): higher scores indicate less fatigue Kidney Disease Quality of Life (KDQOL): See SF-36 Kidney Diseases Questionnaire (KDQ): increased score reflects better quality of life

21
Supplemental Table 13. Summary table of RCTs comparing different Hb targets/ESA doses on non-CVD/mortality adverse event rates in the HD-CKD and PD-CKD populations
Author Year N
Dialy
sis
mod
ality
Description of Intervention
Follo
w-up
m
onth
s
Arm 1 Mean Hb (g/dL) target
(achieved)
Adverse events
Tota
l D/C
of
drug
Arm 2 BP change or hypertension Access thrombosis (%) Seizures Other reported AE
Arm 3 Definition Outcome Definition Outcome Description and Results
ESA vs. ESA
Besarab 1998 UI9718377 US
618 HD58
IV or SC ESA
1.5X pre-trial dose; adjusted after 2 weeks 14
ESA High
14.0 (12.7-13.3) Mean SBP and
DBP during the study59
NS Both synthetic
grafts and natural fistulae
243 (39%) vs. 176 (29%)
(P= 0.001) NS —
0
615 IV or SC ESA adjusted ESA Low
10.0 (10.0) 0
Parfrey 2005 UI15901766 Canada & UK
284 HD
IV or SC ESA for 24 wks to reach target then
maintained for 72 wks 24
ESA High
13.5-14.5 (13.3) Hypertension not
specified NS
AV fistulae, permanent
catheter, non site specific embolism
67 (23%) vs. 57 (19%) (NS)
—
Overall treatment emergent AE in >10%
of patients: 284 (96%) vs. 281
(94%)60
nd 281 ESA
Low 9.5-11.5 (10.9)
Furuland 2003 UI12543892 Multi
216 HD PD61
SC ESA TIW
12
ESA High
13.5–16.0 (13.4-14.3)
ΔMean DBP from baseline
90 vs. 83 mmHg
(P= 0.02)
Complication in synthetic graft,
fistulae, catheter during study
7 (5%) vs. 3(2%) in HD patients
only (NS)
—
Individuals with at least 1 SAE NOS: 110 (51%) vs. 97 (38.5%)
(NS) Thromboembolic
event: 56 (26%)vs. 47 (24%) per arm (NS)62
34
200 SC ESA TIW or no treatment
ESA Low
9-12 (11.3-11.7) 15
Foley 2000 UI10972697 Canada
73
HD
SC ESA ESA high arm had a 24
wk “ramping” phase. 24 wk maintenance was
similar in both arms
11
ESA High
13-14 (13) Mean SBP, DBP,
during between groups, and use of
Anti-HTN meds
For LVH: significant P=0.075 SBP and ↑Anti-HTN
For LVD: NS
AV access 6 (8%) vs. 10
(14%) (NS)63
— — nd 73 ESA
Low 9.5-10.5 (10.5)
ESA vs. Placebo
Abraham 1991 UI1751794 US
151 HD
IV ESA TIW after HD session
100 IU/kg 2-3
ESA 12.5-13.5 (10.8) Correlation
between BP and change in Hb or rate of Hb rise
No correlation64
ESA arm: 1 individual
withdrawn for severe high BP
— — 3 (2%) vs.
0 (0%) individuals
(nd) — nd
78 Placebo (7.5)
58 All individuals had evidence of congestive heart failure and ischemic heart disease. 59 Pre-study ABP had to be below 160/100 for 4 weeks prior to study. Subgroup analysis [2040]: 31 patients; Mean day & nocturnal BP readings for 24 hr were NS at baseline or at follow-up. 60 Of these p>0.05 for all comparisons except headache was greater in the ESA high arm and skeletal pain and surgery were greater in ESA low arm. More patients in the lower target experienced skeletal pain p=0.009, surgery p=0.013, and dizziness p=0.001, and more patients in the higher target group experienced headache p=0.030, and cerebrovascular events p=0.045. 61 Includes some pre-dialysis patients, stages 4-5. 62 Thromboembolic events were defined by WHO classification. 63 Patients with ongoing access problems were specifically excluded. The event rates small and study did not have enough statistical power to detect a moderate impact on access thrombosis; the proportion using natural fistulae in the Besarab study was 23% compared to 76% in this study. 64 No significant correlation but clinically important increases in BP appeared dose-related with earlier time to peak and peak BP achieved.

22
Author Year N
Dialy
sis
mod
ality
Description of Intervention
Follo
w-up
m
onth
s
Arm 1 Mean Hb (g/dL) target
(achieved)
Adverse events
Tota
l D/C
of
drug
Arm 2 BP change or hypertension Access thrombosis (%) Seizures Other reported AE
Arm 3 Definition Outcome Definition Outcome Description and Results
Nissenson 1995 UI7703390 US [Crossover]
78 PD
Self-admin. SC ESA TIW Blinded phase: 4,000 IU/mL;
Maintenance phase: 2,000, 4,000, or 10,000
IU/mL
6-9 ESA 10.6-12.6
(11.2) Increased DBP and anti-HTN regimen
55% vs. 20% (nd) — — —
Mild and SAE: 407 AEs in 74 patients vs.
325 AE in 63 patients65
(nd) nd
74 Placebo (8.0)
Coding of Outcomes: (Variable per Column Description) Hypertension: includes mean changes in SBP, DBP, MAP, increase in use of anti-HTN medications, difficult to control hypertension Access Thrombosis: synthetic grafts and fistulae
65 Mild and severe reactions not otherwise specified. Of 408 events such in ESA group, 37% (N=149) considered mild severity but possibly related to study medication, 1% (N=5) were considered severe or life threatening possibly or definitely related to study medication. In the placebo group 26% (N=85) were considered mild severity but possibly related to study medication, <1% (N=2) were considered severe or life threatening possibly or definitely related to study medication.

23
Supplemental Table 14. Summary table of RCTs comparing different Hb targets/ESA doses on exercise capacity in the HD-CKD and PD-CKD populations
66 Data shown for ESA arms vs. placebo. All statistical comparisons for ESA high vs. ESA low were not significant. 67 Not a significant improvement but did improve over study time 68 Only 3 children completed the treadmill test.
Author Year N
CKD stage Follow-
up months
Arm1 Mean Hb (g/dL) target
(achieved)
Primary outcome of study
Quality of life
Quality Arm 2 Scale/Test Description Results Baseline Hb
(g/dL) Arm 3
Parfrey 2005 UI15901766 Canada & UK
324 5 (HD)
24 ESA High 13.5-14.5
(13.1) Left ventricular volume index 6-min walk test
Patients are asked to cover as much distance in an enclosed corridor as they
can in 6 minutes NS Good
11.0 ESA Low 9.5-11.5 (10.8)
CanEPO 1990-1991 UI2108751, UI2048574, UI2192412 Canada
118
5 (HD)
6
ESA High 11.5 -13 (11.7)
QoL and functional capacity66
Naughton stress test NS
Good 7.0
ESA Low 9.5-11 (10.2) 6-min walk test
Patients are asked to cover as much distance in an enclosed corridor as they
can in 6 minutes NS
Placebo (7.4) Pediatric Patients
Morris 1993
UI8257180 UK
10 5
(PD,HD) 8 ESA 10.5 -12
(11.2) QoL, diet, exercise tolerance, and PD
efficiency Exercise tolerance
test 2-min walking NS67
Poor 7.0 Placebo (~6.5) Treadmill NS68

24
Supplemental Table 15. Evidence profile of RCTs comparing different higher vs. lower Hb targets/ESA doses in the ND-CKD populations
Outcome # of studies
& study design
Total N of patients
randomized
Methodologic quality of studies
Consistency across studies
Directness of the evidence including
applicability
Other considerations
Summary of findings Quality of
evidence for outcome
Qualitative description of effect size Importance of outcome
Mortality 6 RCTs (High) 6832 No limitations
(0)
No important inconsistencies
(0)
Direct (0)
None (0) High No difference Critical
CVD (including mortality)
7 RCTs (High) 6962 No limitations
(0) Some
inconsistency (-1)
Direct (0)
None (0) High No benefit. Possible harm with higher Hb target based on the
CHOIR study.69 Critical
QoL 6 RCTs (High) 6790 No limitations
(0) Some inconsistency
(-1) Direct
(0) None
(0) Moderate Possible benefit of higher Hb High
Transfusion requirement
2 RCTs (High) 4641
Some limitations
(-1)
No important inconsistencies
(0) Some uncertainty70
(-1) None
(0) Low Possible benefit High
Kidney disease progression
7 RCTs (High) 6614 No limitations
(0) Some inconsistency
(-1) Some uncertainty71
(-1) None
(0) Moderate No difference72 High
Adverse events 8 RCTs (High) 7132
Possible harm with increased hypertension incidence associated with high Hb targets. Insufficient evidence for other adverse event incidence.
Moderate
Total N of patients 8 RCTs (High) 7132
Balance of benefit and harm Trade off
Possible benefit with higher target for QoL and transfusion requirements. Possible harm for cardiovascular disease and adverse events
Quality of overall evidence Moderate
69 In Singh study, statistical significance of the primary outcome is lost after multivariate adjustment for CHF, atrial fibrillation/flutter, serum albumin, reticulocyte count, and age [HR 1.24 (95% CI: 0.95;1.62), p=0.111]. 70 Indications for transfusions were not per protocol. 71 Different degrees of blood pressure control and dietary modifications as concomitant therapies. 72 Shorter time to dialysis in CREATE
25
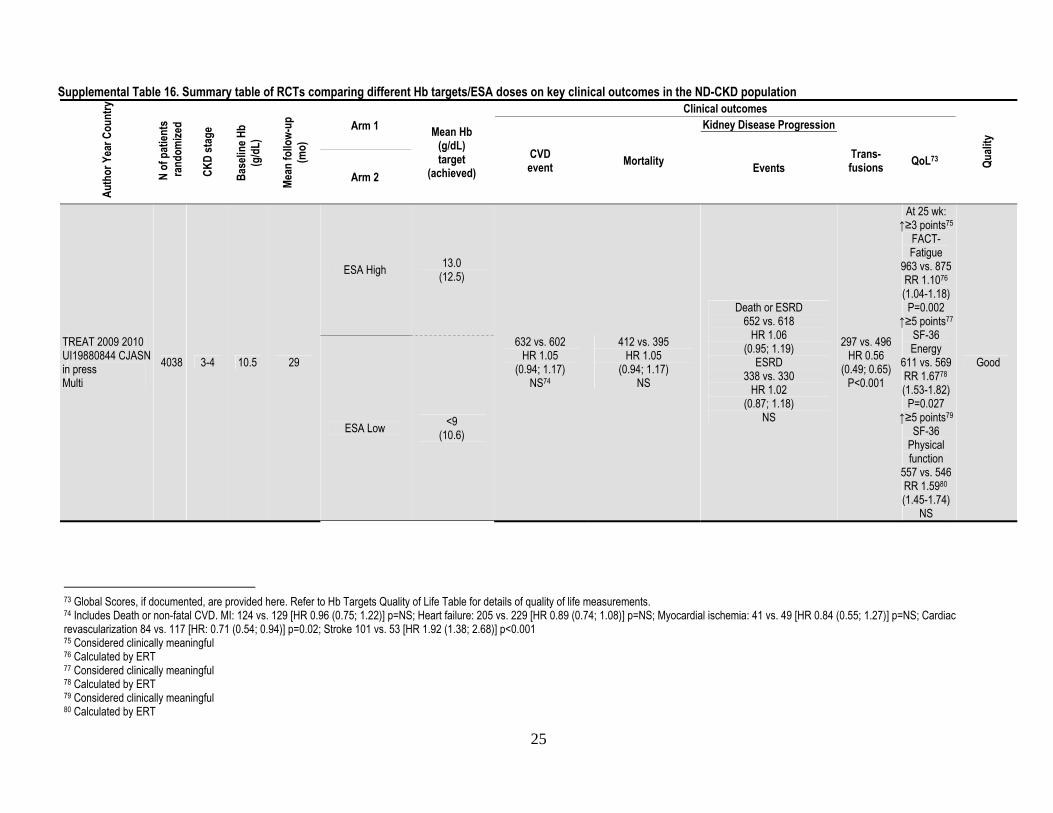
Supplemental Table 16. Summary table of RCTs comparing different Hb targets/ESA doses on key clinical outcomes in the ND-CKD population Au
thor
Yea
r Cou
ntry
N of
pat
ients
ra
ndom
ized
CKD
stag
e
Base
line H
b (g
/dL)
Mean
follo
w-up
(m
o)
Arm 1 Mean Hb
(g/dL) target
(achieved)
Clinical outcomes
Quali
ty
CVD event Mortality
Kidney Disease Progression
Trans-fusions QoL73 Events
Arm 2
TREAT 2009 2010 UI19880844 CJASN in press Multi
4038 3-4 10.5 29
ESA High 13.0 (12.5)
632 vs. 602 HR 1.05
(0.94; 1.17) NS74
412 vs. 395 HR 1.05
(0.94; 1.17) NS
Death or ESRD 652 vs. 618
HR 1.06 (0.95; 1.19)
ESRD 338 vs. 330
HR 1.02 (0.87; 1.18)
NS
297 vs. 496 HR 0.56
(0.49; 0.65) P<0.001
At 25 wk: ↑≥3 points75
FACT-Fatigue
963 vs. 875 RR 1.1076 (1.04-1.18)
P=0.002 ↑≥5 points77
SF-36 Energy
611 vs. 569 RR 1.6778 (1.53-1.82)
P=0.027 ↑≥5 points79
SF-36 Physical function
557 vs. 546 RR 1.5980 (1.45-1.74)
NS
Good
ESA Low <9 (10.6)
73 Global Scores, if documented, are provided here. Refer to Hb Targets Quality of Life Table for details of quality of life measurements. 74 Includes Death or non-fatal CVD. MI: 124 vs. 129 [HR 0.96 (0.75; 1.22)] p=NS; Heart failure: 205 vs. 229 [HR 0.89 (0.74; 1.08)] p=NS; Myocardial ischemia: 41 vs. 49 [HR 0.84 (0.55; 1.27)] p=NS; Cardiac revascularization 84 vs. 117 [HR: 0.71 (0.54; 0.94)] p=0.02; Stroke 101 vs. 53 [HR 1.92 (1.38; 2.68)] p<0.001 75 Considered clinically meaningful 76 Calculated by ERT 77 Considered clinically meaningful 78 Calculated by ERT 79 Considered clinically meaningful 80 Calculated by ERT

26
Auth
or Y
ear C
ount
ry
N of
pat
ients
ra
ndom
ized
CKD
stag
e
Base
line H
b (g
/dL)
Mean
follo
w-up
(m
o)
Arm 1 Mean Hb
(g/dL) target
(achieved)
Clinical outcomes
Quali
ty
CVD event Mortality
Kidney Disease Progression
Trans-fusions QoL73 Events
Arm 2
CHOIR 2006 UI17108343 US81 1432 3-4 10.1 16
ESA High 13.5 (12.782)
*125 vs. 9783
HR 1.34 (1.03 ; 1.74)
P=0.03
52 vs. 36 HR 1.48
(0.9; 2.27) NS
RRT 155 vs. 134
HR 1.19 (0.94; 1.49)
NS
— See QoL Table Fair
ESA Low 11.3 (11.484)
CREATE 2006 UI17108342 Multi 603 3-4 11.6 3685
ESA High 13-15 (13.486)
*58 vs. 4787
HR 1.28 (0.69; 1.89)
NS
31 vs. 21 HR1.51
(0.87; 2.63)88
NS
RRT 127 vs. 111
Shorter time to dialysis with high Hb target
P=0.03
26 vs. 33 (nd)
See QoL Table Good
ESA Low 10.5-11.5 (11.689)
Ritz 2007 UI17261422 Multi 172 1-3 11.9 15
ESA High 13-15 (13.5) 6 vs. 690
(nd) ---- RRT
2 vs. 3 (nd)
— See QoL Table Good
ESA Low 10.5-11.5 (12.1)
Levin 2005 UI16253719 Multi 172 3-4 11.8 22.6
(median)
ESA High 12-14 (12.8) 1 vs. 1
NS 1 vs. 3 NS91
RRT 8 vs. 11
NS — — Good
ESA Low 9-10.5 (11.5)
81 The data and safety monitoring board recommended that the study be terminated in May 2005 at the time of the second interim analysis, even though neither the efficacy nor the futility boundaries had been crossed, because the conditional power for demonstrating a benefit for the high-Hb group by the scheduled end of study was less than 5% for all plausible values of the true effect for the remaining data. Other factors that the board considered included an examination of differences between the treatment groups in adverse events, biochemical data, and QoL data. 82 From graph. Averaged over all measurements. 83 End point was a composite of death, myocardial infarction, hospitalization for congestive heart failure (excluding renal replacement therapy), and stroke. There was statistically significant imbalance at baseline with more individuals with CABG and HTN in higher Hb target arm. Statistical significance of the primary outcome is lost after multivariate adjustment for CHF, atrial fibrillation/flutter, serum albumin, reticulocyte count, and age [HR 1.24 (95% CI: 0.95; 1.62), p=0.111]. 84 From graph. Averaged over all measurements 85 Follow-up in Arm 1 was 35 months; Arm 2 was 36 months. 86 From graph. Averaged over all measurements 87 End point was a composite of a first cardiovascular event including sudden death, myocardial infarction, acute heart failure, stroke, transient ischemic attack, angina pectoris resulting in hospitalization for 24 hours or more or prolongation of hospitalization, complication of peripheral vascular disease (amputation or necrosis), or cardiac arrhythmia resulting in hospitalization for 24 hours or more. 88 For HR inverse was taken of those reported in the article to convert to HR of higher versus lower Hb target 89 From graph. Averaged over all measurements 90 6 vs. 5 patients for cardiac adverse events and 0 vs. 1 patient for ischemic stroke. 91 All adverse events leading to death were determined to be unrelated to the study drug.

27
Auth
or Y
ear C
ount
ry
N of
pat
ients
ra
ndom
ized
CKD
stag
e
Base
line H
b (g
/dL)
Mean
follo
w-up
(m
o)
Arm 1 Mean Hb
(g/dL) target
(achieved)
Clinical outcomes
Quali
ty
CVD event Mortality
Kidney Disease Progression
Trans-fusions QoL73 Events
Arm 2
Roger 2004 UI14694167 Australia & New Zealand
155 3-4 11.2 24 ESA High 12-13
(12.1) 0 vs.0 NS ---- --- — NS Good
ESA Low 9-10 (10.8)
Rossert 2006 UI16632012 Multi 39092 3-4 11.6 11.893
ESA High 13-1594
(14.0d,n) 3 vs. 4 (NS)
1 vs. 6
NS — — See QoL Table Poor
ESA Low 11-12 (12.095)
Macdougall 2006 UI16968726 UK96 197 2-5 10.9 2297
ESA Early 11 (11)
nd 1 vs. 698
NS
RRT 30 vs. 63
Mean time to dialysis or death NS
— — Poor ESA Late 11
(10.5) Annotations: * Primary outcome
92 Because of safety concerns in late 2002 related to the risk for EPO-induced pure red cell aplasia and subsequent labeling changes for SC administration of Eprex, the study was terminated prematurely by the sponsor. Thus GFR decline over 1 year could only be assessed in 163 patients (75 in Arm 1 and 88 in Arm 2) and quality of life follow-up was assessed in 177 patients with a median duration of 5.8 months between assessments. 93 . Intended 36 months, but study stopped early. Therefore, study duration was 4 months of stabilization phase and a median of 7 months in the High Hb and 8.6 months in the Low Hb group of maintenance phase. 94 Hemoglobin target was 14-15 g/dL for men and 13-14 g/dL in women. 95 In the High Hb group, the achieved Hb for men was 14.2 g/dL and for women was 13.6 g/dl. In the low Hb group, the achieved Hb for men was 12.1 g/dl and for women was 11.5 g/dl. From graph. Averaged over all measurements 96 The study, which began in 1997, was stopped early (December 2002) by the sponsor due to contraindication of the SC route of administration for EPO. Patients were followed-up for reasons of safety after their discontinuation, and were subsequently continued on a different EPO preparation to maintain their well-being. The results presented here provide some of the final available trial data in CKD patients administered EPO by the SC route before discontinuation of the study. 97 Follow-up in Arm 1 was 24 months; Arm 2 was 21 months. 98 Group B results include one death that occurred after dialysis started.

28
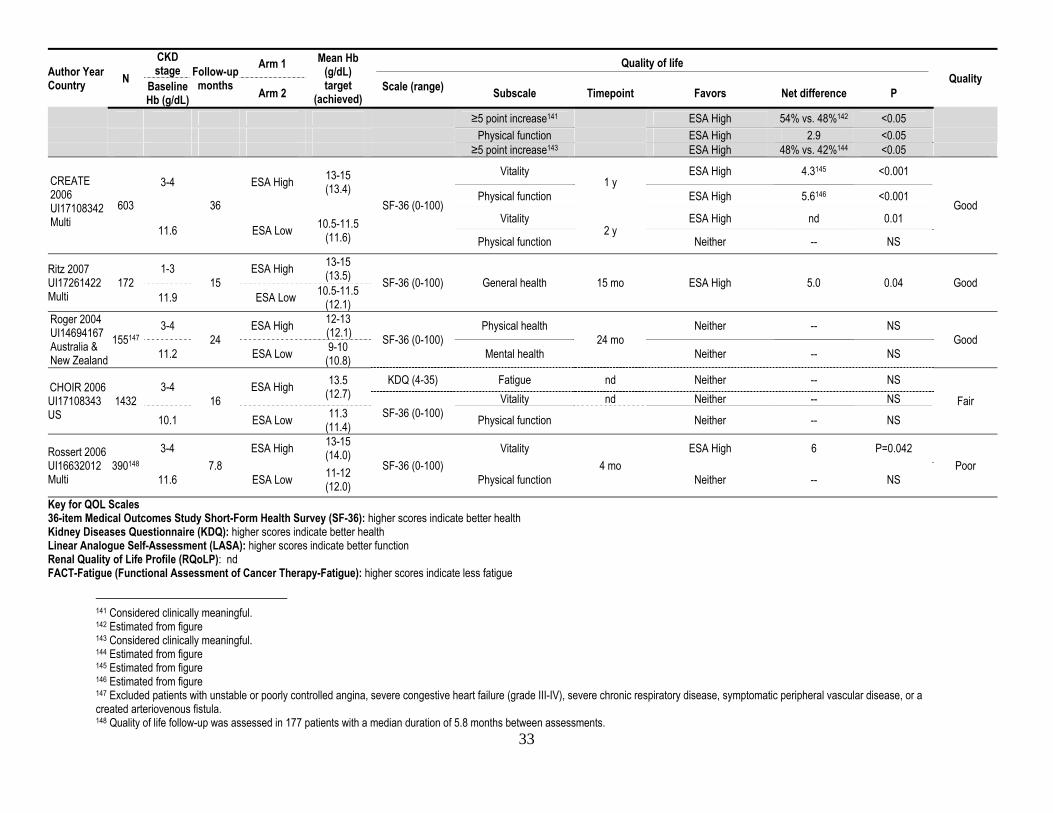
Supplemental Table 17. Summary table of RCTs comparing different Hb targets/ESA doses on quality of life in the ND-CKD population
Author Year Country N
CKD stage Follow-up
months
Arm 1 Mean Hb (g/dL) target
(achieved)
Quality of life Quality Baseline
Hb (g/dL) Arm 2 Scale (range) Subscale Timepoint Favors Net difference (or % improved) P
TREAT 2009 2010 UI19880844 CJASN in press Multi
4038 3-4
29
ESA High 13.0 (12.5) FACT (0-52) Fatigue
13 wk
ESA High 1.4 <0.0001
Good
≥3 point increase99 ESA High 55% vs. 49%100 <0.05
10.5 ESA Low <9
(10.6) EQ-5D (0-100) VAS ESA High 1.9 <0.0001
FACT (0-52) Fatigue
25 wk
ESA High 1.4 <0.001 ≥3 point increase101 ESA High 55% vs. 49% 0.002
SF-36 (0-100)
Energy Neither -- NS ≥5 point increase102 ESA High 54% vs. 49% 0.03
Physical function Neither -- NS ≥5 point increase103 Neither 49% vs. 48% NS Role physical Neither -- NS Bodily pain Neither -- NS General health Neither -- NS Social function Neither -- NS Role emotional Neither -- NS Mental health Neither -- NS EQ-5D (0-100) VAS ESA High 1.6 <0.05
FACT (0-52) Fatigue
49 wk
ESA High 1.2 <0.05 ≥3 point increase104 ESA High 52% vs. 47%105 <0.05
SF-36 (0-100)
Energy Neither -- NS ≥5 point increase106 Neither 53% vs. 50%107 NS
Physical function Neither -- NS ≥5 point increase108 Neither 49% vs. 46%109 NS Role physical ESA High 2.3 <0.001 Bodily pain Neither -- NS General health Neither -- NS Social function Neither -- NS Role emotional Neither -- NS
99 Considered clinically meaningful. 100 Estimated from figure 101 Considered clinically meaningful. 102 Considered clinically meaningful. 103 Considered clinically meaningful. 104 Considered clinically meaningful. 105 Estimated from figure 106 Considered clinically meaningful. 107 Estimated from figure 108 Considered clinically meaningful. 109 Estimated from figure

29
Author Year Country N
CKD stage Follow-up
months
Arm 1 Mean Hb (g/dL) target
(achieved)
Quality of life Quality Baseline
Hb (g/dL) Arm 2 Scale (range) Subscale Timepoint Favors Net difference (or % improved) P
Mental health Neither -- NS EQ-5D (0-100) VAS ESA High 1.9 <0.05
FACT (0-52) Fatigue 73 wk
ESA High 1.2 <0.05 ≥3 point increase110 Neither 51% vs. 49%111 NS EQ-5D (0-100) VAS ESA High 1.5 <0.05
FACT (0-52) Fatigue
97 wk
ESA High 1.5 <0.001 ≥3 point increase112 ESA High 51% vs. 45%113 <0.05
SF-36 (0-100)
Energy ESA High 1.5 <0.001 ≥5 point increase114 ESA High 54% vs. 48%115 <0.05
Physical function ESA High 2.9 <0.05 ≥5 point increase116 ESA High 48% vs. 42%117 <0.05 Role physical ESA High 3.6 <0.001 Bodily pain Neither -- NS General health Neither -- NS Social function Neither -- NS Role emotional Neither -- NS Mental health Neither -- NS EQ-5D (0-100) VAS ESA High 1.6 <0.05
CREATE 2006 UI17108342 Multi
603 3-4 36
ESA High 13-15 (13.4)
SF-36 (0-100)
Vitality
1 y
ESA High 4.3118 <0.001
Good
General health ESA High 3.9119 0.003
11.6 ESA Low 10.5-11.5 (11.6)
Mental health ESA High 4.8120 <0.001 Physical function ESA High 5.6121 <0.001
Physical role ESA High 7.8122 0.01 Social function ESA High 4.2123 0.006
Vitality 2 y ESA High nd 0.01 General health ESA High nd 0.008
110 Considered clinically meaningful. 111 Estimated from figure 112 Considered clinically meaningful. 113 Estimated from figure 114 Considered clinically meaningful. 115 Estimated from figure 116 Considered clinically meaningful. 117 Estimated from figure 118 Estimated from figure 119 Estimated from figure 120 Estimated from figure 121 Estimated from figure 122 Estimated from figure 123 Estimated from figure

30
Author Year Country N
CKD stage Follow-up
months
Arm 1 Mean Hb (g/dL) target
(achieved)
Quality of life Quality Baseline
Hb (g/dL) Arm 2 Scale (range) Subscale Timepoint Favors Net difference (or % improved) P
Mental health Neither -- NS Physical function Neither -- NS
Physical role Neither -- NS Social function Neither -- NS
Ritz 2007 UI17261422 Multi
172 1-3
15 ESA High 13-15
(13.5) SF-36 (0-100) General health 15 mo ESA High 5.0 0.04 Good 11.9 ESA Low 10.5-11.5
(12.1)
Roger 2004 UI14694167 Australia & New Zealand
155124 3-4 24
ESA High 12-13 (12.1) SF-36 (0-100)
Physical health 24 mo
Neither -- NS
Good
11.2 ESA Low 9-10 (10.8) Mental health Neither -- NS
RQoLP (nd) Global QoL (nd) 24 mo Neither -- NS
CHOIR 2006 UI17108343 US
1432 3-4 16
ESA High 13.5 (12.7)
LASA (0-100) nd Neither -- NS
Fair
KDQ (4-35) Fatigue nd Neither -- NS
10.1 ESA Low 11.3 (11.4)
SF-36 (0-100)
Vitality
nd
Neither -- NS
Physical function Neither -- NS General health Neither -- NS
Bodily pain Neither -- NS Social functioning Neither -- NS
Emotional role ESA Low -5.1 0.01 Mental health Neither -- NS Physical role Neither -- NS
Rossert 2006 UI16632012 Multi
390125 3-4 7.8
ESA High 13-15 (14.0)
SF-36 (0-100)
Vitality
4 mo
ESA High 6 0.042
Poor
Physical function Neither -- NS
11.6 ESA Low 11-12 (12.0)
General health Neither -- NS Bodily pain Neither -- NS
Social functioning Neither -- NS Emotional role Neither -- NS Mental health Neither -- NS Physical role Neither -- NS
Key for QOL Scales 36-item Medical Outcomes Study Short-Form Health Survey (SF-36): higher scores indicate better health Kidney Diseases Questionnaire (KDQ): higher scores indicate better health Linear Analogue Self-Assessment (LASA): higher scores indicate better function
124 Excluded patients with unstable or poorly controlled angina, severe congestive heart failure (grade III-IV), severe chronic respiratory disease, symptomatic peripheral vascular disease, or a created arteriovenous fistula. 125 Quality of life follow-up was assessed in 177 patients with a median duration of 5.8 months between assessments.

31
Renal Quality of Life Profile (RQoLP): nd FACT-Fatigue (Functional Assessment of Cancer Therapy-Fatigue): higher scores indicate less fatigue EQ-5D (EuroQoL): higher scores indicate better health)

32
Supplemental Table 18. Summary table of RCTs comparing different Hb targets/ESA doses on Fatigue, Vitality/Energy, and Physical function in the ND-CKD population
Author Year Country N
CKD stage Follow-up
months
Arm 1 Mean Hb (g/dL) target
(achieved)
Quality of life Quality Baseline
Hb (g/dL) Arm 2 Scale (range) Subscale Timepoint Favors Net difference P
TREAT 2009 2010 UI19880844 CJASN in press Multi
4038 3-4
29 ESA High 13.0
(12.5) FACT (0-52) Fatigue
13 wk ESA High 1.4 <0.001
Good
10.5 ESA Low <9 (10.6) ≥3 point increase126 ESA High 55% vs. 49%127 <0.05
FACT (0-52) Fatigue
25 wk
ESA High 1.4 <0.001 ≥3 point increase128 ESA High 55% vs. 49% 0.002
SF-36 (0-100)
Energy Neither -- NS ≥5 point increase129 ESA High 54% vs. 49% 0.03 Physical functioning Neither -- NS ≥5 point increase130 Neither 49% vs. 48% NS FACT (0-52) Fatigue
49 wk
ESA High 1.2 <0.05 ≥3 point increase131 ESA High 52% vs. 47%132 <0.05
SF-36 (0-100)
Energy Neither -- NS ≥5 point increase133 Neither 53% vs. 50%134 NS Physical function Neither -- NS ≥5 point increase135 Neither 49% vs. 46%136 NS
FACT (0-52) Fatigue
73 wk ESA High 1.2 <0.05
≥3 point increase137 Neither 51% vs. 49%138 NS
FACT (0-52)
Fatigue
97 wk
ESA High 1.5 <0.001
≥3 point increase139 ESA High 51% vs. 45%140 <0.05
SF-36 (0-100) Energy ESA High 1.5 <0.001
126 Considered clinically meaningful. 127 Estimated from figure 128 Considered clinically meaningful. 129 Considered clinically meaningful. 130 Considered clinically meaningful. 131 Considered clinically meaningful. 132 Estimated from figure 133 Considered clinically meaningful. 134 Estimated from figure 135 Considered clinically meaningful. 136 Estimated from figure 137 Considered clinically meaningful. 138 Estimated from figure 139 Considered clinically meaningful. 140 Estimated from figure
33
Author Year Country N
CKD stage Follow-up
months
Arm 1 Mean Hb (g/dL) target
(achieved)
Quality of life Quality Baseline
Hb (g/dL) Arm 2 Scale (range) Subscale Timepoint Favors Net difference P
≥5 point increase141 ESA High 54% vs. 48%142 <0.05 Physical function ESA High 2.9 <0.05 ≥5 point increase143 ESA High 48% vs. 42%144 <0.05
CREATE 2006 UI17108342 Multi
603
3-4
36
ESA High 13-15 (13.4)
SF-36 (0-100)
Vitality 1 y
ESA High 4.3145 <0.001
Good Physical function ESA High 5.6146 <0.001
11.6 ESA Low 10.5-11.5 (11.6)
Vitality 2 y
ESA High nd 0.01
Physical function Neither -- NS
Ritz 2007 UI17261422 Multi
172 1-3
15 ESA High 13-15
(13.5) SF-36 (0-100) General health 15 mo ESA High 5.0 0.04 Good 11.9 ESA Low 10.5-11.5
(12.1) Roger 2004 UI14694167 Australia & New Zealand
155147 3-4
24 ESA High 12-13
(12.1) SF-36 (0-100) Physical health
24 mo Neither -- NS
Good 11.2 ESA Low 9-10
(10.8) Mental health Neither -- NS
CHOIR 2006 UI17108343 US
1432 3-4
16 ESA High 13.5
(12.7) KDQ (4-35) Fatigue nd Neither -- NS
Fair SF-36 (0-100)
Vitality nd Neither -- NS
10.1 ESA Low 11.3 (11.4) Physical function Neither -- NS
Rossert 2006 UI16632012 Multi
390148
3-4 7.8
ESA High 13-15 (14.0)
SF-36 (0-100) Vitality
4 mo ESA High 6 P=0.042
Poor 11.6 ESA Low 11-12
(12.0) Physical function Neither -- NS
Key for QOL Scales 36-item Medical Outcomes Study Short-Form Health Survey (SF-36): higher scores indicate better health Kidney Diseases Questionnaire (KDQ): higher scores indicate better health Linear Analogue Self-Assessment (LASA): higher scores indicate better function Renal Quality of Life Profile (RQoLP): nd FACT-Fatigue (Functional Assessment of Cancer Therapy-Fatigue): higher scores indicate less fatigue
141 Considered clinically meaningful. 142 Estimated from figure 143 Considered clinically meaningful. 144 Estimated from figure 145 Estimated from figure 146 Estimated from figure 147 Excluded patients with unstable or poorly controlled angina, severe congestive heart failure (grade III-IV), severe chronic respiratory disease, symptomatic peripheral vascular disease, or a created arteriovenous fistula. 148 Quality of life follow-up was assessed in 177 patients with a median duration of 5.8 months between assessments.
34
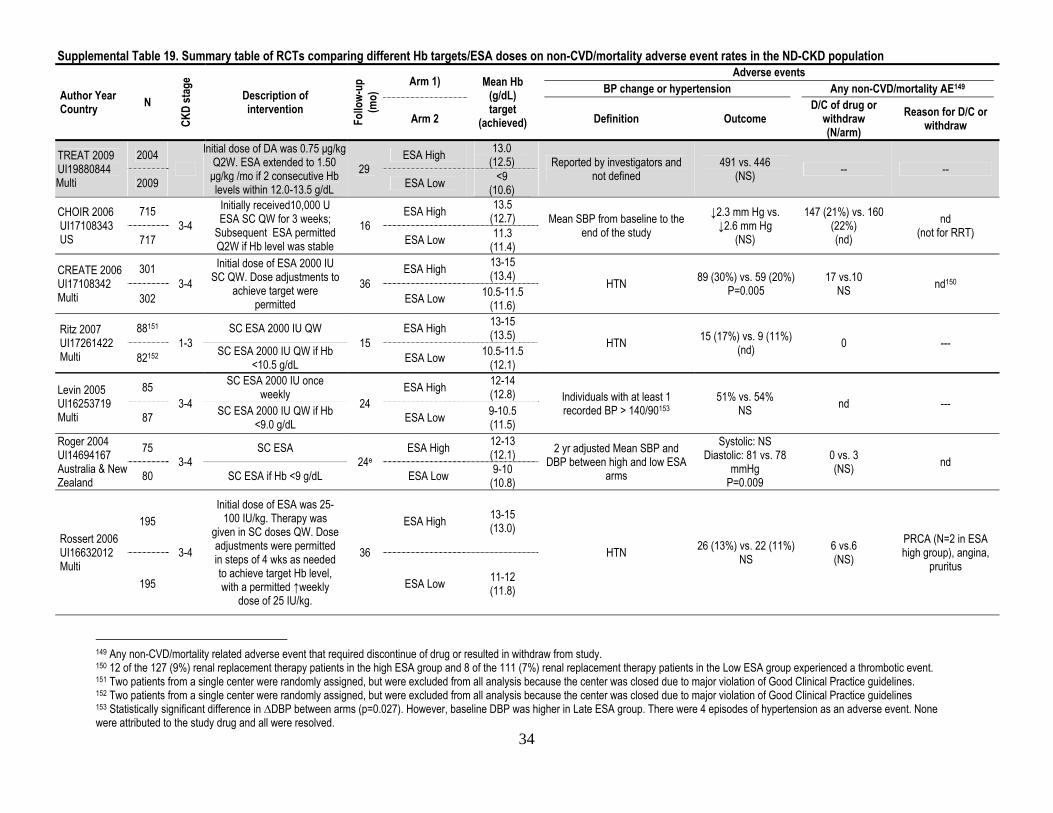
Supplemental Table 19. Summary table of RCTs comparing different Hb targets/ESA doses on non-CVD/mortality adverse event rates in the ND-CKD population
Author Year Country N
CKD
stag
e
Description of intervention
Follo
w-up
(m
o) Arm 1) Mean Hb
(g/dL) target
(achieved)
Adverse events BP change or hypertension Any non-CVD/mortality AE149
Arm 2 Definition Outcome D/C of drug or
withdraw (N/arm)
Reason for D/C or withdraw
TREAT 2009 UI19880844 Multi
2004
Initial dose of DA was 0.75 μg/kg Q2W. ESA extended to 1.50 μg/kg /mo if 2 consecutive Hb levels within 12.0-13.5 g/dL
29 ESA High 13.0
(12.5) Reported by investigators and not defined
491 vs. 446 (NS) -- --
2009 ESA Low <9 (10.6)
CHOIR 2006 UI17108343 US
715 3-4
Initially received10,000 U ESA SC QW for 3 weeks;
Subsequent ESA permitted Q2W if Hb level was stable
16 ESA High 13.5
(12.7) Mean SBP from baseline to the end of the study
↓2.3 mm Hg vs. ↓2.6 mm Hg
(NS)
147 (21%) vs. 160 (22%) (nd)
nd (not for RRT) 717 ESA Low 11.3
(11.4)
CREATE 2006 UI17108342 Multi
301 3-4
Initial dose of ESA 2000 IU SC QW. Dose adjustments to
achieve target were permitted
36 ESA High 13-15
(13.4) HTN 89 (30%) vs. 59 (20%) P=0.005
17 vs.10 NS nd150
302 ESA Low 10.5-11.5 (11.6)
Ritz 2007 UI17261422 Multi
88151
1-3 SC ESA 2000 IU QW
15 ESA High 13-15
(13.5) HTN 15 (17%) vs. 9 (11%) (nd) 0 ---
82152 SC ESA 2000 IU QW if Hb <10.5 g/dL ESA Low 10.5-11.5
(12.1)
Levin 2005 UI16253719 Multi
85 3-4
SC ESA 2000 IU once weekly
24 ESA High 12-14
(12.8) Individuals with at least 1 recorded BP > 140/90153
51% vs. 54% NS nd ---
87 SC ESA 2000 IU QW if Hb <9.0 g/dL ESA Low 9-10.5
(11.5) Roger 2004 UI14694167 Australia & New Zealand
75 3-4
SC ESA 24e
ESA High 12-13 (12.1) 2 yr adjusted Mean SBP and
DBP between high and low ESA arms
Systolic: NS Diastolic: 81 vs. 78
mmHg P=0.009
0 vs. 3 (NS) nd
80 SC ESA if Hb <9 g/dL ESA Low 9-10 (10.8)
Rossert 2006 UI16632012 Multi
195
3-4
Initial dose of ESA was 25-100 IU/kg. Therapy was
given in SC doses QW. Dose adjustments were permitted in steps of 4 wks as needed to achieve target Hb level, with a permitted ↑weekly
dose of 25 IU/kg.
36
ESA High 13-15 (13.0)
HTN 26 (13%) vs. 22 (11%) NS
6 vs.6 (NS)
PRCA (N=2 in ESA high group), angina,
pruritus 195 ESA Low 11-12
(11.8)
149 Any non-CVD/mortality related adverse event that required discontinue of drug or resulted in withdraw from study. 150 12 of the 127 (9%) renal replacement therapy patients in the high ESA group and 8 of the 111 (7%) renal replacement therapy patients in the Low ESA group experienced a thrombotic event. 151 Two patients from a single center were randomly assigned, but were excluded from all analysis because the center was closed due to major violation of Good Clinical Practice guidelines. 152 Two patients from a single center were randomly assigned, but were excluded from all analysis because the center was closed due to major violation of Good Clinical Practice guidelines 153 Statistically significant difference in ∆DBP between arms (p=0.027). However, baseline DBP was higher in Late ESA group. There were 4 episodes of hypertension as an adverse event. None were attributed to the study drug and all were resolved.

35
Author Year Country N
CKD
stag
e
Description of intervention
Follo
w-up
(m
o) Arm 1) Mean Hb
(g/dL) target
(achieved)
Adverse events BP change or hypertension Any non-CVD/mortality AE149
Arm 2 Definition Outcome D/C of drug or
withdraw (N/arm)
Reason for D/C or withdraw
Macdougall 2006 UI16968726 UK
65 2-5
SC ESA 1000U Q2W 36
ESA High 11 (11) HTN 14 (22%) vs. 9 (7%)
nd 132 SC ESA 2000 U thrice
weekly if Hb <9.0 g/dL ESA Low 9-11 (10.5)

36
Supplemental Table 20. ESA protocols from the major trials in CKD populations
Trial, Year Country Population
Hb Target, g/dL (Achieved) Drug Initial Dose Initial Timing of Changes
Maximum Doses Used
Low Target High Target Low Target High Target CanEPO 1990-1991 UI2108751, UI2048574, UI2192412 Canada
CKD 5D: HD 9.5-11 (10.2)
11.5-13 (11.7) Epoetin alfa 100 U/kg 12 wk (high target)
8 wk (low target) ??
CHOIR 2006 UI17108343 US
CKD Stage 3-4 11.3 (11.4)
13.5 (12.7) Epoetin alfa 10,000 U/wk 2 wk 20,000 U/wk
(per protocol) 20,000 U/wk (per protocol)
Parfrey 2005 UI15901766 Canada & UK
CKD 5D: HD 9.5-11.5 (10.8)
13.5-14.5 (13.1) Epoetin alfa 150 IU/kg/wk 2 wk154 ??
Besarab 1998 UI9718377 US
CKD 5D: HD 10.0±1.0 (10.0)
14.0±1.0 (12.7-13.3) Epoetin alfa Low: ~150 U/kg/wk155
High: ~225 U/kg/wk156 2 wk 500 U/Kg/wk (per protocol)
500 U/Kg/wk (per protocol)
CREATE 2006 UI17108342 Multiple
CKD Stage 3-4 10.5-11.5 (11.6)
13-15 (13.4) Epoetin beta 2000 IU/wk 4 wk 20,000 U/wk
(per protocol) 20,000 U/wk (per protocol)
TREAT 2009 UI19880844 Multiple
CKD Stage 3-4, DM <9 (10.6)
13.0 (12.5) Darbepoetin alfa 0.75 μg/kg 2 wk 1.5 µg/kg 600 μg/mo
(per protocol)
Some of these data are from personal communications with the study authors.
154 Discretionary 155 Low Hb group started on baseline epoetin dose (coming into the trial), which was 153±119 U/Kg/wk. High Hb group was started at 1.5 times their baseline epoetin dose, which was 146±103 U/kg/wk. 156 Low Hb group started on baseline epoetin dose (coming into the trial), which was 153±119 U/Kg/wk. High Hb group was started at 1.5 times their baseline epoetin dose, which was 146±103 U/kg/wk.

37
Supplemental Table 21. Evidence profile of RCTs examining IV vs. SC EPO in CKD patients with anemia
Outcome # of studies
and study design
Total N (treatment)
Methodological quality of studies
per outcome Consistency
across studies
Directness of the evidence
generalizability/ applicability
Other considerations
Summary of findings
Quality of evidence for outcome
Qualitative and quantitative description of effect
Importance of outcome
Mortality 4 RCTs (High)
599 (276)
Some limitations (-1)
No important inconsistencies
(0) Direct
(0) Imprecision
(-1) Low Insufficient evidence Critical
CV mortality 1 RCT (High)
114 (53)
No limitations (0) NA Direct
(0)
Sparse (-1)
Imprecision (-1)
Low Insufficient evidence Critical
CV events 0 RCTs -- -- -- -- -- -- -- Critical ESRD 0 RCTs -- -- -- -- -- -- -- Critical
Transfusion 2 RCTs (High)
252 (128)
Some limitations (-1)
No important inconsistencies
(0) Direct
(0)
Sparse (-1)
Imprecision (-1)
Very low Insufficient evidence High
QoL 1 RCT (High)
83 (45)
Some limitations (-1) NA Direct
(0) Sparse
(-1) Low No difference High
Hb (categorical)
3 RCTs (High)
394 (200)
No limitations (0)
No important inconsistencies
(0) Direct
(0) Sparse
(-1) Moderate No difference157 Moderate
Hb (continuous)
4 RCTs (High)
559 (276)
Some limitations (-1)
No important inconsistencies
(0) Direct
(0) None
(0) Moderate No difference Moderate
ESA dose (categorical) 0 RCTs -- -- -- -- -- -- -- Moderate
ESA dose (continuous)
4 RCTs (High)
559 (276)
Some limitations (-1)
No important inconsistencies
(0) Direct
(0) None
(0) Moderate Benefit with SC EPO. No difference for darbepoetin. Moderate
Adverse events 3 RCTs (High)
351 (175) Possible harm with SC, especially in regards
to pain (SC 18% vs. IV 0%) Moderate
Total 4 RCTs 599 (276)
Balance of potential benefits and harms: Insufficient evidence for important clinical outcomes
No difference in Hb response Benefit for decreasing ESA dose with SC EPO
Quality of overall evidence: Low
157 In one study, more patients are out of range with SC.

38
Supplemental Table 22. Summary table of RCTs158 examining IV vs. SC ESA in CKD patients with anemia (categorical outcomes)
Outcome Author, Year, Country
Outcome Assessment
Time (Treatment Duration)
Treatments (Number Analyzed / Enrolled)
CKD Stage
Baseline TSAT/
Ferritin Arm 1
(Arm 2)
Mean ESA dose Arm 1
(Arm 2)
Hemoglobin (g/dL) Results P-
value Quality Arm 1 (Intervention)
Arm 2 (Comparator)
Baseline Arm 1
(Arm 2)
Achieved Arm 1
(Arm 2)
Events No (%) Arm 1
[Arm 2]
RR/OR/HR (95% CI)
Mortality All cause mortality Bommer 2008
UI18676350 Germany
48 wk (52 wk)
IV Darbepoetin α 53/53
SC Darbepoetin α 61/61 CKD 5D 502 pg/mL
(556 pg/mL) 31.1 µg
(26.9 µg) 11.6
(12.0) 11.6
(11.7)
3 (6%) [5 (8%)]
RR 0.69159 (0.16; 2.75) NS Good
Cerebral bleeding death
0 (%) [1 (2%)] nd nd Good
Death160 Muirhead, 1992 UI2192414 Canada
48 wk (48 wk)
SC rHuEPO 45/64
IV rHuEPO 38/64 CKD 5D: HD nd
147 U/kg/wk
(184 U/kg/wk)
8.0 (7.7)
10.9 (11.2)
3 (5%) [12 (13%)]
RR 0.34161 (0.09; 1.36) NS Good
All cause mortality
Chazot 2009 UI19407262 France
6 mo (6 mo)
SC direct switch to IV Darbepoetin
α 77/77
SC indirect switch to IV Darbepoetin α after 2 mo of SC
darbepoetin 77/77
CKD 5D: HD 34%/418
µg/L (35%/479
µg/L)
0.44 µg/kg/wk
(0.46 µg/kg/wk)
11.6 (11.5)
11.7 (12.0)
3 (4%) [8 (10%)]
RR 0.38 (0.10; 1.36) NS Fair
Death Kaufman 1998 UI9718376 US
26 wk (26 wk)
IV EPO 101/101
SC EPO 107/107 CKD 5D: HD
28%/305 ng/mL
(29%/297 ng/mL)
122 U/kg/wk
(117 U/kg/wk)
Hct 32% (Hct 32%)
Hct 31% (Hct 31%)
8 (8%) [11 (10%)]
RR 0.77 (0.32;
1.84)162 NS Fair
CV Mortality
Cardiac death Bommer 2008 UI18676350 Germany
48 wk (52 wk)
IV Darbepoetin α 53/53
SC Darbepoetin α 61/61 CKD 5D 502 pg/mL
(556 pg/mL) 31.1 µg
(26.9 µg) 11.6
(12.0) 11.6
(11.7) 2 (4%) [2 (3%)]
RR 1.15163 (0.17; 7.89) NS Good
Transfusions
Blood transfusion
Bommer 2008 UI18676350 Germany
48 wk (52 wk)
IV Darbepoetin α 53/53
SC Darbepoetin α 61/61 CKD 5D 502 pg/mL
(556 pg/mL) 31.1 µg
(26.9 µg) 11.6
(12.0) 11.6
(11.7) 4 (8%) [4 (7%)]
RR1.15164 (0.30; 4.38) NS Good
158 Kaufman and Muirhead were known older studies but were not part of a systematic review. 159 Calculated by ERT 160 Includes those who died during 1 month placebo run-in period and after withdrawal from the study (cessation of therapy). 161 Calculated by ERT 162 Calculated by ERT 163 Calculated by ERT 164 Calculated by ERT

39
Outcome Author, Year, Country
Outcome Assessment
Time (Treatment Duration)
Treatments (Number Analyzed / Enrolled)
CKD Stage
Baseline TSAT/
Ferritin Arm 1
(Arm 2)
Mean ESA dose Arm 1
(Arm 2)
Hemoglobin (g/dL) Results P-
value Quality Arm 1 (Intervention)
Arm 2 (Comparator)
Baseline Arm 1
(Arm 2)
Achieved Arm 1
(Arm 2)
Events No (%) Arm 1
[Arm 2]
RR/OR/HR (95% CI)
Transfusion Kaufman 1998 UI9718376 US
26 wk (26 wk)
IV EPO 101/101
SC EPO 107/107 CKD 5D: HD
28%/305 ng/mL
(29%/297 ng/mL)
122 U/kg/wk
(117 U/kg/wk)
Hct 32% (Hct 32%)
Hct 31% (Hct 31%)
9 (12%) [7 (9%)]
RR 1.36 (0.53;
3.52)165 NS
(0.61) Fair
Hb
ΔHb ≥1 g/dL
Patel 2009 UI19088467 US
4 wks (24 wks)
IV EPO 78/78
SC EPO 79/79 CKD 5D: HD
28%/315 ng/mL
(27%/293 ng/mL)
49.99 U/kg/sess
ion (36
U/kg/session)
10.38 (10.37) nd
69 (88%) [72 (91%)]
RR 0.97166 (0.87; 1.08) NS Good
ΔHb >1.5 g/dL
40 (51%) [44 (56%)]
RR 0.92167 (0.69; 1.23) NS Good
ΔHb 2 g/dL 25 (32%) [27 (34%)]
RR 0.94168 (0.60; 1.46) NS Good
↑Hb >3.0 g/dL
1 (1%) [4 (5%)]
RR 0.25169 (0.03; 2.22) NS Good
↓Hb >3.0 g/dL
3 (4%) [6 (8%)]
RR 0.51170 (0.13; 1.95) NS Good
Mean number of weeks with Hb >11g/dL or <10 g/dL
12.45 (13.92) -- 0.04 Good
Mean number of ΔHb ≥1 g/dL
3.44 (4.03) -- NS
(0.08) Good
Mean number of ΔHb>1.5 g/dL
1.27 (1.49) -- NS
(0.22) Good
Number of ΔHb of 2 g/pt
0.63 (0.71) nd NS
(0.42) Good
165 Calculated by ERT 166 Calculated by ERT 167 Calculated by ERT 168 Calculated by ERT 169 Calculated by ERT 170 Calculated by ERT

40
Outcome Author, Year, Country
Outcome Assessment
Time (Treatment Duration)
Treatments (Number Analyzed / Enrolled)
CKD Stage
Baseline TSAT/
Ferritin Arm 1
(Arm 2)
Mean ESA dose Arm 1
(Arm 2)
Hemoglobin (g/dL) Results P-
value Quality Arm 1 (Intervention)
Arm 2 (Comparator)
Baseline Arm 1
(Arm 2)
Achieved Arm 1
(Arm 2)
Events No (%) Arm 1
[Arm 2]
RR/OR/HR (95% CI)
Number of ↑Hb >3.0 g/dL
0.01 (0.05) nd NS
(0.17) Good
Number of ↓Hb >3.0 g/dL
0.04 (0.08) nd NS
(0.18) Good
Failure to achieve or maintain Hb target
Muirhead, 1992 UI2192414 Canada
48 wk (48 wk)
SC rHuEPO 45/64
IV rHuEPO 38/64 CKD 5D: HD nd
147 U/kg/wk
(184 U/kg/wk)
8.0 (7.7)
10.9 (11.2)
6171 (9.4%) [12 (19%)]
RR 0.45172 (0.16; 1.28) NS173 Good
Patients with stable Hb levels
Chazot 2009 UI19407262 France
6 mo (6 mo)
SC direct switch to IV Darbepoetin
α 77/77
SC indirect switch to IV Darbepoetin α after 2 mo of SC
darbepoetin 77/77
CKD 5D: HD 34%/418.3
µg/L (35.4%/479.
4µg/L)
0.44 µg/kg/wk
(0.46 µg/kg/wk)
11.6 (11.5)
11.7 (12.0)
64 (83%174) [63 (82%)]
RD -1.0 (-12.7; 10.7)175
Non-inf176 Fair
171 Includes 1 patient who was kept below target by physician. 172 Calculated by ERT 173 Without 1 patient kept below target OR=0.37 (95% CI 0.12, 1.13) p=0.08. 174 Calculated by ERT 175 90% CI 176 This study shows equivalence between groups 1 and 2 in terms of percentage of patients with Hb stability. Moreover, equivalence between groups 1 and 2 in terms of proportions of patients with Hb stability at month 3 was shown. At the end of the study, the mean intravenous darbepoetin dosages were similar between the 3 treatment groups, whatever the initial route of administration.

41
Supplemental Table 23. Summary table of RCTs177 examining IV vs. SC ESA in CKD patients with anemia (continuous outcomes)
Outcome Author, Year, Country
Outcome Assessment
Time (Treatment Duration)
Treatments (Number Analyzed / Enrolled)
CKD Stage
Baseline TSAT/
Ferritin Arm 1
(Arm 2)
Mean ESA dose Arm 1
(Arm 2)
Hemoglobin (g/dL) Results P-
value Quality Arm 1 (Intervention)
Arm 2 (Comparator)
Baseline Arm 1
(Arm 2)
Achieved Arm 1
(Arm 2)
Baseline Arm 1
(Arm 2)
∆ (95% CI) Arm 1
(Arm 2) QoL KDQ Physical
Muirhead, 1992 UI2192414 Canada
48 wk (48 wk)
SC rHuEPO 45/64
IV rHuEPO 38/64 CKD 5D: HD nd
147 U/kg/wk
(184 U/kg/wk)
8.0 (7.7)
10.9 (11.2)
4.3 (4.3)
+0.9 (+1.0) NS
Fair
KDQ Fatigue 4.5 (4.3)
+0.5 (+0.8) NS
KDQ Relation-ships
5.2 (4.9)
+0.2 (+0.5) NS
KDQ Depression
5.1 (5.0)
+0.3 (+0.4) NS
KDQ Frustration
5.3 (4.9)
+0.1 (+0.3) NS
KDQ Global Physical
4.5 (4.4)
+0.6 (+0.7) NS
KDQ Global Emotional
5.2 (4.9)
+0.2 (+0.4) NS
Hb/Hct
ΔHb, g/dL Bommer 2008 UI18676350 Germany
48 wk (52 wk)
IV Darbepoetin α 53/53
SC Darbepoetin α 61/61 CKD 5D
502 pg/mL (556
pg/mL)
31.1 µg (26.9 µg)
11.6 (12.0)
11.6 (11.7)
11.6 (12.0)
+0.36 -0.04 ,0.76
(range) NS
(0.073) Good
Hb, g/dL Muirhead, 1992 UI2192414 Canada
48 wk (48 wk)
SC rHuEPO 45/64
IV rHuEPO 38/64 CKD 5D: HD nd
147 U/kg/wk
(184 U/kg/wk)
8.0 (7.7)
10.9 (11.2)
8.0 (7.7)
+2.9 (+3.5) NS Good
Hb, g/dL Chazot 2009 UI19407262 France
6 mo (6 mo)
SC direct switch to IV Darbepoetin
α 77/77
SC indirect switch to IV Darbepoetin α after 2 mo of SC
darbepoetin 77/77
CKD 5D: HD 34%/418
µg/L (35%/479
µg/L)
0.44 µg/kg/wk
(0.46 µg/kg/wk)
11.6 (11.5)
11.7 (12.0)
11.6 (11.5)
+0.1 (+0.5) nd Fair
ΔHct, % Kaufman 1998 UI9718376 US
26 wk (26 wk)
IV EPO 101/101
SC EPO 107/107 CKD 5D: HD
28%/305 ng/mL
(29%/297 ng/mL)
122 U/kg/wk
(117 U/kg/wk)
Hct 32% (Hct 32%)
Hct 31% (Hct 31%)
32% (32%)
-0.9% (-0.7%)
NS (0.60) Fair
177 Kaufman and Muirhead were known older studies but were not part of a systematic review.

42
Outcome Author, Year, Country
Outcome Assessment
Time (Treatment Duration)
Treatments (Number Analyzed / Enrolled)
CKD Stage
Baseline TSAT/
Ferritin Arm 1
(Arm 2)
Mean ESA dose Arm 1
(Arm 2)
Hemoglobin (g/dL) Results P-
value Quality Arm 1 (Intervention)
Arm 2 (Comparator)
Baseline Arm 1
(Arm 2)
Achieved Arm 1
(Arm 2)
Baseline Arm 1
(Arm 2)
∆ (95% CI) Arm 1
(Arm 2) ESA dose
ΔDarbepoetin doses, µg/wk
Bommer 2008 UI18676350 Germany
48 wk (52 wk)
IV Darbepoetin α 53/53
SC Darbepoetin α 61/61 CKD 5D
502 pg/mL (556
pg/mL)
31.1 µg (26.9 µg)
11.6 (12.0)
11.6 (11.7)
31.7 (25.8)
Net Δ -1.25
NS (0.67) Good
EPO dose (U/kg/wk) Muirhead,
1992 UI2192414 Canada
48 wk (48 wk)
SC rHuEPO 45/64
IV rHuEPO 38/64 CKD 5D: HD nd
147 U/kg/wk
(184 U/kg/wk)
8.0 (7.7)
10.9 (11.2)
0 147 (184) NS
Good EPO dose (U/kg/wk) Stabilization
(32-48 wk)
0 206 (274) 0.02
Time to stabilization (wk)
-- 14.9 (17.3) 0.006
Darbepoetin dose, µg/kg/wk
Chazot 2009 UI19407262 France
6 mo (6 mo)
SC direct switch to IV Darbepoetin
α 77/77
SC indirect switch to IV Darbepoetin α after 2 mo of SC
darbepoetin 77/77
CKD 5D: HD 34%/418
µg/L (35.4%/479 µg/L)
0.44 µg/kg/wk
(0.46 µg/kg/wk)
11.6 (11.5)
11.7 (12.0)
0.45 (0.46)
-0.01 (0) nd Fair
ΔWeekly EPO dose, U/kg/wk
Kaufman 1998 UI9718376 US
26 wk (26 wk)
IV EPO 101/101
SC EPO 107/107 CKD 5D: HD
28%/305 ng/mL
(29%/297 ng/mL)
122 U/kg/wk
(117 U/kg/wk)
Hct 32% (Hct 32%)
Hct 31% (Hct 31%)
122 (117)
+18.3 (-21.9) <0.001 Fair

43
Supplemental Table 24. Summary table of adverse events in RCTs178 examining IV vs. SC EPO in CKD patients with anemia
Adverse Event
Author, Year, Country
Outcome Assessment
Time (Treatment Duration)
Treatments (Number Analyzed / Enrolled)
CKD Stage Baseline
TSAT/ Ferritin Arm 1
(Arm 2)
Mean ESA dose Arm 1
(Arm 2)
Hemoglobin (g/dL) Results
P-value Arm 1 (Intervention)
Arm 2 (Comparator)
Baseline Arm 1
(Arm 2)
Achieved Arm 1
(Arm 2) Definition
Events No (%) Arm 1
[Arm 2]
Total Bommer 2008 UI18676350 Germany
48 wk (52 wk)
IV Darbepoetin α
53/53
SC Darbepoetin α
61/61 CKD 5D 502 pg/mL
(556 pg/mL) 31.1 µg
(26.9 µg) 11.6
(12.0) 11.6
(11.7)
All 18 (34%) [38 (62%)] 0.005179
SAEs Including death 6 (11%) [24 (39%)] 0.003180
Related to darbepoeitin
Classified as related to by the
investigators 5 (9%) [4 (7%)] NS181
Total AE Chazot 2009 UI19407262 France
6 mo (6 mo)
SC direct switch to IV
Darbepoetin α 77/77
SC indirect switch to IV
Darbepoetin α after 2 mo of
SC darbepoetin
77/77
CKD 5D: HD 34%/418 µg/L
(35.4%/479 µg/L)
0.44 µg/kg/wk (0.46
µg/kg/wk) 11.6
(11.5) 11.7
(12.0) Mild or moderate 25 (32%) [22 (29%)] NS
Seizure
Muirhead, 1992 UI2192414 Canada
48 wk (48 wk)
SC rHuEPO 45/64
IV rHuEPO 38/64 CKD 5D: HD nd 147 U/kg/wk
(184 U/kg/wk) 8.0
(7.7) 10.9
(11.2)
nd (none HTN) 4 (7%) [1 (2%)] nd
Serious HTN PreHD DBP>110 or HTN seizure
18 (30%) [22 (36%)] nd
Thrombotic events
Dialysis access or extracorporeal
circuit 24 (39%) [30 (48%)] nd
Failure of access nd 21%
[18%] nd
SC pain nd 11 (18%) [0 (0%)] nd
178 Kaufman and Muirhead were known older studies but were not part of a systematic review. 179 Calculated by ERT 180 Calculated by ERT 181 Calculated by ERT

44
Supplemental Table 25. Evidence profile of RCTs examining different dosing schedules in CKD patients with anemia
Outcome # of studies
and study design
Total N (treatment)
Methodological quality of studies
per outcome Consistency
across studies
Directness of the evidence
generalizability/ applicability
Other considerations
Summary of findings
Quality of evidence for outcome
Qualitative and quantitative description of effect
Importance of outcome
Mortality 7 RCTs (High)
2803 (1884)
No limitations (0)
No important inconsistencies
(0) Direct
(0) Imprecision
(-1) Moderate Insufficient evidence Critical
CV mortality 2 RCTs (High)
803 (570)
No limitations (0)
No important inconsistencies
(0) Direct
(0) Imprecision
(-1) Moderate Insufficient evidence Critical
CV events 2 RCTs (High)
949 (711)
No limitations (0) NA Direct
(0) Imprecision
(-1) Moderate Insufficient evidence Critical
ESRD 1 RCT (High)
644 (322)
Some limitations (-1) NA Direct
(0)
Sparse (-1)
Imprecision (-1)
Very low Insufficient evidence Critical
Transfusion 5 RCTs (High)
2003 (1282)
Some limitations (-1)
No important inconsistencies
(0) Direct
(0) Imprecision
(-1) Low Insufficient evidence High
QoL 1 RCT (High)
519 (489)
Some limitations (-1)
No important inconsistencies
(0) Direct
(0) Sparse
(-1) Moderate No difference High
Hb (categorical)
3 RCTs (High)
1257 (739)
No limitations (0)
No important inconsistencies
(0) Direct
(0) None
(0) High No difference Moderate
Hb (continuous)
8 RCTs (High)
3006 (2086)
No limitations (0)
Important inconsistencies
(0) Direct
(0) None
(0) Moderate No difference182 Moderate
ESA dose (categorical) 0 RCTs -- -- -- -- -- -- -- Moderate
ESA dose (continuous)
4 RCTs (High)
1003 (638)
No limitations (0)
No important inconsistencies
(0) Direct
(0) None
(0) High Benefit of C.E.R.A every two weeks vs. once every month and epoetin every week vs. IV darbepoetin every week or epoetin three times per week
Moderate
Adverse events 6 RCTs (High)
2803 (1984) No difference in major adverse events Moderate
Total 8 RCTs 3006 (2086)
182 In one study, there was a benefit for IV darbepoetin alfa every week or epoetin alfa three times per week over epoetin alfa every week in dialysis patients.
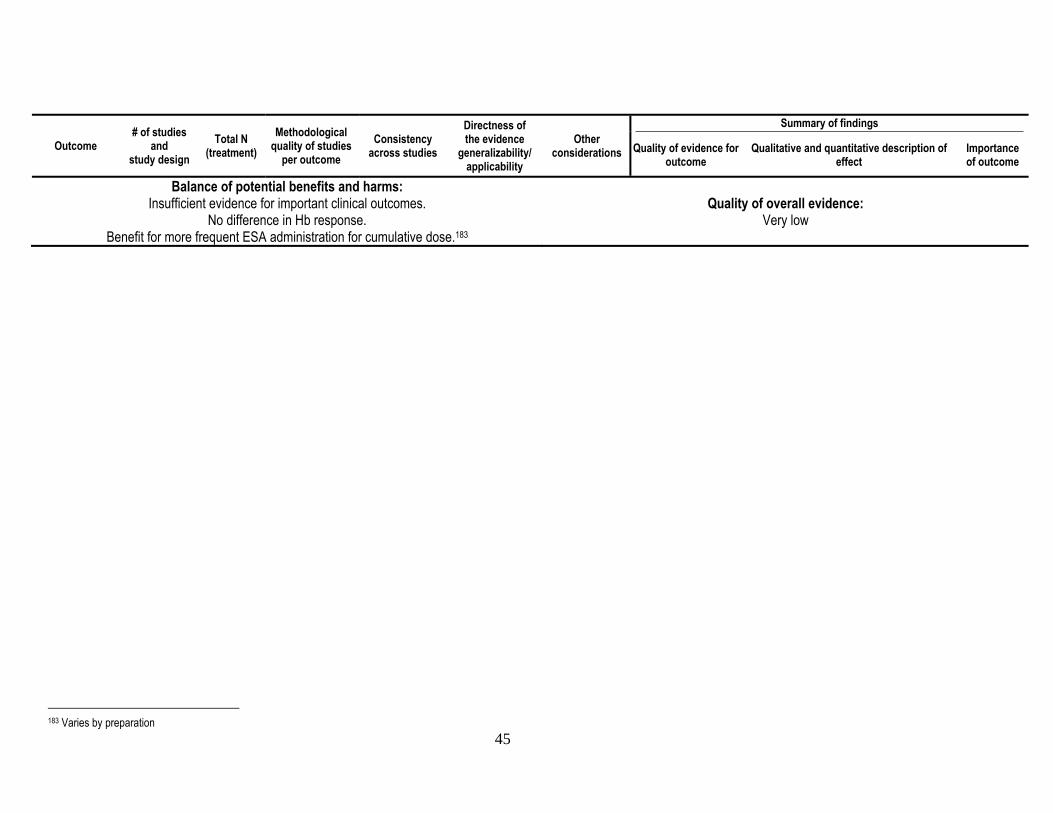
45
Outcome # of studies
and study design
Total N (treatment)
Methodological quality of studies
per outcome Consistency
across studies
Directness of the evidence
generalizability/ applicability
Other considerations
Summary of findings
Quality of evidence for outcome
Qualitative and quantitative description of effect
Importance of outcome
Balance of potential benefits and harms: Insufficient evidence for important clinical outcomes.
No difference in Hb response. Benefit for more frequent ESA administration for cumulative dose.183
Quality of overall evidence: Very low
183 Varies by preparation

46
Supplemental Table 26. Summary table of RCTs examining different dosing schedules in CKD patients with anemia (categorical outcomes)
Outcome Author, Year,
Country
Outcome Assessme
nt Time (Treatment Duration)
Treatments (Number Analyzed / Enrolled)
Baseline GFR
Arm 1 (Arm 2) [CKD Stage]
Baseline TSAT/Ferritin
Arm 1 (Arm 2)
Mean ESA dose Arm 1
(Arm 2)
Hemoglobin (g/dL) Results P-
value Quality Arm 1 (Intervention)
Arm 2 (Comparato
r)
Baseline Arm 1
(Arm 2)
Achieved Arm 1
(Arm 2)
Events No (%) Arm 1
[Arm 2]
RR/OR/HR (95% CI)
Q2W vs. Q4W Mortality
All cause mortality
Levin 2007 UI17950856 Multi
52 wks (52 wks)
Methoxy polyethylene glycol-EPO β
Q2W 223/223
Methoxy polyethylene glycol- EPO β Q4W 224/224
CKD 5D 27%/453 μg/L (28%/522 μg/L)
Median 57µg/2 wk (175 µg/4
wk)
119.7 g/L (118.5 g/L)
118.0 g/L (116.1 g/L)
19 (9%) [15 (7%)]
RR 1.26184 (0.66;2.42) NS Fair
Total death Pergola 2010 UI20185602 US
37 wks (37 wks)
EPO Q2W 107/107
EPO Q4W 215/215
29 mL/min (28 mL/min)
519 pmol/L (559 pmol/L)
4529 IU/wk (5423 IU/w
k) 11.12
(11.17) 11.0
(11.0) 3 (3%) [9 (4%)]
RR 0.33185 (0.09; 1.20) NS Good
Deaths Sulowicz 2007 UI17699476 Multi
36 wk (36 wk)
C.E.R.A. Q2W 190/190
C.E.R.A Q4W
191/191 CKD 5D: HD
& PD
30%/418 ng/mL
(28%/427 ng/mL)
56 μg/2wk (150
μg/4wk) 11.70
(11.66) 11.70
(11.46) 13 (7%)
[18 (10%)]
RR 0.73186 (0.37;1.44) NS Fair
Death [safety]
Kessler 2010 UI19888948 Multi
53 wk (53 wk)
C.E.R.A. Q2W 73/73
C.E.R.A. Q4W 72/72
CKD Stage 3-4
≥20%/≥100 ng/mL
(≥20%/≥100 ng/mL)
Median IQR range
0.17 µg/kg/wk
(0.22 µg/kg/wk)
8-11 g/dL (8-11g/dL)
11.92 (11.70)
2 (2%) [1 (1%)]
RR 1.97 (0.18,
21.28)187 NS
(0.576) Fair
Death Provenzano 2005 UI16114787 US
16 wks (16 wks)
EPO α 20,000 units Q2W 131/131
EPO α 40,000 units
Q4W 126/126
nd 26% /179 (25%/227)
9,681 U (9,748 U)
11.9 (11.9)
11.9 (11.4)
1 (1%) [2 (2%)]
RR 0.96 (0.06,
15.21)188 NS Fair
CV mortality
Sudden cardiac death
Pergola 2010 UI20185602 US
37 wks (37 wks)
EPO Q2W 107/107
EPO Q4W 215/215
29 mL/min (28 mL/min)
518.60 pmol/L (558.97 pmol/L)
4529 IU/wk (5423 IU/w
k) 11.12
(11.17) 11.0
(11.0) 0 (0%) [0 (0%)] -- --- Good
184 Calculated by ERT 185 Calculated by ERT 186 Calculated by ERT 187 Calculated by ERT 188 Calculated by ERT

47
Outcome Author, Year,
Country
Outcome Assessme
nt Time (Treatment Duration)
Treatments (Number Analyzed / Enrolled)
Baseline GFR
Arm 1 (Arm 2) [CKD Stage]
Baseline TSAT/Ferritin
Arm 1 (Arm 2)
Mean ESA dose Arm 1
(Arm 2)
Hemoglobin (g/dL) Results P-
value Quality Arm 1 (Intervention)
Arm 2 (Comparato
r)
Baseline Arm 1
(Arm 2)
Achieved Arm 1
(Arm 2)
Events No (%) Arm 1
[Arm 2]
RR/OR/HR (95% CI)
ESRD
Dialysis Pergola, 2010 UI20185602 US
37 wks (37 wks)
EPO Q2W 107/107
EPO Q4W 215/215
29 mL/min (28 mL/min)
518.60 pmol/L (558.97 pmol/L)
4529 IU/wk (5423 IU/w
k) 11.12
(11.17) 11.0
(11.0) 2 (2%) [4 (2%)]
RR 1.00189 (0.19; 5.40) NS Fair
CV events
Cardiac arrest
Pergola 2010 UI20185602 US
37 wks (37 wks)
EPO Q2W 107/107
EPO Q4W 215/215
29 mL/min (28 mL/min)
518.60 pmol/L (558.97 pmol/L)
4529 IU/wk (5423 IU/w
k) 11.12
(11.17) 11.0
(11.0) 0 (0%) [1 (1%)] -- --- Good
Thrombosis Provenzano 2005 UI16114787 US
16 wks (16 wks)
EPO α 20,000 units Q2W 131/131
EPO α 40,000 units
Q4W 126/126
nd 26% /179 (25%/227)
9,681 U (9,748 U)
11.9 (11.9)
11.9 (11.4)
3 (2%) [3 (2%)]
RR 0.96 (0.20,
4.68)190 NS Fair
Transfusion
Transfusion Levin, 2007 UI17950856 Multi
52 wks (52 wks)
Methoxy polyethylene glycol-EPO β
Q2W 223/223
Methoxy polyethylene glycol- EPO β Q4W 224/224
CKD 5D 27%/453 μg/L (28%/522 μg/L)
Median 57µg/2 wk (175 µg/4
wks)
119.7 g/L (118.5 g/L)
118.0 g/L (116.1 g/L)
21 (10%) [16 (7%)]
RR 1.31191 (0.70; 2.44) NS Fair
Transfusion Pergola 2010 UI20185602 US
37 wks (37 wks)
EPO Q2W 107/107
EPO Q4W 215/215
29 mL/min (28 mL/min)
518.60 pmol/L (558.97 pmol/L)
4529 IU/wk (5423 IU/w
k) 11.12
(11.17) 11.0
(11.0) 6 (6%)
[14 (7%)] RR 0.86192 (0.34; 2.18) NS Fair
Transfusion Sulowicz 2007 UI17699476 Multi
36 wk (36 wk)
C.E.R.A. Q2W 190/190
C.E.R.A Q4W
191/191 CKD 5D: HD
& PD
30%/418 ng/mL
(28%/427 ng/mL)
56 μg/2wk (150
μg/4wk) 11.70
(11.66) 11.70
(11.46) 6%
[11%] -- --- Good
189 Calculated by ERT 190 Calculated by ERT 191 Calculated by ERT 192 Calculated by ERT

48
Outcome Author, Year,
Country
Outcome Assessme
nt Time (Treatment Duration)
Treatments (Number Analyzed / Enrolled)
Baseline GFR
Arm 1 (Arm 2) [CKD Stage]
Baseline TSAT/Ferritin
Arm 1 (Arm 2)
Mean ESA dose Arm 1
(Arm 2)
Hemoglobin (g/dL) Results P-
value Quality Arm 1 (Intervention)
Arm 2 (Comparato
r)
Baseline Arm 1
(Arm 2)
Achieved Arm 1
(Arm 2)
Events No (%) Arm 1
[Arm 2]
RR/OR/HR (95% CI)
Transfusions [safety]
Kessler 2010 UI19888948 Multi
53 wk (53 wk)
C.E.R.A. Q2W 73/73
C.E.R.A. Q4W 72/72
CKD Stage 3-4
≥20%/≥100 ng/mL
(≥20%/≥100 ng/mL)
Median IQR range
0.17 µg/kg/wk
(0.22 µg/kg/wk)
8-11 g/dL (8-11g/dL)
11.92 (11.70)
2 (3%) [0 (0%)] nd nd Fair
Hb
Hb maintained within 10 g/L
Levin 2007 UI17950856 Multi
52 wks (52 wks)
Methoxy polyethylene glycol-EPO β
Q2W 223/223
Methoxy polyethylene glycol- EPO β Q4W 224/224
CKD 5D 27%/453 μg/L (28%/522 μg/L)
Median 57µg/2 wk (175 µg/4
wks)
119.7 g/L (118.5 g/L)
118.0 g/L (116.1 g/L)
133 (68%) [127
(68%)]
RR 1.00193 (0.87; 1.15) NS Fair
Hb maintained within ±1.0 g/dL
Sulowicz 2007 UI17699476 Multi
36 wk (36 wk)
C.E.R.A. Q2W 190/190
C.E.R.A Q4W
191/191 CKD 5D: HD
& PD
30%/418 ng/mL
(28%/427 ng/mL)
56 μg/2wk (150
μg/4wk) 11.70
(11.66) 11.70
(11.46)
76% [66%] -- --- Good
Hb maintained within 10-13.5 g/dL
92% [88%] -- --- Good
Hb levels maintained within ±1 g/dL of the response value [ITT]
Kessler 2010 UI19888948 Multi
53 wk (53 wk)
C.E.R.A. Q2W 73/73
C.E.R.A. Q4W 72/72
CKD Stage 3-4
≥20%/≥100 ng/mL
(≥20%/≥100 ng/mL)
Median IQR range
0.17 µg/kg/wk
(0.22 µg/kg/wk)
8-11 g/dL (8-11g/dL)
11.92 (11.70)
55 (76%) [50
(70%)]
RR 1.08 (0.89,
1.33)194 NS
(0.428) Fair
Q2W vs. Q3W Mortality
Death Provenzano 2005 UI16114787 US
16 wks (16 wks)
Epoetin α 20,000 units
Q2W 131/131
Epoetin α 30,000 units
Q3W 132/132
nd 26% /179 (26%/205)
9,681 U (9,489 U)
11.9 (11.9)
11.9 (11.2)
2 (2%) [3 (2%)]
RR 1.01 (0.21,
4.90)195 NS Fair
193 Calculated by ERT 194 Calculated by ERT 195 Calculated by ERT
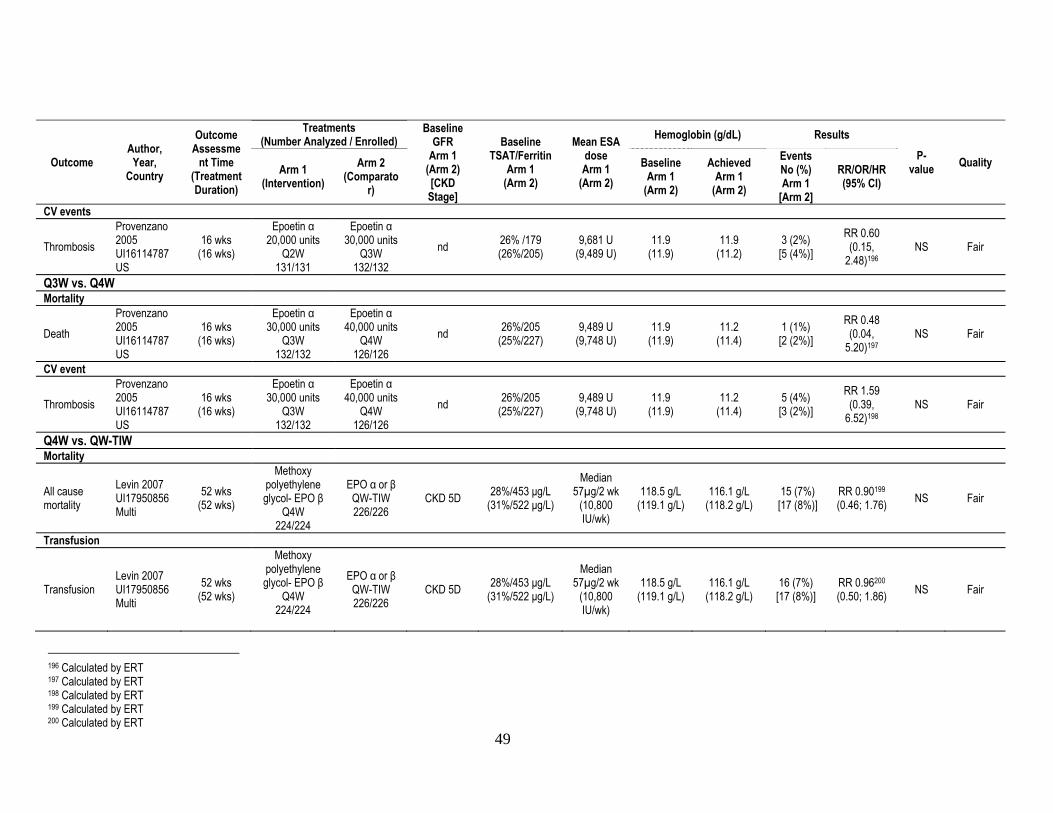
49
Outcome Author, Year,
Country
Outcome Assessme
nt Time (Treatment Duration)
Treatments (Number Analyzed / Enrolled)
Baseline GFR
Arm 1 (Arm 2) [CKD Stage]
Baseline TSAT/Ferritin
Arm 1 (Arm 2)
Mean ESA dose Arm 1
(Arm 2)
Hemoglobin (g/dL) Results P-
value Quality Arm 1 (Intervention)
Arm 2 (Comparato
r)
Baseline Arm 1
(Arm 2)
Achieved Arm 1
(Arm 2)
Events No (%) Arm 1
[Arm 2]
RR/OR/HR (95% CI)
CV events
Thrombosis Provenzano 2005 UI16114787 US
16 wks (16 wks)
Epoetin α 20,000 units
Q2W 131/131
Epoetin α 30,000 units
Q3W 132/132
nd 26% /179 (26%/205)
9,681 U (9,489 U)
11.9 (11.9)
11.9 (11.2)
3 (2%) [5 (4%)]
RR 0.60 (0.15,
2.48)196 NS Fair
Q3W vs. Q4W Mortality
Death Provenzano 2005 UI16114787 US
16 wks (16 wks)
Epoetin α 30,000 units
Q3W 132/132
Epoetin α 40,000 units
Q4W 126/126
nd 26%/205 (25%/227)
9,489 U (9,748 U)
11.9 (11.9)
11.2 (11.4)
1 (1%) [2 (2%)]
RR 0.48 (0.04,
5.20)197 NS Fair
CV event
Thrombosis Provenzano 2005 UI16114787 US
16 wks (16 wks)
Epoetin α 30,000 units
Q3W 132/132
Epoetin α 40,000 units
Q4W 126/126
nd 26%/205 (25%/227)
9,489 U (9,748 U)
11.9 (11.9)
11.2 (11.4)
5 (4%) [3 (2%)]
RR 1.59 (0.39,
6.52)198 NS Fair
Q4W vs. QW-TIW Mortality
All cause mortality
Levin 2007 UI17950856 Multi
52 wks (52 wks)
Methoxy polyethylene glycol- EPO β
Q4W 224/224
EPO α or β QW-TIW 226/226
CKD 5D 28%/453 μg/L (31%/522 μg/L)
Median 57µg/2 wk
(10,800 IU/wk)
118.5 g/L (119.1 g/L)
116.1 g/L (118.2 g/L)
15 (7%) [17 (8%)]
RR 0.90199 (0.46; 1.76) NS Fair
Transfusion
Transfusion Levin 2007 UI17950856 Multi
52 wks (52 wks)
Methoxy polyethylene glycol- EPO β
Q4W 224/224
EPO α or β QW-TIW 226/226
CKD 5D 28%/453 μg/L (31%/522 μg/L)
Median 57µg/2 wk
(10,800 IU/wk)
118.5 g/L (119.1 g/L)
116.1 g/L (118.2 g/L)
16 (7%) [17 (8%)]
RR 0.96200 (0.50; 1.86) NS Fair
196 Calculated by ERT 197 Calculated by ERT 198 Calculated by ERT 199 Calculated by ERT 200 Calculated by ERT

50
Outcome Author, Year,
Country
Outcome Assessme
nt Time (Treatment Duration)
Treatments (Number Analyzed / Enrolled)
Baseline GFR
Arm 1 (Arm 2) [CKD Stage]
Baseline TSAT/Ferritin
Arm 1 (Arm 2)
Mean ESA dose Arm 1
(Arm 2)
Hemoglobin (g/dL) Results P-
value Quality Arm 1 (Intervention)
Arm 2 (Comparato
r)
Baseline Arm 1
(Arm 2)
Achieved Arm 1
(Arm 2)
Events No (%) Arm 1
[Arm 2]
RR/OR/HR (95% CI)
Hb
Hb maintained within 10 g/L
Levin 2007 UI17950856 Multi
52 wks (52 wks)
Methoxy polyethylene glycol- EPO β
Q4W 224/224
EPO α or β QW-TIW 226/226
CKD 5D 28%/453 μg/L (31%/522 μg/L)
Median 57µg/2 wk
(10,800 IU/wk)
118.5 g/L (119.1 g/L)
116.1 g/L (118.2 g/L)
127 (68%) [138
(67%)]
RR 1.00201 (0.87; 1.15) NS Fair
Q2W vs. QW-TIW Mortality
All cause mortality
Levin 2007 UI17950856 Multi
52 wks (52 wks)
Methoxy polyethylene glycol- EPO β
Q2W 223/223
EPO α or β QW-TIW 226/226
CKD 5D 27%/453 μg/L (31%/522 μg/L)
Median 57µg/2 wk
(10,800 IU/wk)
119.7 g/L (119.1 g/L)
118.0 g/L (118.2 g/L)
19 (9%) [17 (8%)]
RR 1.14202 (0.61; 2.13) NS Fair
Total death Pergola 2009 UI19808215 US
44 wks (44 wks)
EPO α Q2W 125/125
EPO α TIW (22wk), then QW (22wk)
123/123
29 mL/min (31 mL/min)
553pmol/L (510 pmol/L)
6662 IU/wk (5039 IU/wk)
9.81 (9.63)
11.1 (11.4)
4 (3%) [4 (3%)]
RR 0.98203 (0.25; 3.85) NS Good
CV mortality
Cardiac death
Pergola 2009 UI19808215 US
44 wks (44 wks)
EPO α Q2W 125/125
EPO α TIW (22wk), then QW (22wk)
123/123
29 mL/min (31 mL/min)
553pmol/L (510 pmol/L)
6662 IU/wk (5039 IU/wk)
9.81 (9.63)
11.1 (11.4)
0 (0%) [0 (0%)] -- --- Good
Transfusion
Transfusion Levin 2007 UI17950856 Multi
52 wks (52 wks)
Methoxy polyethylene glycol- EPO β
Q2W 223/223
EPO α or β QW-TIW 226/226
CKD 5D 27%/453 μg/L (31%/522 μg/L)
Median 57µg/2 wk
(10,800 IU/wk)
119.7 g/L (119.1 g/L)
118.0 g/L (118.2 g/L)
21 (10%) [17 (8%)]
RR 1.26204 (0.69; 2.33) NS Fair
201 Calculated by ERT 202 Calculated by ERT 203 Calculated by ERT 204 Calculated by ERT

51
Outcome Author, Year,
Country
Outcome Assessme
nt Time (Treatment Duration)
Treatments (Number Analyzed / Enrolled)
Baseline GFR
Arm 1 (Arm 2) [CKD Stage]
Baseline TSAT/Ferritin
Arm 1 (Arm 2)
Mean ESA dose Arm 1
(Arm 2)
Hemoglobin (g/dL) Results P-
value Quality Arm 1 (Intervention)
Arm 2 (Comparato
r)
Baseline Arm 1
(Arm 2)
Achieved Arm 1
(Arm 2)
Events No (%) Arm 1
[Arm 2]
RR/OR/HR (95% CI)
Transfusion Pergola 2009 UI19808215 US
44 wks (44 wks)
EPO α Q2W 125/125
EPO α TIW (22wk), then QW (22wk)
123/123
29 mL/min (31 mL/min)
553pmol/L (510 pmol/L)
6662 IU/wk (5039 IU/wk)
9.81 (9.63)
11.1 (11.4)
14 (11%) [37205 (3%)]
RR 0.37206 (0.21; 0.65)
0.002207 Fair
Hb
Hb maintained within 10 g/L
Levin 2007 UI17950856 Multi
52 wks (52 wks)
Methoxy polyethylene glycol- EPO β
Q2W 223/223
EPO α or β QW-TIW 226/226
CKD 5D 27%/453 μg/L (31%/522 μg/L)
Median 57µg/2 wk
(10,800 IU/wk)
119.7 g/L (119.1 g/L)
118.0 g/L (118.2 g/L)
133 (68%) [138
(67%)]
RR 1.01208 (0.88; 1.15) NS Fair
QW vs. QW or TIW Mortality
Death Locatelli 2008 UI18587731 Multi
28 wks (28 wks)
EPO α QW 213/217
IV Darbepoetin α QW or
EPO α TIW 68/70
CKD 5D: HD 31%/402
ng/mL (32%/402
ng/mL)
6.791 IU/wk (6.210 IU/wk)
11.57 (11.57)
10.92 (11.64)
1 (5%) [0 (0%)] -- --- Good
Total death Pergola 2009 UI19808215 US
44 wks (44 wks)
EPO α QW 125/125
EPO α TIW (22wk), then QW (22wk)
123/123
30 mL/min (31 mL/min)
573.81 pmol/L (510.23 pmol/L)
5035 IU/wk (5039 IU/wk)
9.71 (9.63)
11.3 (11.4)
6 (5%) [4 (3%)]
RR 1.48209 (0.43; 5.10) NS210 Good
Death Locatelli 2002 UI12087569 EU
24 wks (24 wks)
SC EPO β QW 75/84
SC EPO β TIW
71/89 5D: HD
26%/422 ng/mL
(27%/461 ng/mL)
81 IU/kg (78 IU/kg)
Hct 33.1%
(33.3%)
Hct 33%
(33.2%)211 1 (1%) [5 (7%)]
RR 0.19212 (0.02; 1.58) NS Good
205 Calculated by ERT 206 Calculated by ERT 207 Calculated by ERT 208 Calculated by ERT 209 Calculated by ERT 210 Calculated by ERT 211 Estimated from graph 212 Calculated by ERT

52
Outcome Author, Year,
Country
Outcome Assessme
nt Time (Treatment Duration)
Treatments (Number Analyzed / Enrolled)
Baseline GFR
Arm 1 (Arm 2) [CKD Stage]
Baseline TSAT/Ferritin
Arm 1 (Arm 2)
Mean ESA dose Arm 1
(Arm 2)
Hemoglobin (g/dL) Results P-
value Quality Arm 1 (Intervention)
Arm 2 (Comparato
r)
Baseline Arm 1
(Arm 2)
Achieved Arm 1
(Arm 2)
Events No (%) Arm 1
[Arm 2]
RR/OR/HR (95% CI)
CV mortality
Cardiac death
Pergola 2009 UI19808215 US
44 wks (44 wks)
EPO α QW 125/125
EPO α TIW (22wk), then QW (22wk)
123/123
30 mL/min (31 mL/min)
573.81 pmol/L (510.23 pmol/L)
5035 IU/wk (5039 IU/wk)
9.71 (9.63)
11.3 (11.4)
1 (1%) [0 (0%)] -- --- Good
Transfusion
Transfusion Pergola 2009 UI19808215 US
44 wks (44 wks)
EPO α QW 125/125
EPO α TIW (22wk), then QW (22wk)
123/123
30 mL/min (31 mL/min)
573.81 pmol/L (510.23 pmol/L)
5035 IU/wk (5039 IU/wk)
9.71 (9.63)
11.3 (11.4)
88 (7%) [37
(3%)]213 RR 2.34214 (1.75; 3.14)
0.000215 Fair
Transfusion Locatelli 2002 UI12087569 EU
24 wks (24 wks)
SC EPO β QW 75/84
SC EPO β TIW
71/89 5D: HD
26%/422 ng/mL
(27%/461 ng/mL)
81 IU/kg (78 IU/kg)
Hct 33.1%
(33.3%)
Hct 33%
(33.2%)216 6 (8%)
[8 (11%)] RR 0.71
(0.26; 1.94) NS Fair
Q4W vs. QW Mortality
Total death Pergola 2010 UI20185602 US
37 wks (37 wks)
EPO Q4W 215/215
EPO QW 108/108
28 mL/min (28 mL/min)
558.97 pmol/L (513.97 pmol/L)
5423 IU/wk (2967 IU/wk)
11.17 (11.03)
11.0 (11.0)
9 (4%) [4 (4%)]
RR 1.13217 (0.36; 3.59) NS Good
Death Provenzano 2005 UI16114787 US
16 wks (16 wks)
EPO α 40,000 units Q4W 126/126
EPO α 10,000 units
QW 130/130
nd 25%/227 (25%/198)
9,748 U (9,265 U)
11.9 (11.9)
11.4 (12.2)
1 (1%) [1 (1%)]
RR 1.04 (0.07,
16.44)218 NS Fair
CV mortality
Sudden cardiac death
Pergola 2010 UI20185602 US
37 wks (37 wks)
EPO Q4W 215/215
EPO QW 108/108
28 mL/min (28 mL/min)
558.97 pmol/L (513.97 pmol/L)
5423 IU/wk (2967 IU/wk)
11.17 (11.03)
11.0 (11.0)
0 (0%) [2 (2%)] -- --- Good
213 Calculated by ERT 214 Calculated by ERT 215 Calculated by ERT 216 Estimated from graph 217 Calculated by ERT 218 Calculated by ERT

53
Outcome Author, Year,
Country
Outcome Assessme
nt Time (Treatment Duration)
Treatments (Number Analyzed / Enrolled)
Baseline GFR
Arm 1 (Arm 2) [CKD Stage]
Baseline TSAT/Ferritin
Arm 1 (Arm 2)
Mean ESA dose Arm 1
(Arm 2)
Hemoglobin (g/dL) Results P-
value Quality Arm 1 (Intervention)
Arm 2 (Comparato
r)
Baseline Arm 1
(Arm 2)
Achieved Arm 1
(Arm 2)
Events No (%) Arm 1
[Arm 2]
RR/OR/HR (95% CI)
ESRD
Dialysis Pergola 2010 UI20185602 US
37 wks (37 wks)
EPO Q4W 215/215
EPO QW 108/108
28 mL/min (28 mL/min)
558.97 pmol/L (513.97 pmol/L)
5423 IU/wk (2967 IU/wk)
11.17 (11.03)
11.0 (11.0)
4 (2%) [2 (2%)]
RR 1.00219 (0.19; 5.40) NS Fair
CV events
Cardiac arrest
Pergola 2010 UI20185602 US
37 wks (37 wks)
EPO Q4W 215/215
EPO QW 108/108
28 mL/min (28 mL/min)
558.97 pmol/L (513.97 pmol/L)
5423 IU/wk (2967 IU/wk)
11.17 (11.03)
11.0 (11.0)
0 (0%) [0 (0%)] -- --- Good
Thrombosis Provenzano, 2005 UI16114787 US
16 wks (16 wks)
EPO α 40,000 units Q4W 126/126
EPO α 10,000 units
QW 130/130
nd 25%/227 (25%/198)
9,748 U (9,265 U)
11.9 (11.9)
11.4 (12.2)
3 (2%) [2 (2%)]
RR 1.55 (0.26,
9.11)220 NS Fair
Transfusion
Transfusion Pergola 2010 UI20185602 US
37 wks (37 wks)
EPO Q4W 215/215
EPO QW 108/108
28 mL/min (28 mL/min)
558.97 pmol/L (513.97 pmol/L)
5423 IU/wk (2967 IU/wk)
11.17 (11.03)
11.0 (11.0)
14 (7%) [4 (4%)]
RR 1.76221 (0.59; 5.21) NS Fair
Q3W vs. QW Mortality
Death Provenzano 2005 UI16114787 US
16 wks (16 wks)
EPO α 30,000 units Q3W 132/132
EPO α 10,000 units
QW 130/130
nd 26%/205 (25%/198)
9, 489 U (9, 265 U)
11.9 (11.9)
11.2 (12.2)
3 (2%) [1 (1%)]
RR 02.95 (0.31,
28.04)222 NS Fair
CV event
Thrombosis Provenzano 2005 UI16114787 US
16 wks (16 wks)
EPO α 30,000 units Q3W 132/132
EPO α 10,000 units
QW 130/130
nd 26%/205 (25%/198)
9, 489 U (9, 265 U)
11.9 (11.9)
11.2 (12.2)
5 (4%) [2 (2%)]
RR 2.48 (0.49,
12.56)223 NS Fair
219 Calculated by ERT 220 Calculated by ERT 221 Calculated by ERT 222 Calculated by ERT 223 Calculated by ERT

54
Outcome Author, Year,
Country
Outcome Assessme
nt Time (Treatment Duration)
Treatments (Number Analyzed / Enrolled)
Baseline GFR
Arm 1 (Arm 2) [CKD Stage]
Baseline TSAT/Ferritin
Arm 1 (Arm 2)
Mean ESA dose Arm 1
(Arm 2)
Hemoglobin (g/dL) Results P-
value Quality Arm 1 (Intervention)
Arm 2 (Comparato
r)
Baseline Arm 1
(Arm 2)
Achieved Arm 1
(Arm 2)
Events No (%) Arm 1
[Arm 2]
RR/OR/HR (95% CI)
Q2W vs. QW Mortality
Total death Pergola 2009 UI19808215 US
44 wks (44 wks)
EPO α Q2W 125/125
EPO α QW 125/125
29 mL/min (30 mL/min)
552.74 pmol/L (573.81 pmol/L)
6662 IU/wk (5035 IU/wk)
9.81 (9.71)
11.1 (11.3)
4 (3%) [6 (5%)]
RR 0.67224 (0.19; 2.31) NS225 Good
Total death Pergola 2010 UI20185602 US
37 wks (37 wks)
EPO Q2W 107/107
EPO QW 108/108
29 mL/min (28 mL/min)
518.60 pmol./L (513.97 pmol/L)
4529 IU/wk (2967 IU/wk)
11.12 (11.03)
11.0 (11.0)
3 (3%) [4 (4%)]
RR 0.76226 (0.17; 3.30) NS Good
Death Provenzano 2005 UI16114787 US
16 wks (16 wks)
EPO α 20,000 units Q2W 131/131
EPO α 10,000 units
QW 130/130
nd 26%/179 (25% /198)
9,681 U (9,265 U)
11.9 (11.9)
11.9 (12.2)
2 (2%) [1 (1%)]
RR 1.98 (0.18,
21.62)227 NS Fair
CV mortality
Cardiac death
Pergola 2009 UI19808215 US
44 wks (44 wks)
EPO α Q2W 125/125
EPO α QW 125/125
29 mL/min (30 mL/min)
552.74 pmol/L (573.81 pmol/L)
6662 IU/wk (5035 IU/wk)
9.81 (9.71)
11.1 (11.3)
0 (0%) [1 (1%)] -- --- Good
Sudden cardiac death
Pergola, 2010 UI20185602 US
37 wks (37 wks)
EPO Q2W 107/107
EPO QW 108/108
29 mL/min (28 mL/min)
518.60 pmol./L (513.97 pmol/L)
4529 IU/wk (2967 IU/wk)
11.12 (11.03)
11.0 (11.0)
0 (0%) [2 (2%)] -- --- Good
ESRD
Dialysis
Pergola 2010 UI20185602 US
37 wks (37 wks)
EPO Q2W 107/107
EPO QW 108/108
29 mL/min (28 mL/min)
518.60 pmol./L (513.97 pmol/L)
4529 IU/wk (2967 IU/wk)
11.12 (11.03)
11.0 (11.0)
2 (2%) [2 (2%)]
RR 1.01228 (0.14; 7.04) NS Fair
224 Calculated by ERT 225 Calculated by ERT 226 Calculated by ERT 227 Calculated by ERT 228 Calculated by ERT

55
Outcome Author, Year,
Country
Outcome Assessme
nt Time (Treatment Duration)
Treatments (Number Analyzed / Enrolled)
Baseline GFR
Arm 1 (Arm 2) [CKD Stage]
Baseline TSAT/Ferritin
Arm 1 (Arm 2)
Mean ESA dose Arm 1
(Arm 2)
Hemoglobin (g/dL) Results P-
value Quality Arm 1 (Intervention)
Arm 2 (Comparato
r)
Baseline Arm 1
(Arm 2)
Achieved Arm 1
(Arm 2)
Events No (%) Arm 1
[Arm 2]
RR/OR/HR (95% CI)
CV events
Cardiac arrest
Pergola 2010 UI20185602 US
37 wks (37 wks)
EPO Q2W 107/107
EPO QW 108/108
29 mL/min (28 mL/min)
518.60 pmol./L (513.97 pmol/L)
4529 IU/wk (2967 IU/wk)
11.12 (11.03)
11.0 (11.0)
0 (0%) [0 (0%)] -- --- Good
Thrombosis Provenzano 2005 UI16114787 US
16 wks (16 wks)
EPO α 20,000 units Q2W 131/131
EPO α 10,000 units
QW 130/130
nd 26%/179 (25% /198)
9,681 U (9,265 U)
11.9 (11.9)
11.9 (12.2)
3 (2%) [2 (2%)]
RR 1.49 (0.25,
8.76)229 NS Fair
Transfusion
Transfusion Pergola 2009 UI19808215 US
44 wks (44 wks)
EPO α Q2W 125/125
EPO α QW 125/125
29 mL/min (30 mL/min)
552.74 pmol/L (573.81 pmol/L)
6662 IU/wk (5035 IU/wk)
9.81 (9.71)
11.1 (11.3)
14 (11%) [8
(7%)]230 RR 1.75231 (0.76; 4.02) NS232 Fair
Transfusion Pergola 2010 UI20185602 US
37 wks (37 wks)
EPO Q2W 107/107
EPO QW 108/108
29 mL/min (28 mL/min)
518.60 pmol./L (513.97 pmol/L)
4529 IU/wk (2967 IU/wk)
11.12 (11.03)
11.0 (11.0)
6 (6%) [4 (4%)]
RR 1.51233 (0.44; 5.21) NS Fair
Hb Target Hb >10 g/dL maintained without ↑EPO >60%
Mircescu 2006 UI16931218 Romania
12 wk (24 wk)
EPO β Q2W 102/104
EPO β QW 101/103 CKD 5D: HD
36%/333 ng/mL
(36%/339 ng/mL)
67.8 IU/kg (71.8 IU/kg)
11.4 (11.4)
11.41 (11.38)
73% [62%] -- --- Good
Target Hb >10 g/dL maintained without ↑EPO >60%
75% [69%] -- --- Good
229 Calculated by ERT 230 Calculated by ERT 231 Calculated by ERT 232 Calculated by ERT 233 Calculated by ERT
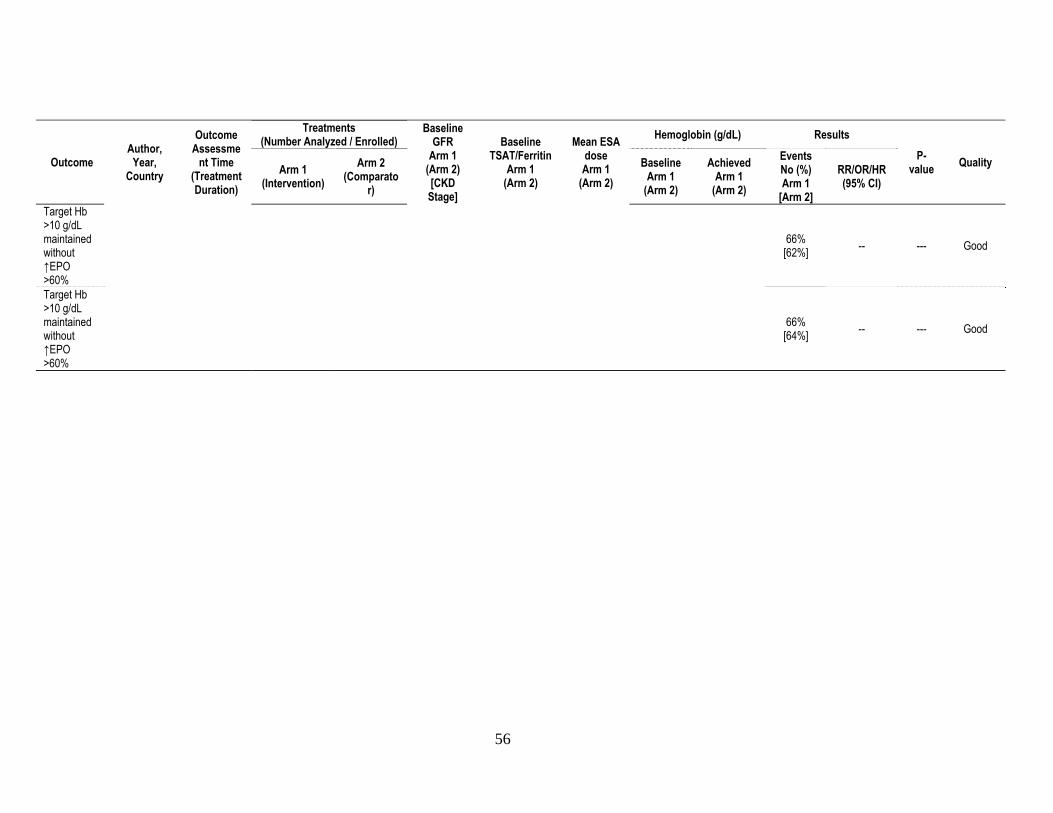
56
Outcome Author, Year,
Country
Outcome Assessme
nt Time (Treatment Duration)
Treatments (Number Analyzed / Enrolled)
Baseline GFR
Arm 1 (Arm 2) [CKD Stage]
Baseline TSAT/Ferritin
Arm 1 (Arm 2)
Mean ESA dose Arm 1
(Arm 2)
Hemoglobin (g/dL) Results P-
value Quality Arm 1 (Intervention)
Arm 2 (Comparato
r)
Baseline Arm 1
(Arm 2)
Achieved Arm 1
(Arm 2)
Events No (%) Arm 1
[Arm 2]
RR/OR/HR (95% CI)
Target Hb >10 g/dL maintained without ↑EPO >60%
66% [62%] -- --- Good
Target Hb >10 g/dL maintained without ↑EPO >60%
66% [64%] -- --- Good

57
Supplemental Table 27. Summary table of RCTs examining different dosing schedules in CKD patients with anemia (continuous outcomes)
Outcome Author, Year, Country,
Outcome Assessment
Time (Treatment Duration)
Treatments (Number Analyzed / Enrolled)
Baseline GFR
Arm 1 (Arm 2)
[CKD Stage]
Baseline TSAT/Ferritin
Arm 1 (Arm 2)
Mean ESA dose Arm 1
(Arm 2)
Hemoglobin (g/dL) Results P-value Quality Arm 1
(Intervention) Arm 2
(Comparator) Baseline
Arm 1 (Arm 2)
Achieved Arm 1
(Arm 2)
Baseline Arm 1
(Arm 2)
∆ (95% CI) Arm 1
(Arm 2) Q2W vs. Q4W QoL Mean ∆LASA energy score
Provenzano 2005 UI16114787 US
16 wks (16 wks)
Epoetin α 20,000 units
Q2W 94/131
Epoetin α 40,000 units
Q4W 93/126
nd 26% /179 (25%/227)
9,681 U (9,748 U)
11.9 (11.9)
11.9 (11.4)
52.9 (49.1)
2.7 (6.1) nd Fair
Mean ∆LASA activity score
53.3 (52.2)
3.5 (5.0) nd Fair
Mean ∆LASA overall QOL score
62.9 (59.5)
0.7 (1.6) nd Fair
Mean ∆total KDQ score
22.7 (22.8)
0.1 (-0.2) nd Fair
Hb
∆Hb, g/L [PP]
Levin 2007 UI17950856 Multi
52 wks (52 wks)
Methoxy polyethylene glycol-EPO β
Q2W 223/223
Methoxy polyethylene glycol- EPO β
Q4W 224/224
CKD 5D 27%/453 μg/L
(28%/522 μg/L)
Median 57µg/2 wk
(175 µg/4 wk)
119.7 g/L (118.5 g/L)
118.0 g/L (116.1 g/L)
119.7 (118.5)
-0.71 (-2.20; 0.77)
[-0.25 (-1.79;
1.29)]234
--- Fair
ΔHb g/dL Pergola 2010 UI20185602 US
37 wks (37 wks)
EPO Q2W 107/107
EPO Q4W 215/215
29 mL/min (28 mL/min)
519 pmol/L (559 pmol/L)
4529 IU/wk (5423 IU/wk)
11.12 (11.17)
11.0 (11.0)
11.12 (11.17)
-0.10 (-0.19) --- Good
Difference of least squares means
11.12 (11.17)
-0.03 (-0.09) --- Good
∆Hb, g/dL [PP]
Sulowicz 2007 UI17699476 Multi
36 wk (36 wk)
C.E.R.A. Q2W 190/190
C.E.R.A Q4W 191/191
CKD 5D: HD & PD
30%/418 ng/mL
(28%/427 ng/mL)
56 μg/2wk (150 μg/4wk)
11.70 (11.66)
11.70 (11.46)
11.70 (11.66)
0.032 (-0.131) --- Good
234 After adjusting for covariates

58
Outcome Author, Year, Country,
Outcome Assessment
Time (Treatment Duration)
Treatments (Number Analyzed / Enrolled)
Baseline GFR
Arm 1 (Arm 2)
[CKD Stage]
Baseline TSAT/Ferritin
Arm 1 (Arm 2)
Mean ESA dose Arm 1
(Arm 2)
Hemoglobin (g/dL) Results P-value Quality Arm 1
(Intervention) Arm 2
(Comparator) Baseline
Arm 1 (Arm 2)
Achieved Arm 1
(Arm 2)
Baseline Arm 1
(Arm 2)
∆ (95% CI) Arm 1
(Arm 2)
Hb, g/dL [ITT]
Kessler 2010 UI19888948 Multi
53 wk (53 wk)
C.E.R.A. Q2W 73/73
C.E.R.A. Q4W 72/72
CKD Stage 3-4
≥20%/≥100 ng/mL
(≥20%/≥100 ng/mL)
Median IQR range
0.17 µg/kg/wk (0.22
µg/kg/wk)
8-11 g/dL (8-
11g/dL) 11.92
(11.70)
8-11 g/dL (8-
11g/dL)
+0.92 to +3.92
(+0.7 to 3.7)235
nd Fair
Mean ΔHb g/dL
Provenzano 2005 UI16114787 US
16 wks (16 wks)
Epoetin α 20,000 units
Q2W 114/131
Epoetin α 40,000 units
Q4W 104/126
nd 26% /179 (25%/227)
9,681 U (9,748 U)
11.9 (11.9)
11.9 (11.4)
11.9 (11.9)
0.0 (-0.5) nd Fair
ESA dose
Median doses
Sulowicz 2007 UI17699476 Multi
36 wk (36 wk)
C.E.R.A. Q2W 190/190
C.E.R.A Q4W 191/191
CKD 5D: HD & PD
30%/418 ng/mL
(28%/427 ng/mL)
56 μg/2wk (150 μg/4wk)
11.70 (11.66)
11.70 (11.46)
60 μg/2wk
(120 μg/4wk)
-4 μg/2wk (+30
μg/4wk) --- Good
Q2W vs., Q3W QoL Mean ∆LASA energy score
Provenzano 2005 UI16114787 US
16 wks (16 wks)
Epoetin α 20,000 units
Q2W 94/131
Epoetin α 30,000 units
Q3W 101/132
nd 26% /179 (26%/205)
9,681 U (9,489 U)
11.9 (11.9)
11.9 (11.2)
52.9 (51.3)
2.7 (5.9) nd Fair
Mean ∆LASA activity score
53.3 (53.4)
3.5 (6.0) nd Fair
Mean ∆LASA overall QOL score
62.9 (63.5)
0.7 (1.3) nd Fair
Mean ∆total KDQ score
22.7 (23.0)
0.1 (-0.4) nd Fair
Hb
Mean ΔHb g/dL
Provenzano 2005 UI16114787 US
16 wks (16 wks)
Epoetin α 20,000 units
Q2W 114/131
Epoetin α 30,000 units
Q3W 114/132
nd 26% /179 (26%/205)
9,681 U (9,489 U)
11.9 (11.9)
11.9 (11.2)
11.9 (11.9)
0.0 (-0.7) nd Fair
Q3W vs., Q4W QoL
235 The Hb was given in a range at baseline (taken from the inclusion criteria). Therefore the achieved Hb is also given in a range of what the difference could be.

59
Outcome Author, Year, Country,
Outcome Assessment
Time (Treatment Duration)
Treatments (Number Analyzed / Enrolled)
Baseline GFR
Arm 1 (Arm 2)
[CKD Stage]
Baseline TSAT/Ferritin
Arm 1 (Arm 2)
Mean ESA dose Arm 1
(Arm 2)
Hemoglobin (g/dL) Results P-value Quality Arm 1
(Intervention) Arm 2
(Comparator) Baseline
Arm 1 (Arm 2)
Achieved Arm 1
(Arm 2)
Baseline Arm 1
(Arm 2)
∆ (95% CI) Arm 1
(Arm 2) Mean ∆LASA energy score
Provenzano 2005 UI16114787 US
16 wks (16 wks)
Epoetin α 30,000 units
Q3W 101/132
Epoetin α 40,000 units
Q4W 93/126
nd 26%/205 (25%/227)
9,489 U (9,748 U)
11.9 (11.9)
11.2 (11.4)
51.3 (49.1)
5.9 (6.1) nd Fair
Mean ∆LASA activity score
53.4 (52.2)
6.0 (5.0) nd Fair
Mean ∆LASA overall QOL score
63.5 (59.5)
1.3 (1.6) nd Fair
Mean ∆total KDQ score
23.0 (22.8)
-0.4 (-0.2) nd Fair
Hb
Mean ΔHb g/dL
Provenzano 2005 UI16114787 US
16 wks (16 wks)
Epoetin α 30,000 units
Q3W 114/132
Epoetin α 40,000 units
Q4W 104/126
nd 26%/205 (25%/227)
9,489 U (9,748 U)
11.9 (11.9)
11.2 (11.4)
11.9 (11.9)
-0.7 (-0.5) nd Fair
Q4W vs. QW-TIW Hb
∆Hb, g/L [PP] Levin 2007
UI17950856 Multi
52 wks (52 wks)
Methoxy polyethylene glycol- EPO β
Q4W 224/224
EPO α or β 1-3X/wk
226/226 CKD 5D
28%/453 μg/L (31%/522 μg/L)
Median 57µg/2 wk
(10,800 IU/wk)
118.5 g/L (119.1 g/L)
116.1 g/L (118.2 g/L)
118.5 (119.1)
-0.25 (-1.79; 1.29)
[-0.75 (-2.26;
0.75)]236
--- Fair
Difference ∆Hb [ITT]
0.025 (-2.20; 2.70)
Non-inf237 Fair
Q2W vs. QW-TIW Hb
∆Hb, g/L [PP]
Levin 2007 UI17950856 Multi
52 wks (52 wks)
Methoxy polyethylene glycol- EPO β
Q2W 223/223
EPO α or β 1-3X/wk
226/226 CKD 5D
27%/453 μg/L (31%/522 μg/L)
Median 57µg/2 wk
(10,800 IU/wk)
119.7 g/L (119.1 g/L)
118.0 g/L (118.2 g/L)
119.7 (119.1)
-0.71 (-2.20; 0.77)
[-0.75 (-2.26;
0.75)]238
--- Fair
236 After adjusting for covariates 237 The lower limit of 97.5% CI was > pre-defined -7.5g/L non-inferiority threshold indicating that methoxy polyethylene glycol-epoetin is non-inferior to epoetin (p<0.0001) 238 After adjusting for covariates

60
Outcome Author, Year, Country,
Outcome Assessment
Time (Treatment Duration)
Treatments (Number Analyzed / Enrolled)
Baseline GFR
Arm 1 (Arm 2)
[CKD Stage]
Baseline TSAT/Ferritin
Arm 1 (Arm 2)
Mean ESA dose Arm 1
(Arm 2)
Hemoglobin (g/dL) Results P-value Quality Arm 1
(Intervention) Arm 2
(Comparator) Baseline
Arm 1 (Arm 2)
Achieved Arm 1
(Arm 2)
Baseline Arm 1
(Arm 2)
∆ (95% CI) Arm 1
(Arm 2) Difference ∆Hb [ITT]
119.7 (119.1)
-0.31 (-2.13; 2.76)
Non-inf239 Fair
ΔHb g/dL Pergola 2009 UI19808215 US
44 wks (44 wks)
EPO α Q2W 125/125
EPO α TIW (22wk), then QW (22wk)
123/123
29 mL/min (31 mL/min)
553pmol/L (510 pmol/L)
6662 IU/wk (5039 IU/wk)
9.81 (9.63)
11.1 (11.4)
9.81 (9.63)
1.27 (1.81)
Non-inf240 Good
QW vs. QW or TIW Hb
ΔHb, g/dL Locatelli 2008 UI18587731 Multi
28 wks (28 wks)
EPO α QW 213/217
IV Darbepoetin α QW or EPO α
TIW 68/70
CKD 5D: HD 31%/402
ng/mL (32%/402
ng/mL)
6.791 IU/wk (6.210 IU/wk)
11.57 (11.57)
10.92 (11.64)
11.57 (11.57)
-0.65 (+0.07) <0.001 Good
ΔHb g/dL Pergola 2009 UI19808215 US
44 wks (44 wks)
EPO α QW 125/125
EPO α TIW (22wk), then QW (22wk)
123/123
30 ml/min (31 ml/min)
573.81 pmol/L (510.23 pmol/L)
5035 IU/wk (5039 IU/wk)
9.71 (9.63)
11.3 (11.4)
9.71 (9.63)
1.59 (1.81)
Non-inf241 Good
ΔHct% [PP]
Locatelli 2002 UI12087569 EU
24 wks (24 wks)
SC EPO β QW
75/84
SC EPO β TIW
71/89 5D: HD
26%/422 ng/mL
(27%/461 ng/mL)
81 IU/kg (78 IU/kg)
Hct 33.1%
(33.3%)
Hct 33%
(33.2%)242 33.1%
(33.3%) -0.1
(-0.1) nd243 Fair
ESA dose ESA dose, IU/week
Locatelli 2008 UI18587731 Multi
28 wks (28 wks)
EPO α QW 213/217
IV Darbepoetin α QW or EPO α
TIW 68/70
CKD 5D: HD 31%/402
ng/mL (32%/402
ng/mL)
6.791 IU/wk (6.210 IU/wk)
11.57 (11.57)
10.92 (11.64)
6,791 (6,210)
1,636 (-133) <0.001 Good
Normalized ESA dose, IU/kg/g
6,791 (6,210)
+24.9 (-2.9) <0.001 Good
Normalized ESA dose, IU/kg/g Hb/wk
6,791 (6,210)
+3.1 (-0.2) <0.001 Good
239 The lower limit of 97.5% CI was > pre-defined -7.5g/L non-inferiority threshold indicating that methoxy polyethylene glycol-epoetin is non-inferior to epoetin (p<0.0001) 240 The lower limit of the 95% CI for the estimated treatment difference for both comparisons QW versus TIW (-0.380; 0.0037) and Q2W vs. TIW (-0.641; -0.221) was above the prespecified noninferiority margin of -1 g/dL. 241 The lower limit of the 95% CI for the estimated treatment difference for both comparisons QW vs. TIW (-0.380; 0.0037) and Q2W vs. TIW (-0.641; -0.221) was above the prespecified noninferiority margin of -1 g/dL. 242 Estimated from graph 243 The difference in mean time-adjusted AUC for hematocrit between the two treatment groups was -0.54 volume%. The mean value and 90% CI (-1.27; 0.19) were within the pre-specified range.

61
Outcome Author, Year, Country,
Outcome Assessment
Time (Treatment Duration)
Treatments (Number Analyzed / Enrolled)
Baseline GFR
Arm 1 (Arm 2)
[CKD Stage]
Baseline TSAT/Ferritin
Arm 1 (Arm 2)
Mean ESA dose Arm 1
(Arm 2)
Hemoglobin (g/dL) Results P-value Quality Arm 1
(Intervention) Arm 2
(Comparator) Baseline
Arm 1 (Arm 2)
Achieved Arm 1
(Arm 2)
Baseline Arm 1
(Arm 2)
∆ (95% CI) Arm 1
(Arm 2) Median ΔEPO dose IU/kg/wk [PP]
Locatelli 2002 UI12087569 EU
24 wks (24 wks)
SC EPO β QW
75/84
SC EPO β TIW
71/89 5D: HD
26%/422 ng/mL
(27%/461 ng/mL)
81 IU/kg (78 IU/kg)
Hct 33.1%
(33.3%)
Hct 33%
(33.2%)244 81
(78) 1.0
(0.0) nd245 Fair
Q3W vs. QW QoL Mean ∆LASA energy score
Provenzano 2005 UI16114787 US
16 wks (16 wks)
EPO α 30,000 units Q3W 132/132
EPO α 10,000 units QW 130/130
nd 26%/205 (25%/198)
9, 489 U (9, 265 U)
11.9 (11.9)
11.2 (12.2)
51.3 (48.3)
5.9 (6.8) nd Fair
Mean ∆LASA activity score
53.4 (49.1)
6.0 (4.6) nd Fair
Mean ∆LASA overall QOL score
63.5 (58.7)
1.3 (3.3) nd Fair
Mean ∆total KDQ score
23.0 (21.7)
-0.4 (1.1) nd Fair
Hb
Mean ΔHb g/dL
Provenzano 2005 UI16114787 US
16 wks (16 wks)
EPO α 30,000 units Q3W 132/132
EPO α 10,000 units QW 130/130
nd 26%/205 (25%/198)
9, 489 U (9, 265 U)
11.9 (11.9)
11.2 (12.2)
11.9 (11.9)
-0.7 (0.3) nd Fair
Q2W vs. QW QoL Mean ∆LASA energy score
Provenzano 2005 UI16114787 US
16 wks (16 wks)
EPO α 20,000 units Q2W 131/131
EPO α 10,000 units QW 130/130
nd 26%/179 (25% /198)
9,681 U (9,265 U)
11.9 (11.9)
11.9 (12.2)
52.9 (48.3)
2.7 (6.8) nd Fair
Mean ∆LASA activity score
53.3 (49.1)
3.5 (4.6) nd Fair
244 Estimated from graph 245 The ratio of mean weekly epoetin beta doses was 1.11. This value and the 90% CI of the ratio (0.99; 1.23) were within the pre-specified range.

62
Outcome Author, Year, Country,
Outcome Assessment
Time (Treatment Duration)
Treatments (Number Analyzed / Enrolled)
Baseline GFR
Arm 1 (Arm 2)
[CKD Stage]
Baseline TSAT/Ferritin
Arm 1 (Arm 2)
Mean ESA dose Arm 1
(Arm 2)
Hemoglobin (g/dL) Results P-value Quality Arm 1
(Intervention) Arm 2
(Comparator) Baseline
Arm 1 (Arm 2)
Achieved Arm 1
(Arm 2)
Baseline Arm 1
(Arm 2)
∆ (95% CI) Arm 1
(Arm 2) Mean ∆LASA overall QOL score
32.9 (58.7)
0.7 (3.3) nd Fair
Mean ∆total KDQ score
22.7 (21.7)
0.1 (1.1) nd Fair
Hb Mean Hb levels, g/dL Mircescu
2006 UI16931218 Romania
12 wk (24 wk)
EPO β Q2W 102/104
EPO β QW 101/103 CKD 5D: HD
36%/333 ng/mL
(36%/339 ng/mL)
67.8 IU/kg (71.8 IU/kg)
11.4 (11.4)
11.41 (11.38)
11.38 (11.32)
+0.04 (+0.06)
Non-inf246 Good
Difference between groups in mean Hb, g/dL
11.4 (11.4)
0.028 (-0.21; 0.26) --- Good
ΔHb g/dL Pergola 2009 UI19808215 US
44 wks (44 wks)
EPO α Q2W 125/125
EPO α QW 125/125
29 mL/min (30 mL/min)
552.74 pmol/L (573.81 pmol/L)
6662 IU/wk (5035 IU/wk)
9.81 (9.71)
11.1 (11.3)
9.81 (9.71)
1.27 (1.59) --- Good
Difference of least squares means
Pergola 2009 UI19808215 US
44 wks (44 wks)
EPO α Q2W 125/125
EPO α QW 125/125
29 mL/min (30 mL/min)
552.74 pmol/L (573.81 pmol/L)
6662 IU/wk (5035 IU/wk)
9.81 (9.71)
11.1 (11.3)
9.81 (9.71)
-0.43 (-0.17) --- Good
ΔHb g/dL Pergola 2010 UI20185602 US
37 wks (37 wks)
EPO Q2W 107/107
EPO QW 108/108
29 mL/min (28 mL/min)
518.60 pmol./L (513.97 pmol/L)
4529 IU/wk (2967 IU/wk)
11.12 (11.03)
11.0 (11.0)
11.12 (11.03)
-0.10 (-0.02)
Non-inf247 Good
Difference in Hb at 16 wks, g/dL
Provenzano 2005 UI16114787 US
16 wks (16 wks)
EPO α 20,000 units Q2W 131/131
EPO α 10,000 units QW 130/130
nd 26%/179 (25% /198)
9,681 U (9,265 U)
11.9 (11.9)
11.9 (12.2)
11.9 (11.9)
+0.3 (-0.6, 0.1) 0.001248 Fair
Mean ΔHb g/dL
0.0 (0.3) nd Fair
ESA dose
246 The 2 treatment schedules were considered to have similar efficacy if mean Hb level in group 2w did not differ by more than +/-0.5 g/dL compared with group 1w during the assessment period 247 The lower limit of the 95% CI for the estimated treatment difference for both comparisons, Q2W (-0.208; 0.153) vs. QW, and Q4W (-0.249; 0.063) vs. QW, was above the prespecified noninferiority margin of -1 g/dL. These analyses were adjusted for the baseline Hb level. 248 One-sided p-value testing non-inferiority from QW

63
Outcome Author, Year, Country,
Outcome Assessment
Time (Treatment Duration)
Treatments (Number Analyzed / Enrolled)
Baseline GFR
Arm 1 (Arm 2)
[CKD Stage]
Baseline TSAT/Ferritin
Arm 1 (Arm 2)
Mean ESA dose Arm 1
(Arm 2)
Hemoglobin (g/dL) Results P-value Quality Arm 1
(Intervention) Arm 2
(Comparator) Baseline
Arm 1 (Arm 2)
Achieved Arm 1
(Arm 2)
Baseline Arm 1
(Arm 2)
∆ (95% CI) Arm 1
(Arm 2) Mean cumulative EPO doses/wk Mircescu
2006 UI16931218 Romania
12 wk (24 wk)
EPO β Q2W 102/104
EPO β QW 101/103 CKD 5D: HD
36%/333 ng/mL
(36%/339 ng/mL)
67.8 IU/kg (71.8 IU/kg)
11.4 (11.4)
11.41 (11.38)
70.8 (72.5)
+0.957 (+0.991) --- Good
Ratio of Q2W to QW mean cumulative EPO doses
70.8 (72.5)
0.94 (0.81; 1.08)
Non-inf249 Good
Q4W vs. QW QoL Mean ∆LASA energy score
Provenzano 2005 UI16114787 US
16 wks (16 wks)
EPO α 40,000 units Q4W 126/126
EPO α 10,000 units QW 130/130
nd 25%/227 (25%/198)
9,748 U (9,265 U)
11.9 (11.9)
11.4 (12.2)
49.1 (48.3)
6.1 (6.8) nd Fair
Mean ∆LASA activity score
52.2 (49.1)
5.0 (4.6) nd Fair
Mean ∆LASA overall QOL score
59.5 (58.7)
1.6 (3.3) nd Fair
Mean ∆total KDQ score
22.8 (21.7)
-0.2 (1.1) nd Fair
Hb
ΔHb g/dL Pergola 2010 UI20185602 US
37 wks (37 wks)
EPO Q4W 215/215
EPO QW 108/108
28 mL/min (28 mL/min)
558.97 pmol/L (513.97 pmol/L)
5423 IU/wk (2967 IU/wk)
11.17 (11.03)
11.0 (11.0)
11.17 (11.03)
-0.19 (-0.02)
Non-inf250 Good
Difference in Hb at 16 wks, g/dL
Provenzano 2005 UI16114787 US
16 wks (16 wks)
EPO α 40,000 units Q4W 126/126
EPO α 10,000 units QW 130/130
nd 25%/227 (25%/198)
9,748 U (9,265 U)
11.9 (11.9)
11.4 (12.2)
11.9 (11.9)
+0.8 (-1.2, -0.5) 0.008251 Fair
Mean ΔHb g/dL
-0.5 (0.3) nd Fair
249 A range of 0.8 to 1.25 for the ratio is considered sufficient to define bioequivalence. Equivalence of drug use in the 2 arms was accepted if the entire 95% CI for this ratio was within these limits 250 The lower limit of the 95% CI for the estimated treatment difference for both comparisons, Q2W (-0.208; 0.153) vs. QW, and Q4W (-0.249; 0.063) vs. QW, was above the prespecified noninferiority margin of -1 g/dL. These analyses were adjusted for the baseline Hb level. 251 One-sided p-value testing non-inferiority from QW
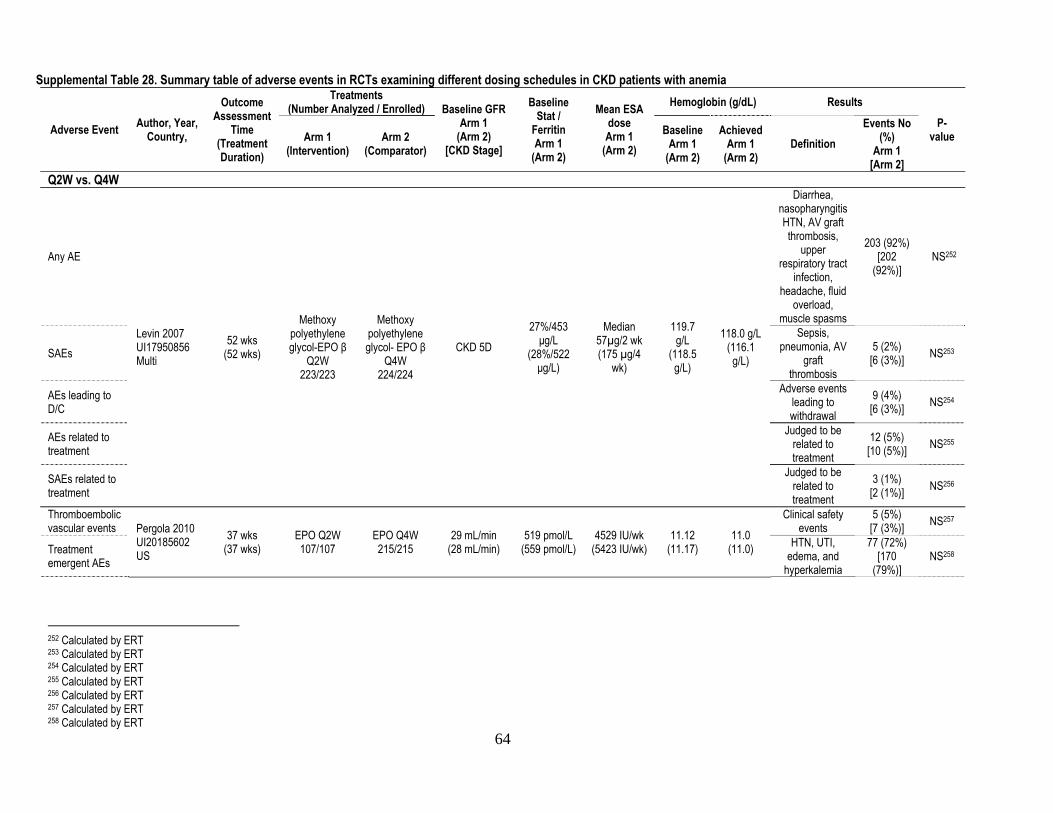
64
Supplemental Table 28. Summary table of adverse events in RCTs examining different dosing schedules in CKD patients with anemia
Adverse Event Author, Year, Country,
Outcome Assessment
Time (Treatment Duration)
Treatments (Number Analyzed / Enrolled) Baseline GFR
Arm 1 (Arm 2)
[CKD Stage]
Baseline Stat /
Ferritin Arm 1
(Arm 2)
Mean ESA dose Arm 1
(Arm 2)
Hemoglobin (g/dL) Results P-
value Arm 1 (Intervention)
Arm 2 (Comparator)
Baseline Arm 1
(Arm 2)
Achieved Arm 1
(Arm 2) Definition
Events No (%)
Arm 1 [Arm 2]
Q2W vs. Q4W
Any AE
Levin 2007 UI17950856 Multi
52 wks (52 wks)
Methoxy polyethylene glycol-EPO β
Q2W 223/223
Methoxy polyethylene glycol- EPO β
Q4W 224/224
CKD 5D 27%/453 μg/L
(28%/522 μg/L)
Median 57µg/2 wk (175 µg/4
wk)
119.7 g/L
(118.5 g/L)
118.0 g/L (116.1 g/L)
Diarrhea, nasopharyngitis HTN, AV graft thrombosis,
upper respiratory tract
infection, headache, fluid
overload, muscle spasms
203 (92%) [202
(92%)] NS252
SAEs Sepsis,
pneumonia, AV graft
thrombosis
5 (2%) [6 (3%)] NS253
AEs leading to D/C
Adverse events leading to withdrawal
9 (4%) [6 (3%)] NS254
AEs related to treatment
Judged to be related to treatment
12 (5%) [10 (5%)] NS255
SAEs related to treatment
Judged to be related to treatment
3 (1%) [2 (1%)] NS256
Thromboembolic vascular events Pergola 2010
UI20185602 US
37 wks (37 wks)
EPO Q2W 107/107
EPO Q4W 215/215
29 mL/min (28 mL/min)
519 pmol/L (559 pmol/L)
4529 IU/wk (5423 IU/wk)
11.12 (11.17)
11.0 (11.0)
Clinical safety events
5 (5%) [7 (3%)] NS257
Treatment emergent AEs
HTN, UTI, edema, and
hyperkalemia
77 (72%) [170
(79%)] NS258
252 Calculated by ERT 253 Calculated by ERT 254 Calculated by ERT 255 Calculated by ERT 256 Calculated by ERT 257 Calculated by ERT 258 Calculated by ERT

65
Adverse Event Author, Year, Country,
Outcome Assessment
Time (Treatment Duration)
Treatments (Number Analyzed / Enrolled) Baseline GFR
Arm 1 (Arm 2)
[CKD Stage]
Baseline Stat /
Ferritin Arm 1
(Arm 2)
Mean ESA dose Arm 1
(Arm 2)
Hemoglobin (g/dL) Results P-
value Arm 1 (Intervention)
Arm 2 (Comparator)
Baseline Arm 1
(Arm 2)
Achieved Arm 1
(Arm 2) Definition
Events No (%)
Arm 1 [Arm 2]
SAEs
Most commonly reported: CHF,
acute renal failure, chest
pain, and anemia
28 (26%) [56 (26%)] NS259
D/C D/C from the study
15 (14%) [41 (19%)] NS260
AEs leading to study D/C
D/C from the study because
of an AE 4 (4%)
[11 (5%)] NS261
Hypertension
Sulowicz 2007 UI17699476 Multi
36 wk (36 wk)
C.E.R.A. Q2W 190/190
C.E.R.A Q4W 191/191
CKD 5D: HD & PD
30%/418 ng/mL
(28%/427 ng/mL)
56 μg/2wk (150
μg/4wk) 11.70
(11.66) 11.70
(11.46)
--- 27 (14%) [30 (16%)] ---
Procedural hypertension --- 17 (9%)
[29 (15%)] ---
Any AE --- 171 (90%)
[177 (93%)]
---
Serious AE --- 70 (37%) [73 (38%)] ---
AE leading to D/C --- 1 (1%)
[0 (0%)] ---
SAE [safety] Kessler 2010 UI19888948 Multi
53 wk (53 wk)
C.E.R.A. Q2W 73/73
C.E.R.A. Q4W 72/72
CKD Stage 3-4
≥20%/≥100 ng/mL
(≥20%/≥100 ng/mL)
Median IQR range 0.17
µg/kg/wk (0.22
µg/kg/wk)
8-11 g/dL (8-
11g/dL)
11.92 (11.70)
None considered to be treatment
related
11262 (15%)
[11 (15%)] NS
(0.972)
AE related to study medication [safety]
Related to study
medication 1 (1%)
[0 (0%)]263 nd
259 Calculated by ERT 260 Calculated by ERT 261 Calculated by ERT 262 Event rate calculated by ERT 263 Calculated by ERT

66
Adverse Event Author, Year, Country,
Outcome Assessment
Time (Treatment Duration)
Treatments (Number Analyzed / Enrolled) Baseline GFR
Arm 1 (Arm 2)
[CKD Stage]
Baseline Stat /
Ferritin Arm 1
(Arm 2)
Mean ESA dose Arm 1
(Arm 2)
Hemoglobin (g/dL) Results P-
value Arm 1 (Intervention)
Arm 2 (Comparator)
Baseline Arm 1
(Arm 2)
Achieved Arm 1
(Arm 2) Definition
Events No (%)
Arm 1 [Arm 2]
Any AE [safety] At least 1 AE
mild or moderate in
intensity
48 (67%) [46
(64%)]264 NS
(0.814)
HTN [safety] nd 1 (1%) [3 (4%)]265
NS (0.330)
HTN Provenzano 2005 US UI16114787
16 wks (16 wks)
Epoetin α 20,000 units
Q2W 130/131
Epoetin α 40,000 units
Q4W 124/126
nd 26% /179 (25%/227)
9,681 U (9,748 U)
11.9 (11.9)
11.9 (11.4)
nd 8 (6%) [9 (7%)] NS
Drug D/C Withdrew from the study due
to adverse events
3 (2%) [5 (4% )] NS
Q2W vs. Q3W
HTN Provenzano 2005 UI16114787 US
16 wks (16 wks)
Epoetin α 20,000 units
Q2W 130/131
Epoetin α 30,000 units
Q3W 131/132
nd 26% /179 (26%/205)
9,681 U (9,489 U)
11.9 (11.9)
11.9 (11.2)
nd 8 (6%) [9 (7%)] NS
Drug D/C Withdrew from the study due
to adverse events
3 (2%) [5 (4% )] NS
Q3W vs. Q4W
HTN Provenzano 2005 UI16114787 US
16 wks (16 wks)
Epoetin α 30,000 units
Q3W 131/132
Epoetin α 40,000 units
Q4W 124/126
nd 26%/205 (25%/227)
9,489 U (9,748 U)
11.9 (11.9)
11.2 (11.4)
nd 9 (7%) [9 (7%)] NS
Drug D/C Withdrew from the study due
to adverse events
5 (4%) [5 (4% )] NS
Q4W vs. QW-TIW
264 Calculated by ERT 265 Calculated by ERT
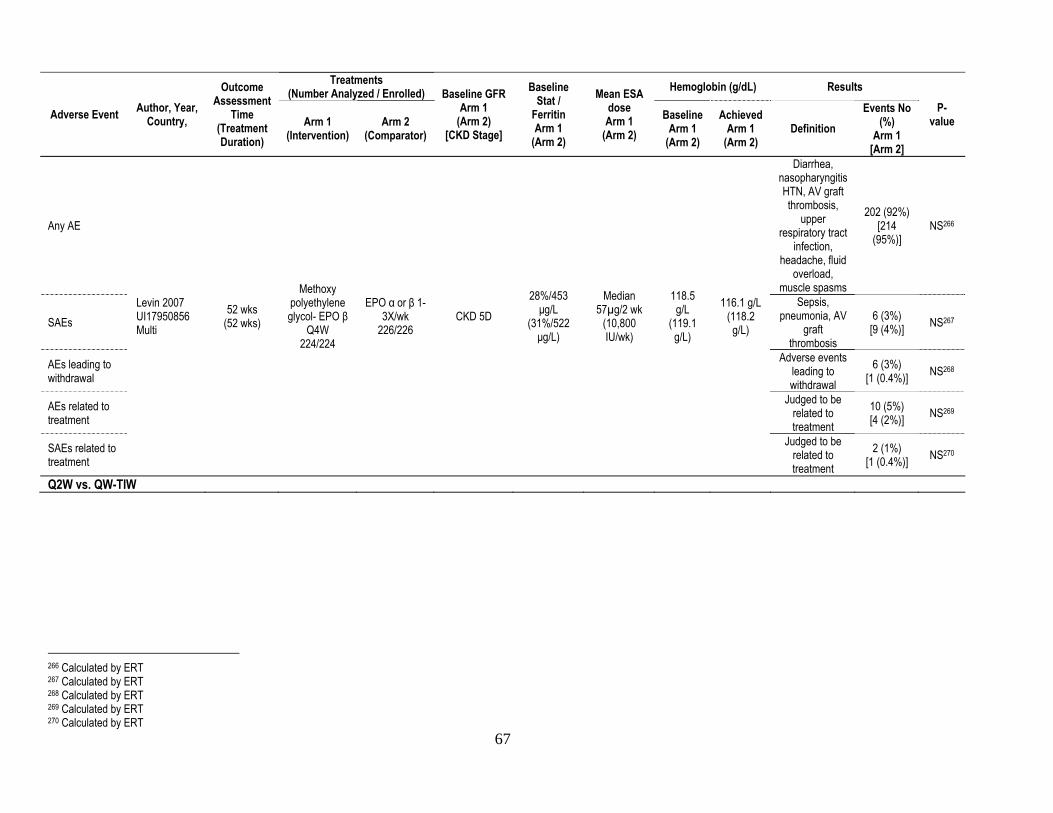
67
Adverse Event Author, Year, Country,
Outcome Assessment
Time (Treatment Duration)
Treatments (Number Analyzed / Enrolled) Baseline GFR
Arm 1 (Arm 2)
[CKD Stage]
Baseline Stat /
Ferritin Arm 1
(Arm 2)
Mean ESA dose Arm 1
(Arm 2)
Hemoglobin (g/dL) Results P-
value Arm 1 (Intervention)
Arm 2 (Comparator)
Baseline Arm 1
(Arm 2)
Achieved Arm 1
(Arm 2) Definition
Events No (%)
Arm 1 [Arm 2]
Any AE
Levin 2007 UI17950856 Multi
52 wks (52 wks)
Methoxy polyethylene glycol- EPO β
Q4W 224/224
EPO α or β 1-3X/wk
226/226 CKD 5D
28%/453 μg/L
(31%/522 μg/L)
Median 57µg/2 wk
(10,800 IU/wk)
118.5 g/L
(119.1 g/L)
116.1 g/L (118.2 g/L)
Diarrhea, nasopharyngitis HTN, AV graft thrombosis,
upper respiratory tract
infection, headache, fluid
overload, muscle spasms
202 (92%) [214
(95%)] NS266
SAEs Sepsis,
pneumonia, AV graft
thrombosis
6 (3%) [9 (4%)] NS267
AEs leading to withdrawal
Adverse events leading to withdrawal
6 (3%) [1 (0.4%)] NS268
AEs related to treatment
Judged to be related to treatment
10 (5%) [4 (2%)] NS269
SAEs related to treatment
Judged to be related to treatment
2 (1%) [1 (0.4%)] NS270
Q2W vs. QW-TIW
266 Calculated by ERT 267 Calculated by ERT 268 Calculated by ERT 269 Calculated by ERT 270 Calculated by ERT

68
Adverse Event Author, Year, Country,
Outcome Assessment
Time (Treatment Duration)
Treatments (Number Analyzed / Enrolled) Baseline GFR
Arm 1 (Arm 2)
[CKD Stage]
Baseline Stat /
Ferritin Arm 1
(Arm 2)
Mean ESA dose Arm 1
(Arm 2)
Hemoglobin (g/dL) Results P-
value Arm 1 (Intervention)
Arm 2 (Comparator)
Baseline Arm 1
(Arm 2)
Achieved Arm 1
(Arm 2) Definition
Events No (%)
Arm 1 [Arm 2]
Any AE
Levin 2007 UI17950856 Multi
52 wks (52 wks)
Methoxy polyethylene glycol- EPO β
Q2W 223/223
EPO α or β 1-3X/wk
226/226 CKD 5D
27%/453 μg/L
(31%/522 μg/L)
Median 57µg/2 wk
(10,800 IU/wk)
119.7 g/L
(119.1 g/L)
118.0 g/L (118.2 g/L)
Diarrhea, nasopharyngitis HTN, AV graft thrombosis,
upper respiratory tract
infection, headache, fluid
overload, muscle spasms
203 (92%) [214
(95%)] NS271
SAEs Sepsis,
pneumonia, AV graft
thrombosis
5 (2%) [9 (4%)] NS272
AEs leading to withdrawal
Adverse events leading to withdrawal
9 (4%) [1 (0.4%)] NS273
AEs related to treatment
Judged to be related to treatment
12 (5%) [4 (2%)] NS274
SAEs related to treatment
Judged to be related to treatment
3 (1%) [1 (0.4%)] NS275
Total AEs
Pergola 2009 UI19808215 US
44 wks (44 wks)
EPO α Q2W 125/125
EPO α TIW (22wk), then QW (22wk)
123/123
29 mL/min (31 mL/min)
553pmol/L (510 pmol/L)
6662 IU/wk (5039 IU/wk)
9.81 (9.63)
11.1 (11.4)
AEs that occurred after
the first dose of study drug
107 (86%) [98 (80%) NS276
Drug related AEs
Possible, probable, or very likely
related to study drug
15 (12%) [11 (9%) NS277
271 Calculated by ERT 272 Calculated by ERT 273 Calculated by ERT 274 Calculated by ERT 275 Calculated by ERT 276 Calculated by ERT 277 Calculated by ERT

69
Adverse Event Author, Year, Country,
Outcome Assessment
Time (Treatment Duration)
Treatments (Number Analyzed / Enrolled) Baseline GFR
Arm 1 (Arm 2)
[CKD Stage]
Baseline Stat /
Ferritin Arm 1
(Arm 2)
Mean ESA dose Arm 1
(Arm 2)
Hemoglobin (g/dL) Results P-
value Arm 1 (Intervention)
Arm 2 (Comparator)
Baseline Arm 1
(Arm 2)
Achieved Arm 1
(Arm 2) Definition
Events No (%)
Arm 1 [Arm 2]
SAEs
Cardiac failure congestive,
CRF, hypoglycemia,
MI, AKI, pneumonia, GI
heme, hip fracture,
dehydration, syncope, UTI, anemia, chest
pain, DVT, dyspnea, fall,
diarrhea, osteoarthritis,
upper GI heme
42 (34%) [36 (29%) NS278
Confirmed thromboembolic vascular events
--- 8 (6%) [2 (2%) NS279
AEs leading to study D/C --- 5 (4%)
[3 (2%) NS280
QW vs. QW or TIW
Total AEs
Locatelli 2008 UI18587731 Multi
28 wks (28 wks)
EPO α QW 213/217
IV Darbepoetin α QW or EPO α
TIW 68/70
CKD 5D: HD 31%/402
ng/mL (32%/402
ng/mL)
6.791 IU/wk (6.210 IU/wk)
11.57 (11.57)
10.92 (11.64)
--- 157 (72%) [50 (71%)] NS
Mild events --- 109281 (51%)
[34 (50%)] NS282
Moderate events --- 89283 (42%)
[23 (34%)] NS284
278 Calculated by ERT 279 Calculated by ERT 280 Calculated by ERT 281 Calculated by ERT 282 Calculated by ERT 283 Calculated by ERT 284 Calculated by ERT

70
Adverse Event Author, Year, Country,
Outcome Assessment
Time (Treatment Duration)
Treatments (Number Analyzed / Enrolled) Baseline GFR
Arm 1 (Arm 2)
[CKD Stage]
Baseline Stat /
Ferritin Arm 1
(Arm 2)
Mean ESA dose Arm 1
(Arm 2)
Hemoglobin (g/dL) Results P-
value Arm 1 (Intervention)
Arm 2 (Comparator)
Baseline Arm 1
(Arm 2)
Achieved Arm 1
(Arm 2) Definition
Events No (%)
Arm 1 [Arm 2]
Marked events --- 32285 (15%)
[11 (16%)] NS286
AEs considered possibly related to study treatment
--- 0 (0%) [1 (2%)] ---
AEs considered possibly related to study treatment
Hb >14 g/dL, anemia,
reduction in Hb, increase in Hb and asthenia
11/402 3/123 NS287
SAEs nd 54 (25%) [16 (23%)] NS288
Total AEs
Pergola 2009 UI19808215 US
44 wks (44 wks)
EPO α QW 125/125
EPO α TIW (22wk), then QW (22wk)
123/123
30 mL/min (31 mL/min)
573.81 pmol/L (510.23 pmol/L)
5035 IU/wk (5039 IU/wk)
9.71 (9.63)
11.3 (11.4)
AEs that occurred after
the first dose of study drug
98 (78%) [98 (80%) NS289
Drug related AEs
Possible, probable, or very likely
related to study drug
11 (9%) [11 (9%) NS290
285 Calculated by ERT 286 Calculated by ERT 287 Calculated by ERT 288 Calculated by ERT 289 Calculated by ERT 290 Calculated by ERT

71
Adverse Event Author, Year, Country,
Outcome Assessment
Time (Treatment Duration)
Treatments (Number Analyzed / Enrolled) Baseline GFR
Arm 1 (Arm 2)
[CKD Stage]
Baseline Stat /
Ferritin Arm 1
(Arm 2)
Mean ESA dose Arm 1
(Arm 2)
Hemoglobin (g/dL) Results P-
value Arm 1 (Intervention)
Arm 2 (Comparator)
Baseline Arm 1
(Arm 2)
Achieved Arm 1
(Arm 2) Definition
Events No (%)
Arm 1 [Arm 2]
SAEs
Cardiac failure congestive,
CRF, hypoglycemia,
MI, AKI, pneumonia, GI
heme, hip fracture,
dehydration, syncope, UTI, anemia, chest
pain, DVT, dyspnea, fall,
diarrhea, osteoarthritis,
upper GI heme
41 (33%) [36 (29%) NS291
Confirmed thromboembolic vascular events
--- 5 (4%) [2 (2%) NS292
AEs leading to study D/C --- 3 (2%)
[3 (2%) NS293
SAEs
Locatelli 2002 UI12087569 EU
24 wks (24 wks)
SC EPO β QW
75/84
SC EPO β TIW
71/89 5D: HD
26%/422 ng/mL(27%/461
ng/mL) 81 IU/kg
(78 IU/kg) Hct
33.1% (33.3%)
Hct 33%
(33.2%)294
nd 22 (27%) [30 (34%)] NS295
AEs
Hypotension, HTN, pain in
extremity, diarrhea,
cough, muscle cramps,
headache, pruritis, upper
respiratory tract infection
46 (55%) [47 (53%)] NS296
291 Calculated by ERT 292 Calculated by ERT 293 Calculated by ERT 294 Estimated from graph 295 Calculated by ERT 296 Calculated by ERT

72
Adverse Event Author, Year, Country,
Outcome Assessment
Time (Treatment Duration)
Treatments (Number Analyzed / Enrolled) Baseline GFR
Arm 1 (Arm 2)
[CKD Stage]
Baseline Stat /
Ferritin Arm 1
(Arm 2)
Mean ESA dose Arm 1
(Arm 2)
Hemoglobin (g/dL) Results P-
value Arm 1 (Intervention)
Arm 2 (Comparator)
Baseline Arm 1
(Arm 2)
Achieved Arm 1
(Arm 2) Definition
Events No (%)
Arm 1 [Arm 2]
Q3W vs. QW
HTN Provenzano 2005 UI16114787 US
16 wks (16 wks)
EPO α 30,000 units Q3W 132/132
EPO α 10,000 units QW 130/130
nd 26%/205 (25%/198)
9, 489 U (9, 265 U)
11.9 (11.9)
11.2 (12.2)
nd 9 (7%) [9 (7%)] NS
Drug D/C Withdrew from the study due
to adverse events
5 (4%) [3 (2%)] NS
Q2W vs. QW
Total AEs
Pergola 2009 UI19808215 US
44 wks (44 wks)
EPO α Q2W 125/125
EPO α QW 125/125
29 mL/min (30 mL/min)
552.74 pmol/L (573.81 pmol/L)
6662 IU/wk (5035 IU/wk)
9.81 (9.71)
11.1 (11.3)
AEs that occurred after
the first dose of study drug
107 (86%) [98 (78%) NS297
Drug related AEs
Possible, probable, or very likely
related to study drug
15 (12%) [11 (9%) NS298
SAEs
Cardiac failure congestive,
CRF, hypoglycemia,
MI, AKI, pneumonia, GI
heme, hip fracture,
dehydration, syncope, UTI, anemia, chest
pain, DVT, dyspnea, fall,
diarrhea, osteoarthritis,
upper GI heme
42 (34%) [41 (33%) NS299
297 Calculated by ERT 298 Calculated by ERT 299 Calculated by ERT

73
Adverse Event Author, Year, Country,
Outcome Assessment
Time (Treatment Duration)
Treatments (Number Analyzed / Enrolled) Baseline GFR
Arm 1 (Arm 2)
[CKD Stage]
Baseline Stat /
Ferritin Arm 1
(Arm 2)
Mean ESA dose Arm 1
(Arm 2)
Hemoglobin (g/dL) Results P-
value Arm 1 (Intervention)
Arm 2 (Comparator)
Baseline Arm 1
(Arm 2)
Achieved Arm 1
(Arm 2) Definition
Events No (%)
Arm 1 [Arm 2]
Confirmed thromboembolic vascular events
--- 8 (6%) [5 (4%) NSi300
AEs leading to study D/C --- 5 (4%)
[3 (2%) NS301
Thromboembolic vascular events
Pergola 2010 UI20185602 US
37 wks (37 wks)
EPO Q2W 107/107
EPO QW 108/108
29 mL/min (28 mL/min)
518.60 pmol./L (513.97 pmol/L)
4529 IU/wk (2967 IU/wk)
11.12 (11.03)
11.0 (11.0)
Clinical safety events
5 (5%) [3 (3%)] NS302
Treatment emergent AEs
HTN, UTI, edema, and
hyperkalemia 77 (72%) [84 (78%)] NS303
SAEs
Most commonly reported: CHF,
acute renal failure, chest
pain, and anemia
28 (26%) [24 (22%)] NS304
D/Cs D/C from the study
15 (14%) [13 (12%)] NS305
AEs leading to study D/C
D/C from the study because
of an AE 4 (4%)
[3 (3%)] NS306
HTN Provenzano 2005 UI16114787 US
16 wks (16 wks)
EPO α 20,000 units Q2W 131/131
EPO α 10,000 units QW 130/130
nd 26%/179 (25% /198)
9,681 U (9,265 U)
11.9 (11.9)
11.9 (12.2)
nd 8 (6%) [9 (7%)] NS
Drug D/C Withdrew from the study due
to adverse events
5 (4%) [3 (2%)] NS
Q4W vs. QW Thromboembolic vascular events
Pergola 2010 UI20185602
37 wks (37 wks)
EPO Q4W 215/215
EPO QW 108/108
28 mL/min (28 mL/min)
558.97 pmol/L
5423 IU/wk (2967 IU/wk)
11.17 (11.03)
11.0 (11.0)
Clinical safety events
7 (3%) [3 (3%)] NS307
300 Calculated by ERT 301 Calculated by ERT 302 Calculated by ERT 303 Calculated by ERT 304 Calculated by ERT 305 Calculated by ERT 306 Calculated by ERT 307 Calculated by ERT

74
Adverse Event Author, Year, Country,
Outcome Assessment
Time (Treatment Duration)
Treatments (Number Analyzed / Enrolled) Baseline GFR
Arm 1 (Arm 2)
[CKD Stage]
Baseline Stat /
Ferritin Arm 1
(Arm 2)
Mean ESA dose Arm 1
(Arm 2)
Hemoglobin (g/dL) Results P-
value Arm 1 (Intervention)
Arm 2 (Comparator)
Baseline Arm 1
(Arm 2)
Achieved Arm 1
(Arm 2) Definition
Events No (%)
Arm 1 [Arm 2]
Treatment emergent AEs
US (513.97 pmol/L)
HTN, UTI, edema, and
hyperkalemia 170 (79%) [84 (78%)] NS308
SAEs
Most commonly reported: CHF,
acute renal failure, chest
pain, and anemia
56 (26%) [24 (22%)] NS309
D/C D/C from the study
41 (19%) [13 (12%)] NS310
AEs leading to study D/C
D/C from the study because
of an AE 11 (5%) [3 (3%)] NS311
HTN Provenzano 2005 UI16114787 US
16 wks (16 wks)
EPO α 40,000 units Q4W 126/126
EPO α 10,000 units QW 130/130
nd 25%/227 (25%/198)
9,748 U (9,265 U)
11.9 (11.9)
11.4 (12.2)
nd 9 (7%) [9 (7%)] NS
Drug D/C Withdrew from the study due
to adverse events
5 (4%) [3 (2%)] NS
308 Calculated by ERT 309 Calculated by ERT 310 Calculated by ERT 311 Calculated by ERT

75
Supplemental Table 29. Evidence profile of RCTs examining ESA vs. ESA in CKD patients with anemia
Outcome # of studies
and study design
Total N (treatment)
Methodological quality of studies
per outcome Consistency
across studies
Directness of the evidence
generalizability/ applicability
Other considerations
Summary of findings
Quality of evidence for outcome
Qualitative and quantitative description of effect
Importance of outcome
Mortality 15 RCTs (High)
5719 (3000)
No limitations (0)
No important inconsistencies
(0) Direct
(0) Imprecision
(-1) Moderate Insufficient evidence Critical
CV mortality 1 RCT (High)
324 (162)
No limitations (0) NA Direct
(0)
Sparse (-1)
Imprecision (-1)
Low Insufficient evidence Critical
CV events 1 RCT (High)
522 (347)
Serious limitations (-2) NA Direct
(0) Imprecision
(-1) Very Low Insufficient evidence Critical
ESRD 0 RCTs -- -- -- -- -- -- -- Critical
Transfusion 17 RCTs (High)
6590 (3527)
Some limitations (-1)
No important inconsistencies
(0) Direct
(0) Imprecision
(-1) Low Insufficient evidence High
QoL 1 RCT (High)
324 (162)
Some limitations (-1) NA Direct
(0) Sparse
(-1) Low Possible benefit for darbepoetin alfa for Physical Role and Vitality vs. C.E.R.A.312 High
Hb (categorical)
13 RCTs (High)
5006 (2786)
No limitations (0)
No important inconsistencies
(0) Direct
(0) None
(0) High No difference Moderate
Hb (continuous)
16 RCTs (High)
5763 (3099)
No limitations (0)
No important inconsistencies
(0) Direct
(0) None
(0) High No difference Moderate
ESA dose (categorical)
4 RCT (High)
1608 (715)
No limitations (0) NA Direct
(0) Sparse
(-1) Moderate No difference Moderate
ESA dose (continuous)
7 RCTs (High)
3102 (1796)
No limitations (0) NA Direct
(0) Sparse
(-1) Moderate No difference313 Moderate
Adverse events 16 RCTs (High)
6285 (3514) No difference in major adverse events Moderate
Total 18 RCTs 7032 (3807)
Balance of potential benefits and harms: Insufficient evidence for important clinical outcomes.
No difference for Hb response. Quality of overall evidence:
Low
312 Statistical comparisons were not performed. 313 EPO is better if C.E.R.A. is given every four weeks but not for C.E.R.A given every two weeks.

76
Supplemental Table 30. Summary table of RCTs examining ESA vs. ESA in CKD patients with anemia (categorical outcomes)
Outcome Author, Year, Country
Outcome Assessment
Time (Treatment Duration)
Treatments (Number Analyzed / Enrolled)
CKD Stage
Baseline TSAT/ Ferritin Arm 1
(Arm 2)
Median ESA dose Arm 1
(Arm 2)
Hemoglobin (g/dL) Results P-
value Quality Arm 1 (Intervention)
Arm 2 (Comparator)
Baseline Arm 1
(Arm 2)
Achieved Arm 1
(Arm 2)
Events No (%)
Arm 1 [Arm 2]
RR/OR/HR (95% CI)
Darbepoetin vs. EPO Mortality
Death Nissenson 2002 UI12087569 US & Canada
28 wks (28 wks)
IV Darbepoetin α
QW + placebo 169/169
IV EPO TIW+ placebo 335/335
5D: HD 32%/411ng/
mL (32%/425
ng/mL)
14,177 U/wk (13,576 U/wk)
11.2 (11.2)
11.36 (12.8)
9 (5%) [23 (7%)]
RR 0.78314 (0.37; 1.64) NS Fair
Death Tolman 2005 UI15788469 UK
9 mo (9 mo)
SC Darbepoetin α QW
112/112 SC EPO β TIW
105/105 5D: HD 478 µg/L (499 µg/L)
Median 91 IU/kg/wk
(79 IU/kg/wk) 11.86
(11.73) 11.9
(11.5) 13 (12%) [11 (10%)]
RR 1.11 (0.52; 2.36) NS Fair
Death Vanrenterghem 2002 UI12427142 Multi
52 wk (52 wk)
Darbepoetin α 347/347
rHuEPO 175/175
5D: HD, PD
305.8 μg/L (288.7 μg/L)
6000 IU/wk (6000 IU/wk)
11.0 (11.0)
11.5 (11.0)
41 12%) [11 (6%)]
RR 1.86315 (0.98;3.53)
NS (0.062) Fair
2 y (52 wk)
25% [21%] -- nd Fair
Annualized death rate
13% [11%] -- NS Fair
CV events Cerebrovascular disorder Vanrenterghe
m 2002 UI12427142 Multi
52 wk (52 wk)
Darbepoetin α 347/347
rHuEPO 175/175
5D: HD, PD
305.8 μg/L (288.7 μg/L)
6000 IU/wk (6000 IU/wk)
11.0 (11.0)
11.5 (11.0)
2% (1%) -- nd Poor
MI 2% (1%) -- nd Poor
Transient ischemic attack
0% (1%) -- nd Poor
Transfusion
Transfusions Nissenson 2002 UI12087569 US & Canada
28 wks (28 wks)
IV Darbepoetin α QW + placebo
169/169
IV EPO TIW+ placebo 335/335
5D: HD 32%/411ng/
mL (32%/425
ng/mL)
14,177 U/wk (13,576 U/wk)
11.2 (11.2)
11.36 (12.8)
16 (10%) [37 (11%)]
RR 0.86316 (0.49; 1.50) NS Fair
Transfusions Tolman 2005 UI15788469 UK
9 mo (9 mo)
SC Darbepoetin α QW
112/112 SC EPO β TIW
105/105 5D: HD 478 µg/L (499 µg/L)
Median 91 IU/kg/wk
(79 IU/kg/wk) 11.86
(11.73) 11.9
(11.5) 8 (10%)
[11 (14%)] RR 0.73
(0.31; 1.71) NS Fair
Transfusions Vanrenterghem 2002 UI12427142 Multi
2 y (52 wk)
Darbepoetin α 347/347
rHuEPO 175/175
5D: HD, PD
305.8 μg/L (288.7 μg/L)
6000 IU/wk (6000 IU/wk)
11.0 (11.0)
11.5 (11.0)
4% [5%] -- nd Fair
314 Calculated by ERT 315 Calculated by ERT 316 Calculated by ERT

77
Outcome Author, Year, Country
Outcome Assessment
Time (Treatment Duration)
Treatments (Number Analyzed / Enrolled)
CKD Stage
Baseline TSAT/ Ferritin Arm 1
(Arm 2)
Median ESA dose Arm 1
(Arm 2)
Hemoglobin (g/dL) Results P-
value Quality Arm 1 (Intervention)
Arm 2 (Comparator)
Baseline Arm 1
(Arm 2)
Achieved Arm 1
(Arm 2)
Events No (%)
Arm 1 [Arm 2]
RR/OR/HR (95% CI)
ESA dose
%Dose changes
Nissenson 2002 UI12087569 US & Canada
28 wks (28 wks)
IV Darbepoetin α QW + placebo 169/169
IV EPO TIW+ placebo 335/335
5D: HD 32%/411ng/
mL (32%/425
ng/mL)
14,177 U/wk (13,576 U/wk)
11.2 (11.2)
11.36 (12.8)
74 (44%) [164 (49%)]
RR 0.89 (0.73; 1.10) NS Fair
EPO ζ vs. EPO α Mortality Total all cause mortality Krivoshiev
2008 UI18394266 EU
24 wks (24 wks)
EPO ζ 300/305
EPO α 298/304
CKD 5D: HD ---
182.20 IU/kg/wk
(166.14 IU/kg/wk)
8.07 (8.04)
11.60 (11.61)
13 (4%) [16 (5%)]
RR 0.81317 (0.40;1.65) NS Good
Mortality possibly related to drug
1 (0.3%) [0 (0%)] --- --- Good
Death [safety]
Krivoshiev 2010 UI20369312 Multi
28 wks (28 wks)
EPO ζ 232/232
EPO α 230/230
CKD 5D: HD nd
97.0 IU/kg/wk (86.0
IU/kg/wk) 10.56
(10.40) 10.94
(11.02) 16 (7%) [7 (3%)]
RR 2.27 (0.95,
5.40)318 NS
(0.065) Good
Transfusion
Transfusion Krivoshiev 2008 UI18394266 EU
24 wks (24 wks)
EPO ζ 273/305
EPO α 268/304
CKD 5D: HD ---
182.20 IU/kg/wk
(166.14 IU/kg/wk)
8.07 (8.04)
11.60 (11.61)
10 (4%) [13 (5%)]
RR 0.76319 (0.34;1.69) NS Good
Transfusion
Wizemann 2008 UI18208642 Germany & Poland
24 wk (24 wk)
EPO ζ 239/313
EPO α 239/313
CKD 5D: HD --- --- 11.6
(11.7) 11.35
(11.54) 3 (1%) [2 (1%)]
RR 1.50320 (0.25; 8.90) NS Good
Transfusions [PP]
Krivoshiev 2010 UI20369312 Multi
28 wks (28 wks)
EPO ζ 154/232
EPO α 165/230
CKD 5D: HD nd
97.0 IU/kg/wk (86.0
IU/kg/wk) 10.56
(10.40) 10.94
(11.02) 2 (1%) [1 (1%)]
RR 2.14 (0.20,
23.40)321 NS
(0.532) Good
317 Calculated by ERT 318 Calculated by ERT 319 Calculated by ERT 320 Calculated by ERT 321 Calculated by ERT

78
Outcome Author, Year, Country
Outcome Assessment
Time (Treatment Duration)
Treatments (Number Analyzed / Enrolled)
CKD Stage
Baseline TSAT/ Ferritin Arm 1
(Arm 2)
Median ESA dose Arm 1
(Arm 2)
Hemoglobin (g/dL) Results P-
value Quality Arm 1 (Intervention)
Arm 2 (Comparator)
Baseline Arm 1
(Arm 2)
Achieved Arm 1
(Arm 2)
Events No (%)
Arm 1 [Arm 2]
RR/OR/HR (95% CI)
Hb
Hb maintenance success322
Krivoshiev 2008 UI18394266 EU
24 wks (24 wks)
EPO ζ 273/305
EPO α 268/304
CKD 5D: HD ---
182.20 IU/kg/wk
(166.14 IU/kg/wk)
8.07 (8.04)
11.60 (11.61)
236 (86%) [227 (85%)]
95% CI [test-
reference] (-4.2%; 7.7%)
NS Good
Hb treatment success323
230 (84%) [230 (86%)]
RR 0.98324 (0.91; 1.05) NS Good
Permanent ∆Hb >1 g/dL Wizemann
2008 UI18208642 Germany & Poland
24 wk (24 wk)
EPO ζ 239/313
EPO α 239/313
CKD 5D: HD --- --- 11.6
(11.7) 11.35
(11.54)
11% [11%] -- NS Good
Transient ∆Hb >1g/dL
132 (55%) [134 (56%)]
RR 0.99325 (0.84; 1.16) NS Good
Patients with Hb values outside the target range
161 (67%) [152 (64%)]
RR 1.06326 (0.91; 1.24) NS Good
Hb values outside the target range [PP]
Krivoshiev 2010 UI20369312 Multi
28 wks (28 wks)
EPO ζ 154/232
EPO α 165/230
CKD 5D: HD nd
97.0 IU/kg/wk (86.0
IU/kg/wk) 10.56
(10.40) 10.94
(11.02)
134 (87%) [143 (87%)]
RR 1.00 (0.92,
1.09)327 NS
(0.927) Good
Permanent ∆Hb >1 g/dL [PP]
66 (43%) [59 (36%)]
RR 1.18 (0.90,
1.56)328 NS
(0.238) Good
Transient ∆Hb >1 g/dL [PP]
131 (85%) [148 (90%)]
RR 0.95 (0.87,
1.03)329 NS
(0.216) Good
Hb>13 g/dL [safety]
EPO ζ 232/232
EPO α 230/230
180 (78%) [174 (76%)]
RR 1.03 (0.93,
1.13)330
NS (0.624) Good
322 Hb concentration of ≥11.0 ±1.0 g/dL for at least 4 consecutive weeks 323 Hb concentration of ≥11.0-12.0 g/dL for 2 consecutive weeks without any blood transfusion within the preceding 3 months 324 Calculated by ERT 325 Calculated by ERT 326 Calculated by ERT 327 Calculated by ERT 328 Calculated by ERT 329 Calculated by ERT 330 Calculated by ERT

79
Outcome Author, Year, Country
Outcome Assessment
Time (Treatment Duration)
Treatments (Number Analyzed / Enrolled)
CKD Stage
Baseline TSAT/ Ferritin Arm 1
(Arm 2)
Median ESA dose Arm 1
(Arm 2)
Hemoglobin (g/dL) Results P-
value Quality Arm 1 (Intervention)
Arm 2 (Comparator)
Baseline Arm 1
(Arm 2)
Achieved Arm 1
(Arm 2)
Events No (%)
Arm 1 [Arm 2]
RR/OR/HR (95% CI)
ESA dose Permanent ∆EPO dose
Wizemann 2008 UI18208642 Germany & Poland
24 wk (24 wk)
EPO ζ 239/313
EPO α 239/313
CKD 5D: HD --- --- 11.6
(11.7) 11.35
(11.54)
94 (39%) [98 (41%)]
RR 0.96331 (0.77; 1.19) NS Good
Transient ∆EPO dose
141 (59%) [155 (65%)]
RR 0.91332 (0.75; 1.05) NS Good
Permanent dosage changes [PP]
Krivoshiev 2010 UI20369312 Multi
28 wks (28 wks)
EPO ζ 154/232
EPO α 165/230
CKD 5D: HD nd
97.0 IU/kg/wk (86.0
IU/kg/wk) 10.56
(10.40) 10.94
(11.02)
135 (88%) [136 (82%)]
RR 1.06 (0.97,
1.17)333 NS
(0.190) Good
Transient dosage changes [PP]
139 (90%) [141 (86%)]
RR 1.06 (0.97,
1.15)334 NS
(0.189) Good
EPO θ vs. EPO β Mortality
All cause mortality [ITT]
Gertz, 2010 UI20812790 Multi
13-24 wk (24 wk)
EPO θ 180/180
EPO β 90/90
CKD 5D: HD nd 102.5 IU/kg
(97.5 IU/kg) 10.87
(10.87) 10.60
(10.66) 10 (6%) [7 (8%)]
RR 0.71 (0.28, 1.81) NS Good
Transfusion Transfusion requirement [ITT]
Gertz, 2010 UI20812790 Multi
13-24 wk (24 wk)
EPO θ 180/180
EPO β 90/90
CKD 5D: HD nd 102.5 IU/kg
(97.5 IU/kg) 10.87
(10.87) 10.60
(10.66) 7 (4%) [4 (4%)]
RR 0.88 (0.26, 2.91) NS Good
Hb %Hb values w/in range (baseline ±1 g/dL and 9.5-12.0 g/dL), per pt [PP]
Gertz, 2010 UI20812790 Multi
13-24 wk (24 wk)
EPO θ 150/180
EPO β 74/90
CKD 5D: HD nd 102.5 IU/kg
(97.5 IU/kg) 10.87
(10.87) 10.60
(10.66) 66% [67%]
Ratio 0.99 (0.87, 1.13) NS Good
331 Calculated by ERT 332 Calculated by ERT 333 Calculated by ERT 334 Calculated by ERT

80
Outcome Author, Year, Country
Outcome Assessment
Time (Treatment Duration)
Treatments (Number Analyzed / Enrolled)
CKD Stage
Baseline TSAT/ Ferritin Arm 1
(Arm 2)
Median ESA dose Arm 1
(Arm 2)
Hemoglobin (g/dL) Results P-
value Quality Arm 1 (Intervention)
Arm 2 (Comparator)
Baseline Arm 1
(Arm 2)
Achieved Arm 1
(Arm 2)
Events No (%)
Arm 1 [Arm 2]
RR/OR/HR (95% CI)
Hb values w/in range (baseline ±1 g/dL and 9.5-12.0 g/dL), % pts/wk [PP]
59-72%, (60-74%) -- NS Fair
HX575 vs. EPO α Transfusion
Transfusions
HaagWeber 2009 UI19863881 Germany & Austria
24-28 wk (≥ 54 wk)
HX575 203/314
EPO α 114/164
CKD 5D: HD
25%/677 ng/mL
(26%/672 ng/mL)
6906 IU/wk (6477 IU/wk)
11.7 (12.0)
11.7 (11.9)
15 (7%) [8 (7%)]
RR 0.99 (0.43; 2.29) NS Fair
Hb Responders definition I335
HaagWeber 2009 UI19863881 Germany & Austria
24-28 wk (≥24 wk)
HX575 304/314
EPO α 161/164
CKD 5D: HD
25%/677 ng/mL
(26%/672 ng/mL)
6906 IU/wk (6477 IU/wk)
11.7 (12.0)
11.7 (11.9)
81% [84%] --- --- Fair
Responders definition II336
70% [64%] --- --- Fair
C.E.R.A. vs. EPO Mortality
Death Spinowitz 2009 UI18004064 Multi
36 wks (36 wks)
C.E.R.A. Q2W 123/168
EPO QW-TIW 133/168
CKD 5D: HD & PD
29%/515 ng/mL
(30%/482 ng/mL)
60 µg/2wk (7,310 IU/wk)
11.85 (11.83)
11.99 (11.82)
7 (4%) [10 (6%)]
RR 0.76 (0.30;
1.93)337 NS Good
Deaths Sulowicz 2007 UI17699476 Multi
36 wk (36 wk)
C.E.R.A. Q2W 190/190
EPO QW-TIW 191/191
CKD 5D: HD & PD
30%/418 ng/mL
(31%/435 ng/mL)
56 μg/2wk (5500 IU/wk)
11.70 (11.65)
11.70 (11.52)
13 (7%) [12 (6%)]
RR 1.09338 (0.51; 2.33) ---
Fair
C.E.R.A. Q4W 191/191
EPO QW-TIW 191/191
28%/427 ng/mL
(31%/435 ng/mL)
150 μg/4wk (5500 IU/wk)
11.66 (11.65)
11.46 (11.52)
18 (10%) [12 (6%)]
RR 1.50339 (0.74; 3.03) ---
335 Patients with mean Hb value during the baseline and evaluation periods within the target range of 10.0–13.0 g/dL 336 Responders according to Definition I with mean weekly epoetin dosages during baseline and evaluation periods differing by ≤ 25% 337 Calculated by ERT 338 Calculated by ERT 339 Calculated by ERT

81
Outcome Author, Year, Country
Outcome Assessment
Time (Treatment Duration)
Treatments (Number Analyzed / Enrolled)
CKD Stage
Baseline TSAT/ Ferritin Arm 1
(Arm 2)
Median ESA dose Arm 1
(Arm 2)
Hemoglobin (g/dL) Results P-
value Quality Arm 1 (Intervention)
Arm 2 (Comparator)
Baseline Arm 1
(Arm 2)
Achieved Arm 1
(Arm 2)
Events No (%)
Arm 1 [Arm 2]
RR/OR/HR (95% CI)
Deaths Levin 2007 UI17950856 Multi
52 wk (52 wk)
Methoxy polyethylene glycol-EPO β
Q2W 221/223
EPO QW-TIW 225/226
CKD 5D: HD & PD
27%/453 µg/L
(31%/ 505 µg/L)
100 µg/2wk (9600 IU/wk)
11.97 (11.91)
11.80 (11.82)
19 (9%) [17 (8%)]
RR 1.14340 (0.61; 2.13) NS
Good Methoxy polyethylene glycol-EPO β
Q4W 220/224
EPO QW-TIW 225/226
28%/522 µg/L
(31%/ 505 µg/L)
200 µg/4wk (9600 IU/wk)
11.85 (11.91)
11.61 (11.82)
15 (7%) [17 (8%)]
RR 0.90 (0.46; 1.76) NS
Transfusion
RBC transfusion
Spinowitz 2009 UI18004064 Multi
36 wks (36 wks)
C.E.R.A. Q2W 123/168
EPO QW to TIW 133/168
CKD 5D: HD & PD
29%/515 ng/mL
(30%/482 ng/mL)
60 µg/2wk (7,310 IU/week
) 11.85
(11.83) 11.99
(11.82) 34 (28%) [59 (44%)]
RR 0.62341 (0.44;
0.88)342 NS Fair
RBC transfusion
Sulowicz 2007 UI17699476 Multi
36 wk (36 wk)
C.E.R.A. Q2W 190/190
EPO QW-TIW 191/191
CKD 5D: HD & PD
30%/418 ng/mL
(31%/435 ng/mL)
56 μg/2wk (5500 IU/wk)
11.70 (11.65)
11.70 (11.52)
6% [10%] -- ---
Good
C.E.R.A. Q4W 191/191
EPO QW-TIW 191/191
28%/427 ng/mL
(31%/435 ng/mL)
150 μg/4wk (5500IU/wk)
11.66 (11.65)
11.46 (11.52)
11% [10%] -- ---
RBC transfusions
Levin 2007 UI17950856 Multi
52 wk (52 wk)
Methoxy polyethylene glycol-EPO β
Q2W 221/223
EPO QW-TIW 225/226
CKD 5D: HD & PD
27%/453 µg/L
(31%/ 505 µg/L)
100 µg/2wk (9600 IU/wk)
11.97 (11.91)
11.80 (11.82)
21 (10%) [17 (8%)]
RR 1.26343 (0.69; 2.33) NS
Good Methoxy polyethylene glycol-EPO β
Q4W 220/224
EPO QW-TIW 225/226
28%/522 µg/L
(31%/ 505 µg/L)
200 µg/4wk (9600 IU/wk)
11.85 (11.91)
11.61 (11.82)
16 (7%) [17 (8%)]
RR 0.96344 (0.50; 1.86) NS
340 Calculated by ERT 341 Calculated by ERT 342 Calculated by ERT 343 Calculated by ERT 344 Calculated by ERT

82
Outcome Author, Year, Country
Outcome Assessment
Time (Treatment Duration)
Treatments (Number Analyzed / Enrolled)
CKD Stage
Baseline TSAT/ Ferritin Arm 1
(Arm 2)
Median ESA dose Arm 1
(Arm 2)
Hemoglobin (g/dL) Results P-
value Quality Arm 1 (Intervention)
Arm 2 (Comparator)
Baseline Arm 1
(Arm 2)
Achieved Arm 1
(Arm 2)
Events No (%)
Arm 1 [Arm 2]
RR/OR/HR (95% CI)
Hb
Hb within ±1.0 g/dL of baseline value
Spinowitz 2009 UI18004064 Multi
36 wks (36 wks)
C.E.R.A. Q2W 123/168
EPO QW-TIW 133/168
CKD 5D: HD & PD
29%/515 ng/mL
(30%/482 ng/mL)
60 µg/2wk (7,310 IU/week
) 11.85
(11.83) 11.99
(11.82) 86345 (69%) [90 (68%)]
RR 1.03 (0.88;
1.22)346 NS Good
Hb within ±1.0 g/dL of baseline value
Sulowicz 2007 UI17699476 Multi
36 wk (36 wk)
C.E.R.A. Q2W 190/190
EPO QW-TIW 191/191
CKD 5D: HD & PD
30%/418 ng/mL
(31%/435 ng/mL)
56 μg/2wk (5500 IU/wk)
11.70 (11.65)
11.70 (11.52)
76% [72%] -- ---
Good
C.E.R.A. Q4W 191/191
EPO QW-TIW 191/191
28%/427 ng/mL
(31%/435 ng/mL)
150 μg/4wk (5500 IU/wk)
11.66 (11.65)
11.46 (11.52)
66% [72%] -- ---
Maintained Hb 10-13.5 g/dL
C.E.R.A. Q2W 190/190
EPO QW-TIW 191/191
30%/418 ng/mL
(31%/435 ng/mL)
56 μg/2wk (5500 IU/wk)
11.70 (11.65)
11.70 (11.52)
92% [88%] -- ---
C.E.R.A. Q4W 191/191
EPO QW-TIW 191/191
28%/427 ng/mL
(31%/435 ng/mL)
150 μg/4wk (5500 IU/wk)
11.66 (11.65)
11.46 (11.52)
88% [88%] -- ---
Hb within 10 g/dL of baseline value
Levin 2007 UI17950856 Multi
52 wk (52 wk)
Methoxy polyethylene glycol-EPO β
Q2W 196/223
EPO QW-TIW 205/226
CKD 5D: HD & PD
27%/453 µg/L
(31%/ 505 µg/L)
100 µg/2wk (9600 IU/wk)
11.97 (11.91)
11.80 (11.82)
133 (68%) [138 (67%)]
RR 1.01347 (0.88; 1.15) NS
Good
Methoxy polyethylene glycol-EPO β
Q4W 188/224
EPO QW-TIW 205/226
28%/522 µg/L
(31%/ 505 µg/L)
200 µg/4wk (9600 IU/wk)
11.85 (11.91)
11.61 (11.82)
127 (68%) [138 (67%)]
RR 1.00348 (0.87; 1.15) NS
345 Calculated by ERT 346 Calculated by ERT 347 Calculated by ERT 348 Calculated by ERT

83
Outcome Author, Year, Country
Outcome Assessment
Time (Treatment Duration)
Treatments (Number Analyzed / Enrolled)
CKD Stage
Baseline TSAT/ Ferritin Arm 1
(Arm 2)
Median ESA dose Arm 1
(Arm 2)
Hemoglobin (g/dL) Results P-
value Quality Arm 1 (Intervention)
Arm 2 (Comparator)
Baseline Arm 1
(Arm 2)
Achieved Arm 1
(Arm 2)
Events No (%)
Arm 1 [Arm 2]
RR/OR/HR (95% CI)
C.E.R.A. vs. Darbepoetin α Mortality
All cause mortality
Canaud 2008 UI18586762 Multi
52 wk (52 wk)
C.E.R.A. 157/157
Darbepoetin α 156/156 CKD 5D 28%/nd
(28%/nd) 0.35 µg/kg/wk
(0.44 µg/kg/wk)
12.0 (11.9)
12.1 (11.8)
13 (9%) [12 (8%)]
RR 1.08349 (0.51; 2.28) NS Fair
All cause death
Macdougall 2008 UI18287255 Multi
28 wks (28 wks)
C.E.R.A. Q2W 162/162
Darbepoetin α QW
162/162
CKD Stage 3-
4
24%/175 μg/L
(24%/186 μg/L)
0.34 μg/kg (0.19 μg/kg)
10.2 (10.2)
12.18 (12.01)
8 (5%) [9 (6%)]
RR 0.89350 (0.35; 2.26) NS Good
Death [safety]
Kessler 2010 UI19888948 Multi
53 wk (53 wk)
C.E.R.A. Q2W 73/73
Darbepoetin α QW/Q2W 151/151
CKD Stage 3-
4
≥20%/≥100 ng/mL
(≥20%/≥100 ng/mL)
Median IQR range
0.17 µg/kg/wk (0.17
µg/kg/wk) 8-11 g/dL (8-11g/dL)
11.92 (11.89)
2 (2%) [6 (4%)]
RR 0.69 (0.14,
3.33)351 NS
(0.644) Fair
C.E.R.A. Q4W 72/72
Median IQR range
0.22 µg/kg/wk (0.17
µg/kg/wk)
11.70 (11.89)
1 (1%) [6 (4%)]
RR 0.35 (0.04,
2.85)352 NS
(0.326) Fair
Death (safety)
Carrera 2010 UI20522670 Multi
52 wk (52 wk)
Methoxy polyethylene glycol-EPO β
Q4W 245/245
Darbepoetin α Q2W
244/245 CKD 5D:
HD
27%/427 µg/L
(27%/446 µg/L)
Median 30.0 µg/wk
(20.0 µg/wk) 12.09 g/dL
(12.07 g/dL) 11.8
(10.7)353 14 (6%) [14 (6%)]
RR 1.00 (0.49,
2.04)354 NS Good
Death (safety) Roger 2011 UI21505096 Multi
28 wk (20 wk)
C.E.R.A Q4W 153/153
Darbepoetin α QW/Q2W 154/154
CKD Stage 3-
4
24%/186 μg/L
(23.8%/207 μg/L)
Median 80
µg/4wk (110
µg/4wk)355
9.53 g/dL (9.53 g/dL)
11.3 g/dL (11.5
g/dL356) 4 (3%) [7 (5%)]
RR 0.58 (0.17,
1.92)357 NS Good
349 Calculated by ERT 350 Calculated by ERT 351 Calculated by ERT 352 Calculated by ERT 353 Estimated from figure 354 Calculated by ERT 355 Estimated from figure 356 Estimated from figure 357 Calculated by ERT

84
Outcome Author, Year, Country
Outcome Assessment
Time (Treatment Duration)
Treatments (Number Analyzed / Enrolled)
CKD Stage
Baseline TSAT/ Ferritin Arm 1
(Arm 2)
Median ESA dose Arm 1
(Arm 2)
Hemoglobin (g/dL) Results P-
value Quality Arm 1 (Intervention)
Arm 2 (Comparator)
Baseline Arm 1
(Arm 2)
Achieved Arm 1
(Arm 2)
Events No (%)
Arm 1 [Arm 2]
RR/OR/HR (95% CI)
CV mortality
CV death Macdougall 2008 UI18287255 Multi
28 wks (28 wks)
C.E.R.A. Q2W 162/162
Darbepoetin α QW
162/162
CKD Stage 3-
4
24%/175 μg/L
(24%/186 μg/L)
0.34 μg/kg (0.19 μg/kg)
10.2 (10.2)
12.18 (12.01)
7 (4%) [5 (3%)]
RR 1.41358 (0.46; 4.35) NS Good
Transfusion
Transfusion359 Canaud 2008 UI18586762 Multi
52 wk (52 wk)
C.E.R.A. 157/157
Darbepoetin α 156/156 CKD 5D 28.4%/nd
(28.0%/nd) 0.35 µg/kg/wk
(0.44 µg/kg/wk)
12.0 (11.9)
12.1 (11.8)
19 (12%) [16 (10%)]
RR1.18360 (0.63; 2.21) NS Fair
Transfusion Macdougall 2008 UI18287255 Multi
28 wks (28 wks)
C.E.R.A. Q2W 162/162
Darbepoetin α QW
162/162
CKD Stage 3-
4
24%/175 μg/L
(24%/186 μg/L)
0.34 μg/kg (0.19 μg/kg)
10.2 (10.2)
12.18 (12.01)
5361 (3%) [11362 (7%)
RR 0.45363 (0.16; 1.28) NS Fair
Transfusions [safety]
Kessler 2010 UI19888948 Multi
53 wk (53 wk)
C.E.R.A. Q2W 73/73
Darbepoetin α QW/Q2W 151/151
CKD Stage 3-
4
≥20%/≥100 ng/mL
(≥20%/≥100 ng/mL)
Median IQR range
0.17 µg/kg/wk (0.17
µg/kg/wk) 8-11 g/dL (8-11g/dL)
11.92 (11.89)
2 (3%) [4 (3%)]
RR 1.03 (0.19,
5.52)364 NS
(0.969) Fair
C.E.R.A. Q4W 72/72
Median IQR range
0.22 µg/kg/wk (0.17
µg/kg/wk)
11.70 (11.89)
0 (0%) [4 (3%)] nd nd Fair
Transfusions Carrera 2010 UI20522670 Multi
52 wk (52 wk)
Methoxy polyethylene glycol-EPO β
Q4W 245/245
Darbepoetin α Q2W
244/245 CKD 5D:
HD
27%/427 µg/L
(27%/446 µg/L)
Median 30.0 µg/wk
(20.0 µg/wk) 12.09 g/dL
(12.07 g/dL) 11.8
(10.7)365 39 (16%) [32 (13%)]
RR 1.21366 (0.79, 1.87) NS Good
358 Calculated by ERT 359 At least one RBC transfusion during the dose-titration and evaluation period) 360 Calculated by ERT 361 Calculated by ERT 362 Calculated by ERT 363 Calculated by ERT 364 Calculated by ERT 365 Estimated from figure 366 Calculated by ERT

85
Outcome Author, Year, Country
Outcome Assessment
Time (Treatment Duration)
Treatments (Number Analyzed / Enrolled)
CKD Stage
Baseline TSAT/ Ferritin Arm 1
(Arm 2)
Median ESA dose Arm 1
(Arm 2)
Hemoglobin (g/dL) Results P-
value Quality Arm 1 (Intervention)
Arm 2 (Comparator)
Baseline Arm 1
(Arm 2)
Achieved Arm 1
(Arm 2)
Events No (%)
Arm 1 [Arm 2]
RR/OR/HR (95% CI)
Transfusions Roger 2011 UI21505096 Multi
28 wk (20 wk)
C.E.R.A Q4W 153/153
Darbepoetin α QW/Q2W 154/154
CKD Stage 3-
4
24%/186 μg/L
(23.8%/207 μg/L)
Median 80 µg/4wk
(110 µg/4wk)367
9.53 g/dL (9.53 g/dL)
11.3 g/dL (11.5
g/dL368) 5 (3%)
[10 (7%)] RR.0.50 (0.18,
1.44)369 NS Good
Hb
Hb response rate
Macdougall 2008 UI18287255 Multi
28 wks (28 wks)
C.E.R.A. Q2W 162/162
Darbepoetin α QW
162/162
CKD Stage 3-
4
24%/175 μg/L
(24%/186 μg/L)
0.34 μg/kg (0.19 μg/kg)
10.2 (10.2)
12.18 (12.01)
159370 (98%) [156371 (96%)
Response rate 95% CI
(93.80; 99.32)372
Non-inf 373 Good
Hb levels maintained within ±1 g/dL of the response value [ITT] Kessler 2010
UI19888948 Multi
53 wk (53 wk)
C.E.R.A. Q2W 73/73
Darbepoetin α QW/Q2W 151/151
CKD Stage 3-
4
≥20%/≥100 ng/mL
(≥20%/≥100 ng/mL)
Median IQR range
0.17 µg/kg/wk (0.17
µg/kg/wk) 8-11 g/dL (8-11g/dL)
11.92 (11.89)
55 (76%) [103 (68%)]
RR 1.10 (0.93,
1.31)374 NS
(0.253) Fair
Hb levels maintained within ±1 g/dL of the response value [ITT]
C.E.R.A. Q4W 72/72
Median IQR range
0.22 µg/kg/wk (0.17
µg/kg/wk)
11.70 (11.89)
50 (70%) [103 (68%)]
RR 1.12 (0.95,
1.33)375 NS
(0.188) Fair
Hb response rate
Carrera 2010 UI20522670
52 wk (52 wk)
Methoxy polyethylene
Darbepoetin α Q2W
CKD 5D: HD
27%/427 µg/L
Median 30.0 µg/wk
12.09 g/dL (12.07 g/dL)
11.8 (10.7)376
157 (64%) [99 (40%)]
RR 1.59 (1.33, 1.90)
<0.0001 Good
367 Estimated from figure 368 Estimated from figure 369 Calculated by ERT 370 Calculated by ERT 371 Calculated by ERT 372 The 95% CI for the C.E.R.A. response rate was 93.80 to 99.32% 373 The lower limit was greater than the predefined 60% response (p<0.0001), it could be concluded that C.E.R.A. once every 2 wk effectively corrected anemia. 374 Calculated by ERT 375 Calculated by ERT 376 Estimated from figure
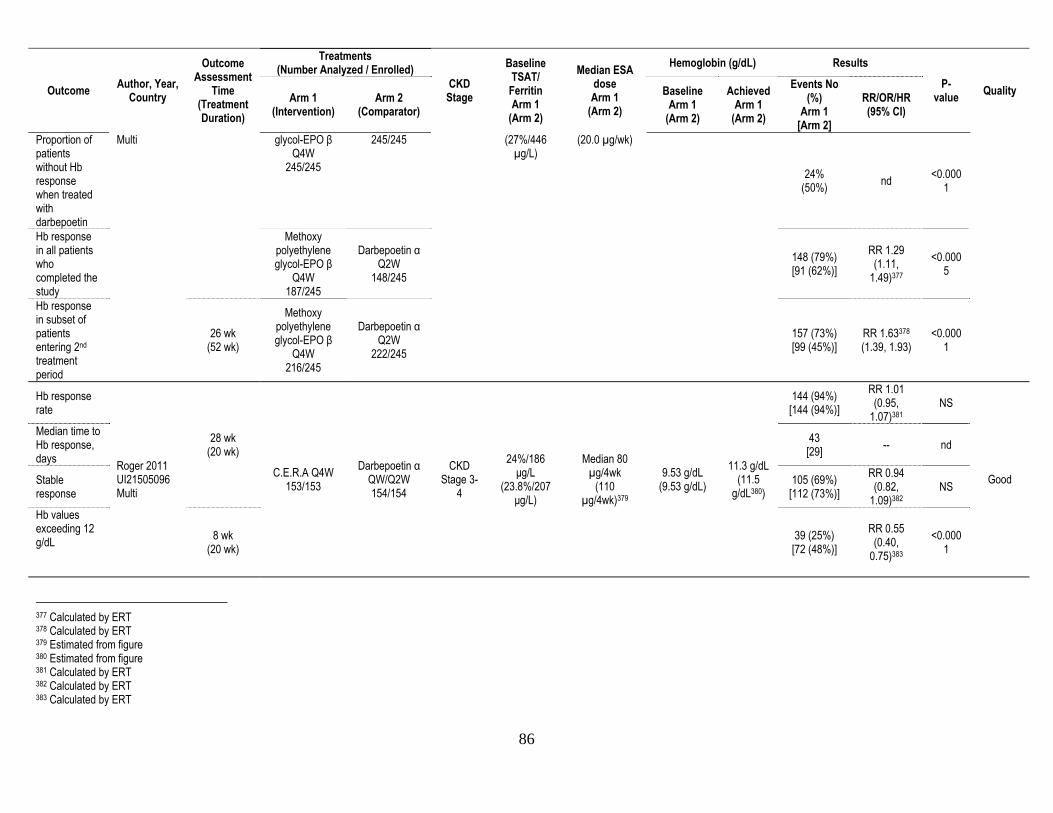
86
Outcome Author, Year, Country
Outcome Assessment
Time (Treatment Duration)
Treatments (Number Analyzed / Enrolled)
CKD Stage
Baseline TSAT/ Ferritin Arm 1
(Arm 2)
Median ESA dose Arm 1
(Arm 2)
Hemoglobin (g/dL) Results P-
value Quality Arm 1 (Intervention)
Arm 2 (Comparator)
Baseline Arm 1
(Arm 2)
Achieved Arm 1
(Arm 2)
Events No (%)
Arm 1 [Arm 2]
RR/OR/HR (95% CI)
Proportion of patients without Hb response when treated with darbepoetin
Multi glycol-EPO β Q4W
245/245
245/245 (27%/446 µg/L)
(20.0 µg/wk)
24% (50%) nd <0.000
1
Hb response in all patients who completed the study
Methoxy polyethylene glycol-EPO β
Q4W 187/245
Darbepoetin α Q2W
148/245 148 (79%) [91 (62%)]
RR 1.29 (1.11,
1.49)377 <0.000
5
Hb response in subset of patients entering 2nd treatment period
26 wk (52 wk)
Methoxy polyethylene glycol-EPO β
Q4W 216/245
Darbepoetin α Q2W
222/245 157 (73%) [99 (45%)]
RR 1.63378 (1.39, 1.93)
<0.0001
Hb response rate
Roger 2011 UI21505096 Multi
28 wk (20 wk)
C.E.R.A Q4W 153/153
Darbepoetin α QW/Q2W 154/154
CKD Stage 3-
4
24%/186 μg/L
(23.8%/207 μg/L)
Median 80 µg/4wk
(110 µg/4wk)379
9.53 g/dL (9.53 g/dL)
11.3 g/dL (11.5
g/dL380)
144 (94%) [144 (94%)]
RR 1.01 (0.95,
1.07)381 NS
Good
Median time to Hb response, days
43 [29] -- nd
Stable response
105 (69%) [112 (73%)]
RR 0.94 (0.82,
1.09)382 NS
Hb values exceeding 12 g/dL
8 wk (20 wk)
39 (25%) [72 (48%)]
RR 0.55 (0.40,
0.75)383 <0.000
1
377 Calculated by ERT 378 Calculated by ERT 379 Estimated from figure 380 Estimated from figure 381 Calculated by ERT 382 Calculated by ERT 383 Calculated by ERT

87
Outcome Author, Year, Country
Outcome Assessment
Time (Treatment Duration)
Treatments (Number Analyzed / Enrolled)
CKD Stage
Baseline TSAT/ Ferritin Arm 1
(Arm 2)
Median ESA dose Arm 1
(Arm 2)
Hemoglobin (g/dL) Results P-
value Quality Arm 1 (Intervention)
Arm 2 (Comparator)
Baseline Arm 1
(Arm 2)
Achieved Arm 1
(Arm 2)
Events No (%)
Arm 1 [Arm 2]
RR/OR/HR (95% CI)
ESA dose Required dose change to achieve stable Hb
Roger 2011 UI21505096 Multi
28 wk (20 wk)
C.E.R.A Q4W 153/153
Darbepoetin α QW/Q2W 154/154
CKD Stage 3-
4
24%/186 μg/L
(23.8%/207 μg/L)
Median 80 µg/4wk
(110 µg/4wk)384
9.53 g/dL (9.53 g/dL)
11.3 g/dL (11.5
g/dL385)
65 (62%) [64 (57%)]
RR 1.02 (0.79,
1.33)386 NS
Good Mean number of dose changes per patient
1.12 [1.10] -- nd
Multiple dose adjustments
10.7% [21.3%] -- nd
C.E.R.A vs. C.E.R.A. Mortality
Death [safety]
Kessler 2010 UI19888948 Multi
53 wk (53 wk)
C.E.R.A. Q2W 73/73
C.E.R.A. Q4W 72/72
CKD Stage 3-
4
≥20%/≥100 ng/mL
(≥20%/≥100 ng/mL)
Median IQR range
0.17 µg/kg/wk (0.22
µg/kg/wk)
8-11 g/dL (8-11g/dL)
11.92 (11.70)
2 (2%) [1 (1%)]
RR 1.97 (0.18,
21.28)387 NS
(0.576) Fair
Transfusion
Transfusions [safety]
Kessler 2010 UI19888948 Multi
53 wk (53 wk)
C.E.R.A. Q2W 73/73
C.E.R.A. Q4W 72/72
CKD Stage 3-
4
≥20%/≥100 ng/mL
(≥20%/≥100 ng/mL)
Median IQR range
0.17 µg/kg/wk (0.22
µg/kg/wk)
8-11 g/dL (8-11g/dL)
11.92 (11.70)
2 (3%) [0 (0%)] nd nd Fair
Hb Hb levels maintained within ±1 g/dL of the response value [ITT]
Kessler 2010 UI19888948 Multi
53 wk (53 wk)
C.E.R.A. Q2W 73/73
C.E.R.A. Q4W 72/72
CKD Stage 3-
4
≥20%/≥100 ng/mL
(≥20%/≥100 ng/mL)
Median IQR range
0.17 µg/kg/wk (0.22
µg/kg/wk)
8-11 g/dL (8-11g/dL)
11.92 (11.70)
55 (76%) [50 (70%)]
RR 1.08 (0.89,
1.33)388 NS
(0.428) Fair
384 Estimated from figure 385 Estimated from figure 386 Calculated by ERT 387 Calculated by ERT 388 Calculated by ERT
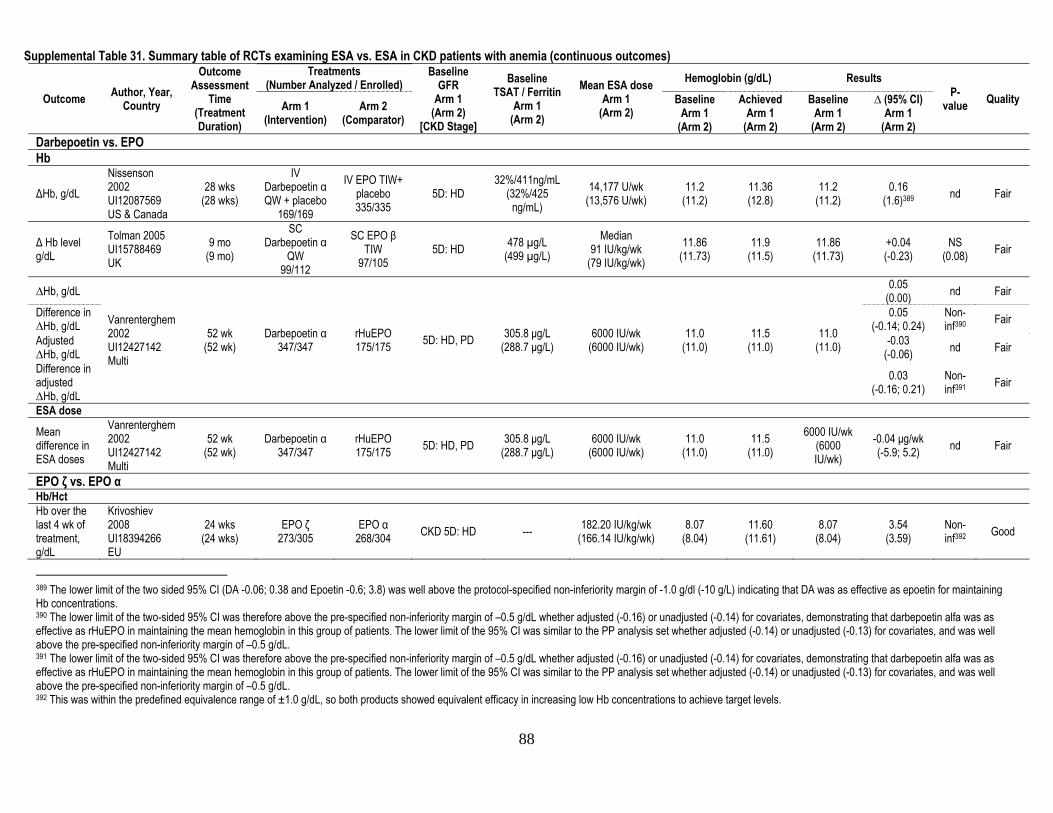
88
Supplemental Table 31. Summary table of RCTs examining ESA vs. ESA in CKD patients with anemia (continuous outcomes)
Outcome Author, Year, Country
Outcome Assessment
Time (Treatment Duration)
Treatments (Number Analyzed / Enrolled)
Baseline GFR
Arm 1 (Arm 2)
[CKD Stage]
Baseline TSAT / Ferritin
Arm 1 (Arm 2)
Mean ESA dose Arm 1
(Arm 2)
Hemoglobin (g/dL) Results P-
value Quality Arm 1 (Intervention)
Arm 2 (Comparator)
Baseline Arm 1
(Arm 2)
Achieved Arm 1
(Arm 2)
Baseline Arm 1
(Arm 2)
∆ (95% CI) Arm 1
(Arm 2) Darbepoetin vs. EPO Hb
ΔHb, g/dL Nissenson 2002 UI12087569 US & Canada
28 wks (28 wks)
IV Darbepoetin α QW + placebo
169/169
IV EPO TIW+ placebo 335/335
5D: HD 32%/411ng/mL
(32%/425 ng/mL)
14,177 U/wk (13,576 U/wk)
11.2 (11.2)
11.36 (12.8)
11.2 (11.2)
0.16 (1.6)389 nd Fair
Δ Hb level g/dL
Tolman 2005 UI15788469 UK
9 mo (9 mo)
SC Darbepoetin α
QW 99/112
SC EPO β TIW
97/105 5D: HD 478 µg/L
(499 µg/L) Median
91 IU/kg/wk (79 IU/kg/wk)
11.86 (11.73)
11.9 (11.5)
11.86 (11.73)
+0.04 (-0.23)
NS (0.08) Fair
∆Hb, g/dL
Vanrenterghem 2002 UI12427142 Multi
52 wk (52 wk)
Darbepoetin α 347/347
rHuEPO 175/175 5D: HD, PD 305.8 μg/L
(288.7 μg/L) 6000 IU/wk
(6000 IU/wk) 11.0
(11.0) 11.5
(11.0) 11.0
(11.0)
0.05 (0.00) nd Fair
Difference in ∆Hb, g/dL
0.05 (-0.14; 0.24)
Non-inf390 Fair
Adjusted ∆Hb, g/dL
-0.03 (-0.06) nd Fair
Difference in adjusted ∆Hb, g/dL
0.03 (-0.16; 0.21)
Non-inf391 Fair
ESA dose
Mean difference in ESA doses
Vanrenterghem 2002 UI12427142 Multi
52 wk (52 wk)
Darbepoetin α 347/347
rHuEPO 175/175 5D: HD, PD 305.8 μg/L
(288.7 μg/L) 6000 IU/wk
(6000 IU/wk) 11.0
(11.0) 11.5
(11.0) 6000 IU/wk
(6000 IU/wk)
-0.04 μg/wk (-5.9; 5.2) nd Fair
EPO ζ vs. EPO α Hb/Hct Hb over the last 4 wk of treatment, g/dL
Krivoshiev 2008 UI18394266 EU
24 wks (24 wks)
EPO ζ 273/305
EPO α 268/304 CKD 5D: HD --- 182.20 IU/kg/wk
(166.14 IU/kg/wk) 8.07
(8.04) 11.60
(11.61) 8.07
(8.04) 3.54
(3.59) Non-inf392 Good
389 The lower limit of the two sided 95% CI (DA -0.06; 0.38 and Epoetin -0.6; 3.8) was well above the protocol-specified non-inferiority margin of -1.0 g/dl (-10 g/L) indicating that DA was as effective as epoetin for maintaining Hb concentrations. 390 The lower limit of the two-sided 95% CI was therefore above the pre-specified non-inferiority margin of –0.5 g/dL whether adjusted (-0.16) or unadjusted (-0.14) for covariates, demonstrating that darbepoetin alfa was as effective as rHuEPO in maintaining the mean hemoglobin in this group of patients. The lower limit of the 95% CI was similar to the PP analysis set whether adjusted (-0.14) or unadjusted (-0.13) for covariates, and was well above the pre-specified non-inferiority margin of –0.5 g/dL. 391 The lower limit of the two-sided 95% CI was therefore above the pre-specified non-inferiority margin of –0.5 g/dL whether adjusted (-0.16) or unadjusted (-0.14) for covariates, demonstrating that darbepoetin alfa was as effective as rHuEPO in maintaining the mean hemoglobin in this group of patients. The lower limit of the 95% CI was similar to the PP analysis set whether adjusted (-0.14) or unadjusted (-0.13) for covariates, and was well above the pre-specified non-inferiority margin of –0.5 g/dL. 392 This was within the predefined equivalence range of ±1.0 g/dL, so both products showed equivalent efficacy in increasing low Hb concentrations to achieve target levels.

89
Outcome Author, Year, Country
Outcome Assessment
Time (Treatment Duration)
Treatments (Number Analyzed / Enrolled)
Baseline GFR
Arm 1 (Arm 2)
[CKD Stage]
Baseline TSAT / Ferritin
Arm 1 (Arm 2)
Mean ESA dose Arm 1
(Arm 2)
Hemoglobin (g/dL) Results P-
value Quality Arm 1 (Intervention)
Arm 2 (Comparator)
Baseline Arm 1
(Arm 2)
Achieved Arm 1
(Arm 2)
Baseline Arm 1
(Arm 2)
∆ (95% CI) Arm 1
(Arm 2)
Hb, g/dL
Wizemann 2008 UI18208642 Germany & Poland
24 wk (24 wk)
EPO ζ -EPO α
121/155
EPO α -EPO ζ
118/155 CKD 5D: HD --- --- 11.6
(11.7) 11.35
(11.54)
11.6 (11.7)
-0.25 (-0.16) --- Good
95% CI of intra-individual difference of Hb
Equivalence range +/-0.6 0.09; 0.28 Non-
inf393 Good
Hct 34.3 (34.4)
0 (+0.47) --- Good
Hb, g/dL [PP]
Krivoshiev 2010 UI20369312 Multi
28 wks (28 wks)
EPO ζ 154/232
EPO α 165/230 CKD 5D: HD nd
97.0 IU/kg/wk (86.0
IU/kg/wk) 10.56
(10.40) 10.94
(11.02) 10.56
(10.40) +0.38
(+0.62) nd Good
ESA dose EPO ζ dose over last 4 wks of treatment, IU/kg/wk
Krivoshiev 2008 UI18394266 EU
24 wks (24 wks)
EPO ζ 273/305
EPO α 268/304 CKD 5D: HD --- 182.20 IU/kg/wk
(166.14 IU/kg/wk) 8.07
(8.04) 11.60
(11.61) --- 182.20 [166.14]
Non-inf394 Good
Weekly EPO dose, IU/kg/wk Wizemann
2008 UI18208642 Germany & Poland
24 wk (24 wk)
EPO ζ -EPO α
121/155
EPO α -EPO ζ
118/155 CKD 5D: HD --- --- 11.6
(11.7) 11.35
(11.54)
--- 92.68 (92.58) --- Good
95% CI of intra-individual difference of EPO dose
Equivalence range +/-45 -4.67; 4.29 Non-
inf395 Good
EPO θ vs. EPO β
Hb, g/dL Gertz, 2010 UI20812790 Multi
13-24 wk (24 wk)
EPO θ 180/180
EPO β 90/90 CKD 5D: HD nd 102.5 IU/kg
(97.5 IU/kg) 10.87
(10.87) 10.60
(10.66) 10.87
(10.87)
-0.27 (-0.20)
[Net: -0.08 (-0.30, 0.14)]
NS (0.46) Good
HX575 vs. EPO α Hb
393 Level 1 of the strategy was the calculation of the 95% confidence interval (CI) of the intra-individual difference (epoetin zeta compared with epoetin alfa) of the mean Hb level during double-blind treatment with each study drug, and comparison with the predefined acceptance range (± 0.6 g/dL). 394 These values were within the range of ±45 IU/kg/wk, which takes into account TIW dosing with the minimum clinically effective dose (15IU/kg) 395 The statistical tests for dose equivalence assumed that a difference in dose of <15 IU/kg would not be clinically significant. This was based on evidence from epoetin alfa dose–response trials that have shown that a dose of 15 IU/kg, administered three times per week, is close to the no-effect dose. On this basis, the equivalence margin was defined as ±45 IU/kg/wk
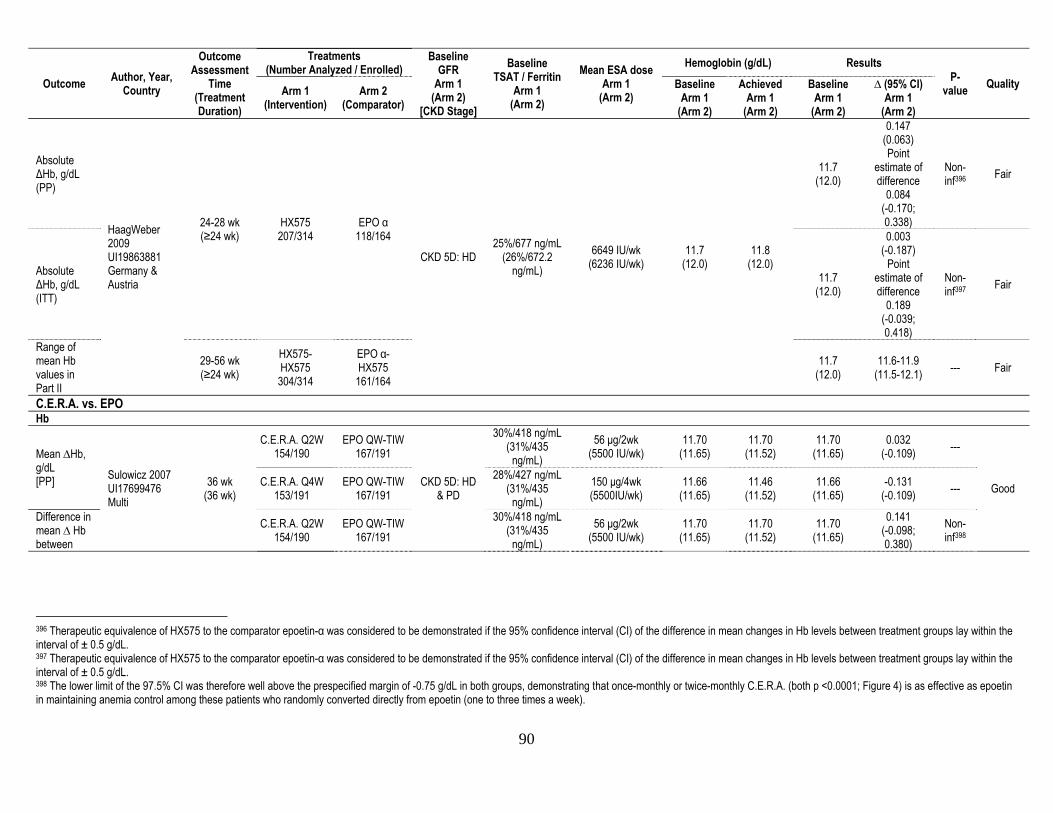
90
Outcome Author, Year, Country
Outcome Assessment
Time (Treatment Duration)
Treatments (Number Analyzed / Enrolled)
Baseline GFR
Arm 1 (Arm 2)
[CKD Stage]
Baseline TSAT / Ferritin
Arm 1 (Arm 2)
Mean ESA dose Arm 1
(Arm 2)
Hemoglobin (g/dL) Results P-
value Quality Arm 1 (Intervention)
Arm 2 (Comparator)
Baseline Arm 1
(Arm 2)
Achieved Arm 1
(Arm 2)
Baseline Arm 1
(Arm 2)
∆ (95% CI) Arm 1
(Arm 2)
Absolute ΔHb, g/dL (PP)
HaagWeber 2009 UI19863881 Germany & Austria
24-28 wk (≥24 wk)
HX575 207/314
EPO α 118/164
CKD 5D: HD 25%/677 ng/mL
(26%/672.2 ng/mL)
6649 IU/wk (6236 IU/wk)
11.7 (12.0)
11.8 (12.0)
11.7 (12.0)
0.147 (0.063) Point
estimate of difference
0.084 (-0.170; 0.338)
Non-inf396 Fair
Absolute ΔHb, g/dL (ITT)
11.7 (12.0)
0.003 (-0.187)
Point estimate of difference
0.189 (-0.039; 0.418)
Non-inf397 Fair
Range of mean Hb values in Part II
29-56 wk (≥24 wk)
HX575-HX575 304/314
EPO α-HX575
161/164 11.7
(12.0) 11.6-11.9
(11.5-12.1) --- Fair
C.E.R.A. vs. EPO Hb
Mean ∆Hb, g/dL [PP] Sulowicz 2007
UI17699476 Multi
36 wk (36 wk)
C.E.R.A. Q2W 154/190
EPO QW-TIW 167/191
CKD 5D: HD & PD
30%/418 ng/mL (31%/435
ng/mL) 56 μg/2wk
(5500 IU/wk) 11.70
(11.65) 11.70
(11.52) 11.70
(11.65) 0.032
(-0.109) ---
Good C.E.R.A. Q4W 153/191
EPO QW-TIW 167/191
28%/427 ng/mL (31%/435
ng/mL) 150 μg/4wk (5500IU/wk)
11.66 (11.65)
11.46 (11.52)
11.66 (11.65)
-0.131 (-0.109) ---
Difference in mean ∆ Hb between
C.E.R.A. Q2W 154/190
EPO QW-TIW 167/191
30%/418 ng/mL (31%/435
ng/mL) 56 μg/2wk
(5500 IU/wk) 11.70
(11.65) 11.70
(11.52) 11.70
(11.65) 0.141
(-0.098; 0.380)
Non-inf398
396 Therapeutic equivalence of HX575 to the comparator epoetin-α was considered to be demonstrated if the 95% confidence interval (CI) of the difference in mean changes in Hb levels between treatment groups lay within the interval of ± 0.5 g/dL. 397 Therapeutic equivalence of HX575 to the comparator epoetin-α was considered to be demonstrated if the 95% confidence interval (CI) of the difference in mean changes in Hb levels between treatment groups lay within the interval of ± 0.5 g/dL. 398 The lower limit of the 97.5% CI was therefore well above the prespecified margin of -0.75 g/dL in both groups, demonstrating that once-monthly or twice-monthly C.E.R.A. (both p <0.0001; Figure 4) is as effective as epoetin in maintaining anemia control among these patients who randomly converted directly from epoetin (one to three times a week).

91
Outcome Author, Year, Country
Outcome Assessment
Time (Treatment Duration)
Treatments (Number Analyzed / Enrolled)
Baseline GFR
Arm 1 (Arm 2)
[CKD Stage]
Baseline TSAT / Ferritin
Arm 1 (Arm 2)
Mean ESA dose Arm 1
(Arm 2)
Hemoglobin (g/dL) Results P-
value Quality Arm 1 (Intervention)
Arm 2 (Comparator)
Baseline Arm 1
(Arm 2)
Achieved Arm 1
(Arm 2)
Baseline Arm 1
(Arm 2)
∆ (95% CI) Arm 1
(Arm 2) groups C.E.R.A. Q4W
153/191 EPO QW-TIW
167/191 28%/427 ng/mL
(31%/435 ng/mL)
150 μg/4wk (5500IU/wk)
11.66 (11.65)
11.46 (11.52)
11.66 (11.65)
-0.022 (-0.262; 0.217)
Non-inf399
Mean ∆Hb, g/dL [PP]
Levin 2007 UI17950856 Multi
29-36 wk (52 wk)
Methoxy polyethylene glycol-EPO β
Q2W 118/223
EPO QW-TIW 180/226
CKD 5D: HD & PD
27%/453 µg/L
(31%/ 505 µg/L)
100 µg/2wk (9600 IU/wk)
11.97 (11.91)
11.80 (11.82)
100 µg/2wk (9600 IU/wk)
-0..071 (-0.075)
Non-inf400
Good Methoxy polyethylene glycol-EPO β
Q4W 172/224
EPO QW-TIW 180/226
28%/522 µg/L
(31%/ 505 µg/L)
200 µg/4wk (9600 IU/wk)
11.85 (11.91)
11.61 (11.82)
200 µg/4wk (9600 IU/wk)
-0.025 (-0.075)
Non-inf401
ESA dose
Median ESA dose
Sulowicz 2007 UI17699476 Multi
36 wk (36 wk)
C.E.R.A. Q2W 154/190
EPO QW-TIW 167/191
CKD 5D: HD & PD
30.45%/417.75 ng/mL
(30.50%/435 ng/mL)
56 μg/2wk (5500 IU/wk)
11.70 (11.65)
11.70 (11.52)
60 μg/2wk (6000 IU/wk)
-4 μg/2wk (-500 IU/wk) ---
Good
C.E.R.A. Q4W 153/191
EPO QW-TIW 167/191
27.55%/426.50 ng/mL
(30.50%/435 ng/mL)
150 μg/4wk (5500IU/wk)
11.66 (11.65)
11.46 (11.52)
120 μg/4wk (6000 IU/wk)
+30 μg/4wk (-500 IU/wk) ---
Median ESA dose
Levin 2007 UI17950856 Multi
29-36 wk (52 wk)
Methoxy polyethylene glycol-EPO β
Q2W 196/223
EPO QW-TIW 205/226
CKD 5D: HD & PD
27%/453 µg/L
(31%/ 505 µg/L)
100 µg/2wk (9600 IU/wk)
11.97 (11.91)
11.80 (11.82)
100 µg/2wk (9600 IU/wk)
-43 µg/2wk (+1200 IU/wk)
--
Good Methoxy polyethylene glycol-EPO β
Q4W 188/224
EPO QW-TIW 205/226
28%/522 µg/L
(31%/ 505 µg/L)
200 µg/4wk (9600 IU/wk)
11.85 (11.91)
11.61 (11.82)
200 µg/4wk (9600 IU/wk)
-25 µg/4wk (+1200 IU/wk)
--
C.E.R.A. vs. Darbepoetin α QoL
399 The lower limit of the 97.5% CI was therefore well above the prespecified margin of -0.75 g/dL in both groups, demonstrating that once-monthly or twice-monthly C.E.R.A. (both p <0.0001; Figure 4) is as effective as epoetin in maintaining anemia control among these patients who randomly converted directly from epoetin (one to three times a week). 400 The lower limit of the 97.5% CI was above the prespecifi ed concentration of –0.75 g/dL for both groups given methoxy polyethylene glycol-epoetin beta, indicating that this treatment was as effective as conventional epoetin treament for maintenance of haemoglobin in this population (p<0·0001 for both comparisons). This analysis was robust for the intention-to-treat and per-protocol populations (p<0·0001 for both comparisons). 401 The lower limit of the 97.5% CI was above the prespecifi ed concentration of –0.75 g/dL for both groups given methoxy polyethylene glycol-epoetin beta, indicating that this treatment was as effective as conventional epoetin treament for maintenance of haemoglobin in this population (p<0·0001 for both comparisons). This analysis was robust for the intention-to-treat and per-protocol populations (p<0·0001 for both comparisons).

92
Outcome Author, Year, Country
Outcome Assessment
Time (Treatment Duration)
Treatments (Number Analyzed / Enrolled)
Baseline GFR
Arm 1 (Arm 2)
[CKD Stage]
Baseline TSAT / Ferritin
Arm 1 (Arm 2)
Mean ESA dose Arm 1
(Arm 2)
Hemoglobin (g/dL) Results P-
value Quality Arm 1 (Intervention)
Arm 2 (Comparator)
Baseline Arm 1
(Arm 2)
Achieved Arm 1
(Arm 2)
Baseline Arm 1
(Arm 2)
∆ (95% CI) Arm 1
(Arm 2) ∆Physical functioning
Macdougall 2008 UI18287255 Multi
28 wks (28 wks)
C.E.R.A. Q2W 162/162
Darbepoetin α QW
162/162 CKD 3-4 24%/175 μg/L
(24%/186 μg/L) 0.34 μg/kg
(0.19 μg/kg) 10.2 (10.2)
12.18 (12.01)
--- 4.0 (3.0)402 --- Fair
∆Physical role --- 3.5
(9.5)403 --- Fair
∆Body pain --- 1.0 (2.0)404 --- Fair
∆General health --- 6.0405
(4.0)406 --- Fair
∆Physical component score
--- 0.5 (1.0)407 --- Fair
∆Vitality --- 7.0408 (11.0)409 --- Fair
∆Emotional role --- 5.5410
(7.0)411 --- Fair
∆Social functioning --- 5.0412
(4.0)413 --- Fair
∆Mental health --- 2.0
(4.0)414 --- Fair
∆Mental component score
--- 2.0 (3.0)415 --- Fair
Hb ∆Hb, g/dL [PP]
Canaud 2008 UI18586762
52 wk (52 wk)
C.E.R.A. 157/157
Darbepoetin α 156/156 CKD 5D 28%/nd
(28%/nd) 0.35 µg/kg/wk
(0.44 µg/kg/wk) 12.0
(11.9) 12.1
(11.8) 12.0
(11.9) 0.06
(-0.12) --- Fair
402 Estimated from graph 403 Clinically meaningful improvement in DA arm from baseline to weeks 29 (an increase of ≥5 points) 404 Estimated from graph 405 Clinically meaningful improvement in C.E.R.A. arm from baseline to weeks 29 (an increase of ≥5 points) 406 Estimated from graph 407 Estimated from graph 408 Clinically meaningful improvement in C.E.R.A. arm from baseline to weeks 29 (n increase of ≥5 points) 409 Clinically meaningful improvement in DA arm from baseline to weeks 29 (n increase of ≥5 points) 410 Clinically meaningful improvement in C.E.R.A. arm from baseline to weeks 29 (n increase of ≥5 points) 411 Clinically meaningful improvement in DA arm from baseline to weeks 29 (n increase of ≥5 points) 412 Clinically meaningful improvement in C.E.R.A. arm from baseline to weeks 29 (n increase of ≥5 points) 413 Estimated from graph 414 Estimated from graph 415 Estimated from graph
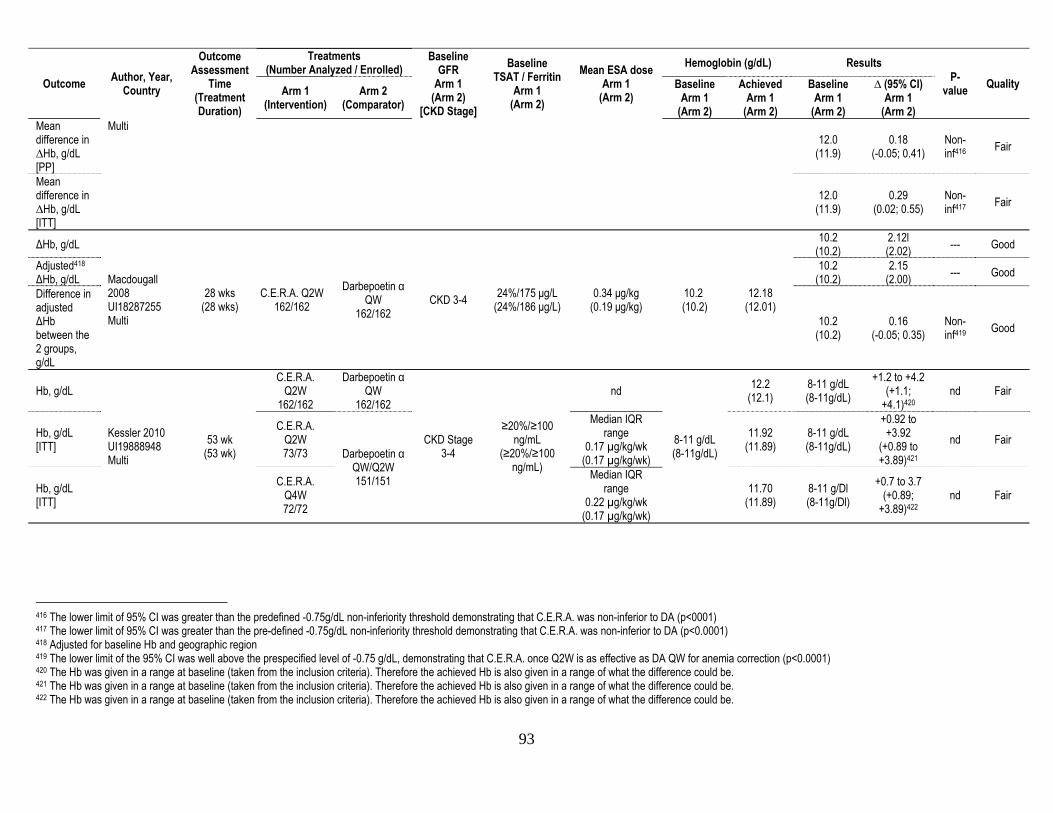
93
Outcome Author, Year, Country
Outcome Assessment
Time (Treatment Duration)
Treatments (Number Analyzed / Enrolled)
Baseline GFR
Arm 1 (Arm 2)
[CKD Stage]
Baseline TSAT / Ferritin
Arm 1 (Arm 2)
Mean ESA dose Arm 1
(Arm 2)
Hemoglobin (g/dL) Results P-
value Quality Arm 1 (Intervention)
Arm 2 (Comparator)
Baseline Arm 1
(Arm 2)
Achieved Arm 1
(Arm 2)
Baseline Arm 1
(Arm 2)
∆ (95% CI) Arm 1
(Arm 2) Mean difference in ∆Hb, g/dL [PP]
Multi 12.0
(11.9) 0.18
(-0.05; 0.41) Non-inf416 Fair
Mean difference in ∆Hb, g/dL [ITT]
12.0 (11.9)
0.29 (0.02; 0.55)
Non-inf417 Fair
ΔHb, g/dL
Macdougall 2008 UI18287255 Multi
28 wks (28 wks)
C.E.R.A. Q2W 162/162
Darbepoetin α QW
162/162 CKD 3-4 24%/175 μg/L
(24%/186 μg/L) 0.34 μg/kg
(0.19 μg/kg) 10.2 (10.2)
12.18 (12.01)
10.2 (10.2)
2.12l (2.02) --- Good
Adjusted418 ΔHb, g/dL
10.2 (10.2)
2.15 (2.00) --- Good
Difference in adjusted ΔHb between the 2 groups, g/dL
10.2 (10.2)
0.16 (-0.05; 0.35)
Non-inf419 Good
Hb, g/dL
Kessler 2010 UI19888948 Multi
53 wk (53 wk)
C.E.R.A. Q2W
162/162
Darbepoetin α QW
162/162
CKD Stage 3-4
≥20%/≥100 ng/mL
(≥20%/≥100 ng/mL)
nd
8-11 g/dL (8-11g/dL)
12.2 (12.1)
8-11 g/dL (8-11g/dL)
+1.2 to +4.2 (+1.1;
+4.1)420 nd Fair
Hb, g/dL [ITT]
C.E.R.A. Q2W 73/73 Darbepoetin α
QW/Q2W 151/151
Median IQR range
0.17 µg/kg/wk (0.17 µg/kg/wk)
11.92 (11.89)
8-11 g/dL (8-11g/dL)
+0.92 to +3.92
(+0.89 to +3.89)421
nd Fair
Hb, g/dL [ITT]
C.E.R.A. Q4W 72/72
Median IQR range
0.22 µg/kg/wk (0.17 µg/kg/wk)
11.70 (11.89)
8-11 g/Dl (8-11g/Dl)
+0.7 to 3.7 (+0.89;
+3.89)422 nd Fair
416 The lower limit of 95% CI was greater than the predefined -0.75g/dL non-inferiority threshold demonstrating that C.E.R.A. was non-inferior to DA (p<0001) 417 The lower limit of 95% CI was greater than the pre-defined -0.75g/dL non-inferiority threshold demonstrating that C.E.R.A. was non-inferior to DA (p<0.0001) 418 Adjusted for baseline Hb and geographic region 419 The lower limit of the 95% CI was well above the prespecified level of -0.75 g/dL, demonstrating that C.E.R.A. once Q2W is as effective as DA QW for anemia correction (p<0.0001) 420 The Hb was given in a range at baseline (taken from the inclusion criteria). Therefore the achieved Hb is also given in a range of what the difference could be. 421 The Hb was given in a range at baseline (taken from the inclusion criteria). Therefore the achieved Hb is also given in a range of what the difference could be. 422 The Hb was given in a range at baseline (taken from the inclusion criteria). Therefore the achieved Hb is also given in a range of what the difference could be.

94
Outcome Author, Year, Country
Outcome Assessment
Time (Treatment Duration)
Treatments (Number Analyzed / Enrolled)
Baseline GFR
Arm 1 (Arm 2)
[CKD Stage]
Baseline TSAT / Ferritin
Arm 1 (Arm 2)
Mean ESA dose Arm 1
(Arm 2)
Hemoglobin (g/dL) Results P-
value Quality Arm 1 (Intervention)
Arm 2 (Comparator)
Baseline Arm 1
(Arm 2)
Achieved Arm 1
(Arm 2)
Baseline Arm 1
(Arm 2)
∆ (95% CI) Arm 1
(Arm 2)
Hb, g/dL Carrera 2010 UI20522670 Multi
14 wk (52 wk)
Methoxy polyethylene glycol-EPO β
Q4W 245/245
Darbepoetin α QW
245/245 CKD Stage
5D: HD 27%/427 µg/L
(27%/446 µg/L) Median 30.0
µg/wk (20.0 µg/wk)
12.09 g/dL (12.07 g/dL)
11.8 (10.7)
12.09 (12.07)
-0.99 (-0.87) nd Good
∆Hb over time Roger 2011
UI21505096 Multi
28 wk (20 wk)
C.E.R.A Q4W 153/153
Darbepoetin α QW/Q2W 154/154
CKD Stage 3-4
24%/186 μg/L (23.8%/207
μg/L)
Median 80 µg/4wk
(110 µg/4wk)423 9.53 g/dL
(9.53 g/dL) 11.3 g/dL
(11.5 g/dL424)
9.53 (9.53)
1.62 (1.66)425
Non-inf 426
Good Mean increase in Hb, g/dL/wk
0.20 (0.27) nd
ESA dose
∆ Mean monthly dose, %
Carrera 2010 UI20522670 Multi
52 wk (52 wk)
Methoxy polyethylene glycol-EPO β
Q4W 211/245
Darbepoetin α QW
219/245 CKD Stage
5D: HD 27%/427 µg/L
(27%/446 µg/L) Median 30.0
µg/wk (20.0 µg/wk)
12.09 g/dL (12.07 g/dL)
11.8 (10.7)
159.38 (64.85)
6.8 (58.8) nd Good
∆Median dose from baseline to evaluation
Roger 2011 UI21505096 Multi
28 wk (20 wk)
C.E.R.A Q4W 153/153
Darbepoetin α QW/Q2W 154/154
CKD Stage 3-4
24%/186 μg/L (23.8%/207
μg/L)
Median 80 µg/4wk
(110 µg/4wk)427 9.53 g/dL
(9.53 g/dL) 11.3 g/dL
(11.5 g/dL428)
80 (110)
6.6% (35.6%) nd Good
C.E.R.A vs. C.E.R.A. Hb
Hb, g/dL [ITT]
Kessler 2010 UI19888948 Multi
53 wk (53 wk)
C.E.R.A. Q2W 73/73
C.E.R.A. Q4W 72/72
CKD Stage 3-4
≥20%/≥100 ng/mL
(≥20%/≥100 ng/mL)
Median IQR range
0.17 µg/kg/wk (0.22 µg/kg/wk)
8-11 g/dL (8-11g/dL)
11.92 (11.70)
8-11 g/dL (8-11g/dL)
+0.92 to +3.92
(+0.7; 3.7)429 nd Fair
423 Estimated from figure 424 Estimated from figure 425 Between-group treatment difference of -0.036 g/dL 426 The lower limit of the 95% CI for the group difference was -0.25 g/dL, which was above the protocol-specified non-inferiority limit of -0.75, demonstrating that C.E.R.A. was statistically non-inferior to darbepoetin alfa (P < 0.0001). 427 Estimated from figure 428 Estimated from figure 429 The Hb was given in a range at baseline (taken from the inclusion criteria). Therefore the achieved Hb is also given in a range of what the difference could be.

95
Supplemental Table 32. Summary table of adverse events in RCTs examining ESA vs. ESA in CKD patients with anemia (categorical outcomes)
Adverse Event Author, Year, Country
Outcome Assessment
Time (Treatment Duration)
Treatments (Number Analyzed / Enrolled)
Baseline GFR
Arm 1 (Arm 2)
[CKD Stage]
Baseline TSAT / Ferritin Arm 1
(Arm 2)
Mean ESA dose Arm 1
(Arm 2)
Hemoglobin (g/dL) Results P-value Arm 1
(Intervention) Arm 2
(Comparator) Baseline
Arm 1 (Arm 2)
Achieved Arm 1
(Arm 2) Definition
Events No (%) Arm 1
[Arm 2] Darbepoetin vs. EPO
AEs
Nissenson 2002 UI12087569 US & Canada
28 wks (28 wks)
IV Darbepoetin α QW + placebo
169/169
IV EPO TIW+ placebo 335/335
5D: HD 32%/411ng/mL (32%/425 ng/mL)
14,177 U/wk (13,576 U/wk)
11.2 (11.2)
11.36 (12.8)
AE occurring in at 10% of the
patients 158 (94%)
[332 (99%)] 0.005
HTN nd 48 (28%) [80 (24%)] NS
Drug D/C Did not
complete the study
48 (28%) [94 (28%)] NS
Thrombosis, vascular access nd 27 (16%)
[59 (18%)] NS
Drug D/C Tolman 2005 UI15788469 UK
9 mo (9 mo)
SC Darbepoetin α
QW 87/112
SC EPO β TIW
82/105 5D: HD 478 µg/L
(499 µg/L) Median
91 IU/kg/wk (79 IU/kg/wk)
11.86 (11.73)
11.9 (11.5)
Withdrawal 1 (1%) [4 (5%)] NS
Hypertension Intercurrent hypertension
6 (7%) [7 (9%)] NS
At last one AE
Vanrenterghem 2002 UI12427142 Multi
52 wk (52 wk)
Darbepoetin α 347/347
rHuEPO 175/175 5D: HD, PD 305.8 μg/L
(288.7 μg/L) 6000 IU/wk
(6000 IU/wk) 11.0
(11.0) 11.5
(11.0)
nd 96% (95%) nd
Hypotension nd 39% (38%) nd
Myalgia nd 34% (36%) nd
HTN nd 30% (28%) nd
Pruritus nd 14% (5%) nd
Back pain nd 10% (16%) nd
EPO ζ vs. EPO α
Total AE Krivoshiev 2008 UI18394266 EU
24 wks (24 wks)
EPO ζ 300/305
EPO α 298/304 CKD 5D: HD --- 182.20 IU/kg/wk
(166.14 IU/kg/wk) 8.07
(8.04) 11.61
(11.63)
Emergent AE’s that occurred in ≥5% of the patients.
123 (40%) [114 (38%)] NS
AE leading to withdrawal
Withdrew because of AE
21 (7%) [15 (5%)] NS430
SAEs SAEs 54 (18%) [53 (17%)] NS431
430 Calculated by ERT 431 Calculated by ERT

96
Adverse Event Author, Year, Country
Outcome Assessment
Time (Treatment Duration)
Treatments (Number Analyzed / Enrolled)
Baseline GFR
Arm 1 (Arm 2)
[CKD Stage]
Baseline TSAT / Ferritin Arm 1
(Arm 2)
Mean ESA dose Arm 1
(Arm 2)
Hemoglobin (g/dL) Results P-value Arm 1
(Intervention) Arm 2
(Comparator) Baseline
Arm 1 (Arm 2)
Achieved Arm 1
(Arm 2) Definition
Events No (%) Arm 1
[Arm 2] Infections and infestations
Most commonly reported
38 (13%) [39 (13%)] NS432
Nervous systems disorder --- 17 (6%)
[10 (3%)] NS433
Vascular disorders --- 26 (9%)
[27 (9%)] NS434
HTN --- 20 (7%) [13 (4%)] NS435
GI disorders --- 16 (5%) [13 (4%)] NS436
Cardiac disorders
Wizemann 2008 UI18208642 Germany & Poland
24 wk (24 wk)
EPO ζ -EPO α
121/155 EPO α-EPO ζ
118/155 CKD 5D: HD --- --- 11.6 (11.7)
11.35 (11.54) --- 19 (6)
[17 (5%)] ---
Total AE [safety]
Krivoshiev 2010 UI20369312 Multi
28 wks (28 wks)
EPO ζ 232/232
EPO α 230/230 CKD 5D: HD nd
97.0 IU/kg/wk (86.0
IU/kg/wk) 10.56
(10.40) 10.94
(11.02)
All AEs that occurred in >5% of the patients
91 (39%) [92 (40%)]
NS (0.865437)
AE related to study drug [safety]
A relationship between study drug and event
could not be ruled out
5 (2%) [3 (1%)]
NS (0.488438)
SAEs [safety]
SAEs belonging mainly to
system organ classes of
surgical and medical
procedures
38 (16%) [30 (13%)]
NS (0.313439)
432 Calculated by ERT 433 Calculated by ERT 434 Calculated by ERT 435 Calculated by ERT 436 Calculated by ERT 437 Calculated by ERT 438 Calculated by ERT 439 Calculated by ERT

97
Adverse Event Author, Year, Country
Outcome Assessment
Time (Treatment Duration)
Treatments (Number Analyzed / Enrolled)
Baseline GFR
Arm 1 (Arm 2)
[CKD Stage]
Baseline TSAT / Ferritin Arm 1
(Arm 2)
Mean ESA dose Arm 1
(Arm 2)
Hemoglobin (g/dL) Results P-value Arm 1
(Intervention) Arm 2
(Comparator) Baseline
Arm 1 (Arm 2)
Achieved Arm 1
(Arm 2) Definition
Events No (%) Arm 1
[Arm 2] SAEs related to study medication [safety]
Possibly related to study drug administration
3 (3%) [1 (2%)]
NS (0.344440)
HTN [safety] Hypertensive crisis
6 (3%) [13 (6%)]
NS (0.107441)
Thrombolic event [safety] nd 9 (4%)
[4 (2%)] NS
(0.177442)
Stroke [safety] nd 9 (4%) [9 (4%)]
NS (0.985443)
MI [safety] nd 5 (2%) [9 (4%)]
NS (0.278444)
EPO θ vs. EPO β Withdrawal 2º AE
Gertz, 2010 UI20812790 Multi
24 wk (24 wk)
EPO θ 180/180
EPO β 90/90 CKD 5D: HD nd 102.5 IU/kg
(97.5 IU/kg) 10.87
(10.87) 10.60
(10.66)
nd 9 (5%) [6 (7%)] NS
Total nd 136 (76%) [73 (81%)] NS
Headache nd 21 (12%) [11 (12%)] NS
Muscle spasms nd 20 (11%) [15 (17%)] NS
Procedural hypotension nd 17 (9%)
14 (16%)] NS
Severe intensity AE nd 17 (9%)
[10 (11%)] NS
Cardiac disorders nd 8 (4%)
[5 (6%) NS
Adverse drug reactions nd445 39 (22%)
[20 (22%) NS
Serious AE nd 36 (20%) [20 (22%)] NS
Serious AE “related to study medication”
nd446 9 (5.0%) [5 (5.6%)] NS
440 Calculated by ERT 441 Calculated by ERT 442 Calculated by ERT 443 Calculated by ERT 444 Calculated by ERT 445 Most common: hypertension, headache, arteriovenous fistula thrombosis 446 Most common: arteriovenous fistula thrombosis, cardiac failure, “worsening of disease,” myocardial infarction, pneumonia, extremity necrosis
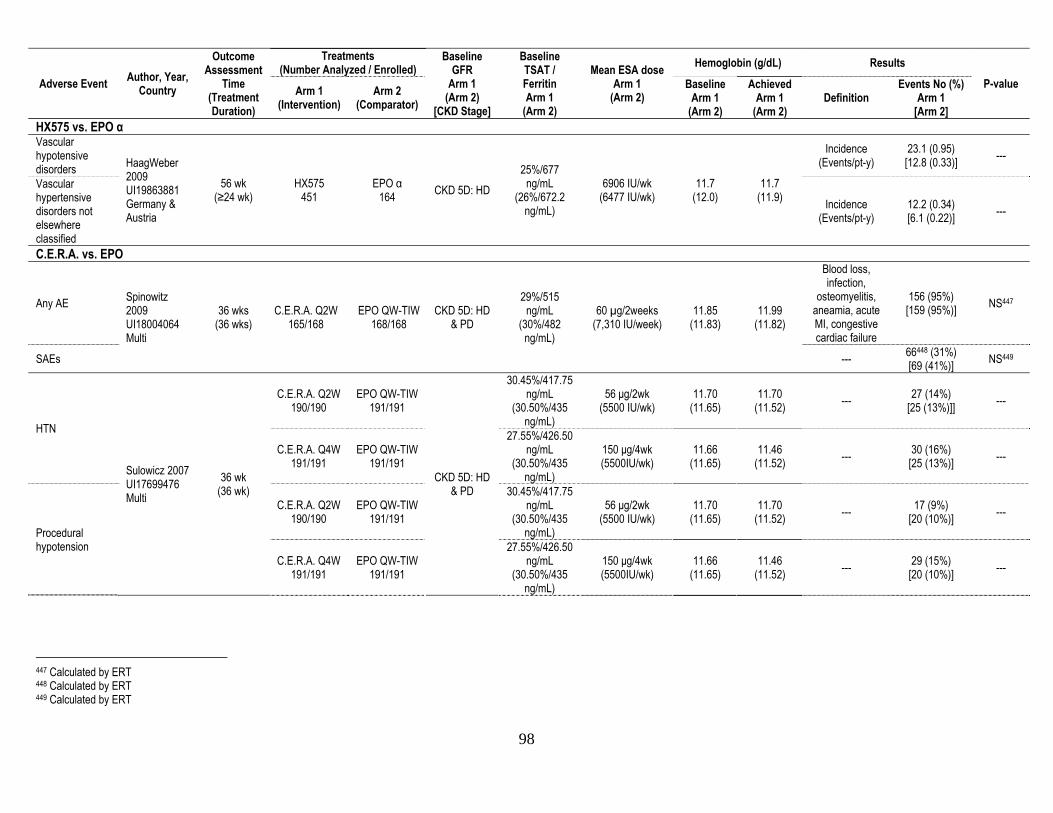
98
Adverse Event Author, Year, Country
Outcome Assessment
Time (Treatment Duration)
Treatments (Number Analyzed / Enrolled)
Baseline GFR
Arm 1 (Arm 2)
[CKD Stage]
Baseline TSAT / Ferritin Arm 1
(Arm 2)
Mean ESA dose Arm 1
(Arm 2)
Hemoglobin (g/dL) Results P-value Arm 1
(Intervention) Arm 2
(Comparator) Baseline
Arm 1 (Arm 2)
Achieved Arm 1
(Arm 2) Definition
Events No (%) Arm 1
[Arm 2] HX575 vs. EPO α Vascular hypotensive disorders HaagWeber
2009 UI19863881 Germany & Austria
56 wk (≥24 wk)
HX575 451
EPO α 164 CKD 5D: HD
25%/677 ng/mL
(26%/672.2 ng/mL)
6906 IU/wk (6477 IU/wk)
11.7 (12.0)
11.7 (11.9)
Incidence (Events/pt-y)
23.1 (0.95) [12.8 (0.33)] ---
Vascular hypertensive disorders not elsewhere classified
Incidence (Events/pt-y)
12.2 (0.34) [6.1 (0.22)] ---
C.E.R.A. vs. EPO
Any AE Spinowitz 2009 UI18004064 Multi
36 wks (36 wks)
C.E.R.A. Q2W 165/168
EPO QW-TIW 168/168
CKD 5D: HD & PD
29%/515 ng/mL
(30%/482 ng/mL)
60 µg/2weeks (7,310 IU/week)
11.85 (11.83)
11.99 (11.82)
Blood loss, infection,
osteomyelitis, aneamia, acute MI, congestive cardiac failure
156 (95%) [159 (95%)] NS447
SAEs --- 66448 (31%) [69 (41%)] NS449
HTN
Sulowicz 2007 UI17699476 Multi
36 wk (36 wk)
C.E.R.A. Q2W 190/190
EPO QW-TIW 191/191
CKD 5D: HD & PD
30.45%/417.75 ng/mL
(30.50%/435 ng/mL)
56 μg/2wk (5500 IU/wk)
11.70 (11.65)
11.70 (11.52) --- 27 (14%)
[25 (13%)]] ---
C.E.R.A. Q4W 191/191
EPO QW-TIW 191/191
27.55%/426.50 ng/mL
(30.50%/435 ng/mL)
150 μg/4wk (5500IU/wk)
11.66 (11.65)
11.46 (11.52) --- 30 (16%)
[25 (13%)] ---
Procedural hypotension
C.E.R.A. Q2W 190/190
EPO QW-TIW 191/191
30.45%/417.75 ng/mL
(30.50%/435 ng/mL)
56 μg/2wk (5500 IU/wk)
11.70 (11.65)
11.70 (11.52) --- 17 (9%)
[20 (10%)] ---
C.E.R.A. Q4W 191/191
EPO QW-TIW 191/191
27.55%/426.50 ng/mL
(30.50%/435 ng/mL)
150 μg/4wk (5500IU/wk)
11.66 (11.65)
11.46 (11.52) --- 29 (15%)
[20 (10%)] ---
447 Calculated by ERT 448 Calculated by ERT 449 Calculated by ERT

99
Adverse Event Author, Year, Country
Outcome Assessment
Time (Treatment Duration)
Treatments (Number Analyzed / Enrolled)
Baseline GFR
Arm 1 (Arm 2)
[CKD Stage]
Baseline TSAT / Ferritin Arm 1
(Arm 2)
Mean ESA dose Arm 1
(Arm 2)
Hemoglobin (g/dL) Results P-value Arm 1
(Intervention) Arm 2
(Comparator) Baseline
Arm 1 (Arm 2)
Achieved Arm 1
(Arm 2) Definition
Events No (%) Arm 1
[Arm 2]
Any AE
C.E.R.A. Q2W 190/190
EPO QW-TIW 191/191
30.45%/417.75 ng/mL
(30.50%/435 ng/mL)
56 μg/2wk (5500 IU/wk)
11.70 (11.65)
11.70 (11.52) --- 171 (90%)
[167 (87%)] ---
C.E.R.A. Q4W 191/191
EPO QW-TIW 191/191
27.55%/426.50 ng/mL
(30.50%/435 ng/mL)
150 μg/4wk (5500IU/wk)
11.66 (11.65)
11.46 (11.52) --- 177 (93%)
[167 (87%)] ---
SAEs
C.E.R.A. Q2W 190/190
EPO QW-TIW 191/191
30.45%/417.75 ng/mL
(30.50%/435 ng/mL)
56 μg/2wk (5500 IU/wk)
11.70 (11.65)
11.70 (11.52) --- 70 (37%)
[85 (45%)] ---
C.E.R.A. Q4W 191/191
EPO QW-TIW 191/191
27.55%/426.50 ng/mL
(30.50%/435 ng/mL)
150 μg/4wk (5500IU/wk)
11.66 (11.65)
11.46 (11.52) --- 73 (38%)
[85 (45%)] ---
AE leading to withdrawal
C.E.R.A. Q2W 190/190
EPO QW-TIW 191/191
30.45%/417.75 ng/mL
(30.50%/435 ng/mL)
56 μg/2wk (5500 IU/wk)
11.70 (11.65)
11.70 (11.52) --- 1 (1%)
[2 (1%)] ---
C.E.R.A. Q4W 191/191
EPO QW-TIW 191/191
27.55%/426.50 ng/mL
(30.50%/435 ng/mL)
150 μg/4wk (5500IU/wk)
11.66 (11.65)
11.46 (11.52) --- 0 (0%)
[1 (1%)] ---
Any AE Levin 2007 UI17950856 Multi
52 wk (52 wk)
Methoxy polyethylene glycol-EPO β
Q2W 221/223
EPO QW-TIW 225/226
CKD 5D: HD & PD
27%/453 µg/L (31%/ 505
µg/L) 100 µg/2wk (9600 IU/wk)
11.97 (11.91)
11.80 (11.82)
203 (92%) [214 (95%)]
RR 0.97450 (0.92; 1.01) NS
Methoxy polyethylene glycol-EPO β
Q4W 220/224
EPO QW-TIW 225/226
28%/522 µg/L (31%/ 505
µg/L) 200 µg/4wk (9600 IU/wk)
11.85 (11.91)
11.61 (11.82)
202 (92%) [214(95%)]
RR 0.97451 (0.92; 1.01) NS
450 Calculated by ERT 451 Calculated by ERT

100
Adverse Event Author, Year, Country
Outcome Assessment
Time (Treatment Duration)
Treatments (Number Analyzed / Enrolled)
Baseline GFR
Arm 1 (Arm 2)
[CKD Stage]
Baseline TSAT / Ferritin Arm 1
(Arm 2)
Mean ESA dose Arm 1
(Arm 2)
Hemoglobin (g/dL) Results P-value Arm 1
(Intervention) Arm 2
(Comparator) Baseline
Arm 1 (Arm 2)
Achieved Arm 1
(Arm 2) Definition
Events No (%) Arm 1
[Arm 2]
Diarrhea
Methoxy polyethylene glycol-EPO β
Q2W 221/223
EPO QW-TIW 225/226
27%/453 µg/L (31%/ 505
µg/L) 100 µg/2wk (9600 IU/wk)
11.97 (11.91)
11.80 (11.82)
38 (17%) [30 (13%)]
RR 1.29452 (0.83; 2.00) NS
Methoxy polyethylene glycol-EPO β
Q4W 220/224
EPO QW-TIW 225/226
28%/522 µg/L (31%/ 505
µg/L) 200 µg/4wk (9600 IU/wk)
11.85 (11.91)
11.61 (11.82)
26 (12%) [30 (13%)]
RR 0.89453 (0.54; 1.45) NS
Nasopharyngitis
Methoxy polyethylene glycol-EPO β
Q2W 221/223
EPO QW-TIW 225/226
27%/453 µg/L (31%/ 505
µg/L) 100 µg/2wk (9600 IU/wk)
11.97 (11.91)
11.80 (11.82)
28 (13%) [24 (11%)]
RR 1.19454 (0.71; 1.98) NS
Methoxy polyethylene glycol-EPO β
Q4W 220/224
EPO QW-TIW 225/226
28%/522 µg/L (31%/ 505
µg/L) 200 µg/4wk (9600 IU/wk)
11.85 (11.91)
11.61 (11.82)
39 (18%) [24 (11%)]
RR 1.66455 (1.04; 2.67) NS
Hypertension
Methoxy polyethylene glycol-EPO β
Q2W 221/223
EPO QW-TIW 225/226
27%/453 µg/L (31%/ 505
µg/L) 100 µg/2wk (9600 IU/wk)
11.97 (11.91)
11.80 (11.82)
23 (10%) [35 (16%)]
RR 0.67456 (0.41; 1.09) NS
Methoxy polyethylene glycol-EPO β
Q4W 220/224
EPO QW-TIW 225/226
28%/522 µg/L (31%/ 505
µg/L) 200 µg/4wk (9600 IU/wk)
11.85 (11.91)
11.61 (11.82)
29 (13%) [35 (16%)]
RR 0.85457 (0.54; 1.34) NS
452 Calculated by ERT 453 Calculated by ERT 454 Calculated by ERT 455 Calculated by ERT 456 Calculated by ERT 457 Calculated by ERT

101
Adverse Event Author, Year, Country
Outcome Assessment
Time (Treatment Duration)
Treatments (Number Analyzed / Enrolled)
Baseline GFR
Arm 1 (Arm 2)
[CKD Stage]
Baseline TSAT / Ferritin Arm 1
(Arm 2)
Mean ESA dose Arm 1
(Arm 2)
Hemoglobin (g/dL) Results P-value Arm 1
(Intervention) Arm 2
(Comparator) Baseline
Arm 1 (Arm 2)
Achieved Arm 1
(Arm 2) Definition
Events No (%) Arm 1
[Arm 2]
Ateriovenous graft thrombosis
Methoxy polyethylene glycol-EPO β
Q2W 221/223
EPO QW-TIW 225/226
27%/453 µg/L (31%/ 505
µg/L) 100 µg/2wk (9600 IU/wk)
11.97 (11.91)
11.80 (11.82)
25 (11%) [32 (14%)]
RR 0.80458 (0.49; 1.30) NS
Methoxy polyethylene glycol-EPO β
Q4W 220/224
EPO QW-TIW 225/226
28%/522 µg/L (31%/ 505
µg/L) 200 µg/4wk (9600 IU/wk)
11.85 (11.91)
11.61 (11.82)
26 (12%) [32 (14%)]
RR 0.83459 (0.51; 1.35) NS
Upper respiratory tract infection
Methoxy polyethylene glycol-EPO β
Q2W 221/223
EPO QW-TIW 225/226
27%/453 µg/L (31%/ 505
µg/L) 100 µg/2wk (9600 IU/wk)
11.97 (11.91)
11.80 (11.82)
20 (9%) [25 (11%)]
RR 0.81460 (0.47; 1.42) NS
Methoxy polyethylene glycol-EPO β
Q4W 220/224
EPO QW-TIW 225/226
28%/522 µg/L (31%/ 505
µg/L) 200 µg/4wk (9600 IU/wk)
11.85 (11.91)
11.61 (11.82)
30 (14%) [25 (11%)]
RR 1.23461 (0.75; 2.02) NS
Headache
Methoxy polyethylene glycol-EPO β
Q2W 221/223
EPO QW-TIW 225/226
27%/453 µg/L (31%/ 505
µg/L) 100 µg/2wk (9600 IU/wk)
11.97 (11.91)
11.80 (11.82)
30 (14%) [24 (11%)]
RR 1.27462 (0.77; 2.11) NS
Methoxy polyethylene glycol-EPO β
Q4W 220/224
EPO QW-TIW 225/226
28%/522 µg/L (31%/ 505
µg/L) 200 µg/4wk (9600 IU/wk)
11.85 (11.91)
11.61 (11.82)
17 (18%) [24 (11%)]
RR 0.72463 (0.40; 1.31) NS
458 Calculated by ERT 459 Calculated by ERT 460 Calculated by ERT 461 Calculated by ERT 462 Calculated by ERT 463 Calculated by ERT

102
Adverse Event Author, Year, Country
Outcome Assessment
Time (Treatment Duration)
Treatments (Number Analyzed / Enrolled)
Baseline GFR
Arm 1 (Arm 2)
[CKD Stage]
Baseline TSAT / Ferritin Arm 1
(Arm 2)
Mean ESA dose Arm 1
(Arm 2)
Hemoglobin (g/dL) Results P-value Arm 1
(Intervention) Arm 2
(Comparator) Baseline
Arm 1 (Arm 2)
Achieved Arm 1
(Arm 2) Definition
Events No (%) Arm 1
[Arm 2]
Fluid overload
Methoxy polyethylene glycol-EPO β
Q2W 221/223
EPO QW-TIW 225/226
27%/453 µg/L (31%/ 505
µg/L) 100 µg/2wk (9600 IU/wk)
11.97 (11.91)
11.80 (11.82)
27 (12%) [17 (8%)]
RR 1.62464 (0.91; 2.88) NS
Methoxy polyethylene glycol-EPO β
Q4W 220/224
EPO QW-TIW 225/226
28%/522 µg/L (31%/ 505
µg/L) 200 µg/4wk (9600 IU/wk)
11.85 (11.91)
11.61 (11.82)
22 (10%) [17 (8%)]
RR 1.32465 (0.72; 2.42) NS
Muscle spasms
Methoxy polyethylene glycol-EPO β
Q2W 221/223
EPO QW-TIW 225/226
27%/453 µg/L (31%/ 505
µg/L) 100 µg/2wk (9600 IU/wk)
11.97 (11.91)
11.80 (11.82)
19 (9%) [24 (10%)]
RR 0.81466 (0.45; 1.43) NS
Methoxy polyethylene glycol-EPO β
Q4W 220/224
EPO QW-TIW 225/226
28%/522 µg/L (31%/ 505
µg/L) 200 µg/4wk (9600 IU/wk)
11.85 (11.91)
11.61 (11.82)
19 (9%) [24 (10%)]
RR 0.81467 (0.46; 1.44) NS
SAE
Methoxy polyethylene glycol-EPO β
Q2W 221/223
EPO QW-TIW 225/226
27%/453 µg/L (31%/ 505
µg/L) 100 µg/2wk (9600 IU/wk)
11.97 (11.91)
11.80 (11.82)
101 (46%) [99 (44%)]
RR 1.04468 (0.85; 1.28) NS
Methoxy polyethylene glycol-EPO β
Q4W 220/224
EPO QW-TIW 225/226
28%/522 µg/L (31%/ 505
µg/L) 200 µg/4wk (9600 IU/wk)
11.85 (11.91)
11.61 (11.82)
87 (40%) [99 (44%)]
RR 0.90469 (0.72; 1.12) NS
464 Calculated by ERT 465 Calculated by ERT 466 Calculated by ERT 467 Calculated by ERT 468 Calculated by ERT 469 Calculated by ERT

103
Adverse Event Author, Year, Country
Outcome Assessment
Time (Treatment Duration)
Treatments (Number Analyzed / Enrolled)
Baseline GFR
Arm 1 (Arm 2)
[CKD Stage]
Baseline TSAT / Ferritin Arm 1
(Arm 2)
Mean ESA dose Arm 1
(Arm 2)
Hemoglobin (g/dL) Results P-value Arm 1
(Intervention) Arm 2
(Comparator) Baseline
Arm 1 (Arm 2)
Achieved Arm 1
(Arm 2) Definition
Events No (%) Arm 1
[Arm 2]
Sepsis
Methoxy polyethylene glycol-EPO β
Q2W 221/223
EPO QW-TIW 225/226
27%/453 µg/L (31%/ 505
µg/L) 100 µg/2wk (9600 IU/wk)
11.97 (11.91)
11.80 (11.82)
5 (2%) [9 (4%)]
RR 0.57470 (0.19; 1.66) NS
Methoxy polyethylene glycol-EPO β
Q4W 220/224
EPO QW-TIW 225/226
28%/522 µg/L (31%/ 505
µg/L) 200 µg/4wk (9600 IU/wk)
11.85 (11.91)
11.61 (11.82)
6 (3%) [9 (4%)]
RR 0.68471 (0.25; 1.88) NS
Pneumonia
Methoxy polyethylene glycol-EPO β
Q2W 221/223
EPO QW-TIW 225/226
27%/453 µg/L (31%/ 505
µg/L) 100 µg/2wk (9600 IU/wk)
11.97 (11.91)
11.80 (11.82)
9 (4%) [5 (2%)]
RR 1.83472 (0.62; 5.38) NS
Methoxy polyethylene glycol-EPO β
Q4W 220/224
EPO QW-TIW 225/226
28%/522 µg/L (31%/ 505
µg/L) 200 µg/4wk (9600 IU/wk)
11.85 (11.91)
11.61 (11.82)
5 (2%) [5 (2%)]
RR 1.02473 (0.30; 3.48) NS
Serious arteriovenous graft thrombosis
Methoxy polyethylene glycol-EPO β
Q2W 221/223
EPO QW-TIW 225/226
27%/453 µg/L (31%/ 505
µg/L) 100 µg/2wk (9600 IU/wk)
11.97 (11.91)
11.80 (11.82)
2 (12%) [7 (8%)]
RR 0.29474 (0.06; 1.38) NS
Methoxy polyethylene glycol-EPO β
Q4W 220/224
EPO QW-TIW 225/226
28%/522 µg/L (31%/ 505
µg/L) 200 µg/4wk (9600 IU/wk)
11.85 (11.91)
11.61 (11.82)
8 (4%) [7 (8%)]
RR 1.17475 (0.43; 3.17) NS
470 Calculated by ERT 471 Calculated by ERT 472 Calculated by ERT 473 Calculated by ERT 474 Calculated by ERT 475 Calculated by ERT

104
Adverse Event Author, Year, Country
Outcome Assessment
Time (Treatment Duration)
Treatments (Number Analyzed / Enrolled)
Baseline GFR
Arm 1 (Arm 2)
[CKD Stage]
Baseline TSAT / Ferritin Arm 1
(Arm 2)
Mean ESA dose Arm 1
(Arm 2)
Hemoglobin (g/dL) Results P-value Arm 1
(Intervention) Arm 2
(Comparator) Baseline
Arm 1 (Arm 2)
Achieved Arm 1
(Arm 2) Definition
Events No (%) Arm 1
[Arm 2]
AE leading to withdrawal
Methoxy polyethylene glycol-EPO β
Q2W 221/223
EPO QW-TIW 225/226
27%/453 µg/L (31%/ 505
µg/L) 100 µg/2wk (9600 IU/wk)
11.97 (11.91)
11.80 (11.82)
9 (4%) [1 (0.4%)]
RR 9.16476 (1.17; 71.72) NS
Methoxy polyethylene glycol-EPO β
Q4W 220/224
EPO QW-TIW 225/226
28%/522 µg/L (31%/ 505
µg/L) 200 µg/4wk (9600 IU/wk)
11.85 (11.91)
11.61 (11.82)
6 (3%) [1 (0.4%)]
RR 6.14477 (0.74; 50.56) NS
C.E.R.A. vs. Darbepoetin α
Any AE Canaud 2008 UI18586762 Multi
52 wk (52 wk)
C.E.R.A. 157/157
Darbepoetin α 156/156 CKD 5D 28.4%/nd
(28.0%/nd) 0.35 µg/kg/wk
(0.44 µg/kg/wk) 12.0
(11.9) 12.1
(11.8)
--- 135 (88%) [143 (92%)] NS478
SAEs --- 71 (46%) [75 (48%)]479 NS480
AE leading to withdrawal --- 1 (1%)
[1 (1%)] NS481
Treatment related AE
Macdougall 2008 UI18287255 Multi
28 wks (28 wks)
C.E.R.A. Q2W 162/162
Darbepoetin α QW
162/162 CKD 3-4 24%/175 μg/L
(24%/186 μg/L) 0.34 μg/kg
(0.19 μg/kg) 10.2 (10.2)
12.18 (12.01)
--- 13482 (8%) [9483 (6%) NS
SAEs --- 49484 (30%) [58485 (36%) NS
SAEs related to study medication
Maculopapular rash,
angioneirotic adema HTN
10486 (1%) [2487 (1%) NS
476 Calculated by ERT 477 Calculated by ERT 478 Calculated by ERT 479 Serious adverse events were considered to be related to study treatment in one patient in CERA group (arteriovenous graft thrombosis) and three patients in DA group (arteriovenous graft thrombosis, AVF site hemorrhage and cerebral infarction) 480 Calculated by ERT 481 Calculated by ERT 482 Calculated by ERT 483 Calculated by ERT 484 Calculated by ERT 485 Calculated by ERT 486 Calculated by ERT 487 Calculated by ERT

105
Adverse Event Author, Year, Country
Outcome Assessment
Time (Treatment Duration)
Treatments (Number Analyzed / Enrolled)
Baseline GFR
Arm 1 (Arm 2)
[CKD Stage]
Baseline TSAT / Ferritin Arm 1
(Arm 2)
Mean ESA dose Arm 1
(Arm 2)
Hemoglobin (g/dL) Results P-value Arm 1
(Intervention) Arm 2
(Comparator) Baseline
Arm 1 (Arm 2)
Achieved Arm 1
(Arm 2) Definition
Events No (%) Arm 1
[Arm 2] AE leading to study withdrawal
Withdrawn as a result of AE
5488 (3%) [10489 (6%) NS
Any AE
Most common: HTN, peripheral
edema, diarrhea,
nasopharyngitis
146490 (90%) [147491 (91%) NS
AV thromboembolic events
Limb venothrombosis,
pulmonary embolism, MI,
stroke
5492 (3%) [2493 (1%) NS
SAE [safety]
Kessler 2010 UI19888948 Multi
53 wk (53 wk)
C.E.R.A. Q2W 73/73
Darbepoetin α QW/Q2W 151/151
CKD Stage 3-4
≥20%/≥100 ng/mL
(≥20%/≥100 ng/mL)
Median IQR range
0.17 µg/kg/wk (0.17 µg/kg/wk)
8-11 g/dL (8-11g/dL)
11.92 (11.89)
None considered to be treatment
related
11494 (15%) [30 (20%)]
NS (0.391)
C.E.R.A. Q4W 72/72
Median IQR range
0.22 µg/kg/wk (0.17 µg/kg/wk)
11.70 (11.89)
None considered to be treatment
related
11495 (15%) [30 (20%)]
NS (0.415)
AE related to study medication [safety]
C.E.R.A. Q2W 73/73
Median IQR range
0.17 µg/kg/wk (0.17 µg/kg/wk)
11.92 (11.89)
Related to study medication
1 (1%) [0 (0%)]496 nd
C.E.R.A. Q4W 72/72
Median IQR range
0.22 µg/kg/wk (0.17 µg/kg/wk)
11.70 (11.89)
Related to study medication
0 (0%) [0 (0%)] nd
488 Calculated by ERT 489 Calculated by ERT 490 Calculated by ERT 491 Calculated by ERT 492 Calculated by ERT 493 Calculated by ERT 494 Event rate calculated by ERT 495 Event rate calculated by ERT 496 Calculated by ERT

106
Adverse Event Author, Year, Country
Outcome Assessment
Time (Treatment Duration)
Treatments (Number Analyzed / Enrolled)
Baseline GFR
Arm 1 (Arm 2)
[CKD Stage]
Baseline TSAT / Ferritin Arm 1
(Arm 2)
Mean ESA dose Arm 1
(Arm 2)
Hemoglobin (g/dL) Results P-value Arm 1
(Intervention) Arm 2
(Comparator) Baseline
Arm 1 (Arm 2)
Achieved Arm 1
(Arm 2) Definition
Events No (%) Arm 1
[Arm 2]
Any AE [safety]
C.E.R.A. Q2W 73/73
Median IQR range
0.17 µg/kg/wk (0.17 µg/kg/wk)
11.92 (11.89)
At least 1 AE mild or
moderate in intensity
48 (67%) [99 (66%)]497
NS (0.978)
C.E.R.A. Q4W 72/72
Median IQR range
0.22 µg/kg/wk (0.17 µg/kg/wk)
11.70 (11.89)
At least 1 AE mild or
moderate in intensity
46 (64%) [99 (66%)]498
NS (0.808)
HTN [safety]
C.E.R.A. Q2W 73/73
Median IQR range
0.17 µg/kg/wk (0.17 µg/kg/wk)
11.92 (11.89) nd 1 (1%)
[5 (3%)]499 NS
(0.416)
C.E.R.A. Q4W 72/72
Median IQR range
0.22 µg/kg/wk (0.17 µg/kg/wk)
11.70 (11.89) nd 3 (4%)
[5 (3%)]500 NS
(0.748)
Hypertension
Roger 2011 UI21505096 Multi
28 wk (20 wk)
C.E.R.A Q4W 153/153
Darbepoetin α QW/Q2W 154/154
CKD Stage 3-4
24%/186 μg/L (23.8%/207
μg/L)
Median 80 µg/4wk
(110 µg/4wk)501 9.53 g/dL
(9.53 g/dL) 11.3 g/dL
(11.5 g/dL502)
nd
24 (16%) [37 (24%)]
nd
Renal impairment
9 (6%) [16 (10%)]
Hyperkalemia 13 (9%) [8 (5%)]
Upper respiratory tract infection
9 (6%) [11 (7%)]
Constipation 5 (3%) [12 (8%)]
Diarrhea 10 (7%) [6 (4%)]
Urinary tract infection
6 (4%) [8 (5%)]
Hypotension 5 (3%) [8 (5%)]
497 Calculated by ERT 498 Calculated by ERT 499 Calculated by ERT 500 Calculated by ERT 501 Estimated from figure 502 Estimated from figure

107
Adverse Event Author, Year, Country
Outcome Assessment
Time (Treatment Duration)
Treatments (Number Analyzed / Enrolled)
Baseline GFR
Arm 1 (Arm 2)
[CKD Stage]
Baseline TSAT / Ferritin Arm 1
(Arm 2)
Mean ESA dose Arm 1
(Arm 2)
Hemoglobin (g/dL) Results P-value Arm 1
(Intervention) Arm 2
(Comparator) Baseline
Arm 1 (Arm 2)
Achieved Arm 1
(Arm 2) Definition
Events No (%) Arm 1
[Arm 2]
Nasopharyngitis 5 (3%) [8 (5%)]
Pneumonia 2 (1%) [8 (5%)]
C.E.R.A vs. C.E.R.A.
SAE [safety]
Kessler 2010 UI19888948 Multi
53 wk (53 wk)
C.E.R.A. Q2W 73/73
C.E.R.A. Q4W 72/72
CKD Stage 3-4
≥20%/≥100 ng/mL
(≥20%/≥100 ng/mL)
Median IQR range
0.17 µg/kg/wk (0.22 µg/kg/wk)
8-11 g/dL (8-11g/dL)
11.92 (11.70)
None considered to be treatment
related
11503 (15%) [11 (15%)]
NS (0.972)
AE related to study medication [safety]
Related to study medication
1 (1%) [0 (0%)]504 nd
Any AE [safety] At least 1 AE
mild or moderate in
intensity
48 (67%) [46 (64%)]505
NS (0.814)
HTN [safety] nd 1 (1%) [3 (4%)]506
NS (0.330)
503 Event rate calculated by ERT 504 Calculated by ERT 505 Calculated by ERT 506 Calculated by ERT