Embed Size (px)
Citation preview
KENTUCKYCOMPLETIONREPORT
The Completion Report describes the state of postsecondary education
degree and credential attainment in Kentucky between Academic Years (AY)
2004‐05 and 2013‐14. Part One details the number and types of degrees
produced during this time and pays attention to trends among key
demographics in the state. Part Two provides context for these trends by
comparing Kentucky to the United States. The report also provides analysis
of the Commonwealth’s strengths and areas of opportunity for
improvement, and identifies questions for future research and policy
recommendations for the postsecondary education system.
DescribingaDecadeofDegree&CredentialProduction

CONTENTS INTRODUCTION ......................................................................................................................................................................... 1
PART I: DESCRIBING KENTUCKY ................................................................................................................................................ 2
EXECUTIVE SUMMARY .......................................................................................................................................................... 2
TOTAL DEGREES & CREDENTIALS AWARDED ........................................................................................................................ 3
GROWTH IN TOTAL DEGREES & CREDENTIALS AWARDED ................................................................................................... 4
TYPES OF DEGREES & CREDENTIALS AWARDED ................................................................................................................... 5
DEGREES & CREDENTIALS BY FIELD OF STUDY ...................................................................................................................... 7
DEGREES & CREDENTIALS EARNED BY GENDER .................................................................................................................... 9
DEGREES & CREDENTIALS EARNED BY RACE/ETHNICITY .................................................................................................... 10
PART II: KENTUCKY IN CONTEXT .............................................................................................................................................. 12
NATIONAL TRENDS IN DEGREE & CREDENTIAL PRODUCTION ............................................................................................ 12
CONCLUSIONS & RECOMMENDATIONS .................................................................................................................................. 17
SUCCESSES ........................................................................................................................................................................... 17
OPPORTUNITIES .................................................................................................................................................................. 18
FUTURE RESEARCH .............................................................................................................................................................. 19
RECOMMENDATIONS .......................................................................................................................................................... 20
REFERENCES ............................................................................................................................................................................ 22
1
INTRODUCTION
Former United States Secretary of Education Arne
Duncan in 2012 reaffirmed the critical role of higher
education in shaping America’s future. While addressing
TIME’s Higher Education Summit, Duncan stated, “In the
information age, higher education is no longer a luxury.”
It is, he continued, “a necessity that every family in
America should be able to afford.”1
It would seem that much of the American public
agrees with this assessment. In the most recent Gallup‐
Lumina Foundation Poll on Higher Education, 96 percent
of those surveyed stated that they believe it is
somewhat or very important to have a degree or
professional certificate beyond high school. In the same
poll, 94 percent agreed that it is at least somewhat
important that the U.S. increase the proportion of its
population with a degree or certificate beyond high
school.2
But what is driving this focus on the role of higher
education? As the United States marches through the
second decade of the 21st century, it does so at the
meeting point of the revolutionary forces of rapid
globalization, proliferation of new technologies, and
continued evolution from a manufacturing to a service
economy. These forces have worked over the last half
century to change the nature of work in America. The
majority of today’s jobs, nearly two‐thirds, are in high‐
skill service industries. This shift has increased demand
for more highly educated workers.3
Most projections indicate that this “upskilling,” the
demand for workers with more education and training,
will continue into the future. According to a recent
report from Georgetown University’s Center on
Education and the Workforce, by the year 2020 nearly
two‐thirds of all jobs in the U.S. will require at least
some education or training beyond high school. At the
current pace of degree production, however, the nation
will face a shortage of nearly 5 million workers with the
necessary training and education to fill these jobs.4
In Kentucky, the gap between the educational
attainment of the workforce and the needs of employers
is wider than for much of the rest of the nation. By the
year 2020, 62 percent of the jobs in the Commonwealth
are projected to require postsecondary education or
training.4 However, only 54 percent of adults in the
state are projected to hold a postsecondary degree or
credential beyond high school by this time. 3 At its
current pace of degree production, Kentucky will fall
nearly 10 percent short in the number of workers with
postsecondary training it needs to fill this demand.3
In short, the jobs and economy of the future do not
look like those of the past. If Kentucky and the rest of
the U.S. are to bridge this gap, postsecondary education
must play a leading role in the development of a
population ready to address the challenges of the future.
The Kentucky Completion Report addresses these
challenges by developing a better understanding of the
current state of educational attainment in Kentucky,
identifying areas of opportunity for improvement, and
offering recommendations for ways the state’s system of
postsecondary education can lead the development of a
workforce ready for the challenges of the 21st century.
“In the information age, higher
education is no longer a luxury.” ‐Arne Duncan, former U.S. Secretary of Education
2
PARTI:DESCRIBINGKENTUCKY
EXECUTIVE SUMMARY
The Kentucky Completion Report uses data from the
Kentucky Postsecondary Education Data System (KPEDS)
to describe the state of postsecondary degree and
credential attainment in the Commonwealth. Ten‐year
trends between Academic Years (AY) 2004‐05 and 2013‐
14 are reported and analysis is given to provide a
context for what these trends mean to the educational
and economic health of Kentucky.
Part One of the Completion Report details the
number and types of degrees and credentials produced
during this 10‐year period and pays attention to trends
among key demographics. Specifically, this analysis
focuses on degrees and credentials as detailed by:
Degree and credential type
Institutional sector
Area of study
Race/ethnicity
Gender
Part Two places trends in degree and credential
production in Kentucky into a larger context by
comparing the growth in the total number of degrees
and credentials earned in the state to the rest of the
United States. Data for this section are drawn from the
National Center for Education Statistics (NCES)
Integrated Postsecondary Education Data System
(IPEDS). The most recently available data in IPEDS is for
AY 2012‐13, so 10‐year trends are analyzed between AY
2003‐04 and 2012‐13. Part Two of the report also
assesses Kentucky’s areas of strength in degree and
credential production, identifies opportunities for
improvement and poses questions for further
investigation.
KEY FINDINGS The total number of degrees and credentials
awarded in Kentucky has increased 53 percent since
2004‐05.
The two‐year public sector had the largest growth
(102 percent) in degrees and credentials awarded
since 2004‐05.
The pace of growth in degrees and credentials has
slowed in the last five years.
Undergraduate certificates make up a much larger
share of degrees and credentials awarded now than
they did in 2004‐05, while baccalaureate degrees
make up a much smaller share.
The number of degrees and credentials awarded in
the trades, health and STEM fields all grew by more
than 50 percent in the past 10 years ‐‐ 111 percent,
85 percent and 51 percent, respectively.
Men still earn fewer degrees and credentials than
women, but their growth in degree and credential
attainment in the past five years outpaced women.
The number of degrees and credentials earned by
Hispanic students has increased 125 percent since
2004‐05.
Between 2003‐04 and 2012‐13 Kentucky’s growth in
degrees and credentials awarded ranked nationally:
o 8th in total growth at 59 percent
o 9th in two‐year public sector growth at 112
percent
o 32nd in four‐year public sector growth at 24
percent
o 5th in independent sector growth at 59
percent

3
TOTAL DEGREES & CREDENTIALS AWARDED Table 1: Degrees & Credentials Awarded 2004‐05 to 2013‐14
04‐05 05‐06 06‐07 07‐08 08‐09 09‐10 10‐11 11‐12 12‐13 13‐14
Two‐Year Public 15,741 19,805 20,970 22,782 22,744 24,838 27,813 28,544 28,469 31,715
Four‐Year Public 21,631 22,691 22,948 23,122 23,309 23,688 24,571 25,495 25,774 26,057
Independent 5,401 5,517 5,780 6,127 6,330 6,581 7,024 7,927 8,172 7,709
Kentucky 42,773 48,013 49,698 52,031 52,383 55,107 59,408 61,966 62,415 65,481
Source: Kentucky Postsecondary Education Data System.
The number of postsecondary degrees
and credentials awarded in Kentucky rose
dramatically in the past decade. During this time, the number of degrees and credentials earned in
the state grew from 42,773 in Academic Year (AY)
2004‐05 to more than 65,000 in AY 2013‐14, an
increase of 53 percent.
In the past five years, there was a 19 percent
increase in the total number of degrees and credentials
awarded in Kentucky, up from 55,107 in 2009‐10 to
65,481 in 2013‐14. In the most recent academic year,
total degrees grew from 62,415 awarded in 2012‐13 to
65,481 in 2013‐14, an increase of nearly 5 percent.
A decade of sustained growth in degree production
and an overall increase of more than 50 percent are
important accomplishments for the state. Within these
numbers, however, is also a cause for caution. In the
past five years, the pace of growth in degree and
credential production has slowed. Between 2004‐05
and 2008‐09, there was an average annual increase of
5.3 percent in degrees and credentials produced, and
between 2009‐10 and 2013‐14 that pace slowed to an
average increase of 4.6 percent annually.
Source: Kentucky Postsecondary Education Data System.
Figure 1: Total Degrees & Credentials Awarded
0
10,000
20,000
30,000
40,000
50,000
60,000
70,000
2004‐05 2005‐06 2006‐07 2007‐08 2008‐09 2009‐10 2010‐11 2011‐12 2012‐13 2013‐14
Two‐Year Public
Four‐Year Public
Independent
Kentucky

4
GROWTH IN TOTAL DEGREES & CREDENTIALS AWARDED
Source: Kentucky Comprehensive Postsecondary Database.
The rise in Kentucky’s postsecondary degrees and
credentials was driven by the two‐year public sector. In
the past 10 years, there was an increase of more than
100 percent in degrees and credentials awarded in this
sector, from 15,741 in 2004‐05, to 31,715 in 2013‐14.
This growth was especially significant when compared
to 10‐year increases of 20 percent in the four‐year
public sector and 43 percent for the independents.
The number of degrees and credentials awarded in
all three sectors grew in the five years since 2009‐10,
but the gap between the growth in the two‐year public
sector and the others decreased significantly. With 28
percent growth, the two‐year public sector saw the
most progress in the past five years, followed by the
independent sector with a 17 percent increase and the
four‐year public sector with a 10 percent increase.
In the last year, there was an 11 percent increase in
degrees produced in the two‐year public sector. This
was again the largest growth across sectors. There was
a 1 percent gain in degrees and credentials awarded
between 2012‐13 and 2013‐14 at four‐year public
institutions and a 6 percent decrease at independent
institutions.
In general, the past decade’s average
annual growth of 5 percent in degrees and
credentials awarded was led by significant
increases in the two‐year public sector and
bolstered by steady gains at independent
and four‐year public institutions.
Figure 2: Percent Change in Degrees & Credentials Awarded by Sector
Source: Kentucky Postsecondary Education Data System.
101%
28%
11% 8%
20%
10%1% 2%
43%
17%
‐6%4%
53%
19%
5% 5%
‐20
0
20
40
60
80
100
120
Ten‐Year Change Five‐Year Change One‐Year Change Average Annual %Change (05‐14)
Two‐Year Public
Four‐Year Public
Independent
Kentucky

5
TYPES OF DEGREES & CREDENTIALS AWARDED
Figure 3: Degrees & Credentials Awarded by Type
Source: Kentucky Postsecondary Education Data System. *Undergraduate certificates include certificates earned in less than one year, one but less than two years, and two but
less than four years.
0
5,000
10,000
15,000
20,000
25,000Associate
Baccalaureate
Certificates
Diplomas
Doctoral
Master's/Specialist
Post‐Baccalaureate Certificate
Post‐Master's Certificate
The largest 10‐year increase in degrees and
credentials awarded came from growth in the number
of certificates awarded. Between 2004‐05 and 2013‐
14, the number of certificates grew by more than
12,000, an increase of 159 percent. Only post‐
baccalaureate certificates had a larger percentage
increase. However, given the small number of these
credentials (24 in 2004‐05 and 424 in 2013‐14), the
growth in undergraduate certificates* warrants greater
attention. Post‐master’s certificates also saw
significant growth during this period. In fact, with an
increase of 150 percent, this was the third‐fastest
growing degree or credential in Kentucky between
2004‐05 and 2013‐14.
Of the eight degree and credential types in Figure
3, only diplomas decreased between 2004‐05 and
2013‐14.With a drop of less than 2 percent, however,
this was a relatively small decline.
All other degrees and credentials grew during the
last 10 years, but with varying degrees of intensity.
Associate degrees awarded, for example, increased by
nearly 52 percent, from 7,139 in 2004‐05 to 10,846 in
2013‐14. Doctoral degrees, master’s/specialists and
baccalaureate degrees all grew but more modestly.
Doctorates were awarded at a 36 percent higher pace
in 2013‐14 than in 2004‐05; master’s/specialists awards
increased by 27 percent; and baccalaureate degrees
showed the slowest growth at 24 percent.
A shift took place in the past 10 years in
the types of degrees and credentials
Kentucky students sought; away from
four‐year degrees and toward alternative
forms of degrees and credentials.

6
There was a significant change in
the mix of degree and credential
types awarded in Kentucky. As the number of degrees and credentials awarded
grew, the mix of degree and credential types
earned in the state shifted as well. Between
2004‐05 and 2013‐14, the largest change
occurred in the share of certificates awarded. In
2004‐05 certificates accounted for only 19
percent of all degrees and credentials awarded
in the state, but by 2013‐14, undergraduate
certificates accounted for 31 percent of
postsecondary degrees and credentials awarded
in Kentucky.
The second largest shift came in the share
of baccalaureate degrees awarded. Between
2004‐05 and 2013‐14, there was an 8 percent
decrease in degrees and credentials awarded at
the baccalaureate level, a fall from 41 percent in
2004‐05 to 33 percent in 2013‐14. The share of
diplomas, master’s/specialists and doctoral
degrees awarded also fell, but only slightly.
Associate, post‐baccalaureate and post‐master’s
certificates remained relatively stagnant as a
share of total degrees and credentials awarded.
The shift in the share of certificates and
baccalaureate degrees awarded constitutes a
significant change in educational outcomes for
Kentucky. While 10 years ago bachelor degrees
constituted almost half of all degrees and
credentials awarded, they now account for only
a third. Similarly, in 2004‐05 certificates
accounted for less than 20 percent of all
degrees and credentials awarded, but they now
constitute nearly a third of all degrees and
credentials awarded in Kentucky.
Figure 4: Share of Degrees & Credentials (04‐05)
Source: Kentucky Postsecondary Education Data System.
Figure 5: Share of Degrees & Credentials (13‐14)
17%
41%19%
5%
3%15%
0.06%
0.04%
Associate
Baccalaureate
Certificates
Diploma
Doctoral
Master's/Specialists
Post‐BaccalaureateCertificate
Post‐Master's Certificate
17%
33%31%
3%
3% 13%
0.6% 0.03%
Associate
Baccalaureate
Certificates
Diplomas
Doctoral
Master's/Specialist
Post‐BaccalaureateCertificate
Post‐Master's Certificate
Source: Kentucky Postsecondary Education Data System.
7
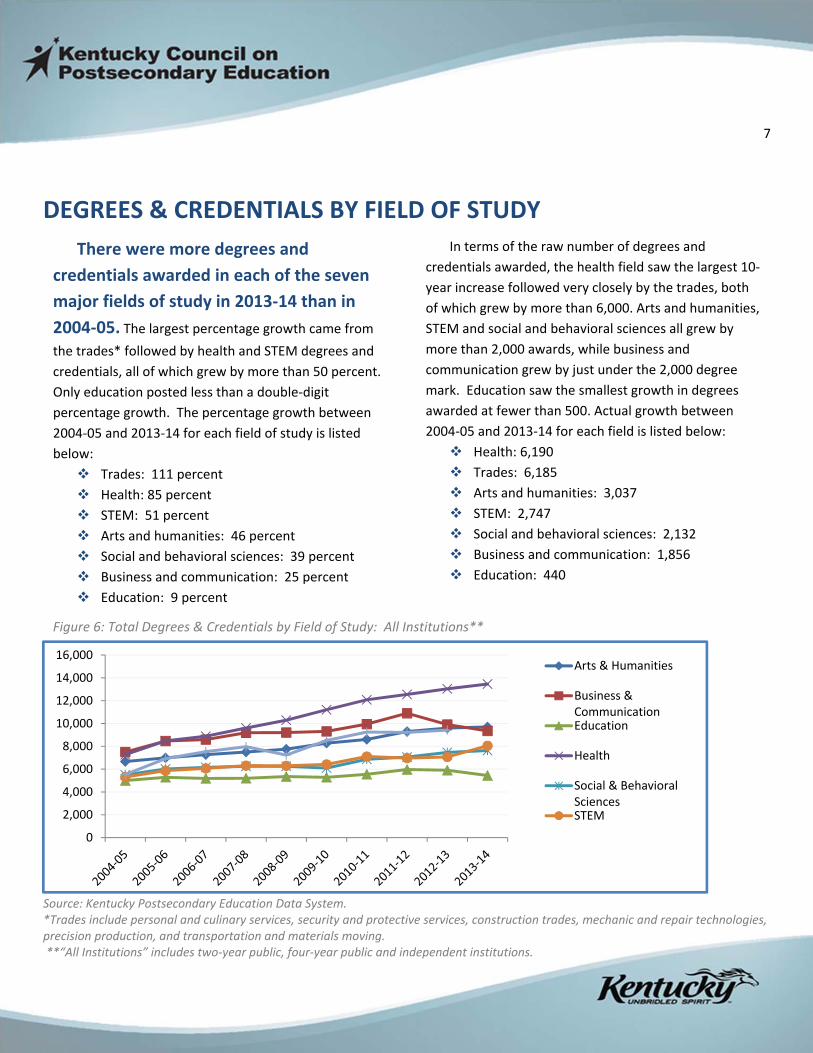
DEGREES & CREDENTIALS BY FIELD OF STUDY
Source: Kentucky Postsecondary Education Data System. *Trades include personal and culinary services, security and protective services, construction trades, mechanic and repair technologies, precision production, and transportation and materials moving. **“All Institutions” includes two‐year public, four‐year public and independent institutions.
There were more degrees and
credentials awarded in each of the seven
major fields of study in 2013‐14 than in
2004‐05. The largest percentage growth came from
the trades* followed by health and STEM degrees and
credentials, all of which grew by more than 50 percent.
Only education posted less than a double‐digit
percentage growth. The percentage growth between
2004‐05 and 2013‐14 for each field of study is listed
below:
Trades: 111 percent
Health: 85 percent
STEM: 51 percent
Arts and humanities: 46 percent
Social and behavioral sciences: 39 percent
Business and communication: 25 percent
Education: 9 percent
In terms of the raw number of degrees and
credentials awarded, the health field saw the largest 10‐
year increase followed very closely by the trades, both
of which grew by more than 6,000. Arts and humanities,
STEM and social and behavioral sciences all grew by
more than 2,000 awards, while business and
communication grew by just under the 2,000 degree
mark. Education saw the smallest growth in degrees
awarded at fewer than 500. Actual growth between
2004‐05 and 2013‐14 for each field is listed below:
Health: 6,190
Trades: 6,185
Arts and humanities: 3,037
STEM: 2,747
Social and behavioral sciences: 2,132
Business and communication: 1,856
Education: 440
0
2,000
4,000
6,000
8,000
10,000
12,000
14,000
16,000Arts & Humanities
Business &CommunicationEducation
Health
Social & BehavioralSciencesSTEM
Figure 6: Total Degrees & Credentials by Field of Study: All Institutions**
8
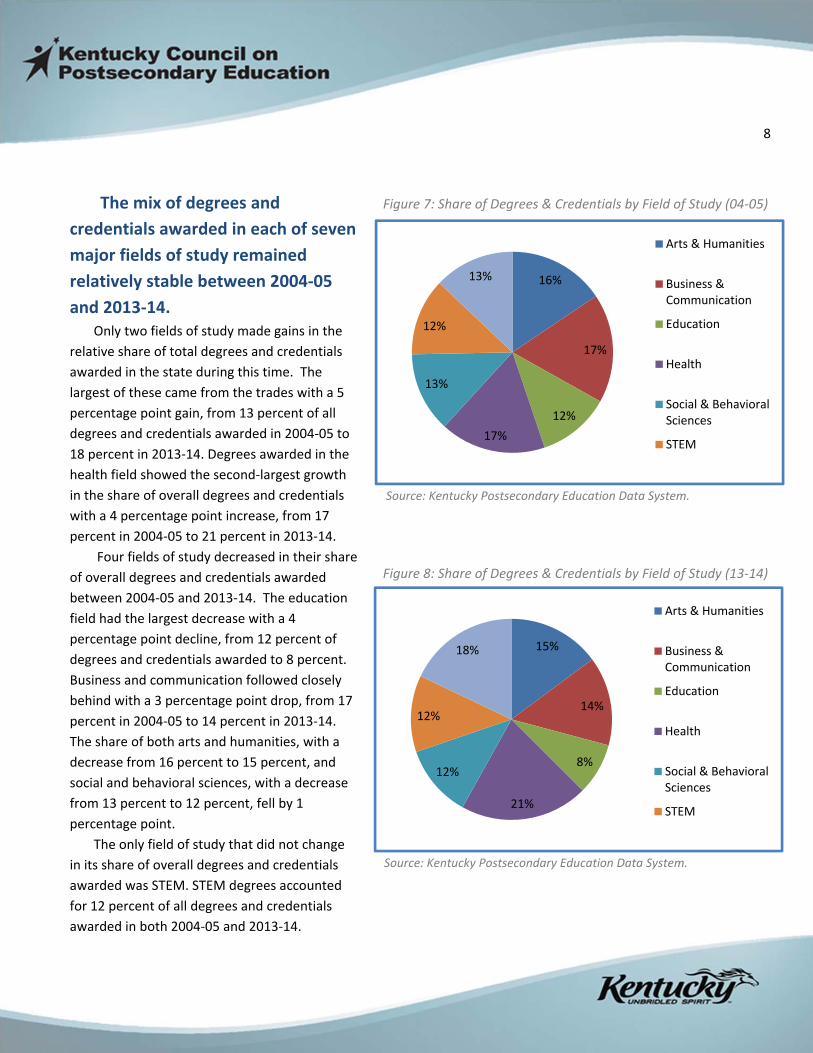
The mix of degrees and
credentials awarded in each of seven
major fields of study remained
relatively stable between 2004‐05
and 2013‐14. Only two fields of study made gains in the
relative share of total degrees and credentials
awarded in the state during this time. The
largest of these came from the trades with a 5
percentage point gain, from 13 percent of all
degrees and credentials awarded in 2004‐05 to
18 percent in 2013‐14. Degrees awarded in the
health field showed the second‐largest growth
in the share of overall degrees and credentials
with a 4 percentage point increase, from 17
percent in 2004‐05 to 21 percent in 2013‐14.
Four fields of study decreased in their share
of overall degrees and credentials awarded
between 2004‐05 and 2013‐14. The education
field had the largest decrease with a 4
percentage point decline, from 12 percent of
degrees and credentials awarded to 8 percent.
Business and communication followed closely
behind with a 3 percentage point drop, from 17
percent in 2004‐05 to 14 percent in 2013‐14.
The share of both arts and humanities, with a
decrease from 16 percent to 15 percent, and
social and behavioral sciences, with a decrease
from 13 percent to 12 percent, fell by 1
percentage point.
The only field of study that did not change
in its share of overall degrees and credentials
awarded was STEM. STEM degrees accounted
for 12 percent of all degrees and credentials
awarded in both 2004‐05 and 2013‐14.
16%
17%
12%
17%
13%
12%
13%
Arts & Humanities
Business &Communication
Education
Health
Social & BehavioralSciences
STEM
15%
14%
8%
21%
12%
12%
18%
Arts & Humanities
Business &Communication
Education
Health
Social & BehavioralSciences
STEM
Figure 7: Share of Degrees & Credentials by Field of Study (04‐05)
Figure 8: Share of Degrees & Credentials by Field of Study (13‐14)
Source: Kentucky Postsecondary Education Data System.
Source: Kentucky Postsecondary Education Data System.
9
0
2,000
4,000
6,000
8,000
10,000
12,000
14,000
16,000
18,000
2009‐2010 2010‐2011 2011‐2012 2012‐2013 2013‐2014
Two‐Year Public Men
Two‐Year Public Women
Four‐Year Public Men
Four‐Year Public Women
Independent Men
Independent Women
33%
14%
22%23%
8%
20%
0
5
10
15
20
25
30
35
Two‐Year Public Four‐Year Public Independent
Men
Women
DEGREES & CREDENTIALS EARNED BY GENDER
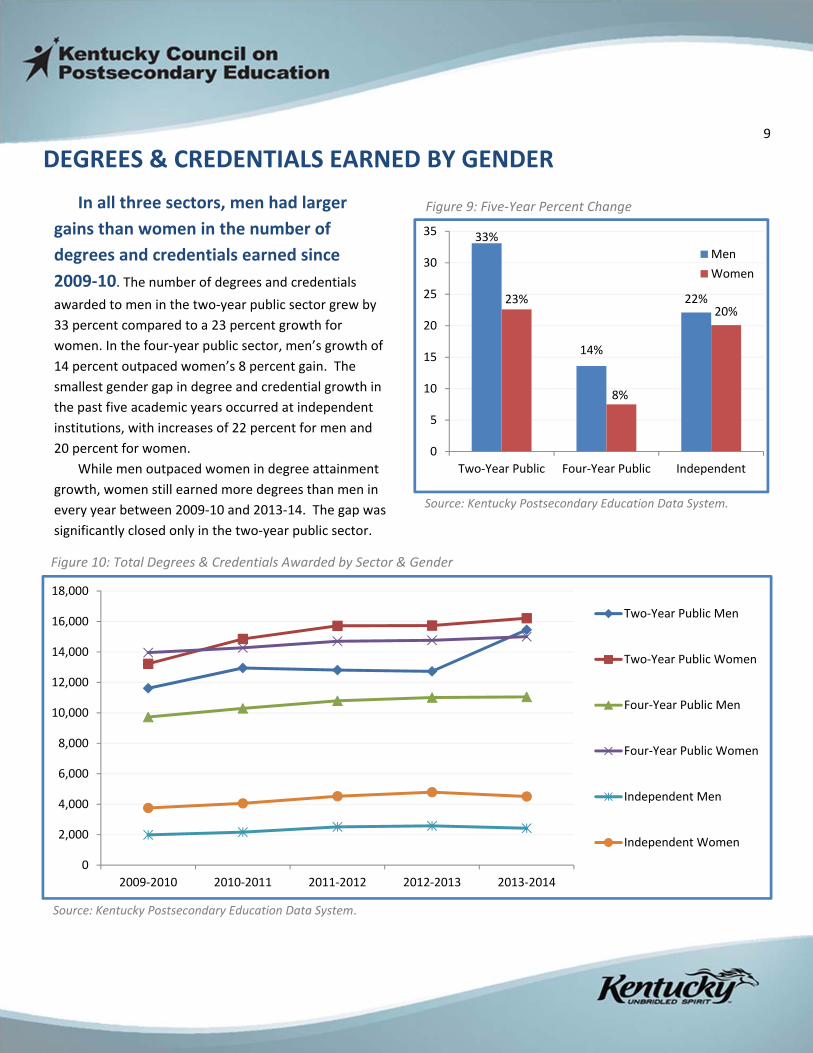
In all three sectors, men had larger
gains than women in the number of
degrees and credentials earned since
2009‐10. The number of degrees and credentials
awarded to men in the two‐year public sector grew by
33 percent compared to a 23 percent growth for
women. In the four‐year public sector, men’s growth of
14 percent outpaced women’s 8 percent gain. The
smallest gender gap in degree and credential growth in
the past five academic years occurred at independent
institutions, with increases of 22 percent for men and
20 percent for women.
While men outpaced women in degree attainment
growth, women still earned more degrees than men in
every year between 2009‐10 and 2013‐14. The gap was
significantly closed only in the two‐year public sector.
Source: Kentucky Postsecondary Education Data System.
Figure 9: Five‐Year Percent Change
Source: Kentucky Postsecondary Education Data System.
Figure 10: Total Degrees & Credentials Awarded by Sector & Gender
10
DEGREES & CREDENTIALS EARNED BY RACE/ETHNICITY
Source: Kentucky Postsecondary Education Data System. * Other includes students who identified as American Indian/Alaska native, native Hawaiian or other Pacific Islander, two or more races, or unknown.
78%
16%‐5%
31%22%
14%
39%
20%
178%
86% 93%
125%
‐58%
70%
21%
‐20%
34%
5%19% 20%
‐100
‐50
0
50
100
150
200
Two‐Year Public Four‐Year Public Independent Kentucky
Asian
Black
Hispanic
Other*
White
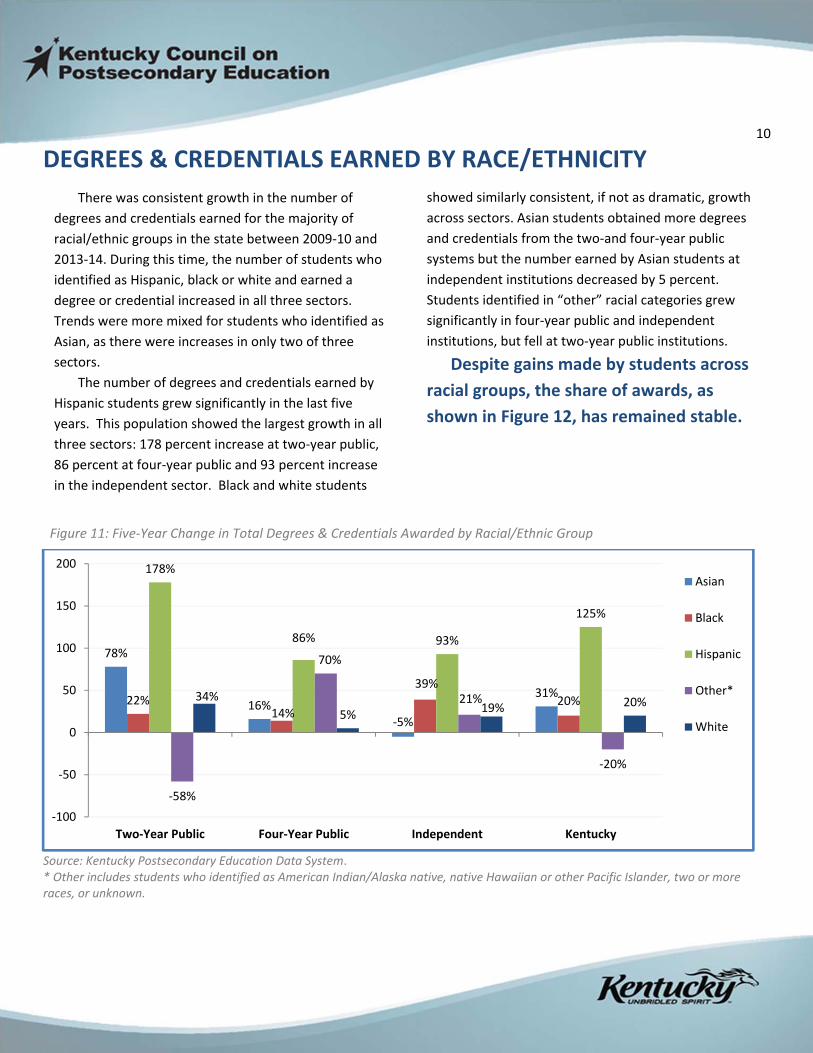
There was consistent growth in the number of
degrees and credentials earned for the majority of
racial/ethnic groups in the state between 2009‐10 and
2013‐14. During this time, the number of students who
identified as Hispanic, black or white and earned a
degree or credential increased in all three sectors.
Trends were more mixed for students who identified as
Asian, as there were increases in only two of three
sectors.
The number of degrees and credentials earned by
Hispanic students grew significantly in the last five
years. This population showed the largest growth in all
three sectors: 178 percent increase at two‐year public,
86 percent at four‐year public and 93 percent increase
in the independent sector. Black and white students
showed similarly consistent, if not as dramatic, growth
across sectors. Asian students obtained more degrees
and credentials from the two‐and four‐year public
systems but the number earned by Asian students at
independent institutions decreased by 5 percent.
Students identified in “other” racial categories grew
significantly in four‐year public and independent
institutions, but fell at two‐year public institutions.
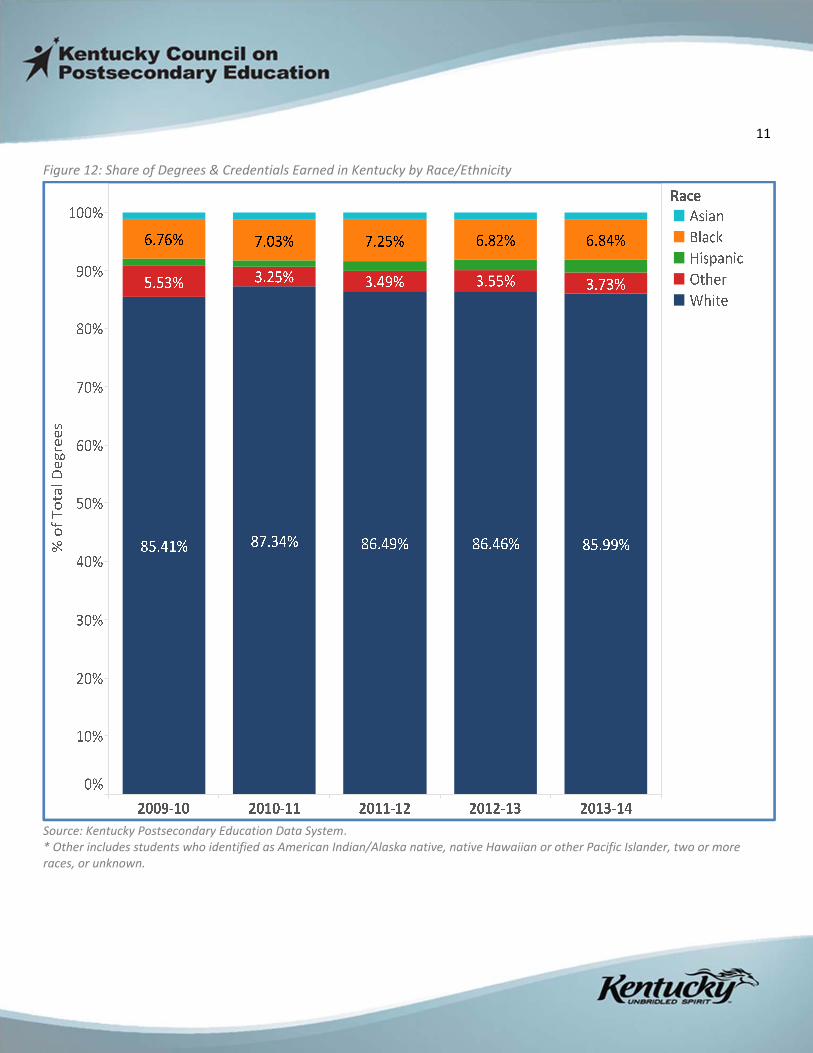
Despite gains made by students across
racial groups, the share of awards, as
shown in Figure 12, has remained stable.
Figure 11: Five‐Year Change in Total Degrees & Credentials Awarded by Racial/Ethnic Group
11
Figure 12: Share of Degrees & Credentials Earned in Kentucky by Race/Ethnicity
Source: Kentucky Postsecondary Education Data System. * Other includes students who identified as American Indian/Alaska native, native Hawaiian or other Pacific Islander, two or more races, or unknown.

12
PARTII:KENTUCKYINCONTEXT
NATIONAL TRENDS IN DEGREE & CREDENTIAL PRODUCTION
Figure 13: Annual Percent Change from Previous Year in Degrees & Credentials Awarded – KY & the U.S.*
Source: National Center for Education Statistics Integrated Postsecondary Data System. * National average calculated as the yearly average of total degrees and credentials produced in 50 states for all institutions in the two‐year public, four‐year public, and four‐year private, non‐profit (independent) sectors.
1%
6%
8%
4%
1%
3%
5%
6%
4%
2%
0%
1%
2%
3%
4%
5%
6%
7%
8%
2008‐09 2009‐10 2010‐11 2011‐12 2012‐13
Kentucky National Average
Kentucky’s percentage of working‐age adults who
hold a two‐year and four‐year college degree falls well
below the national average.8 This, coupled with
demand for workers trained beyond high school,1
means that Kentucky has work to do in catching up
with the rest of the nation in developing a 21st century
workforce.
Figure 13 shows the annual percent change from
the previous year in degrees and credentials awarded
in Kentucky, as well as the national average during the
post‐Recession years. Between 2008‐09 and 2012‐13,
Kentucky and the national average posted positive
growth every year. Kentucky grew more dramatically
than the rest of the nation from 2009 to 2011, but the
overall trend for the state was similar to the average
for the rest of the nation.
Kentucky’s growth in degrees and credentials
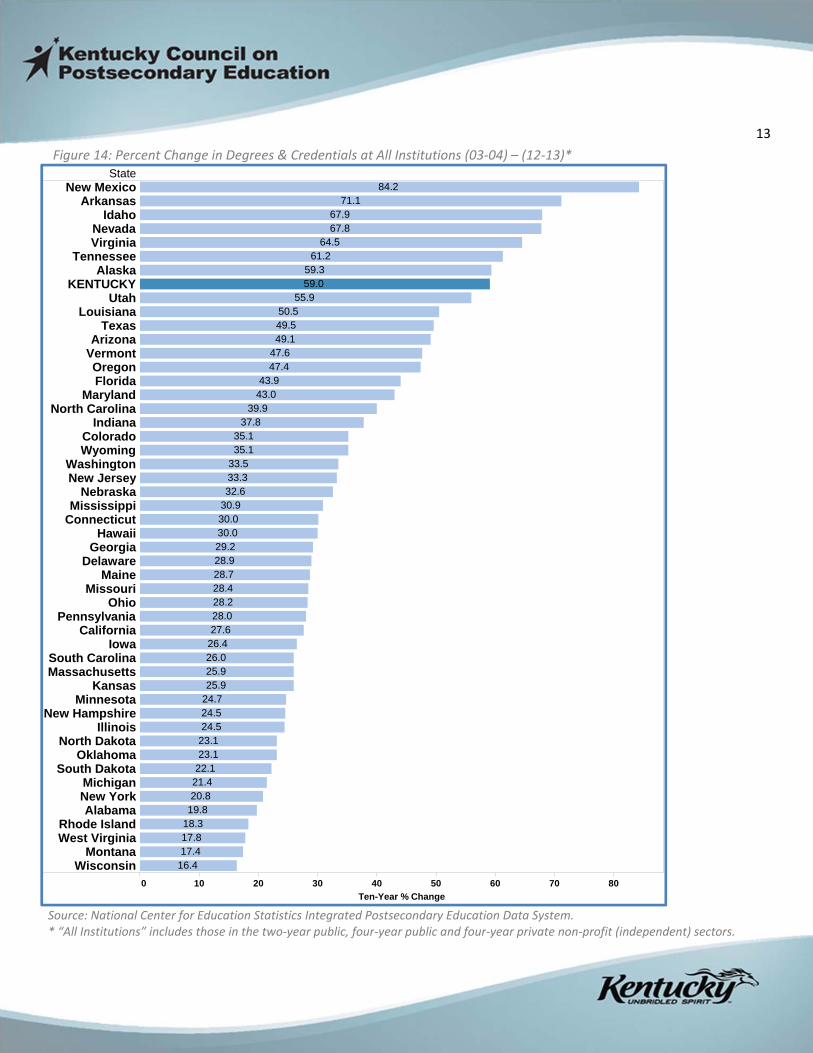
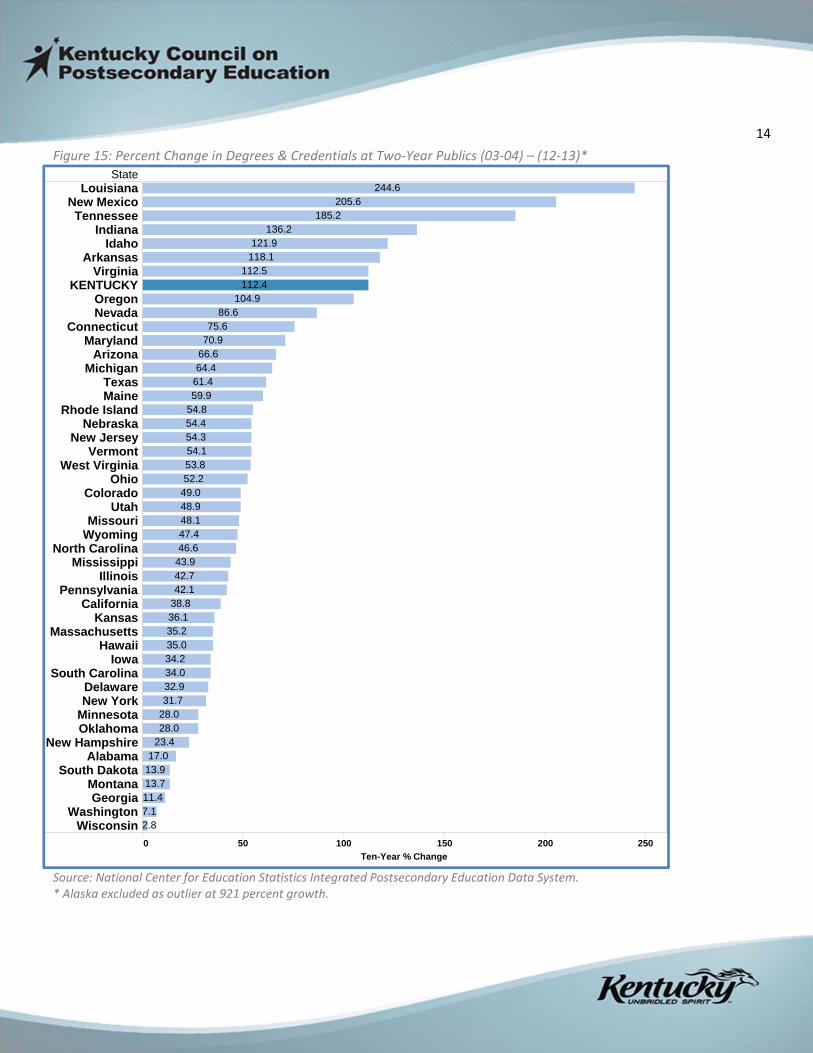
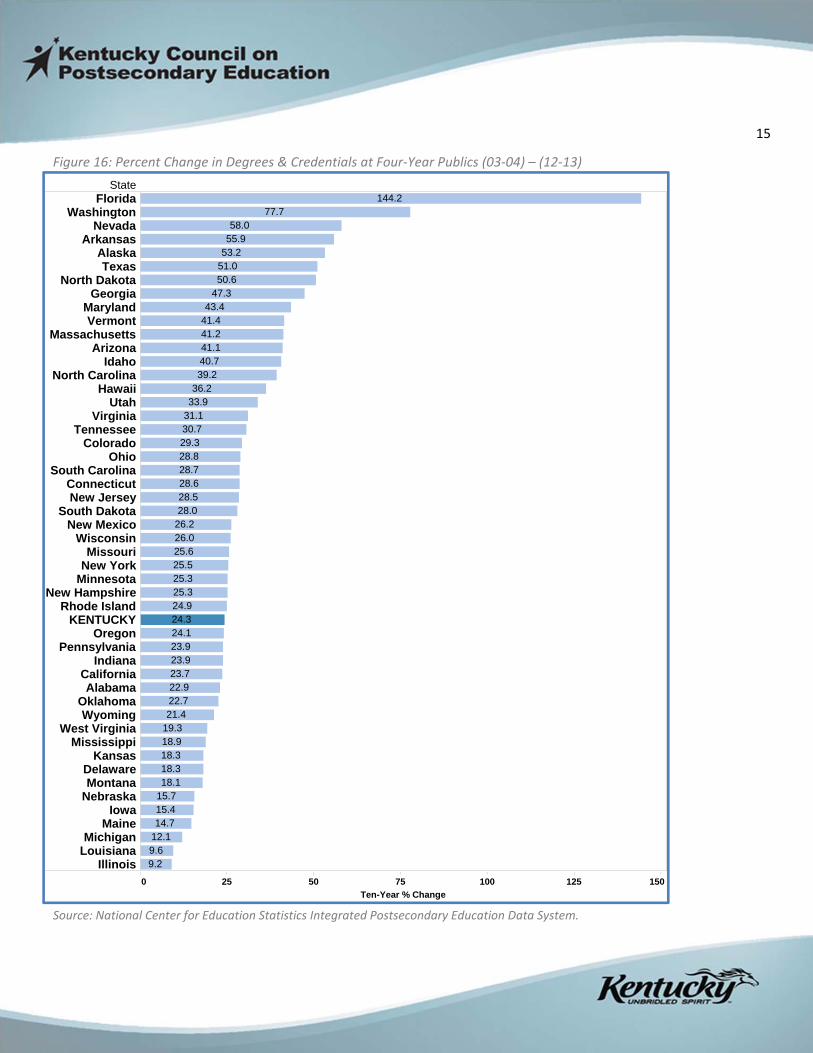
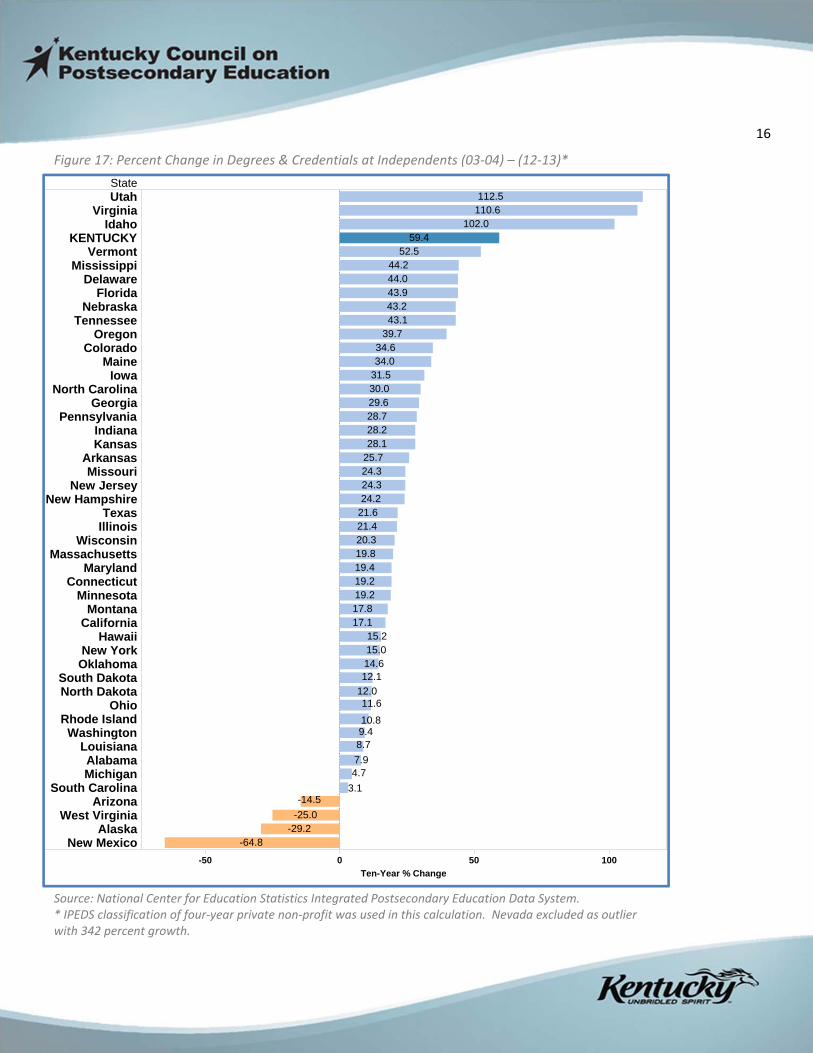
earned between 2003‐04 and 2012‐13, as shown in
Figures 14 through 17, ranks:
8th nationally in total growth at 59 percent
9th in two‐year public sector growth at 112
percent
32nd in four‐year public sector growth at 24
percent
5th in independent sector growth at 59 percent
These trends are promising. Progress has been
made, but work remains as Kentucky’s level of
postsecondary education attainment is below the
nation and many other states.8 Therefore, the rest of
this report is dedicated to understanding the state’s
progress compared to the rest of the nation, and to
offering recommendations for growing not just the
number of degrees in the state, but also their impact.
13
State
0 10 20 30 40 50 60 70 80
Ten-Year % Change
New MexicoArkansas
IdahoNevadaVirginia
TennesseeAlaska
KENTUCKYUtah
LouisianaTexas
ArizonaVermontOregonFlorida
MarylandNorth Carolina
IndianaColoradoWyoming
WashingtonNew Jersey
NebraskaMississippi
ConnecticutHawaii
GeorgiaDelaware
MaineMissouri
OhioPennsylvania
CaliforniaIowa
South CarolinaMassachusetts
KansasMinnesota
New HampshireIllinois
North DakotaOklahoma
South DakotaMichiganNew YorkAlabama
Rhode IslandWest Virginia
MontanaWisconsin
24.524.5
33.5
50.5
64.5
49.5
39.9
25.9
67.967.8
20.819.8
55.9
28.9
30.9
43.9
17.8
37.8
25.9
24.7
28.7
33.3
18.3
59.3
27.6
47.6
32.6
28.0
26.0
30.030.0
59.0
43.0
28.4
26.4
47.4
21.4
17.416.4
28.2
29.2
84.2
61.2
71.1
23.123.1
22.1
49.1
35.135.1
Figure 14: Percent Change in Degrees & Credentials at All Institutions (03‐04) – (12‐13)*
Source: National Center for Education Statistics Integrated Postsecondary Education Data System. * “All Institutions” includes those in the two‐year public, four‐year public and four‐year private non‐profit (independent) sectors.
14
Figure 15: Percent Change in Degrees & Credentials at Two‐Year Publics (03‐04) – (12‐13)* State
0 50 100 150 200 250
Ten-Year % Change
LouisianaNew MexicoTennessee
IndianaIdaho
ArkansasVirginia
KENTUCKYOregonNevada
ConnecticutMaryland
ArizonaMichigan
TexasMaine
Rhode IslandNebraska
New JerseyVermont
West VirginiaOhio
ColoradoUtah
MissouriWyoming
North CarolinaMississippi
IllinoisPennsylvania
CaliforniaKansas
MassachusettsHawaii
IowaSouth Carolina
DelawareNew York
MinnesotaOklahoma
New HampshireAlabama
South DakotaMontanaGeorgia
WashingtonWisconsin
112.5
121.9
104.9
244.6205.6
112.4
185.2136.2
118.1
48.9
32.9
70.9
53.8
38.8
43.9
59.954.8
13.913.7
54.3
42.7
31.7
86.675.6
66.6
46.6
49.0
35.0
34.0
28.028.0
17.0
64.461.4
47.4
23.4
54.4
11.4
52.2
35.2
34.2
48.1
42.1
36.1
54.1
2.87.1
Source: National Center for Education Statistics Integrated Postsecondary Education Data System. * Alaska excluded as outlier at 921 percent growth.
15
Figure 16: Percent Change in Degrees & Credentials at Four‐Year Publics (03‐04) – (12‐13)
State
0 25 50 75 100 125 150
Ten-Year % Change
FloridaWashington
NevadaArkansas
AlaskaTexas
North DakotaGeorgia
MarylandVermont
MassachusettsArizona
IdahoNorth Carolina
HawaiiUtah
VirginiaTennessee
ColoradoOhio
South CarolinaConnecticutNew Jersey
South DakotaNew Mexico
WisconsinMissouri
New YorkMinnesota
New HampshireRhode Island
KENTUCKYOregon
PennsylvaniaIndiana
CaliforniaAlabama
OklahomaWyoming
West VirginiaMississippi
KansasDelawareMontana
NebraskaIowa
MaineMichigan
LouisianaIllinois
144.2
25.5
28.5
23.9
55.9
18.9
22.9
33.9
23.9
24.9
28.8
77.7
24.3
23.7
22.7
40.7
47.3
19.3
18.318.3
15.7
14.7
30.7
28.7
29.3
25.325.3
50.6
25.6
28.6
58.0
51.0
26.0
28.0
43.441.4
21.4
15.4
53.2
41.2
36.2
26.2
39.2
41.1
24.1
18.1
31.1
12.19.69.2
Source: National Center for Education Statistics Integrated Postsecondary Education Data System.
16
Figure 17: Percent Change in Degrees & Credentials at Independents (03‐04) – (12‐13)*
State
-50 0 50 100
Ten-Year % Change
UtahVirginia
IdahoKENTUCKY
VermontMississippi
DelawareFlorida
NebraskaTennessee
OregonColorado
MaineIowa
North CarolinaGeorgia
PennsylvaniaIndianaKansas
ArkansasMissouri
New JerseyNew Hampshire
TexasIllinois
WisconsinMassachusetts
MarylandConnecticut
MinnesotaMontana
CaliforniaHawaii
New YorkOklahoma
South DakotaNorth Dakota
OhioRhode IslandWashington
LouisianaAlabamaMichigan
South CarolinaArizona
West VirginiaAlaska
New Mexico
-14.53.1
4.77.9
8.79.410.8
11.612.0
12.114.615.015.2
112.5110.6
102.0
-64.8
-25.0-29.2
52.5
31.5
43.9
19.8
17.8
39.7
28.7
25.724.324.3
20.3
34.6
29.6
21.6
44.0
34.0
30.0
59.4
21.4
19.4
44.2
43.2
24.2
19.219.2
28.2
43.1
28.1
17.1
Source: National Center for Education Statistics Integrated Postsecondary Education Data System. * IPEDS classification of four‐year private non‐profit was used in this calculation. Nevada excluded as outlier with 342 percent growth.

17
In the past decade, the U.S. experienced the worst
recession in generations, Kentucky’s unemployment
rate climbed into the double digits, and college tuition
rates grew at a record pace. Even in the face of these
challenges, Kentucky’s system of postsecondary
education expanded its sphere of influence. Between
2004 and 2014, enrollment in Kentucky colleges and
universities grew by more than 7 percent. At the same
time, postsecondary institutions increased the number
of degrees and credentials they awarded by nearly 60
percent; the eighth largest gain in the U.S.
The analysis of Kentucky’s degree and credential
production in this report has brought to light several
key trends and highlighted successes, areas of
opportunity for improvement, and questions for future
research. These, along with policy recommendations,
are included below.
SUCCESSES Rapid Pace of Growth
With a 59 percent increase between 2003‐04 and
2012‐13 in the total number of postsecondary degrees
and credentials awarded, Kentucky ranked:
8th nationally in total growth
9th in two‐year public sector growth at 112
percent
32nd in four‐year public sector growth at 24
percent
5th in independent sector growth at 59 percent
Closing the Gender Gap In the five academic years between 2009‐10 and
2013‐14, the disparity between degrees and credentials
CONCLUSIONS & RECOMMENDATIONS
earned by men and women shrank. In this time, men
outpaced women in percentage growth across sectors.
While women continued to earn more postsecondary
degrees and credentials than men, positive progress
was made in closing this gap.
Racial Inequalities Among the most troubling realities in Kentucky’s
higher education landscape has been the disparities in
outcomes between students of majority and minority
racial/ethnic backgrounds. While these imbalances
manifest themselves in many ways, the gap in degrees
and credentials earned by white students and those
who do not identify as white has been troubling.
In the last five years, however, progress has been
made. Specifically, students who identify as black and
those identifying as Hispanic have made significant
gains in the number of degrees and credentials they
earned. Degrees and credentials awarded to black
students grew by 20 percent between 2009‐10 and
2013‐14, and those earned by Hispanic students grew
by 125 percent.
Graduate Degrees The upskilling of the American workforce cannot
stop at the certificate, associate or baccalaureate
levels. Individuals with graduate degrees often occupy
jobs in critical industries such as health care,
engineering and education. These people are also
found in leadership positions, often engage in
innovation and are a positive force in local economies.
Fortunately, graduate degrees in the state of
Kentucky are on the rise. Doctoral degrees were
awarded at a 36 percent higher rate in 2013‐14 than in
18
2004‐05 and master’s/specialists awards increased by
27 percent, from 6,570 to 8,327. As the need for more
highly educated workers continues to rise, attention
must be paid to the impact of graduate education on
the Commonwealth, both now and in the future.
OPPORTUNITIES Four‐Year Degrees & Credentials
While the number of baccalaureate degrees grew
between 2004‐05 and 2013‐14, four‐year degrees
made up a much smaller piece of the overall
completion pie in 2013‐14 than in 2004‐05. Ten years
ago, bachelor’s degrees made up almost half of all
degrees and credentials, and now they account for only
around a third.
It is important that alternative degrees and
credentials grow, particularly those that can be more
responsive to the needs of the state’s employers and
employees. However, it is also important to remain
aware that in the near future almost two‐thirds of the
jobs in the state will require postsecondary education
or training, and many of these jobs will require a
bachelor’s degree. While the growth of alternative
degree types should be fostered, the importance of
baccalaureate degrees cannot be ignored and a
commitment should be made to encourage students’
pursuit of four‐year degrees.
Liberal and Humanities In the last 10 years, the majority of growth in
degrees and credentials has come in fields of study that
require technical training. Degrees and credentials in
the trades, STEM and health fields saw the largest 10‐
year growth in Kentucky. Between 2004‐05 and 2013‐
14, degrees and credentials grew by 111 percent in the
trades, by 85 percent in the health field, and by 51
percent in STEM. In comparison, degrees and
credentials grew by 46 percent in the arts and
humanities, by 25 percent in business and
communication, and by only 9 percent in education.
The growth in these fields is likely due in large part
to workforce needs. However, just as Kentucky should
not neglect baccalaureate degrees, the state also would
be wise to emphasize growth in degrees associated
with the liberal arts, as these also address pressing
workforce needs. According to a recent survey5 by the
American Association of Colleges and Universities
(AAC&U), more than 90 percent of employers stated
that they prioritize skills often associated with liberal
fields of study: written and oral communication,
problem‐solving, innovation, and critical thinking. In the
same survey, nearly three‐fourths of employers said
they would recommend a 21st century liberal arts
education to a young person they know.
Gender Gap Despite progress in closing degree and credential
completion gaps between men and women, Kentucky
still has much work to do in ensuring equitable
outcomes for its students. Between 2009‐10 and 2013‐
14, men outpaced women in growth in the number of
degrees and credentials earned in all three sectors. The
gap in the percentage growth in degrees and
credentials earned by men as compared to women was
10 percent in the two‐year public sector, 6 percent in
the four‐year public sector, and 2 percent in the
independent sector. Despite these gains, however,
women still earned more degrees and credentials than
men in every year between 2009‐10 and 2013‐14.
While progress has been made in terms of growth
in the number of degrees and credentials earned by
male students, not enough has been done to close the
gap between attainment levels of men and women. If
Kentucky’s postsecondary system is to accomplish fully
the goals outlined in its mission, then it must address
these issues and ensure equity in opportunity and
outcomes for all students.
19
FUTURE RESEARCH The primary goal of the Kentucky Completion
Report is to develop a deeper understanding of key
trends in degree and credential production in
Kentucky’s postsecondary institutions. Despite all that
can be learned in this effort, questions remain and new
lines of inquiry have emerged. Below are four
questions that have emerged from this report and
warrant future consideration.
Sub‐Baccalaureate Degree & Credentials With an increase of 159 percent in the last 10
years, the growth in the number of undergraduate
certificates awarded in the state has far outpaced
growth of any other degree or credential. If this
positive trend is to continue, it is important to
understand what has prompted so many more students
to seek out certificates and how the state can leverage
this demand in the future. Future research should
address the following questions:
1. What forces have prompted the growth in
demand for degrees and credentials that take
two or fewer years to complete?
2. Is this a long‐term trend?
3. If so, how can institutions best meet this
demand?
Applied vs. General Education Similar to the growth in undergraduate certificates,
the increase in degrees and credentials was heavily
concentrated in certain fields of study. Degrees in the
trades, health and STEM fields have seen more
concentrated growth in the last 10 years than fields of
study more commonly associated with the liberal arts.
Again, this prompts questions that might lead to an
understanding of both why this trend has occurred and
how to leverage it in the future. These questions
include:
1. Is the increase in degrees and credentials in
applied fields, such as trades, health and STEM,
a by‐product of changing workforce needs?
2. Is this a long‐term trend?
3. If so, how can institutions best meet this need?
Underrepresented Minorities Growth While gaps remain between degree attainment of
white and non‐white students in Kentucky, encouraging
progress has occurred in the last 10 years, particularly
in the number of degrees and credentials earned by
black and Hispanic students. Despite this progress,
significant gaps remain and further study into how best
to close these should be led by questions such as:
1. What can Kentucky do to continue the growth
in degrees and credentials earned by black and
Hispanic students?
2. How can this growth be accelerated to further
close the degree attainment gap?
Adult Population According to the 2013 American Community Survey
conducted by the U.S. Census Bureau, 22 percent of
Kentucky’s residents ages 25‐64 have attended at least
some college but do not hold a degree or credential.
That means there are over 500,000 working‐age
Kentuckians who, at some point, began postsecondary
education but have yet to earn a credential. 6 This
population is an important area of opportunity and
need for postsecondary institutions and for the state. A
better understanding of how best to increase the
attainment levels of these Kentuckians can be
developed through research guided by the following
questions:
1. What policies and/or programs would be
most effective in promoting postsecondary
20
degree and credential attainment amongst
the large number of Kentuckians with some
college credit but no degree?
2. What impact, economic or otherwise, would
raising the degree attainment level of this
population have on Kentucky?
Picking Up the Pace While the 10‐year trend of growth in Kentucky’s
degree and credential production is encouraging, there
is cause for caution. In the past five years, the pace of
growth has slowed from the 5.3 percent average annual
percent increase between 2004‐05 and 2008‐09 to an
average increase of 4.6 percent annually in the last five
years. This slowing trend prompts the following
questions:
1. Can postsecondary institutions regain the rate
of degree and credential growth seen between
2004‐05 and 2008‐09?
2. What are strategies to achieve this goal?
RECOMMENDATIONS The trends in Kentucky’s degree and credential
production described in this report are useful if they are
not left in a vacuum but instead used to drive action.
Below are three broad recommendations for ways
Kentucky’s system of postsecondary education can
leverage this information in working toward its mission
to deliver a world‐class education to students, create
and apply new knowledge, and grow the economy of
the Commonwealth.
Leveraging Demand It is easy to recognize changes in the economy and
in the fundamental nature of work in the U.S. in the
types of jobs being offered today. It is now also clear
that these changes are reflected in the types of degrees
and credentials students pursue. As the economy has
shifted, Kentuckians have retooled by seeking training
in fields with high employment demand and through
short‐term flexible programs.
Institutions should be prepared to operate in this
environment both proactively and reactively. To
leverage this demand, Kentucky colleges and
universities should focus on assessing current and
future needs of the workforce because where the jobs
are is where students want to be. If institutions can
stay abreast of these trends and offer the right kinds of
programs in the right fields, they will enjoy the fruits of
continued growth while addressing the needs of the
state, a win for all of Kentucky.
Minding the Gaps Among the most persistent and troubling
challenges to Kentucky’s system of higher education are
disparities in outcomes between key demographic
groups in the state, particularly the gaps between the
number of degrees and credentials earned by men and
women and between those earned by white and non‐
white students in the state. For years, women and
white students have earned more degrees and
credentials as compared to their male and non‐white
counterparts, respectively. This trend has persisted as
women and white students have continued to earn the
vast majority of degrees each year.
An argument can be made, particularly in the case
of differences between racial/ethnic groups in the state,
that the gaps seen are appropriately aligned with
Kentucky’s population demographics. For example,
about 86 percent of Kentucky’s population identifies as
white, 8 percent of residents identify as black, and just
over 3 percent of Kentuckians identify as Hispanic or
21
Latino.7 These percentages align closely with the
disbursement of degrees and credentials among these
populations. However, given the disproportionate
impact that postsecondary education can have on the
lives and communities of traditionally
underrepresented and underserved populations,
perhaps disproportionate attention being paid to raising
the attainment levels of these populations is warranted.
The good news is that there is reason for optimism.
Between 2009‐10 and 2013‐14, growth among these
key groups in degree and credential attainment was
promising. Specifically the pace of growth in attainment
amongst men, black students, and Hispanic students
was encouraging and could be an indication that some
of these gaps are starting to close. This progress is not
enough, however. Kentucky and its postsecondary
institutions must devote energy and resources toward
understanding the historical conditions that have
perpetuated these disparities and capitalizing on the
conditions that have prompted the progress toward
closing these gaps seen in recent years.
Adult Opportunities Kentucky lags behind much of the United States in
its percentage of adults holding postsecondary degrees
and credentials. Positive gains have been made over the
last 10 years, but more progress is necessary. Recent
projections show that by 2020, the number of jobs in
Kentucky requiring a postsecondary degree or
credential will outpace the number of Kentuckians with
postsecondary education and training by 10 percent. 4
This projected shortage makes raising degree and
credential attainment levels for all populations a
priority. However, with more than half a million
Kentuckians between the ages of 25 and 64 holding
some postsecondary credit but no degree, the adult
population is an area ripe with opportunity as these are
people who could benefit from finishing programs they
have already begun. Implementing policies and
programs designed to promote the return to
postsecondary education of such a large group would
help the state close its skills gap, while improving the
futures of thousands of Kentucky families.
Keeping Momentum The Commonwealth has enjoyed unprecedented
growth in the number of people earning postsecondary
degrees and credentials. As important as this has been
to Kentucky in recent years, the critical role of
postsecondary education will only continue to grow in
years to come. In the face of slowing growth, a call for
renewed focus on educational attainment must be
issued as the clearest path toward prosperity for the
state and its citizens in the 21st century.

22
REFERENCES
1. Duncan, Arne. “Remarks of U.S. Secretary of Education Arne Duncan at the TIME Higher Education Summit.”
Presentation at the TIME Higher Education Summit. Washington, D.C., October 18, 2012.
2. Gallup, Lumina Foundation. “THE 2014 Gallup‐Lumina Foundation study of the American Public’s Opinion on
Higher Education Aspirations and Barriers,” 2015.
3. Carnavale, A. P., Rose, S. J. “The Economy Goes to College: The Hidden Promise of Higher Education in the Post‐
Industrial Service Economy.” Georgetown Center on Education and the Workforce, 2015.
4. Carnavale, Anthony; Smith, Nicole; Strohl, Jeff. “Recovery: Projections of Jobs and Education Requirements
Through 2020.” Georgetown Center on Education and the Workforce, 2013.
5. Hart Research Associates. “It Takes More Than a Major: Employer Priorities for College Learning and Student
Success.” (Washington, D.C.: AAC&U, 2013). Retrieved from http://www.aacu.org/leap/public_
opinion_research.cfm.
6. U. S. Census Bureau (2013). 2013 American Community Survey.
7. U.S. Census Bureau (August, 2015): State and County QuickFacts. Data derived from Population Estimates,
American Community Survey, Census of Population and Housing, State and County Housing Unit Estimates,
County Business Patterns, Nonemployee Statistics, Economic Census, Survey of Business Owners, Building
Permits.
8. Lumina Foundation. (2015). A Stronger Nation through Higher Education: Ten‐Year Time Horizon Brings Goal 2025
into Sharp Focus. Annual Report. Retrieved from
https://www.luminafoundation.org/files/publications/A_stronger_nation_through_higher_education‐2015.pdf.