Embed Size (px)
Citation preview
KN Rao Director, Energy & Environment
ACC Limited (LafargeHolcim)
Paris, 1 December 2015
GHG Reduction Potentials In The Indian
Cement Industry: A Way Forward
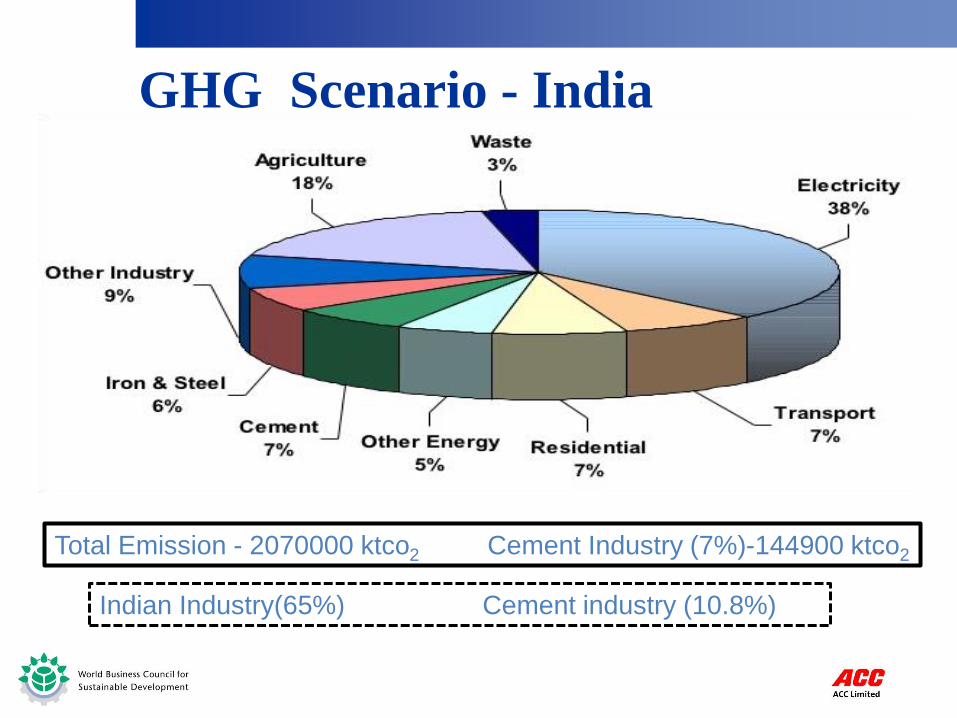
GHG Scenario - India
Total Emission - 2070000 ktco2 Cement Industry (7%)-144900 ktco2
Indian Industry(65%) Cement industry (10.8%)
3
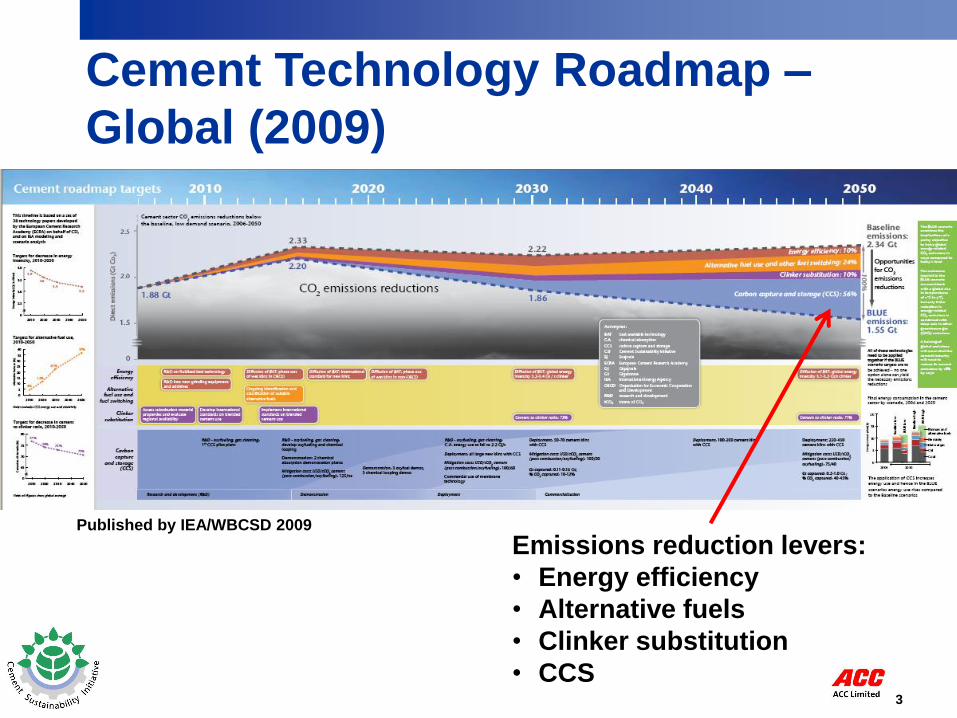
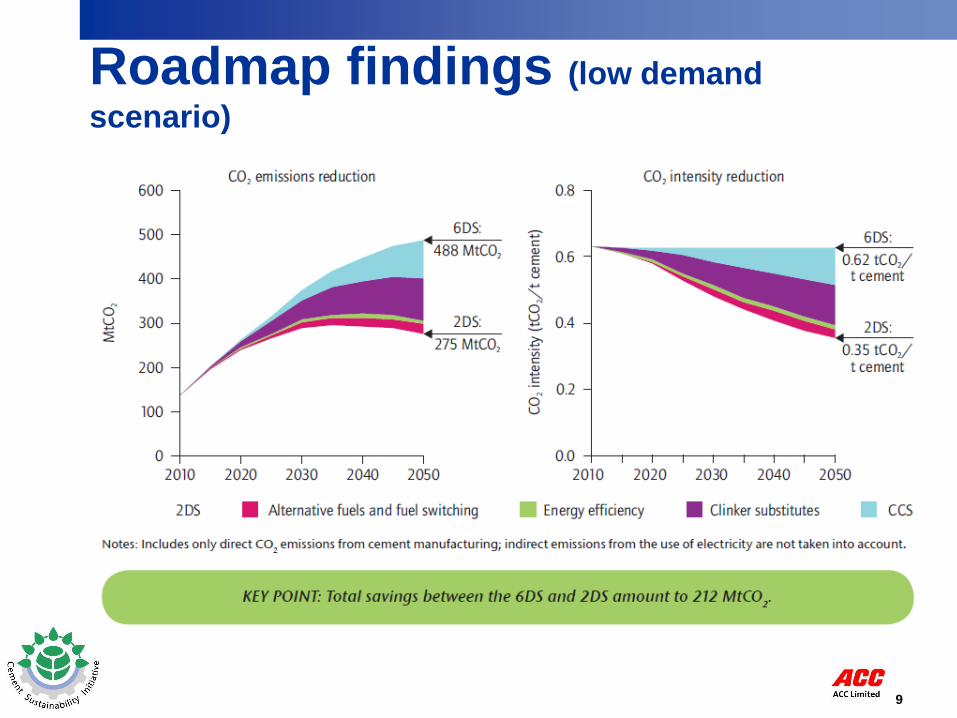
Emissions reduction levers:
• Energy efficiency
• Alternative fuels
• Clinker substitution
• CCS
Published by IEA/WBCSD 2009
Cement Technology Roadmap –
Global (2009)
4
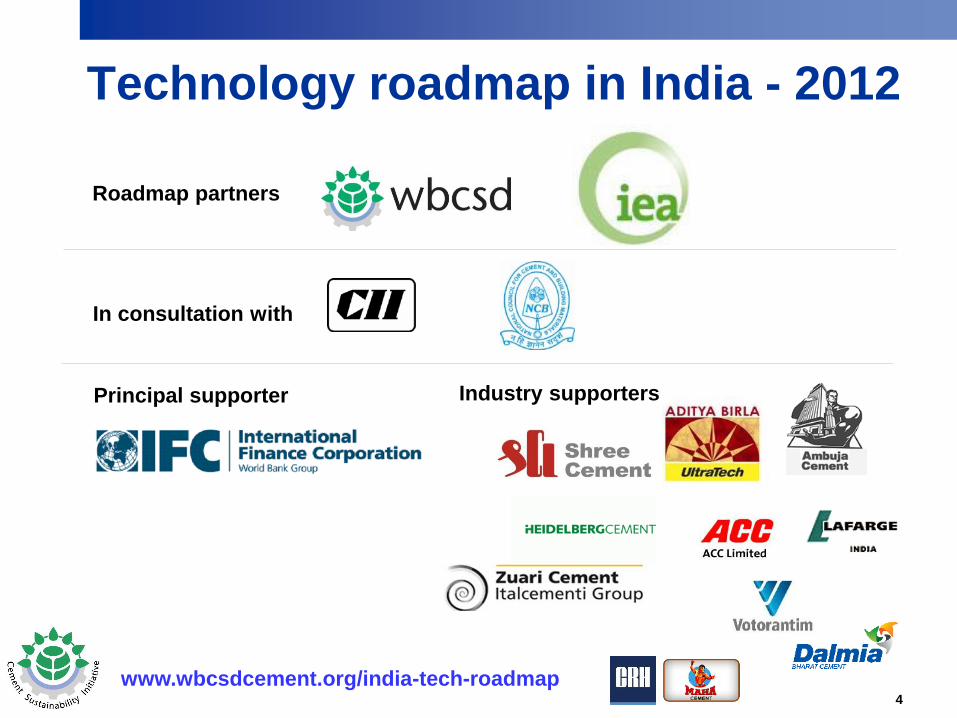
Technology roadmap in India - 2012
In consultation with
Roadmap partners
Principal supporter Industry supporters
www.wbcsdcement.org/india-tech-roadmap
5
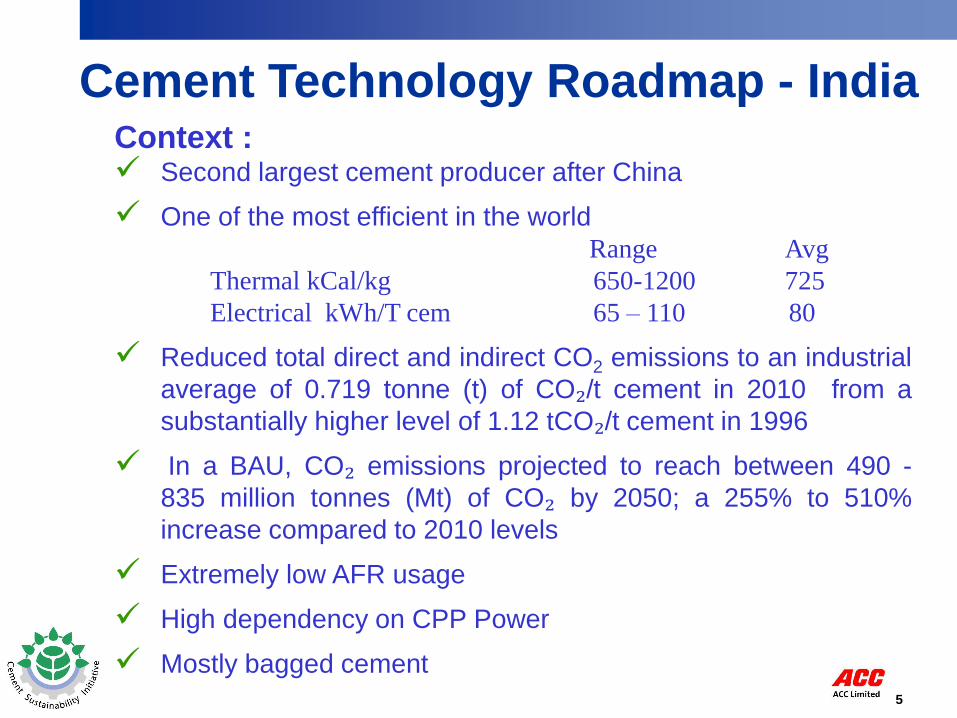
Cement Technology Roadmap - India Context : Second largest cement producer after China
One of the most efficient in the world
Range Avg
Thermal kCal/kg 650-1200 725
Electrical kWh/T cem 65 – 110 80
Reduced total direct and indirect CO2 emissions to an industrial
average of 0.719 tonne (t) of CO₂/t cement in 2010 from a
substantially higher level of 1.12 tCO₂/t cement in 1996
In a BAU, CO₂ emissions projected to reach between 490 -
835 million tonnes (Mt) of CO₂ by 2050; a 255% to 510%
increase compared to 2010 levels
Extremely low AFR usage
High dependency on CPP Power
Mostly bagged cement
6
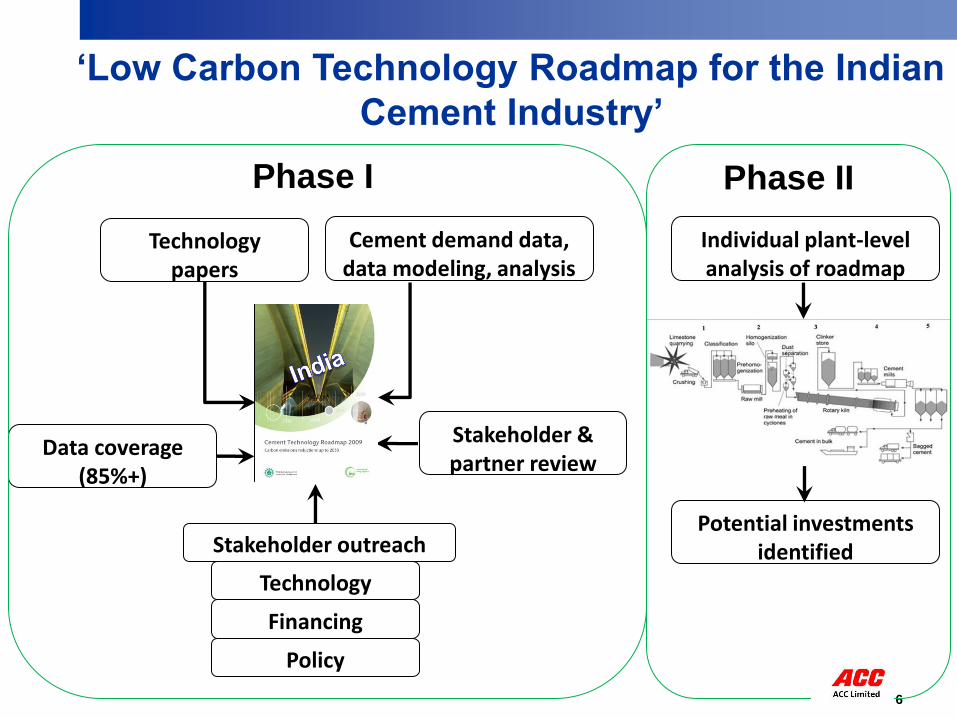
Technology papers
Cement demand data, data modeling, analysis
Technology
Financing
Policy
Cement
Sector
Roadma
Stakeholder outreach
Stakeholder & partner review
Data coverage (85%+)
‘Low Carbon Technology Roadmap for the Indian
Cement Industry’
Phase I Phase II
Individual plant-level analysis of roadmap
Potential investments identified
7
Cement Technology Roadmap - India
Roadmap approach:
The road map modelling has been developed in response
to the IEA 2°C (2DS) and its two variants, based on
demand for materials: the Low- and High-Demand Cases
Roadmap Scope and Boundary:
Surface mining/quarrying to the sale of cement to
consumer,
Energy and emission reduction levers specific to the
cement manufacturing process
CPP is out of scope of Cement manufacturing process and
so not included in modeling
8
Cement Technology Roadmap - India
Key levers to reduce emissions in Indian cement industry viz.
increased rates of blending leading to a reduction in clinker factor
etc., are identified and discussed in detail
By 2050, as much as 150 MtCO2 could be saved through
efficiency improvement and use of alternative energy sources in
CPPs
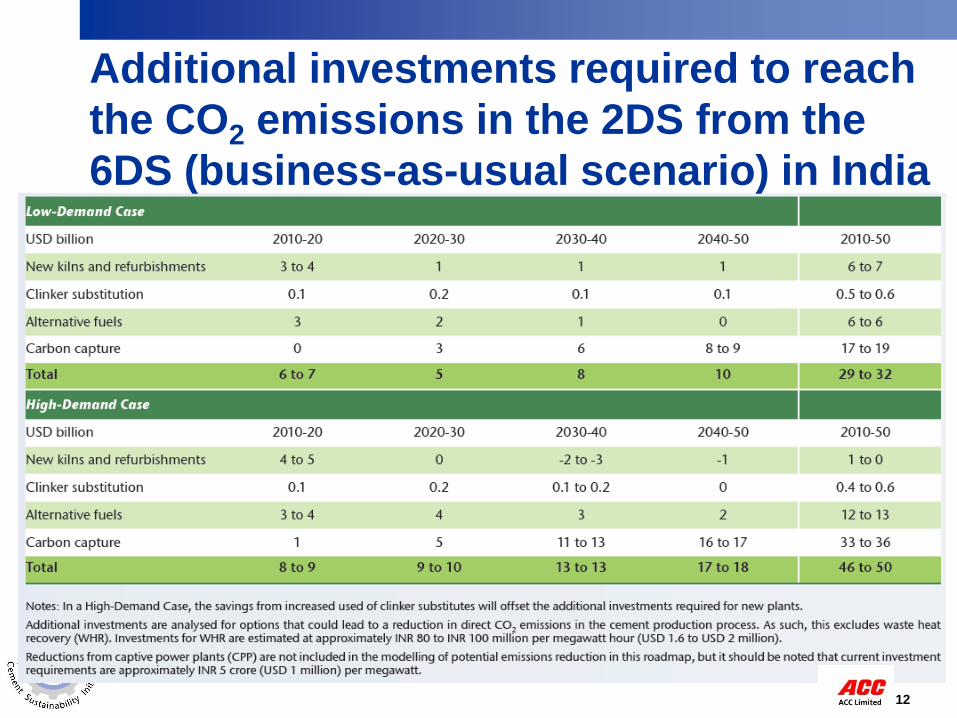
Additional investment requirements (based on net present value)
to achieve the CO₂ emissions reduction set out in this roadmap are
between USD 29 billion to USD 47 billion, or 15% to 25% higher
than in a BAU scenario
9
Roadmap findings (low demand
scenario)
10
Socio-economic benefits derived from
Roadmap levers
• Clinker substitution & Increased AFR usage
– Decreases loads on landfills & incinerators & their
environmental impacts, including: potential groundwater
pollution, methane generation and hazardous ash residues
– Properly designed and operated cement kilns can provide a
practical, cost-effective and environmentally effective
alternative to landfill and incineration
– Energy and materials recovery, offering safe disposal options
for many different types of waste
– Creating safer livelihoods by bringing waste scavengers into
the organized sector
– Energy plantations create sustainable livelihoods in rural areas
– Conservation of limestone & fossil fuel
11
Socio-economic benefits derived from
Roadmap levers
• Energy efficiency
– Reduction in consumption of coal and other fossil fuels has a
direct bearing on contributing to the energy security of the
country
– Electricity access for all due to reduction in demand
– Conservation of fossil fuels
– Opportunity for job creation and GDP growth
• Carbon capture & utilisation
– Conversion of CO2 to chemicals or fuel
– Reduces dependence on natural raw materials and fuels
– Minimizing CO2 mitigation costs
12
Additional investments required to reach
the CO2 emissions in the 2DS from the
6DS (business-as-usual scenario) in India
13
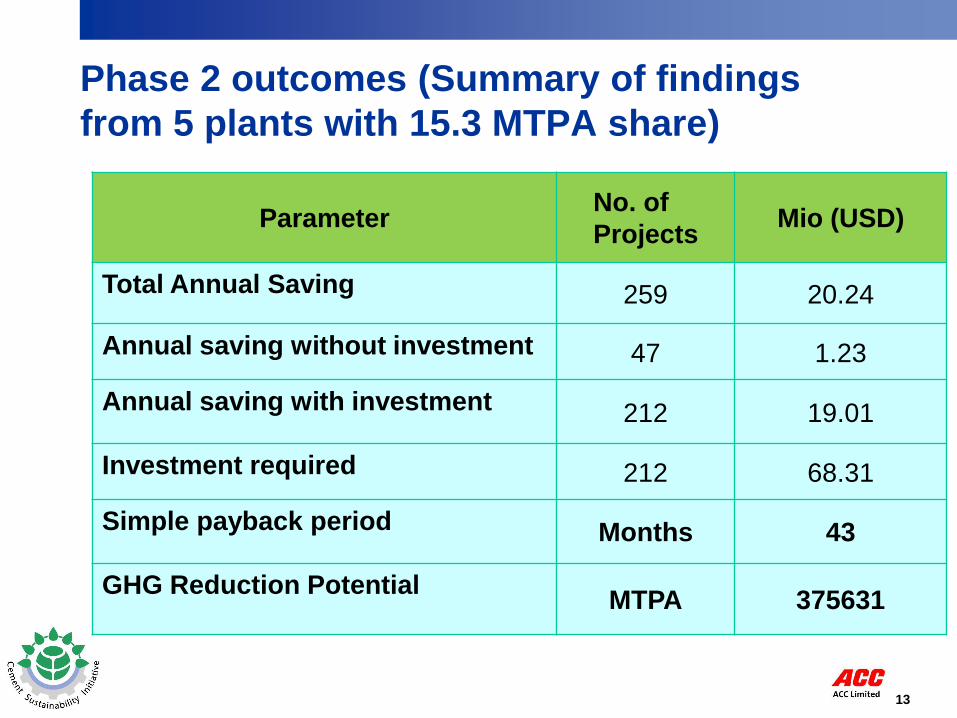
Phase 2 outcomes (Summary of findings
from 5 plants with 15.3 MTPA share)
Parameter No. of
Projects Mio (USD)
Total Annual Saving 259 20.24
Annual saving without investment 47 1.23
Annual saving with investment 212 19.01
Investment required 212 68.31
Simple payback period Months 43
GHG Reduction Potential MTPA 375631
14
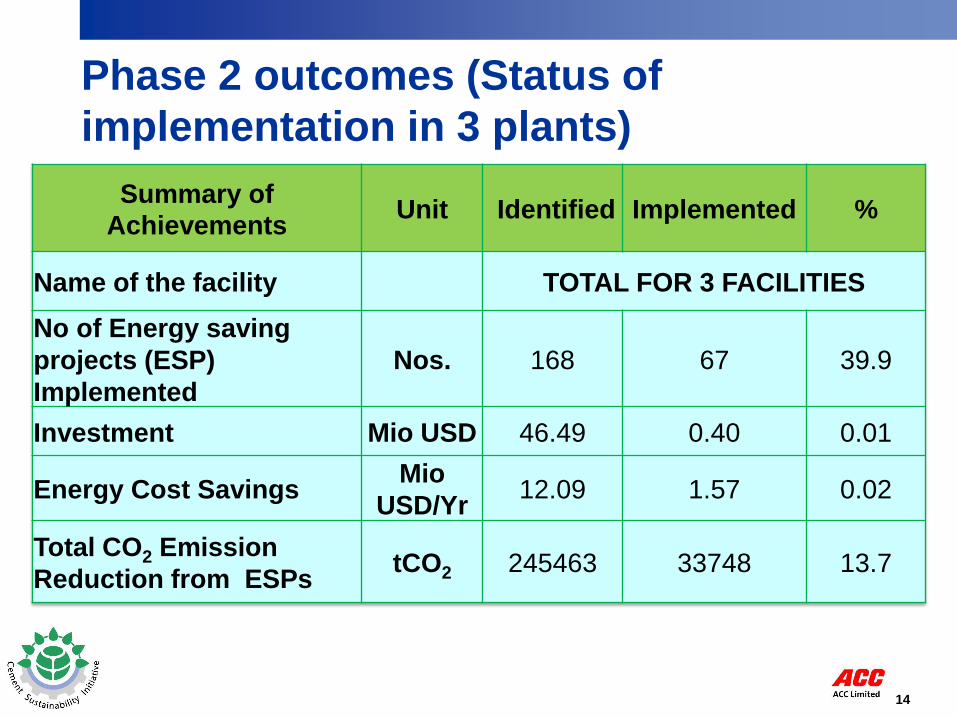
Phase 2 outcomes (Status of
implementation in 3 plants)
Summary of
Achievements Unit Identified Implemented %
Name of the facility TOTAL FOR 3 FACILITIES
No of Energy saving
projects (ESP)
Implemented
Nos. 168 67 39.9
Investment Mio USD 46.49 0.40 0.01
Energy Cost Savings Mio
USD/Yr 12.09 1.57 0.02
Total CO2 Emission
Reduction from ESPs tCO2 245463 33748 13.7
15
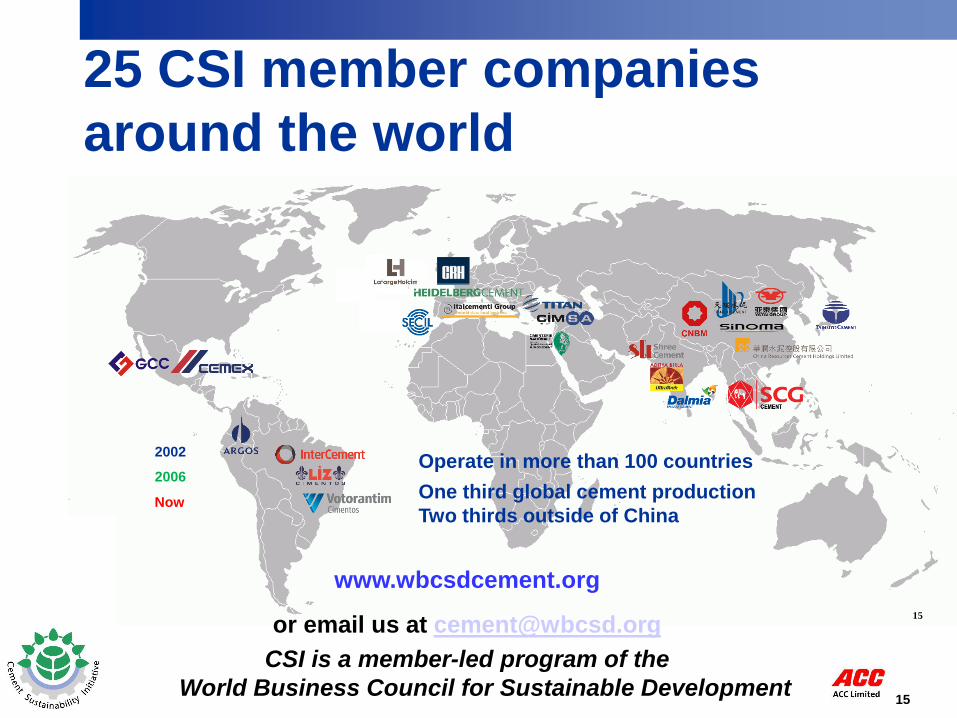
25 CSI member companies
around the world
Operate in more than 100 countries
One third global cement production
Two thirds outside of China
2002
2006
Now
15
www.wbcsdcement.org
or email us at [email protected]
CSI is a member-led program of the
World Business Council for Sustainable Development


![GHG presentation 2 [Autosaved]](https://img.pdfslide.tips/doc/110x75/58ef3baf1a28abaa358b4687/ghg-presentation-2-autosaved.jpg)