Embed Size (px)
Citation preview

Kubernetes 導入 Prometheus
Kevin K Chang 張凱傑
2016 / 9 / 22

Copyright 2016 Trend Micro Inc. 2
Kubernetes
Copyright 2016 Trend Micro Inc. 3
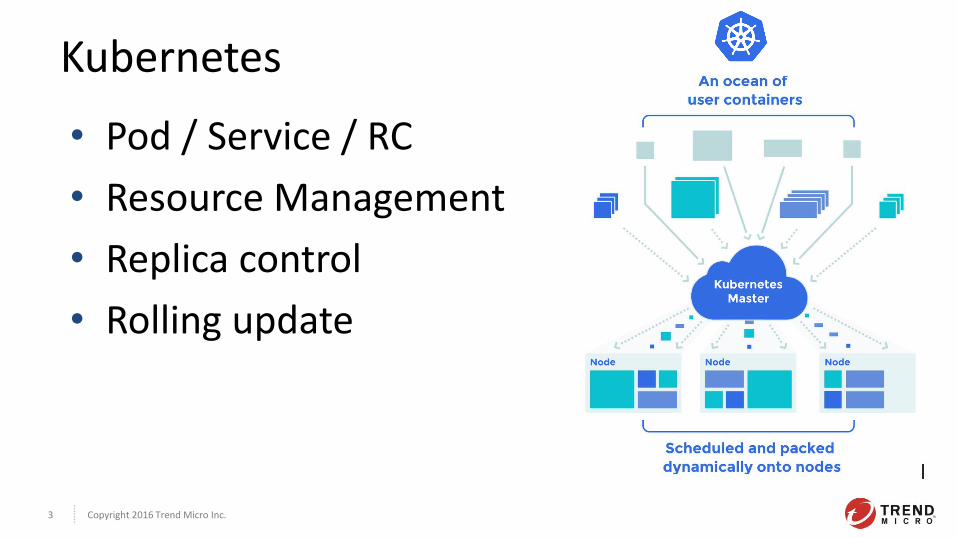
Kubernetes
• Pod / Service / RC
• Resource Management
• Replica control
• Rolling update
Copyright 2016 Trend Micro Inc. 4
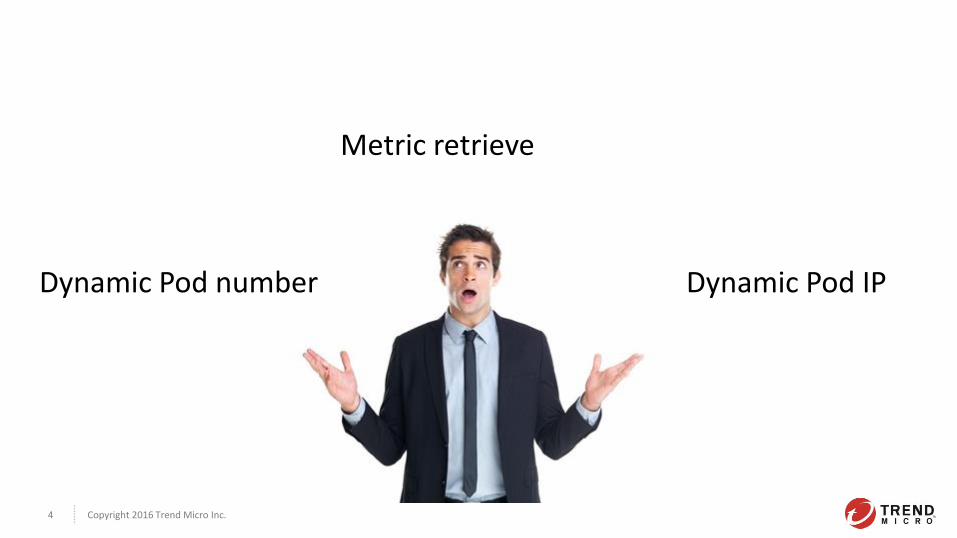
Dynamic Pod IP Dynamic Pod number
Metric retrieve

Copyright 2016 Trend Micro Inc. 5
Prometheus
Copyright 2016 Trend Micro Inc. 6
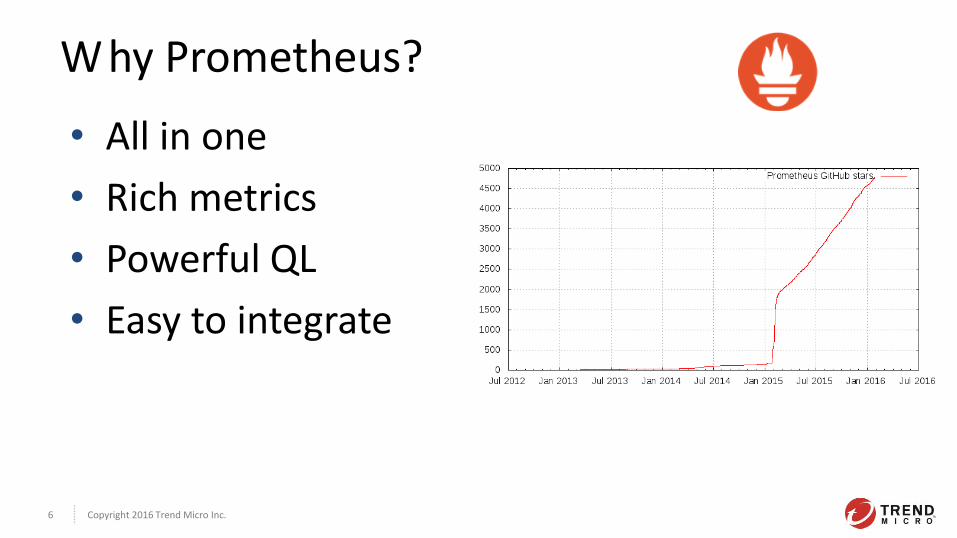
W hy Prometheus?
• All in one
• Rich metrics
• Powerful QL
• Easy to integrate
Copyright 2016 Trend Micro Inc. 7
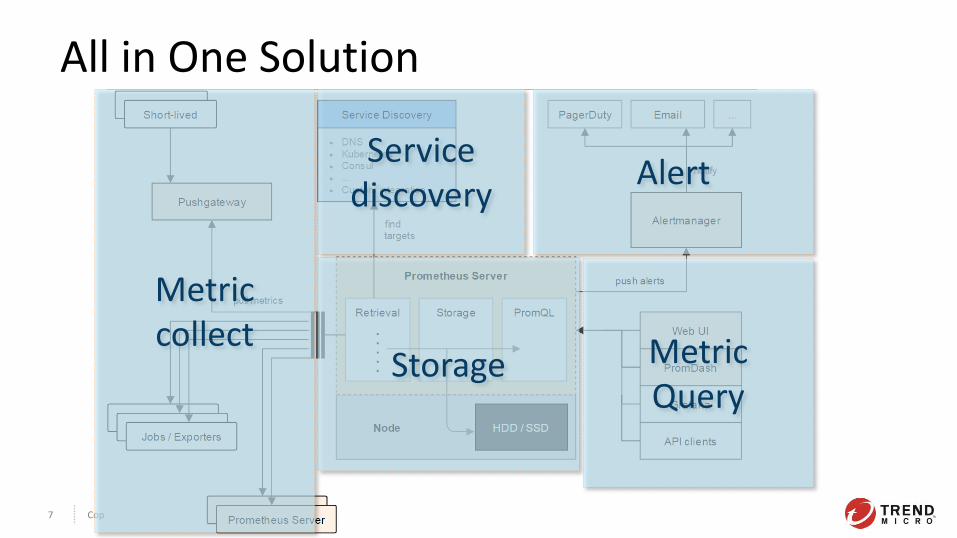
All in One Solution
Storage
Service discovery
Metric collect Metric
Query
Alert
Copyright 2016 Trend Micro Inc. 8
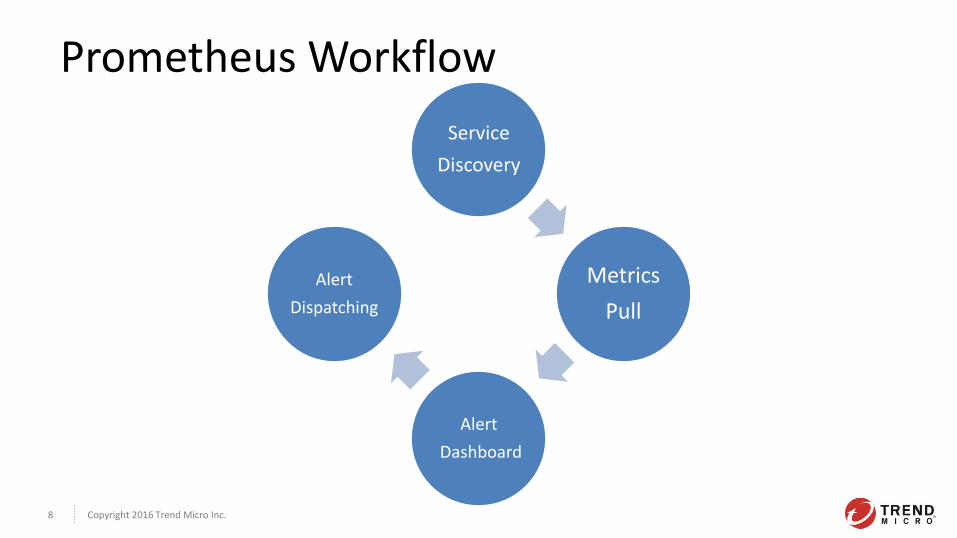
Prometheus Workflow
Service
Discovery
Metrics
Pull
Alert
Dashboard
Alert
Dispatching
Copyright 2016 Trend Micro Inc. 9
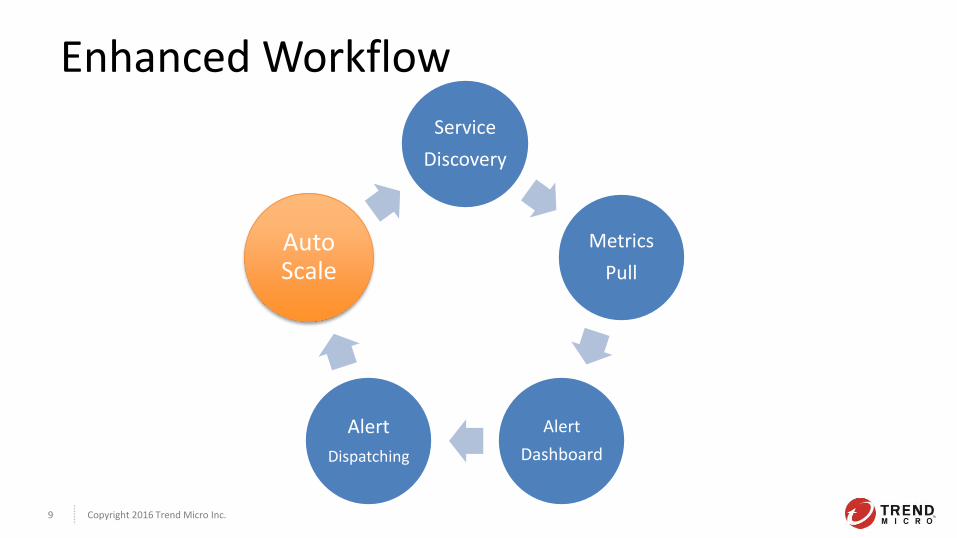
Enhanced Workflow
Service
Discovery
Metrics
Pull
Alert
Dashboard
Alert
Dispatching
Auto Scale

Copyright 2016 Trend Micro Inc. 10
1. Service Discovery
Copyright 2016 Trend Micro Inc. 11
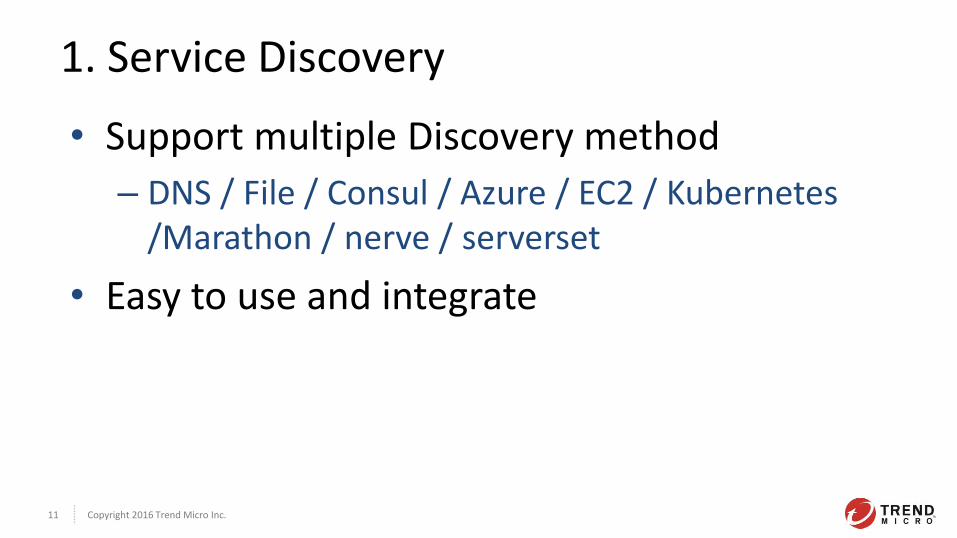
1. Service Discovery
• Support multiple Discovery method
– DNS / File / Consul / Azure / EC2 / Kubernetes /Marathon / nerve / serverset
• Easy to use and integrate
Copyright 2016 Trend Micro Inc. 13
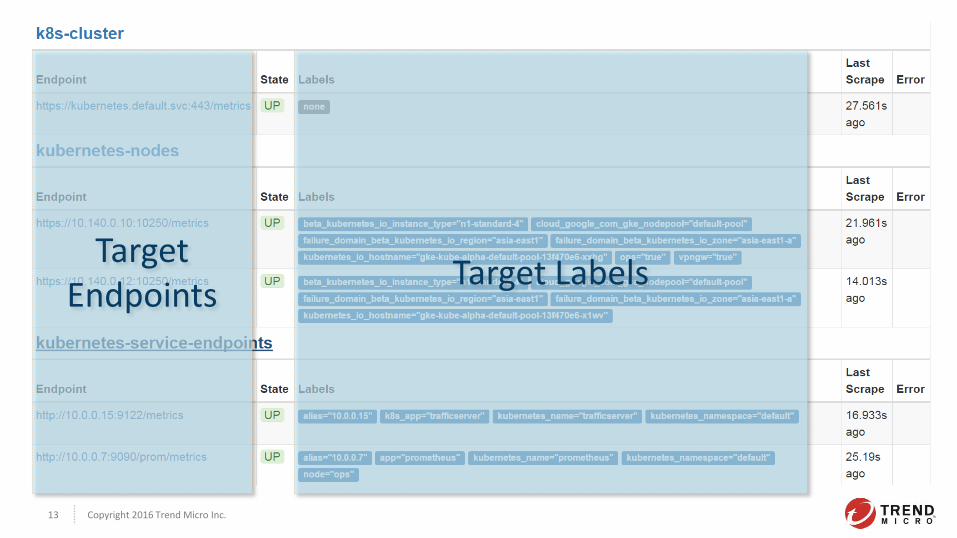
Target Endpoints
Target Labels

Copyright 2016 Trend Micro Inc. 14
2. Metrics Pull
Copyright 2016 Trend Micro Inc. 15
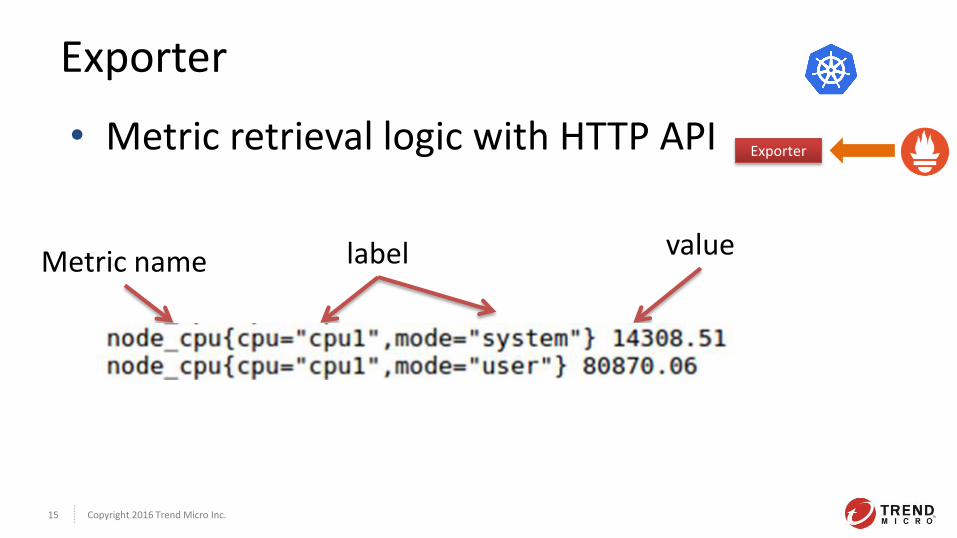
Exporter
Exporter • Metric retrieval logic with HTTP API
Metric name label value
Copyright 2016 Trend Micro Inc. 16
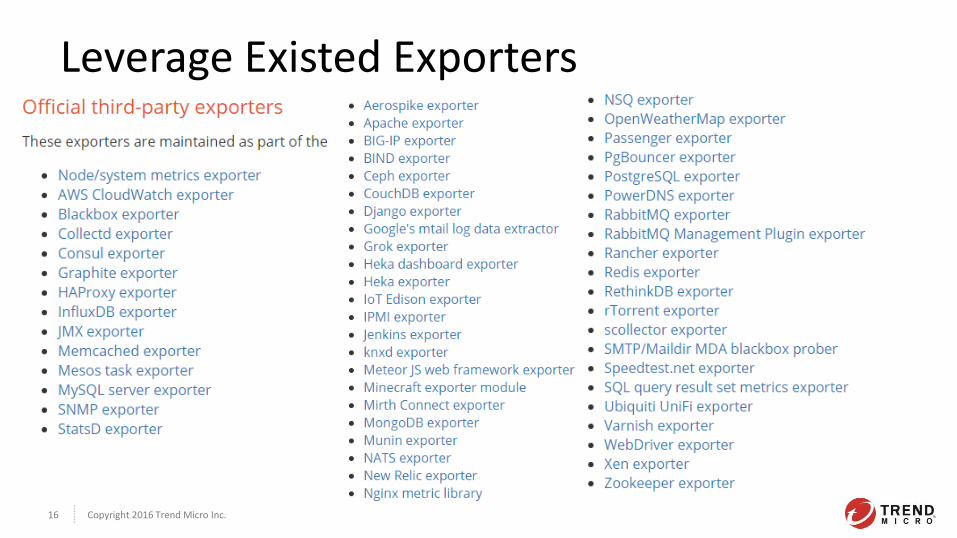
Leverage Existed Exporters
Copyright 2016 Trend Micro Inc. 17
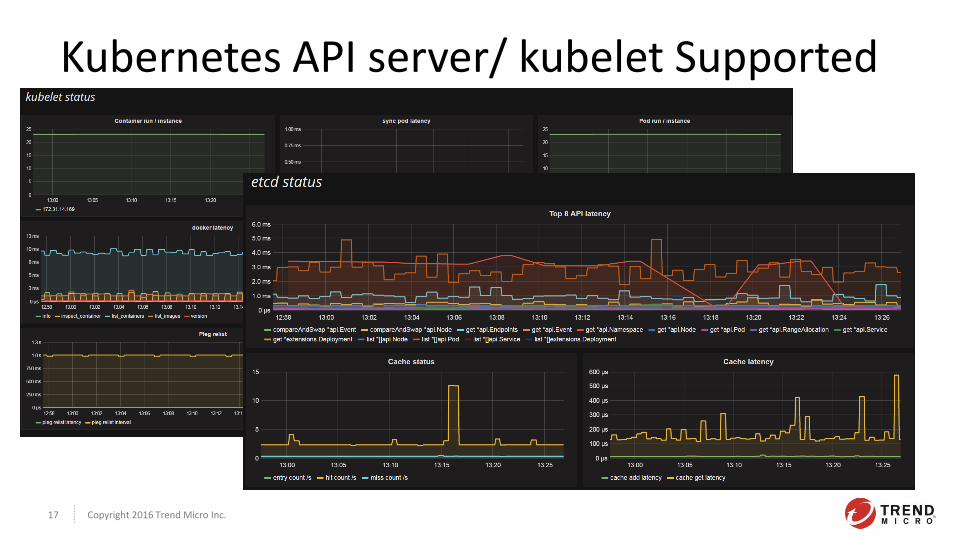
Kubernetes API server/ kubelet Supported
Copyright 2016 Trend Micro Inc. 18
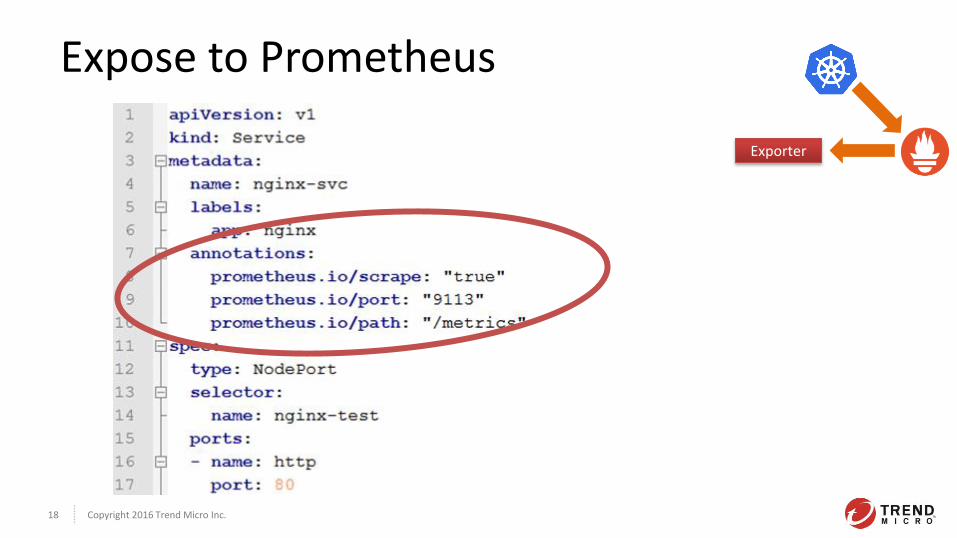
Expose to Prometheus
Exporter

Copyright 2016 Trend Micro Inc. 19
3. Dashboard Alert
Copyright 2016 Trend Micro Inc. 20
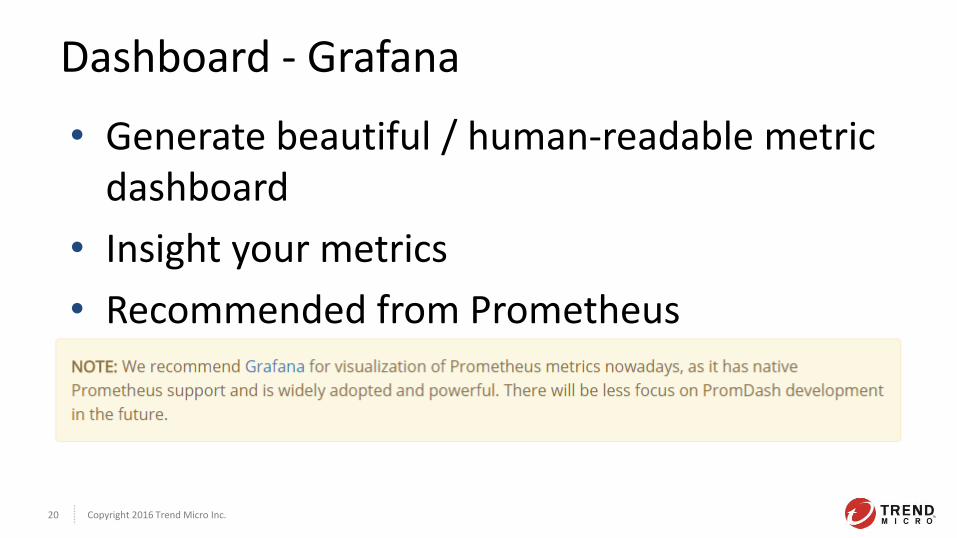
Dashboard - Grafana
• Generate beautiful / human-readable metric dashboard
• Insight your metrics
• Recommended from Prometheus
Copyright 2016 Trend Micro Inc. 21
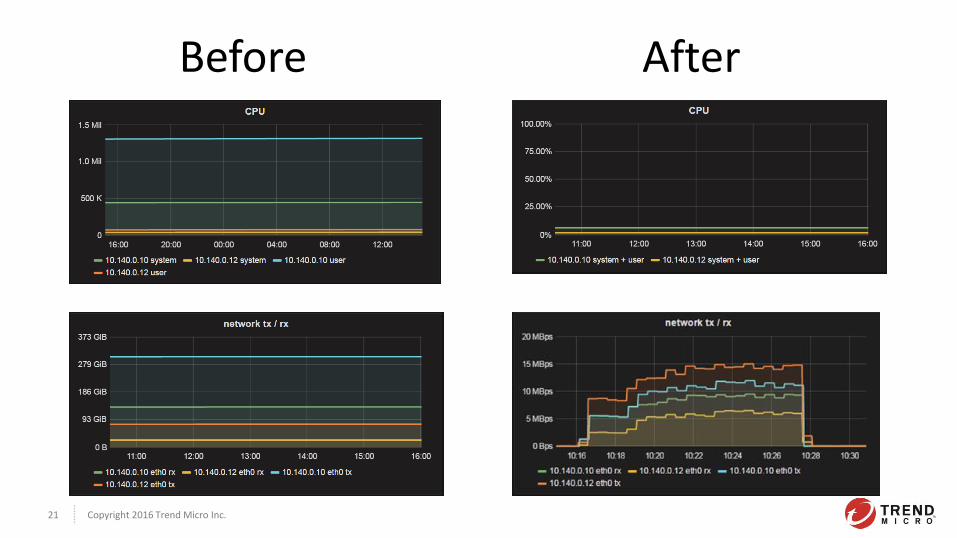
Before After
Copyright 2016 Trend Micro Inc. 22
Copyright 2016 Trend Micro Inc. 23
Copyright 2016 Trend Micro Inc. 24
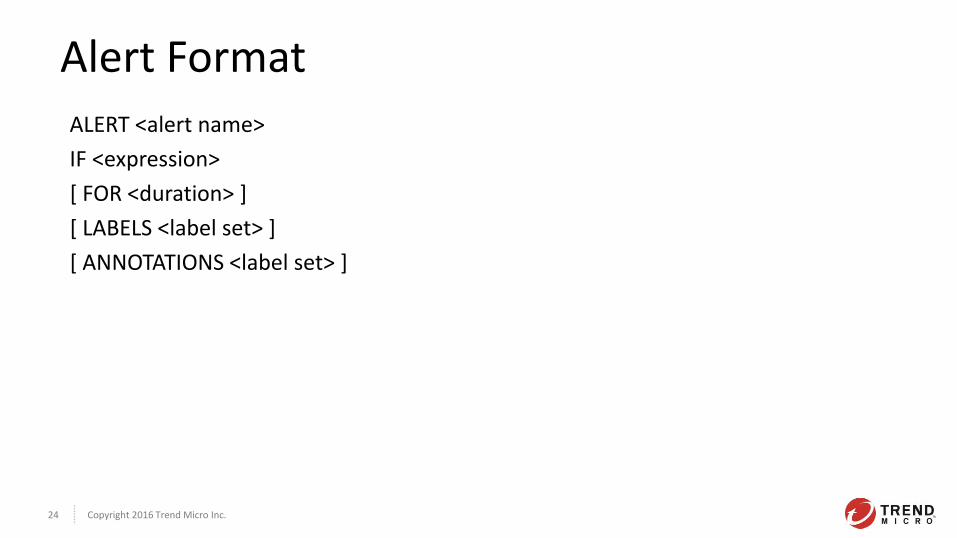
Alert Format
ALERT <alert name>
IF <expression>
[ FOR <duration> ]
[ LABELS <label set> ]
[ ANNOTATIONS <label set> ]
Copyright 2016 Trend Micro Inc. 25
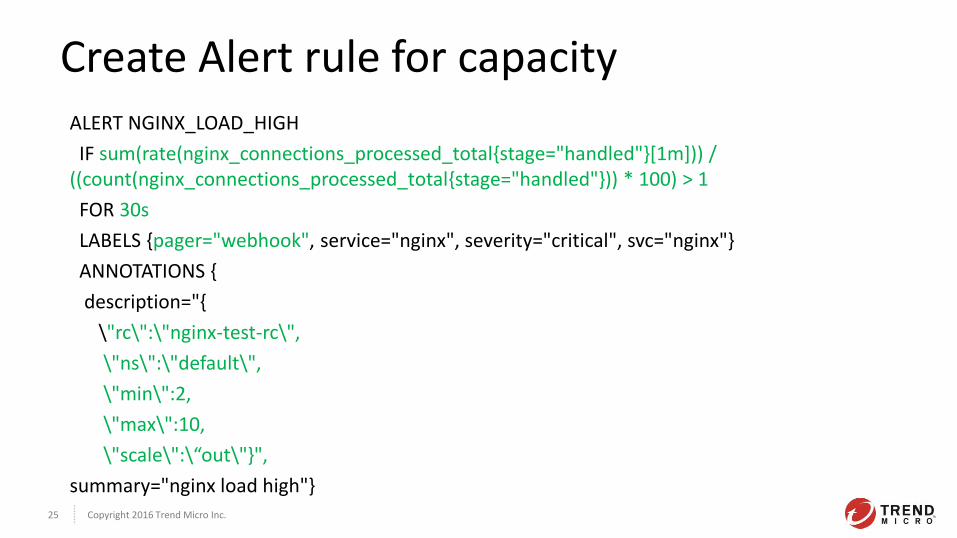
Create Alert rule for capacity ALERT NGINX_LOAD_HIGH
IF sum(rate(nginx_connections_processed_total{stage="handled"}[1m])) / ((count(nginx_connections_processed_total{stage="handled"})) * 100) > 1
FOR 30s
LABELS {pager="webhook", service="nginx", severity="critical", svc="nginx"}
ANNOTATIONS {
description="{
\"rc\":\"nginx-test-rc\",
\"ns\":\"default\",
\"min\":2,
\"max\":10,
\"scale\":\“out\"}",
summary="nginx load high"}
Copyright 2016 Trend Micro Inc. 26
4. Alert Dispatching
Copyright 2016 Trend Micro Inc. 27
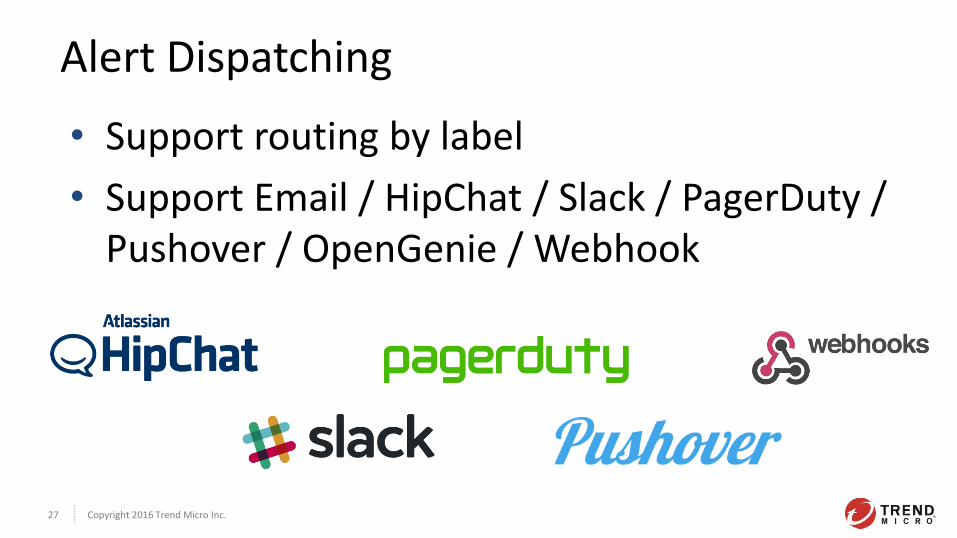
Alert Dispatching
• Support routing by label
• Support Email / HipChat / Slack / PagerDuty / Pushover / OpenGenie / Webhook
Copyright 2016 Trend Micro Inc. 28
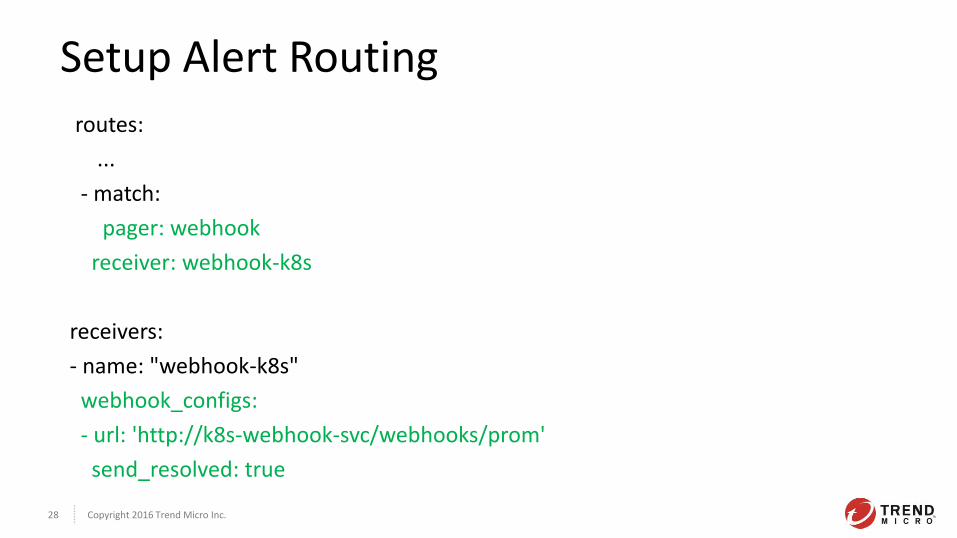
Setup Alert Routing
routes:
...
- match:
pager: webhook
receiver: webhook-k8s
receivers:
- name: "webhook-k8s"
webhook_configs:
- url: 'http://k8s-webhook-svc/webhooks/prom'
send_resolved: true

Copyright 2016 Trend Micro Inc. 29
5. Auto Scale
Copyright 2016 Trend Micro Inc. 30
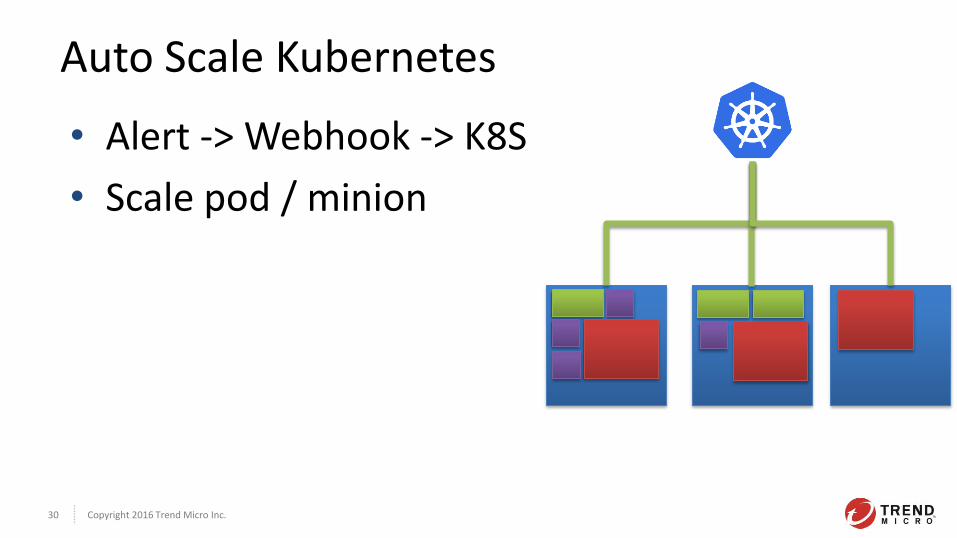
Auto Scale Kubernetes
• Alert -> Webhook -> K8S
• Scale pod / minion
Copyright 2016 Trend Micro Inc. 31
Send to Custom Webhook
Let’s see demo video
Copyright 2016 Trend Micro Inc. 33
Conclusions
• Easy to integrate
• Great metrics system

Copyright 2016 Trend Micro Inc. 34
Tips sharing
Copyright 2016 Trend Micro Inc. 35
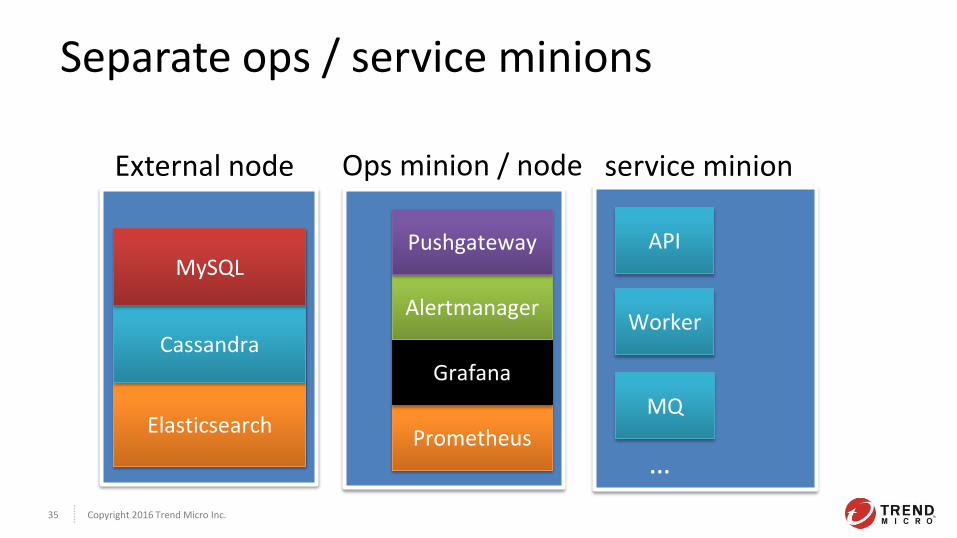
Separate ops / service minions
Ops minion / node service minion
Prometheus
Grafana
Alertmanager
Pushgateway API
Worker
MQ
…
Elasticsearch
Cassandra
MySQL
External node
Copyright 2016 Trend Micro Inc. 36
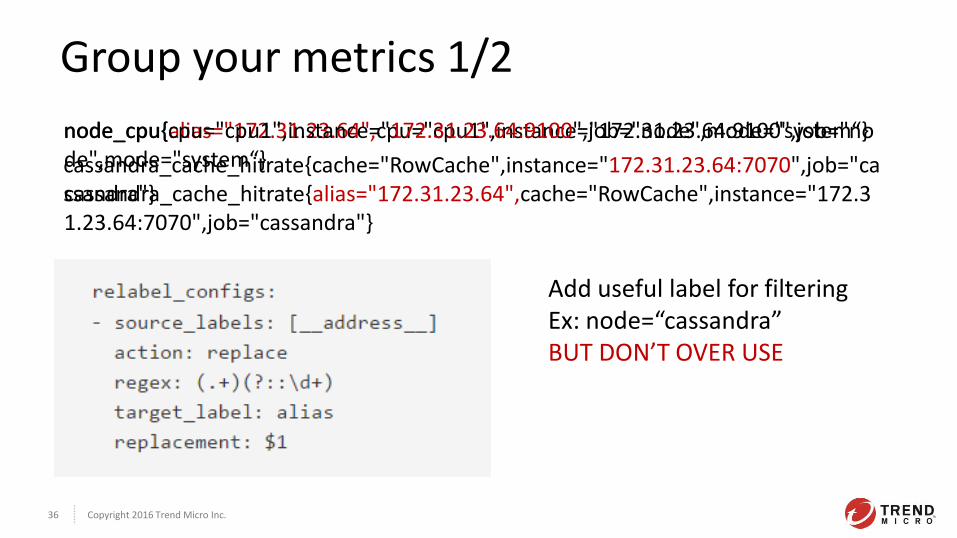
Group your metrics 1/2
node_cpu{alias="172.31.23.64",cpu="cpu1",instance="172.31.23.64:9100",job="node",mode="system“}
cassandra_cache_hitrate{alias="172.31.23.64",cache="RowCache",instance="172.31.23.64:7070",job="cassandra"}
node_cpu{cpu="cpu1",instance="172.31.23.64:9100",job="node",mode="system“}
cassandra_cache_hitrate{cache="RowCache",instance="172.31.23.64:7070",job="cassandra"}
Add useful label for filtering Ex: node=“cassandra” BUT DON’T OVER USE
Copyright 2016 Trend Micro Inc. 37
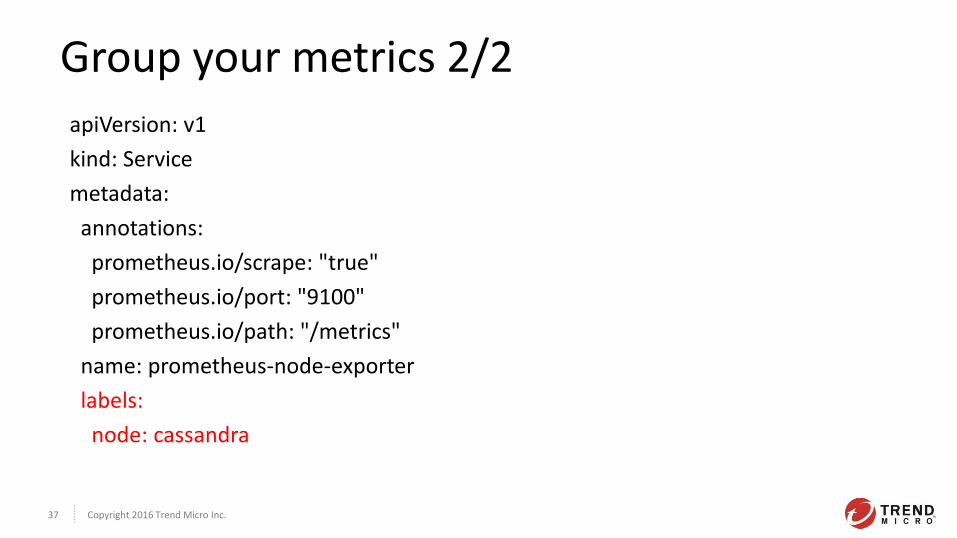
Group your metrics 2/2
apiVersion: v1
kind: Service
metadata:
annotations:
prometheus.io/scrape: "true"
prometheus.io/port: "9100"
prometheus.io/path: "/metrics"
name: prometheus-node-exporter
labels:
node: cassandra

Copyright 2016 Trend Micro Inc. 40
Thank you
Copyright 2016 Trend Micro Inc. 41
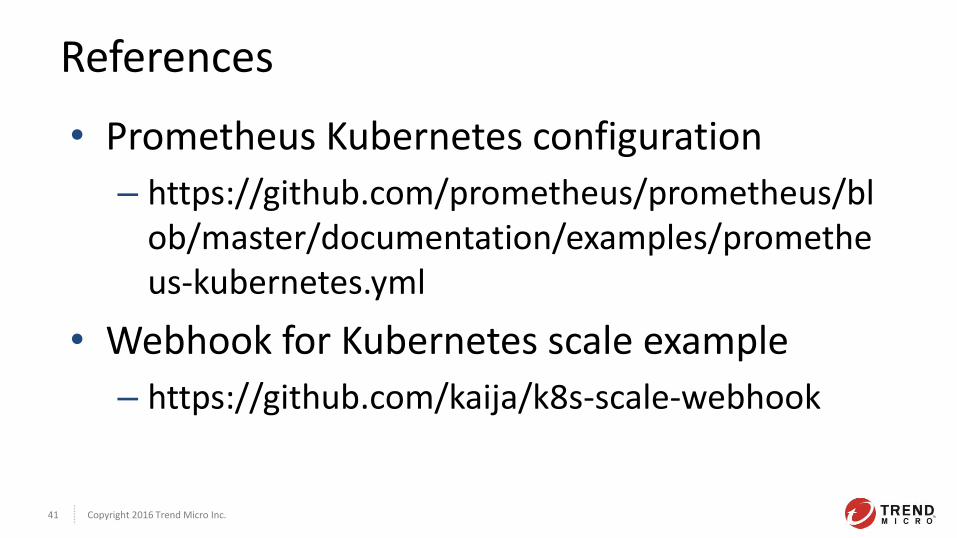
References
• Prometheus Kubernetes configuration
– https://github.com/prometheus/prometheus/blob/master/documentation/examples/prometheus-kubernetes.yml
• Webhook for Kubernetes scale example
– https://github.com/kaija/k8s-scale-webhook