Embed Size (px)
Citation preview

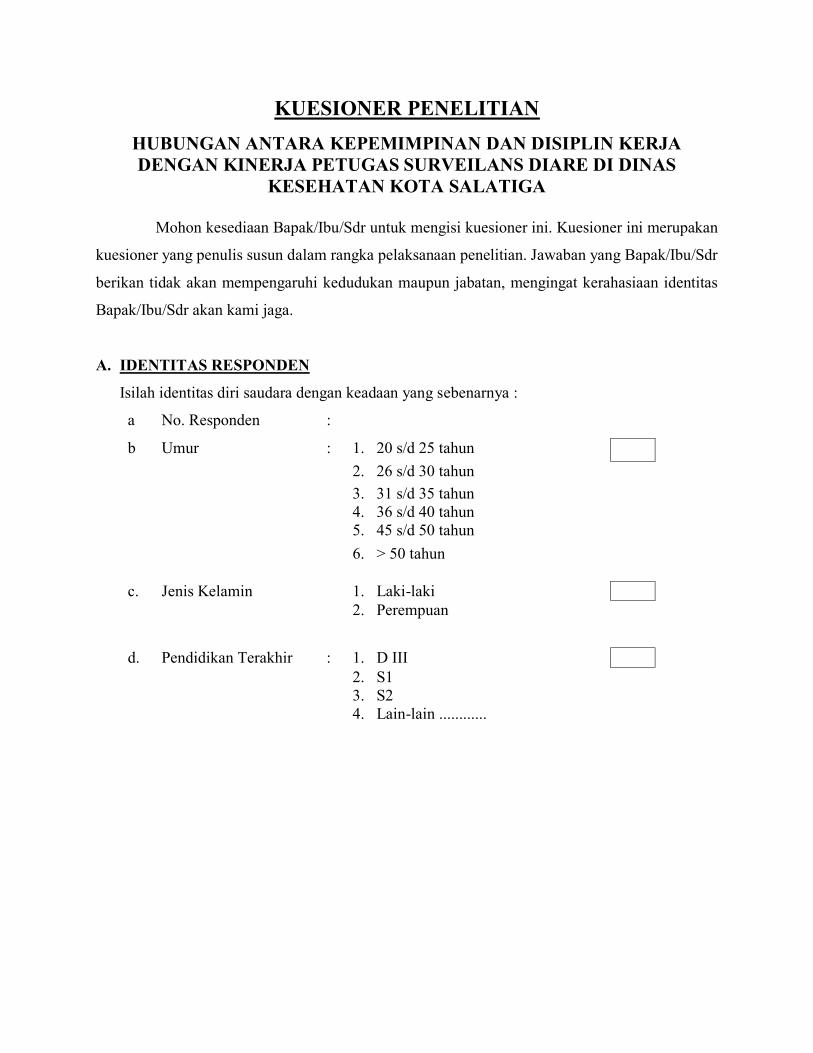
KUESIONER PENELITIAN
HUBUNGAN ANTARA KEPEMIMPINAN DAN DISIPLIN KERJA
DENGAN KINERJA PETUGAS SURVEILANS DIARE DI DINAS
KESEHATAN KOTA SALATIGA
Mohon kesediaan Bapak/Ibu/Sdr untuk mengisi kuesioner ini. Kuesioner ini merupakan
kuesioner yang penulis susun dalam rangka pelaksanaan penelitian. Jawaban yang Bapak/Ibu/Sdr
berikan tidak akan mempengaruhi kedudukan maupun jabatan, mengingat kerahasiaan identitas
Bapak/Ibu/Sdr akan kami jaga.
A. IDENTITAS RESPONDEN
Isilah identitas diri saudara dengan keadaan yang sebenarnya :
a No. Responden :
b Umur : 1. 20 s/d 25 tahun
2. 26 s/d 30 tahun
3. 31 s/d 35 tahun
4. 36 s/d 40 tahun
5. 45 s/d 50 tahun
6. > 50 tahun
c. Jenis Kelamin 1. Laki-laki
2. Perempuan
d. Pendidikan Terakhir : 1. D III
2. S1
3. S2
4. Lain-lain ............
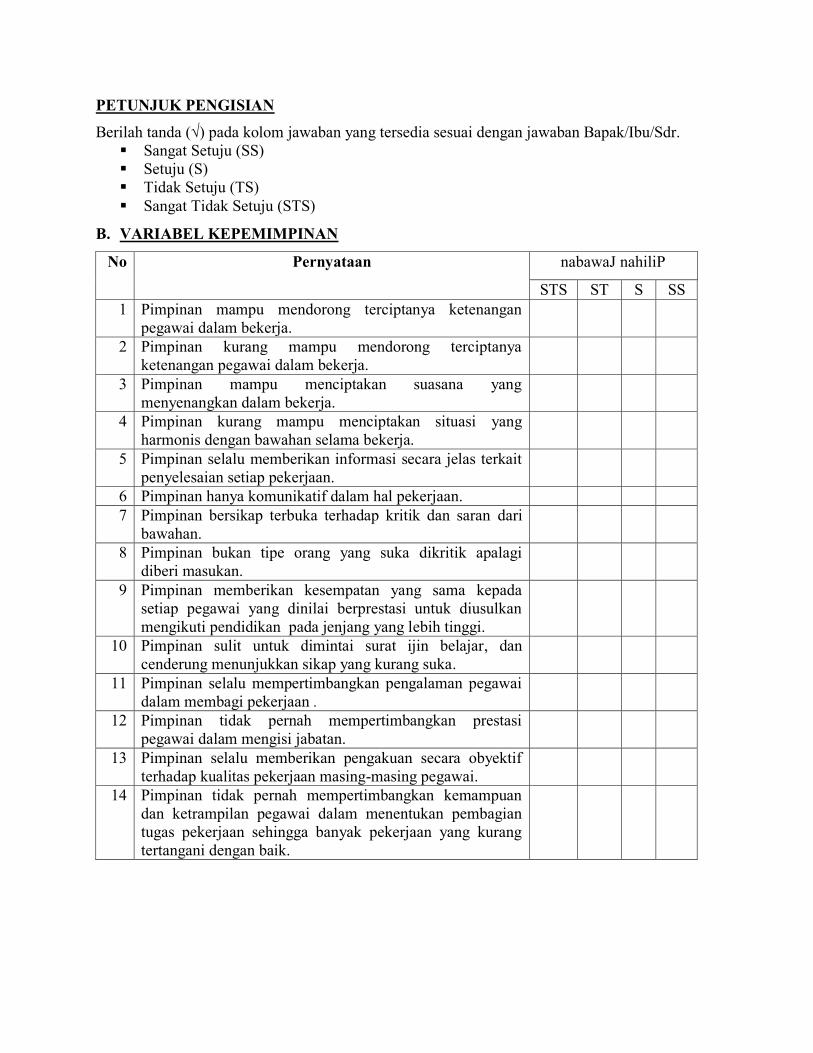
PETUNJUK PENGISIAN
Berilah tanda (√) pada kolom jawaban yang tersedia sesuai dengan jawaban Bapak/Ibu/Sdr.
1. Sangat Setuju (SS)
2. Setuju (S)
3. Tidak Setuju (TS)
4. Sangat Tidak Setuju (STS)
B. VARIABEL KEPEMIMPINAN
No Pernyataan nabawaJ nahiliP
STS ST S SS
1 Pimpinan mampu mendorong terciptanya ketenangan
pegawai dalam bekerja.
2 Pimpinan kurang mampu mendorong terciptanya
ketenangan pegawai dalam bekerja.
5 Pimpinan selalu memberikan informasi secara jelas terkait
penyelesaian setiap pekerjaan.
6 Pimpinan hanya komunikatif dalam hal pekerjaan.
7 Pimpinan bersikap terbuka terhadap kritik dan saran dari
bawahan.
8 Pimpinan bukan tipe orang yang suka dikritik apalagi
diberi masukan.
9 Pimpinan memberikan kesempatan yang sama kepada
setiap pegawai yang dinilai berprestasi untuk diusulkan
mengikuti pendidikan pada jenjang yang lebih tinggi.
10 Pimpinan sulit untuk dimintai surat ijin belajar, dan
cenderung menunjukkan sikap yang kurang suka.
11 Pimpinan selalu mempertimbangkan pengalaman pegawai
dalam membagi pekerjaan .
12 Pimpinan tidak pernah mempertimbangkan prestasi
pegawai dalam mengisi jabatan.
13 Pimpinan selalu memberikan pengakuan secara obyektif
terhadap kualitas pekerjaan masing-masing pegawai.
14 Pimpinan tidak pernah mempertimbangkan kemampuan
dan ketrampilan pegawai dalam menentukan pembagian
tugas pekerjaan sehingga banyak pekerjaan yang kurang
tertangani dengan baik.
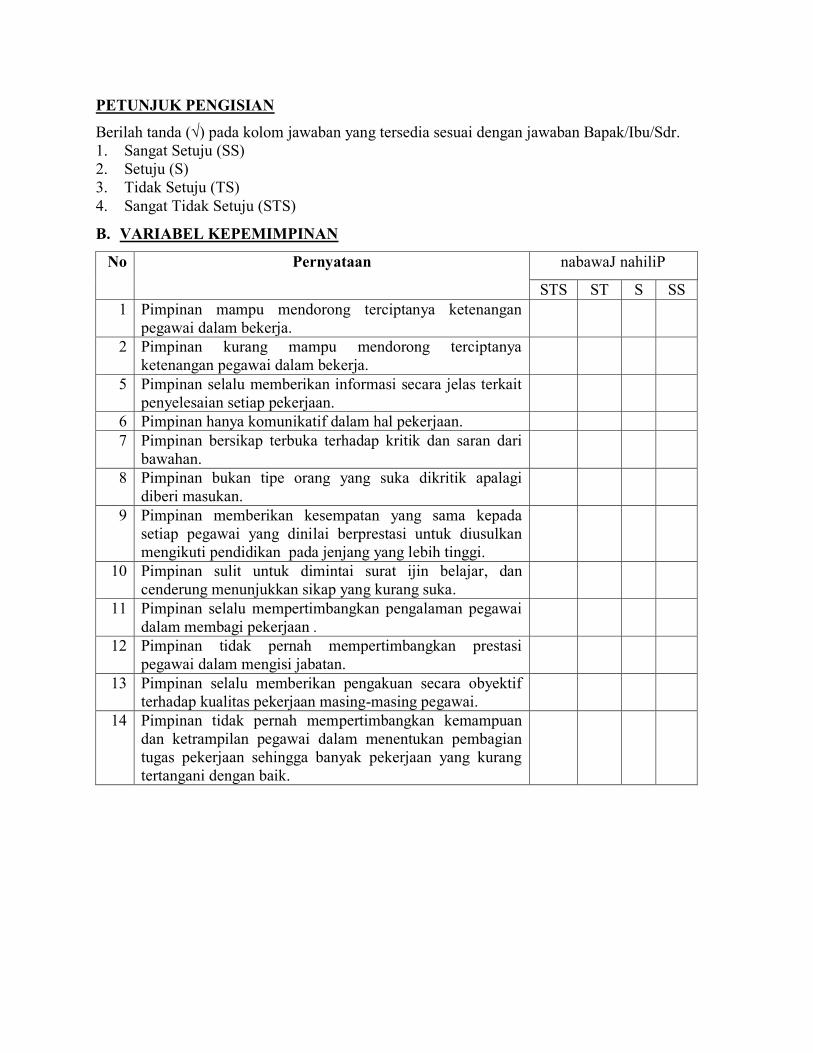
C. AJREK NILPISID
No Pernyataan nabawaJ nahiliP
STS ST S SS
16 Jika pekerjaan di lapangan tidak begitu banyak, saya akan
pulang lebih awal.
17 Saya mengemban tugas dari pimpinan sebagai petugas
surveilans dengan senang hati.
19 Sebagai petugas surveilans, saya selalu taat pada tata tertip
yang berlaku di kantor.
20 Karena tugas banyak di lapangan, dalam bekerja saya sering
tidak mengenakan atribut sebagaiamana aturan kantor.
21 Saya akan merapikan kembali seluruh alat-alat perlengkapan
kantor usai merekap data hasil survei di lapangan selesai.
22 Saya sering lupa untuk mengembalikan lagi alat-alat
perlengkapan kantor setelah saya pakai merekap data hasil
survei lapangan.
23 Dalam melaksanakan tugas survei di lapangan, saya selalu
mengikuti juklak yang telah diberikan pimpinan.
24 Dalam menghadapi kesulitan mengumpulkan data diare di
lapangan, saya sering melanggar cara-cara kerja yang
ditentukan oleh instansi.
25 Sebagai petugas surveilans, saya menyelesaikan tugas
pekerjaan dengan senang hati walaupun sebenarnya beban
kerja saya banyak.
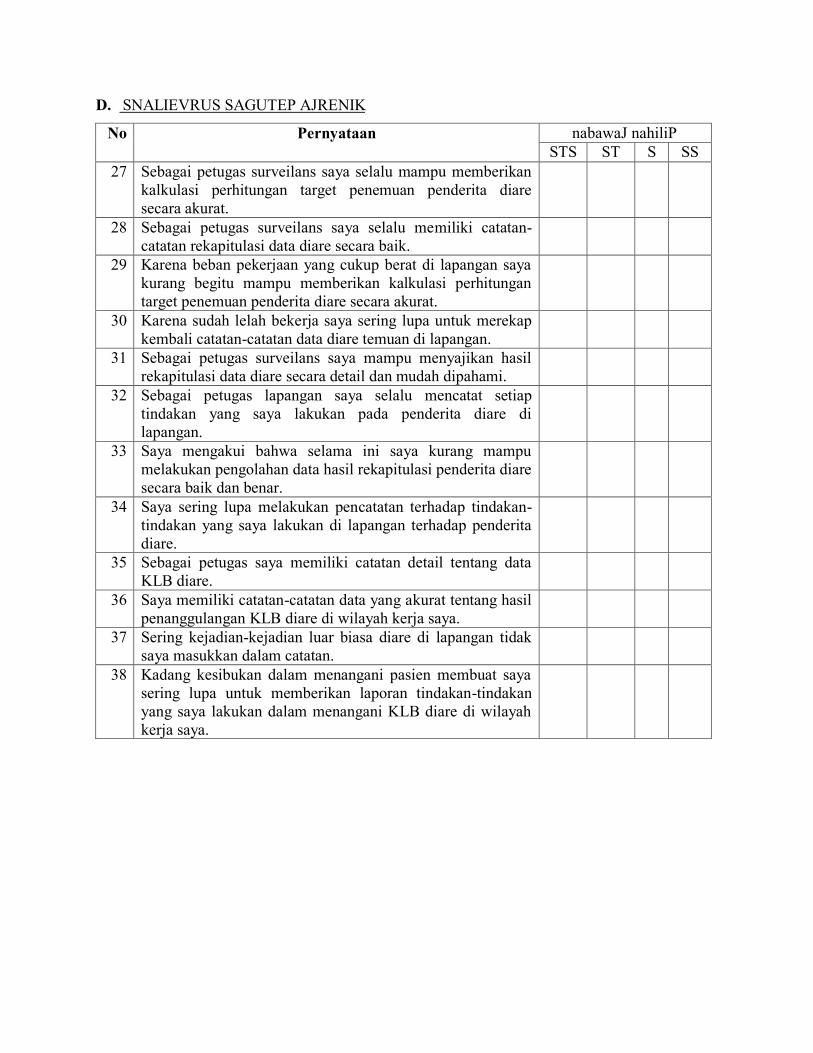
D. SNALIEVRUS SAGUTEP AJRENIK
No Pernyataan nabawaJ nahiliP
STS ST S SS
27 Sebagai petugas surveilans saya selalu mampu memberikan
kalkulasi perhitungan target penemuan penderita diare
secara akurat.
28 Sebagai petugas surveilans saya selalu memiliki catatan-
catatan rekapitulasi data diare secara baik.
29 Karena beban pekerjaan yang cukup berat di lapangan saya
kurang begitu mampu memberikan kalkulasi perhitungan
target penemuan penderita diare secara akurat.
30 Karena sudah lelah bekerja saya sering lupa untuk merekap
kembali catatan-catatan data diare temuan di lapangan.
31 Sebagai petugas surveilans saya mampu menyajikan hasil
rekapitulasi data diare secara detail dan mudah dipahami.
32 Sebagai petugas lapangan saya selalu mencatat setiap
tindakan yang saya lakukan pada penderita diare di
lapangan.
33 Saya mengakui bahwa selama ini saya kurang mampu
melakukan pengolahan data hasil rekapitulasi penderita diare
secara baik dan benar.
34 Saya sering lupa melakukan pencatatan terhadap tindakan-
tindakan yang saya lakukan di lapangan terhadap penderita
diare.
35 Sebagai petugas saya memiliki catatan detail tentang data
KLB diare.
36 Saya memiliki catatan-catatan data yang akurat tentang hasil
penanggulangan KLB diare di wilayah kerja saya.
37 Sering kejadian-kejadian luar biasa diare di lapangan tidak
saya masukkan dalam catatan.
38 Kadang kesibukan dalam menangani pasien membuat saya
sering lupa untuk memberikan laporan tindakan-tindakan
yang saya lakukan dalam menangani KLB diare di wilayah
kerja saya.
KUESIONER PENELITIAN
HUBUNGAN ANTARA KEPEMIMPINAN DAN DISIPLIN KERJA
DENGAN KINERJA PETUGAS SURVEILANS DIARE DI DINAS
KESEHATAN KOTA SALATIGA
Mohon kesediaan Bapak/Ibu/Sdr untuk mengisi kuesioner ini. Kuesioner ini merupakan
kuesioner yang penulis susun dalam rangka pelaksanaan penelitian. Jawaban yang Bapak/Ibu/Sdr
berikan tidak akan mempengaruhi kedudukan maupun jabatan, mengingat kerahasiaan identitas
Bapak/Ibu/Sdr akan kami jaga.
A. IDENTITAS RESPONDEN
Isilah identitas diri saudara dengan keadaan yang sebenarnya :
a No. Responden :
b Umur : 1. 20 s/d 25 tahun
2. 26 s/d 30 tahun
3. 31 s/d 35 tahun
4. 36 s/d 40 tahun
5. 45 s/d 50 tahun
6. > 50 tahun
c. Jenis Kelamin 1. Laki-laki
2. Perempuan
d. Pendidikan Terakhir : 1. D III
2. S1
3. S2
4. Lain-lain ............
PETUNJUK PENGISIAN
Berilah tanda (√) pada kolom jawaban yang tersedia sesuai dengan jawaban Bapak/Ibu/Sdr.
Sangat Setuju (SS)
Setuju (S)
Tidak Setuju (TS)
Sangat Tidak Setuju (STS)
B. VARIABEL KEPEMIMPINAN
No Pernyataan nabawaJ nahiliP
STS ST S SS
1 Pimpinan mampu mendorong terciptanya ketenangan
pegawai dalam bekerja.
2 Pimpinan kurang mampu mendorong terciptanya
ketenangan pegawai dalam bekerja.
3 Pimpinan mampu menciptakan suasana yang
menyenangkan dalam bekerja.
4 Pimpinan kurang mampu menciptakan situasi yang
harmonis dengan bawahan selama bekerja.
5 Pimpinan selalu memberikan informasi secara jelas terkait
penyelesaian setiap pekerjaan.
6 Pimpinan hanya komunikatif dalam hal pekerjaan.
7 Pimpinan bersikap terbuka terhadap kritik dan saran dari
bawahan.
8 Pimpinan bukan tipe orang yang suka dikritik apalagi
diberi masukan.
9 Pimpinan memberikan kesempatan yang sama kepada
setiap pegawai yang dinilai berprestasi untuk diusulkan
mengikuti pendidikan pada jenjang yang lebih tinggi.
10 Pimpinan sulit untuk dimintai surat ijin belajar, dan
cenderung menunjukkan sikap yang kurang suka.
11 Pimpinan selalu mempertimbangkan pengalaman pegawai
dalam membagi pekerjaan .
12 Pimpinan tidak pernah mempertimbangkan prestasi
pegawai dalam mengisi jabatan.
13 Pimpinan selalu memberikan pengakuan secara obyektif
terhadap kualitas pekerjaan masing-masing pegawai.
14 Pimpinan tidak pernah mempertimbangkan kemampuan
dan ketrampilan pegawai dalam menentukan pembagian
tugas pekerjaan sehingga banyak pekerjaan yang kurang
tertangani dengan baik.

C. AJREK NILPISID
No Pernyataan nabawaJ nahiliP
STS ST S SS
15 Sadar bahwa pekerjaan di lapangan cukup banyak, sebagai
petugas surveilans saya tiba di kantor sedikit lebih awal dari
jadwal yang telah ditentukan.
16 Jika pekerjaan di lapangan tidak begitu banyak, saya akan
pulang lebih awal.
17 Saya mengemban tugas dari pimpinan sebagai petugas
surveilans dengan senang hati.
18 Saya jarang bekerja dengan baik, misal: merekap data survei
lapangan jika pimpinan tidak berada di kontor.
19 Sebagai petugas surveilans, saya selalu taat pada tata tertip
yang berlaku di kantor.
20 Karena tugas banyak di lapangan, dalam bekerja saya sering
tidak mengenakan atribut sebagaiamana aturan kantor.
21 Saya akan merapikan kembali seluruh alat-alat perlengkapan
kantor usai merekap data hasil survei di lapangan selesai.
22 Saya sering lupa untuk mengembalikan lagi alat-alat
perlengkapan kantor setelah saya pakai merekap data hasil
survei lapangan.
23 Dalam melaksanakan tugas survei di lapangan, saya selalu
mengikuti juklak yang telah diberikan pimpinan.
24 Dalam menghadapi kesulitan mengumpulkan data diare di
lapangan, saya sering melanggar cara-cara kerja yang
ditentukan oleh instansi.
25 Sebagai petugas surveilans, saya menyelesaikan tugas
pekerjaan dengan senang hati walaupun sebenarnya beban
kerja saya banyak.
26 Karena beban pekerjaan sebagai petugas surveilans cukup
banyak, kadang saya merasa stress jika pimpinan memberikan
instuksi untuk menyelesaikan pekerjaan lebih awal.

D. SNALIEVRUS SAGUTEP AJRENIK
No Pernyataan nabawaJ nahiliP
STS ST S SS
27 Sebagai petugas surveilans saya selalu mampu memberikan
kalkulasi perhitungan target penemuan penderita diare
secara akurat.
28 Sebagai petugas surveilans saya selalu memiliki catatan-
catatan rekapitulasi data diare secara baik.
29 Karena beban pekerjaan yang cukup berat di lapangan saya
kurang begitu mampu memberikan kalkulasi perhitungan
target penemuan penderita diare secara akurat.
30 Karena sudah lelah bekerja saya sering lupa untuk merekap
kembali catatan-catatan data diare temuan di lapangan.
31 Sebagai petugas surveilans saya mampu menyajikan hasil
rekapitulasi data diare secara detail dan mudah dipahami.
32 Sebagai petugas lapangan saya selalu mencatat setiap
tindakan yang saya lakukan pada penderita diare di
lapangan.
33 Saya mengakui bahwa selama ini saya kurang mampu
melakukan pengolahan data hasil rekapitulasi penderita diare
secara baik dan benar.
34 Saya sering lupa melakukan pencatatan terhadap tindakan-
tindakan yang saya lakukan di lapangan terhadap penderita
diare.
35 Sebagai petugas saya memiliki catatan detail tentang data
KLB diare.
36 Saya memiliki catatan-catatan data yang akurat tentang hasil
penanggulangan KLB diare di wilayah kerja saya.
37 Sering kejadian-kejadian luar biasa diare di lapangan tidak
saya masukkan dalam catatan.
38 Kadang kesibukan dalam menangani pasien membuat saya
sering lupa untuk memberikan laporan tindakan-tindakan
yang saya lakukan dalam menangani KLB diare di wilayah
kerja saya.

Kepemimpinan 1
Resp 1 2 3 4 5 6 7 8 9 10 11 12 13 14 Total
1 2 2 3 3 3 2 3 2 3 2 3 3 3 3 37
2 2 3 4 4 4 2 4 4 3 2 3 3 3 4 45
3 2 3 4 4 4 3 4 4 3 3 3 3 4 4 48
4 3 3 3 4 4 4 4 4 3 3 3 4 4 4 50
5 3 3 3 3 4 4 4 4 3 4 4 4 4 4 51
6 4 4 4 4 4 4 4 4 4 4 4 4 4 4 56
7 3 3 4 4 4 4 4 4 4 4 4 4 4 4 54
8 3 4 4 4 4 4 4 4 4 4 4 4 4 4 55
9 4 4 4 4 4 4 4 4 4 4 4 4 4 4 56
10 4 4 4 4 4 4 4 4 4 4 4 4 4 4 56
Kepemimpinan 2
Resp 1 2 3 4 5 6 7 8 9 10 11 12 13 14 Total
1 2 2 3 2 3 2 3 2 3 3 3 3 31
2 2 3 4 2 4 4 3 2 3 3 3 4 37
3 2 3 4 3 4 4 3 3 3 3 4 4 40
4 3 3 4 4 4 4 3 3 3 4 4 4 43
5 3 3 4 4 4 4 3 4 4 4 4 4 45
6 4 4 4 4 4 4 4 4 4 4 4 4 48
7 3 3 4 4 4 4 4 4 4 4 4 4 46
8 3 4 4 4 4 4 4 4 4 4 4 4 47
9 4 4 4 4 4 4 4 4 4 4 4 4 48
10 4 4 4 4 4 4 4 4 4 4 4 4 48
Correlations
Correlations
1 z ? 4 E
1 Pearson ConelationSig. (2{ailed)N 1 0
,806',005
1 0
,282,430
10
,323,363
10
,430,214
102 Pearson Conelation
Sig. (2{ailed)N
806"',005
1 0
1
1 0
,648',043
10
,625,053
10
,677',032
1 03 Pearson Conelation
Sig. (2-taited)N
,282,430
1 0
,648*,043
1 0
1
1 0
,7U',,010
10
,509, 1 3 3
1 04 Pearson Conelation
Sig. (2-tailed)N
,323, J O J
1 0
,625,053
1 0
,7U',010
10
1
10
,667*,035
1 05 Pearson Conelation
Sig. (2tailed)N
,430,214
1 0
,677', vJz
1 0
,509, I J J
1 0
,667',035
1 0
1
1 06 Pearson Conelation
Sig. (2tailed)N
,801,005
1 0
,678',031
1 0
, 135,709
10
,310,383
I U
,620,ucb
' t0
7 Pearson ConelationSig. (2-tailed)N
,430,214
10
,677',,032
1 0
,509,133
10
,667'n?6
1 0
I ,000''
1 0I Pearcon Conelation
Sig. (2-tailed)N
,430,214
1 0
,477*,032
1 0
,s09, 1 3 3
1 0
,867',035
1 0
I , 000'
10I Poarson Conelation
Sig. (2-tailed)N
,775,009
10
,781',008
10
,655*,040
10
,500,141
10
,333,347
1010 Pearson Conelation
Sig. (2-tailed)N
,807*',005
t v
,742',,014
1 0
,327,356
1 0
,250,486
10
,583,077
1 011 Pearson Conelation
Sig. (2-tailed)N
,791,006
10
,701',024
10
,356,312
4 dt v
,102,779
1 0
,408,242
1012 Pearson Conelation
Sig. (2'tailed)N
,845,002
10
,648",043
1 0
,048,896
1 0
,218,545
1 0
,509,133
1013 Pearson Conelation
Sis. (2-tailed)N
,045r,0M
10
,625,053
10
,218,545
1 0
,375,286
1 0
,667',035
1014 Pearson Conelation
Sig. (2-tailed)N
,430,214
10
,677'.,032
10
,509,133
10
,667',035
10
1,000'
10Kepemimpinan Pearson Conelation
Sig, (2-tailed)N
,00210
839* ,898',000
10
,538, 1 0 9
< n
,582,078
1 0,007
10
a 87''
Page 1
7,e6ed
0 t000'
*9 l6'
0 t100'
"LgL.
0 f/00'
.LgL'
0 l/00'
./gL'
U I
t00'
" l69'
N(patterZ)'6tS
uoqelaJJo3 uosJead ueurdruluraday0 tLLO'e89'
0 tL?T,geg'
0 t
.000't
0 t
.000 ' f
0 t990'029'
N(parra-z)'6rs
uonBlerJo9 uogJeed ,,0 tt00'9/8'
0 t, r t '009'
0 l900'
*1.99'
0t9e0'
./99'
0 t000'
,,096'
N(patrerZ) '6rS
uorlelexoc uosjeed CI I0 tt00'
,,0L9'
0t0r0'
.999'
0 tg€ t '609'
0te0 t '609'
0 t000'Lr6'
N(pa1re1-7)'619
uolplajJoc uosJBed zl0 !000'
.61.6'
O Lr00'
,9 lg '
0 tzrz'80r'
0 tzrz'80r'
0 fr r0'
.09L'
N(pa11eyg) '0rg
uo[elexoc uosjeed |. I0 t
t
0 ,zL0 '
"091.'
0 tLLO'089'
0 lLLO'089'
0 t000'
.,096'
N(pelrepg) '6rg
uo[elarioS uosJead 0f0tz t0 '
,09L'
0 t
I
0 tL'T,0e8'
0 tL'T,,t88'
U '
990'029'
N(pelrey7) '6rg
uollBleroc uoslead 60 tLLO'e89'
0 tL'I,,e0e'
0 t
I
0 t
.-000'f
0l,990'029'
N(patterZ)'6tS
uorlBlslo3 uosjeed g0 tL/0'e89'
0tLrt'see'
0 f
"000'f
0 f
L
0 t990'029'
N(pe;;ey7) '619
uorlelaJoc uosiead L0 t000'
,*086'
0r990'029'
0 t990'029'
0 t990'029'
0 ,
I,
N(pa1re1-g) ,6rg
uorlelaroc uosJeed g0l.L/0'e89'
0tLrt'rte'
n lv v
.000' l
0 f
"000'L
0 t990'029'
N(pa1re1.3) '619
uo[elaJroc uosJead g0 t99t'092'
0 tIFL.009'
0 t9e0'
,L99'
01.990'
.1.99'
0 t089'0r8 '
N(parrer-z)'0rs
uo4eploc uosJead ,0r999'LZt'
0 t0f0'
,999'
0tgg r'609'
0 lgg t '609'
0f001'90 r '
N(petret-Z)'6rS
uoqeleroS uo$Bad g0 t,t0'
,ZrL'
0,800't8L'
0 lze0'
,L!9'
0tzt0'
,LLg'
0 tft0'
,81.9'
N(parrerZ)'6rS
uo[elalo3 uosJead z0t.900'/08'
0 f600'9LL,
0 t, tz '0er'
0 ta , l 7 '
00r'
0 f900't08'
N(pa1rey7) 6rg
uolplaloS uosJBa.J0 t 6 I L 9
suosela!oc
Correlations
11 12 1 3 14Kepemimp
inan1 pear5oneondlfrn-Sig. (2{aited)N
7 0 1 r
,0061 n
,645',002
1 0
,645*,044
1 0
,430,214
1 0
,839,002
{ n2 pearson Conelation
-
Sig. (2-taited)N
,701*,024
1 0
,648',043
1 0
,625,053
10
,677',,032
10
,898,000
1 03 Pearson ConelationSig. (2-tailed)N
,356,312
1 0
,048,896
10
,218,545
10
,509,133
10
,538,109
104 Pearson CorrelationSig. (2-taited)N
,102
1 0
,218,545
1 0
,375 | ,667',286 | ,035
1 o l 1 0
,582,078
1 05 Pearson CorrelationSig. (2.taited)N
,408,242
1 n
,509, 1 3 3
1 0
,667',035
1 0
1,000.1 ,787'| ,007
1 o l 1 06 Pearson ConelationSig, (2-taited)N
,760., 0 1 1
1 0
,947*,000
10
,930',000
1 n
,620,066
1 0
,891',001
1 07 Pearson ConelationSig. (2-taited)N
,408,242
1 0
,509
1 0
,667',035
1 0
1 000'
1 n,007
1 0
,787n
8 Pearson ConetationSig. (2{aited)N
,408,242
1 6
,509, 1 3 3
1 n
,667*,035
1 0
1,000*
1 0
,787',007
1 09 Pearson ConelationSig. (2-taited)N
,0046r',81
10
,655*,040
1 0
,500,141
1 0
,333,347
1 0
,787,007
1 n10 Pearson Conelation
Sig. (2-taited)N
,919,000
I U
,873,001
10
5rr,87,001
10
,583,077
1 0
,915",000
1011 Pearson Conelation
Sig. (2-taited)N
'l
t 0
,802.,005
1 0
,612,060
10
,408,242
1 0
0*r, 8 1,004
1 012 Pearson Conelation
Sig. (2-taited)N
,802",005
1 0
1
1 0
,764',010
10
,509,133
10
,836',003
1013 Pearson Conelation
Sig. (2-taited)N
,612,060
10
,764.,010
10
1
' t0
,667*,035
10
,838,002
1014 Pearson Conelation
Sig. (2{aited)N
,408,242
1 0
,509, 1 3 3
1 0
,667',035
1 0 10
1 ,787,007
1 0Kepemimpinan Pearson Conelation
Sig. (2{ailed)N
10"
10
,8,004
36', 8,003
1 0
,838*,002
1 0
87",7,007
1 0
1
10". Conelation is significant at the 0.01 tevel (2-tailed).'. Conelation is significant at the 0.05 level (2{aited).
Page 3

Correlations
Correlations
1 2 q 7Pearson QonelationSig. (2-tailed)N
1
1 0
,906*,005
10
,430,214
1 0
1
,005't0
80 ,430,214
1 02 Pearson Conelation
Sig. (2-tailed)N
,906'',005
't0
I
10
,677',032
1 0
,678.,031
1 0
,677',032
1 05 Pearson Conelation
Sig, (2-taited)N
,430,214
1 0
,677',032
1 0
1
1 0
,620,056
1 n
a 000*
106 Pearson Conelation
Sig. (2-tailed)N
,801 ',005
1 0
,678',031
1 0
,620,056
10
4I
10
,620,056
107 Pearson Conelatron
Sig. (2-tailed)N
,430,214
1 0
,677'*, vJz
1 0
I ,000-
1 0
,620,056
10
1
108 Pearson Conelation
Sig. (2-tailed)N
430, 214
10
Ai l*
, v Jz
I U
1,000. '
1 0
,620,056
1 0
1 ,000*'
I Pearson ConelationSig. (2-taited)N
'f'7 E '
,0091 0
,781,008
1 0
, J J J
,3471 0
,620,056
10
, J J J
,3471 0
10 Pearson ConelationSig. (2-tailed)N
,807,005
1 0
,742',014
1 n
,583,077
1 0
,930,000
10
,583,077
I U11 Pearson Conelation
Sig. (2-tailed)N
7 Q 1 '
,00610
,701*,024
10
,408,242
10
,760*, 0 1 1
1 0
,408,242
1012 Pearson Conelation
Sig. (2-tailed)N
,U5,002
1 0
,ff8*,043
1 n
,509, 1 3 3
1 0
,947*',000
10
,509,133
1 013 Pearson Correlation
Sig. (2-tailed)N
,6,45',044
1 0
,625,053
10
,667*,035
10,000
10
930" ,667',035
1014 Pearson Conelation
Sig. (2-tailed)N
,430,214
1 0
,677",032
10
1,000'
10
,620,056
't0
1,000'
10Kepemimpinan Pearson Conelation
Sig. (2-tailed)N
,860",001
'l/'r
,870*,001
10
,759., 0 1 1
1 0
,929*,000
10
,759*, 0 1 1
1 0
Page 1
Conelations
I o 1 0 1'l 1 2r Pearson conelatton
Sig. (2-tailed)N
,430,214
1 0,009
1 0
5*,77,005807
1 0
,791",006
1 0,002,845
1 02 Pearson Conelation
Sig. (2-taited)N
,677',,032
1 0
,781*,008
1 0
,742*,014
1 0
,701',024
1 0
,648',043
1 05 Pearson Conelation
Sig. (2-tailed)N
1 000'
10
,333,u7
'10
,583,077
10
,408,242
'10
,509,133
't06 Pearson Conelation
Sig. (2-tailed)N
,620,056
1 0
,620,056
1 0
930",000
10
,760., 0 1 1
1 0
,tN7n,000
107 Pearson Conelation
Sig. (Z-tailed)N
000"
10
,33s,347
1 0
,583,077
10
,408,242
10
,509,133
10I Pearson Conelation
Sig, (2-tailed)N
1
1 0
,333,u7
10
,583,077
1 0
,408,242
1 0
,509,133
10I Pearson Conelation
Sig. (2-tailed)N
, J J J
,u710
1
I U
,750',012
10,004
10
6*, 8 1 ,655*,040
1010 Pearson Conelation
Sig. (2-tailed)N
E a,l
,0771 0
,750',012
1 0
1
1 0,000
1 0
9*',91 ,873,001
1011 Pearson Conelation
Sig. (2-tailed)N
,408,242
1 0
,816 ',004
1 0
, g1g*,000
. in
1
1 0
,802n,005
1012 Pearson Conelation
Sig, (2-tailed)N
,509,133
10
,655',M0
10
,873',001
10
,802*,005
1 n
'l
1o13 Pearson Conelation
Sig. (2-tailed)N
,667*,035
10
,500,141
10
,87s*,001
10
,612,060
't0
,7U',010
1014 Pearson Conelation
Sig. (2-tailed)N
1 ,000"
1 0
,333,U7
10
,583,077
1 0
,408,242
10
6no
, 13310
Kepemimpinan Pearson ConelationSig. (2-tailed)N
,759', 0 1 1
1 0
,759', 0 1 1
1 0
,944',',000
10
,838',002
10
,884,001
10
Page 2
I
Conelations
1 3 1 4Kepemimp
inan1 Pearson Conelation
Sig. (2{ailed)N
,645.,044
I U
,430,214
1 0
,860'',001
1 02 Pearson Conelation
Sig. (2-tailed)N
,625,053
. t n
,677*,032
1 0
,870.,001
1 05 Pearson Correlation
Sig. (2-tailed)N
,667',035
10
1,000*
10
Tqo r
6 t r
1 06 Pearson Correlation
Sig. (2{ailed)N
,0001 0
30r',9 ,620,056
10
,929",000
1 07 Pearson Conelation
Sig. (2"tailed)N
,667.,035
1 0
1,000*
10
Tqo r
,01 ' l1 0
8 Pearson ConelationSig, (2{ailed)N
,667',,036
10
1,000'
10
,759., 0 1 1
1 09 Pearson Corelation
Sig. (2-tailed)N
,5001 A 1
1 0
, J J J
,3471 n
,759', 0 1 1
1 010 Pearson Correlation
Sig. (2{ailed)N
,875*,00' t
'10
,583,077
1 0
,944",000
1 011 Pearson Conelation
Sig, (2-tailed)N
,612,060
1 0
,408,242
1 0
,838,vvz
1012 Pearson Conelation
Sig. (2{ailed)N
,764',, u t v
' t0
cno
, 1 3 31 0
,884,001
1013 Pearson Conelation
Sig. (2-tailed)N 10
,667r,035
1 0
,860*,001
1 014 Pearson Conelation
Sig. (2-tailed)N
,667',,035
'10
1
1 n
7 ( O r
, 0 1 11 0
Kepemimpinan Pearson ConelationSig. (2-tailed)N
,860.,001
1 0
7 6 Q r
, 0 1 11 0
1
10**. Conelation is significant at the 0.01 level (2-tailed)'. Conelation is significant at the 0.05 level (2-tailed).
Page 3

Tahap 1
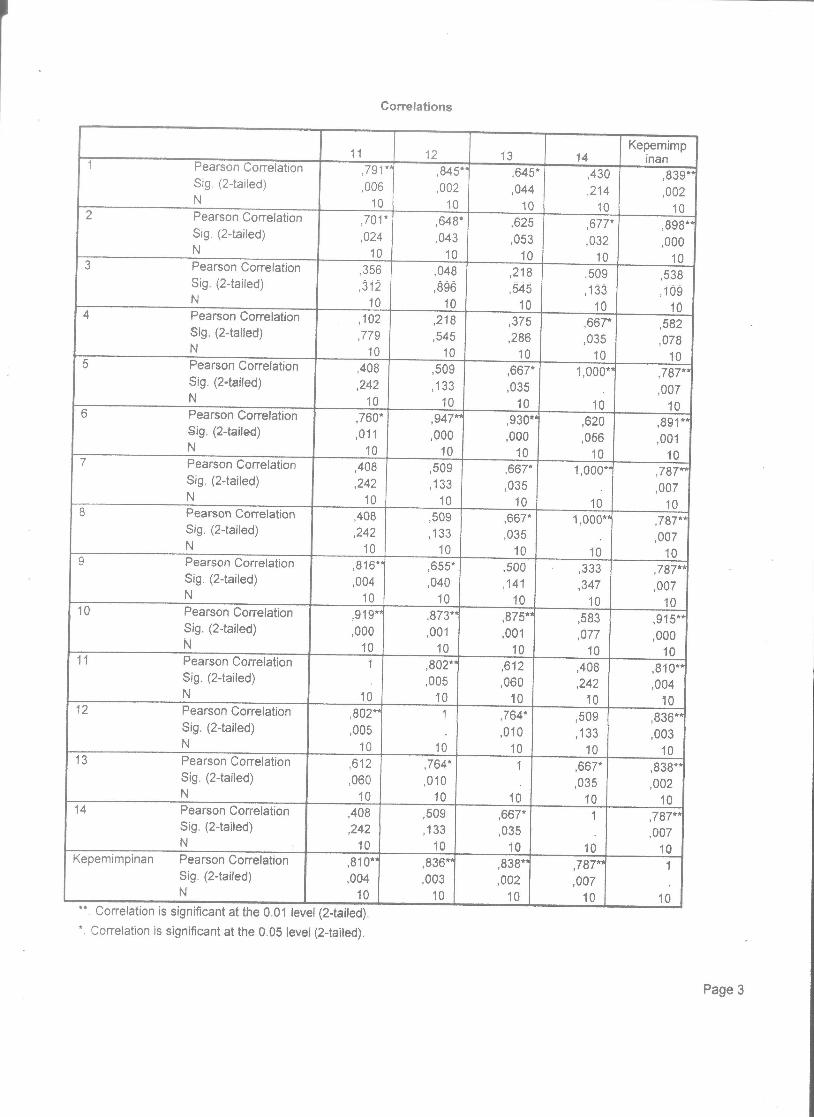
Correlations
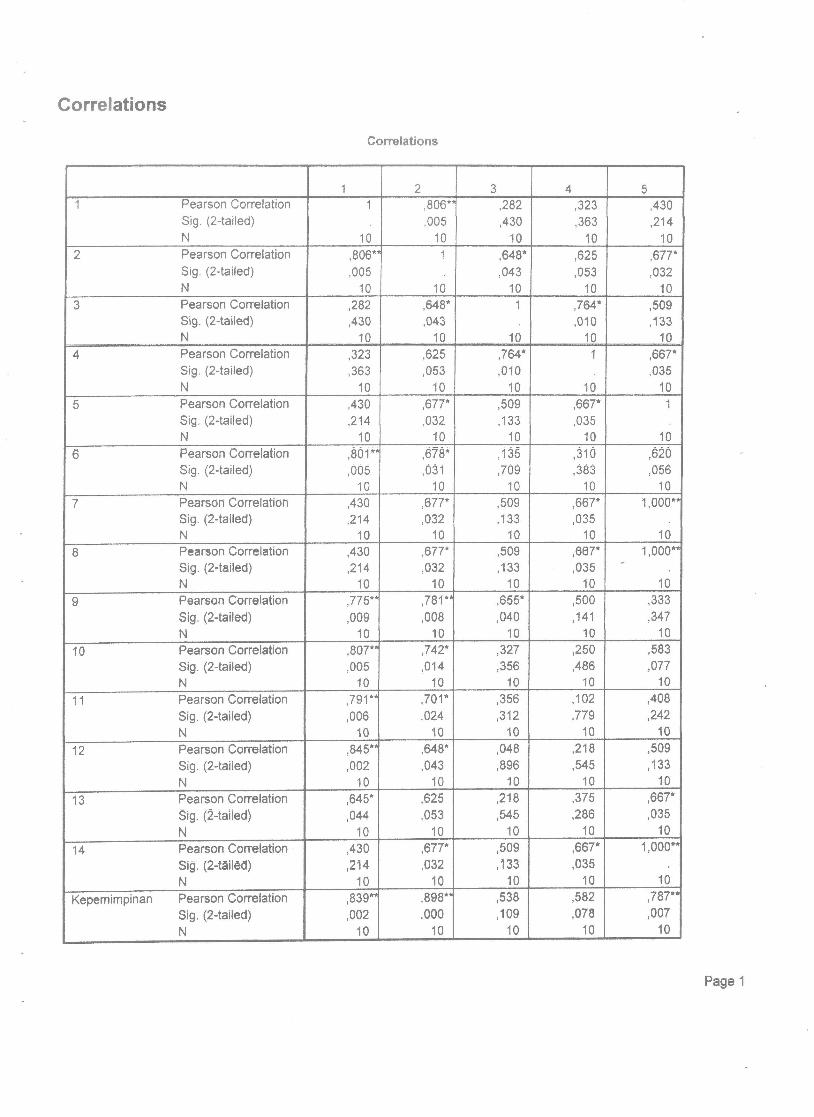
1 2 3 4 5 6 7 8 9 10 11 12 13 14 Kepemimpinan Keterangan
1 Pearson Correlation 1.000 0.806 0.282 0.323 0.430 0.801 0.430 0.430 0.775 0.807 0.791 0.845 0.645 0.430 0.839
Sig. (2-tailed) . 0.005 0.430 0.363 0.214 0.005 0.214 0.214 0.009 0.005 0.006 0.002 0.044 0.214 0.002
N 10 10 10 10 10 10 10 10 10 10 10 10 10 10 10
2 Pearson Correlation 0.806 1.000 0.648 0.625 0.677 0.678 0.677 0.677 0.781 0.742 0.701 0.648 0.625 0.677 0.898
Sig. (2-tailed) 0.005 . 0.043 0.053 0.032 0.031 0.032 0.032 0.008 0.014 0.024 0.043 0.053 0.032 0.000
N 10 10 10 10 10 10 10 10 10 10 10 10 10 10 10
3 Pearson Correlation 0.282 0.648 1.000 0.764 0.509 0.135 0.509 0.509 0.655 0.327 0.356 0.048 0.218 0.509 0.538 Gugur
Sig. (2-tailed) 0.430 0.043 . 0.010 0.133 0.709 0.133 0.133 0.040 0.356 0.312 0.896 0.545 0.133 0.109
N 10 10 10 10 10 10 10 10 10 10 10 10 10 10 10
4 Pearson Correlation 0.323 0.625 0.764 1.000 0.667 0.310 0.667 0.667 0.500 0.250 0.102 0.218 0.375 0.667 0.582 Gugur
Sig. (2-tailed) 0.363 0.053 0.010 . 0.035 0.383 0.035 0.035 0.141 0.486 0.779 0.545 0.286 0.035 0.078
N 10 10 10 10 10 10 10 10 10 10 10 10 10 10 10
5 Pearson Correlation 0.430 0.677 0.509 0.667 1.000 0.620 1.000 1.000 0.333 0.583 0.408 0.509 0.667 1.000 0.787
Sig. (2-tailed) 0.214 0.032 0.133 0.035 . 0.056 . . 0.347 0.077 0.242 0.133 0.035 . 0.007
N 10 10 10 10 10 10 10 10 10 10 10 10 10 10 10
6 Pearson Correlation 0.801 0.678 0.135 0.310 0.620 1.000 0.620 0.620 0.620 0.930 0.760 0.947 0.930 0.620 0.891
Sig. (2-tailed) 0.005 0.031 0.709 0.383 0.056 . 0.056 0.056 0.056 0.000 0.011 0.000 0.000 0.056 0.001
N 10 10 10 10 10 10 10 10 10 10 10 10 10 10 10
7 Pearson Correlation 0.430 0.677 0.509 0.667 1.000 0.620 1.000 1.000 0.333 0.583 0.408 0.509 0.667 1.000 0.787
Sig. (2-tailed) 0.214 0.032 0.133 0.035 . 0.056 . . 0.347 0.077 0.242 0.133 0.035 . 0.007
N 10 10 10 10 10 10 10 10 10 10 10 10 10 10 10
8 Pearson Correlation 0.430 0.677 0.509 0.667 1.000 0.620 1.000 1.000 0.333 0.583 0.408 0.509 0.667 1.000 0.787
Sig. (2-tailed) 0.214 0.032 0.133 0.035 . 0.056 . . 0.347 0.077 0.242 0.133 0.035 . 0.007
N 10 10 10 10 10 10 10 10 10 10 10 10 10 10 10
9 Pearson Correlation 0.775 0.781 0.655 0.500 0.333 0.620 0.333 0.333 1.000 0.750 0.816 0.655 0.500 0.333 0.787
Sig. (2-tailed) 0.009 0.008 0.040 0.141 0.347 0.056 0.347 0.347 . 0.012 0.004 0.040 0.141 0.347 0.007
N 10 10 10 10 10 10 10 10 10 10 10 10 10 10 10
10 Pearson Correlation 0.807 0.742 0.327 0.250 0.583 0.930 0.583 0.583 0.750 1.000 0.919 0.873 0.875 0.583 0.915
Sig. (2-tailed) 0.005 0.014 0.356 0.486 0.077 0.000 0.077 0.077 0.012 . 0.000 0.001 0.001 0.077 0.000
N 10 10 10 10 10 10 10 10 10 10 10 10 10 10 10
11 Pearson Correlation 0.791 0.701 0.356 0.102 0.408 0.760 0.408 0.408 0.816 0.919 1.000 0.802 0.612 0.408 0.810
Sig. (2-tailed) 0.006 0.024 0.312 0.779 0.242 0.011 0.242 0.242 0.004 0.000 . 0.005 0.060 0.242 0.004
N 10 10 10 10 10 10 10 10 10 10 10 10 10 10 10
12 Pearson Correlation 0.845 0.648 0.048 0.218 0.509 0.947 0.509 0.509 0.655 0.873 0.802 1.000 0.764 0.509 0.836
Sig. (2-tailed) 0.002 0.043 0.896 0.545 0.133 0.000 0.133 0.133 0.040 0.001 0.005 . 0.010 0.133 0.003
N 10 10 10 10 10 10 10 10 10 10 10 10 10 10 10
13 Pearson Correlation 0.645 0.625 0.218 0.375 0.667 0.930 0.667 0.667 0.500 0.875 0.612 0.764 1.000 0.667 0.838
Sig. (2-tailed) 0.044 0.053 0.545 0.286 0.035 0.000 0.035 0.035 0.141 0.001 0.060 0.010 . 0.035 0.002
N 10 10 10 10 10 10 10 10 10 10 10 10 10 10 10
14 Pearson Correlation 0.430 0.677 0.509 0.667 1.000 0.620 1.000 1.000 0.333 0.583 0.408 0.509 0.667 1.000 0.787
Sig. (2-tailed) 0.214 0.032 0.133 0.035 . 0.056 . . 0.347 0.077 0.242 0.133 0.035 . 0.007
N 10 10 10 10 10 10 10 10 10 10 10 10 10 10 10
Kepemimpinan Pearson Correlation 0.839 0.898 0.538 0.582 0.787 0.891 0.787 0.787 0.787 0.915 0.810 0.836 0.838 0.787 1.000
Sig. (2-tailed) 0.002 0.000 0.109 0.078 0.007 0.001 0.007 0.007 0.007 0.000 0.004 0.003 0.002 0.007 .
N 10 10 10 10 10 10 10 10 10 10 10 10 10 10 10
** Correlation is significant at the 0.01 level (2-tailed).
* Correlation is significant at the 0.05 level (2-tailed).
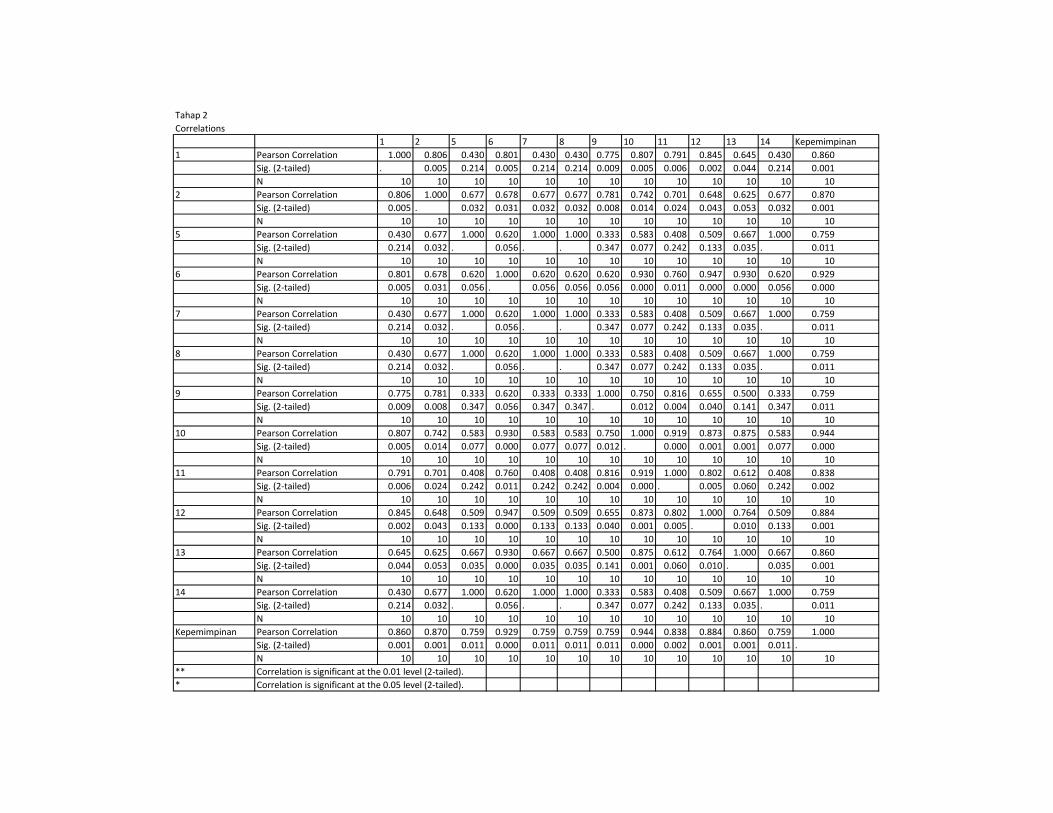
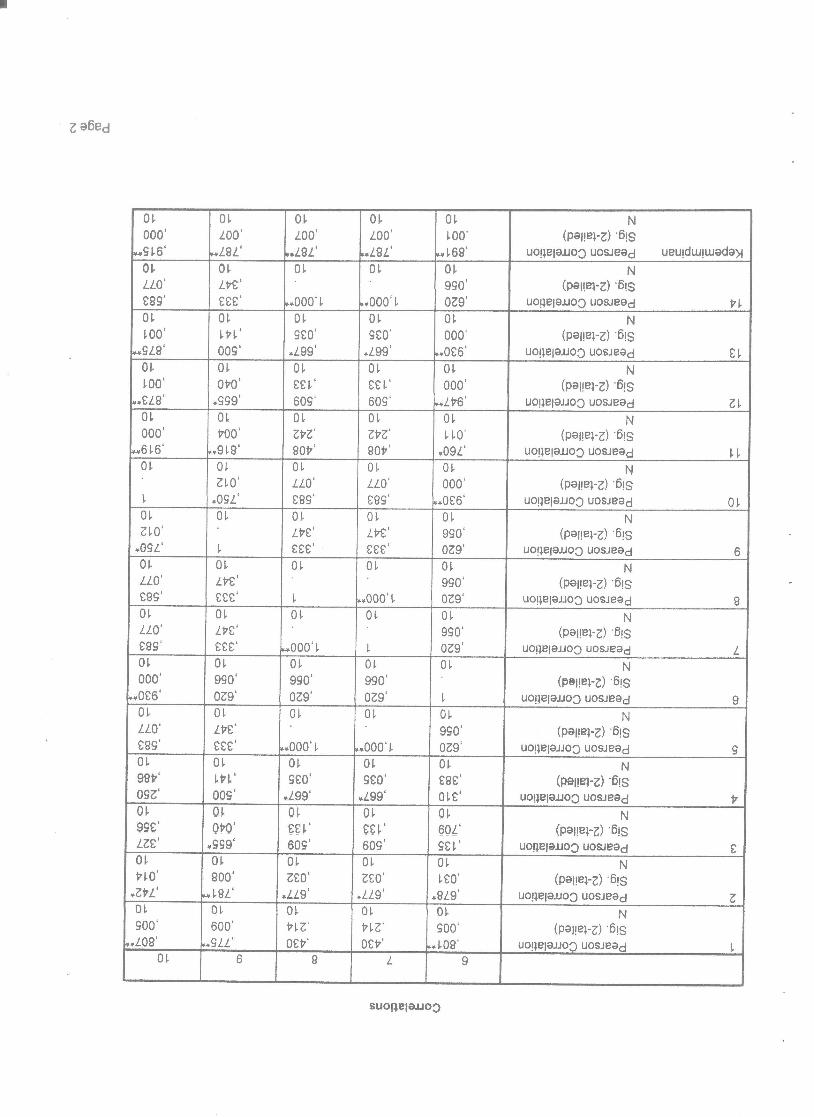
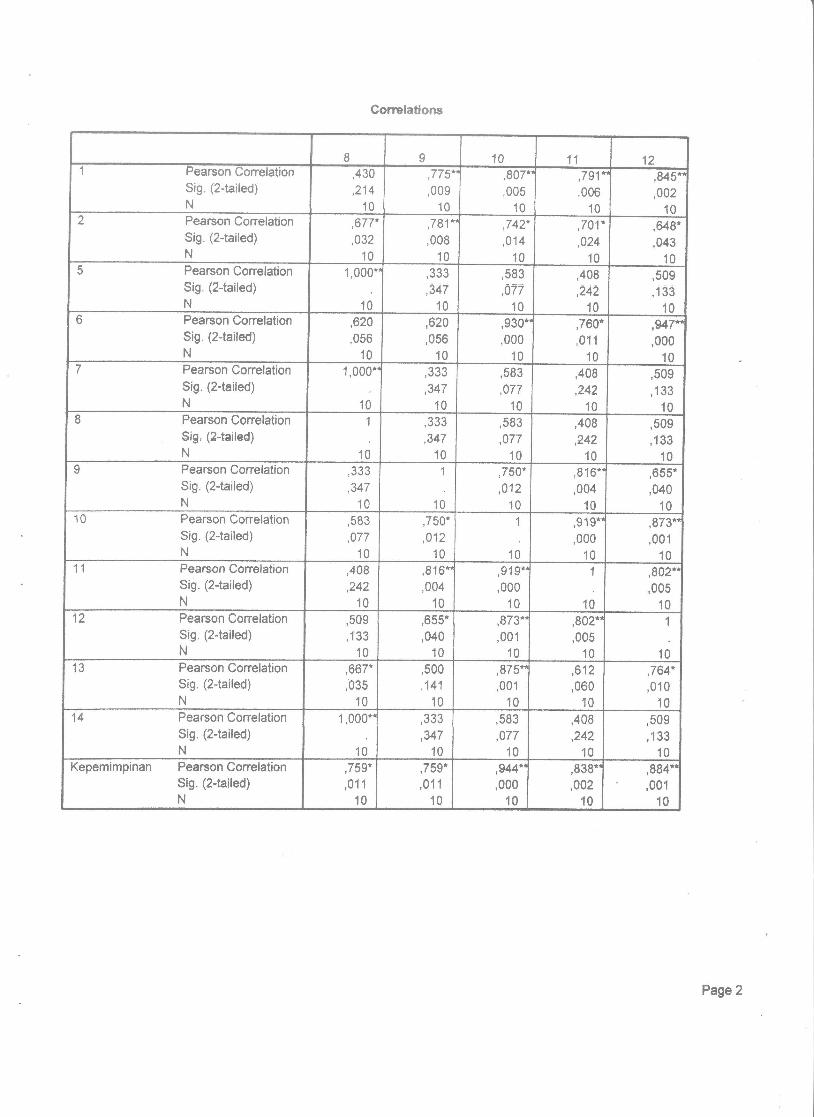
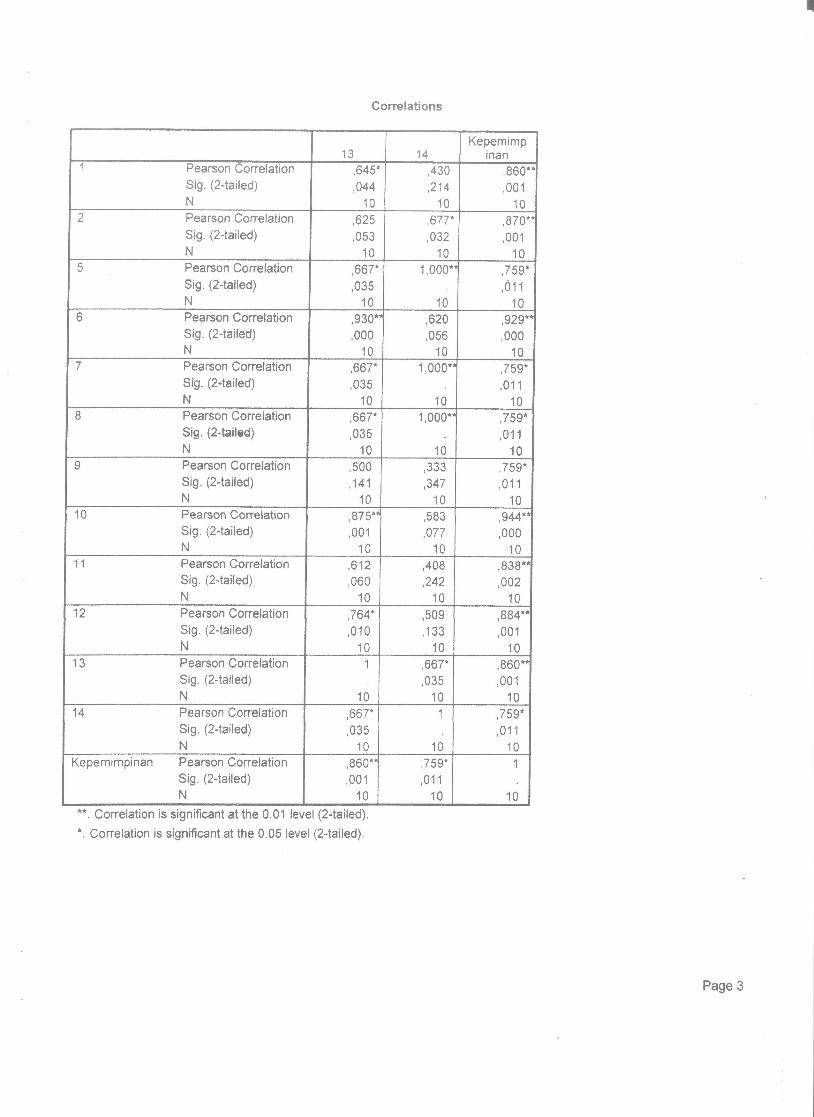
Tahap 2
Correlations
1 2 5 6 7 8 9 10 11 12 13 14 Kepemimpinan
1 Pearson Correlation 1.000 0.806 0.430 0.801 0.430 0.430 0.775 0.807 0.791 0.845 0.645 0.430 0.860
Sig. (2-tailed) . 0.005 0.214 0.005 0.214 0.214 0.009 0.005 0.006 0.002 0.044 0.214 0.001
N 10 10 10 10 10 10 10 10 10 10 10 10 10
2 Pearson Correlation 0.806 1.000 0.677 0.678 0.677 0.677 0.781 0.742 0.701 0.648 0.625 0.677 0.870
Sig. (2-tailed) 0.005 . 0.032 0.031 0.032 0.032 0.008 0.014 0.024 0.043 0.053 0.032 0.001
N 10 10 10 10 10 10 10 10 10 10 10 10 10
5 Pearson Correlation 0.430 0.677 1.000 0.620 1.000 1.000 0.333 0.583 0.408 0.509 0.667 1.000 0.759
Sig. (2-tailed) 0.214 0.032 . 0.056 . . 0.347 0.077 0.242 0.133 0.035 . 0.011
N 10 10 10 10 10 10 10 10 10 10 10 10 10
6 Pearson Correlation 0.801 0.678 0.620 1.000 0.620 0.620 0.620 0.930 0.760 0.947 0.930 0.620 0.929
Sig. (2-tailed) 0.005 0.031 0.056 . 0.056 0.056 0.056 0.000 0.011 0.000 0.000 0.056 0.000
N 10 10 10 10 10 10 10 10 10 10 10 10 10
7 Pearson Correlation 0.430 0.677 1.000 0.620 1.000 1.000 0.333 0.583 0.408 0.509 0.667 1.000 0.759
Sig. (2-tailed) 0.214 0.032 . 0.056 . . 0.347 0.077 0.242 0.133 0.035 . 0.011
N 10 10 10 10 10 10 10 10 10 10 10 10 10
8 Pearson Correlation 0.430 0.677 1.000 0.620 1.000 1.000 0.333 0.583 0.408 0.509 0.667 1.000 0.759
Sig. (2-tailed) 0.214 0.032 . 0.056 . . 0.347 0.077 0.242 0.133 0.035 . 0.011
N 10 10 10 10 10 10 10 10 10 10 10 10 10
9 Pearson Correlation 0.775 0.781 0.333 0.620 0.333 0.333 1.000 0.750 0.816 0.655 0.500 0.333 0.759
Sig. (2-tailed) 0.009 0.008 0.347 0.056 0.347 0.347 . 0.012 0.004 0.040 0.141 0.347 0.011
N 10 10 10 10 10 10 10 10 10 10 10 10 10
10 Pearson Correlation 0.807 0.742 0.583 0.930 0.583 0.583 0.750 1.000 0.919 0.873 0.875 0.583 0.944
Sig. (2-tailed) 0.005 0.014 0.077 0.000 0.077 0.077 0.012 . 0.000 0.001 0.001 0.077 0.000
N 10 10 10 10 10 10 10 10 10 10 10 10 10
11 Pearson Correlation 0.791 0.701 0.408 0.760 0.408 0.408 0.816 0.919 1.000 0.802 0.612 0.408 0.838
Sig. (2-tailed) 0.006 0.024 0.242 0.011 0.242 0.242 0.004 0.000 . 0.005 0.060 0.242 0.002
N 10 10 10 10 10 10 10 10 10 10 10 10 10
12 Pearson Correlation 0.845 0.648 0.509 0.947 0.509 0.509 0.655 0.873 0.802 1.000 0.764 0.509 0.884
Sig. (2-tailed) 0.002 0.043 0.133 0.000 0.133 0.133 0.040 0.001 0.005 . 0.010 0.133 0.001
N 10 10 10 10 10 10 10 10 10 10 10 10 10
13 Pearson Correlation 0.645 0.625 0.667 0.930 0.667 0.667 0.500 0.875 0.612 0.764 1.000 0.667 0.860
Sig. (2-tailed) 0.044 0.053 0.035 0.000 0.035 0.035 0.141 0.001 0.060 0.010 . 0.035 0.001
N 10 10 10 10 10 10 10 10 10 10 10 10 10
14 Pearson Correlation 0.430 0.677 1.000 0.620 1.000 1.000 0.333 0.583 0.408 0.509 0.667 1.000 0.759
Sig. (2-tailed) 0.214 0.032 . 0.056 . . 0.347 0.077 0.242 0.133 0.035 . 0.011
N 10 10 10 10 10 10 10 10 10 10 10 10 10
Kepemimpinan Pearson Correlation 0.860 0.870 0.759 0.929 0.759 0.759 0.759 0.944 0.838 0.884 0.860 0.759 1.000
Sig. (2-tailed) 0.001 0.001 0.011 0.000 0.011 0.011 0.011 0.000 0.002 0.001 0.001 0.011 .
N 10 10 10 10 10 10 10 10 10 10 10 10 10
** Correlation is significant at the 0.01 level (2-tailed).
* Correlation is significant at the 0.05 level (2-tailed).
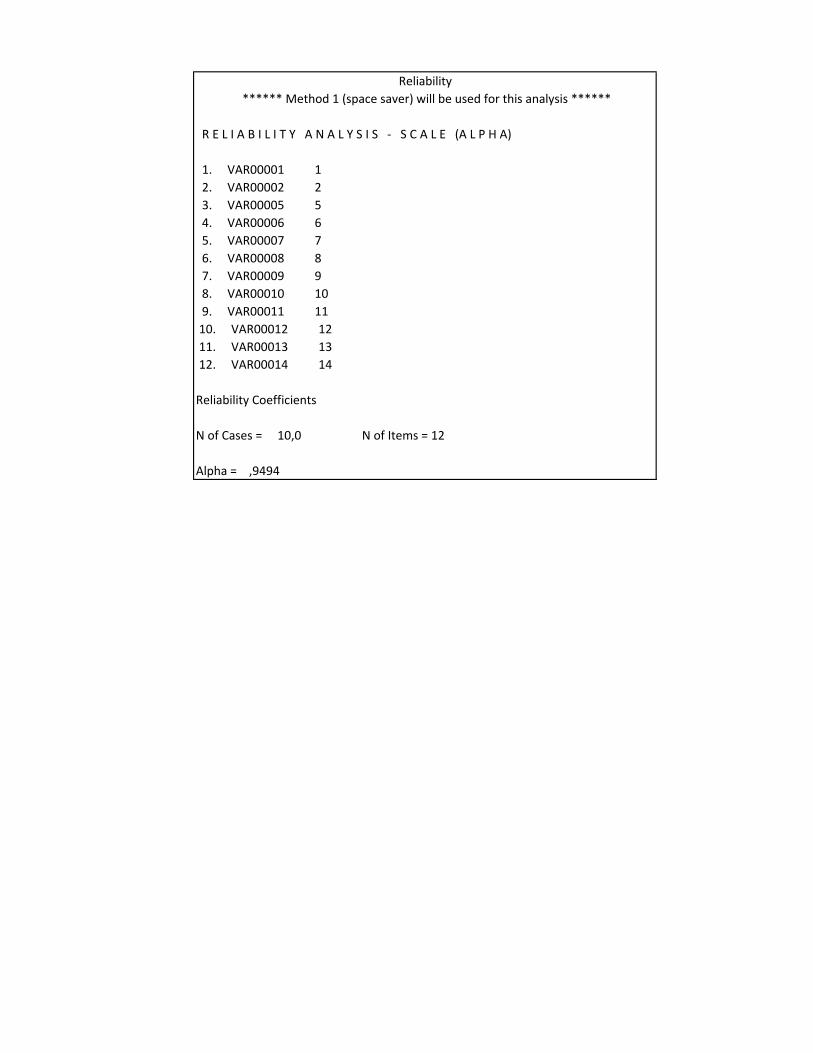
R E L I A B I L I T Y A N A L Y S I S - S C A L E (A L P H A)
1. VAR00001 1
2. VAR00002 2
3. VAR00005 5
4. VAR00006 6
5. VAR00007 7
6. VAR00008 8
7. VAR00009 9
8. VAR00010 10
9. VAR00011 11
10. VAR00012 12
11. VAR00013 13
12. VAR00014 14
Reliability Coefficients
N of Cases = 10,0 N of Items = 12
Alpha = ,9494
Reliability
****** Method 1 (space saver) will be used for this analysis ******
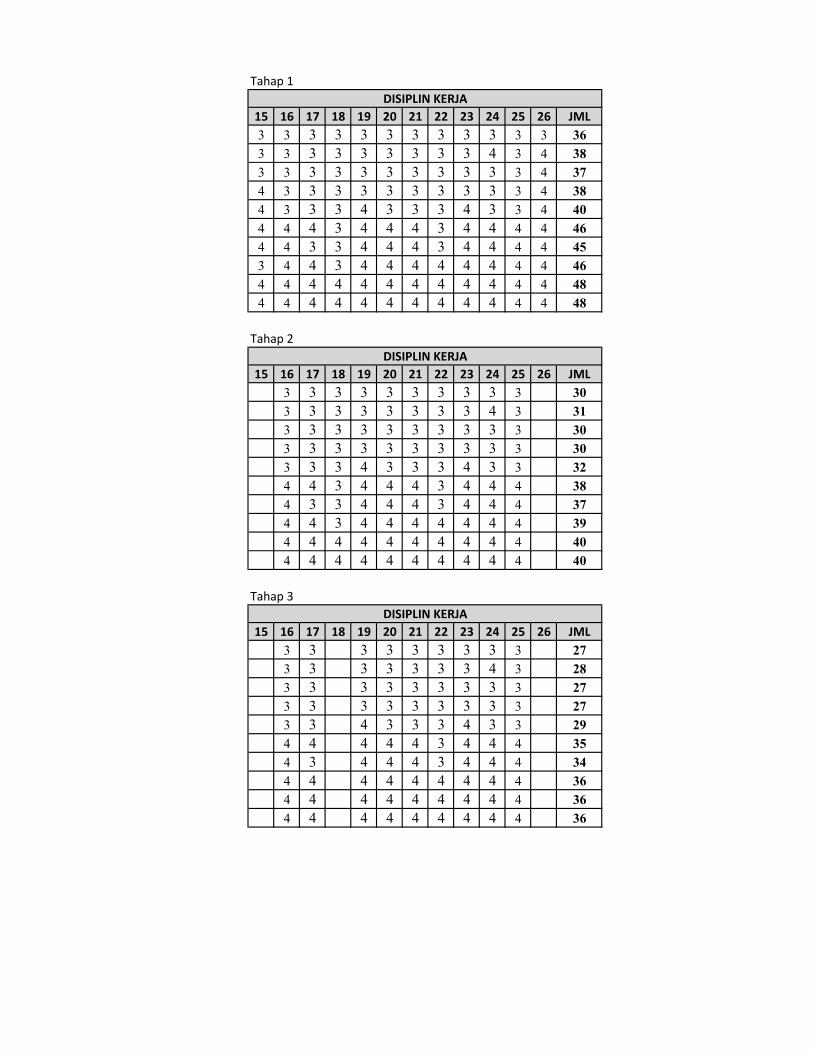
Tahap 1
15 16 17 18 19 20 21 22 23 24 25 26 JML
3 3 3 3 3 3 3 3 3 3 3 3 36
3 3 3 3 3 3 3 3 3 4 3 4 38
3 3 3 3 3 3 3 3 3 3 3 4 37
4 3 3 3 3 3 3 3 3 3 3 4 38
4 3 3 3 4 3 3 3 4 3 3 4 40
4 4 4 3 4 4 4 3 4 4 4 4 46
4 4 3 3 4 4 4 3 4 4 4 4 45
3 4 4 3 4 4 4 4 4 4 4 4 46
4 4 4 4 4 4 4 4 4 4 4 4 48
4 4 4 4 4 4 4 4 4 4 4 4 48
Tahap 2
15 16 17 18 19 20 21 22 23 24 25 26 JML
3 3 3 3 3 3 3 3 3 3 30
3 3 3 3 3 3 3 3 4 3 31
3 3 3 3 3 3 3 3 3 3 30
3 3 3 3 3 3 3 3 3 3 30
3 3 3 4 3 3 3 4 3 3 32
4 4 3 4 4 4 3 4 4 4 38
4 3 3 4 4 4 3 4 4 4 37
4 4 3 4 4 4 4 4 4 4 39
4 4 4 4 4 4 4 4 4 4 40
4 4 4 4 4 4 4 4 4 4 40
Tahap 3
15 16 17 18 19 20 21 22 23 24 25 26 JML
3 3 3 3 3 3 3 3 3 27
3 3 3 3 3 3 3 4 3 28
3 3 3 3 3 3 3 3 3 27
3 3 3 3 3 3 3 3 3 27
3 3 4 3 3 3 4 3 3 29
4 4 4 4 4 3 4 4 4 35
4 3 4 4 4 3 4 4 4 34
4 4 4 4 4 4 4 4 4 36
4 4 4 4 4 4 4 4 4 36
4 4 4 4 4 4 4 4 4 36
DISIPLIN KERJA
DISIPLIN KERJA
DISIPLIN KERJA
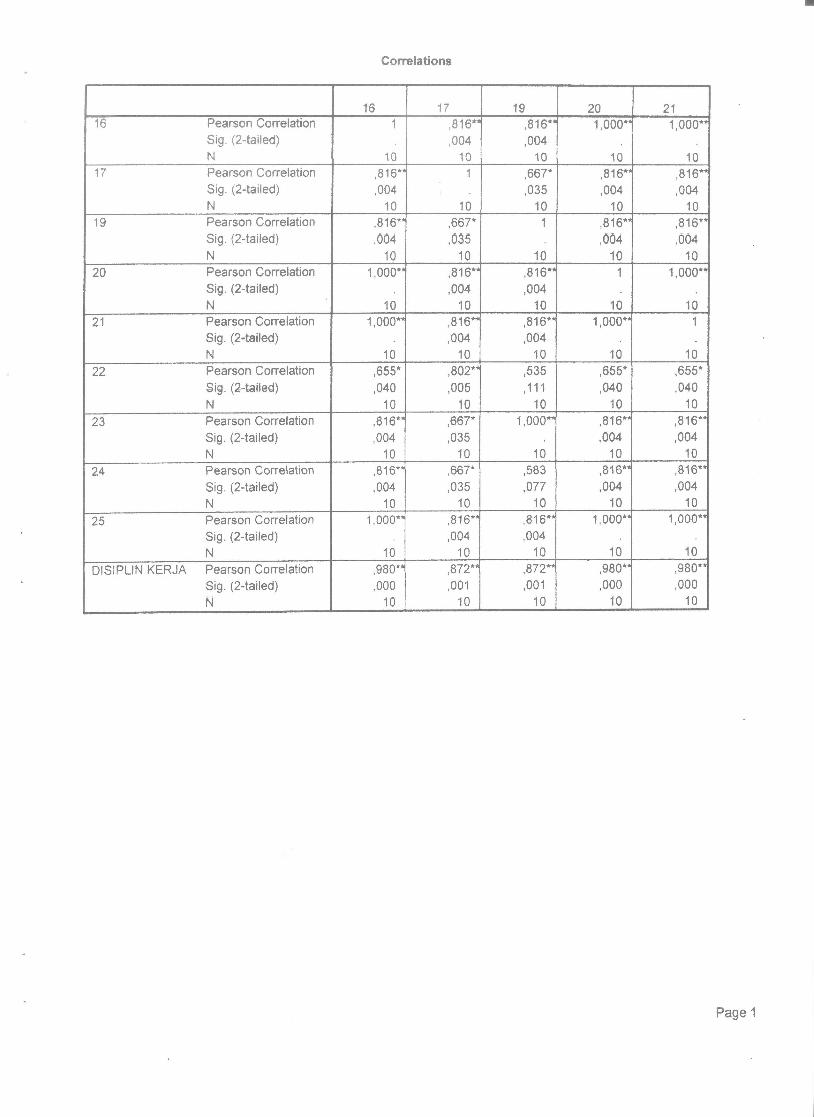
Correlatons
1 5 16 1 7 1 8 't9F'earson uorelattonSig. (2-tailed)N
1
1 0
,408,242
1 0
250,486
1 0
,408,242
1 0
,583,077
1 016 Pearson ConelationSig. (2-taited)N
,408,242
1 0
1I
10
,816*,004
10
,500,141
1 0
,816,004
1 017 Pearson ConelationSig. (2-taited)N
,250,486
10
,816,004
10
1
10
,612,060
10
,667',035
1018 Pearson ConelationSig. (2{aited)N
,408,242
1 0
,500,141
10
,612,060
1 0
1
1 0
,408,242
1 019 Pearson ConelationSig. (2-taited)N
,583,077
1 0
,816*,004
10
,667*,035
1 0
,408,242
1 0
1
1 020 Pearson Conelation
Sig, (2-taited)N
,408,242
10
1,000
10
,816',004
10
,500,141
10
,816*,004
1 021 Pearson Conelation
Sig. (2-taited)N
,408,242
10
1 ,000*
1 0
,816",004
10
,500,141
1 0
,816,004
1022 Pearson Conelation
sigN
(2-tailed),089,807
1 0
,655*,040
1 0
802-,005
10
,7U*,010
10
,535, 1 1 1
1 023 Pearson Conelation
Sig. (2-taited)N
,583,077
1 0
A 16 ',004
1 0
,667',035
1 0
,408,242
1 n
1,000 '
1 024 "Pearson Conelation
Sig. (2-taited)N
,167,645
1 0
,816,004
1 0
,667',035
1 0
,408,242
1 0
,583,077
1 025 Pearson Conelation
Sig. (2-taited)N
,408,242
't0
,|,000"
1 0
,816*,004
1 0
,500,141
10
,816*',004
{ n
26 Pearson ConelaflonSig. (2-taited)N
,408,242
1 0
, J J J
,u710
,272,447
1 0
, 167,6,45
1 0
,408,242
1 0DISIPLIN KERJA Pearson Conelation
Sig. (2-taited)N
,526, 1 1 8
1 0
,961,000
10
,956',002
10
,633',049
10
,883*,001
10
Page 1

Corrslations
20 2 1 22 23 24r b pearson Conelation
Sig. (2-taited)N
,408,242
1 0
,408,242
I U
,8071 0
089 ,583,077
1 0
,167,645
1 016 Pearson Conelation
Sig. (2-taited)N
1,000
4 nI U
1 ,000'
1 0
,655',M0
1 0
6*,81,004
10
,816 ',004
1 017 Pearson Conelation
Sig. (2{aited)N
,816 ',004
{n
16','a
,0041 0
,802,005
10
,667',035
10
,667"d a i
1018 Pearson Conelation
Sig. (2-tailed)N
,500,141
10
,s00, 1 4 1
1 0
,7U,010
10
,408,242
1 0
,408,242
1 019 Pearson Conelation
Sig. (2.taited)N
,816 ',004
1 0
,816*,004
1 0
,535, 1 1 1
1 0
1,000'
10
,583,077
1 020 Pearson Conelation
Sig, (2-taiteC)N
1
1 0
1,000
10
,655',040
1 0,004
6rl
10
,81 ,816,004
1 021 Pearson Conelation
Sig. (2-tailed)N
t ,000*
10
1
1 0
,655*,040
1 0
,816,004
10
,816",004
1 022 Pearson Correlation
Sig. (2-tailed)N
,655',040
10
,655*,040
10
1
1 0
,535, 1 1 1
1 0
,535,1 ' t I
1 023 Pearson Conelation
Sig. (2-tailed)N
,816 ',004
1 0
,816,004
1 0
,535, 1 1 1
1 0
,|
1 0
,583n77
1 024 Pearson Conelation
Sig. (2-tailed)N
6r',81,004
1 0
,816',,004
1 0
,535, 1 1 1
1 0
,583,477
't0
1
1 025 Pearson Conelation
Sig. (2-tailed)N
1,000'
10
000*t .
I U
,655*,040
1 0
,816,0M
10
,816' ',004
1 026 Pearson Conelation
Sig. (2{ailed)N
,333,u7
10
, J J J
,u710
,219,545
1 0
,408,242
10
,408,242
1 0DISIPLIN KERJA Pearson Conelation
Sig. (2-tailed)N
,961 ',000
10
,961.,000
10
,734*, 0 1 6
1 0
,883,001
10
,794',,006
10
Page 2
Conplations
25 26DISIPLINKERJA
15 Pearson ConelationSig. (2-taited)N
,408,242
10
,408,242
1 0
,526, 1 1 8
1 016 Pearson Conelation
Sig. (Z{aited)N
1,000'
1 0
, J J J
,u71 0
,961,000
1017 Pearson Conelation
Si9. (2-taited)N
, 816,004
10
, z t z
,44710
,856' ',002
1018 Pearson Conelation
Sig. (2{aited)N
,500,141
10,645
1 0
,633',049
1019 Pearson Conelation
Sig. (2.taited)N
,0041 0
6r,,81 ,408,242
1 0
,883'',001
1020 Pearson Conelation
Sig, (2-taited)N
000*4
10
,333,u7
1 0
,961' ',000
1021 Pearson Conelation
Sig. (2{ailed)N
1,000'
1 0
, J J J
,U710
,961,000
1022 Pearson Correlation
Sig. (2{aited)N
,655",040
1 0
,218,545
1 0
,7U*,016
1023 Pearson Conelation
Sig. (2-tailed)N
, 8 1 6,004
1 0
,408,242
1 0
,883*',001
1 024 Pearson Conelation
Sig. (2-tailed)N
,816,004
1 0
,408,242
10
,794",006
1 025 Pearson Conelation
Sig. (2{ailed)N
1
1 0
,333,u7
1 0
,961,000
1 026 Pearson Conelation
Sig. (2{ailed)N
,333,u7
10
1
{ n
,451, 1 9 0
1 0DISIPLIN KERJA Pearson Conelation
Sig. (2-tailed)N
,961,000
10
,451, 1 9 0
1 0
1
{ n*', Conelation is significant at the 0.01 level (2-tailed).'. Conelation is significant at the 0.05 level (2-tailed).
Page 3
Conslations
1 6 1 7 1 8 1 9 2010 pearson Conelation
Sig. (2-taited)N 1 0
1 , 8 1 6,004
1 0
,5001 4 1
1 0
6*,81
1 0,004
1,000'
17 Pearson ConelationSig. (2-tailed)N
, 8 1 6,004
1 0
1
I U
,612,060
1 0
,667',035
1 0
, 8 1 6,004
1 018 Pearson Correlation
Sig. (2-taited)N
,500, 1 4 1
1 0
,612,060
10
1
' t0
,408,242
10
,500,141
1019 Pearson Conelation
Sig. (2-taited)N
, 816,004
10
,667.,035
1 0
,408,242
10
1
1 0,004
10
6*,81
20 Pearson ConelationSig. (2-taited)t\l
' .|,000.6r i,81
,0041 0
,500,141
1 0,004
1 0
6*,8'1 II
1 021 Pearson Conelation
Sig, (2-tailed)N
1 000"
1 0,004
1 0
, 816 ' ,500,141
1 0
,816,0M
1 0
1,000'
1022 Pearson Conelation
Sig. (2-tailed)N
A ( A *
,0401 0
,802,005
1 0
,764',010
1 0
,535, 1 1 1
1 0
,655',040
1 023 Peargon Conelation
Sig. (2-taited)N
,816'*,004
10
,667',035
10
,408,242
1 0 1 0
000'I ,
,00410
6f,,81
24 Pearson CorrelationSig. (2-tailed)N
, 8 1 6,004
1 0
,667',035
1 0
,408,242
1 0
,583n77
10,004
1 0
6r', 8 1
25 Pearson ConelationSig. (2-tailed)N
1,000'
1 0
,816*,004
1 0
,500,141
1 0
A t.81,004
1 0
1,000'
1 0DISIPLIN KERJA Pearson Conelation
Sig. (2-tailed)N
,972'.,000
1 0
,990",001
1 0
,628,052
1 0
,861 ',001
t n
,972",000
1 0
Page 1
Comelations
21 22 23 2416 Pearson Conelation
Sig. (2-tailed)N 1 0
1,000' ,655',040
1 0
6*,81,0M
10
,816,004
1017 Pearson Conelation
Sig. (2-tailed)N
6',81,004
10
,802',005
10
,667*,035
1 0
,667',035
1 018 Pearson Conelation
Sig. (2tailed)N
,500, 1 4 1
10
,7U*,010
10
,408,242
10
,408,242
1019 Pearson Conelation
Sig. (2-tailed)N
,816 ',004
10
,535, 1 1 1
1 0
1,000
10
,583,077
1 020 Pearson Conelation
Sig. (2-tailed)N
1,000*
1 0
,655',040
1 0,004
1 0
6*,81 , 8 1 6,004
1 021 Pearson Conelation
Sig, (2-tailed)N
{I
1 0
,655*,040
1 0,004
10
6*,81,004
10
6.,,81
22 Pearson ConelationSig. (2-tailed)N
,655",040
1 0
I
1o
,535, 1 1 1
1 0
,535, 1 1 1
1 023 Pearson Conelation
Sig. (2-tailed)N
,00410
0",81 ,535, 1 1 1
1 0
1
1 0
,583,077
1 024 Pearson Conelation
Sig. (2-tailed)N
6r:, 8 1,004
1 0
,535, 1 1 1
1 0
,583,077
1 0
,|
1 025 Pearson Conelation
Sig. (2-tailed)N
1,000.
1 0
,655*,M0
10
,816 .,004
1 0
6*!
10
,81,004
DISIPLIN KERJA Pearson ConelationSig. (2-tailed)N
,972',000
1 0
70''1
,009' t0
,E61,001
1 0
3*,81,004
10
Page 2
Correlations
25DISIPLINKERJA
]b peanron ConelationSig. (2-taited)N
000'1 ,
1 0
972*,000
1 017 Pearson Conelation
Sig. (2-taited)N
,816.,004
't0
,880*,001
1018 Pearson Conelation
Sig. (Z-tailed)N
,500,141
10
,628,052
1019 Pearson Conelation
Sig. (2-tailed)N
,816,004
1 0
,861*,001
1020 Pearson Conelation
Sig. (2-tailed)N
1,000"
10
,972,000
1 021 Pearson Conelation
Sig, (2-tailed)N
1,000'
10
,972",000
1022 Pearson Conelation
Sig. (2-tailed)N
,655*,040
10
770",009
1023 Pearson Conelation
Sig. (2-tailed)N
,816,004
10
,861*',001
1024 Pearson Conelation
Sig. (2-tailed)N
, 8 1 6,004
1 0,004
1 0
3', 8 1
25 Pearson ConelationSig. (2-tailed)N 1 0
1 ,972,000
10DISIPLIN KERJA Pearson Conelation
Sig. (2-tailed)N
972',000
1 n
I
1 0". Conelation is significant at the 0.01 level (2-tailed).*. Conelation is significant at the 0.05 level (2-tailed).
Page 3
Corelations
16 1 7 1 9 20 2 116 Pearson Oorelatton
Sig. (2-tailed)N
1
I U
A,81,004
1 0
6rr, 8 1,004
10
1 ,000'
1 0
000'1 ,
1 017 Pearson Conelation
Sig. (2-tailed)N
,0041 0
6*, 8 1 1
1 0
,667*,035
10
6*,,81,004
'10
, 8 1 6,004
1 019 Pearson Conelation
Sig. (2-tailed)N
,816.,004
10
AATi
,03510
1
1 0
16*,8,004
10
16' 'n
,00410
20 Pearson ConelationSig. (2tailed)N
1,000*
10
16-,8,004
1 0
,816*,004
10 1 0
1 1,000'
1021 Pearson Conelation
Sig. (2-tailed)N
1,000*
't0
,816",004
1 0
16*',8
1 0,004
000'
10
1 , 1
1022 Pearson Conelation
Sig, (2-tailed)N
,65s',040
l n
,802',006
10
,535, 1 1 1
4 AI U
,655',040
10
,655*,040
1023 Pearson Conelation
Sig. (2-tailed)N
,0041 0
16*A ,667*,035
1 0
1,000*
1 0
,816,004
10
,816,004
I U
24 Pearson ConelationSig. (2tailed)N
,0041 0
6'', 8 1 ,667*,035
1 0
,583,077
1 0
,816,004
10
,816r',,004
' t0
25 Pearson ConelationSig. (2-tailed)N
1,000 '
1 0
R 1 5 *
,0041 0
6r', 8 1,004
1 0
000*'
10
I , 1,000
1 0DISIPLIN KERJA Pearson Conelation
Sig. (2-tailed)N
,980",000
1 0
72*',8,001
1 0
,872,001
10
,980*,000
10
,980",000
10
Page 1
Corrsladons
22 23 24 25DISIPLINKERJA
16 Pearson ConelationSig. (2-taited)N
,655',040
1 0,004
10
6.',81,004
6*
1 0
,81 1,000*
10
980-
,00010
17 Pearson CorrelationSig. (2-taited)N
,802,005
10
,667',035
1 0
,667',03s
'10,004
1 0
6*,81 ,872,001
1 019 Pearson Correlation
Sig. (2tailed)N
,535, 1 1 1
1 0
1,000
'10
,583,077
10
,816*,004
10
,87z',,001
1020 Pearson Conelation
Sig. (2-tailed)N
,655*,040
1 0
6*,81,004
1 0,004
10
6*!,8'l 1,000'
10,000
10
980''
21 Pearson ConelationSig. (2-tailed)N
,655*,040
1 0
6r.,81,004
10
,816,004
1 0
t 000*
1 0
980*,000
1022 Pearson Conelation
Sig, (2-tailed)N
1I
10
,535, 1 1 1
1 0
,535, 1 1 1
't0
,655*,040
10
,740',014
1 023 Pearson Conelation
Sig. (2-tailed)N
,535, 1 1 1
1 0
I
1 0
,583,077
{ n
,816',004
1 0
,872*',001
1024 Pearson Correlation
Sig. (2-tailed)N
,535, 1 1 1
1 0
,583,077
1 0
1
I U
,816.',004
't0
,820*,004
1025 Pearson Conelation
Sig. (2-tailed)N
A q 6 r
,0401 0
,816 ',004
1 0
, 8 1 6,004
1 0
1
10,000
1 0
980"
DISIPLIN KERJA Pearson ConelationSig. (2-tailed)N
,74Q",014
1 0
,872,001
10
,820.',004
10,000
1 0
980* I
10*. Conelation is significant at the 0.01 level (2-tailed).*. Conelation is significant at the 0.05 level (2{ailed).
Page2
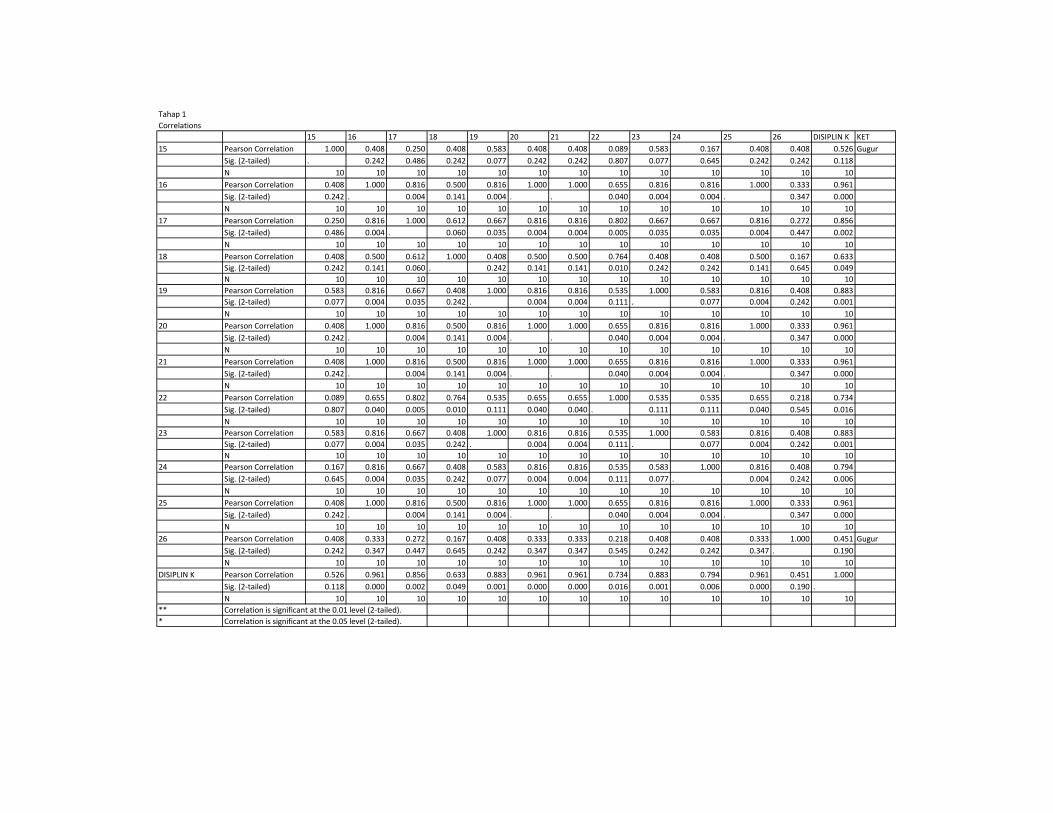
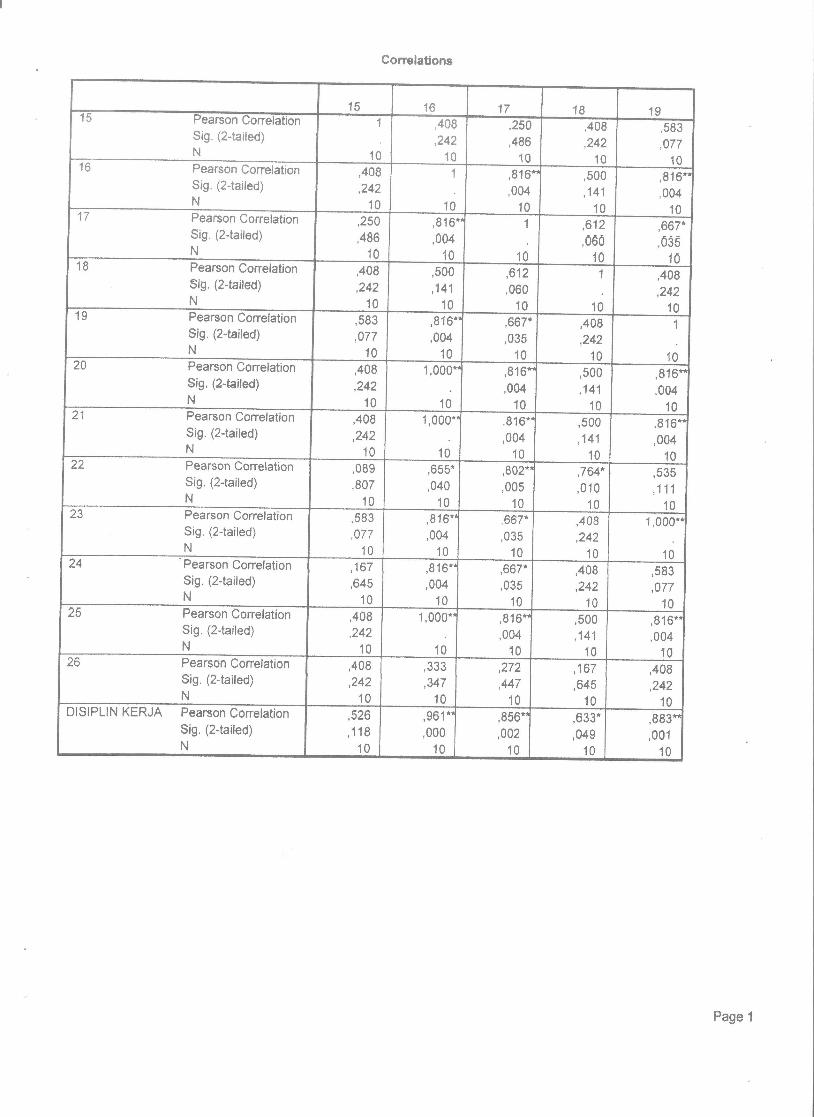
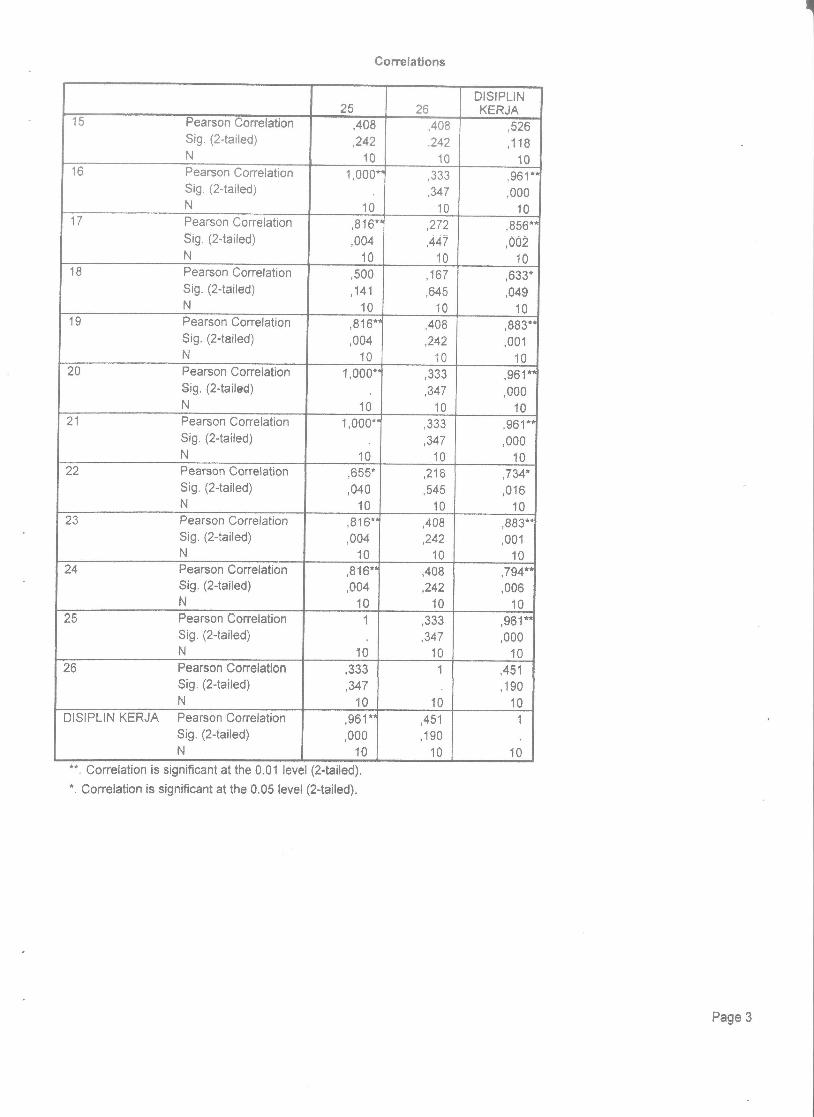
Tahap 1
Correlations
15 16 17 18 19 20 21 22 23 24 25 26 DISIPLIN K KET
15 Pearson Correlation 1.000 0.408 0.250 0.408 0.583 0.408 0.408 0.089 0.583 0.167 0.408 0.408 0.526 Gugur
Sig. (2-tailed) . 0.242 0.486 0.242 0.077 0.242 0.242 0.807 0.077 0.645 0.242 0.242 0.118
N 10 10 10 10 10 10 10 10 10 10 10 10 10
16 Pearson Correlation 0.408 1.000 0.816 0.500 0.816 1.000 1.000 0.655 0.816 0.816 1.000 0.333 0.961
Sig. (2-tailed) 0.242 . 0.004 0.141 0.004 . . 0.040 0.004 0.004 . 0.347 0.000
N 10 10 10 10 10 10 10 10 10 10 10 10 10
17 Pearson Correlation 0.250 0.816 1.000 0.612 0.667 0.816 0.816 0.802 0.667 0.667 0.816 0.272 0.856
Sig. (2-tailed) 0.486 0.004 . 0.060 0.035 0.004 0.004 0.005 0.035 0.035 0.004 0.447 0.002
N 10 10 10 10 10 10 10 10 10 10 10 10 10
18 Pearson Correlation 0.408 0.500 0.612 1.000 0.408 0.500 0.500 0.764 0.408 0.408 0.500 0.167 0.633
Sig. (2-tailed) 0.242 0.141 0.060 . 0.242 0.141 0.141 0.010 0.242 0.242 0.141 0.645 0.049
N 10 10 10 10 10 10 10 10 10 10 10 10 10
19 Pearson Correlation 0.583 0.816 0.667 0.408 1.000 0.816 0.816 0.535 1.000 0.583 0.816 0.408 0.883
Sig. (2-tailed) 0.077 0.004 0.035 0.242 . 0.004 0.004 0.111 . 0.077 0.004 0.242 0.001
N 10 10 10 10 10 10 10 10 10 10 10 10 10
20 Pearson Correlation 0.408 1.000 0.816 0.500 0.816 1.000 1.000 0.655 0.816 0.816 1.000 0.333 0.961
Sig. (2-tailed) 0.242 . 0.004 0.141 0.004 . . 0.040 0.004 0.004 . 0.347 0.000
N 10 10 10 10 10 10 10 10 10 10 10 10 10
21 Pearson Correlation 0.408 1.000 0.816 0.500 0.816 1.000 1.000 0.655 0.816 0.816 1.000 0.333 0.961
Sig. (2-tailed) 0.242 . 0.004 0.141 0.004 . . 0.040 0.004 0.004 . 0.347 0.000
N 10 10 10 10 10 10 10 10 10 10 10 10 10
22 Pearson Correlation 0.089 0.655 0.802 0.764 0.535 0.655 0.655 1.000 0.535 0.535 0.655 0.218 0.734
Sig. (2-tailed) 0.807 0.040 0.005 0.010 0.111 0.040 0.040 . 0.111 0.111 0.040 0.545 0.016
N 10 10 10 10 10 10 10 10 10 10 10 10 10
23 Pearson Correlation 0.583 0.816 0.667 0.408 1.000 0.816 0.816 0.535 1.000 0.583 0.816 0.408 0.883
Sig. (2-tailed) 0.077 0.004 0.035 0.242 . 0.004 0.004 0.111 . 0.077 0.004 0.242 0.001
N 10 10 10 10 10 10 10 10 10 10 10 10 10
24 Pearson Correlation 0.167 0.816 0.667 0.408 0.583 0.816 0.816 0.535 0.583 1.000 0.816 0.408 0.794
Sig. (2-tailed) 0.645 0.004 0.035 0.242 0.077 0.004 0.004 0.111 0.077 . 0.004 0.242 0.006
N 10 10 10 10 10 10 10 10 10 10 10 10 10
25 Pearson Correlation 0.408 1.000 0.816 0.500 0.816 1.000 1.000 0.655 0.816 0.816 1.000 0.333 0.961
Sig. (2-tailed) 0.242 . 0.004 0.141 0.004 . . 0.040 0.004 0.004 . 0.347 0.000
N 10 10 10 10 10 10 10 10 10 10 10 10 10
26 Pearson Correlation 0.408 0.333 0.272 0.167 0.408 0.333 0.333 0.218 0.408 0.408 0.333 1.000 0.451 Gugur
Sig. (2-tailed) 0.242 0.347 0.447 0.645 0.242 0.347 0.347 0.545 0.242 0.242 0.347 . 0.190
N 10 10 10 10 10 10 10 10 10 10 10 10 10
DISIPLIN K Pearson Correlation 0.526 0.961 0.856 0.633 0.883 0.961 0.961 0.734 0.883 0.794 0.961 0.451 1.000
Sig. (2-tailed) 0.118 0.000 0.002 0.049 0.001 0.000 0.000 0.016 0.001 0.006 0.000 0.190 .
N 10 10 10 10 10 10 10 10 10 10 10 10 10
** Correlation is significant at the 0.01 level (2-tailed).
* Correlation is significant at the 0.05 level (2-tailed).
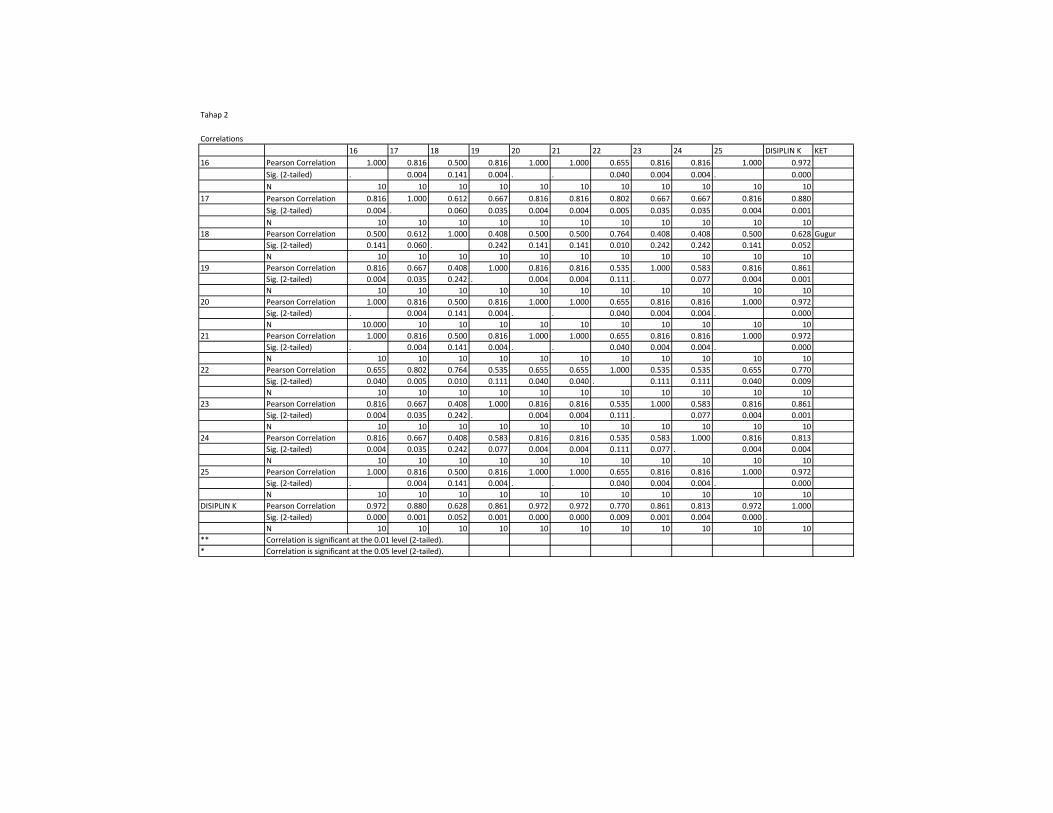
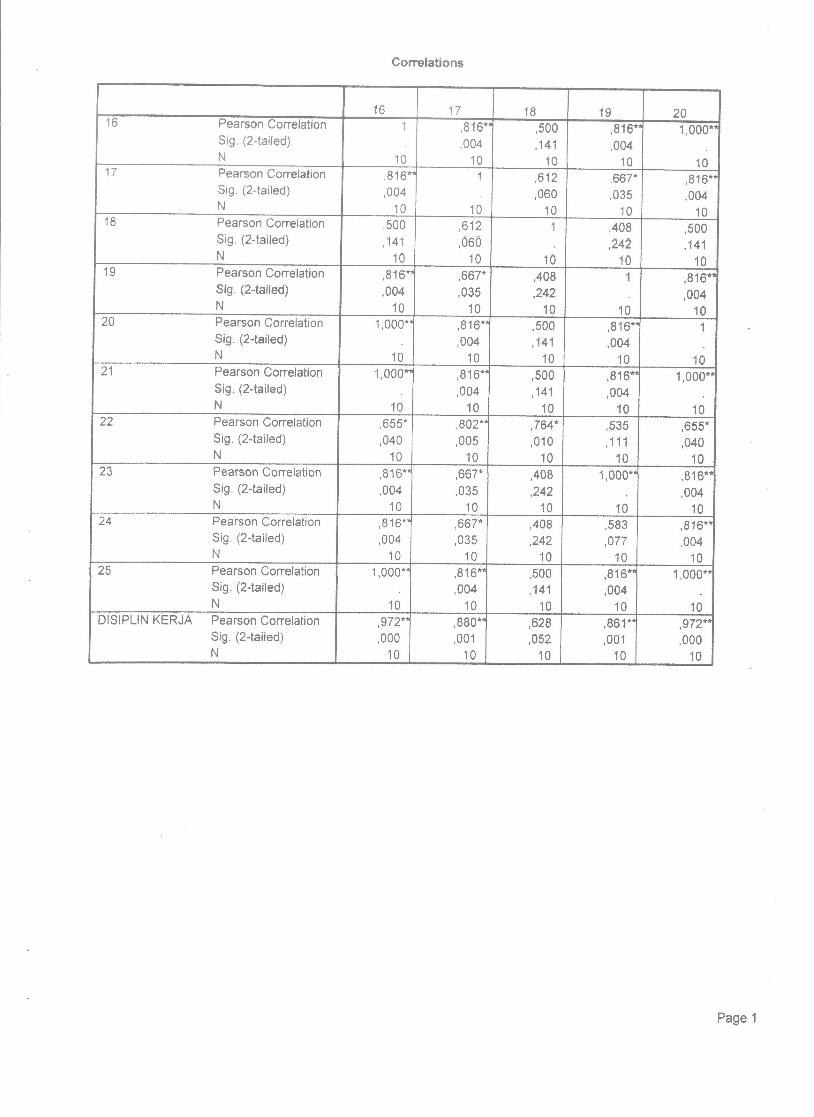
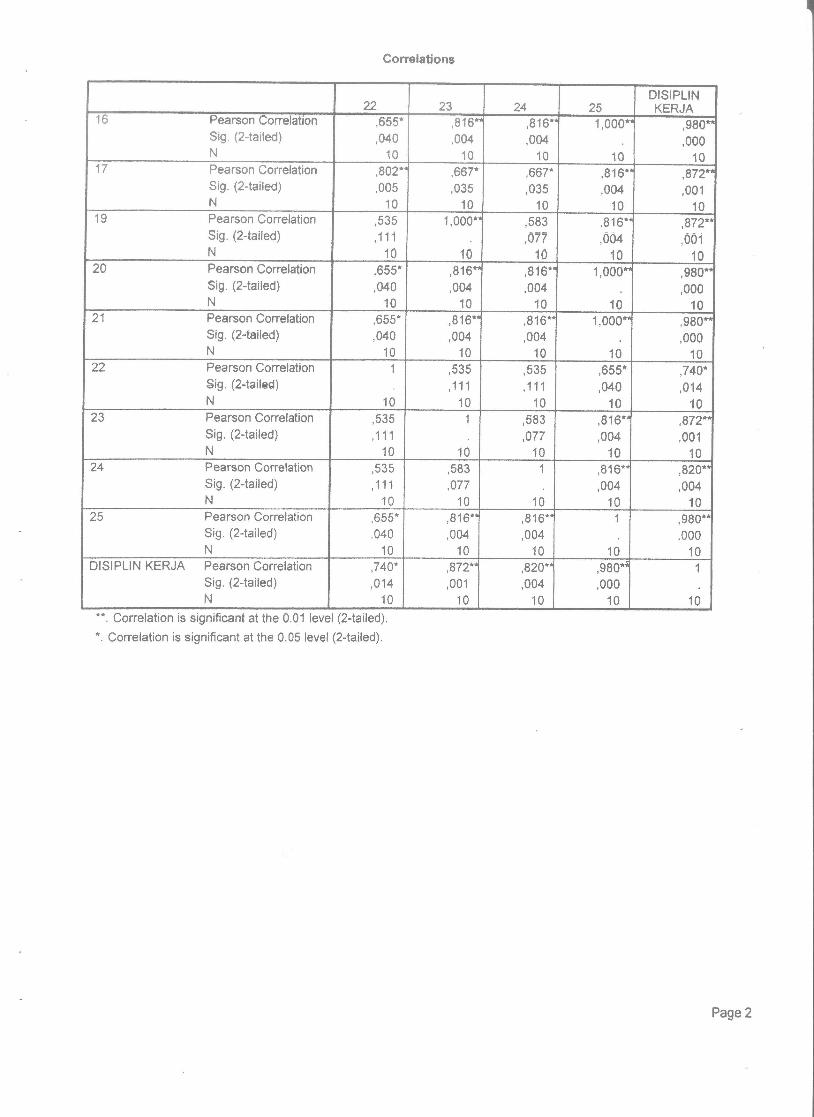
Tahap 2
Correlations
16 17 18 19 20 21 22 23 24 25 DISIPLIN K KET
16 Pearson Correlation 1.000 0.816 0.500 0.816 1.000 1.000 0.655 0.816 0.816 1.000 0.972
Sig. (2-tailed) . 0.004 0.141 0.004 . . 0.040 0.004 0.004 . 0.000
N 10 10 10 10 10 10 10 10 10 10 10
17 Pearson Correlation 0.816 1.000 0.612 0.667 0.816 0.816 0.802 0.667 0.667 0.816 0.880
Sig. (2-tailed) 0.004 . 0.060 0.035 0.004 0.004 0.005 0.035 0.035 0.004 0.001
N 10 10 10 10 10 10 10 10 10 10 10
18 Pearson Correlation 0.500 0.612 1.000 0.408 0.500 0.500 0.764 0.408 0.408 0.500 0.628 Gugur
Sig. (2-tailed) 0.141 0.060 . 0.242 0.141 0.141 0.010 0.242 0.242 0.141 0.052
N 10 10 10 10 10 10 10 10 10 10 10
19 Pearson Correlation 0.816 0.667 0.408 1.000 0.816 0.816 0.535 1.000 0.583 0.816 0.861
Sig. (2-tailed) 0.004 0.035 0.242 . 0.004 0.004 0.111 . 0.077 0.004 0.001
N 10 10 10 10 10 10 10 10 10 10 10
20 Pearson Correlation 1.000 0.816 0.500 0.816 1.000 1.000 0.655 0.816 0.816 1.000 0.972
Sig. (2-tailed) . 0.004 0.141 0.004 . . 0.040 0.004 0.004 . 0.000
N 10.000 10 10 10 10 10 10 10 10 10 10
21 Pearson Correlation 1.000 0.816 0.500 0.816 1.000 1.000 0.655 0.816 0.816 1.000 0.972
Sig. (2-tailed) . 0.004 0.141 0.004 . . 0.040 0.004 0.004 . 0.000
N 10 10 10 10 10 10 10 10 10 10 10
22 Pearson Correlation 0.655 0.802 0.764 0.535 0.655 0.655 1.000 0.535 0.535 0.655 0.770
Sig. (2-tailed) 0.040 0.005 0.010 0.111 0.040 0.040 . 0.111 0.111 0.040 0.009
N 10 10 10 10 10 10 10 10 10 10 10
23 Pearson Correlation 0.816 0.667 0.408 1.000 0.816 0.816 0.535 1.000 0.583 0.816 0.861
Sig. (2-tailed) 0.004 0.035 0.242 . 0.004 0.004 0.111 . 0.077 0.004 0.001
N 10 10 10 10 10 10 10 10 10 10 10
24 Pearson Correlation 0.816 0.667 0.408 0.583 0.816 0.816 0.535 0.583 1.000 0.816 0.813
Sig. (2-tailed) 0.004 0.035 0.242 0.077 0.004 0.004 0.111 0.077 . 0.004 0.004
N 10 10 10 10 10 10 10 10 10 10 10
25 Pearson Correlation 1.000 0.816 0.500 0.816 1.000 1.000 0.655 0.816 0.816 1.000 0.972
Sig. (2-tailed) . 0.004 0.141 0.004 . . 0.040 0.004 0.004 . 0.000
N 10 10 10 10 10 10 10 10 10 10 10
DISIPLIN K Pearson Correlation 0.972 0.880 0.628 0.861 0.972 0.972 0.770 0.861 0.813 0.972 1.000
Sig. (2-tailed) 0.000 0.001 0.052 0.001 0.000 0.000 0.009 0.001 0.004 0.000 .
N 10 10 10 10 10 10 10 10 10 10 10
** Correlation is significant at the 0.01 level (2-tailed).
* Correlation is significant at the 0.05 level (2-tailed).

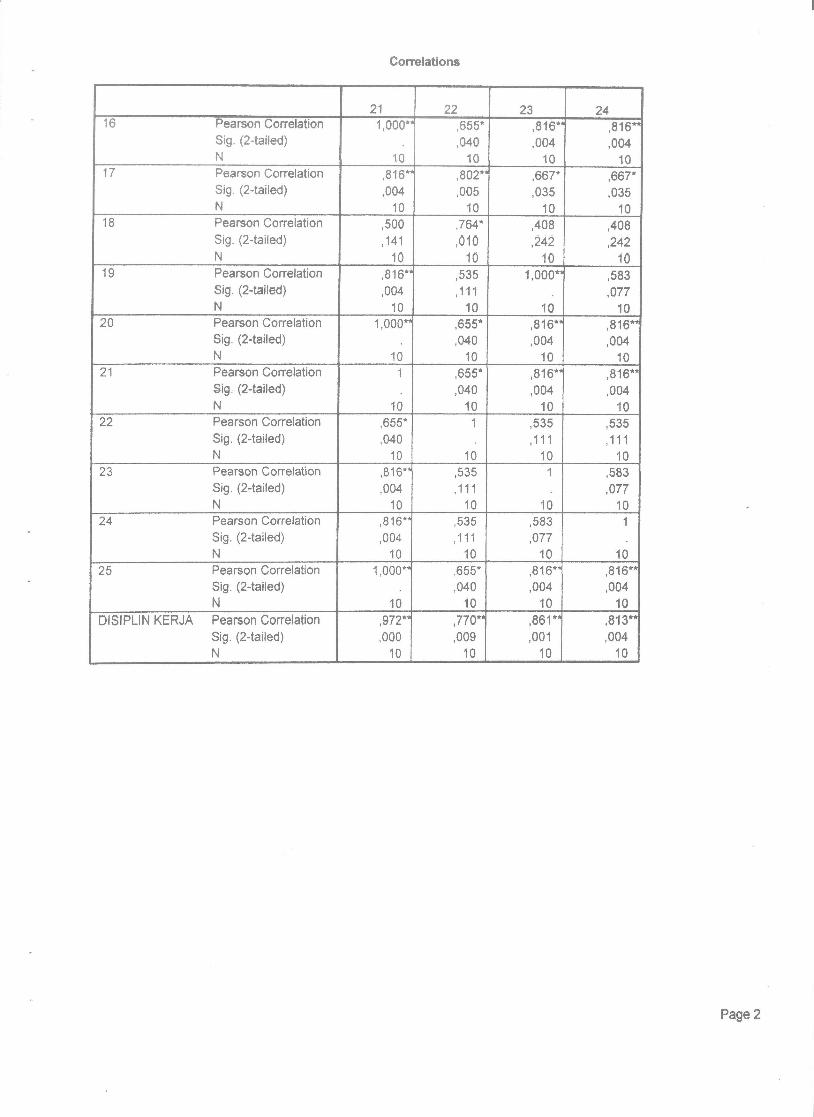
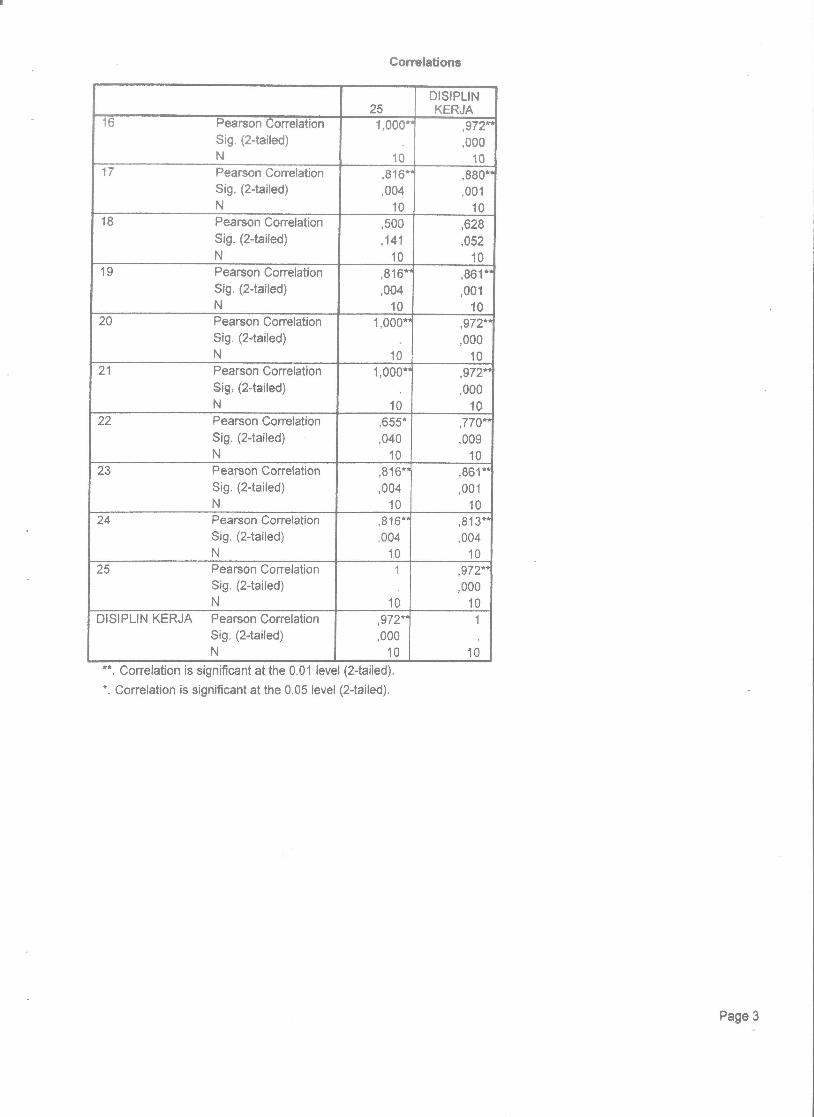
Tahap 3
Correlations
16 17 19 20 21 22 23 24 25 DISIPLIN K KET
16 Pearson Correlation 1 0.816 0.816 1.000 1.000 0.655 0.816 0.816 1.000 0.980
Sig. (2-tailed) . 0.004 0.004 . . 0.040 0.004 0.004 . 0.000
N 10 10 10 10 10 10 10 10 10 10
17 Pearson Correlation 0.816 1.000 0.667 0.816 0.816 0.802 0.667 0.667 0.816 0.872
Sig. (2-tailed) 0.004 . 0.035 0.004 0.004 0.005 0.035 0.035 0.004 0.001
N 10 10 10 10 10 10 10 10 10 10
19 Pearson Correlation 0.816 0.667 1.000 0.816 0.816 0.535 1.000 0.583 0.816 0.872
Sig. (2-tailed) 0.004 0.035 . 0.004 0.004 0.111 . 0.077 0.004 0.001
N 10 10 10 10 10 10 10 10 10 10
20 Pearson Correlation 1.000 0.816 0.816 1.000 1.000 0.655 0.816 0.816 1.000 0.980
Sig. (2-tailed) . 0.004 0.004 . . 0.040 0.004 0.004 . 0.000
N 10 10 10 10 10 10 10 10 10 10
21 Pearson Correlation 1.000 0.816 0.816 1.000 1.000 0.655 0.816 0.816 1.000 0.980
Sig. (2-tailed) . 0.004 0.004 . . 0.040 0.004 0.004 . 0.000
N 10 10 10 10 10 10 10 10 10 10
22 Pearson Correlation 0.655 0.802 0.535 0.655 0.655 1.000 0.535 0.535 0.655 0.740
Sig. (2-tailed) 0.040 0.005 0.111 0.040 0.040 . 0.111 0.111 0.040 0.014
N 10 10 10 10 10 10 10 10 10 10
23 Pearson Correlation 0.816 0.667 1.000 0.816 0.816 0.535 1.000 0.583 0.816 0.872
Sig. (2-tailed) 0.004 0.035 . 0.004 0.004 0.111 . 0.077 0.004 0.001
N 10 10 10 10 10 10 10 10 10 10
24 Pearson Correlation 0.816 0.667 0.583 0.816 0.816 0.535 0.583 1.000 0.816 0.820
Sig. (2-tailed) 0.004 0.035 0.077 0.004 0.004 0.111 0.077 . 0.004 0.004
N 10 10 10 10 10 10 10 10 10 10
25 Pearson Correlation 1.000 0.816 0.816 1.000 1.000 0.655 0.816 0.816 1.000 0.980
Sig. (2-tailed) . 0.004 0.004 . . 0.040 0.004 0.004 . 0.000
N 10 10 10 10 10 10 10 10 10 10
DISIPLIN KERJA Pearson Correlation 0.980 0.872 0.872 0.980 0.980 0.740 0.872 0.820 0.980 1.000
Sig. (2-tailed) 0.000 0.001 0.001 0.000 0.000 0.014 0.001 0.004 0.000 .
N 10 10 10 10 10 10 10 10 10 10
** Correlation is significant at the 0.01 level (2-tailed).
* Correlation is significant at the 0.05 level (2-tailed).
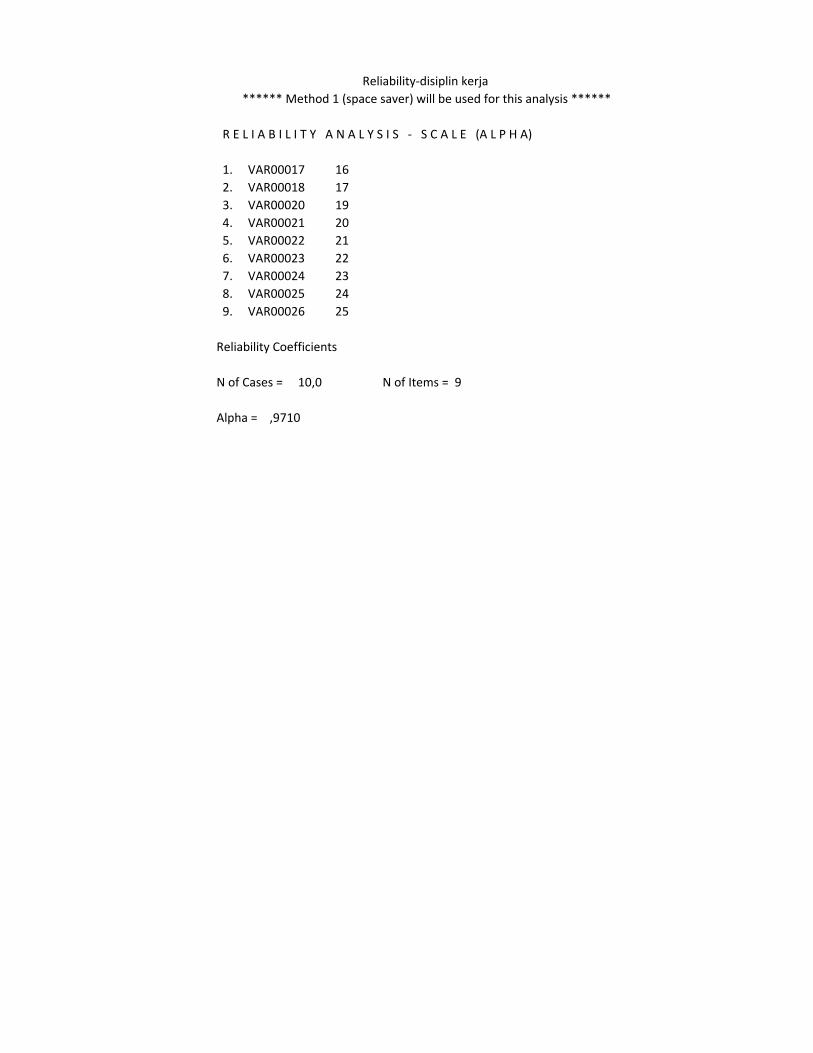
R E L I A B I L I T Y A N A L Y S I S - S C A L E (A L P H A)
1. VAR00017 16
2. VAR00018 17
3. VAR00020 19
4. VAR00021 20
5. VAR00022 21
6. VAR00023 22
7. VAR00024 23
8. VAR00025 24
9. VAR00026 25
Reliability Coefficients
N of Cases = 10,0 N of Items = 9
Alpha = ,9710
Reliability-disiplin kerja
****** Method 1 (space saver) will be used for this analysis ******
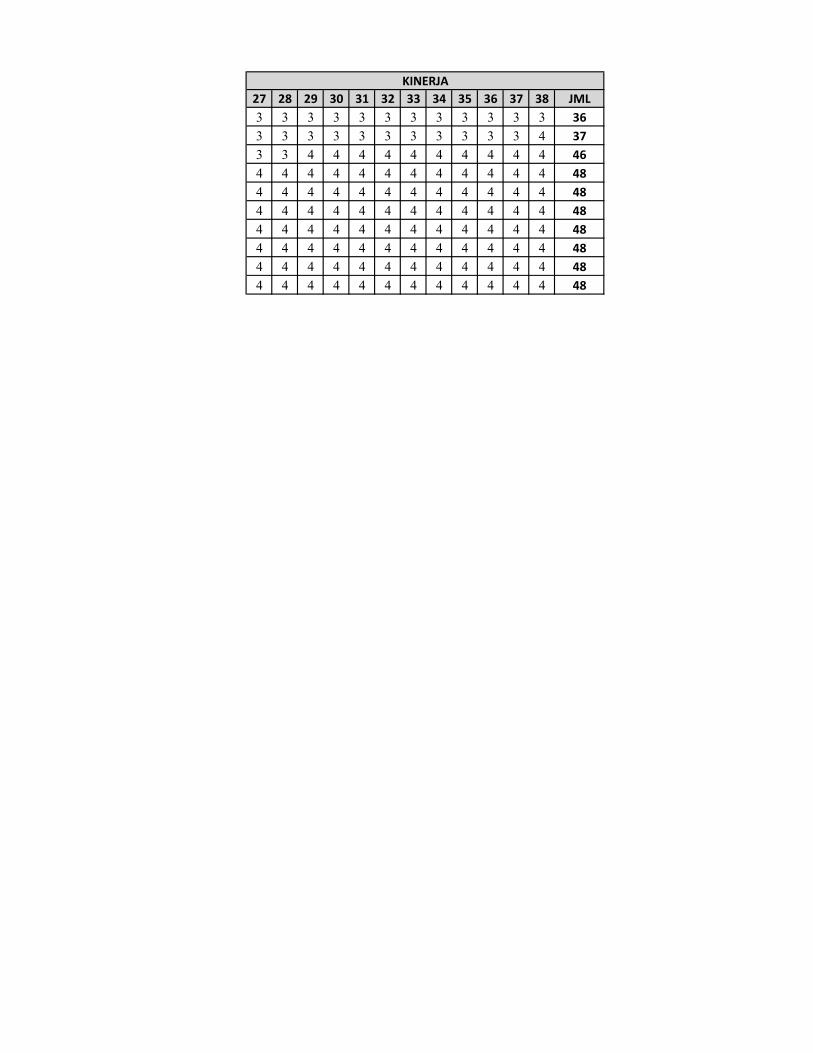
27 28 29 30 31 32 33 34 35 36 37 38 JML
3 3 3 3 3 3 3 3 3 3 3 3 36
3 3 3 3 3 3 3 3 3 3 3 4 37
3 3 4 4 4 4 4 4 4 4 4 4 46
4 4 4 4 4 4 4 4 4 4 4 4 48
4 4 4 4 4 4 4 4 4 4 4 4 48
4 4 4 4 4 4 4 4 4 4 4 4 48
4 4 4 4 4 4 4 4 4 4 4 4 48
4 4 4 4 4 4 4 4 4 4 4 4 48
4 4 4 4 4 4 4 4 4 4 4 4 48
4 4 4 4 4 4 4 4 4 4 4 4 48
KINERJA
Corrslations
27 28 29 1n 31zt Pearson uorTetatton
Sig. (2-tailed)N
1
1 0
'1,000'
1 0
,7U',010
10
,7U',010
10
,7U',, 010
1028 Pearson Conelation
Sig. (2{ailed)N
1 ,000'
1 0
1
1 0
,7U',, 010
10
,764', 0 1 0
1 0
,7U', 010
1029 Pearson Conelation
Sig. (2{ailed)N
,764',, 0 1 0
1 0
,7U', 0 1 0
1 0
1
1 0
1,000
1 0
I 000*
1030 Pearson Conelation
Sig. (2-tailed)N
,764',,010
10
,7U',010
10
I ,000'
10
1
1 0
1,000
1 031 Pearson Conelation
Sig. (2-tailed)N
,7U',, 010
10
,7U',010
10
1,000'
1 0
1,000*
1 0
1
1032 Pearson Conelation
Sig. (2-tailed)N
,764',010
10
,764',010
{ nI U
1 000*'
10
1,000.
10
1,000.
1033 Pearson Conelation
Sig. (2-tailed)N
,7U*,010
10
,764',, 0 1 0
1 0
1,000.
10
1,000''
10
1,000"
1034 Pearson Conelation
Sig. (2-tailed)N
,7&',010
10
,7U',0 ' t0
10
1,000'
10
1,000.
10
1,000r
1 035 Pearson Conelation
Sig. (2-tailed)N
,764', 0 1 0
1 0
,764',
1 0
1,000
1 0
1,000*
1 0
I , 000*
1036 Pearson Conelation
Sig. (2-tailed)N
,764",010
1 0
,764',,010
1 0
1,000'
10
1,000
1 0
1 ,000"
1 037 Pearson Conelation
Sig. (2-tailed)N
,764',, 0 1 0
1 0
,7U',010
10
1I , 000*
1 0
1,000'
10
1,000*
1038 Pearson Conelation
Sig. (2-tailed)N
5no
, 1 3 31 0
,509t ? ?
1 0
,667",035
10
,667',035
1 0
,667',035
1 0KINERJA PearsonConelation
Sig. (2-tailed)N
,840*,002
10
,840',002
10
,990*,000
10
,990.,000
10
,990",000
10
Page 1

T
Conelations
32 33 34 35 362l Pearson Corelafion
Sig. (2{ailed)N
,7U',, 010
10
,7U',010
10
,7U',010
10
,7U',010
10
,7U',, 010
1028 Pearson Conelation
Sig. (2{ailed)N
,7U',010
10
,764', 0 1 0
1 0
,764", 0 1 0
1 0
,7U',, 010
10
,7U',010
1029 Pearson Conelation
Sig. (2{ailed)N
1,000'
10
1,000'
1 0
1,000*
1 0
000't ,
10
1 ,000*
1030 Pearson Conelation
Sig. (2-tailed)N
1,000"
10
1,000*
1 0
t r 000'
1o
1,000'
10
1,000.
1 031 Pearson Conelation
Sig. (2-tailed)N
1 ,000"
10
,t 000*
10
1 ,000*
10
1,000*
t0
1,000*
' t032 Pearson Conelation
Sig. (2-tailed)N
,|
1o
1,000"'
1 0
1,000*
10
1,000*
10
1,000*
1033 Pearson Conelation
Sig. (2-tailed)N
1,000"
1 0
1
1 0
1,000*
1 0
1,000'
1 0
1 ,000*
1 034 Pearson Conelation
Sig. (2-tailed)N
000*
10
1 , 1 ,000*'
10
1
1 0
1,000.
10
1,000*
1035 Pearson Conelation
Sig. (2{ailed)N
1,000*
10
1,000*
10
1,000
1 0
1
10
1 000*
1036 Pearson Conelation
Sig. (2-tailed)N
1,000'
1 0
1,000*
't0
,000''
1 0
1,000*
10
1
't0
37 Pearson ConelationSig. (2-tailed)N
1,000"
10
1,000"
10
1,000*
10
1,000''
10
1,000*
1038 Pearson Conelation
Sig. (2-tailed)N
,667',035
10
,667',035
10
,667",035
10
,667.,035
10
,667',035
10KINERJA PearsonConelation
Sig. (2-tailed)N
,990.,,000
10,000
10
990* ,990*,000
10
,990*,000
't0
,990*,000
10
Page2

Conelations
37 38 KINERJAzt Hearson uorTelalon
Sig. (2-tailed)N
,7U',, 010
10
,509, 1 3 3
1 0
,E40'',002
1 028 Pearson Conelation
Sig. (2{ailed)N
,7U',010
10
,509,t ??
1 0
,840*,002
1029 Pearson Conelation
Sig. (2-tailed)N
1,000
1 0
,667*,035
10
,990",000
1030 Pearson Conelation
Sig. (2-tailed)N
1,000'
' t0
,667*,035
1 0
,990*',000
103'l Pearson Conelation
Sig. (2-tailed)N
1 ,000*
10
,667*,035
10
,990*,000
1032 Pearson Conelation
Sig. (2-tailed)N
I ,000*'
10
,667.,035
10
,990',000
1033 Pearson Conelation
Sig. (2-tailed)N
1,000'
10
,667',035
10
,990*,000
1 n
34 Pearson ConelationSig. (2-tailed)N
1,000'
10
,667',035
10
990*,000
1035 Pearson Conelation
Sig. (2{ailed)" N
1 ,000*
1 0
,667',035
1 0
990*',000
1 036 Pearson Conelation
Sig. (2-tailed)N
1,000
1 0
ARTI
,0351 0
,990',000
1 037 Pearson Correlation
Sig. (2{ailed)N
aI
1o
,667.,035
1 0
990*,000
1 038 Pearson Conelation
Sig. (2-tailed)N
,667',035
1 0
1
I U
,697*,025
10KINERJA PearsonConelation
Sig. (2-tailed)N
,990*,000
10
,6e7',025
I U
I
10-. Conelation is significant at the 0.01 level (2-tailed).'. Conelation is significant at the 0.05 level (2-tailed).
Page 3
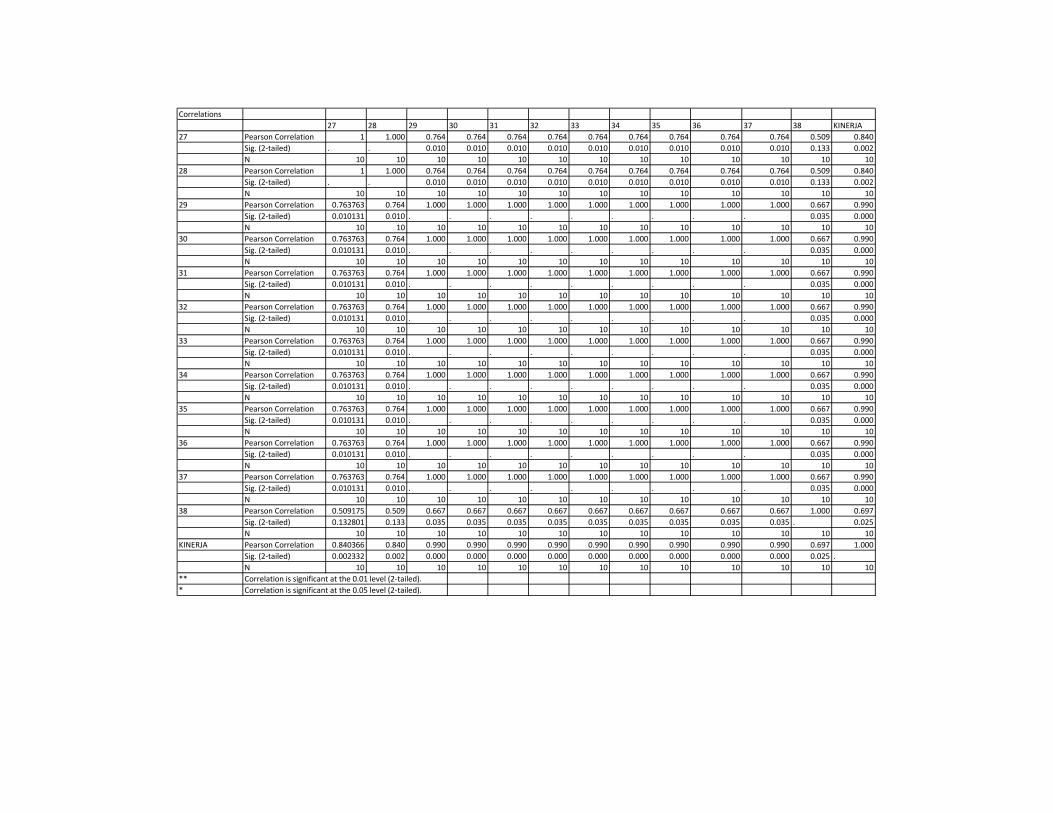
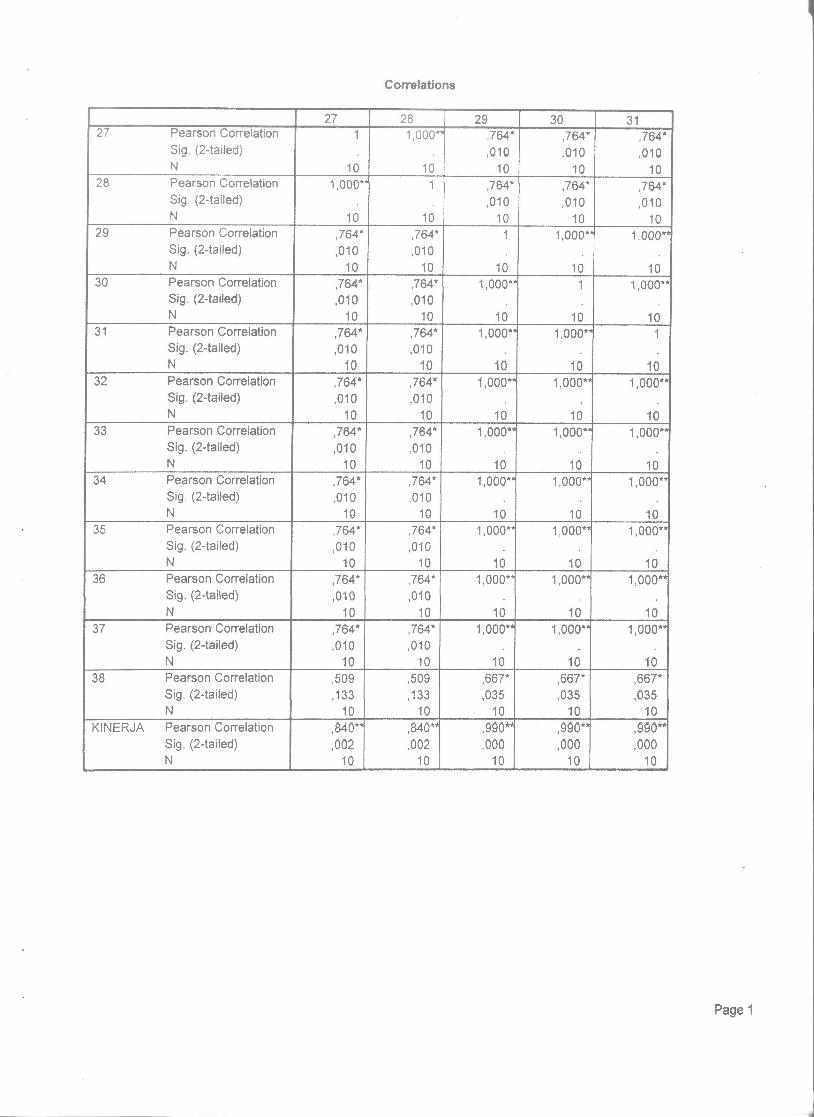
Correlations
27 28 29 30 31 32 33 34 35 36 37 38 KINERJA
27 Pearson Correlation 1 1.000 0.764 0.764 0.764 0.764 0.764 0.764 0.764 0.764 0.764 0.509 0.840
Sig. (2-tailed) . . 0.010 0.010 0.010 0.010 0.010 0.010 0.010 0.010 0.010 0.133 0.002
N 10 10 10 10 10 10 10 10 10 10 10 10 10
28 Pearson Correlation 1 1.000 0.764 0.764 0.764 0.764 0.764 0.764 0.764 0.764 0.764 0.509 0.840
Sig. (2-tailed) . . 0.010 0.010 0.010 0.010 0.010 0.010 0.010 0.010 0.010 0.133 0.002
N 10 10 10 10 10 10 10 10 10 10 10 10 10
29 Pearson Correlation 0.763763 0.764 1.000 1.000 1.000 1.000 1.000 1.000 1.000 1.000 1.000 0.667 0.990
Sig. (2-tailed) 0.010131 0.010 . . . . . . . . . 0.035 0.000
N 10 10 10 10 10 10 10 10 10 10 10 10 10
30 Pearson Correlation 0.763763 0.764 1.000 1.000 1.000 1.000 1.000 1.000 1.000 1.000 1.000 0.667 0.990
Sig. (2-tailed) 0.010131 0.010 . . . . . . . . . 0.035 0.000
N 10 10 10 10 10 10 10 10 10 10 10 10 10
31 Pearson Correlation 0.763763 0.764 1.000 1.000 1.000 1.000 1.000 1.000 1.000 1.000 1.000 0.667 0.990
Sig. (2-tailed) 0.010131 0.010 . . . . . . . . . 0.035 0.000
N 10 10 10 10 10 10 10 10 10 10 10 10 10
32 Pearson Correlation 0.763763 0.764 1.000 1.000 1.000 1.000 1.000 1.000 1.000 1.000 1.000 0.667 0.990
Sig. (2-tailed) 0.010131 0.010 . . . . . . . . . 0.035 0.000
N 10 10 10 10 10 10 10 10 10 10 10 10 10
33 Pearson Correlation 0.763763 0.764 1.000 1.000 1.000 1.000 1.000 1.000 1.000 1.000 1.000 0.667 0.990
Sig. (2-tailed) 0.010131 0.010 . . . . . . . . . 0.035 0.000
N 10 10 10 10 10 10 10 10 10 10 10 10 10
34 Pearson Correlation 0.763763 0.764 1.000 1.000 1.000 1.000 1.000 1.000 1.000 1.000 1.000 0.667 0.990
Sig. (2-tailed) 0.010131 0.010 . . . . . . . . . 0.035 0.000
N 10 10 10 10 10 10 10 10 10 10 10 10 10
35 Pearson Correlation 0.763763 0.764 1.000 1.000 1.000 1.000 1.000 1.000 1.000 1.000 1.000 0.667 0.990
Sig. (2-tailed) 0.010131 0.010 . . . . . . . . . 0.035 0.000
N 10 10 10 10 10 10 10 10 10 10 10 10 10
36 Pearson Correlation 0.763763 0.764 1.000 1.000 1.000 1.000 1.000 1.000 1.000 1.000 1.000 0.667 0.990
Sig. (2-tailed) 0.010131 0.010 . . . . . . . . . 0.035 0.000
N 10 10 10 10 10 10 10 10 10 10 10 10 10
37 Pearson Correlation 0.763763 0.764 1.000 1.000 1.000 1.000 1.000 1.000 1.000 1.000 1.000 0.667 0.990
Sig. (2-tailed) 0.010131 0.010 . . . . . . . . . 0.035 0.000
N 10 10 10 10 10 10 10 10 10 10 10 10 10
38 Pearson Correlation 0.509175 0.509 0.667 0.667 0.667 0.667 0.667 0.667 0.667 0.667 0.667 1.000 0.697
Sig. (2-tailed) 0.132801 0.133 0.035 0.035 0.035 0.035 0.035 0.035 0.035 0.035 0.035 . 0.025
N 10 10 10 10 10 10 10 10 10 10 10 10 10
KINERJA Pearson Correlation 0.840366 0.840 0.990 0.990 0.990 0.990 0.990 0.990 0.990 0.990 0.990 0.697 1.000
Sig. (2-tailed) 0.002332 0.002 0.000 0.000 0.000 0.000 0.000 0.000 0.000 0.000 0.000 0.025 .
N 10 10 10 10 10 10 10 10 10 10 10 10 10
** Correlation is significant at the 0.01 level (2-tailed).
* Correlation is significant at the 0.05 level (2-tailed).

R E L I A B I L I T Y A N A L Y S I S - S C A L E (A L P H A)
1. VAR00029 27
2. VAR00030 28
3. VAR00031 29
4. VAR00032 30
5. VAR00033 31
6. VAR00034 32
7. VAR00035 33
8. VAR00036 34
9. VAR00037 35
10. VAR00038 36
11. VAR00039 37
12. VAR00040 38
Reliability Coefficients
N of Cases = 10,0 N of Items = 12
Alpha = ,9879
Reliability-kinerja
****** Method 1 (space saver) will be used for this analysis ******
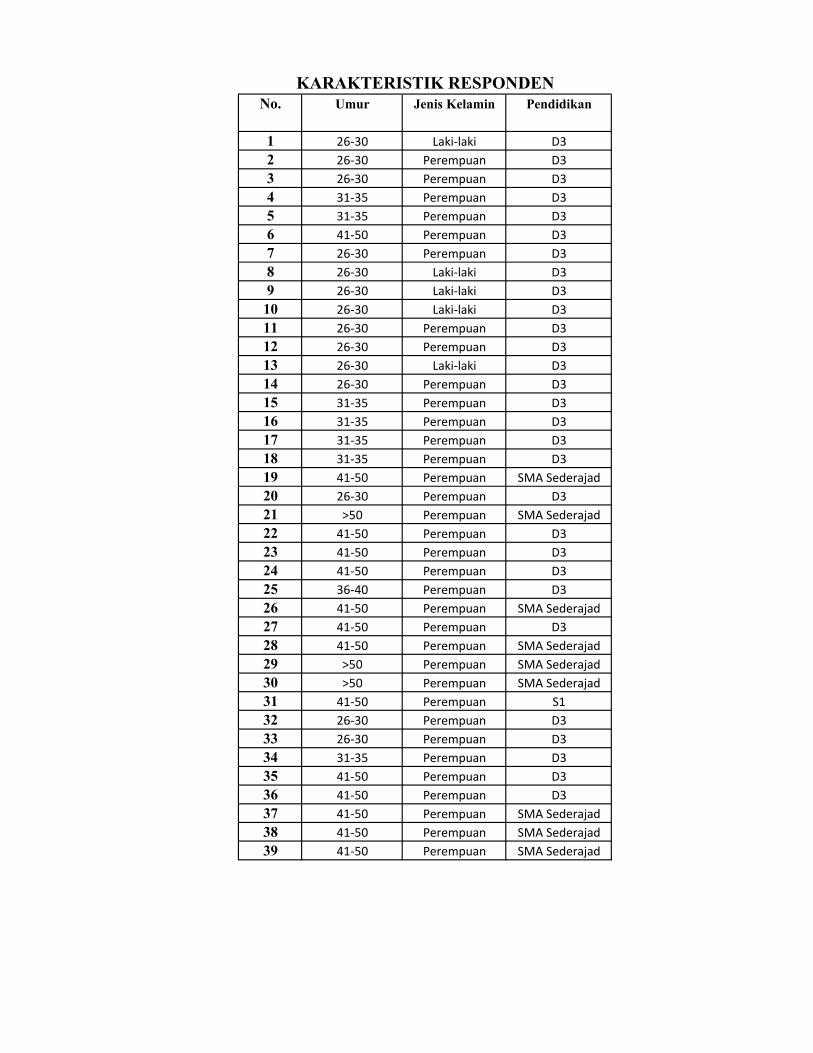
No. Umur Jenis Kelamin Pendidikan
1 26-30 Laki-laki D3
2 26-30 Perempuan D3
3 26-30 Perempuan D3
4 31-35 Perempuan D3
5 31-35 Perempuan D3
6 41-50 Perempuan D3
7 26-30 Perempuan D3
8 26-30 Laki-laki D3
9 26-30 Laki-laki D3
10 26-30 Laki-laki D3
11 26-30 Perempuan D3
12 26-30 Perempuan D3
13 26-30 Laki-laki D3
14 26-30 Perempuan D3
15 31-35 Perempuan D3
16 31-35 Perempuan D3
17 31-35 Perempuan D3
18 31-35 Perempuan D3
19 41-50 Perempuan SMA Sederajad
20 26-30 Perempuan D3
21 >50 Perempuan SMA Sederajad
22 41-50 Perempuan D3
23 41-50 Perempuan D3
24 41-50 Perempuan D3
25 36-40 Perempuan D3
26 41-50 Perempuan SMA Sederajad
27 41-50 Perempuan D3
28 41-50 Perempuan SMA Sederajad
29 >50 Perempuan SMA Sederajad
30 >50 Perempuan SMA Sederajad
31 41-50 Perempuan S1
32 26-30 Perempuan D3
33 26-30 Perempuan D3
34 31-35 Perempuan D3
35 41-50 Perempuan D3
36 41-50 Perempuan D3
37 41-50 Perempuan SMA Sederajad
38 41-50 Perempuan SMA Sederajad
39 41-50 Perempuan SMA Sederajad
KARAKTERISTIK RESPONDEN
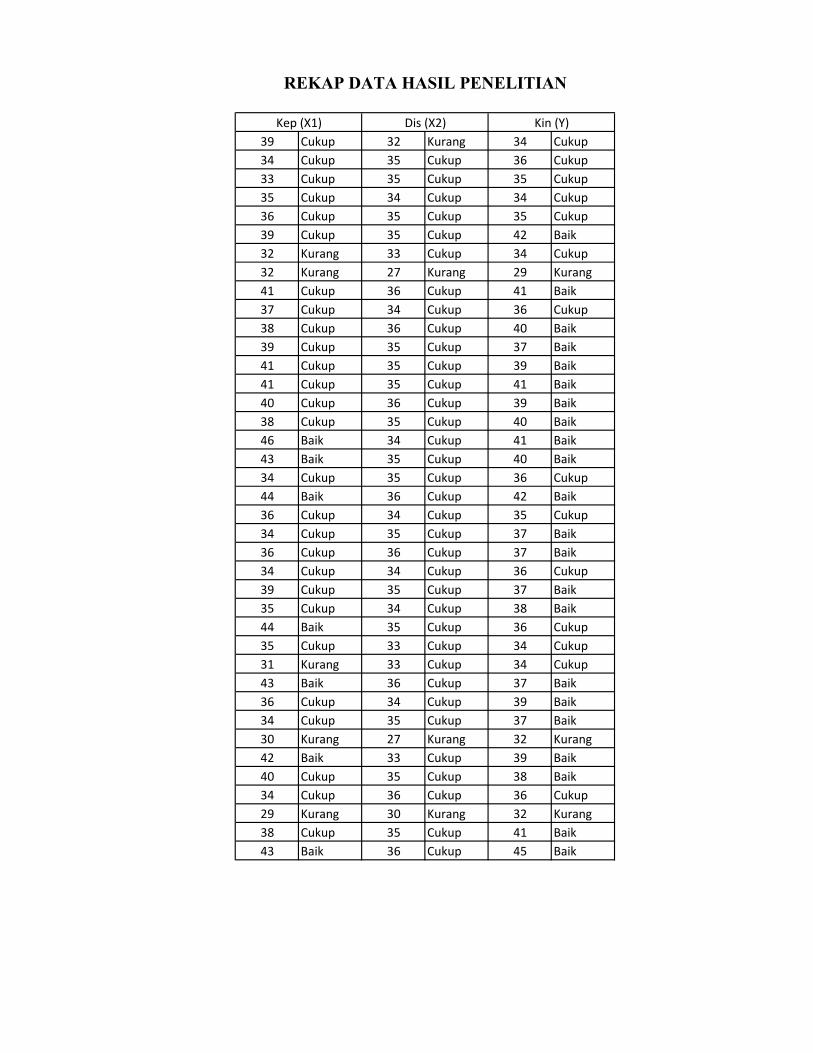
39 Cukup 32 Kurang 34 Cukup
34 Cukup 35 Cukup 36 Cukup
33 Cukup 35 Cukup 35 Cukup
35 Cukup 34 Cukup 34 Cukup
36 Cukup 35 Cukup 35 Cukup
39 Cukup 35 Cukup 42 Baik
32 Kurang 33 Cukup 34 Cukup
32 Kurang 27 Kurang 29 Kurang
41 Cukup 36 Cukup 41 Baik
37 Cukup 34 Cukup 36 Cukup
38 Cukup 36 Cukup 40 Baik
39 Cukup 35 Cukup 37 Baik
41 Cukup 35 Cukup 39 Baik
41 Cukup 35 Cukup 41 Baik
40 Cukup 36 Cukup 39 Baik
38 Cukup 35 Cukup 40 Baik
46 Baik 34 Cukup 41 Baik
43 Baik 35 Cukup 40 Baik
34 Cukup 35 Cukup 36 Cukup
44 Baik 36 Cukup 42 Baik
36 Cukup 34 Cukup 35 Cukup
34 Cukup 35 Cukup 37 Baik
36 Cukup 36 Cukup 37 Baik
34 Cukup 34 Cukup 36 Cukup
39 Cukup 35 Cukup 37 Baik
35 Cukup 34 Cukup 38 Baik
44 Baik 35 Cukup 36 Cukup
35 Cukup 33 Cukup 34 Cukup
31 Kurang 33 Cukup 34 Cukup
43 Baik 36 Cukup 37 Baik
36 Cukup 34 Cukup 39 Baik
34 Cukup 35 Cukup 37 Baik
30 Kurang 27 Kurang 32 Kurang
42 Baik 33 Cukup 39 Baik
40 Cukup 35 Cukup 38 Baik
34 Cukup 36 Cukup 36 Cukup
29 Kurang 30 Kurang 32 Kurang
38 Cukup 35 Cukup 41 Baik
43 Baik 36 Cukup 45 Baik
Dis (X2) Kin (Y)Kep (X1)
REKAP DATA HASIL PENELITIAN

No.
1 2 5 6 7 8 9 10 11 12 13 14 Total 16 17 19 20 21 22 23 24 25 Total 27 28 29 30 31 32 33 34 35 36 37 38 Total
1 3 3 3 3 3 3 3 3 4 3 4 4 39 4 4 4 4 3 3 3 4 3 32 2 2 3 3 3 3 3 3 3 3 3 3 34
2 3 4 3 2 3 3 2 3 2 3 3 3 34 4 3 4 4 4 4 4 4 4 35 3 3 3 3 3 3 3 3 3 3 2 4 36
3 2 2 2 3 3 3 3 3 3 3 3 3 33 4 4 4 3 4 4 4 4 4 35 3 3 3 3 3 2 3 3 3 3 3 3 35
4 3 3 3 2 2 2 3 3 3 4 3 4 35 4 4 3 4 4 3 4 4 4 34 2 3 3 3 3 2 3 3 3 3 3 3 34
5 3 3 3 3 3 3 3 3 3 3 3 3 36 4 4 3 4 4 4 4 4 4 35 2 2 3 3 3 3 4 3 3 3 3 3 35
6 3 3 2 2 2 4 4 4 3 4 4 4 39 4 4 4 4 3 4 4 4 4 35 3 3 4 4 3 3 3 3 4 4 4 4 42
7 3 3 1 2 2 3 2 3 3 3 4 3 32 3 3 4 3 4 4 4 4 4 33 2 2 2 3 2 3 2 4 3 4 3 4 34
8 3 4 3 3 3 2 3 3 2 2 2 2 32 3 3 3 3 3 3 3 3 3 27 3 2 2 2 3 2 3 2 3 2 2 3 29
9 4 4 4 3 4 3 4 3 3 3 3 3 41 4 4 4 4 4 4 4 4 4 36 4 4 3 4 4 3 3 3 4 3 3 3 41
10 2 2 3 4 3 3 4 3 3 4 3 3 37 4 3 4 4 3 4 4 4 4 34 3 3 3 3 3 3 3 3 3 3 3 3 36
11 2 2 2 3 4 4 3 4 2 4 4 4 38 4 4 4 4 4 4 4 4 4 36 2 3 3 3 3 3 3 4 4 4 4 4 40
12 2 3 2 2 4 3 3 4 4 4 4 4 39 4 4 4 4 3 4 4 4 4 35 2 3 3 3 4 3 3 3 4 3 3 3 37
13 3 4 4 4 3 3 3 4 3 3 3 4 41 4 4 4 4 4 3 4 4 4 35 3 3 4 3 3 3 4 3 3 4 3 3 39
14 4 4 2 4 3 4 3 3 3 3 4 4 41 4 4 4 4 3 4 4 4 4 35 3 3 3 4 3 4 3 3 4 3 4 4 41
15 3 4 4 3 3 3 3 3 4 3 3 4 40 4 4 4 4 4 4 4 4 4 36 3 3 3 4 3 3 3 3 4 3 3 4 39
16 2 2 2 2 3 3 4 4 4 4 4 4 38 4 4 4 4 3 4 4 4 4 35 3 3 4 3 4 3 3 3 3 3 4 4 40
17 3 3 4 4 4 4 4 4 4 4 4 4 46 4 4 4 3 3 4 4 4 4 34 3 3 4 4 3 3 4 3 4 3 3 4 41
18 4 4 3 4 3 3 3 3 4 4 4 4 43 4 4 3 4 4 4 4 4 4 35 3 4 3 3 4 4 3 3 3 3 3 4 40
19 4 4 2 2 2 2 2 3 3 3 4 3 34 4 4 3 4 4 4 4 4 4 35 3 2 3 2 2 4 3 4 4 2 3 4 36
20 4 4 4 4 2 4 4 4 4 4 3 3 44 4 4 4 4 4 4 4 4 4 36 4 3 4 3 3 3 3 4 3 4 4 4 42
21 4 4 4 1 1 1 2 4 4 4 3 4 36 4 4 3 4 3 4 4 4 4 34 2 2 3 2 2 4 4 2 3 3 4 4 35
22 1 1 2 2 4 2 4 4 4 4 3 3 34 4 4 4 4 4 3 4 4 4 35 3 3 3 2 3 3 2 4 2 4 4 4 37
23 4 4 1 4 1 1 3 3 4 4 3 4 36 4 4 4 4 4 4 4 4 4 36 3 3 2 2 3 4 4 3 3 3 3 4 37
24 4 4 1 2 2 2 3 4 3 3 3 3 34 3 4 4 4 3 4 4 4 4 34 3 3 2 2 3 3 4 3 3 3 3 4 36
25 3 3 1 4 3 3 4 4 3 3 4 4 39 4 4 3 4 4 4 4 4 4 35 3 3 3 3 3 3 3 3 3 3 3 4 37
26 3 4 1 1 2 3 3 2 4 4 4 4 35 4 4 4 4 4 3 3 4 4 34 4 4 4 3 3 3 3 2 3 3 3 3 38
27 4 4 4 4 4 4 4 4 2 3 3 4 44 4 3 4 4 4 4 4 4 4 35 3 3 3 3 3 3 3 3 3 3 3 3 36
28 4 1 1 4 2 2 3 3 3 4 4 4 35 4 4 3 4 4 3 3 4 4 33 3 3 2 3 3 3 2 3 3 3 3 3 34
29 2 2 2 4 2 2 2 4 3 3 3 2 31 4 4 3 3 4 4 3 4 4 33 3 3 2 3 3 4 2 2 4 3 2 3 34
30 4 4 4 1 4 4 4 3 3 4 4 4 43 4 4 4 4 4 4 4 4 4 36 3 3 3 3 2 4 3 3 4 3 3 3 37
31 4 2 2 2 4 2 2 3 3 4 4 4 36 4 4 4 3 3 4 4 4 4 34 3 3 3 3 3 4 2 4 4 2 4 4 39
32 2 2 1 1 1 4 4 4 3 4 4 4 34 3 4 4 4 4 4 4 4 4 35 2 3 3 3 3 4 3 2 3 4 3 4 37
33 4 2 2 2 2 2 3 2 2 3 3 3 30 4 3 3 3 3 3 3 2 3 27 2 3 3 2 3 3 3 2 2 3 3 3 32
34 4 4 4 4 3 1 4 4 3 3 4 4 42 3 4 3 4 4 4 4 3 4 33 3 4 3 3 4 3 3 3 3 4 3 3 39
35 3 3 1 3 3 4 4 4 3 4 4 4 40 4 4 4 4 4 3 4 4 4 35 3 3 3 4 2 3 3 3 3 4 4 3 38
36 2 2 2 2 3 4 2 2 3 4 4 4 34 4 4 4 4 4 4 4 4 4 36 3 3 3 3 3 3 2 3 3 3 4 3 36
37 3 3 3 3 1 2 2 2 2 3 2 3 29 4 2 4 4 4 3 3 3 3 30 3 2 3 2 2 2 4 3 2 3 3 3 32
38 1 2 3 4 2 3 3 4 4 4 4 4 38 4 4 4 4 4 4 4 3 4 35 3 3 4 3 4 3 4 3 2 4 4 4 41
39 4 1 4 4 4 4 4 4 3 4 4 3 43 4 4 4 4 4 4 4 4 4 36 3 3 4 4 3 4 4 4 4 4 4 4 45
Mean 37.31 34.21 37.21
ST Dev 4.22 2.10 3.24
DATA TANGGAPAN RESPONDENKepemimpinan (X1) Kinerja (Y)Disiplin Kerja (X2)

NPar Tests
One-Sam ple Kolm ogorov-Sm ir nov Tes t
39 39 39
37,3077 34,2051 37,2051
4,22495 2,10488 3,23777
,109 ,263 ,115
,109 ,197 ,115
-,066 -,263 -,084
,679 1,640 ,718
,746 ,009 ,681
N
Mean
Std. Deviation
Normal Parameters a,b
Absolute
Positive
Negative
Most Extreme
Dif ferences
Kolmogorov-Smirnov Z
Asymp. Sig. (2-tailed)
Kepemim
pinan Disiplin Kinerja
Test dis tribution is Normal.a.
Calculated f rom data.b.
Nonparametric Correlations
Cor relations
1,000 ,480** ,530**
. ,002 ,001
39 39 39
,480** 1,000 ,542**
,002 . ,000
39 39 39
,530** ,542** 1,000
,001 ,000 .
39 39 39
Correlation Coef f ic ient
Sig. (2-tailed)
N
Correlation Coef f ic ient
Sig. (2-tailed)
N
Correlation Coef f ic ient
Sig. (2-tailed)
N
Kepemimpinan
Disiplin
Kinerja
Spearman's rho
Kepemim
pinan Disiplin Kinerja
Correlation is s ignif icant at the 0.01 level (2-tailed).**.
Frequencies
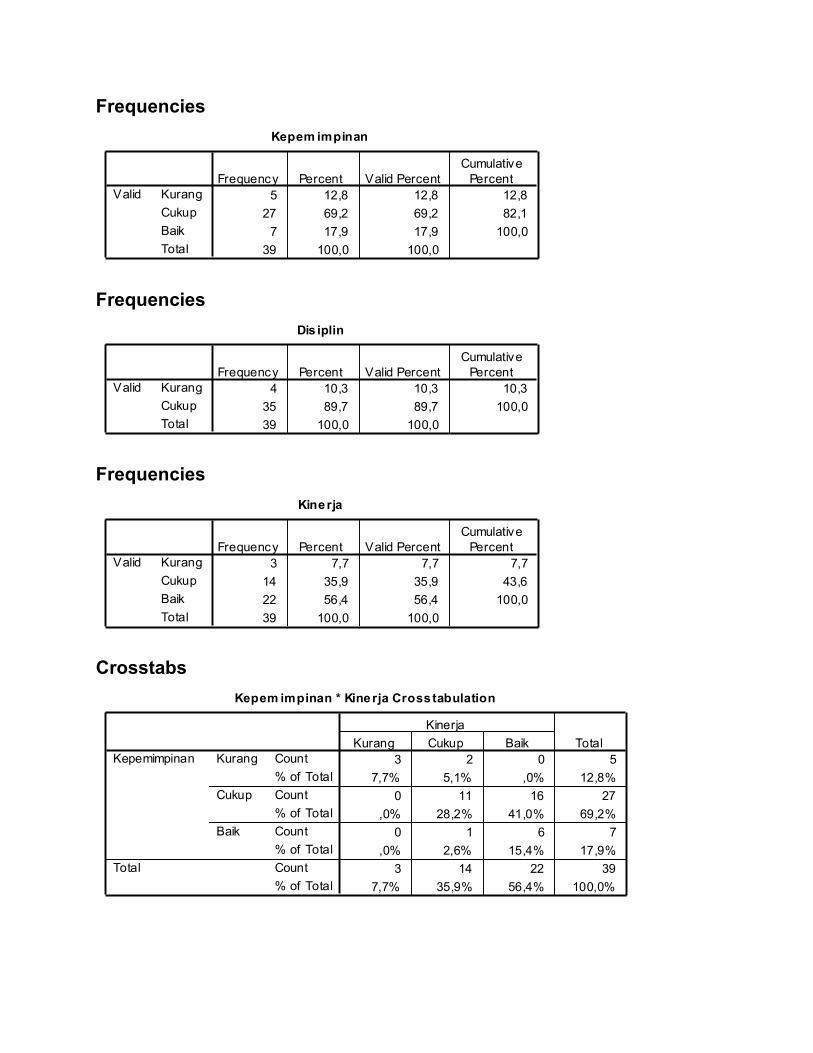
Kepem impinan
5 12,8 12,8 12,8
27 69,2 69,2 82,1
7 17,9 17,9 100,0
39 100,0 100,0
Kurang
Cukup
Baik
Total
Valid
Frequency Percent Valid Percent
Cumulative
Percent
Frequencies
Dis iplin
4 10,3 10,3 10,3
35 89,7 89,7 100,0
39 100,0 100,0
Kurang
Cukup
Total
Valid
Frequency Percent Valid Percent
Cumulative
Percent
Frequencies
Kinerja
3 7,7 7,7 7,7
14 35,9 35,9 43,6
22 56,4 56,4 100,0
39 100,0 100,0
Kurang
Cukup
Baik
Total
Valid
Frequency Percent Valid Percent
Cumulative
Percent
Crosstabs
Kepem impinan * Kinerja Cross tabulation
3 2 0 5
7,7% 5,1% ,0% 12,8%
0 11 16 27
,0% 28,2% 41,0% 69,2%
0 1 6 7
,0% 2,6% 15,4% 17,9%
3 14 22 39
7,7% 35,9% 56,4% 100,0%
Count
% of Total
Count
% of Total
Count
% of Total
Count
% of Total
Kurang
Cukup
Baik
Kepemimpinan
Total
Kurang Cukup Baik
Kinerja
Total
Crosstabs
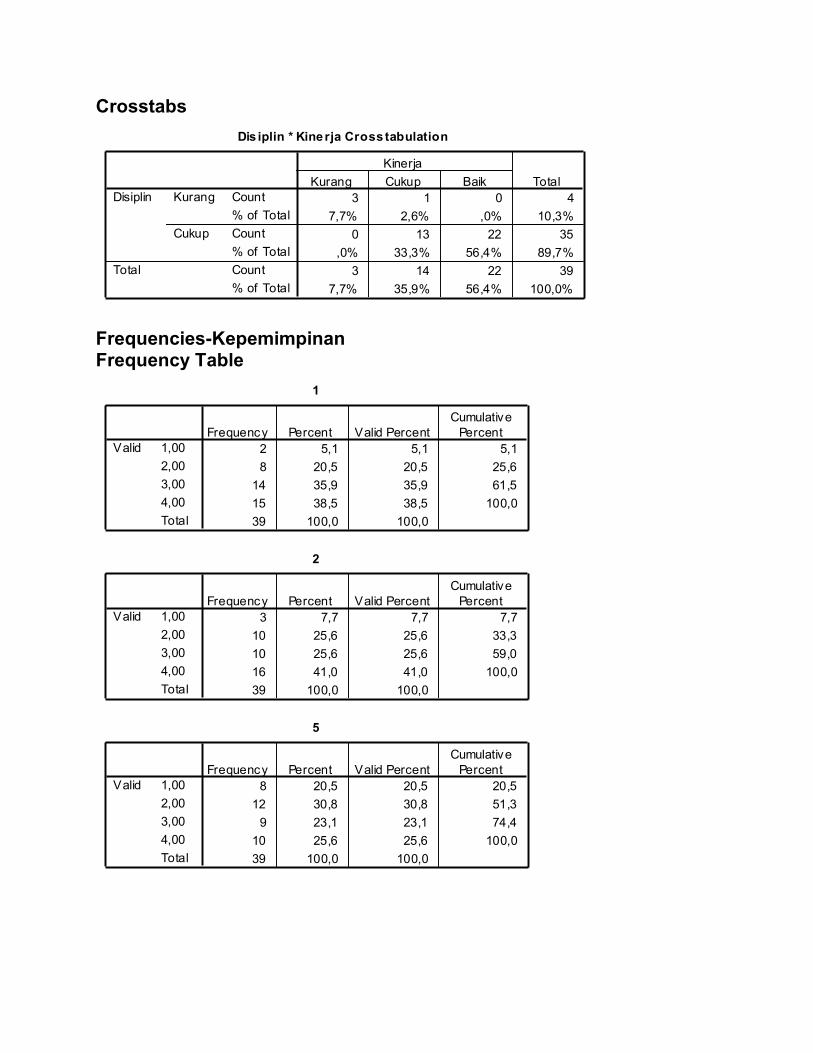
Dis iplin * Kinerja Crosstabulation
3 1 0 4
7,7% 2,6% ,0% 10,3%
0 13 22 35
,0% 33,3% 56,4% 89,7%
3 14 22 39
7,7% 35,9% 56,4% 100,0%
Count
% of Total
Count
% of Total
Count
% of Total
Kurang
Cukup
Disiplin
Total
Kurang Cukup Baik
Kinerja
Total
Frequencies-Kepemimpinan Frequency Table
1
2 5,1 5,1 5,1
8 20,5 20,5 25,6
14 35,9 35,9 61,5
15 38,5 38,5 100,0
39 100,0 100,0
1,00
2,00
3,00
4,00
Total
Valid
Frequency Percent Valid Percent
Cumulative
Percent
2
3 7,7 7,7 7,7
10 25,6 25,6 33,3
10 25,6 25,6 59,0
16 41,0 41,0 100,0
39 100,0 100,0
1,00
2,00
3,00
4,00
Total
Valid
Frequency Percent Valid Percent
Cumulative
Percent
5
8 20,5 20,5 20,5
12 30,8 30,8 51,3
9 23,1 23,1 74,4
10 25,6 25,6 100,0
39 100,0 100,0
1,00
2,00
3,00
4,00
Total
Valid
Frequency Percent Valid Percent
Cumulative
Percent
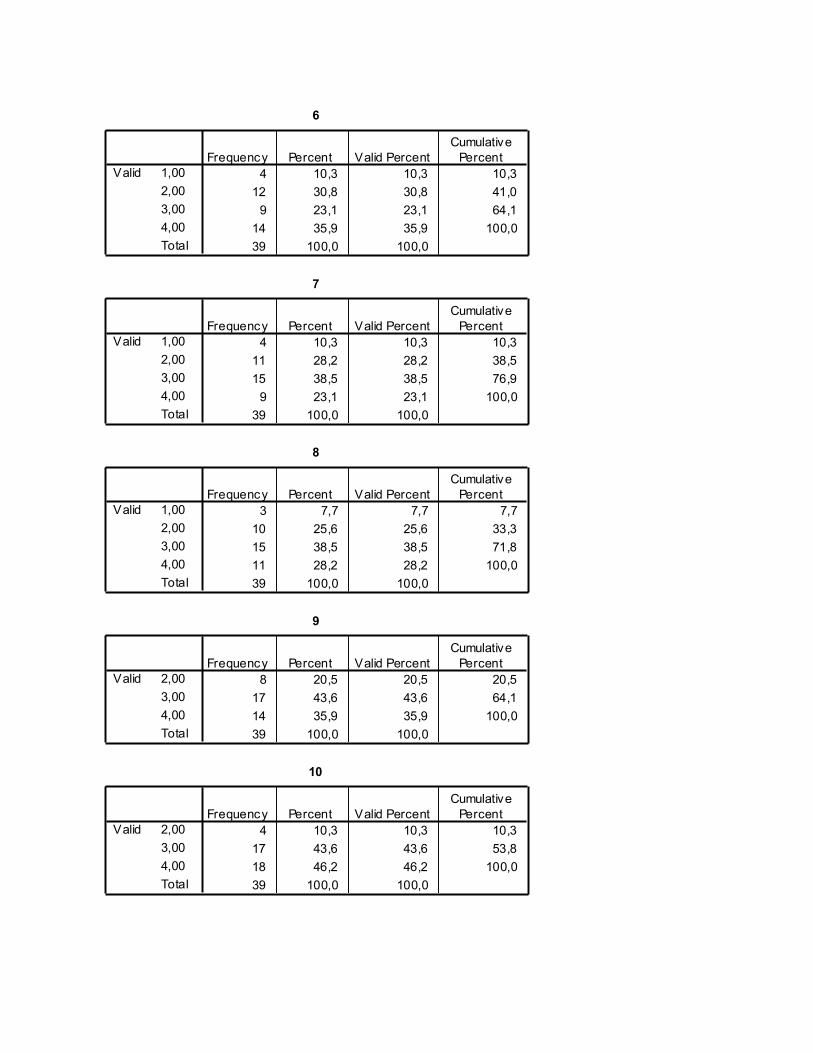
6
4 10,3 10,3 10,3
12 30,8 30,8 41,0
9 23,1 23,1 64,1
14 35,9 35,9 100,0
39 100,0 100,0
1,00
2,00
3,00
4,00
Total
Valid
Frequency Percent Valid Percent
Cumulative
Percent
7
4 10,3 10,3 10,3
11 28,2 28,2 38,5
15 38,5 38,5 76,9
9 23,1 23,1 100,0
39 100,0 100,0
1,00
2,00
3,00
4,00
Total
Valid
Frequency Percent Valid Percent
Cumulative
Percent
8
3 7,7 7,7 7,7
10 25,6 25,6 33,3
15 38,5 38,5 71,8
11 28,2 28,2 100,0
39 100,0 100,0
1,00
2,00
3,00
4,00
Total
Valid
Frequency Percent Valid Percent
Cumulative
Percent
9
8 20,5 20,5 20,5
17 43,6 43,6 64,1
14 35,9 35,9 100,0
39 100,0 100,0
2,00
3,00
4,00
Total
Valid
Frequency Percent Valid Percent
Cumulative
Percent
10
4 10,3 10,3 10,3
17 43,6 43,6 53,8
18 46,2 46,2 100,0
39 100,0 100,0
2,00
3,00
4,00
Total
Valid
Frequency Percent Valid Percent
Cumulative
Percent
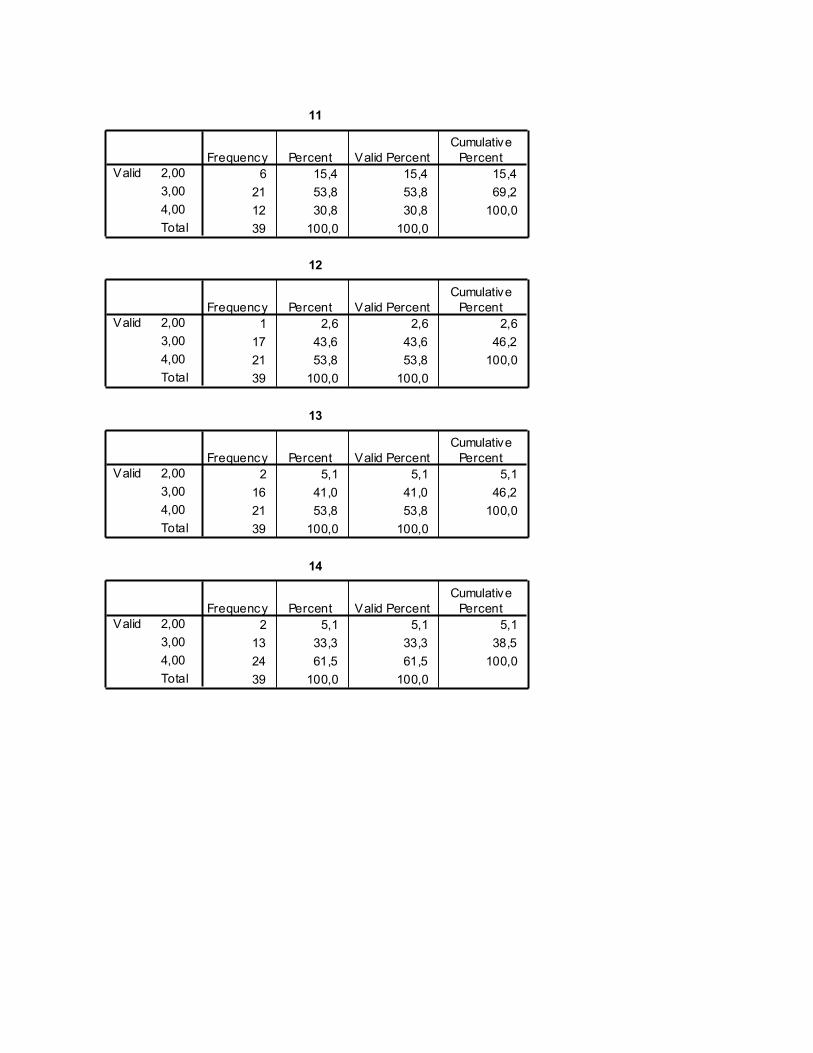
11
6 15,4 15,4 15,4
21 53,8 53,8 69,2
12 30,8 30,8 100,0
39 100,0 100,0
2,00
3,00
4,00
Total
Valid
Frequency Percent Valid Percent
Cumulative
Percent
12
1 2,6 2,6 2,6
17 43,6 43,6 46,2
21 53,8 53,8 100,0
39 100,0 100,0
2,00
3,00
4,00
Total
Valid
Frequency Percent Valid Percent
Cumulative
Percent
13
2 5,1 5,1 5,1
16 41,0 41,0 46,2
21 53,8 53,8 100,0
39 100,0 100,0
2,00
3,00
4,00
Total
Valid
Frequency Percent Valid Percent
Cumulative
Percent
14
2 5,1 5,1 5,1
13 33,3 33,3 38,5
24 61,5 61,5 100,0
39 100,0 100,0
2,00
3,00
4,00
Total
Valid
Frequency Percent Valid Percent
Cumulative
Percent
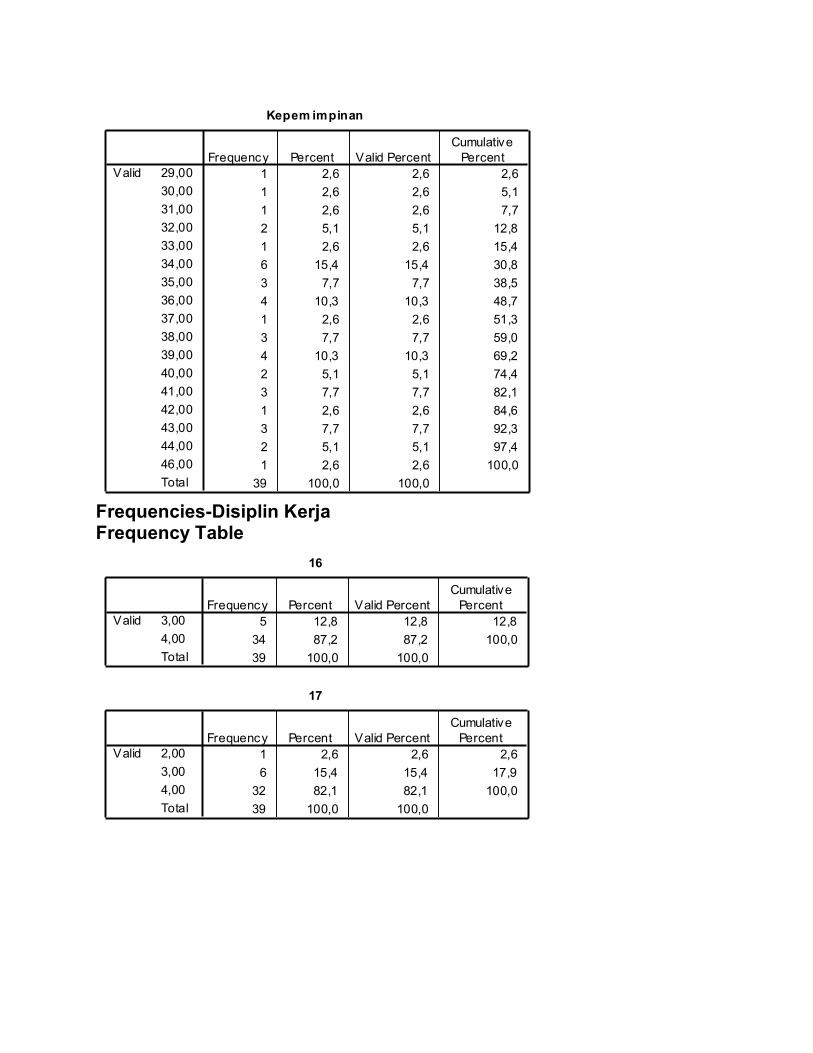
Kepem impinan
1 2,6 2,6 2,6
1 2,6 2,6 5,1
1 2,6 2,6 7,7
2 5,1 5,1 12,8
1 2,6 2,6 15,4
6 15,4 15,4 30,8
3 7,7 7,7 38,5
4 10,3 10,3 48,7
1 2,6 2,6 51,3
3 7,7 7,7 59,0
4 10,3 10,3 69,2
2 5,1 5,1 74,4
3 7,7 7,7 82,1
1 2,6 2,6 84,6
3 7,7 7,7 92,3
2 5,1 5,1 97,4
1 2,6 2,6 100,0
39 100,0 100,0
29,00
30,00
31,00
32,00
33,00
34,00
35,00
36,00
37,00
38,00
39,00
40,00
41,00
42,00
43,00
44,00
46,00
Total
Valid
Frequency Percent Valid Percent
Cumulative
Percent
Frequencies-Disiplin Kerja Frequency Table
16
5 12,8 12,8 12,8
34 87,2 87,2 100,0
39 100,0 100,0
3,00
4,00
Total
Valid
Frequency Percent Valid Percent
Cumulative
Percent
17
1 2,6 2,6 2,6
6 15,4 15,4 17,9
32 82,1 82,1 100,0
39 100,0 100,0
2,00
3,00
4,00
Total
Valid
Frequency Percent Valid Percent
Cumulative
Percent
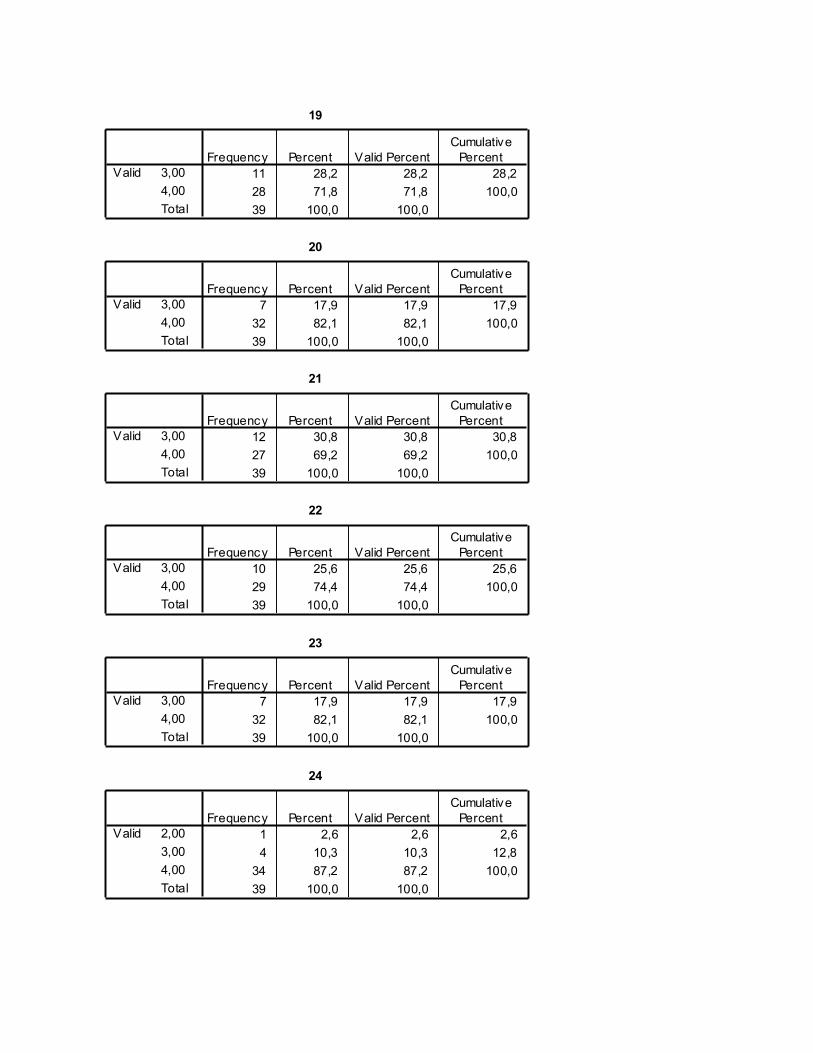
19
11 28,2 28,2 28,2
28 71,8 71,8 100,0
39 100,0 100,0
3,00
4,00
Total
Valid
Frequency Percent Valid Percent
Cumulative
Percent
20
7 17,9 17,9 17,9
32 82,1 82,1 100,0
39 100,0 100,0
3,00
4,00
Total
Valid
Frequency Percent Valid Percent
Cumulative
Percent
21
12 30,8 30,8 30,8
27 69,2 69,2 100,0
39 100,0 100,0
3,00
4,00
Total
Valid
Frequency Percent Valid Percent
Cumulative
Percent
22
10 25,6 25,6 25,6
29 74,4 74,4 100,0
39 100,0 100,0
3,00
4,00
Total
Valid
Frequency Percent Valid Percent
Cumulative
Percent
23
7 17,9 17,9 17,9
32 82,1 82,1 100,0
39 100,0 100,0
3,00
4,00
Total
Valid
Frequency Percent Valid Percent
Cumulative
Percent
24
1 2,6 2,6 2,6
4 10,3 10,3 12,8
34 87,2 87,2 100,0
39 100,0 100,0
2,00
3,00
4,00
Total
Valid
Frequency Percent Valid Percent
Cumulative
Percent
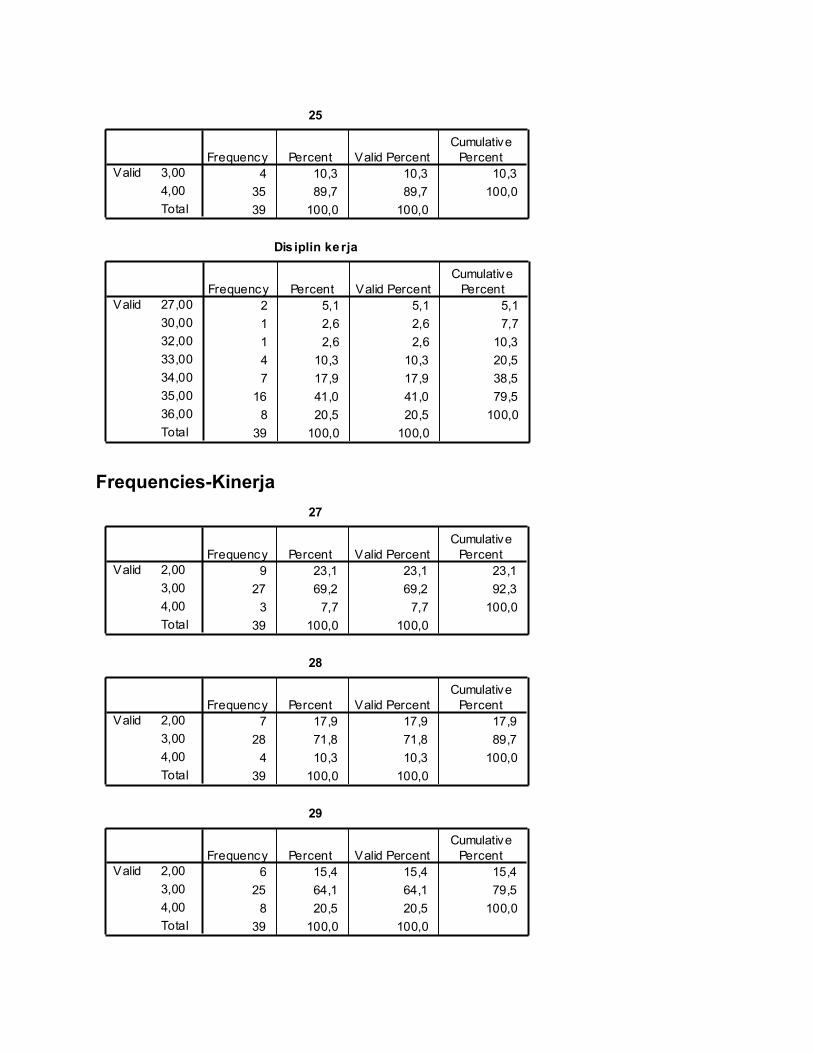
25
4 10,3 10,3 10,3
35 89,7 89,7 100,0
39 100,0 100,0
3,00
4,00
Total
Valid
Frequency Percent Valid Percent
Cumulative
Percent
Dis iplin kerja
2 5,1 5,1 5,1
1 2,6 2,6 7,7
1 2,6 2,6 10,3
4 10,3 10,3 20,5
7 17,9 17,9 38,5
16 41,0 41,0 79,5
8 20,5 20,5 100,0
39 100,0 100,0
27,00
30,00
32,00
33,00
34,00
35,00
36,00
Total
Valid
Frequency Percent Valid Percent
Cumulative
Percent
Frequencies-Kinerja
27
9 23,1 23,1 23,1
27 69,2 69,2 92,3
3 7,7 7,7 100,0
39 100,0 100,0
2,00
3,00
4,00
Total
Valid
Frequency Percent Valid Percent
Cumulative
Percent
28
7 17,9 17,9 17,9
28 71,8 71,8 89,7
4 10,3 10,3 100,0
39 100,0 100,0
2,00
3,00
4,00
Total
Valid
Frequency Percent Valid Percent
Cumulative
Percent
29
6 15,4 15,4 15,4
25 64,1 64,1 79,5
8 20,5 20,5 100,0
39 100,0 100,0
2,00
3,00
4,00
Total
Valid
Frequency Percent Valid Percent
Cumulative
Percent
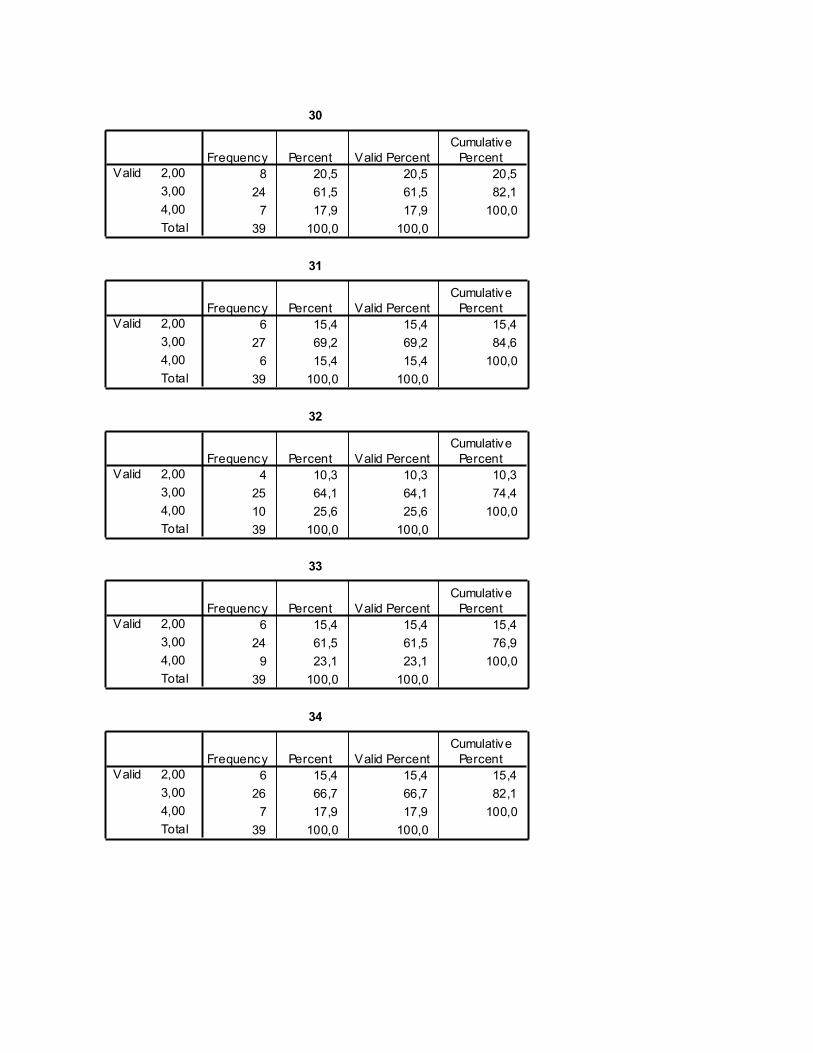
30
8 20,5 20,5 20,5
24 61,5 61,5 82,1
7 17,9 17,9 100,0
39 100,0 100,0
2,00
3,00
4,00
Total
Valid
Frequency Percent Valid Percent
Cumulative
Percent
31
6 15,4 15,4 15,4
27 69,2 69,2 84,6
6 15,4 15,4 100,0
39 100,0 100,0
2,00
3,00
4,00
Total
Valid
Frequency Percent Valid Percent
Cumulative
Percent
32
4 10,3 10,3 10,3
25 64,1 64,1 74,4
10 25,6 25,6 100,0
39 100,0 100,0
2,00
3,00
4,00
Total
Valid
Frequency Percent Valid Percent
Cumulative
Percent
33
6 15,4 15,4 15,4
24 61,5 61,5 76,9
9 23,1 23,1 100,0
39 100,0 100,0
2,00
3,00
4,00
Total
Valid
Frequency Percent Valid Percent
Cumulative
Percent
34
6 15,4 15,4 15,4
26 66,7 66,7 82,1
7 17,9 17,9 100,0
39 100,0 100,0
2,00
3,00
4,00
Total
Valid
Frequency Percent Valid Percent
Cumulative
Percent
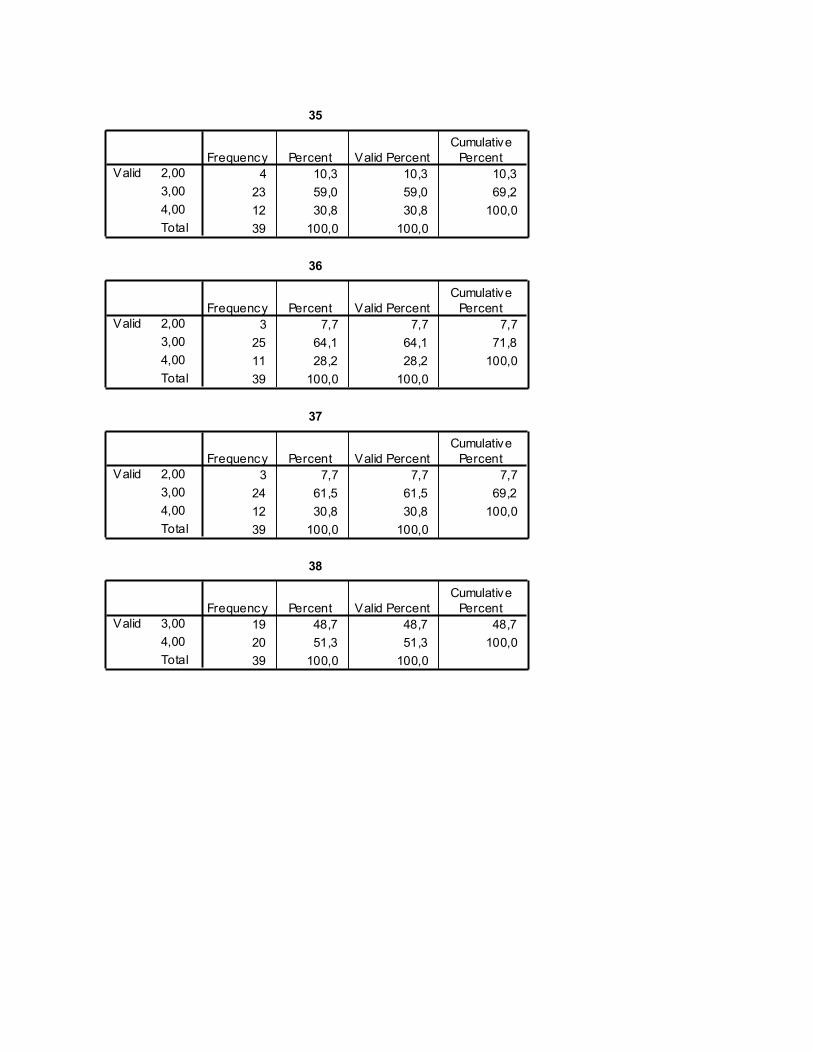
35
4 10,3 10,3 10,3
23 59,0 59,0 69,2
12 30,8 30,8 100,0
39 100,0 100,0
2,00
3,00
4,00
Total
Valid
Frequency Percent Valid Percent
Cumulative
Percent
36
3 7,7 7,7 7,7
25 64,1 64,1 71,8
11 28,2 28,2 100,0
39 100,0 100,0
2,00
3,00
4,00
Total
Valid
Frequency Percent Valid Percent
Cumulative
Percent
37
3 7,7 7,7 7,7
24 61,5 61,5 69,2
12 30,8 30,8 100,0
39 100,0 100,0
2,00
3,00
4,00
Total
Valid
Frequency Percent Valid Percent
Cumulative
Percent
38
19 48,7 48,7 48,7
20 51,3 51,3 100,0
39 100,0 100,0
3,00
4,00
Total
Valid
Frequency Percent Valid Percent
Cumulative
Percent

Kinerja
1 2,6 2,6 2,6
2 5,1 5,1 7,7
5 12,8 12,8 20,5
3 7,7 7,7 28,2
6 15,4 15,4 43,6
6 15,4 15,4 59,0
2 5,1 5,1 64,1
4 10,3 10,3 74,4
3 7,7 7,7 82,1
4 10,3 10,3 92,3
2 5,1 5,1 97,4
1 2,6 2,6 100,0
39 100,0 100,0
29,00
32,00
34,00
35,00
36,00
37,00
38,00
39,00
40,00
41,00
42,00
45,00
Total
Valid
Frequency Percent Valid Percent
Cumulative
Percent