Embed Size (px)
Citation preview

La economía de lo posible
Pensiones e informalidad en América Latina
拉丁美洲的非正规经济和养老金
Ángel Melguizo
con J.R. de Laiglesia, R. Da Costa,
y E. Martínez
Centro de Desarrollo de la OCDE
Conferencia CASS - ILAS
Desafíos para el Desarrollo Sostenible de
América Latina y China
Beijing, 28 de abril de 2011
2
Marco conceptual
Perspectivas Económicas de América Latina 2011, LEO2011:
Políticas para favorecer la movilidad ascendente y reducir la
vulnerabilidad de los sectores de ingreso medio:
• Educación
• Protección social: pensiones, salud y prestaciones por
desempleo
• Política fiscal: impuestos, transferencias y servicios públicos
3
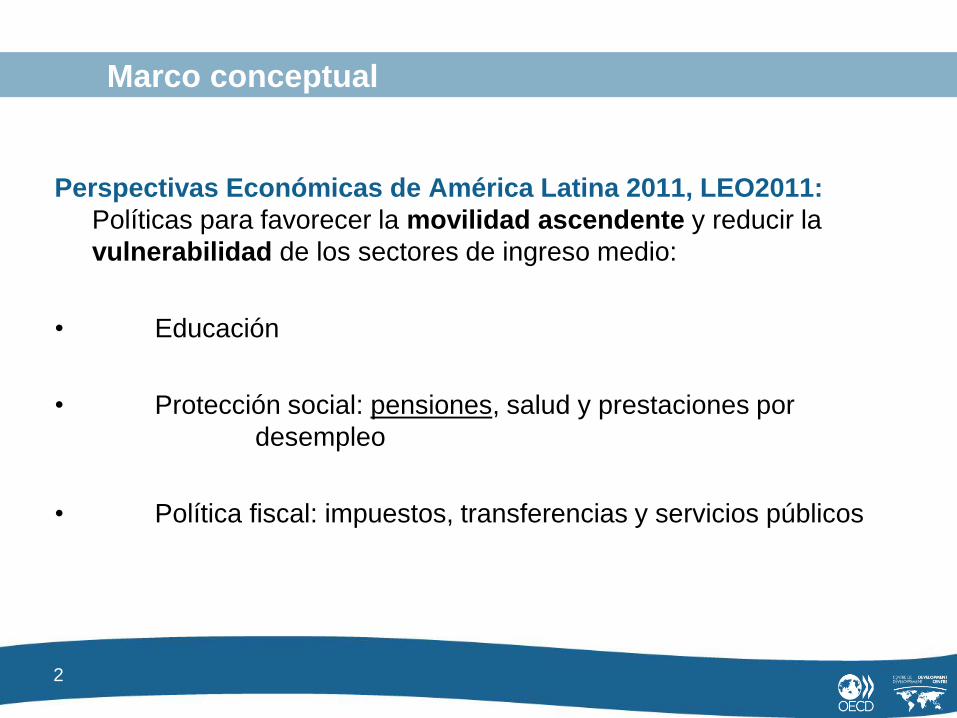
Motivación
• El aumento de la cobertura de los sistemas de pensiones en América
Latina sigue representando un reto
• Sólo un 30% de los trabajadores activos cotizan
• Menos de un 60% de los mayores de 65 años tienen pensión
• Creciente „clase media‟ en América Latina
• Como región, América Latina ha liderado la adopción de reformas
estructurales del sistema de pensiones
• Reformas de segunda/tercera generación: son las pensiones sociales la
solución?
4
Principales resultados
• Los estratos de ingreso medio trabajan en su mayoría en el sector
informal de la economía (en torno al 60% en los países analizados)
• Los trabajadores formales de ingreso medio están razonablemente bien
cubiertos por los sistemas de pensiones
• La cobertura de los trabajadores no formales es irregular y está
correlacionada positivamente con el nivel de ingreso
Implicaciones:
• Necesidad de instrumentos específicos
• Lo posible: adaptados a tipo de informalidad, edad, historial de cotización,
recursos públicos
5
Indice
Marco conceptual, estadísticas y medición
Cobertura e informalidad
Trabajadores independientes
Conclusiones
6
Marco conceptual: pensiones
Con qué frecuencia los trabajadores formales e informales cotizan al
sistema de pensiones? Un análisis de los estratos de ingreso
medio
Informalidad: Informal vs. No formal
Contrato de trabajo vs. Cobertura de pensión
Cobertura: Cotizantes vs. Afiliados
Público vs. privado / Obligatorio vs. voluntario
Ciclo vital vs. Cross section
Estratos medios: Identificación vs. Medición
7
Fuentes estadísticas y definiciones
Muestra: Bolivia, Brasil, Chile y México
Datos de Encuestas Nacionales de Hogares: Encuesta Continua de
Hogares de condiciones de vida (BOL, 01-02), Pesquisa Nacional por Amostra
de Domicilios (BRA, 96-06), Encuesta de Caracterización Socioeconómica
Nacional (CHL, 94-06), y Encuesta Nacional de Ingresos y Gastos de los
Hogares (MEX, 98-06)
Informalidad: Contrato de trabajo o carteira de trabalho (BRA)
Cobertura: Totales, cotizantes BRA y CHL, afiliados BOL y MEX
Estratos medios: 50% - 150% del ingreso per capita mediano,
ajustado por composición del hogar
8
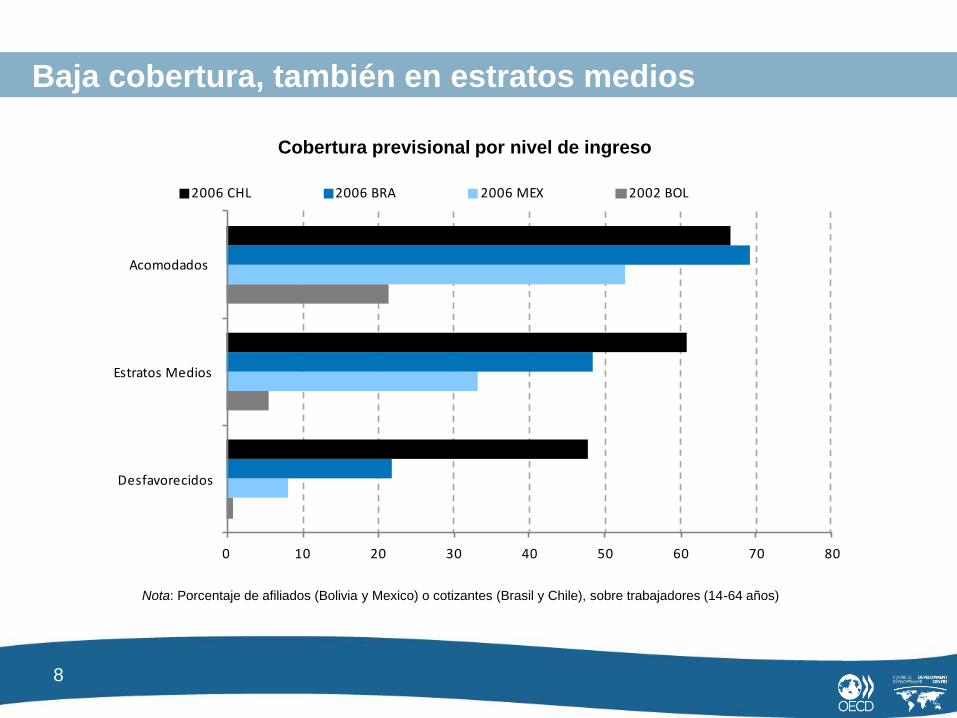
Baja cobertura, también en estratos medios
Nota: Porcentaje de afiliados (Bolivia y Mexico) o cotizantes (Brasil y Chile), sobre trabajadores (14-64 años)
Cobertura previsional por nivel de ingreso
0 10 20 30 40 50 60 70 80
Desfavorecidos
Estratos Medios
Acomodados
2006 CHL 2006 BRA 2006 MEX 2002 BOL
9
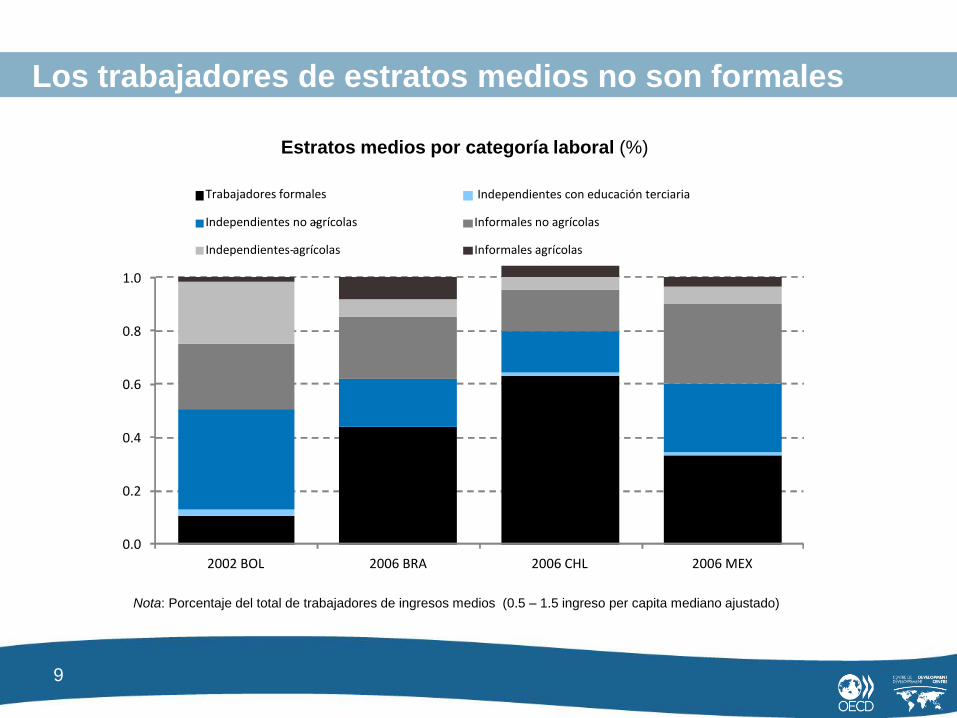
Los trabajadores de estratos medios no son formales
Nota: Porcentaje del total de trabajadores de ingresos medios (0.5 – 1.5 ingreso per capita mediano ajustado)
Estratos medios por categoría laboral (%)
0.0
0.2
0.4
0.6
0.8
1.0
2002 BOL 2006 BRA 2006 CHL 2006 MEX
Trabajadores formales Independientes con educación terciaria
Independientes no agrícolas - Informales no agrícolas
Independientes agrícolas - Informales agrícolas
10
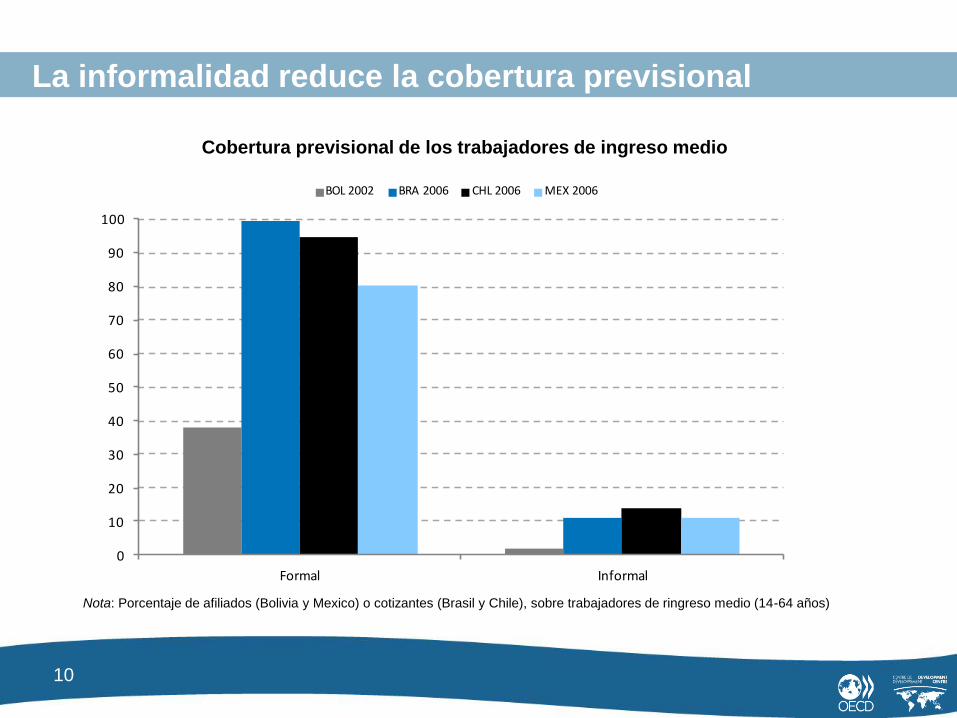
La informalidad reduce la cobertura previsional
Nota: Porcentaje de afiliados (Bolivia y Mexico) o cotizantes (Brasil y Chile), sobre trabajadores de ringreso medio (14-64 años)
Cobertura previsional de los trabajadores de ingreso medio
0
10
20
30
40
50
60
70
80
90
100
Formal Informal
BOL 2002 BRA 2006 CHL 2006 MEX 2006
11
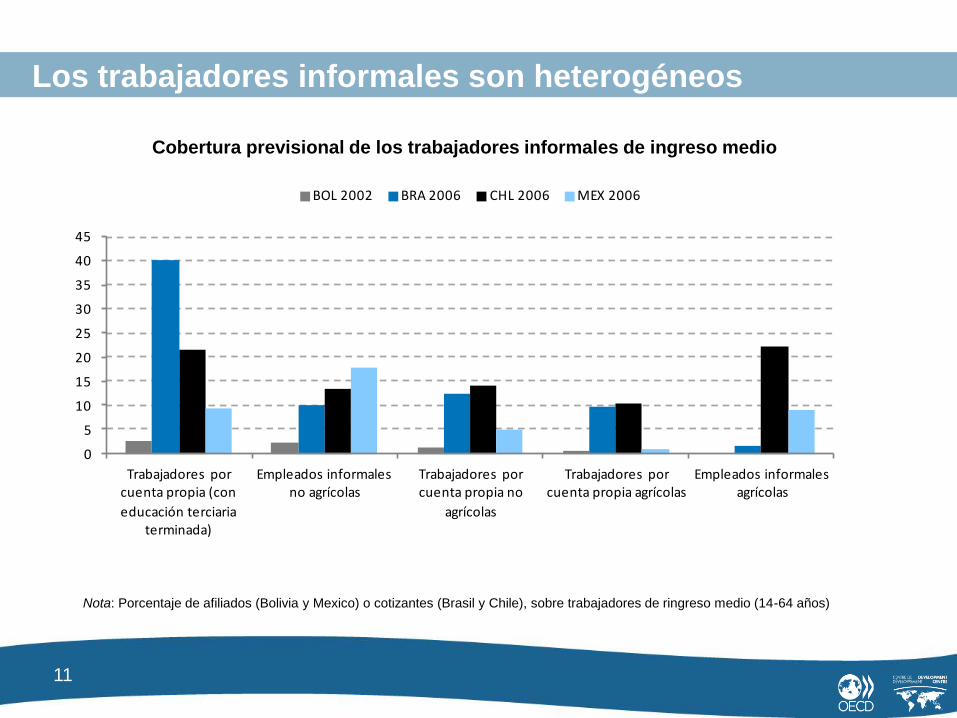
Los trabajadores informales son heterogéneos
heterogeneous
Nota: Porcentaje de afiliados (Bolivia y Mexico) o cotizantes (Brasil y Chile), sobre trabajadores de ringreso medio (14-64 años)
Cobertura previsional de los trabajadores informales de ingreso medio
0
5
10
15
20
25
30
35
40
45
Trabajadores por cuenta propia (con
educación terciaria terminada)
Empleados informales no agrícolas
Trabajadores por cuenta propia no
agrícolas
Trabajadores por cuenta propia agrícolas
Empleados informales agrícolas
BOL 2002 BRA 2006 CHL 2006 MEX 2006
12
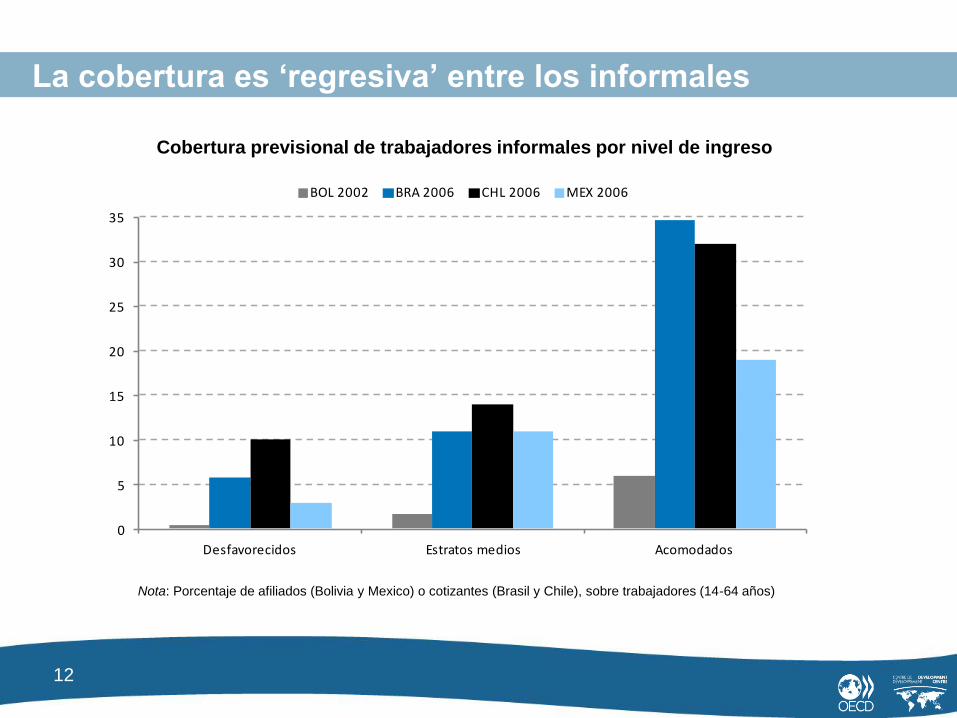
La cobertura es ‘regresiva’ entre los informales
Cobertura previsional de trabajadores informales por nivel de ingreso
Nota: Porcentaje de afiliados (Bolivia y Mexico) o cotizantes (Brasil y Chile), sobre trabajadores (14-64 años)
0
5
10
15
20
25
30
35
Desfavorecidos Estratos medios Acomodados
BOL 2002 BRA 2006 CHL 2006 MEX 2006
13
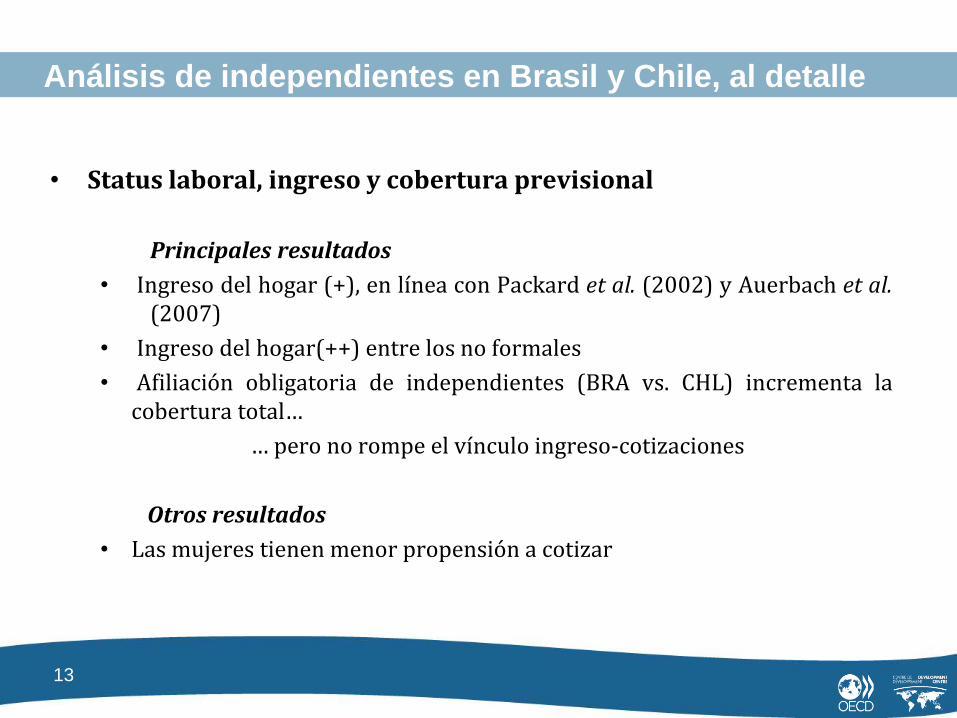
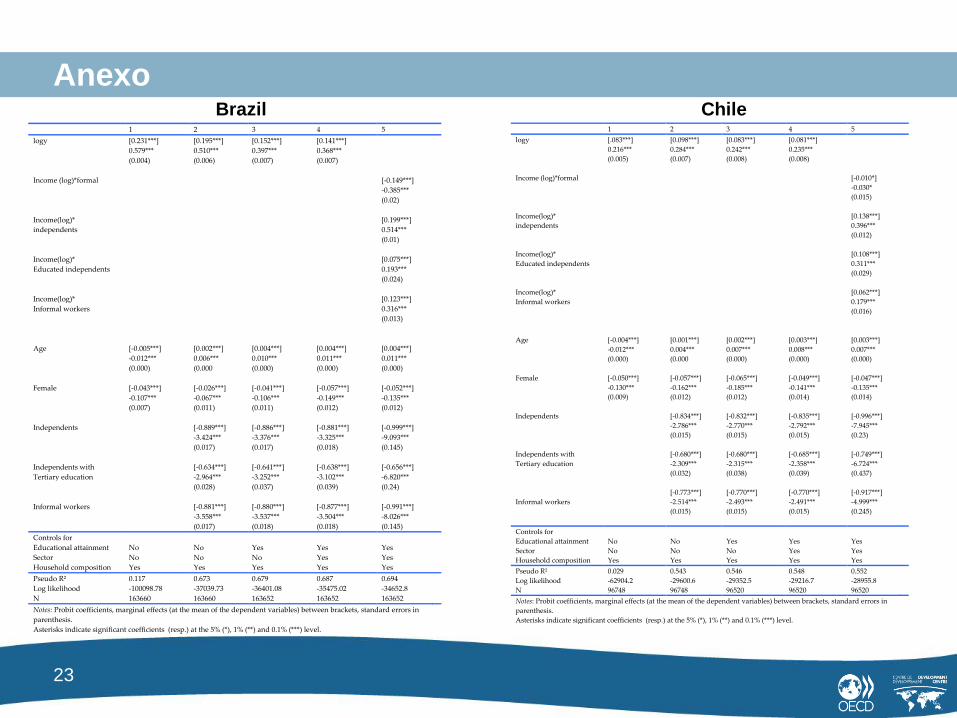
Análisis de independientes en Brasil y Chile, al detalle
• Status laboral, ingreso y cobertura previsional
Principales resultados
• Ingreso del hogar (+), en línea con Packard et al. (2002) y Auerbach et al. (2007)
• Ingreso del hogar(++) entre los no formales
• Afiliación obligatoria de independientes (BRA vs. CHL) incrementa la cobertura total…
… pero no rompe el vínculo ingreso-cotizaciones
Otros resultados
• Las mujeres tienen menor propensión a cotizar
14
Recomendaciones de política: principios
Equilibrio general: Pensiones y Salud y Desempleo (+ Educación) Ribe et al. (2010), Escrivá et al. (2010)
Financiables: Recursos públicos limitados
Transparentes:
Seguro vs. Redistribución
Economía política (comunicación, incertidumbre)
Adaptados a la socio-economía: informalidad(es), edad, ingreso-ahorro
15
Recomendaciones de política: medidas (ex post, ex ante)
Pensiones mínimas: afiliados de más edad, informales agrícolas
Universalidad vs. Elegibilidad más laxa
ECLAC (2006), Levy (2008), Pages (2010), Dethier et al. (2010)
Afiliación: Independientes con educación terciaria
Obligatoriedad vs. Opt-out
Flexibilidad (cotizaciones, retiro de fondos)
Hu y Steward (2009)
Co-financiación pública: Trabajadores informales de ingreso medio con
ahorros
(Voluntary) Matching defined contributions
Holzman et al. (2009)
谢谢
www.oecd.org/dev/
www.latameconomy.org/
La economía de lo posible
Pensiones e informalidad en América Latina
养老金和拉丁美洲的非正规性
Ángel Melguizo
con J.R. de Laiglesia, R. Da Costa,
y E. Martínez
Centro de Desarrollo de la OCDE
Conferencia CASS - ILAS
Desafíos para el Desarrollo Sostenible de
América Latina y China
Beijing, 28 de abril de 2011
18
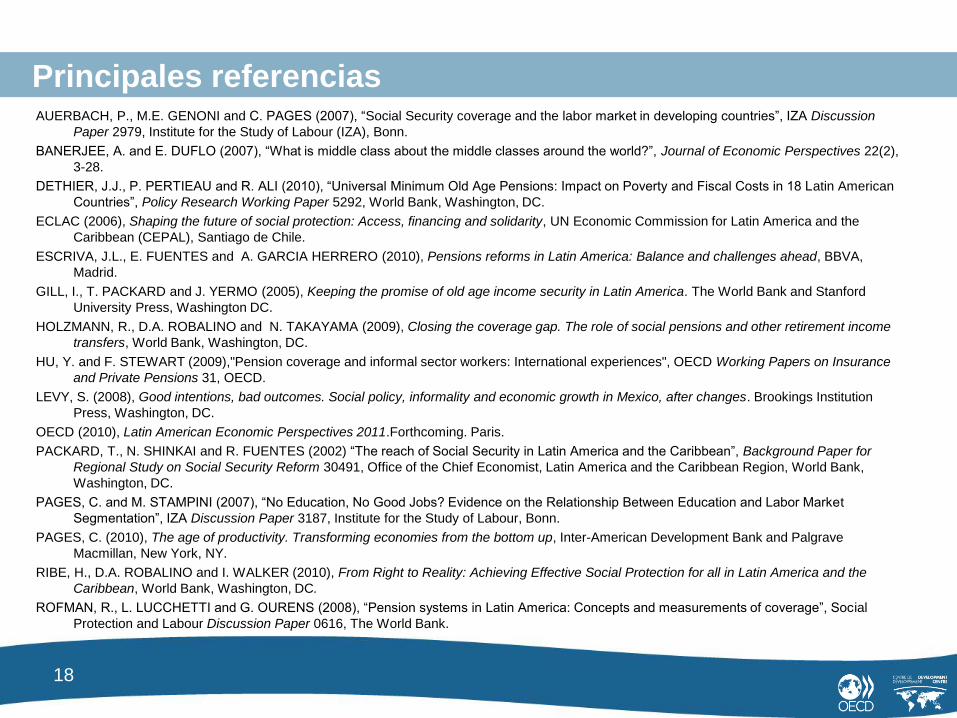
Principales referencias AUERBACH, P., M.E. GENONI and C. PAGES (2007), “Social Security coverage and the labor market in developing countries”, IZA Discussion
Paper 2979, Institute for the Study of Labour (IZA), Bonn.
BANERJEE, A. and E. DUFLO (2007), “What is middle class about the middle classes around the world?”, Journal of Economic Perspectives 22(2),
3-28.
DETHIER, J.J., P. PERTIEAU and R. ALI (2010), “Universal Minimum Old Age Pensions: Impact on Poverty and Fiscal Costs in 18 Latin American
Countries”, Policy Research Working Paper 5292, World Bank, Washington, DC.
ECLAC (2006), Shaping the future of social protection: Access, financing and solidarity, UN Economic Commission for Latin America and the
Caribbean (CEPAL), Santiago de Chile.
ESCRIVA, J.L., E. FUENTES and A. GARCIA HERRERO (2010), Pensions reforms in Latin America: Balance and challenges ahead, BBVA,
Madrid.
GILL, I., T. PACKARD and J. YERMO (2005), Keeping the promise of old age income security in Latin America. The World Bank and Stanford
University Press, Washington DC.
HOLZMANN, R., D.A. ROBALINO and N. TAKAYAMA (2009), Closing the coverage gap. The role of social pensions and other retirement income
transfers, World Bank, Washington, DC.
HU, Y. and F. STEWART (2009),"Pension coverage and informal sector workers: International experiences", OECD Working Papers on Insurance
and Private Pensions 31, OECD.
LEVY, S. (2008), Good intentions, bad outcomes. Social policy, informality and economic growth in Mexico, after changes. Brookings Institution
Press, Washington, DC.
OECD (2010), Latin American Economic Perspectives 2011.Forthcoming. Paris.
PACKARD, T., N. SHINKAI and R. FUENTES (2002) “The reach of Social Security in Latin America and the Caribbean”, Background Paper for
Regional Study on Social Security Reform 30491, Office of the Chief Economist, Latin America and the Caribbean Region, World Bank,
Washington, DC.
PAGES, C. and M. STAMPINI (2007), “No Education, No Good Jobs? Evidence on the Relationship Between Education and Labor Market
Segmentation”, IZA Discussion Paper 3187, Institute for the Study of Labour, Bonn.
PAGES, C. (2010), The age of productivity. Transforming economies from the bottom up, Inter-American Development Bank and Palgrave
Macmillan, New York, NY.
RIBE, H., D.A. ROBALINO and I. WALKER (2010), From Right to Reality: Achieving Effective Social Protection for all in Latin America and the
Caribbean, World Bank, Washington, DC.
ROFMAN, R., L. LUCCHETTI and G. OURENS (2008), “Pension systems in Latin America: Concepts and measurements of coverage”, Social
Protection and Labour Discussion Paper 0616, The World Bank.
19
0.0
0.2
0.4
0.6
0.8
1.0
1.2
1.4
Disadvantaged Middle Sectors Affluent
Nu
mb
er
of
ind
ivid
ual
s (i
n m
illio
n)
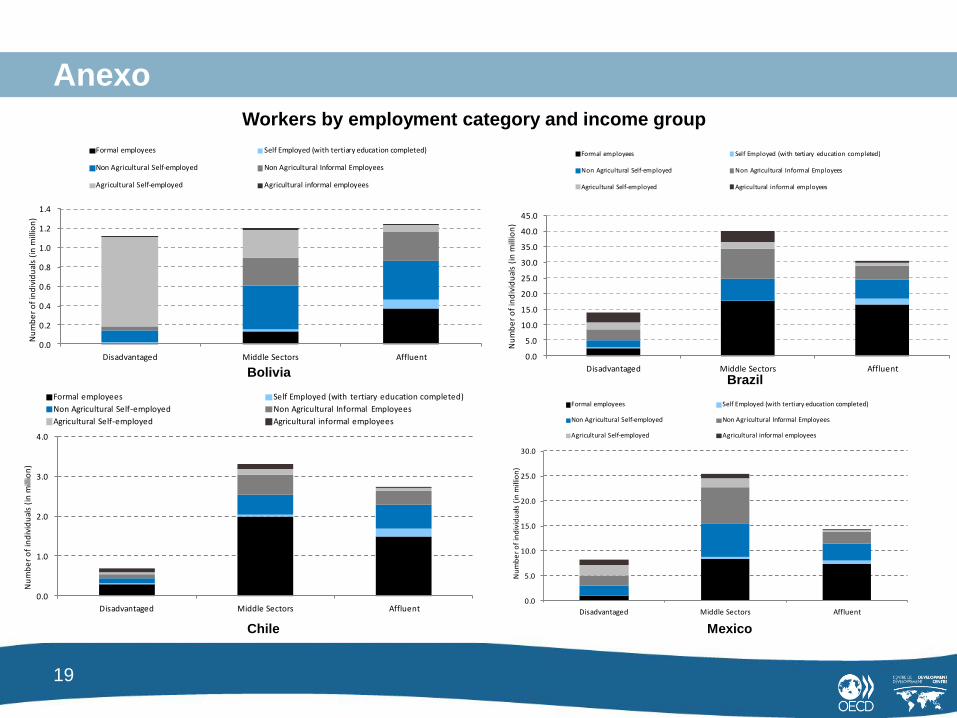
Formal employees Self Employed (with tertiary education completed)
Non Agricultural Self-employed Non Agricultural Informal Employees
Agricultural Self-employed Agricultural informal employees
Workers by employment category and income group
0.0
5.0
10.0
15.0
20.0
25.0
30.0
35.0
40.0
45.0
Disadvantaged Middle Sectors Affluent
Nu
mb
er
of
ind
ivid
ual
s (i
n m
illio
n)
Formal employees Self Employed (with tertiary education completed)
Non Agricultural Self-employed Non Agricultural Informal Employees
Agricultural Self-employed Agricultural informal employees
Bolivia Brazil
0.0
1.0
2.0
3.0
4.0
Disadvantaged Middle Sectors Affluent
Nu
mb
er
of
ind
ivid
ual
s (i
n m
illio
n)
Formal employees Self Employed (with tertiary education completed)
Non Agricultural Self-employed Non Agricultural Informal Employees
Agricultural Self-employed Agricultural informal employees
Chile
0.0
5.0
10.0
15.0
20.0
25.0
30.0
Disadvantaged Middle Sectors Affluent
Nu
mb
er
of
ind
ivid
ual
s (i
n m
illio
n)
Formal employees Self Employed (with tertiary education completed)
Non Agricultural Self-employed Non Agricultural Informal Employees
Agricultural Self-employed Agricultural informal employees
Mexico
Anexo
20
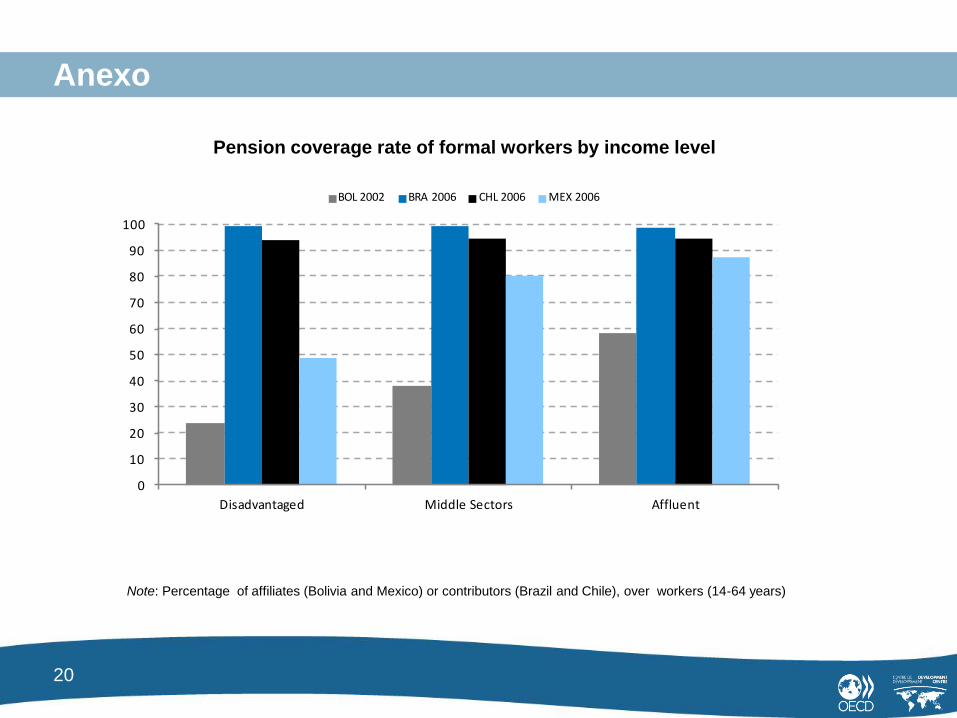
Pension coverage rate of formal workers by income level
Note: Percentage of affiliates (Bolivia and Mexico) or contributors (Brazil and Chile), over workers (14-64 years)
0
10
20
30
40
50
60
70
80
90
100
Disadvantaged Middle Sectors Affluent
BOL 2002 BRA 2006 CHL 2006 MEX 2006
Anexo
21
0
10
20
30
40
50
60
Disadvantaged Middle Sectors Affluent
Pe
rce
nt
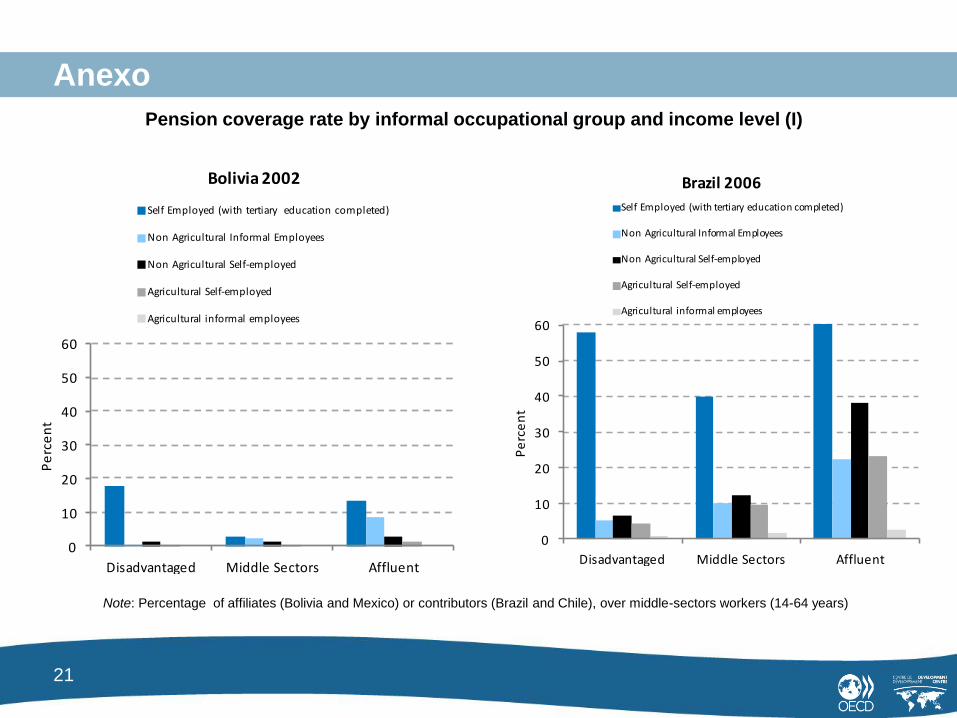
Bolivia 2002
Self Employed (with tertiary education completed)
Non Agricultural Informal Employees
Non Agricultural Self-employed
Agricultural Self-employed
Agricultural informal employees
Pension coverage rate by informal occupational group and income level (I)
0
10
20
30
40
50
60
Disadvantaged Middle Sectors Affluent
Pe
rce
nt
Brazil 2006
Self Employed (with tertiary education completed)
Non Agricultural Informal Employees
Non Agricultural Self-employed
Agricultural Self-employed
Agricultural informal employees
Note: Percentage of affiliates (Bolivia and Mexico) or contributors (Brazil and Chile), over middle-sectors workers (14-64 years)
Anexo
22
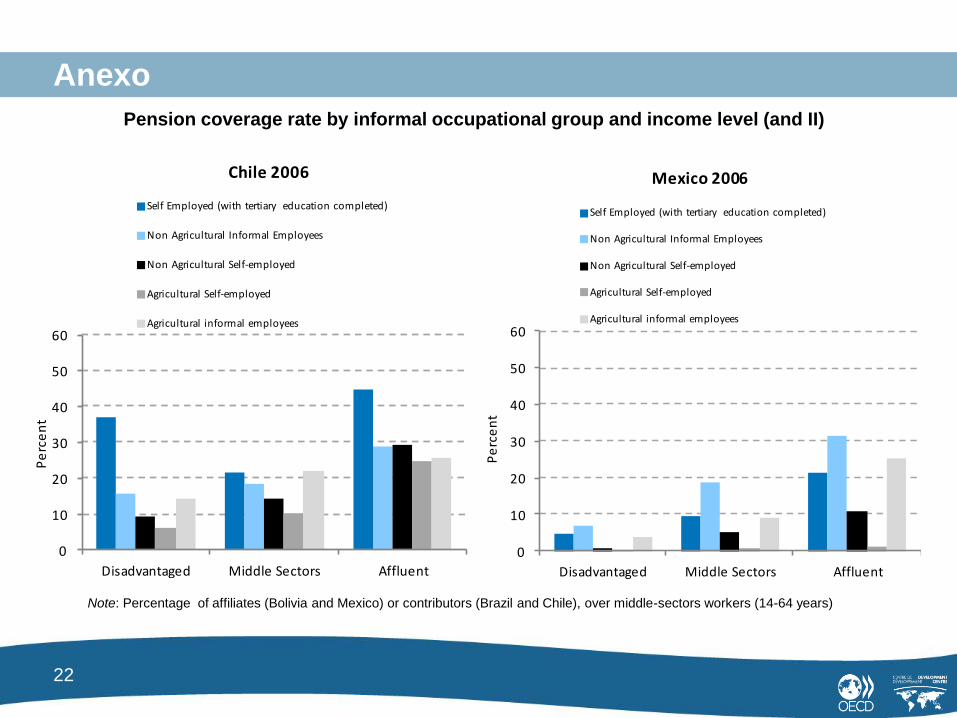
Pension coverage rate by informal occupational group and income level (and II)
0
10
20
30
40
50
60
Disadvantaged Middle Sectors Affluent
Pe
rce
nt
Mexico 2006
Self Employed (with tertiary education completed)
Non Agricultural Informal Employees
Non Agricultural Self-employed
Agricultural Self-employed
Agricultural informal employees
0
10
20
30
40
50
60
Disadvantaged Middle Sectors Affluent
Pe
rce
nt
Chile 2006
Self Employed (with tertiary education completed)
Non Agricultural Informal Employees
Non Agricultural Self-employed
Agricultural Self-employed
Agricultural informal employees
Note: Percentage of affiliates (Bolivia and Mexico) or contributors (Brazil and Chile), over middle-sectors workers (14-64 years)
Anexo
23
Anexo
1 2 3 4 5
logy [.083***] [0.098***] [0.083***] [0.081***]
0.216*** 0.284*** 0.242*** 0.235***
(0.005) (0.007) (0.008) (0.008)
Income (log)*formal [-0.010*]
-0.030*
(0.015)
Income(log)* [0.138***]
independents 0.396***
(0.012)
Income(log)* [0.108***]
Educated independents 0.311***
(0.029)
Income(log)* [0.062***]
Informal workers 0.179***
(0.016)
Age [-0.004***] [0.001***] [0.002***] [0.003***] [0.003***]
-0.012*** 0.004*** 0.007*** 0.008*** 0.007***
(0.000) (0.000 (0.000) (0.000) (0.000)
Female [-0.050***] [-0.057***] [-0.065***] [-0.049***] [-0.047***]
-0.130*** -0.162*** -0.185*** -0.141*** -0.135***
(0.009) (0.012) (0.012) (0.014) (0.014)
Independents [-0.834***] [-0.832***] [-0.835***] [-0.996***]
-2.786*** -2.770*** -2.792*** -7.945***
(0.015) (0.015) (0.015) (0.23)
Independents with [-0.680***] [-0.680***] [-0.685***] [-0.749***]
Tertiary education -2.309*** -2.315*** -2.358*** -6.724***
(0.032) (0.038) (0.039) (0.437)
[-0.773***] [-0.770***] [-0.770***] [-0.917***]
Informal workers -2.514*** -2.493*** -2.491*** -4.999***
(0.015) (0.015) (0.015) (0.245)
Controls for
Educational attainment No No Yes Yes Yes
Sector No No No Yes Yes
Household composition Yes Yes Yes Yes Yes
Pseudo R² 0.029 0.543 0.546 0.548 0.552
Log likelihood -62904.2 -29600.6 -29352.5 -29216.7 -28955.8
N 96748 96748 96520 96520 96520
Notes: Probit coefficients, marginal effects (at the mean of the dependent variables) between brackets, standard errors in
parenthesis.
Asterisks indicate significant coefficients (resp.) at the 5% (*), 1% (**) and 0.1% (***) level.
Chile Brazil 1 2 3 4 5
logy [0.231***] [0.195***] [0.152***] [0.141***]
0.579*** 0.510*** 0.397*** 0.368***
(0.004) (0.006) (0.007) (0.007)
Income (log)*formal [-0.149***]
-0.385***
(0.02)
Income(log)* [0.199***]
independents 0.514***
(0.01)
Income(log)* [0.075***]
Educated independents 0.193***
(0.024)
Income(log)* [0.123***]
Informal workers 0.316***
(0.013)
Age [-0.005***] [0.002***] [0.004***] [0.004***] [0.004***]
-0.012*** 0.006*** 0.010*** 0.011*** 0.011***
(0.000) (0.000 (0.000) (0.000) (0.000)
Female [-0.043***] [-0.026***] [-0.041***] [-0.057***] [-0.052***]
-0.107*** -0.067*** -0.106*** -0.149*** -0.135***
(0.007) (0.011) (0.011) (0.012) (0.012)
Independents [-0.889***] [-0.886***] [-0.881***] [-0.999***]
-3.424*** -3.376*** -3.325*** -9.093***
(0.017) (0.017) (0.018) (0.145)
Independents with [-0.634***] [-0.641***] [-0.638***] [-0.656***]
Tertiary education -2.964*** -3.252*** -3.102*** -6.820***
(0.028) (0.037) (0.039) (0.24)
Informal workers [-0.881***] [-0.880***] [-0.877***] [-0.991***]
-3.558*** -3.537*** -3.504*** -8.026***
(0.017) (0.018) (0.018) (0.145)
Controls for
Educational attainment No No Yes Yes Yes
Sector No No No Yes Yes
Household composition Yes Yes Yes Yes Yes
Pseudo R² 0.117 0.673 0.679 0.687 0.694
Log likelihood -100098.78 -37039.73 -36401.08 -35475.02 -34652.8
N 163660 163660 163652 163652 163652
Notes: Probit coefficients, marginal effects (at the mean of the dependent variables) between brackets, standard errors in
parenthesis.
Asterisks indicate significant coefficients (resp.) at the 5% (*), 1% (**) and 0.1% (***) level.
24
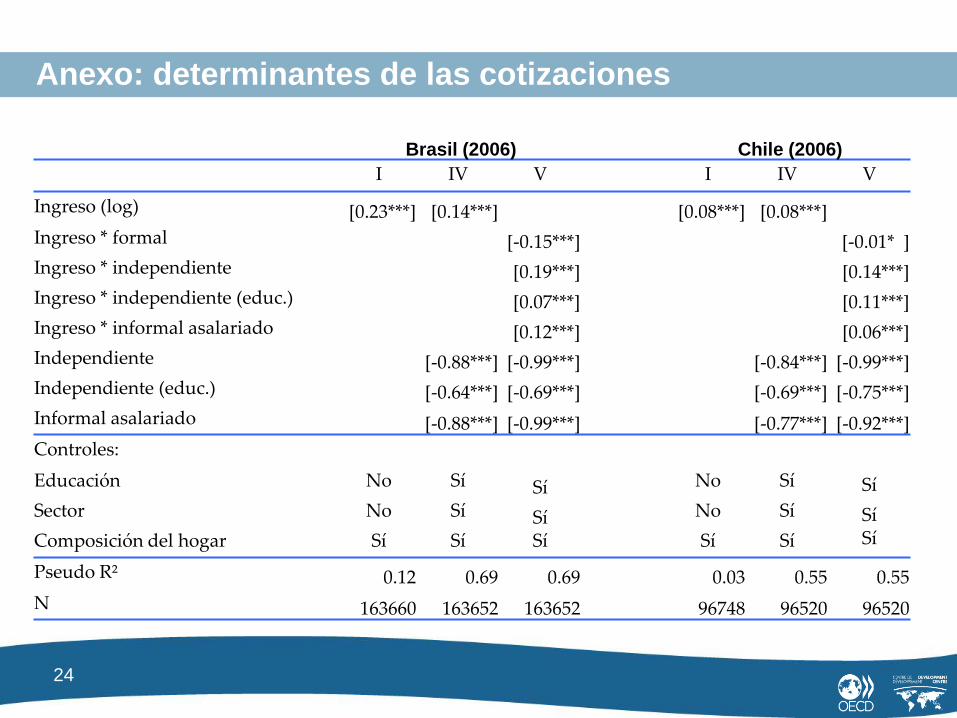
Anexo: determinantes de las cotizaciones
Brasil (2006) Chile (2006)
I IV V I IV V
Ingreso (log) [0.23***] [0.14***] [0.08***] [0.08***]
Ingreso * formal [-0.15***] [-0.01* ]
Ingreso * independiente [0.19***] [0.14***]
Ingreso * independiente (educ.) [0.07***] [0.11***]
Ingreso * informal asalariado [0.12***] [0.06***]
Independiente [-0.88***] [-0.99***] [-0.84***] [-0.99***]
Independiente (educ.) [-0.64***] [-0.69***] [-0.69***] [-0.75***]
Informal asalariado [-0.88***] [-0.99***] [-0.77***] [-0.92***]
Controles:
Educación No Sí Sí No Sí Sí
Sector No Sí Sí No Sí Sí
Composición del hogar Sí Sí Sí Sí Sí Sí
Pseudo R² 0.12 0.69 0.69 0.03 0.55 0.55
N 163660 163652 163652 96748 96520 96520
25
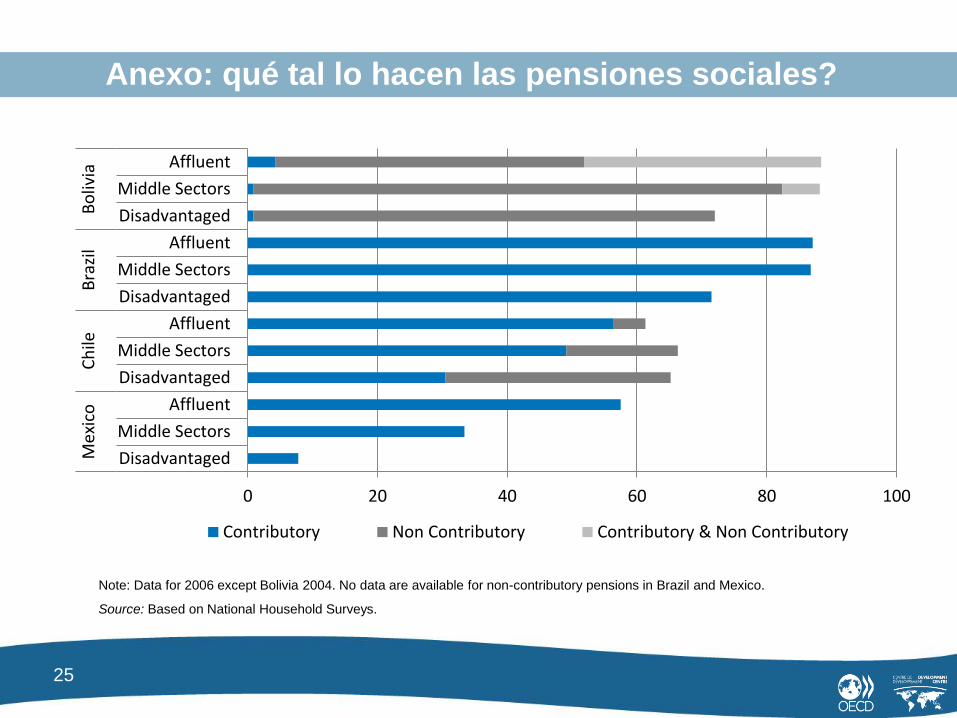
Anexo: qué tal lo hacen las pensiones sociales?
0 20 40 60 80 100
Disadvantaged
Middle Sectors
Affluent
Disadvantaged
Middle Sectors
Affluent
Disadvantaged
Middle Sectors
Affluent
Disadvantaged
Middle Sectors
Affluent
Mex
ico
Ch
ileB
razi
lB
oliv
ia
Contributory Non Contributory Contributory & Non Contributory
Note: Data for 2006 except Bolivia 2004. No data are available for non-contributory pensions in Brazil and Mexico.
Source: Based on National Household Surveys.