Embed Size (px)
Citation preview
Sains Malaysiana 46(11)(2017): 2187-2193http://dx.doi.org/10.17576/jsm-2017-4611-20
Laboratory Study of Acoustic Velocity in Different Types of Rocks atSeismic Frequency Band
(Kajian Makmal Halaju Akustik dalam Pelbagai Jenis Batuan pada Jalur Frekuensi Seismos)
Yunlan He*,Suping peng,Wenfeng Du, Xiaoming Tang & Zeng Hu
ABSTRACT
In order to understand the characteristics of acoustic wave propagation in rocks within seismic frequency band (<100 Hz), the velocities of longitudinal and transverse waves of four different types of rocks were tested using low-frequency stress-strain method by means of the physical testing system of rock at low frequency and the experimental data of acoustic velocities of four different types of rocks at this frequency band were obtained. The experimental results showed that the acoustic velocities of four different types of rocks increased with the increase of temperature and pressure within the temperature and pressure ranges set by the experiment. The acoustic velocity of fine sandstone at 50% water saturation was smaller than that of dry sample. The acoustic velocities of four different types of rocks were different and the velocities of longitudinal waves of gritstone, fine sandstone, argillaceous siltstone and mudstone increased in turn under similar conditions and were smaller than those at ultrasonic frequency. Few of existing studies focus on the acoustic velocity at seismic frequency band, thus, further understanding of the acoustic characteristics at this seismic frequency band still requires more experimental data.
Keywords: Acoustic velocity; pressure; seismic frequency band; temperature
ABSTRAK
Untuk memahami ciri penyebaran gelombang akustik dalam jalur frekuensi seismos (< 100 Hz) batuan, halaju gelombang membujur dan melintang empat jenis batuan berbeza telah diuji menggunakan kaedah frekuensi rendah strain-tegasan melalui sistem ujian fizikal batuan pada frekuensi rendah dan data uji kaji halaju akustik daripada empat jenis batuan pada jalur frekuensi ini diperoleh. Keputusan uji kaji menunjukkan bahawa halaju akustik daripada empat jenis batuan meningkat dengan peningkatan suhu dan tekanan dalam julat suhu dan tekanan yang ditetapkan oleh uji kaji ini. Halaju akustik batu pasir halus pada 50% air tepu adalah lebih kecil berbanding dengan sampel kering. Halaju akustik daripada empat jenis batuan berbeza dan halaju daripada gelombang membujur batu grit, batu pasir halus, batu lodak argil dan batu lumpur meningkat pada keadaan yang serupa tetapi lebih kecil berbanding dengan kekerapan ultrasonik. Beberapa kajian sedia ada memberi tumpuan kepada kelajuan akustik pada jalur frekuensi seismos, oleh itu, pemahaman lanjut terhadap ciri akustik pada jalur frekuensi seismos ini masih memerlukan lebih data uji kaji.
Kata kunci: Halaju akustik; jalur frekuensi seismos; suhu; tekanan
inTroDucTion
The propagation of sound wave in rocks has the characteristics of velocity attenuation and temperature, pressure, saturation and rock type affect the acoustic velocity. Some theories described the seismic wave velocity in fluid saturated rock and its attenuation (Ba 201; Biot 19560; White 1975), but these theoretical models were mainly based on the experimental data of ultrasonic frequency band (MHz) and lacked the support of experimental data at seismic frequency band (5-100 Hz). Whether or not there is any difference between the acoustic velocities at ultrasonic frequency band and seismic frequency band, it has been questioned in previous studies (Mavko et al. 2012; Müller et al. 2010). Tutuncu et al. (1998) tested the velocities of longitudinal and transverse
waves of brine saturated sandstone at frequency ranging from 10 Hz to 1 MHz and the results showed that both the velocities of longitudinal and transverse waves showed an increasing trend. Batzle et al. (2006) further tested and compared the acoustic velocities at ultrasonic and seismic frequency band using low-frequency stress-strain method and ultrasonic testing. Wang et al. (2012) tested the bulk moduli of different types of rocks at 600 Hz using resonance acoustic spectroscopy method and compared them with the bulk moduli of different types of rocks at ultrasonic frequency band. Wei et al. (2015a, 2015b) discussed the factors influencing the acoustic velocity in sandstone using low-frequency stress-strain method and investigated the characteristics of acoustic velocity and dispersion under different conditions. Low frequency
21882188
experimental study is of great significance to understand the propagation velocity and dispersion of acoustic waves in rocks within seismic frequency band (<100 Hz). In this paper, four different types of rocks were selected to test and study the acoustic wave velocity at seismic frequency band using low-frequency stress-strain method and it was expected to obtain the characteristics of acoustic velocities of different types of rocks at this seismic frequency band, thus providing a basis for enriching the theory of acoustic velocity at low frequency.
SampleS anD meTHoDS
EXPERIMENTAL SAMPLES
The experimental samples were collected from the roof of 3# coal seam of Shanxi Formation of the lower series of the Permian System in Sihe Coal Mine in the south of Qinshui
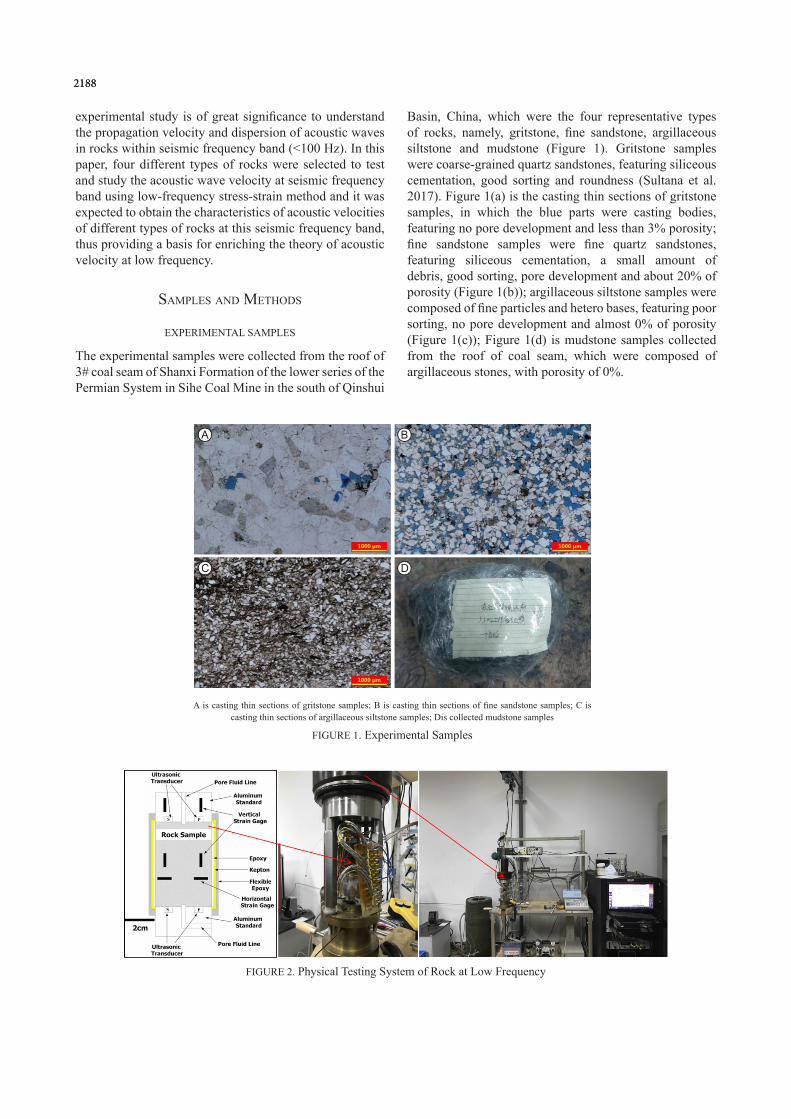
Basin, China, which were the four representative types of rocks, namely, gritstone, fine sandstone, argillaceous siltstone and mudstone (Figure 1). Gritstone samples were coarse-grained quartz sandstones, featuring siliceous cementation, good sorting and roundness (Sultana et al. 2017). Figure 1(a) is the casting thin sections of gritstone samples, in which the blue parts were casting bodies, featuring no pore development and less than 3% porosity; fine sandstone samples were fine quartz sandstones, featuring siliceous cementation, a small amount of debris, good sorting, pore development and about 20% of porosity (Figure 1(b)); argillaceous siltstone samples were composed of fine particles and hetero bases, featuring poor sorting, no pore development and almost 0% of porosity (Figure 1(c)); Figure 1(d) is mudstone samples collected from the roof of coal seam, which were composed of argillaceous stones, with porosity of 0%.
A is casting thin sections of gritstone samples; B is casting thin sections of fine sandstone samples; C is casting thin sections of argillaceous siltstone samples; Dis collected mudstone samples
FIGURE 1. Experimental Samples
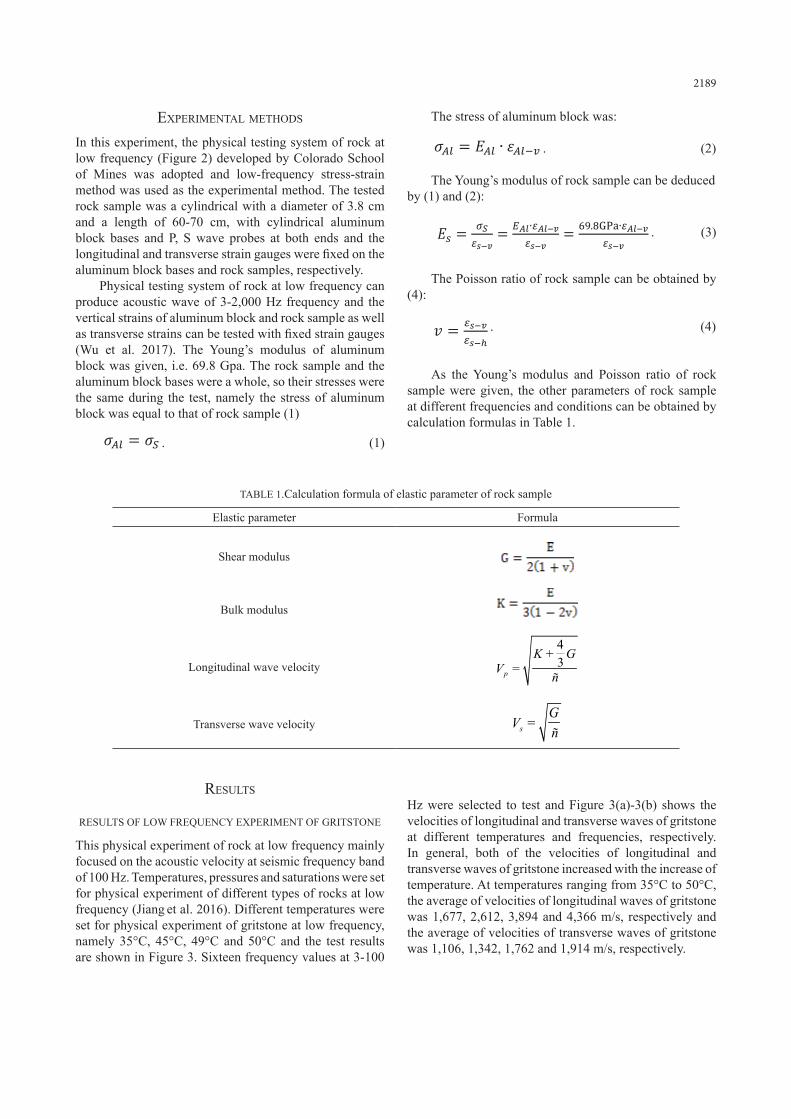
FIGURE 2. Physical Testing System of Rock at Low Frequency
2189
eXperimenTal meTHoDS
In this experiment, the physical testing system of rock at low frequency (Figure 2) developed by Colorado School of Mines was adopted and low-frequency stress-strain method was used as the experimental method. The tested rock sample was a cylindrical with a diameter of 3.8 cm and a length of 60-70 cm, with cylindrical aluminum block bases and P, S wave probes at both ends and the longitudinal and transverse strain gauges were fixed on the aluminum block bases and rock samples, respectively.
Physical testing system of rock at low frequency can produce acoustic wave of 3-2,000 Hz frequency and the vertical strains of aluminum block and rock sample as well as transverse strains can be tested with fixed strain gauges (Wu et al. 2017). The Young’s modulus of aluminum block was given, i.e. 69.8 Gpa. The rock sample and the aluminum block bases were a whole, so their stresses were the same during the test, namely the stress of aluminum block was equal to that of rock sample (1)
EXPERIMENTAL METHODS
In this experiment, the physical testing system of rock at low frequency (Figure 2) developed
by Colorado School of Mines was adopted and low-frequency stress-strain method was used as
the experimental method. The tested rock sample was a cylindrical with a diameter of 3.8 cm
and a length of 60-70 cm, with cylindrical aluminum block bases and P, S wave probes at both
ends and the longitudinal and transverse strain gauges were fixed on the aluminum block bases
and rock samples, respectively.
FIGURE 2. Physical testing system of rock at low frequency
Physical testing system of rock at low frequency can produce acoustic wave of 3-2,000 Hz
frequency and the vertical strains of aluminum block and rock sample as well as transverse
strains can be tested with fixed strain gauges (Wu et al. 2017). The Young's modulus of
aluminum block was given, i.e. 69.8 Gpa. The rock sample and the aluminum block bases were
a whole, so their stresses were the same during the test, namely the stress of aluminum block
was equal to that of rock sample (Formula 1)
(Formula 1)
The stress of aluminum block was:
(Formula 2)
The Young's modulus of rock sample can be deduced by Formulas 1 and 2:
(Formula 3)
. (1)
TABLE 1.Calculation formula of elastic parameter of rock sample
Elastic parameter Formula
Shear modulus
Bulk modulus
Longitudinal wave velocity
4+
3=p
K GV
ñ
Transverse wave velocity =s
GV
ñ
The stress of aluminum block was:
EXPERIMENTAL METHODS
In this experiment, the physical testing system of rock at low frequency (Figure 2) developed
by Colorado School of Mines was adopted and low-frequency stress-strain method was used as
the experimental method. The tested rock sample was a cylindrical with a diameter of 3.8 cm
and a length of 60-70 cm, with cylindrical aluminum block bases and P, S wave probes at both
ends and the longitudinal and transverse strain gauges were fixed on the aluminum block bases
and rock samples, respectively.
FIGURE 2. Physical testing system of rock at low frequency
Physical testing system of rock at low frequency can produce acoustic wave of 3-2,000 Hz
frequency and the vertical strains of aluminum block and rock sample as well as transverse
strains can be tested with fixed strain gauges (Wu et al. 2017). The Young's modulus of
aluminum block was given, i.e. 69.8 Gpa. The rock sample and the aluminum block bases were
a whole, so their stresses were the same during the test, namely the stress of aluminum block
was equal to that of rock sample (Formula 1)
(Formula 1)
The stress of aluminum block was:
(Formula 2)
The Young's modulus of rock sample can be deduced by Formulas 1 and 2:
(Formula 3)
. (2)
The Young’s modulus of rock sample can be deduced by (1) and (2):
EXPERIMENTAL METHODS
In this experiment, the physical testing system of rock at low frequency (Figure 2) developed
by Colorado School of Mines was adopted and low-frequency stress-strain method was used as
the experimental method. The tested rock sample was a cylindrical with a diameter of 3.8 cm
and a length of 60-70 cm, with cylindrical aluminum block bases and P, S wave probes at both
ends and the longitudinal and transverse strain gauges were fixed on the aluminum block bases
and rock samples, respectively.
FIGURE 2. Physical testing system of rock at low frequency
Physical testing system of rock at low frequency can produce acoustic wave of 3-2,000 Hz
frequency and the vertical strains of aluminum block and rock sample as well as transverse
strains can be tested with fixed strain gauges (Wu et al. 2017). The Young's modulus of
aluminum block was given, i.e. 69.8 Gpa. The rock sample and the aluminum block bases were
a whole, so their stresses were the same during the test, namely the stress of aluminum block
was equal to that of rock sample (Formula 1)
(Formula 1)
The stress of aluminum block was:
(Formula 2)
The Young's modulus of rock sample can be deduced by Formulas 1 and 2:
(Formula 3) . (3)
The Poisson ratio of rock sample can be obtained by (4): The Poisson ratio of rock sample can be obtained by Formula 4:
(Formula 4)
As the Young's modulus and Poisson ratio of rock sample were given, the other parameters
of rock sample at different frequencies and conditions can be obtained by calculation formulas
in Table 1.
TABLE 1.Calculation formula of elastic parameter of rock sample
Elastic parameter Formula
Shear modulus
Bulk modulus
Longitudinal wave velocity 4
+3=p
K GV
ρ
Transverse wave velocity =s
GV
ρ
RESULTS
RESULTS OF LOW FREQUENCY EXPERIMENT OF GRITSTONE
This physical experiment of rock at low frequency mainly focused on the acoustic velocity at
seismic frequency band of 100 Hz. Temperatures, pressures and saturations were set for
physical experiment of different types of rocks at low frequency (Jiang et al. 2016). Different
temperatures were set for physical experiment of gritstone at low frequency, namely 35℃, 45℃,
49℃ and 50℃ and the test results are shown in Figure 3. Sixteen frequency values at 3-100 Hz
were selected to test and Figure 3(a)-3(b) shows the velocities of longitudinal and transverse
waves of gritstone at different temperatures and frequencies, respectively. In general, both of
the velocities of longitudinal and transverse waves of gritstone increased with the increase of
temperature. At temperatures ranging from 35℃ to 50℃ , the average of velocities of
longitudinal waves of gritstone was 1,677, 2,612, 3,894 and 4,366 m/s, respectively and the
. (4)
As the Young’s modulus and Poisson ratio of rock sample were given, the other parameters of rock sample at different frequencies and conditions can be obtained by calculation formulas in Table 1.
reSulTS
RESULTS OF LOW FREQUENCY EXPERIMENT OF GRITSTONE
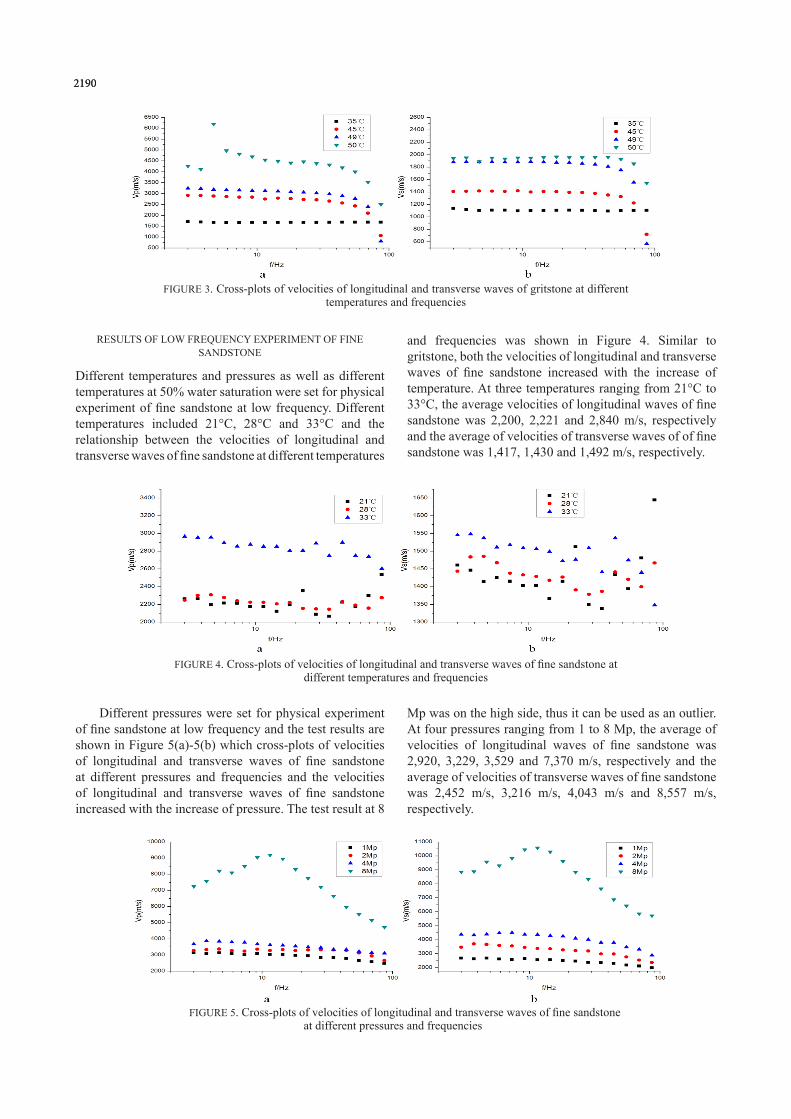
This physical experiment of rock at low frequency mainly focused on the acoustic velocity at seismic frequency band of 100 Hz. Temperatures, pressures and saturations were set for physical experiment of different types of rocks at low frequency (Jiang et al. 2016). Different temperatures were set for physical experiment of gritstone at low frequency, namely 35°C, 45°C, 49°C and 50°C and the test results are shown in Figure 3. Sixteen frequency values at 3-100
Hz were selected to test and Figure 3(a)-3(b) shows the velocities of longitudinal and transverse waves of gritstone at different temperatures and frequencies, respectively. In general, both of the velocities of longitudinal and transverse waves of gritstone increased with the increase of temperature. At temperatures ranging from 35°C to 50°C, the average of velocities of longitudinal waves of gritstone was 1,677, 2,612, 3,894 and 4,366 m/s, respectively and the average of velocities of transverse waves of gritstone was 1,106, 1,342, 1,762 and 1,914 m/s, respectively.
21902190
FIGURE 3. Cross-plots of velocities of longitudinal and transverse waves of gritstone at different temperatures and frequencies
RESULTS OF LOW FREQUENCY EXPERIMENT OF FINE SANDSTONE
Different temperatures and pressures as well as different temperatures at 50% water saturation were set for physical experiment of fine sandstone at low frequency. Different temperatures included 21°C, 28°C and 33°C and the relationship between the velocities of longitudinal and transverse waves of fine sandstone at different temperatures
FIGURE 4. Cross-plots of velocities of longitudinal and transverse waves of fine sandstone at different temperatures and frequencies
and frequencies was shown in Figure 4. Similar to gritstone, both the velocities of longitudinal and transverse waves of fine sandstone increased with the increase of temperature. At three temperatures ranging from 21°C to 33°C, the average velocities of longitudinal waves of fine sandstone was 2,200, 2,221 and 2,840 m/s, respectively and the average of velocities of transverse waves of of fine sandstone was 1,417, 1,430 and 1,492 m/s, respectively.
Different pressures were set for physical experiment of fine sandstone at low frequency and the test results are shown in Figure 5(a)-5(b) which cross-plots of velocities of longitudinal and transverse waves of fine sandstone at different pressures and frequencies and the velocities of longitudinal and transverse waves of fine sandstone increased with the increase of pressure. The test result at 8
Mp was on the high side, thus it can be used as an outlier. At four pressures ranging from 1 to 8 Mp, the average of velocities of longitudinal waves of fine sandstone was 2,920, 3,229, 3,529 and 7,370 m/s, respectively and the average of velocities of transverse waves of fine sandstone was 2,452 m/s, 3,216 m/s, 4,043 m/s and 8,557 m/s, respectively.
FIGURE 5. Cross-plots of velocities of longitudinal and transverse waves of fine sandstone at different pressures and frequencies
2191
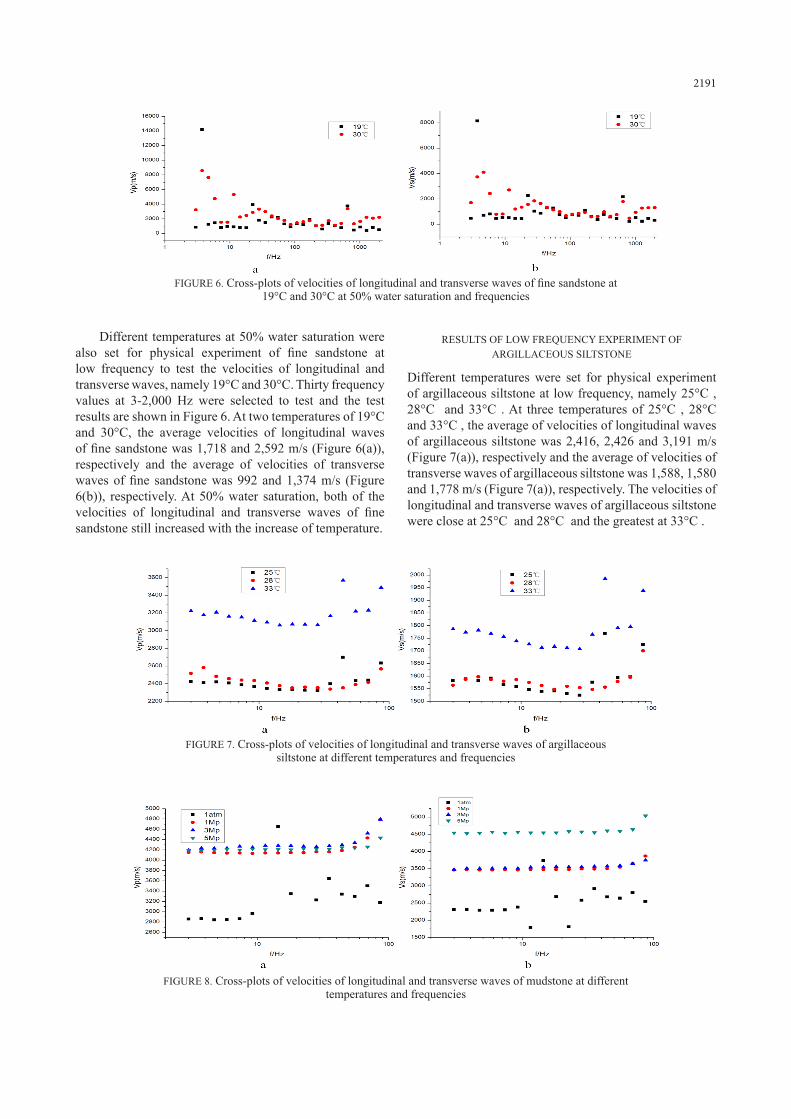
Different temperatures at 50% water saturation were also set for physical experiment of fine sandstone at low frequency to test the velocities of longitudinal and transverse waves, namely 19°C and 30°C. Thirty frequency values at 3-2,000 Hz were selected to test and the test results are shown in Figure 6. At two temperatures of 19°C and 30°C, the average velocities of longitudinal waves of fine sandstone was 1,718 and 2,592 m/s (Figure 6(a)), respectively and the average of velocities of transverse waves of fine sandstone was 992 and 1,374 m/s (Figure 6(b)), respectively. At 50% water saturation, both of the velocities of longitudinal and transverse waves of fine sandstone still increased with the increase of temperature.
FIGURE 6. Cross-plots of velocities of longitudinal and transverse waves of fine sandstone at 19°C and 30°C at 50% water saturation and frequencies
RESULTS OF LOW FREQUENCY EXPERIMENT OF ARGILLACEOUS SILTSTONE
Different temperatures were set for physical experiment of argillaceous siltstone at low frequency, namely 25°C , 28°C and 33°C . At three temperatures of 25°C , 28°C and 33°C , the average of velocities of longitudinal waves of argillaceous siltstone was 2,416, 2,426 and 3,191 m/s (Figure 7(a)), respectively and the average of velocities of transverse waves of argillaceous siltstone was 1,588, 1,580 and 1,778 m/s (Figure 7(a)), respectively. The velocities of longitudinal and transverse waves of argillaceous siltstone were close at 25°C and 28°C and the greatest at 33°C .
FIGURE 7. Cross-plots of velocities of longitudinal and transverse waves of argillaceous siltstone at different temperatures and frequencies
FIGURE 8. Cross-plots of velocities of longitudinal and transverse waves of mudstone at different temperatures and frequencies
21922192
RESULTS OF LOW FREQUENCY EXPERIMENT OF MUDSTONE
Different pressures were set for physical experiment of mudstone at low frequency, namely 1 atm, 1, 3 and 5 Mp. The velocity of longitudinal wave is shown in Figure 8(a), which was small at 1 atm and its average was 3,119 m/s. At three pressures of 1, 3 and 5 Mp, the average of velocities of longitudinal waves of mudstone was 4,214, 4,312 and 4,228 m/s (Figure 8(a)), respectively. In general, the velocity of longitudinal wave of mudstone increased with the increase of pressure, and slightly smaller at 5 Mp than at other pressures. The velocity of transverse wave of mudstone is shown in Figure 8(b), which increased with the increase of pressure. At four pressures of 1 atm and 1 Mp, 3 Mp and 5 Mp, the average of velocities of transverse waves of mudstone was 2,502, 3,514, 3,555 and 4,592 m/s, respectively.
DiScuSSion
The acoustic velocities of four different types of rocks within 100 Hz were obtained using low-frequency stress-strain method, for each type of rock, the velocities of longitudinal and transverse waves showed great differences, while having certain rules. In this study, temperatures, pressures and saturations were set to analyze the acoustic velocities of four different types of rocks within 100 Hz. Temperature had an obvious influence rule on acoustic velocities at low frequency, as the experimental results of gritstone, fine sandstone, argillaceous siltstone showed that the velocities of their longitudinal and transverse waves increased with the increase of temperature, which also increased with the increase of temperature at 50% water saturation.
Pressure also had a certain influence on acoustic velocities at low frequency. Mavko et al. (1998) discussed the influence of pressure and rock fracture change on the velocities of longitudinal and transverse waves. Wei et al. (2015a) concluded that the velocity of longitudinal wave of tight sandstone increased with the increase of pressure through low frequency experiment which was consistent with the influence of pressure on acoustic velocity obtained in this low frequency experiment. The results of physical experiments of fine sandstone and mudstone at low frequency at different pressures showed that the velocities of longitudinal and transverse waves of fine sandstone and mudstone increased with the increase of confining pressure.
The physical experiment of fine sandstone at low frequency was conducted to test the acoustic velocity at low frequency, the velocities of longitudinal and transverse waves of fine sandstone at 50% water saturation decreased compared with those of dry sample. Murphy (1984) tested the acoustic velocity of tight sandstone at certain saturation, and the results showed that the acoustic velocity at 5 kHz was 10-25% smaller than that at 500 kHz. Wei et al. (2015a) tested the acoustic velocities of tight sandstone at different saturations at 796 Hz, 1,558 Hz and
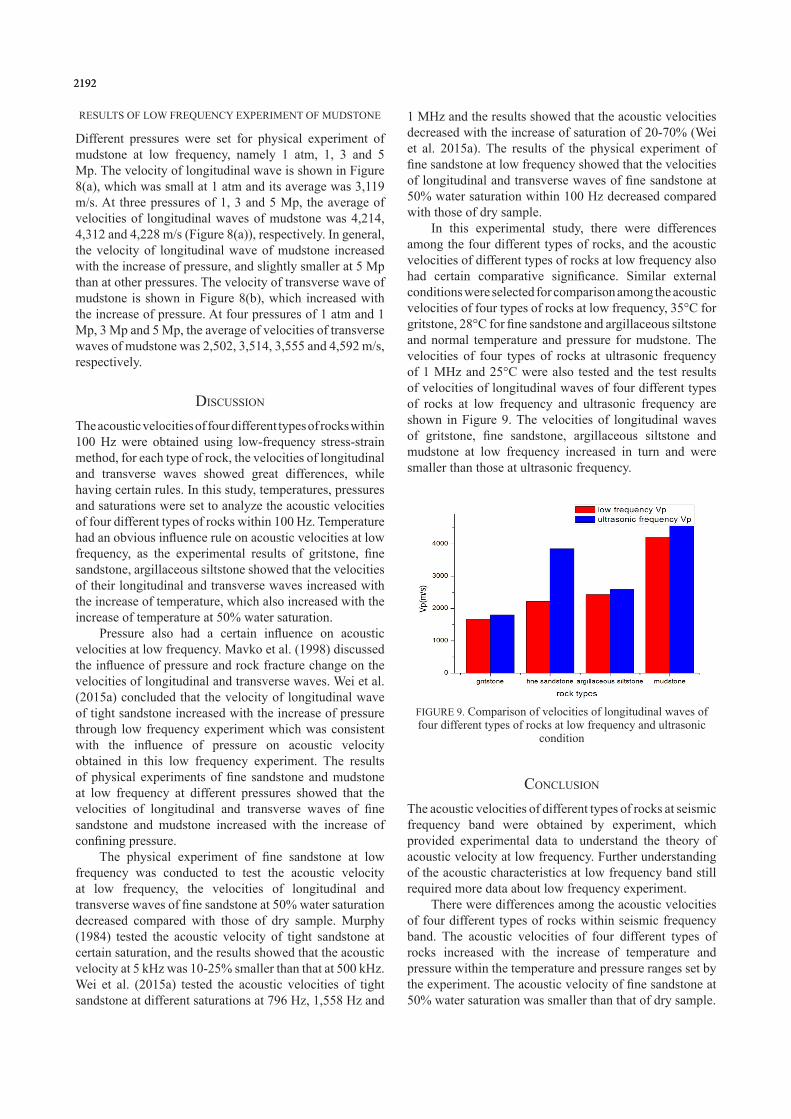
FIGURE 9. Comparison of velocities of longitudinal waves of four different types of rocks at low frequency and ultrasonic
condition
1 MHz and the results showed that the acoustic velocities decreased with the increase of saturation of 20-70% (Wei et al. 2015a). The results of the physical experiment of fine sandstone at low frequency showed that the velocities of longitudinal and transverse waves of fine sandstone at 50% water saturation within 100 Hz decreased compared with those of dry sample.
In this experimental study, there were differences among the four different types of rocks, and the acoustic velocities of different types of rocks at low frequency also had certain comparative significance. Similar external conditions were selected for comparison among the acoustic velocities of four types of rocks at low frequency, 35°C for gritstone, 28°C for fine sandstone and argillaceous siltstone and normal temperature and pressure for mudstone. The velocities of four types of rocks at ultrasonic frequency of 1 MHz and 25°C were also tested and the test results of velocities of longitudinal waves of four different types of rocks at low frequency and ultrasonic frequency are shown in Figure 9. The velocities of longitudinal waves of gritstone, fine sandstone, argillaceous siltstone and mudstone at low frequency increased in turn and were smaller than those at ultrasonic frequency.
concluSion
The acoustic velocities of different types of rocks at seismic frequency band were obtained by experiment, which provided experimental data to understand the theory of acoustic velocity at low frequency. Further understanding of the acoustic characteristics at low frequency band still required more data about low frequency experiment.
There were differences among the acoustic velocities of four different types of rocks within seismic frequency band. The acoustic velocities of four different types of rocks increased with the increase of temperature and pressure within the temperature and pressure ranges set by the experiment. The acoustic velocity of fine sandstone at 50% water saturation was smaller than that of dry sample.
2193
There were differences among the acoustic velocities of four different types of rocks. The velocities of longitudinal waves of gritstone, fine sandstone, argillaceous siltstone and mudstone increased in turn under similar conditions, and were smaller than those at ultrasonic frequency.
ACKNOWLEDGEMENTS
The project was financially supported by Open-end Fund of State Key Laboratory of Water Resource Protection and Utilization in Coal Mining (SHJT-16-30.1), Certificate of China Postdoctoral Science Foundation (2016M591286), National Natural Science Foundation of China (41602168) and Project of China Geological Survey (12120115102101).
REFERENCES
Ba, J. 2010. Wave propagation theory in double-porosity medium and experimental analysis on seismic responses. Scientia Sinica (Physica, Mechanica & Astronomica) 40(11): 1398-1409.
Batzle, M.L., Han, D.H. & Hofmann, R. 2006. Fluid mobility and frequency-dependent seismic velocity-direct measurements. Geophysics 71(1): N1-N9.
Biot, M.A. 1956. Theory of propagation of elastic waves in a fluid-saturated porous solid. I. Low-frequency range. The Journal of the Acoustical Society of America 28(2): 168-178.
Jiang, L., Yue, K., Yang, Y. & Wu, Q. 2016. Leaching and freeze-thaw events contribute to litter decomposition - A review. Sains Malaysiana 45(7): 1041-1047.
Mavko, G., Mukerji, T. & Dvorkin, J. 2012. The Rock Physics Handbook, 2nd ed. Cambridge: Cambridge University Press. pp. 310-311.
Mavko, G., Mukerji, T. & Dvorkin, J. 1998. The Rock Physics Handbook: Tools for Seismic Analysis in Porous Media. Cambridge: Cambridge University Press. pp. 102-112.
Müller, M.T., Gurevich, B. & Lebedev, M. 2010. Seismic wave attenuation and dispersion resulting from wave-induced flow in porous rocks - A review. Geophysics 75(5): A147-A164.
Murphy III, W.F. 1984. Acoustic measures of partical gas saturation in tight sandstones. Journal of Geophysical Research 89(B13): 11549-11559
Sultana, M.N., Akib, S. & Ashraf, M.A. 2017. Thermal comfort and runoff water quality performance on green roofs in tropical conditions. Geology, Ecology, and Landscapes 1(1): 47-55.
Tutuncu, A.N., Gregory, A.R., Sharma, M.M. & Podio, A.L. 1998. Nonlinear viscoelastic behavior of sedimentary rocks, Part 1: Effect of frequency and strain amplitude. Geophysics 63(1): 184-194.
Wang, S.X., Zhao, J.G., Harris, J.M. & Quan, Y. 2012. Differential acoustic resonance spectroscopy for the acoustic measurement of small and irregular samples in the low frequency range. Journal of Geophysical Research Atmospheres 117(B6): doi.10.1029/2011JB00880.
Wei, X., Wang, S.X., Zhao, J.G. & Deng, J.X. 2015a. Laboratory investigation of influence factors on Vp and Vs in tigth sandstone. Geophysical Prospecting for Petroleum 54(1): 9-16.
Wei, X., Wang, S.X., Zhao, J.G., Tang, G.Y. & Deng, J.X. 2015b. Laboratory study of velocity of the seismic wave in fluid-saturated sandstones. Chinese J. Geophys. 58(9): 330-338.
White, J.E. 1975. Computed seismic speeds and attenuation in rocks with partial gas saturation. Geophysics 40(2): 224-232.
Wu, H., Zhao, B. & Gao, W. 2017. Analysis of gradient descent ontology iterative algorithm for geological setting. Geology, Ecology, and Landscapes 1(1): 41-46.
Yunlan He*State Key Laboratory of Water Resource Protection and Utilization in Coal MiningBeijing 100011China
Yunlan He*, Suping Peng, Wenfeng Du, Xiaoming Tang & Zeng HuState Key Laboratory of Coal Resources and Safety MiningChina University of Mining & Technology (Beijing) Beijing 100083China
*Corresponding author; email: [email protected]
Received: 22 January 2017Accepted: 30 May 2017