Embed Size (px)
Citation preview

Labour market analysis: Wages (structure, trends, thematic areas and relation to other major issues
including decent work indicators)Monica D. Castillo
Chief Decent Work Data Production UnitChief, Decent Work Data Production UnitILO Department of Statistics – Geneva
National Labour Market Information Training Programme Port of Spain, Trinidad and Tobago
31 October – 11 November 2011
ILO Department of Statistics
Contents
R ti l d t t• Rationale and context• Use of current and structural wages statistics• Wage and related indicators in the Decent Work
Indicator Framework • Productivity and wages• ILO Global Wage Report: Key Findings • ILO Global Wage Report: Key Findings
ILO Department of Statistics
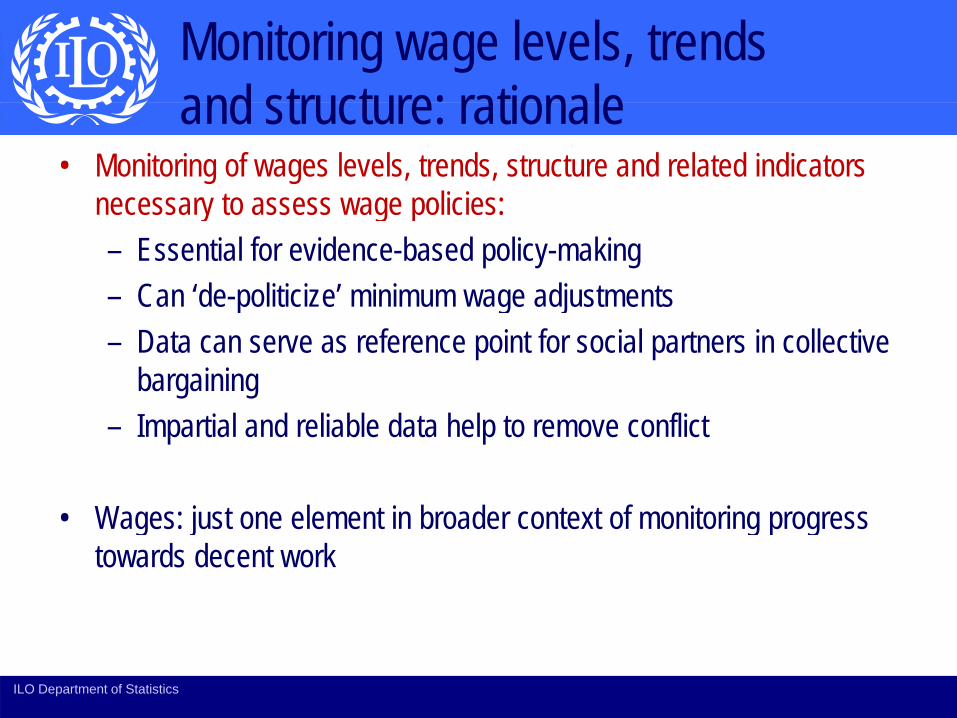
Monitoring wage levels, trends and structure: rationale and structure: rationale
• Monitoring of wages levels, trends, structure and related indicators necessary to assess wage policies:necessary to assess wage policies:– Essential for evidence-based policy-making– Can ‘de-politicize’ minimum wage adjustmentsp g j– Data can serve as reference point for social partners in collective
bargaining– Impartial and reliable data help to remove conflict
Wages: just one element in broader context of monitoring progress • Wages: just one element in broader context of monitoring progress towards decent work
ILO Department of Statistics
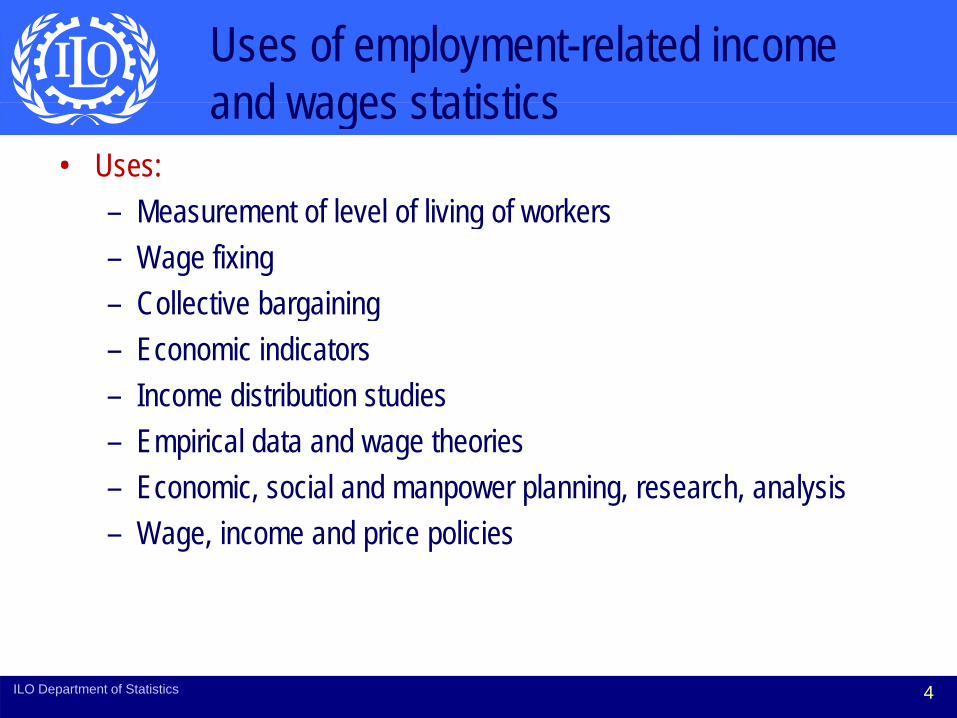
Uses of employment-related income and wages statisticsand wages statistics
• Uses:M t f l l f li i f k– Measurement of level of living of workers
– Wage fixing– Collective bargainingCollective bargaining– Economic indicators– Income distribution studies– Empirical data and wage theories– Economic, social and manpower planning, research, analysis– Wage, income and price policies
4ILO Department of Statistics
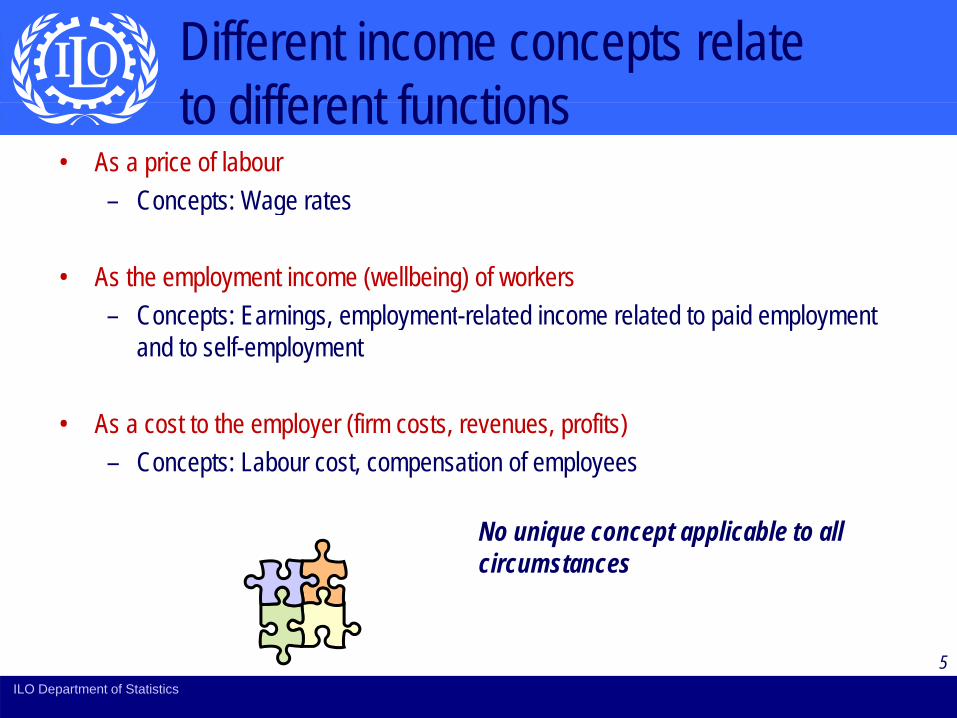
Different income concepts relate to different functionsto different functions
• As a price of labour– Concepts: Wage ratesConcepts: Wage rates
• As the employment income (wellbeing) of workersC t E i l t l t d i l t d t id l t – Concepts: Earnings, employment-related income related to paid employment and to self-employment
• As a cost to the employer (firm costs, revenues, profits)– Concepts: Labour cost, compensation of employees
No unique concept applicable to all circumstances
5ILO Department of Statistics
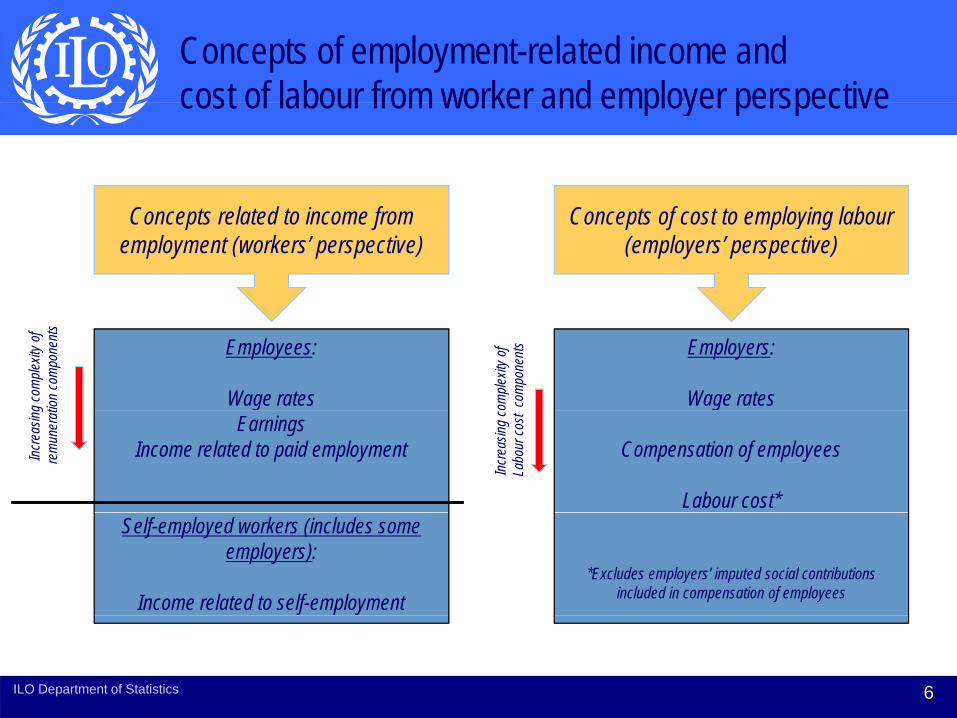
Concepts of employment-related income and cost of labour from worker and employer perspectivecost of labour from worker and employer perspective
Concepts related to income from employment (workers’ perspective)
Concepts of cost to employing labour(employers’ perspective)
Employees:
Wage ratesg co
mple
xity o
f tio
n co
mpo
nent
s
Employers:
Wage ratesomple
xity o
f co
mpo
nent
s
EarningsIncome related to paid employmentIn
crea
sing
rem
uner
at
Compensation of employees
Labour cost*In
crea
sing
cLa
bour
cost
Self-employed workers (includes some
employers):
Income related to self-employment*Excludes employers’ imputed social contributions
included in compensation of employees
6ILO Department of Statistics
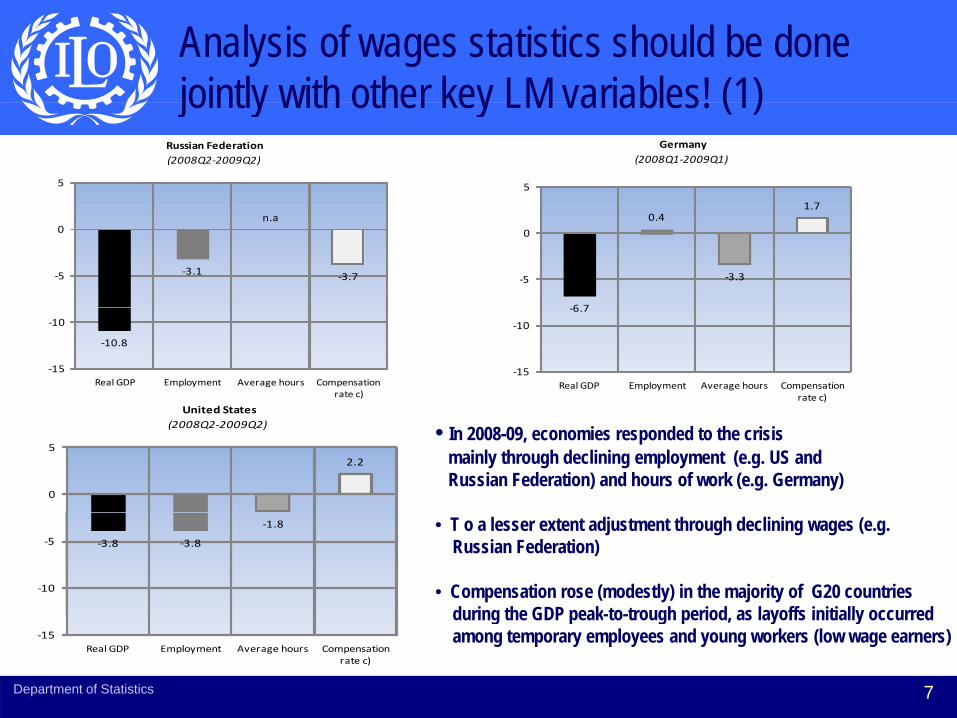
Analysis of wages statistics should be done jointly with other key LM variables! (1)jointly with other key LM variables! (1)
Russian Federation(2008Q2‐2009Q2)
5
Germany(2008Q1‐2009Q1)
1 7
5
‐3.1
n.a
‐3.7‐5
0
6 7
0.4
‐3.3
1.7
‐5
0
‐10.8
‐15
‐10
Real GDP Employment Average hours Compensation rate c)
‐6.7
‐15
‐10
Real GDP Employment Average hours Compensation rate c)
United StatesUnited States(2008Q2‐2009Q2)
2.2
0
5• In 2008-09, economies responded to the crisis
mainly through declining employment (e.g. US and Russian Federation) and hours of work (e.g. Germany)
‐3.8 ‐3.8
‐1.8
‐10
‐5• T o a lesser extent adjustment through declining wages (e.g.
Russian Federation)
• Compensation rose (modestly) in the majority of G20 countries during the GDP peak-to-trough period as layoffs initially occurred
Department of Statistics 7
‐15Real GDP Employment Average hours Compensation
rate c)
during the GDP peak-to-trough period, as layoffs initially occurred among temporary employees and young workers (low wage earners)
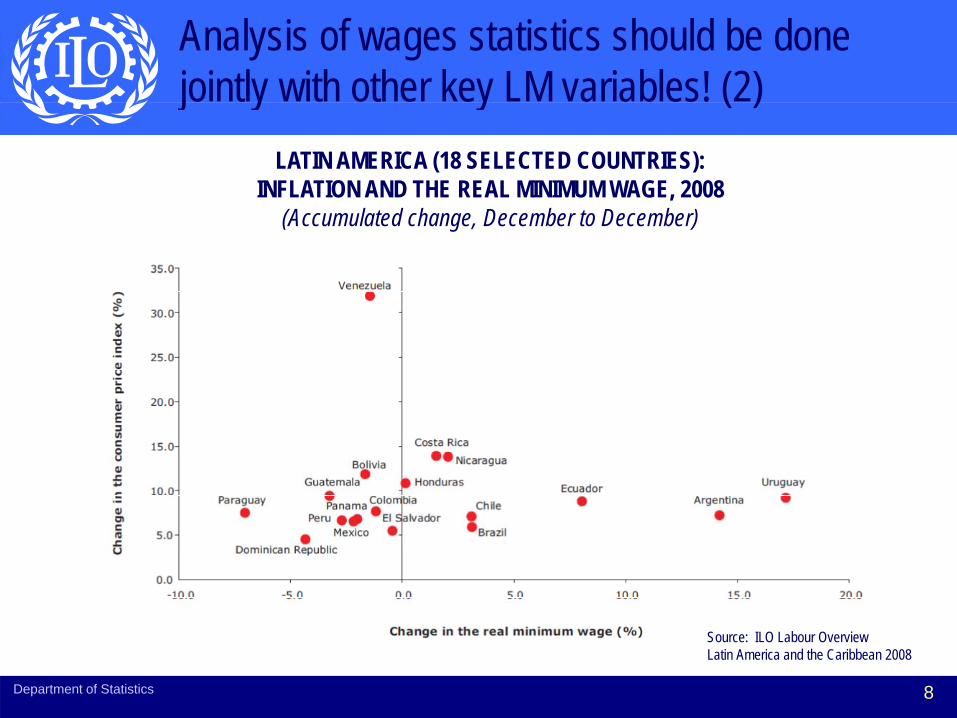
Analysis of wages statistics should be done jointly with other key LM variables! (2)j y y ( )
LATIN AMERICA (18 SELECTED COUNTRIES):INFLATION AND THE REAL MINIMUM WAGE, 2008
(Accumulated change, December to December)
Department of Statistics 8
Source: ILO Labour Overview Latin America and the Caribbean 2008
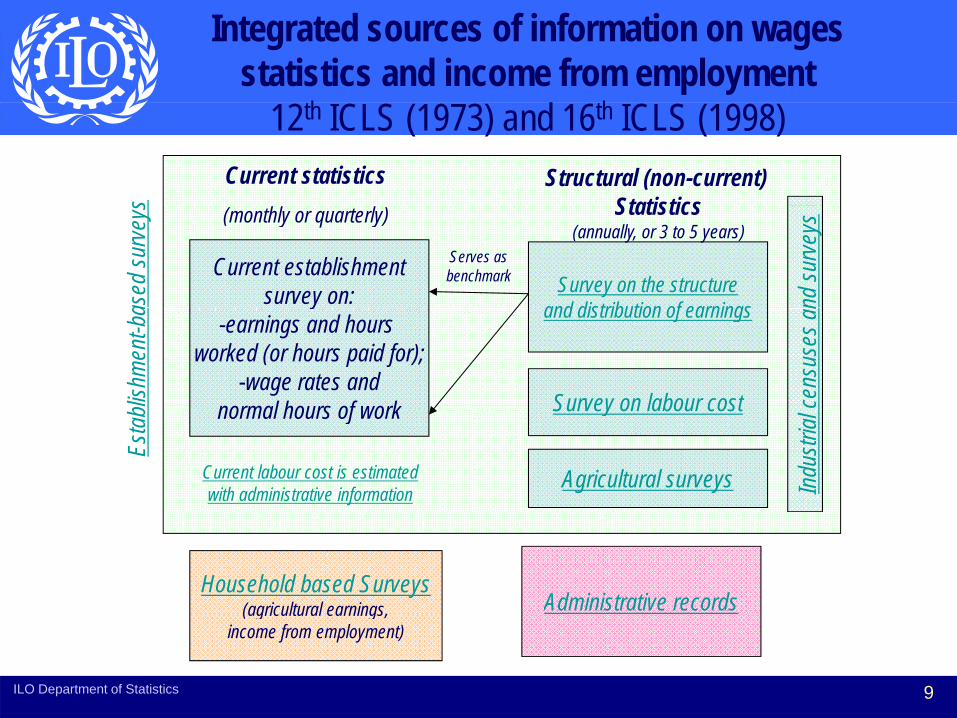
Integrated sources of information on wages statistics and income from employment
th th12th ICLS (1973) and 16th ICLS (1998)Current statistics Structural (non-current)
Statisticss
Current establishmentsurvey on: Survey on the structure
and distribution of earnings
(monthly or quarterly) Statistics(annually, or 3 to 5 years)
Serves as benchmark
ased
surv
eys
nd su
rvey
s
y-earnings and hours
worked (or hours paid for);-wage rates and
normal hours of work
and distribution of earnings
Survey on labour costblish
men
t-ba
cens
uses
an
normal hours of work Survey on labour cost
Agricultural surveysCurrent labour cost is estimated with administrative information
Esta
b
Indu
strial
Household based Surveys(agricultural earnings, Administrative records
9
(agricultural earnings,income from employment)
ILO Department of Statistics
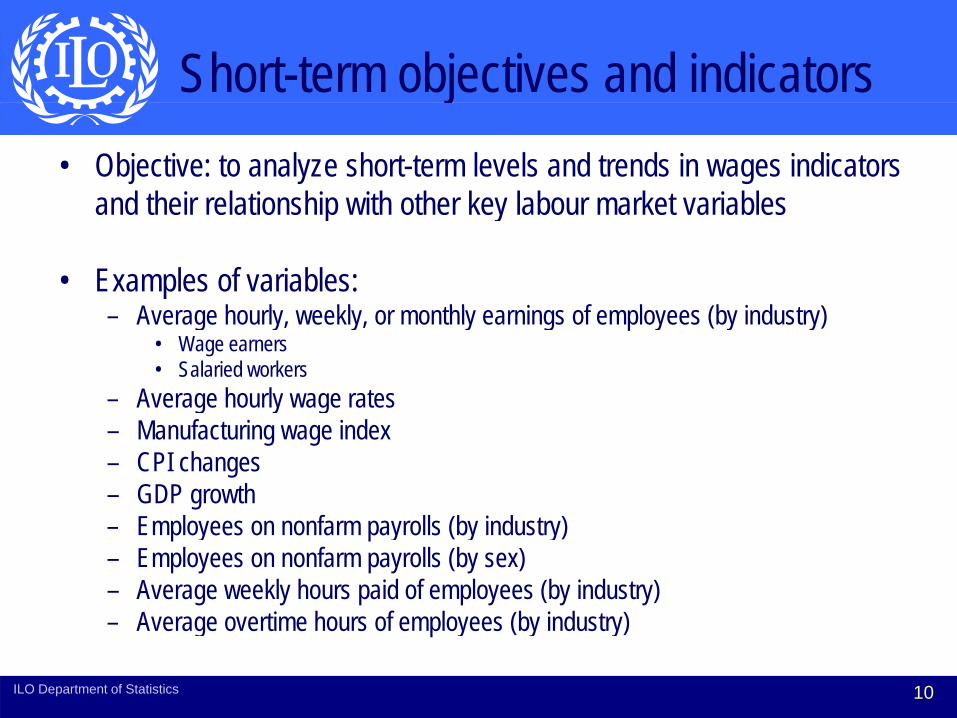
Short-term objectives and indicatorsj• Objective: to analyze short-term levels and trends in wages indicators
and their relationship with other key labour market variablesand their relationship with other key labour market variables
• Examples of variables:A h l kl thl i f l (b i d t )– Average hourly, weekly, or monthly earnings of employees (by industry)
• Wage earners• Salaried workers
– Average hourly wage ratesg y g– Manufacturing wage index– CPI changes– GDP growth– Employees on nonfarm payrolls (by industry) – Employees on nonfarm payrolls (by sex)– Average weekly hours paid of employees (by industry)
A ti h f l (b i d t )– Average overtime hours of employees (by industry)
10ILO Department of Statistics
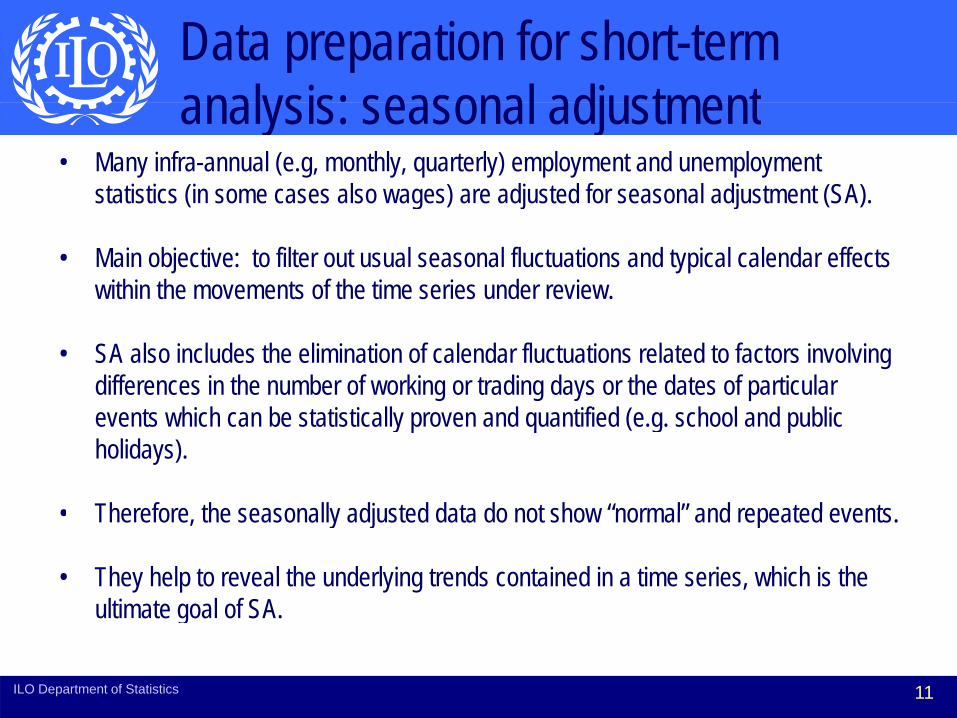
Data preparation for short-term analysis: seasonal adjustmentanalysis: seasonal adjustment
• Many infra-annual (e.g, monthly, quarterly) employment and unemployment statistics (in some cases also wages) are adjusted for seasonal adjustment (SA).( g ) j j ( )
• Main objective: to filter out usual seasonal fluctuations and typical calendar effects within the movements of the time series under review.
• SA also includes the elimination of calendar fluctuations related to factors involving differences in the number of working or trading days or the dates of particular
t hi h b t ti ti ll d tifi d ( h l d bli events which can be statistically proven and quantified (e.g. school and public holidays).
• Therefore the seasonally adjusted data do not show “normal” and repeated events• Therefore, the seasonally adjusted data do not show normal and repeated events.
• They help to reveal the underlying trends contained in a time series, which is the ultimate goal of SAultimate goal of SA.
11ILO Department of Statistics
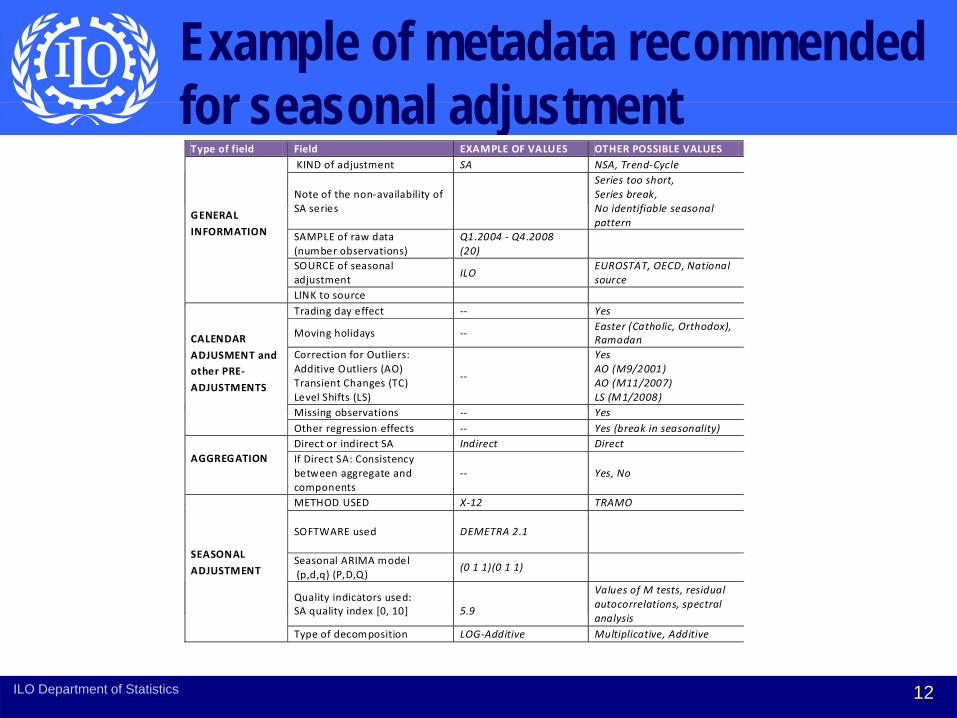
Example of metadata recommended for seasonal adjustment for seasonal adjustment
Type of field Field EXAMPLE OF VALUES OTHER POSSIBLE VALUES KIND of adjustment SA NSA, Trend‐Cycle
Note of the non‐availability of SA i
Series too short, Series break, N id ifi bl l
GENERAL
INFORMATION
SA series No identifiable seasonal pattern
SAMPLE of raw data (number observations)
Q1.2004 ‐ Q4.2008 (20)
SOURCE of seasonal adjustment
ILO EUROSTAT, OECD, National source
LINK to source T di d ff Y
CALENDAR
ADJUSMENT and other PRE‐
ADJUSTMENTS
Trading day effect ‐‐ Yes
Moving holidays ‐‐ Easter (Catholic, Orthodox), Ramadan
Correction for Outliers: Additive Outliers (AO) Transient Changes (TC) Level Shifts (LS)
‐‐
Yes AO (M9/2001) AO (M11/2007) LS (M1/2008)
Mi i b ti YMissing observations ‐‐ Yes Other regression effects ‐‐ Yes (break in seasonality)
AGGREGATION
Direct or indirect SA Indirect Direct If Direct SA: Consistency between aggregate and components
‐‐ Yes, No
METHOD USED X‐12 TRAMO
SEASONAL
ADJUSTMENT
SOFTWARE used DEMETRA 2.1
Seasonal ARIMA model (p,d,q) (P,D,Q)
(0 1 1)(0 1 1)
Quality indicators used: SA quality index [0, 10]
5.9
Values of M tests, residual autocorrelations, spectral
l i
12
q y [ , ]analysis
Type of decomposition LOG‐Additive Multiplicative, Additive
ILO Department of Statistics
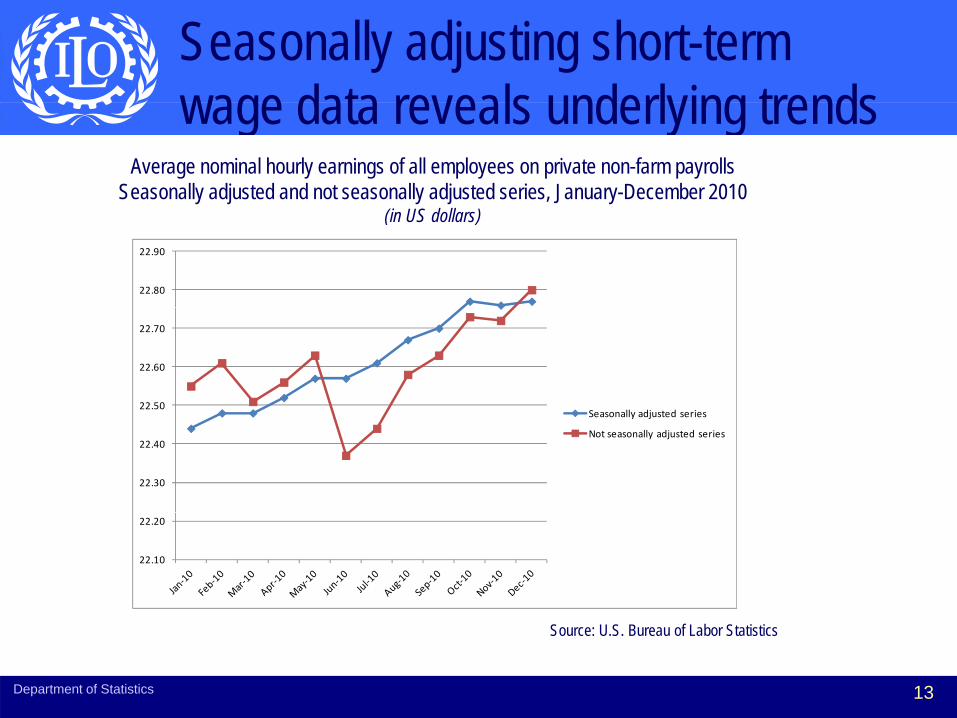
Seasonally adjusting short-termwage data reveals underlying trendswage data reveals underlying trends
Average nominal hourly earnings of all employees on private non-farm payrollsSeasonally adjusted and not seasonally adjusted series, January-December 2010
22.80
22.90
(in US dollars)
22.50
22.60
22.70
S ll dj d i
22.30
22.40
Seasonally adjusted series
Not seasonally adjusted series
22.10
22.20
Department of Statistics 13
Source: U.S. Bureau of Labor Statistics
Data preparation for short-term analysis: real wagesanalysis: real wages
• Real wages: the goods and services which can be purchased with wages or are provided as wages (Resolution concerning the wages or are provided as wages (Resolution concerning the international comparison of real wages adopted by the Eighth ICLS (1954)
• Comparisons of the movement of real wages over time in a country indicate a measure of the material progress of wage and salary earners of the material progress of wage and salary earners
• Workers seek to protect the purchasing power of wages, especially at times of high inflation
• Money wages are linked to CPI and by compensating for differences in living costs over • Money wages are linked to CPI and by compensating for differences in living costs over time & between places
• Real wage index numbers are valuable in establishing relationships between wages and other economic variables e g employment GDP income & consumptionand other economic variables, e.g. employment, GDP, income, & consumption.
Department of Statistics 14

Calculating real wages or earningsg g g• To transform a nominal wage rate or earnings series into real terms, two things are needed:
– the nominal wage rate estimate (or earnings estimate) and g ( g )– an appropriate price index (usually the Consumer Price Index (CPI).
• The CPI measures the value of a basket of consumer goods over a certain time period, relative to the value of the same basket in a base period.
• The CPI is set equal to 100 in a given base year for convenience and reference. • To use the CPI to deflate a nominal wage or earnings series, the index must be divided by
100 (d i l f ) 100 (decimal form). • The formula for obtaining a real series is given by dividing nominal values by the price index
(decimal form) for that same time period:
15ILO Department of Statistics
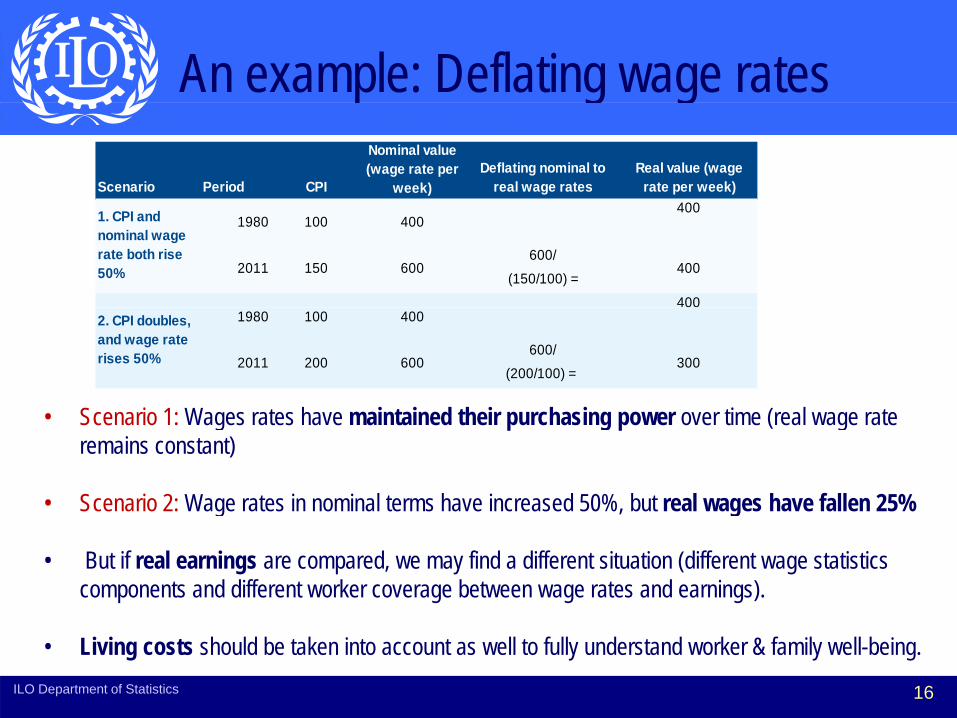
An example: Deflating wage ratesp g g
Scenario Period CPI
Nominal value (wage rate per
week)Deflating nominal to
real wage ratesReal value (wage
rate per week)400
1980 100 400 400
600/
(150/100) =
400
400
1. CPI and nominal wage rate both rise 50% 2011 150 600
S i 1 W t h i t i d th i h i ti ( l t
1980 100 400
600/(200/100) =
2. CPI doubles, and wage rate rises 50% 2011 200 600 300
• Scenario 1: Wages rates have maintained their purchasing power over time (real wage rate remains constant)
• Scenario 2: Wage rates in nominal terms have increased 50%, but real wages have fallen 25%g , g
• But if real earnings are compared, we may find a different situation (different wage statistics components and different worker coverage between wage rates and earnings).
16
• Living costs should be taken into account as well to fully understand worker & family well-being. ILO Department of Statistics
Wage Indices (1)g ( )• Index numbers of wages are the devices by which the short-term
trends or changes in the level of wages are measured and they are trends or changes in the level of wages are measured, and they are useful for the study of:– seasonal variations, ,– business cycles, – wage drifts, etc.
• Different methods of calculation (depends on scope, objective)F i ( A i l i d i ) – For separate wage series (e.g. A particular industry, occupation): simplest method
– Wages in general: more complexWages in general: more complex
17ILO Department of Statistics
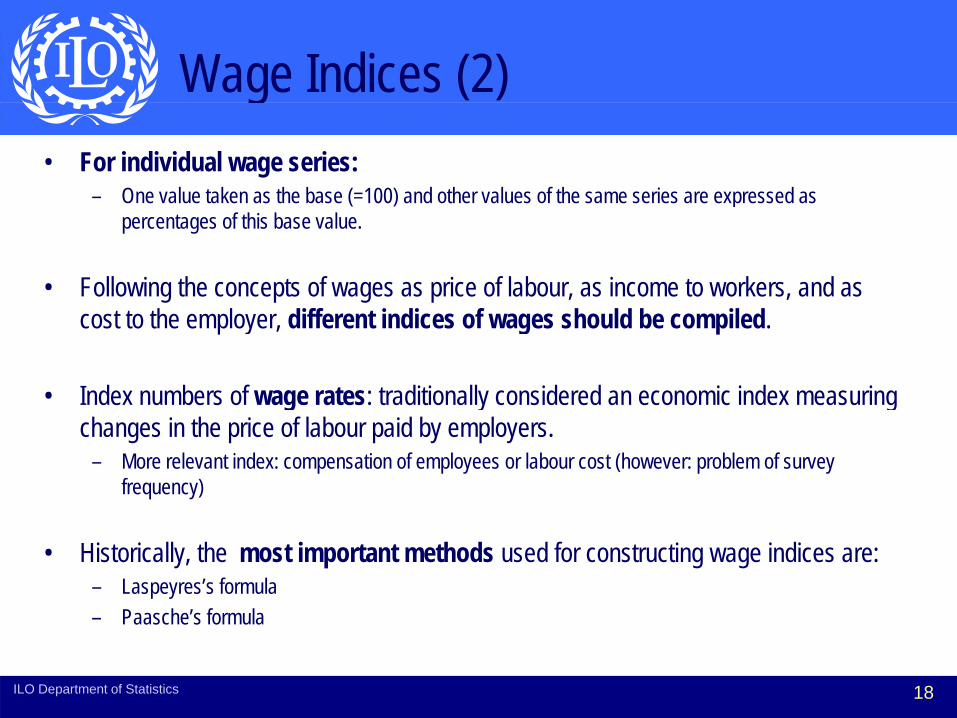
Wage Indices (2)g ( )• For individual wage series:
– One value taken as the base (=100) and other values of the same series are expressed as ( ) ppercentages of this base value.
• Following the concepts of wages as price of labour, as income to workers, and as cost to the employer, different indices of wages should be compiled.
• Index numbers of wage rates: traditionally considered an economic index measuring g y gchanges in the price of labour paid by employers.
– More relevant index: compensation of employees or labour cost (however: problem of survey frequency)
• Historically, the most important methods used for constructing wage indices are:– Laspeyres’s formula
Paasche’s formula– Paasche s formula
18ILO Department of Statistics

Issues in constructing wage indicesg g
• Issues:
– Clear statement of the purpose for which the index is d i ddesigned
– Definition of the scope of the index– Choice of data and selection of sources of dataChoice of data and selection of sources of data– System of weighting and method of combining data
(choice of formula)( )– Choice of the base period
Department of Statistics 19
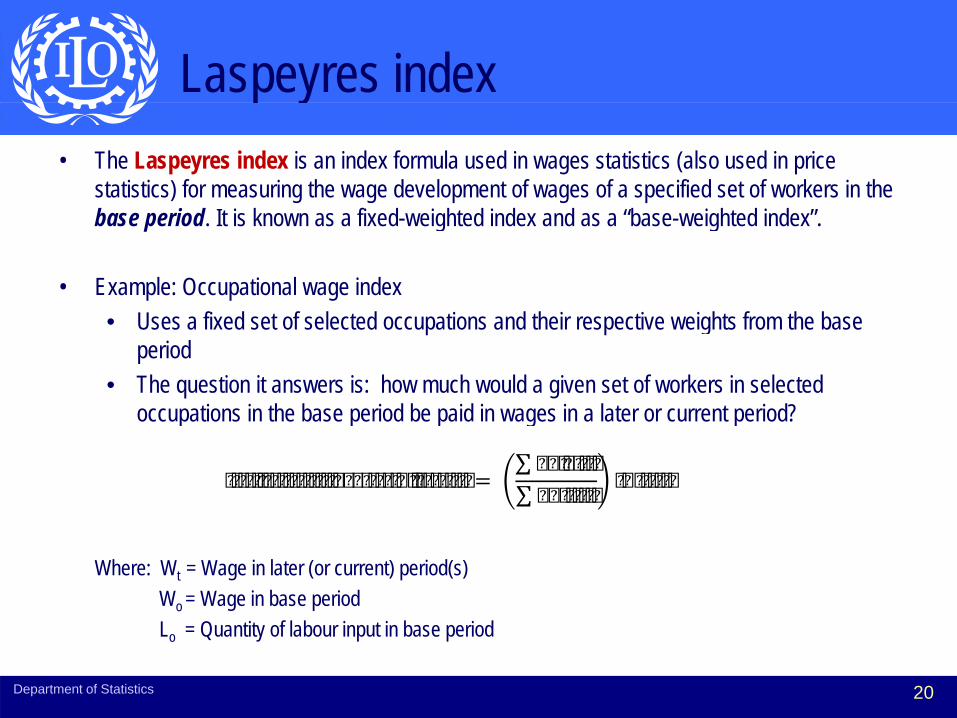
Laspeyres indexp y• The Laspeyres index is an index formula used in wages statistics (also used in price
statistics) for measuring the wage development of wages of a specified set of workers in the base period. It is known as a fixed-weighted index and as a “base-weighted index”.
• Example: Occupational wage index• Uses a fixed set of selected occupations and their respective weights from the base
period • The question it answers is: how much would a given set of workers in selected
occupations in the base period be paid in wages in a later or current period?occupations in the base period be paid in wages in a later or current period?
∑∑
Where: Wt = Wage in later (or current) period(s)Wo = Wage in base periodLo = Quantity of labour input in base period
Department of Statistics 20
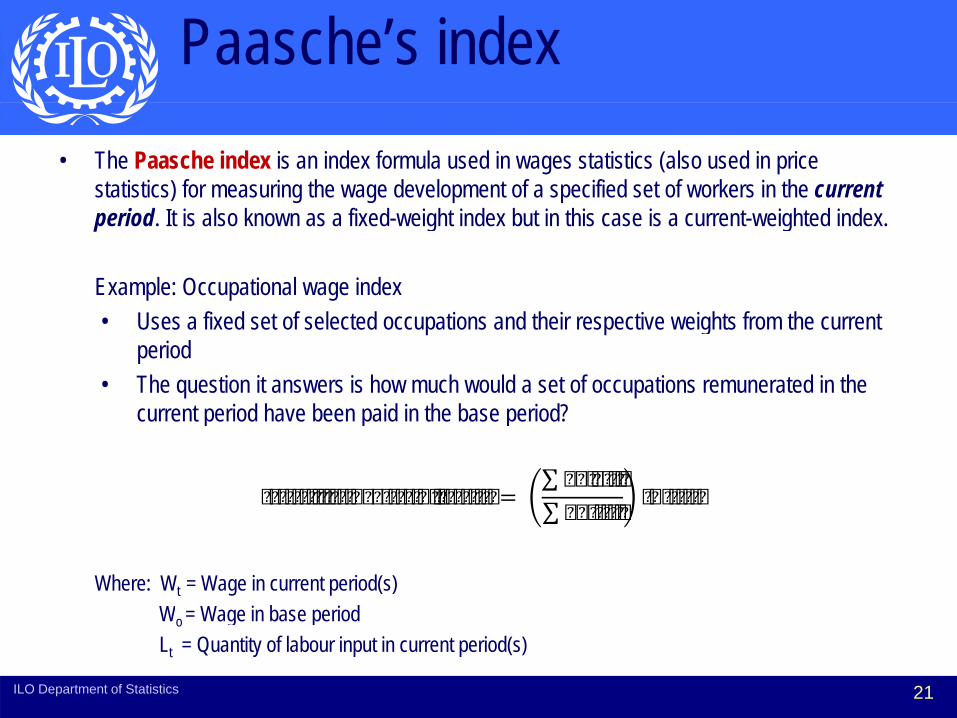
Paasche’s index• The Paasche index is an index formula used in wages statistics (also used in price
statistics) for measuring the wage development of a specified set of workers in the currentperiod. It is also known as a fixed-weight index but in this case is a current-weighted index.
Example: Occupational wage index• Uses a fixed set of selected occupations and their respective weights from the current
period• The question it answers is how much would a set of occupations remunerated in the
current period have been paid in the base period? current period have been paid in the base period?
∑ ∑
Where: Wt = Wage in current period(s)W = Wage in base period
∑
21
Wo = Wage in base periodLt = Quantity of labour input in current period(s)
ILO Department of Statistics
Examples using consumer pricesp g p
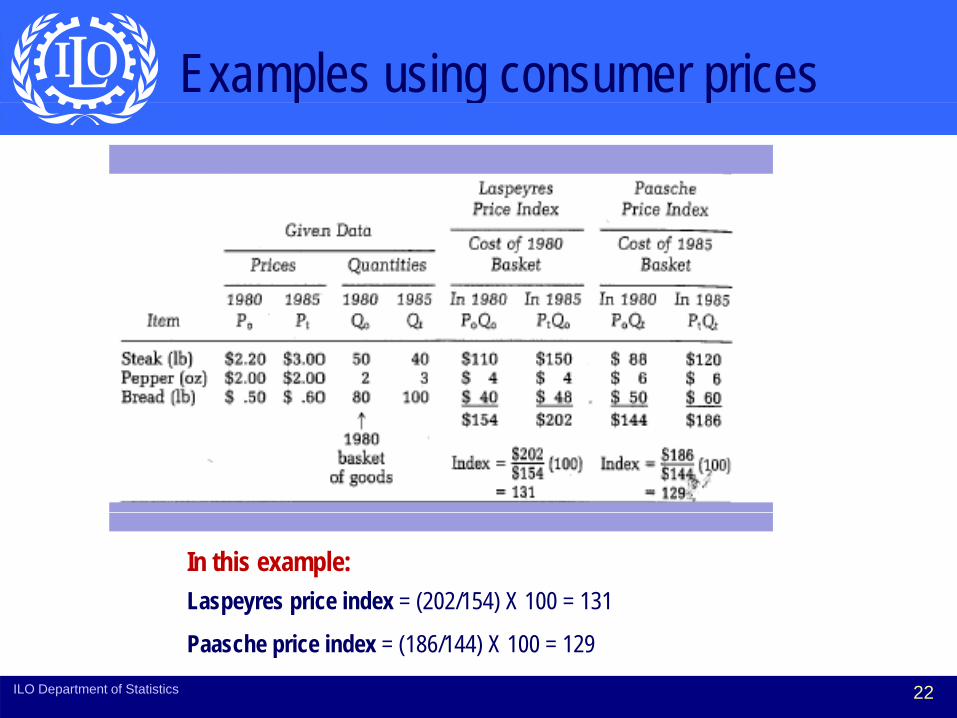
In this example:Laspeyres price index = (202/154) X 100 = 131
22
Paasche price index = (186/144) X 100 = 129ILO Department of Statistics
Structural analysis: wage structure, wage differentials etcwage differentials, etc.
• Wage structure and distribution surveys provide detailed information on level, differentials, distribution and trends of wages
• Studies of trends in wage distribution typically decompose changes in inequality into changes in earnings differences between certain skill groups (e.g. levels of education) and changes in the dispersion within these groups.W t t l i ill f diff i t t l i th f • Wage structure analysis will focus on differences in wage rates, not only in the wages for different categories (e.g. occupations) but also in the wages for the same category (e.g. occupation).
• Wage differentials can be grouped to facilitate analysis for example :• Wage differentials can be grouped to facilitate analysis, for example :– By occupational/educational (skill) level– By industry– By occupation and industry– By occupation and industry– By geographical area (e.g rural, urban)– By sex and age (jointly or separately)
By race/ethnic group and age (jointly or separately)– By race/ethnic group and age (jointly or separately)– By union/non-union wage differentials
23ILO Department of Statistics
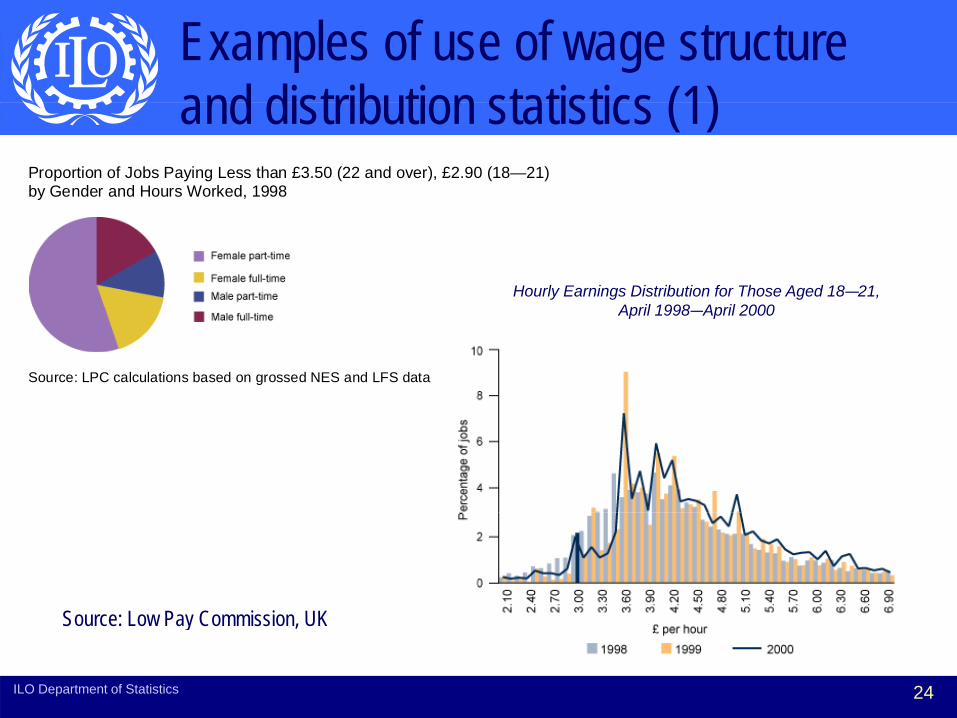
Examples of use of wage structure and distribution statistics (1)and distribution statistics (1)
Proportion of Jobs Paying Less than £3.50 (22 and over), £2.90 (18—21) by Gender and Hours Worked, 1998
Hourly Earnings Distribution for Those Aged 18—21, April 1998 April 2000
Source: LPC calculations based on grossed NES and LFS data
April 1998—April 2000
Source: Low Pay Commission UK
24
Source: Low Pay Commission, UK
ILO Department of Statistics
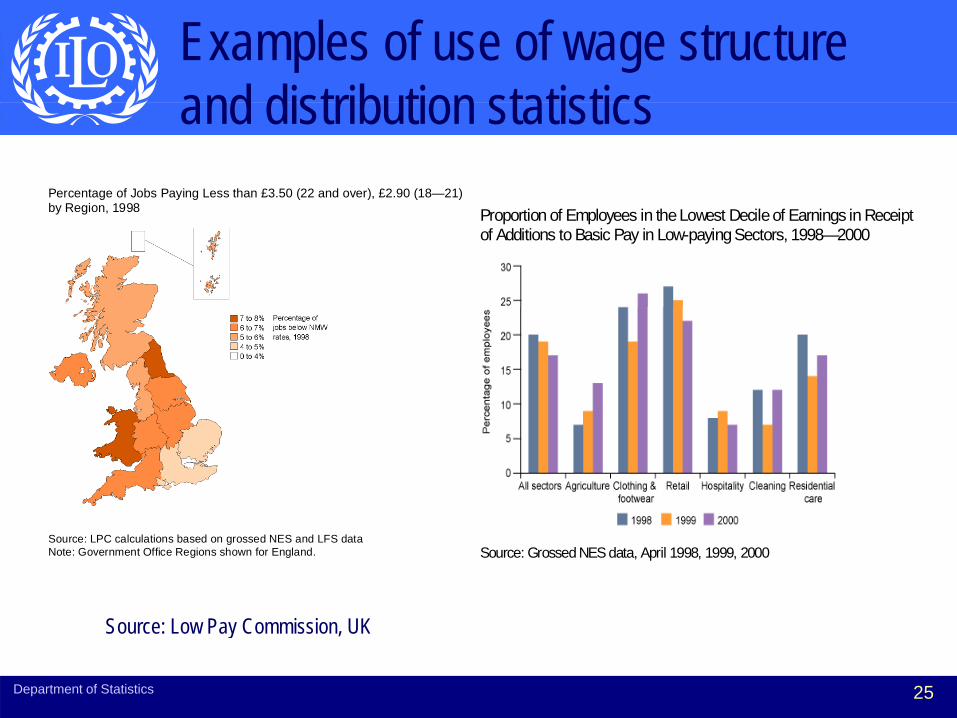
Examples of use of wage structure and distribution statisticsand distribution statistics
Percentage of Jobs Paying Less than £3.50 (22 and over), £2.90 (18—21) b R i 1998
Figure 3.14
by Region, 1998 Proportion of Employees in the Lowest Decile of Earnings in Receipt of Additions to Basic Pay in Low-paying Sectors, 1998—2000
Source: LPC calculations based on grossed NES and LFS data Note: Government Office Regions shown for England.
Source: Grossed NES data, April 1998, 1999, 2000
Department of Statistics 25
Source: Low Pay Commission, UK

Wage and Related Indicators in the gDecent Work Indicator Framework
Department of Statistics 26
Decent Work Indicators that are relevant for effective wage policies for effective wage policies
• Wages fall under element of:– ‘Adequate earnings and productive work’.
• Important links to:p– Employment opportunities.– Equal opportunity and treatment in employment.qua oppo tu ty a d t eat e t e p oy e t– Social dialogue, workers’ and employers’
representation.p– Economic and social context for decent work.
ILO Department of Statistics
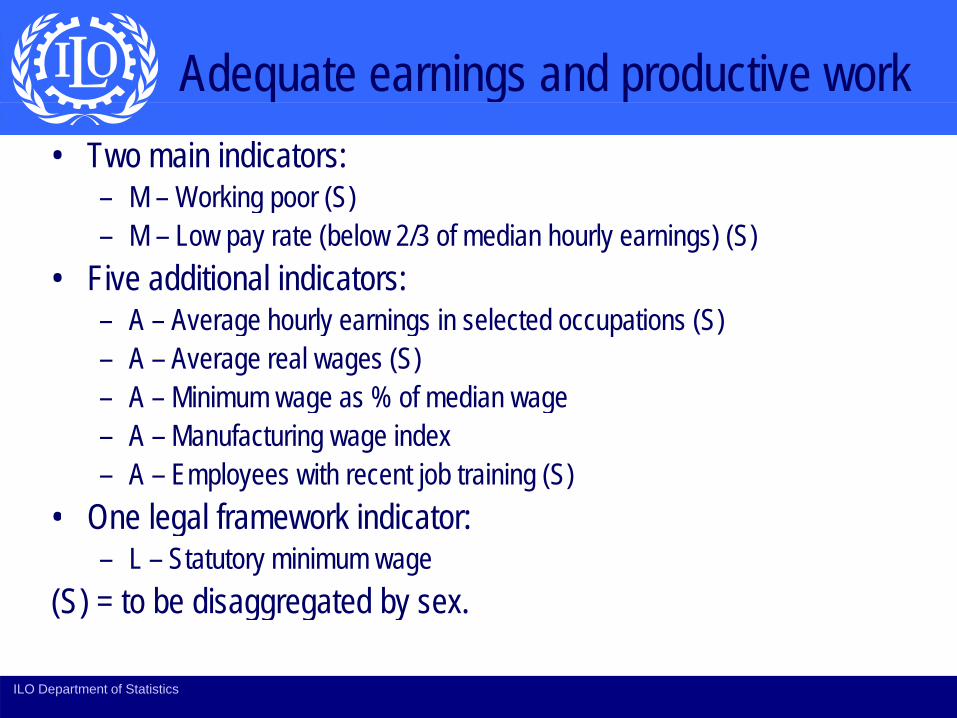
Adequate earnings and productive work• Two main indicators:
– M – Working poor (S)M Working poor (S)– M – Low pay rate (below 2/3 of median hourly earnings) (S)
• Five additional indicators:– A – Average hourly earnings in selected occupations (S)– A – Average real wages (S) – A – Minimum wage as % of median wageg g– A – Manufacturing wage index– A – Employees with recent job training (S)
• One legal framework indicator:• One legal framework indicator:– L – Statutory minimum wage
(S) = to be disaggregated by sex.( ) gg g y
ILO Department of Statistics
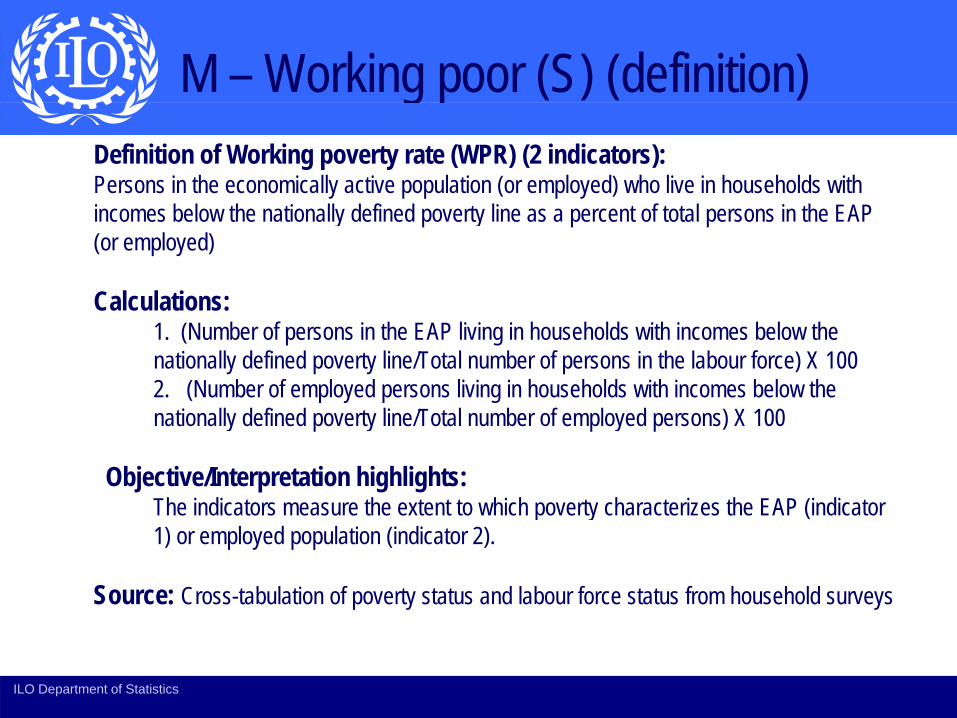
M – Working poor (S) (definition)g p ( ) ( )Definition of Working poverty rate (WPR) (2 indicators):Persons in the economically active population (or employed) who live in households with i b l th ti ll d fi d t li t f t t l i th EAP incomes below the nationally defined poverty line as a percent of total persons in the EAP (or employed)
Calculations:Calculations:1. (Number of persons in the EAP living in households with incomes below the nationally defined poverty line/Total number of persons in the labour force) X 100 2. (Number of employed persons living in households with incomes below the
ti ll d fi d t li /T t l b f l d ) X 100nationally defined poverty line/Total number of employed persons) X 100
Objective/Interpretation highlights:The indicators measure the extent to which poverty characterizes the EAP (indicator The indicators measure the extent to which poverty characterizes the EAP (indicator 1) or employed population (indicator 2).
Source: Cross-tabulation of poverty status and labour force status from household surveys
ILO Department of Statistics
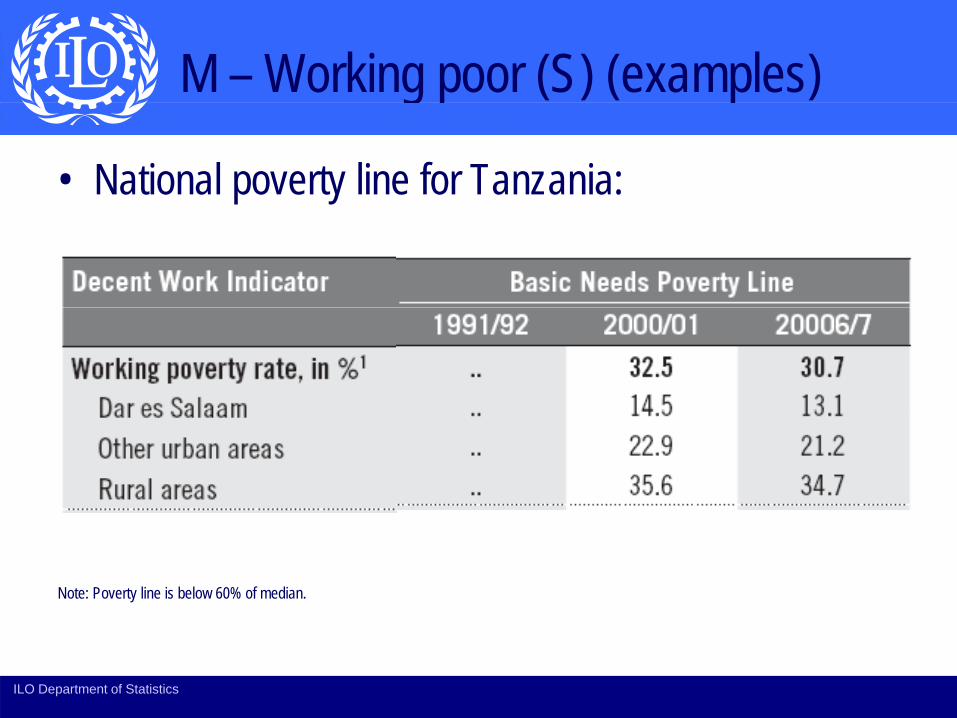
M – Working poor (S) (examples)g p ( ) ( p )
• National poverty line for Tanzania:
Note: Poverty line is below 60% of median.
ILO Department of Statistics
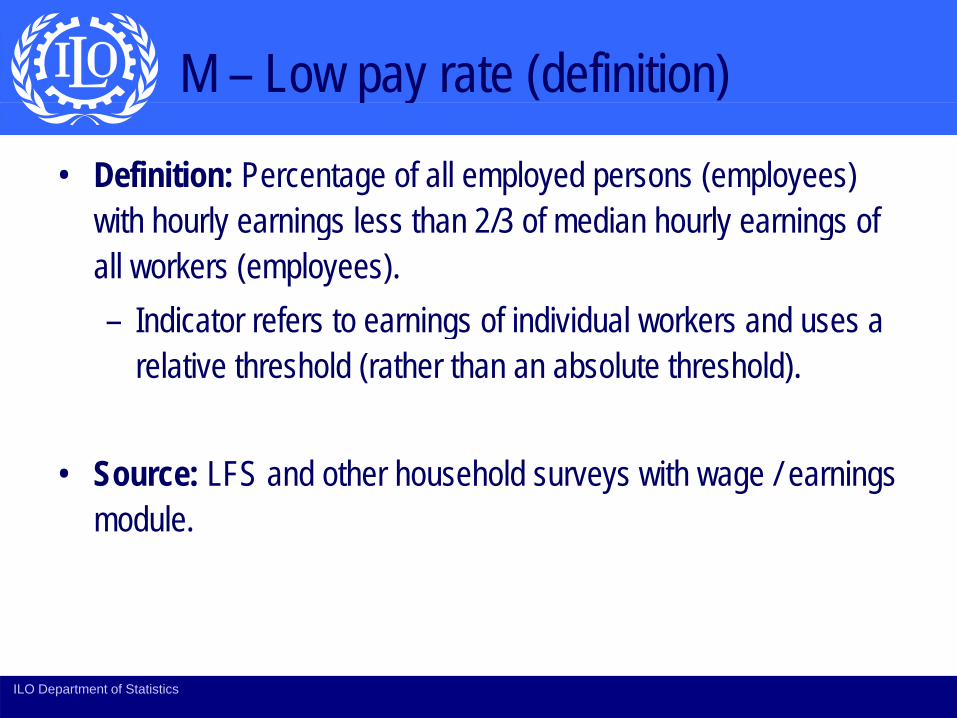
M – Low pay rate (definition)p y ( )
• Definition: Percentage of all employed persons (employees) with hourly earnings less than 2/3 of median hourly earnings of all workers (employees).
I di f i f i di id l k d – Indicator refers to earnings of individual workers and uses a relative threshold (rather than an absolute threshold).
• Source: LFS and other household surveys with wage / earnings d l module.
ILO Department of Statistics
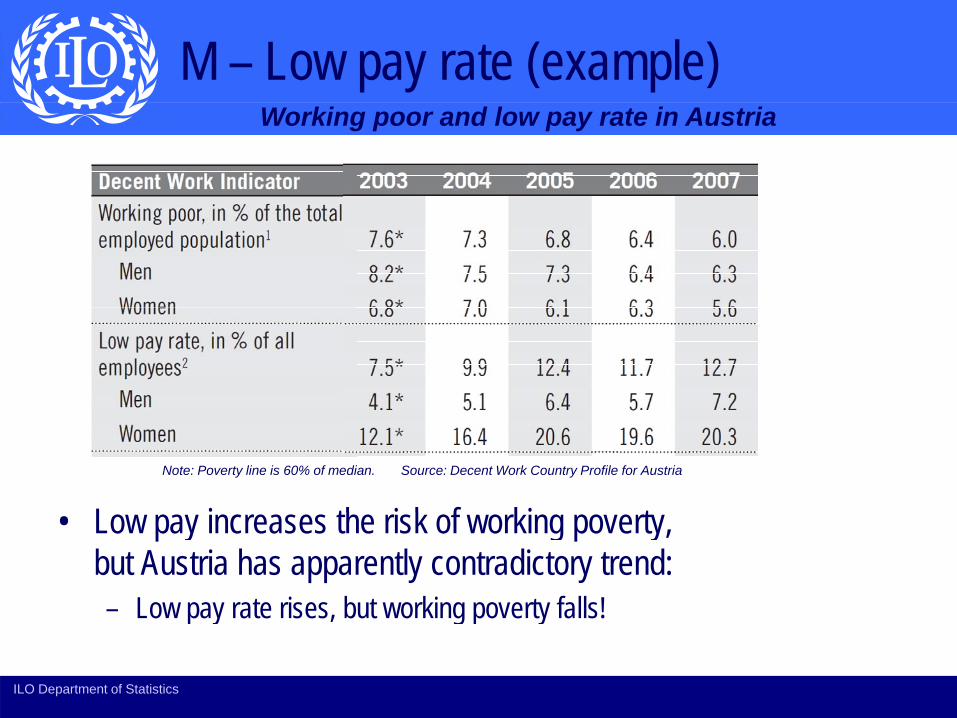
M – Low pay rate (example)Working poor and low pay rate in Austria
L i th i k f ki t Note: Poverty line is 60% of median. Source: Decent Work Country Profile for Austria
• Low pay increases the risk of working poverty, but Austria has apparently contradictory trend:– Low pay rate rises, but working poverty falls!Low pay rate rises, but working poverty falls!
ILO Department of Statistics
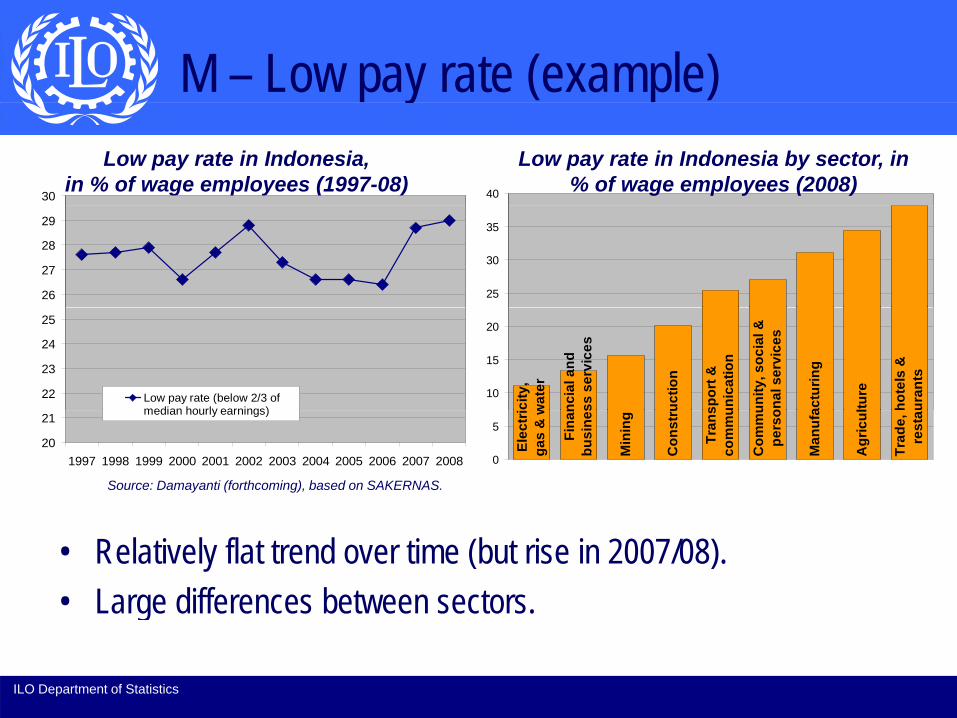
M – Low pay rate (example)y ( )Low pay rate in Indonesia,
in % of wage employees (1997-08) 40
Low pay rate in Indonesia by sector, in % of wage employees (2008)
30
25
30
35
26
27
28
29
uctio
n
spor
t &
unic
atio
n
unity
, soc
ial &
on
al s
ervi
ces
actu
ring
lture
city
, w
ater
ncia
l and
ss
ser
vice
s
hote
ls &
ur
ants
10
15
20
22
23
24
25
Low pay rate (below 2/3 ofmedian hourly earnings)
Source: Damayanti (forthcoming), based on SAKERNAS.
Min
ing
Con
str u
Tran
sco
mm
u
Com
mu
pers
o
Man
ufa
Agr
icul
Elec
tri
gas
& w
Fina
nbu
sine
s
Trad
e,
rest
a
0
520
21
1997 1998 1999 2000 2001 2002 2003 2004 2005 2006 2007 2008
median hourly earnings)
• Relatively flat trend over time (but rise in 2007/08).• Large differences between sectors.g
ILO Department of Statistics
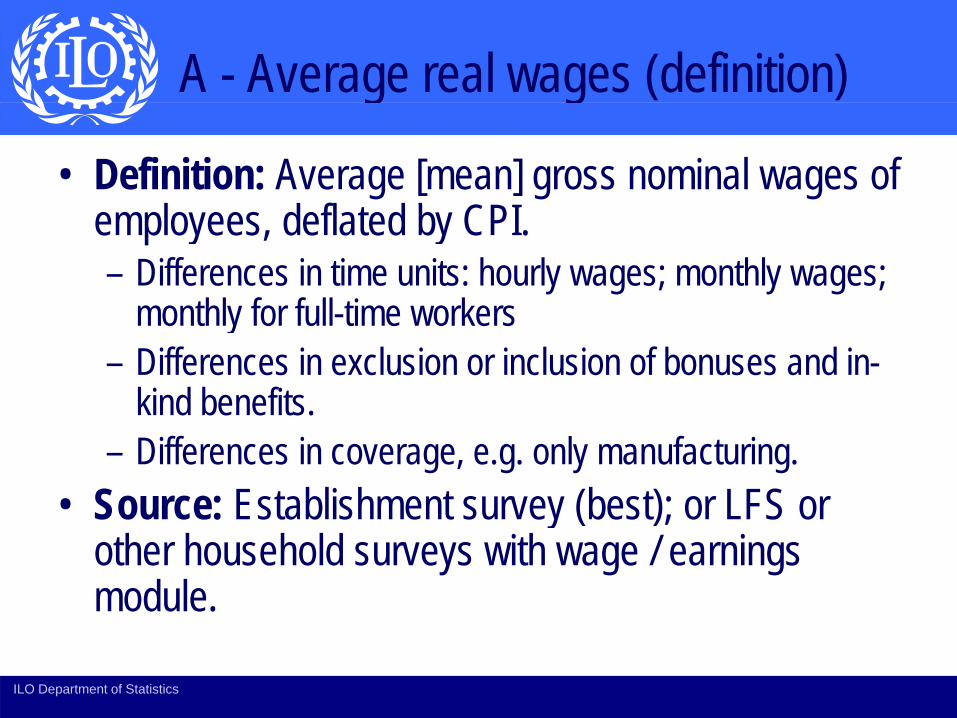
A - Average real wages (definition) g g ( )
• Definition: Average [mean] gross nominal wages of l d fl d b CPI employees, deflated by CPI.
– Differences in time units: hourly wages; monthly wages; monthly for full time workersmonthly for full-time workers
– Differences in exclusion or inclusion of bonuses and in-kind benefitskind benefits.
– Differences in coverage, e.g. only manufacturing.• Source: Establishment survey (best); or LFS or Source: Establishment survey (best); or LFS or
other household surveys with wage / earnings module.
ILO Department of Statistics
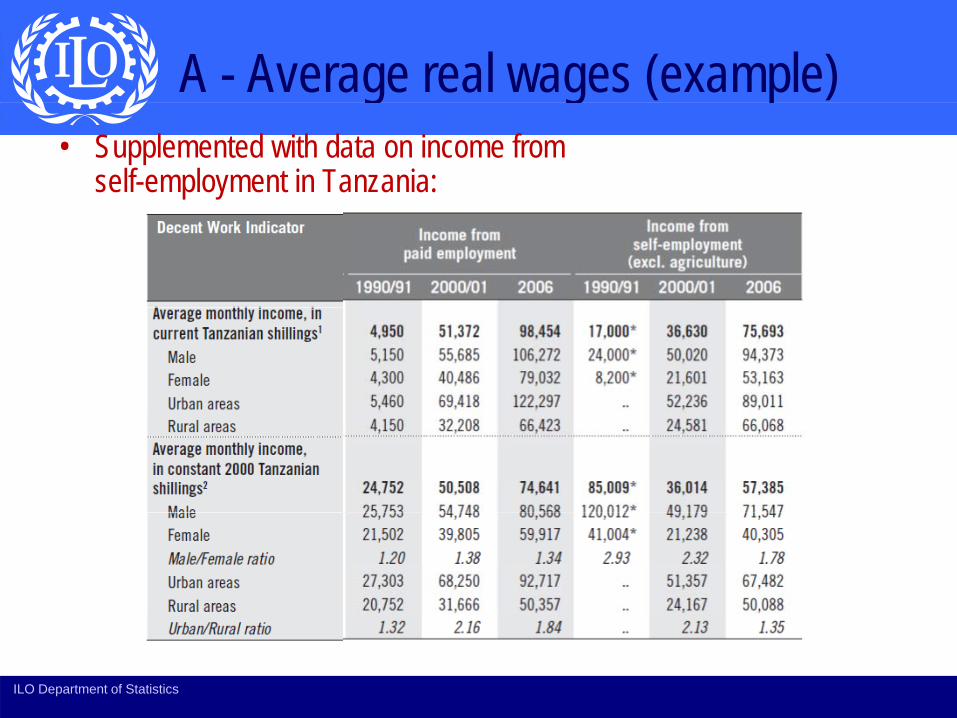
A - Average real wages (example) g g ( p )• Supplemented with data on income from
self-employment in Tanzania:
ILO Department of Statistics
Equal opportunity and treatmentA Gender wage gap (definition) A - Gender wage gap (definition)
• Definition: Difference between women’s and men’s Definition: Difference between women s and men s [mean] gross nominal wages, expressed in % of men’s wages. g– Time units: hourly wages; monthly wages; monthly for
full-time equivalents.– Raw wage gap, i.e. not adjusted for differences in
occupation or education.S LFS d th h h ld ith • Source: LFS and other household surveys with wage / earnings module.
A – Gender wage gap (examples)g g p ( p )
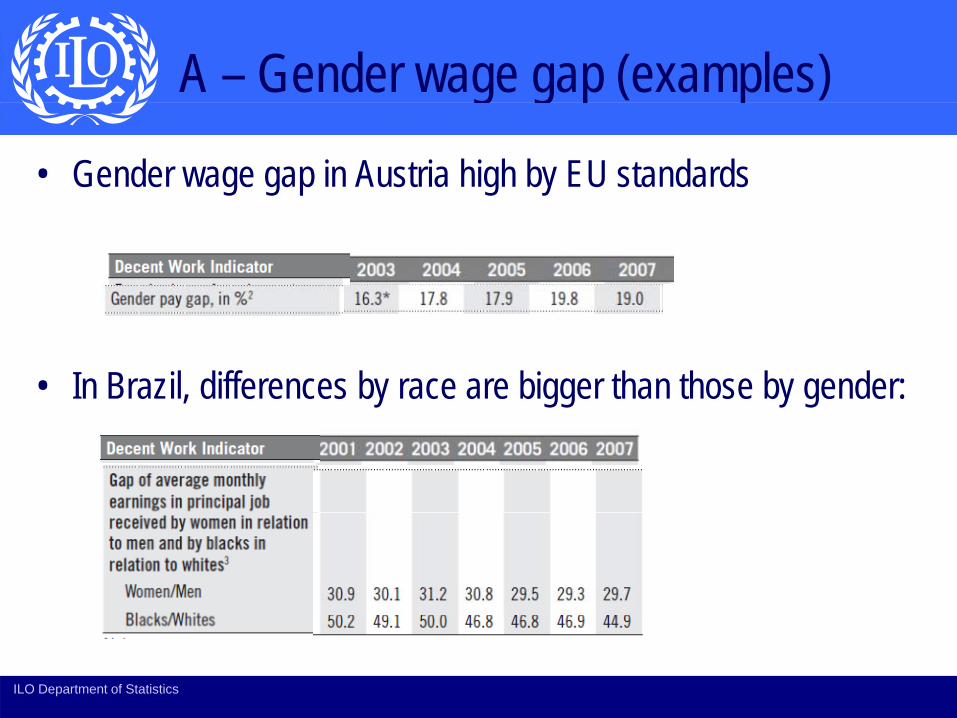
• Gender wage gap in Austria high by EU standards
• In Brazil, differences by race are bigger than those by gender:
ILO Department of Statistics

Productivity and WagesProductivity and Wages
ILO Department of Statistics

Why worry about labour productivity?y y p y
• Link between wages and labour productivity has important implications for social and economic outcomes
• Common reference point for minimum wage settingCommon reference point for minimum wage setting
Accepted by both Workers and Employers as a • Accepted by both Workers and Employers as a reference point in collective bargaining
ILO Department of Statistics 39
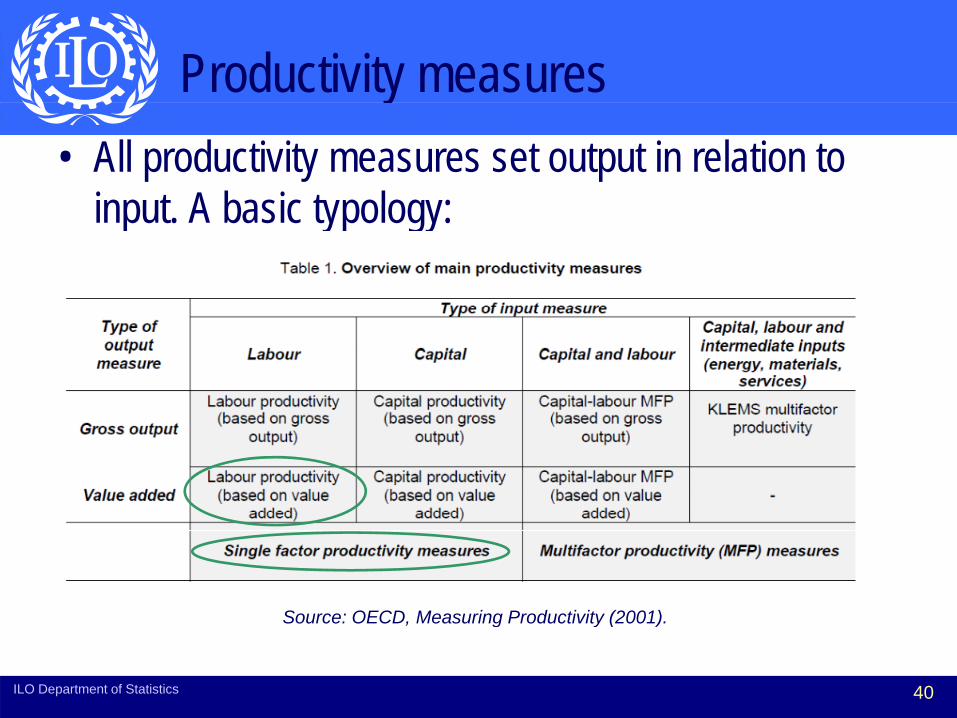
Productivity measuresy• All productivity measures set output in relation to
input A basic typology: input. A basic typology:
Source: OECD Measuring Productivity (2001)Source: OECD, Measuring Productivity (2001).
ILO Department of Statistics 40
Definition of labour productivity
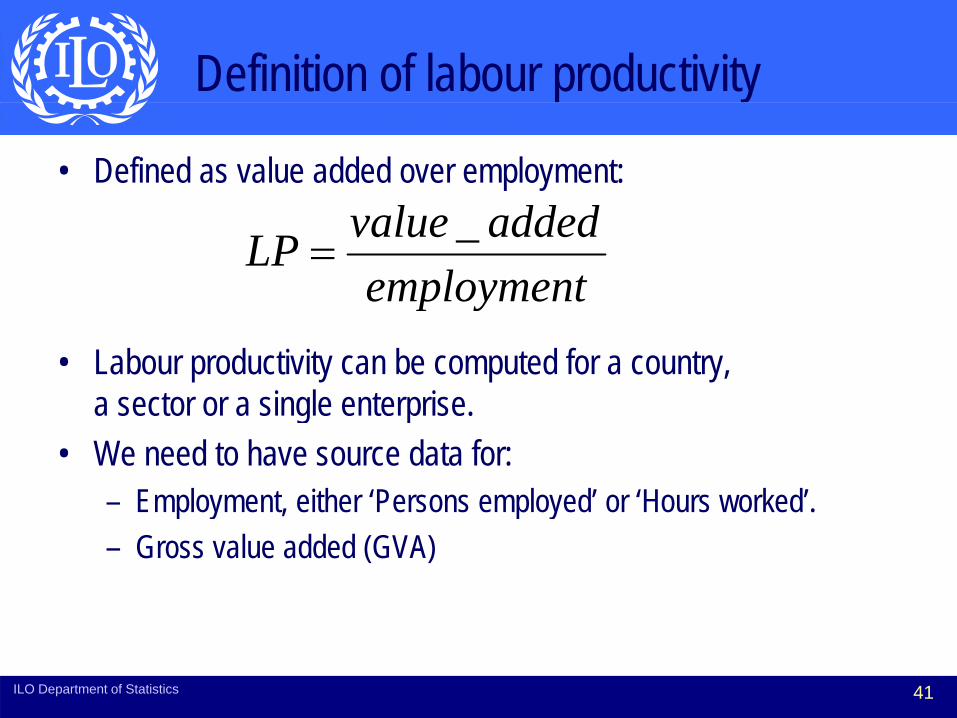
• Defined as value added over employment: dd dl
employmentaddedvalueLP _
=
• Labour productivity can be computed for a country, a sector or a single enterprise
p y
a sector or a single enterprise. • We need to have source data for:
– Employment, either ‘Persons employed’ or ‘Hours worked’.p y , p y– Gross value added (GVA)
ILO Department of Statistics 41
How is value added distributed?
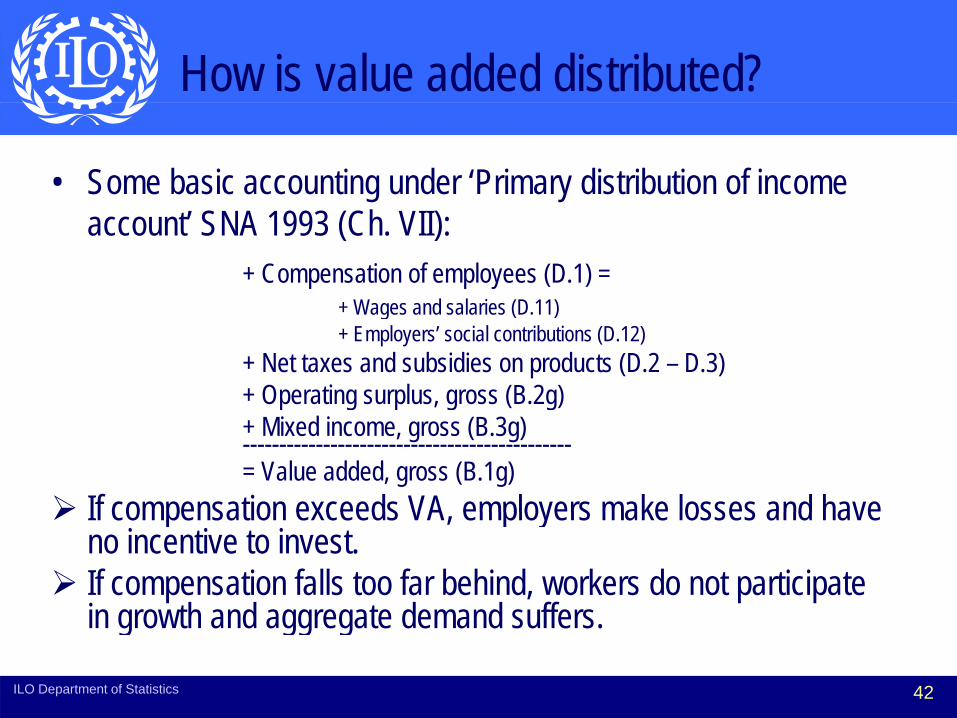
• Some basic accounting under ‘Primary distribution of income account’ SNA 1993 (Ch. VII):
+ Compensation of employees (D.1) =+ Wages and salaries (D 11)+ Wages and salaries (D.11)+ Employers’ social contributions (D.12)
+ Net taxes and subsidies on products (D.2 – D.3)+ Operating surplus, gross (B.2g)+ Mixed income, gross (B.3g)---------------------------------------------= Value added, gross (B.1g)
If compensation exceeds VA employers make losses and have If compensation exceeds VA, employers make losses and have no incentive to invest.If compensation falls too far behind, workers do not participate in growth and aggregate demand suffersin growth and aggregate demand suffers.
ILO Department of Statistics 42
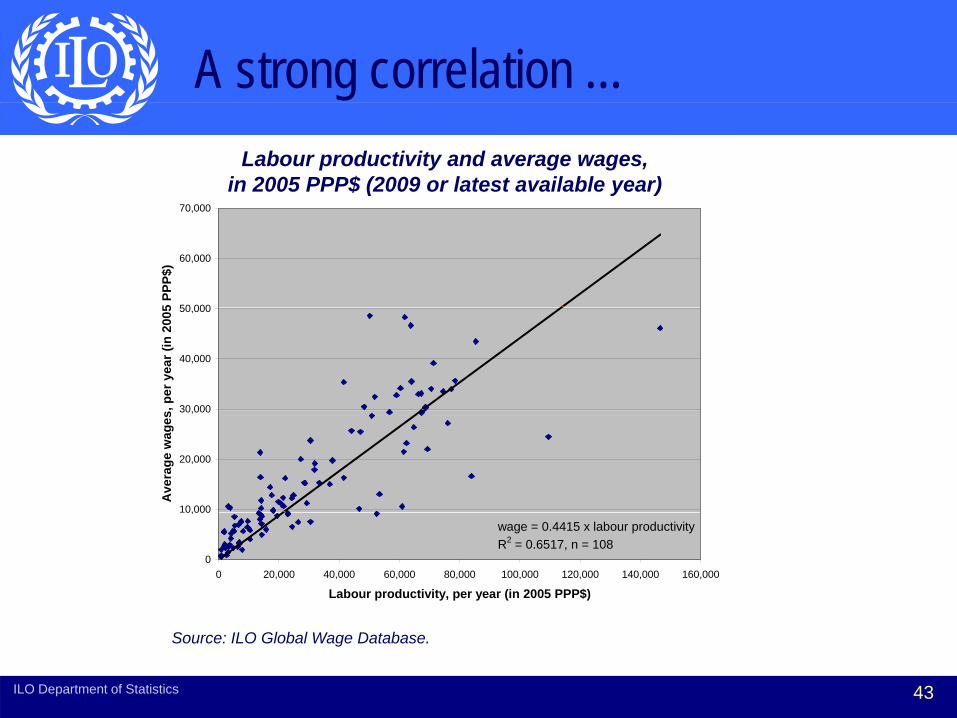
A strong correlation …
70 000
Labour productivity and average wages, in 2005 PPP$ (2009 or latest available year)
50 000
60,000
70,000
5 PP
P$)
30 000
40,000
50,000
, per
yea
r (in
200
5
10,000
20,000
30,000
Ave
rage
wag
es
wage = 0.4415 x labour productivityR2 = 0.6517, n = 108
0
0,000
0 20,000 40,000 60,000 80,000 100,000 120,000 140,000 160,000
Labour productivity, per year (in 2005 PPP$)
Source: ILO Global Wage Database.
ILO Department of Statistics 43
… but is there an automatic link?• Many country-level studies find notable elasticity, but often not
t one-to-one: – Kenya 1950s/1960s: growth of wages about 3/4 as fast as growth of LP
(Harris & Todaro 1969) (Harris & Todaro, 1969) – South Africa 1990s: elasticity of 0.38 in manufacturing sector
(Wakeford, 2004).– Global Wage Report 2008/09: elasticity of 0.756 between growth of
GDP per capita and wage growth.
A th L i (1954) I diti f l l b l • Arthur Lewis (1954): In conditions of surplus labour, employers don’t have to pass on productivity gains.
Wage policies and labour market institutions matter!– Wage policies and labour market institutions matter!
ILO Department of Statistics 44

Why might employers want to ‘share’ productivity growth through higher wages?productivity growth through higher wages?
‘E l t k ll i ’ d l t ti • ‘Employer takes all gains’-model seems tempting for them in the short term, but– … if productivity gains translate only into higher profits
(and redundancies), this gives workers incentives to ‘sabotage’ innovationsabotage innovation.
– … if productivity gains benefit workers though higher wages they have a stake in raising productivitywages, they have a stake in raising productivity.
• Prospect for ‘win-win’ collective bargaining!
ILO Department of Statistics 45

What drives labour productivity growth?
• Traditional focus of the economic literature:f f f– Amount of complementary factors of production
(machinery, land, etc.).Pace of technological innovation– Pace of technological innovation.
– Workers’ skills and efforts.• Industrial relations literature highlights:• Industrial relations literature highlights:
– It matters how factors of production interact and the production process is organized.production process is organized.
– Labour-management cooperation can help to increase efficiency and to adopt new technology.
ILO Department of Statistics 46
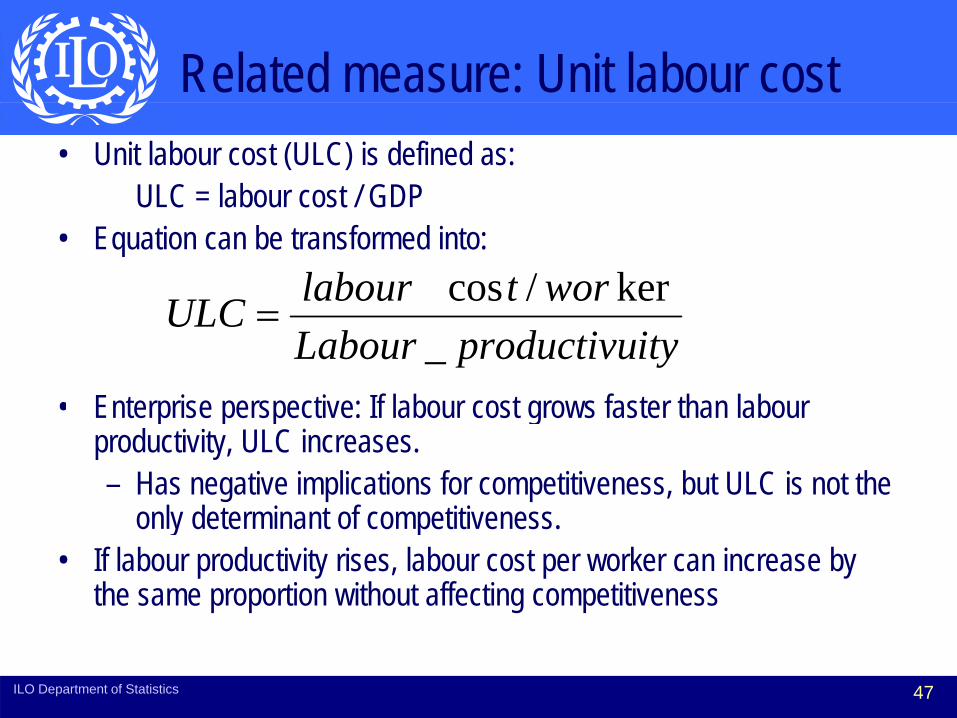
Related measure: Unit labour cost • Unit labour cost (ULC) is defined as:
ULC = labour cost / GDPULC labour cost / GDP• Equation can be transformed into:
wortlabourULC ker/cos
• Enterprise perspective: If labour cost grows faster than labour
ityproductivuLabourULC
__
=
• Enterprise perspective: If labour cost grows faster than labour productivity, ULC increases.– Has negative implications for competitiveness, but ULC is not the
only determinant of competitivenessonly determinant of competitiveness.• If labour productivity rises, labour cost per worker can increase by
the same proportion without affecting competitiveness
ILO Department of Statistics 47

ILO Global Wage Report:Key Findings
Report prepared by: Conditions of Work and Employment (TRAVAIL)Social Protection Sector Social Protection Sector International Labour [email protected]
Department of Statistics 48
Global wage growth trendsGlobal wage growth trends• Wage growth has declined considerably during the crisis
• The aggregate data probably over-estimates wage growth during the crisis, because of “composition effects” whereby low-paid , p y pworkers drop out of the labour market first during recessions
• The whole “real economy” has suffered: profits have declined more than wage bills, as seen in the short- term increase in the “wage share” in most countries wage share in most countries
ILO Department of Statistics 49
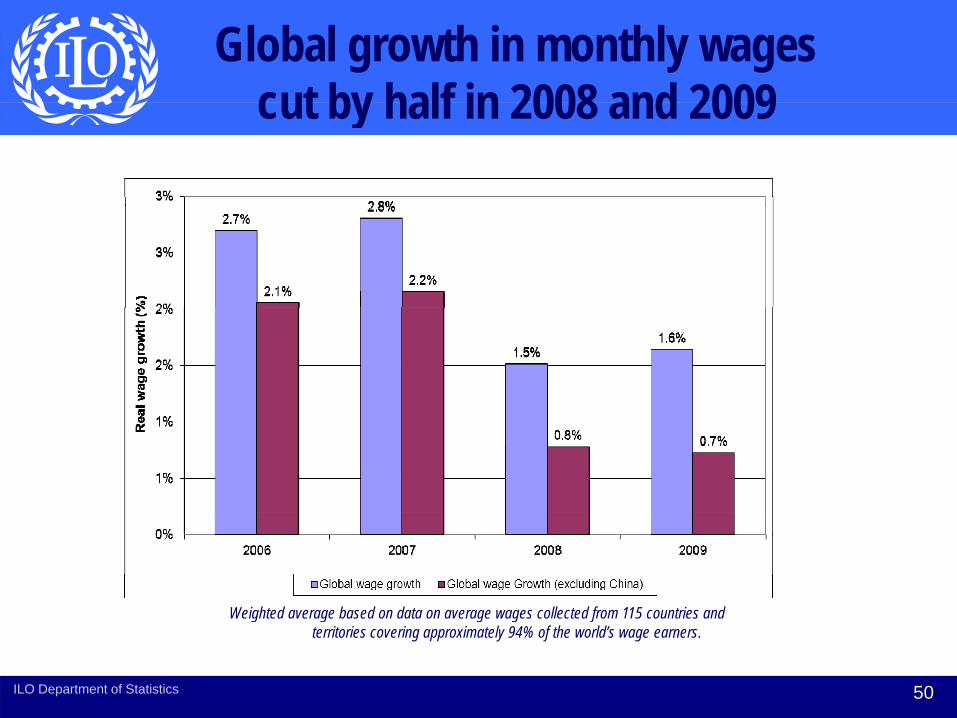
Global growth in monthly wages cut by half in 2008 and 2009cut by half in 2008 and 2009
Weighted average based on data on average wages collected from 115 countries and Weighted average based on data on average wages collected from 115 countries and territories covering approximately 94% of the world’s wage earners.
ILO Department of Statistics 50
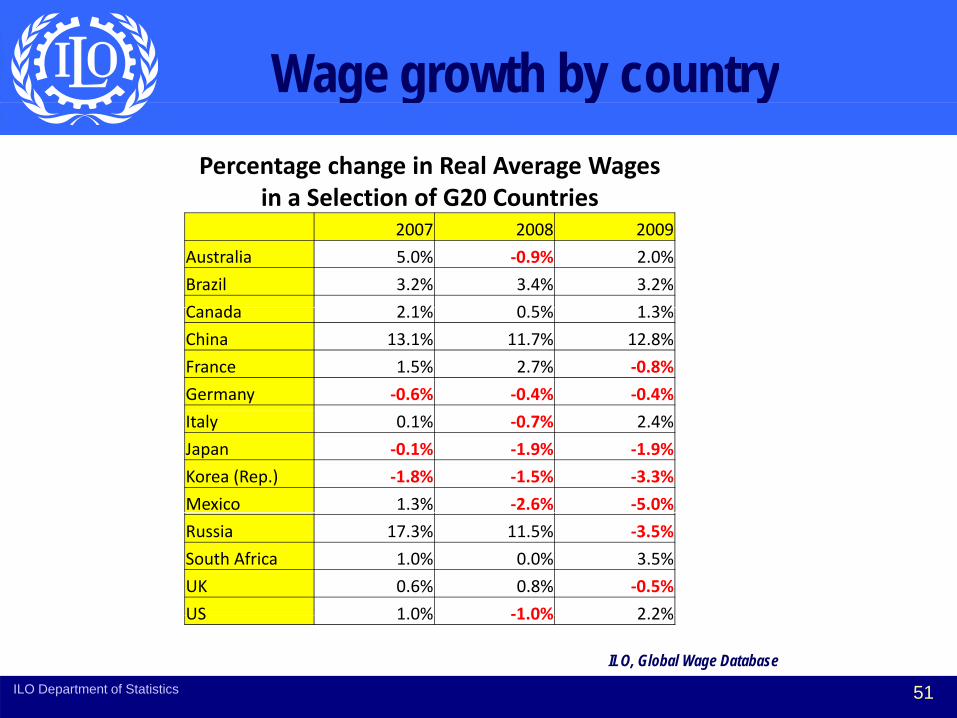
Wage growth by countryg g y yPercentage change in Real Average Wages
in a Selection of G20 Countriesin a Selection of G20 Countries2007 2008 2009
Australia 5.0% ‐0.9% 2.0%
Brazil 3.2% 3.4% 3.2%
C d 2 1% 0 5% 1 3%Canada 2.1% 0.5% 1.3%
China 13.1% 11.7% 12.8%
France 1.5% 2.7% ‐0.8%
Germany ‐0.6% ‐0.4% ‐0.4%
Italy 0.1% ‐0.7% 2.4%
Japan ‐0.1% ‐1.9% ‐1.9%
Korea (Rep.) ‐1.8% ‐1.5% ‐3.3%
Mexico 1.3% ‐2.6% ‐5.0%
Russia 17.3% 11.5% ‐3.5%
South Africa 1.0% 0.0% 3.5%
UK 0.6% 0.8% ‐0.5%
US 1 0% ‐1 0% 2 2%
ILO, Global Wage Database
US 1.0% ‐1.0% 2.2%
ILO Department of Statistics 51
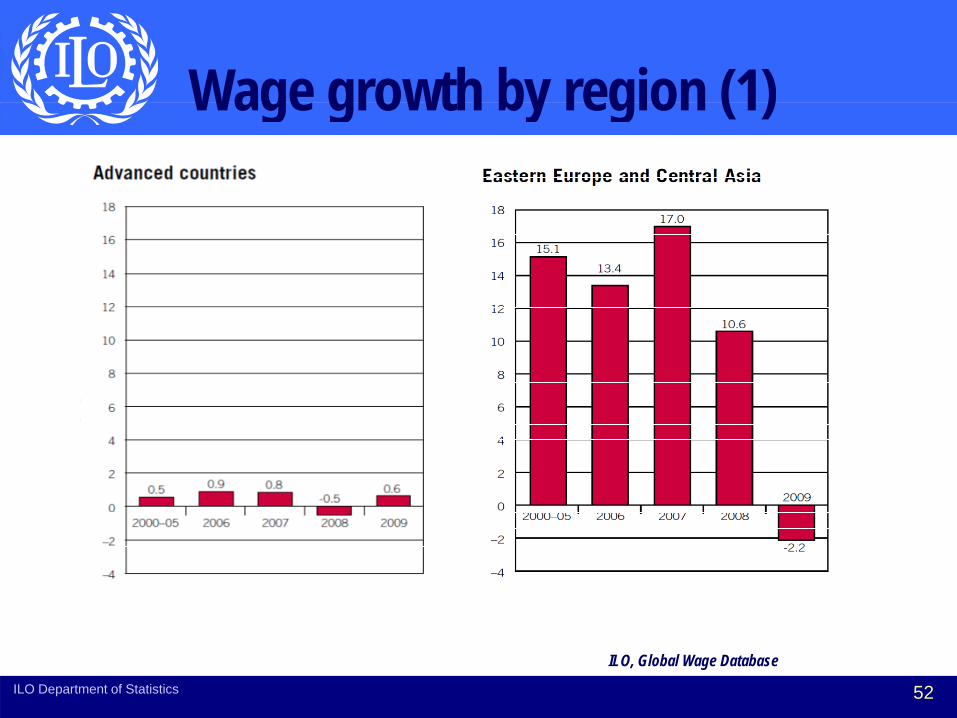
Wage growth by region (1)Wage growth by region (1)
ILO Department of Statistics 52
ILO, Global Wage Database
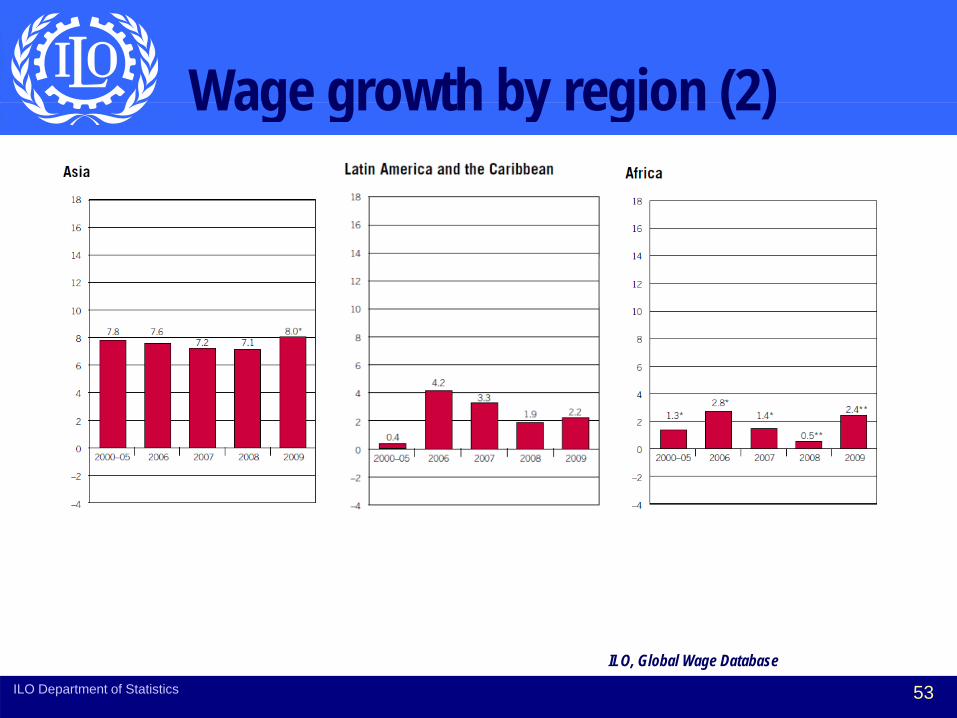
Wage growth by region (2)Wage growth by region (2)
ILO Department of Statistics 53
ILO, Global Wage Database
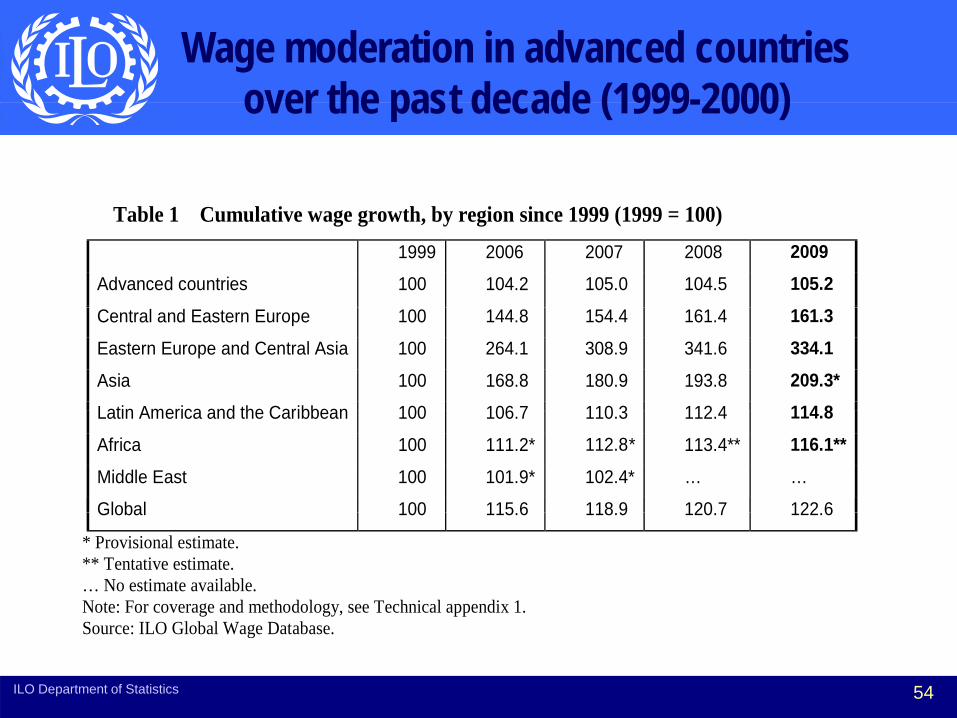
Wage moderation in advanced countries over the past decade (1999-2000)over the past decade (1999-2000)
Table 1 Cumulative wage growth, by region since 1999 (1999 = 100) 1999 2006 2007 2008 2009
Advanced countries 100 104.2 105.0 104.5 105.2
Central and Eastern Europe 100 144.8 154.4 161.4 161.3
Eastern Europe and Central Asia 100 264.1 308.9 341.6 334.1
Asia 100 168.8 180.9 193.8 209.3*
Latin America and the Caribbean 100 106 7 110 3 112 4 114 8Latin America and the Caribbean 100 106.7 110.3 112.4 114.8
Africa 100 111.2* 112.8* 113.4** 116.1**
Middle East 100 101.9* 102.4* … …
Global 100 115 6 118 9 120 7 122 6Global 100 115.6 118.9 120.7 122.6
* Provisional estimate. ** Tentative estimate. … No estimate available. Note: For coverage and methodology, see Technical appendix 1.g gy, ppSource: ILO Global Wage Database.
ILO Department of Statistics 54
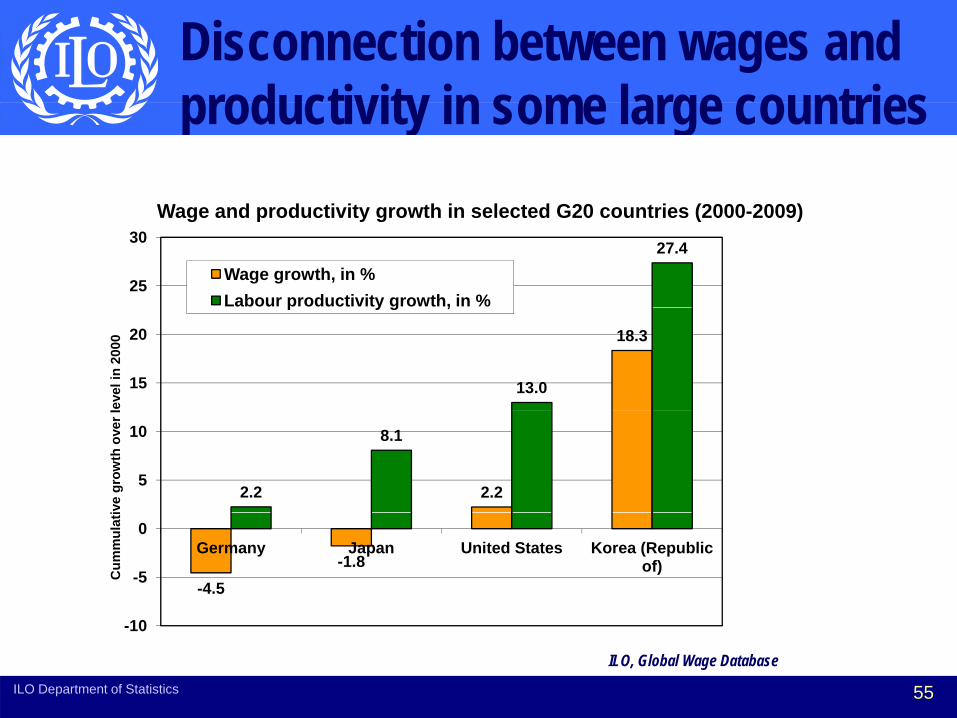
Disconnection between wages and productivity in some large countriesproductivity in some large countries
W d d ti it th i l t d G20 t i (2000 2009)
27.4
25
30Wage and productivity growth in selected G20 countries (2000-2009)
Wage growth, in %Labour productivity growth, in %
18.3
13.015
20
evel
in 2
000
p y g ,
2.22.2
8.1
5
10
ive
grow
th o
ver l
-4.5-1.8
-5
0Germany Japan United States Korea (Republic
of)Cum
mul
ati
-10
ILO Department of Statistics 55
ILO, Global Wage Database
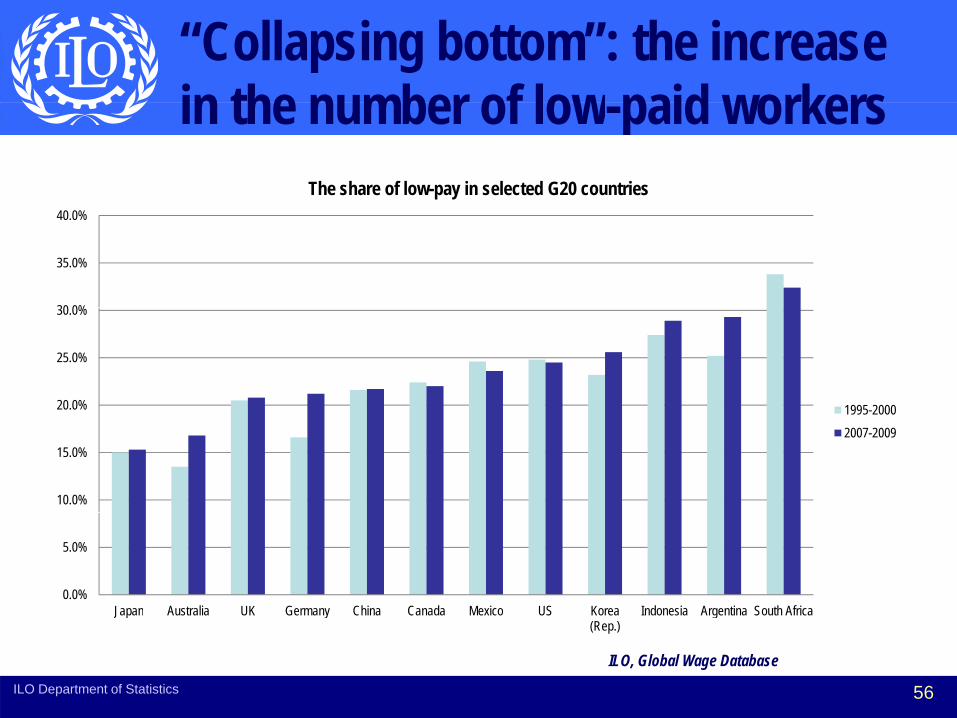
“Collapsing bottom”: the increase in the number of low paid workersin the number of low-paid workers
The share of low-pay in selected G20 countries
30 0%
35.0%
40.0%
20.0%
25.0%
30.0%
1995 2000
10.0%
15.0%
1995-20002007-2009
0.0%
5.0%
Japan Australia UK Germany China Canada Mexico US Korea Indonesia Argentina South AfricaJapan Australia UK Germany China Canada Mexico US Korea (Rep.)
Indonesia Argentina South Africa
ILO Department of Statistics 56
ILO, Global Wage Database
Some remarksSome remarks• Many low paid workers live in poverty: 17.5 million people suffer
f “i k” t i th EU 27 d 7 5 illi “ ki from “in-work” poverty in the EU-27, and 7.5 million are “working poor” in the U.S. In China, 45% of low paid migrant workers are poor.
• Increasing inequality and wage moderation in the past decade h d ti i t h h ld ti d t had a negative impact on household consumption and aggregate demand, compensated in some countries by low interest rates, excessive credit, or by reliance on export surplus.
ILO Department of Statistics 57
Minimum wages can play a complementary rolecomplementary role
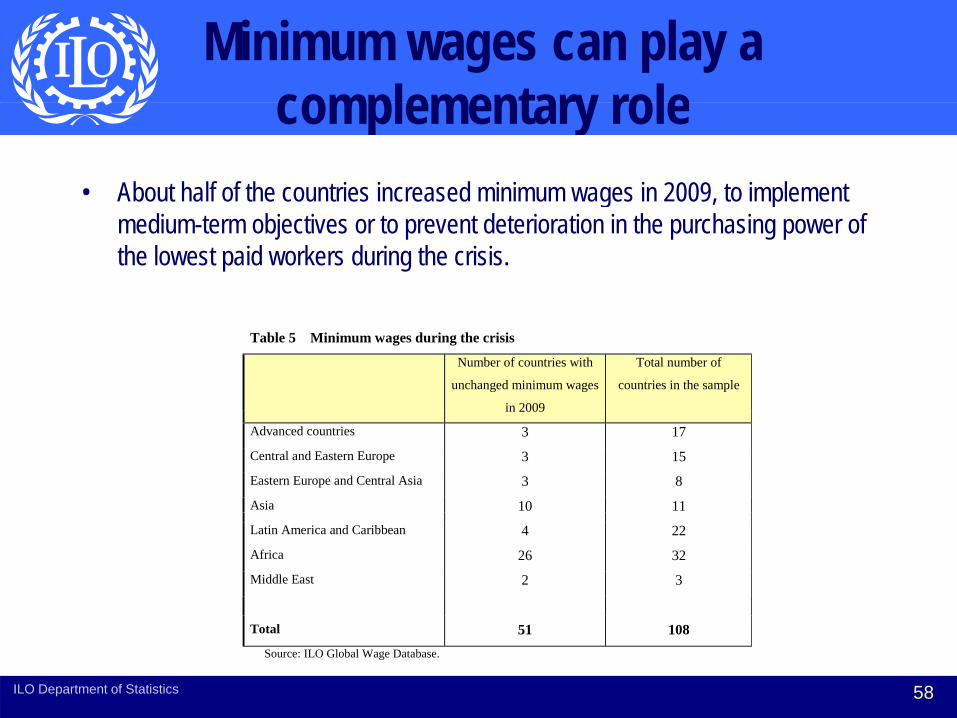
• About half of the countries increased minimum wages in 2009, to implement g , pmedium-term objectives or to prevent deterioration in the purchasing power of the lowest paid workers during the crisis.
Table 5 Minimum wages during the crisis
Number of countries with
unchanged minimum wages
in 2009
Total number of
countries in the sample
in 2009
Advanced countries 3 17
Central and Eastern Europe 3 15
Eastern Europe and Central Asia 3 8
Asia 10 11Latin America and Caribbean 4 22
Africa 26 32 Middle East 2 3
Total 51 108 Source: ILO Global Wage Database.
ILO Department of Statistics 58
Conclusions• Monitoring of wages levels, trends, structure and related indicators are
necessary to formulate and assess wage policiesnecessary to formulate and assess wage policies• Wages: just one element in broader context of monitoring progress
towards decent work • Wage indicators should be analyzed jointly with other key economic
indicators (e.g. CPI, productivity, hours, employment, etc)B th t d t t l t ti ti h ld b l d• Both current and structural wages statistics should be analyzed
• Wage growth has declined considerably during the crisis, resulting in declining profits and wage bills declining profits and wage bills
59ILO Department of Statistics
Key Referencesy• Mata Greenwood, Adriana, 2010. Power Point presentation “Wages statistics: Sources”, ILO
Department of Statistics, Geneva.• International Labour Office, 1979. An Integrated System of Wages Statistics: A Manual on
Methods, Geneva• International Labour Office. “Employment and labour market adjustments in G20 countries during
2007 09 d O tl k f 2010 A t ti ti l O i ” A ILO R t ith b t ti 2007-09 and Outlook for 2010: A statistical Overview”. An ILO Report, with substantive contributions from OECD, to the meeting of G20 Labour and Employment Ministers. 20-21 April, 2010 Washington, DC
• Luebker Malte Power Point presentation “Monitoring wages and related indicators” ILO ITC & • Luebker, Malte. Power Point presentation, Monitoring wages and related indicators . ILO ITC & TRAVAIL Course “Building Effective Wage Policies” Turin. ILO Conditions of Work and Employment Programme (TRAVAIL), Geneva. 29 November – 3 December 2010.
• Luebker, Malte. Power Point presentation, “Wages, labour productivity and related concepts”. ILO ITC & TRAVAIL Course “Building Effective Wage Policies in CIS countries” Turin. . ILO Conditions of Work and Employment Programme (TRAVAIL), Geneva. 3-7 October 2011.
• Luebker, Malte. Power Point presentation, “Global Wage Report: Wage policies in times of crisis”. . ILO C diti f W k d E l t P (TRAVAIL) G 2011ILO Conditions of Work and Employment Programme (TRAVAIL), Geneva. 2011.
ILO Department of Statistics 60

Questions• How closely do wage analysts at the Ministry of Labour of Trinidad and Tobago and
other analysts work with the National Statistics Office in Trinidad and Tobago for y gdeveloping wages statistics information and defining indicators?
• How are wages research and analysis topics defined in Trinidad and Tobago?• Does the public sector work closely with the academic research community?Does the public sector work closely with the academic research community?• What are the key wage analysis issues?
– Current wages statistics– Structural wages statisticsStructural wages statistics
• Is wage analysis readily incorporated into policy discussions?• Are policymakers informed of the types of wages statistics and interpretation of
wage analysis results?wage analysis results?• How can coordination mechanisms between data producers and data users of
wages statistics be improved?
ILO Department of Statistics 61


![[1]THE PAYMENT OF WAGES ACT 1936](https://img.pdfslide.tips/doc/110x75/586a2f8f1a28ab123a8b8976/1the-payment-of-wages-act-1936.jpg)