Embed Size (px)
Citation preview
UTM/RMC/F/0024 (1998)
Lampiran 20
UNIVERSITI TEKNOLOGI MALAYSIA
BORANG PELAPORAN AKHI
TAJUK PROJEK : DEVELOPMENT OF
Saya _ MOHAMMAD NA (HU
Mengaku membenarkan Laporan Akhir PenyTeknologi Malaysia dengan syarat-syarat keguna
1. Laporan Akhir Penyelidikan ini adalah
2. Perpustakaan Universiti Teknologi tujuan rujukan sahaja.
3. Perpustakaan dibenarkan mem
Penyelidikan ini bagi kategori TIDAK
4. * Sila tandakan ( / )
SULIT (Mengandun Kepentingan AKTA RAH TERHAD (Mengandun Organisasi/b
TIDAK TERHAD
CATATAN : * Jika Laporan Akhir Penyelidikan ini SULIberkuasa/organisasi berkenaan dengan menyatakan sekali sebab dan
NGESAHAN
R PENYELIDIKAN
LOW NOx LIQUID FUEL BURNER
ZRI MOHD JAAFAR__________________ RUF BESAR)
elidikan ini disimpan di Perpustakaan Universiti an seperti berikut :
hakmilik Universiti Teknologi Malaysia.
Malaysia dibenarkan membuat salinan untuk
buat penjualan salinan Laporan Akhir TERHAD.
gi maklumat yang berdarjah keselamatan atau Malaysia seperti yang termaktub di dalam SIA RASMI 1972).
gi maklumat TERHAD yang telah ditentukan oleh adan di mana penyelidikan dijalankan).
√
T atau TERHAD, sila lampirkan surat daripada pihak tempoh laporan ini perlu dikelaskan sebagai SULIT dan TERHAD.
DEVELOPMENT OF LOW NOX LIQUID FUEL BURNER
RESEARCHERS:
PROF. MADYA DR. MOHAMMAD NAZRI MOHD. JAAFAR (HEAD) DR. AZEMAN MUSTAFA
PROF. MADYA HAMIDON MUSA WAN ZAIDI WAN OMAR
DR. MOHD. ZAMRI YUSOFF IR. DR. HJ. KAMSANI ABDUL MAJID MOHAMAD SHAIFUL ASHRUL ISHAK
RESEARCH VOTE NO: 74069
FACULTY OF MECHANICAL ENGINEERING UNIVERSITI TEKNOLOGI MALAYSIA
2005
“I declared that this report entitled “DEVELOPMENT OF LOW NOX LIQUID
FUEL BURNER” is the results of our own research except as cited in references”.
Signature : _________________________
Name : Mohammad Nazri Mohd. Jaafar
Date : 20th May 2005
iii
DEVELOPMENT OF LOW NOX LIQUID FUEL BURNER (Keywords: Combustion, Air Swirlers, Exhaust Gas, NOx emission)
ABSTRACT Recently, most of the gas turbine combustion research and development involves in lowering the emissions emitted from the combustor. Emission causes adverse affect to the world and mankind especially. Main concern of the present work is to reduce the NOx emission since the CO emission could be reduced through homogeneous mixing of fuel and air. Homogeneous mixing of fuel and air is also needed in order to reduce NOx emission. A liquid fuel burner system with radial air swirler vane angle of 30o, 40o, 50o and 60o has been investigated using 163mm inside diameter combustor. Orifice plates with three different sizes of 20mm, 25mm and 30mm were inserted at the back plate of swirler outlet. All tests were conducted using diesel as fuel. Fuel was injected at two different positions, i.e. at upstream and downstream of the swirler outlet using central fuel injector with single fuel nozzle pointing axially outwards. Experiment has been carried out to compare the three emissions NOx, CO and SO2. NOx reduction of about 53 percent was achieved for orifice plate of 20mm with downstream injection compared to orifice plate of 20mm with upstream injection. CO2 and SO2 was reduced about 26 percent and 56 percent respectively for the same configuration. This comparison was taken using swirler vane angle of 60o. The overall study shows that larger swirler vane angle produces lower emission results compared to the smaller ones. Smaller orifice plates produce better emission reduction. Meanwhile, downstream injection position significantly decreases the emission levels compared to upstream injection position. Combination of smallest orifice plate and largest swirler vane angle with downstream injection produce widest and shortest flame length.
Key researcher:
Prof. Madya Dr. Mohammad Nazri Mohd. Jaafar (head) Dr. Azeman Mustafa
Prof. Madya Hamidon Musa Wan Zaidi Wan Omar
Dr. Mohd. Zamri Yusoff Ir. Dr. Hj. Kamsani Abdul Majid Mohamad Shaiful Ashrul Ishak
Email: [email protected] Tel. No.: 607-5534661 Fax. No.: 607-5566159
iii
PEMBANGUNAN PEMBAKAR BAHAN API CECAIR RENDAH NOX
(Katakunci: Pembakaran, Pemusar udara, Gas ekzos, Emisi NOx)
ABSTRAK Masa kini, kebanyakan kajian dan pembangunan ke atas pembakaran turbin gas melibatkan pengurangan emisi dari pembakar. Pencemaran memberi kesan negatif kepada dunia dan manusia khususnya. Dalam projek ini, perhatian diberikan kepada pengurangan emisi NOx kerana emisi CO dapat dikurangkan melalui percampuran yang baik di antara bahan api dan udara. Percampuran yang baik juga diperlukan untuk mengurangkan emisi NOx. Pembakar berbahan api cecair menggunakan pemusar udara aliran jejarian bersudut 30o, 40o, 50o dan 60o dikaji menggunakan pembakar berdiameter dalam 163mm. Tiga plat orifis bersaiz 20mm, 25mm dan 30mm dipasang di bahagian keluar pemusar udara. Ujikaji dijalankan menggunakan bahan api diesel. Bahan api dibekalkan pada dua kedudukan pancitan, yakni di belakang dan di hadapan pemusar udara menggunakan pemancit bahan api berlubang tunggal menghala arah paksi. Ujikaji dijalankan ke atas tiga jenis pencemar iaitu NOx, CO dan SO2. Emisi NOx dapat dikurangkan sebanyak 53 peratus bagi plat orifis 20mm menggunakan pancitan di hadapan pemusar udara berbanding plat orifis 20mm menggunakan pancitan di belakang pemusar udara. CO dan SO2 pula dapat dikurangkan sebanyak 26 dan 56 peratus masing-masing untuk konfigurasi yang sama. Ujikaji menunjukkan emisi yang rendah bagi pemusar udara bersudut besar berbanding pemusar udara bersudut kecil. Plat orifis bersaiz kecil memperoleh nilai emisi yang rendah. Pancitan di hadapan pemusar udara menunjukkan pengurangan emisi yang lebih baik berbanding pancitan di belakang pemusar udara. Saiz api yang pendek dengan bukaan yang besar diperoleh apabila pemusar udara besudut besar, plat orifis yang kecil dan pancitan di hadapan pemusar udara digunakan.
Penyelidik utama:
Prof. Madya Dr. Mohammad Nazri Mohd. Jaafar (ketua) Dr. Azeman Mustafa
Prof. Madya Hamidon Musa Wan Zaidi Wan Omar
Dr. Mohd. Zamri Yusoff Ir. Dr. Hj. Kamsani Abdul Majid Mohamad Shaiful Ashrul Ishak
Email: [email protected] Tel. No.: 607-5534661 Fax. No.: 607-5566159
iv
ACKNOWLEDGEMENTS
We would like to thank the Ministry of Science, Technology and Innovation
(MOSTI) of Malaysia for awarding the research grant for this project and Universiti
Teknologi Malaysia (UTM) for supporting this research. The research was funded
under the IRPA grant scheme through project number 08-02-06-0061EA255. We
would also like to extend my gratitude to all technicians who has offered their
assistance in fabricating some of our component and to all undergraduate and
postgraduate students who has helped and supported this project. Last but not least,
we would like to thank the RMC’s staff and JKKP of Faculty of Mechanical
Engineering, UTM for the help and assistance in making this project successful.
v
TABLE OF CONTENTS
CHAPTER TITLE PAGE
ABSTRACT ii
ABSTRAK iii
ACKNOWLEDGMENTS iv
TABLE OF CONTENTS v
LIST OF TABLES xii
LIST OF FIGURES xiii
LIST OF ABREVIATIONS xix
LIST OF APPENDICES xxii
I INTRODUCTION 1
1.1 Background 1
1.2 Review of Previous Works 2
1.3 Problem Statement 6
1.4 Objective of Research 6
1.5 Scopes of Research 7
1.6 Limitations of the Study 7
1.7 An Outline of the Report 7
II LITERATURE REVIEW 10
2.1 Introduction 10
2.2 Environmental Problems 10
2.2.1 Acid Rain 11
2.2.2 Ozone Depletion 11
vi
2.2.3 Global Warming 12
2.2.4 Photochemical Smog 12
2.3 Combustor Exhaust Emissions 13
2.3.1 Oxides of Nitrogen 14
2.3.1.1 Nitric Oxide 14
2.3.1.2 Nitrogen Dioxide 16
1.3.1.3 Nitrous Oxide 16
2.3.2 Carbon Monoxide 17
2.3.3 Unburned Hydrocarbon 18
2.3.4 Oxides of Sulphur 19
2.35 Carbon Dioxide 19
2.4 Gas Turbine Combustor 20
2.4.1 Operation of a Gas Turbine Combustor 20
2.4.2 Combustor Arrangement 21
2.4.2.1 Tubular Combustor 21
2.4.2.2 Annular Combustor 23
2.4.2.3 Tuboannular Combustor 24
2.4.3 Combustor Design Requirement 25
2.5 Flame Stabilizer 25
2.5.1 Bluff Body 26
2.5.2 Opposed Jet 26
2.5.3 Sudden Expansion 27
2.5.4 Grid Mix and Jet Mix 27
2.5.5 Axial and Radial Swirler 27
2.6 Injection System 28
2.6.1 Injectors Requirement 29
2.6.2 Atomization Process 30
2.6.2.1 Jet Break Up 30
2.6.2.2 Sheet Break Up 31
2.6.3 Spray Characteristic 32
2.6.3.1 Mean Drop Size 32
2.6.3.2 Drop Size Distribution 33
2.6.3.3 Spray Pattern and Cone Angle 34
2.6.3.4 Dispersion and Penetration 36
vii
2.6.4 Types of Atomizers 36
2.6.4.1 Plain Orifice Atomizer 37
2.6.4.2 Simplex Atomizer 37
2.6.4.3 Wide Range Atomizer 39
2.6.4.4 Spill Return Atomizer 40
2.6.4.5 Fan Spray Atomizer 40
2.6.4.6 Rotary Atomizer 41
2.6.4.7 Air Assist Atomizer 41
2.6.4.8 Air Blast Atomizer 41
2.6.4.9 Slinger System 42
2.7 Air Fuel System 43
III EMISSION CONTROL 45
3.1 Introduction 45
3.2 Factors Influencing NOx Formation 46
3.3 NOx Control Techniques 46
3.3.1 Prevention of NOx Formation 47
3.3.1.1 Premixed Combustor 47
3.3.1.2 Rapid Mixing Combustor 48
3.3.1.3 Variable Geometry Combustor 49
3.3.1.4 Lean Premixed Prevapourized
Combustor 50
3.3.2 Destruction of NOx 50
3.3.2.1 Staged Combustor 51
3.3.2.2 Flue Gas Recirculation Combustor 52
3.3.2.3 Rich-Burn Quench Lean-Burn
Staged Combustor 53
3.3.2.4 Selective Catalyst Reduction
Combustor (SCR) 54
3.3.2.5 Selective Non-Catalyst Reduction
Combustor (SNCR) 55
3.4 Practical Low NOx Combustor 56
viii
IV BURNER DESIGN CONCEPT 58
4.1 Introduction 58
4.2 Combustion Chamber Design 59
4.2.1 Length and Diameter 59
4.2.2 Pressure Loss Parameter 60
4.3 Swirler Design 61
4.3.1 Rapid Mixing System 62
4.3.2 Swirl Flow 62
4.3.3 Effect of Swirl 63
4.3.4 Swirl Stabilized Flame 65
4.3.5 Swirler Pressure Drop 66
4.3.6 Swirl Number 67
4.4 Fuel Injector Design 69
V EXPERIMENTAL SET UP 70
5.1 Introduction 70
5.2 Experimental Set Up 70
5.2.1 Liquid Fuel Burner 71
5.2.1.1 Combustion Chamber 72
5.2.1.2 Swirler and Orifice Plate 72
5.2.1.3 Injector Design 73
5.2.2 Fuel System 73
5.2.2.1 Fuel Tank 74
5.2.2.2 Air Compressor 74
5.2.3 Air Supply System 74
5.2.3.1 Air Compressor 75
5.2.3.2 Blower 75
5.2.4 Instrumentation 75
5.2.4.1 Filter, Lubricator and Regulator
Gauge 76
5.2.4.2 Flow Meters 76
5.2.4.3 Pressure Gauge 76
ix
5.2.4.4 Gas Sampling Probe 76
5.2.4.5 Gas Analyzer 77
5.3 General Test Procedure 78
5.4 Experimental Testing Parameters 79
5.5 Temperature Measurement 81
VI EXPERIMENTAL RESULTS AND
DISCUSSIONS ON COMBUSTION
PERFORMANCE 82
6.1 Introduction 82
6.2 Upstream Injection 83
6.2.1 Temperature Profile in Accordance to
Equivalence Ratio along the Combustion
Chamber Using Orifice Plate of 30mm
with Upstream Injection 83
6.2.2 Emission Investigation Using Orifice
Plate of 30mm with Upstream Injection 87
6.2.3 Temperature Profile in Accordance to
Equivalence Ratio along the Combustion
Chamber Using Orifice Plate of 25mm
with Upstream Injection 90
6.2.4 Emission Investigation Using Orifice
Plate of 25mm with Upstream Injection 94
6.2.5 Temperature Profile in Accordance to
Equivalence Ratio along the Combustion
Chamber Using Orifice Plate of 20mm
with Upstream Injection 97
6.26 Emission Investigation Using Orifice
Plate of 20mm with Upstream Injection 101
6.3 Downstream Injection 103
6.3.1 Temperature Profile in Accordance to
Equivalence Ratio along the Combustion
Chamber Using Orifice Plate of 30mm
x
with Downstream Injection 104
6.3.2 Emission Investigation Using Orifice
Plate of 30mm with Downstream Injection 108
6.3.3 Temperature Profile in Accordance to
Equivalence Ratio along the Combustion
Chamber Using Orifice Plate of 25mm
with Downstream Injection 111
6.3.4 Emission Investigation Using Orifice
Plate of 25mm with Downstream Injection 116
6.3.5 Temperature Profile in Accordance to
Equivalence Ratio along the Combustion
Chamber Using Orifice Plate of 20mm
with Downstream Injection 119
6.3.6 Emission Investigation Using Orifice
Plate of 20mm with Downstream Injection 123
6.3.7 Temperature Profile for Various Swirlers
Using Orifice Plate of 30mm with
Upstream Injection at Equivalence Ratio
of 0.803 126
6.3.8 Temperature Profile for Various Swirlers
Using Orifice Plate of 25mm with
Upstream Injection at Equivalence Ratio
of 0.803 127
6.3.9 Temperature Profile for Various Swirlers
Using Orifice Plate of 20mm with
Upstream Injection at Equivalence Ratio
of 0.803 128
6.3.10 Temperature Profile for Various Swirlers
Using Orifice Plate of 30mm with
Downstream Injection at Equivalence
Ratio of 0.803 130
6.3.11 Temperature Profile for Various Swirlers
Using Orifice Plate of 25mm with
Downstream Injection at Equivalence
xi
Ratio of 0.803 131
6.3.12 Temperature Profile for Various Swirlers
Using Orifice Plate of 20mm with
Downstream Injection at Equivalence
Ratio of 0.803 133
6.4 Discussion on Combustion Temperature Profile 134
6.5 Comparison on Varying Orifice Plate Diameter
and Injection Position 136
VII CONCLUSIONS AND RECOMMENDATIONS
FOR FUTURE WORK 139
7.1 General Conclusions 139
7.2 Conclusion on Combustion Performance 141
7.3 Conclusions on Emission Results 143
7.4 Conclusions on Temperature Profiles 144
7.4 Recommendations for Future Work 145
REFERENCES 146
APPENDICES 149 – 174
xii
LIST OF TABLES
TABLE NO. TITLE PAGE
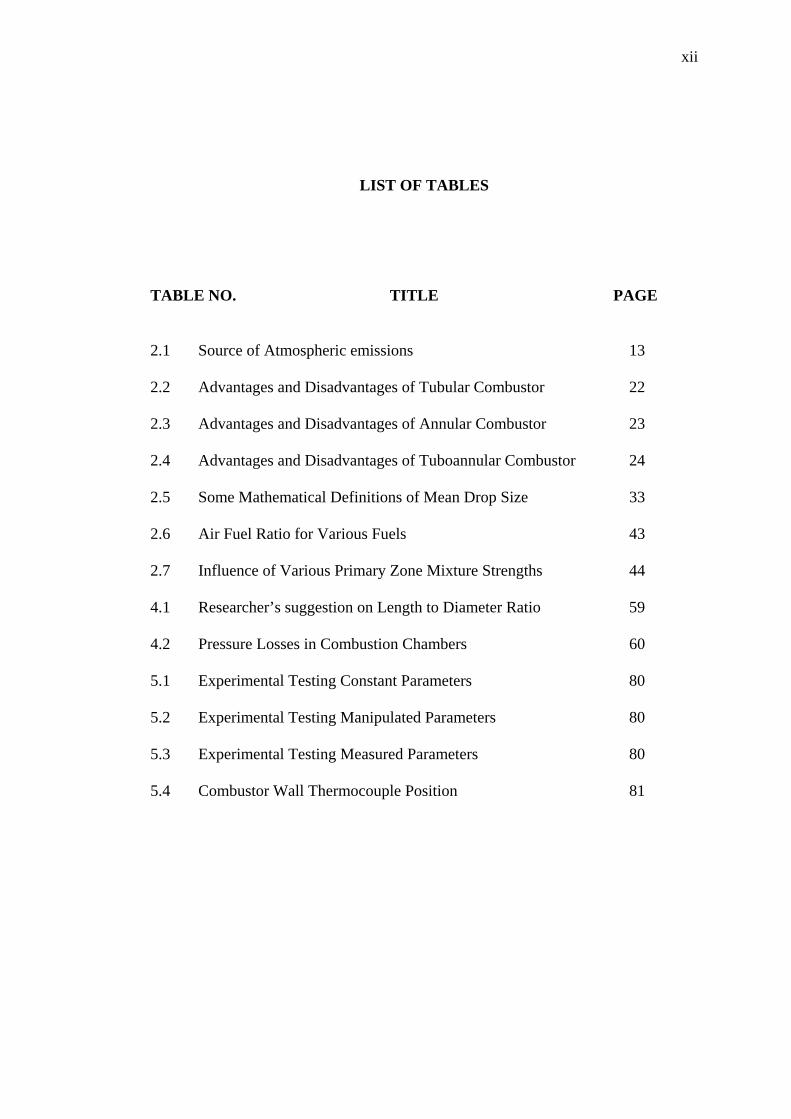
2.1 Source of Atmospheric emissions 13 2.2 Advantages and Disadvantages of Tubular Combustor 22 2.3 Advantages and Disadvantages of Annular Combustor 23 2.4 Advantages and Disadvantages of Tuboannular Combustor 24 2.5 Some Mathematical Definitions of Mean Drop Size 33 2.6 Air Fuel Ratio for Various Fuels 43 2.7 Influence of Various Primary Zone Mixture Strengths 44 4.1 Researcher’s suggestion on Length to Diameter Ratio 59 4.2 Pressure Losses in Combustion Chambers 60 5.1 Experimental Testing Constant Parameters 80 5.2 Experimental Testing Manipulated Parameters 80 5.3 Experimental Testing Measured Parameters 80 5.4 Combustor Wall Thermocouple Position 81
xiii
LIST OF FIGURES
FIGURE NO. TITLE PAGE
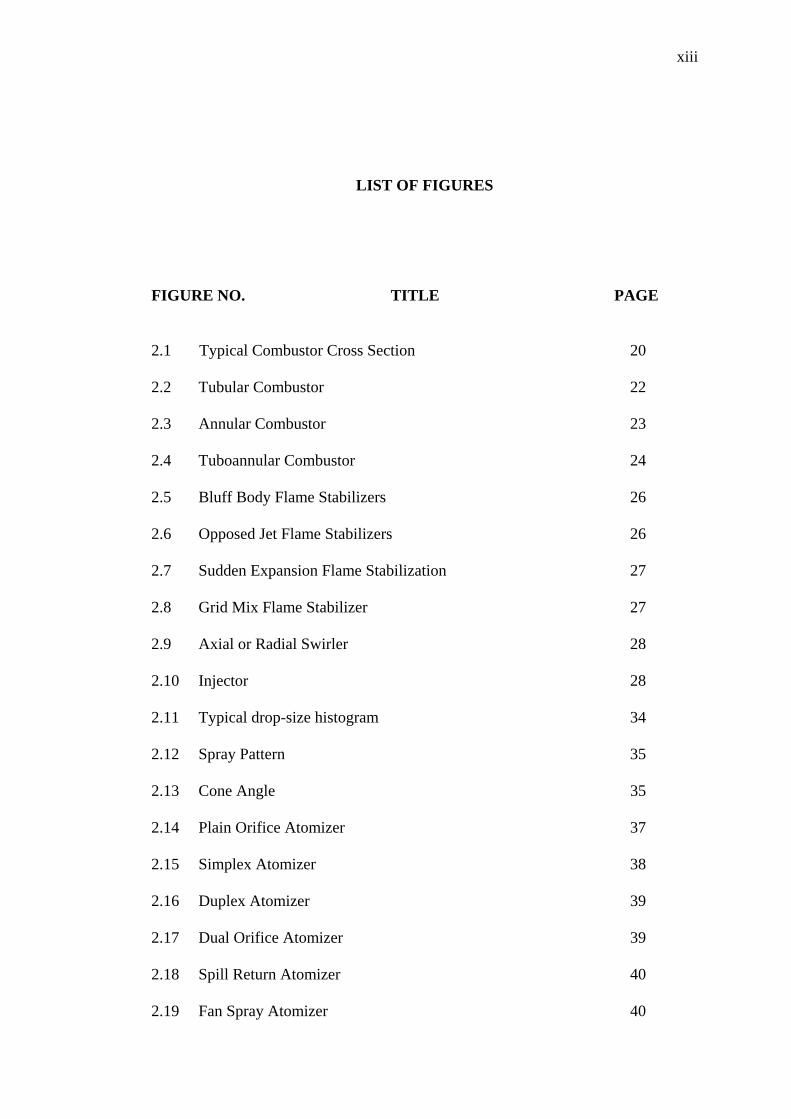
2.1 Typical Combustor Cross Section 20 2.2 Tubular Combustor 22 2.3 Annular Combustor 23 2.4 Tuboannular Combustor 24 2.5 Bluff Body Flame Stabilizers 26 2.6 Opposed Jet Flame Stabilizers 26 2.7 Sudden Expansion Flame Stabilization 27 2.8 Grid Mix Flame Stabilizer 27 2.9 Axial or Radial Swirler 28 2.10 Injector 28 2.11 Typical drop-size histogram 34 2.12 Spray Pattern 35 2.13 Cone Angle 35 2.14 Plain Orifice Atomizer 37 2.15 Simplex Atomizer 38 2.16 Duplex Atomizer 39 2.17 Dual Orifice Atomizer 39 2.18 Spill Return Atomizer 40 2.19 Fan Spray Atomizer 40
xiv
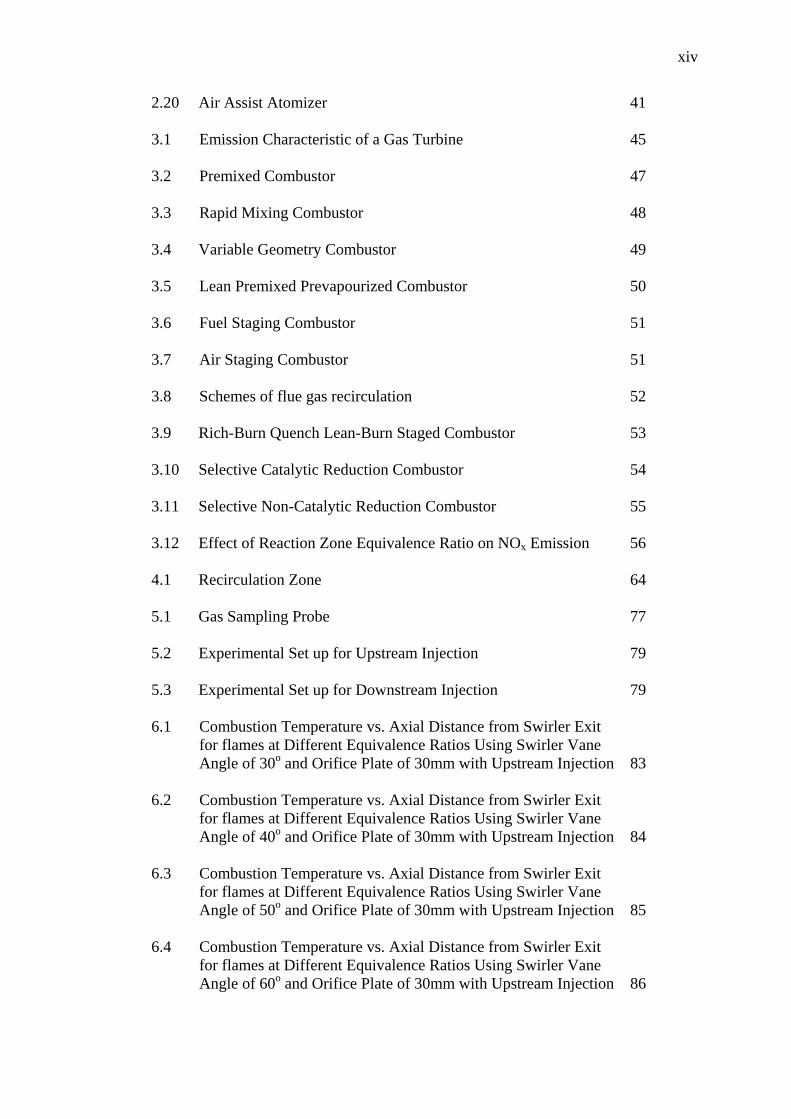
2.20 Air Assist Atomizer 41 3.1 Emission Characteristic of a Gas Turbine 45 3.2 Premixed Combustor 47 3.3 Rapid Mixing Combustor 48 3.4 Variable Geometry Combustor 49 3.5 Lean Premixed Prevapourized Combustor 50 3.6 Fuel Staging Combustor 51 3.7 Air Staging Combustor 51 3.8 Schemes of flue gas recirculation 52 3.9 Rich-Burn Quench Lean-Burn Staged Combustor 53 3.10 Selective Catalytic Reduction Combustor 54 3.11 Selective Non-Catalytic Reduction Combustor 55 3.12 Effect of Reaction Zone Equivalence Ratio on NOx Emission 56 4.1 Recirculation Zone 64 5.1 Gas Sampling Probe 77 5.2 Experimental Set up for Upstream Injection 79 5.3 Experimental Set up for Downstream Injection 79 6.1 Combustion Temperature vs. Axial Distance from Swirler Exit
for flames at Different Equivalence Ratios Using Swirler Vane Angle of 30o and Orifice Plate of 30mm with Upstream Injection 83
6.2 Combustion Temperature vs. Axial Distance from Swirler Exit
for flames at Different Equivalence Ratios Using Swirler Vane Angle of 40o and Orifice Plate of 30mm with Upstream Injection 84
6.3 Combustion Temperature vs. Axial Distance from Swirler Exit
for flames at Different Equivalence Ratios Using Swirler Vane Angle of 50o and Orifice Plate of 30mm with Upstream Injection 85
6.4 Combustion Temperature vs. Axial Distance from Swirler Exit
for flames at Different Equivalence Ratios Using Swirler Vane Angle of 60o and Orifice Plate of 30mm with Upstream Injection 86
xv
6.5 NOx Emission vs. Equivalence Ratio for Various Swirlers Using Orifice Plate of 30mm with Upstream Injection 87
6.6 CO Emission vs. Equivalence Ratio for Various Swirlers
Using Orifice Plate of 30mm with Upstream Injection 88 6.7 SO2 Emission vs. Equivalence Ratio for Various Swirlers
Using Orifice Plate of 30mm with Upstream Injection 89
6.8 Combustion Temperature vs. Axial Distance from Swirler Exit for flames at Different Equivalence Ratios Using Swirler Vane Angle of 30o and Orifice Plate of 25mm with Upstream Injection 90
6.9 Combustion Temperature vs. Axial Distance from Swirler Exit
for flames at Different Equivalence Ratios Using Swirler Vane Angle of 40o and Orifice Plate of 25mm with Upstream Injection 91
6.10 Combustion Temperature vs. Axial Distance from Swirler Exit
for flames at Different Equivalence Ratios Using Swirler Vane Angle of 50o and Orifice Plate of 25mm with Upstream Injection 92
6.11 Combustion Temperature vs. Axial Distance from Swirler Exit for flames at Different Equivalence Ratios Using Swirler Vane Angle of 60o and Orifice Plate of 25mm with Upstream Injection 93
6.12 NOx Emission vs. Equivalence Ratio for Various Swirlers Using Orifice Plate of 25mm with Upstream Injection 94
6.13 CO Emission vs. Equivalence Ratio for Various Swirlers
Using Orifice Plate of 25mm with Upstream Injection 95 6.14 SO2 Emission vs. Equivalence Ratio for Various Swirlers
Using Orifice Plate of 25mm with Upstream Injection 96
6.15 Combustion Temperature vs. Axial Distance from Swirler Exit for flames at Different Equivalence Ratios Using Swirler Vane Angle of 30o and Orifice Plate of 20mm with Upstream Injection 97
6.16 Combustion Temperature vs. Axial Distance from Swirler Exit
for flames at Different Equivalence Ratios Using Swirler Vane Angle of 40o and Orifice Plate of 20mm with Upstream Injection 98
6.17 Combustion Temperature vs. Axial Distance from Swirler Exit
for flames at Different Equivalence Ratios Using Swirler Vane Angle of 50o and Orifice Plate of 20mm with Upstream Injection 99
6.18 Combustion Temperature vs. Axial Distance from Swirler Exit
for flames at Different Equivalence Ratios Using Swirler Vane Angle of 60o and Orifice Plate of 20mm with Upstream Injection 100
xvi
6.19 NOx Emission vs. Equivalence Ratio for Various Swirlers Using Orifice Plate of 20mm with Upstream Injection 101
6.20 CO Emission vs. Equivalence Ratio for Various Swirlers
Using Orifice Plate of 20mm with Upstream Injection 102 6.21 SO2 Emission vs. Equivalence Ratio for Various Swirlers
Using Orifice Plate of 20mm with Upstream Injection 103
6.22 Combustion Temperature vs. Axial Distance from Swirler Exit for flames at Different Equivalence Ratios Using Swirler Vane Angle of 30o and Orifice Plate of 30mm with Downstream Injection 104
6.23 Combustion Temperature vs. Axial Distance from Swirler Exit for
flames at Different Equivalence Ratios Using Swirler Vane Angle of 40o and Orifice Plate of 30mm with Downstream Injection 105
6.24 Combustion Temperature vs. Axial Distance from Swirler Exit for
flames at Different Equivalence Ratios Using Swirler Vane Angle of 50o and Orifice Plate of 30mm with Downstream Injection 106
6.25 Combustion Temperature vs. Axial Distance from Swirler Exit for
flames at Different Equivalence Ratios Using Swirler Vane Angle of 60o and Orifice Plate of 30mm with Downstream Injection 107
6.26 NOx Emission vs. Equivalence Ratio for Various Swirlers Using Orifice Plate of 30mm with Downstream Injection 108
6.27 CO Emission vs. Equivalence Ratio for Various Swirlers
Using Orifice Plate of 30mm with Downstream Injection 109 6.28 SO2 Emission vs. Equivalence Ratio for Various Swirlers
Using Orifice Plate of 30mm with Downstream Injection 110 6.29 Combustion Temperature vs. Axial Distance from Swirler Exit for
flames at Different Equivalence Ratios Using Swirler Vane Angle of 30o and Orifice Plate of 25mm with Downstream Injection 111
6.30 Upstream Flame Profile 112 6.31 Downstream Flame Profile 112 6.32 Combustion Temperature vs. Axial Distance from Swirler Exit for
flames at Different Equivalence Ratios Using Swirler Vane Angle of 40o and Orifice Plate of 25mm with Downstream Injection 113
6.33 Combustion Temperature vs. Axial Distance from Swirler Exit for
flames at Different Equivalence Ratios Using Swirler Vane Angle of 50o and Orifice Plate of 25mm with Downstream Injection 114
xvii
6.34 Combustion Temperature vs. Axial Distance from Swirler Exit for flames at Different Equivalence Ratios Using Swirler Vane Angle of 60o and Orifice Plate of 25mm with Downstream Injection 115
6.35 NOx Emission vs. Equivalence Ratio for Various Swirlers
Using Orifice Plate of 25mm with Downstream Injection 116 6.36 Temperature Profile for Various Equivalence Ratios 117 6.37 CO Emission vs. Equivalence Ratio for Various Swirlers
Using Orifice Plate of 25mm with Downstream Injection 117 6.38 SO2 Emission vs. Equivalence Ratio for Various Swirlers
Using Orifice Plate of 25mm with Downstream Injection 118
6.39 Combustion Temperature vs. Axial Distance from Swirler Exit for flames at Different Equivalence Ratios Using Swirler Vane Angle of 30o and Orifice Plate of 20mm with Downstream Injection 119
6.40 Combustion Temperature vs. Axial Distance from Swirler Exit for
flames at Different Equivalence Ratios Using Swirler Vane Angle of 40o and Orifice Plate of 20mm with Downstream Injection 120
6.41 Combustion Temperature vs. Axial Distance from Swirler Exit for
flames at Different Equivalence Ratios Using Swirler Vane Angle of 50o and Orifice Plate of 20mm with Downstream Injection 121
6.42 Combustion Temperature vs. Axial Distance from Swirler Exit for
flames at Different Equivalence Ratios Using Swirler Vane Angle of 60o and Orifice Plate of 20mm with Downstream Injection 122
6.43 NOx Emission vs. Equivalence Ratio for Various Swirlers Using Orifice Plate of 20mm with Downstream Injection 123
6.44 CO Emission vs. Equivalence Ratio for Various Swirlers
Using Orifice Plate of 20mm with Downstream Injection 124 6.45 SO2 Emission vs. Equivalence Ratio for Various Swirlers
Using Orifice Plate of 20mm with Downstream Injection 125 6.46 Combustion Temperature vs. Axial Distance from Swirler
Exit for Various Swirler Using Orifice Plate of 30mm with Upstream Injection at Equivalence Ratio of 0.803 126
6.47 Combustion Temperature vs. Axial Distance from Swirler
Exit for Various Swirler Using Orifice Plate of 25mm with Upstream Injection at Equivalence Ratio of 0.803 127
6.48 Combustion Temperature vs. Axial Distance from Swirler Exit for Various Swirler Using Orifice Plate of 20mm with
xviii
Upstream Injection at Equivalence Ratio of 0.803 128 6.49 Combustion Temperature vs. Axial Distance from Swirler
Exit for Various Swirler Using Orifice Plate of 30mm with Downstream Injection at Equivalence Ratio of 0.803 130
6.50 Combustion Temperature vs. Axial Distance from Swirler
Exit for Various Swirler Using Orifice Plate of 25mm with Downstream Injection at Equivalence Ratio of 0.803 131
6.51 Combustion Temperature vs. Axial Distance from Swirler
Exit for Various Swirler Using Orifice Plate of 20mm with Downstream Injection at Equivalence Ratio of 0.803 133
xix
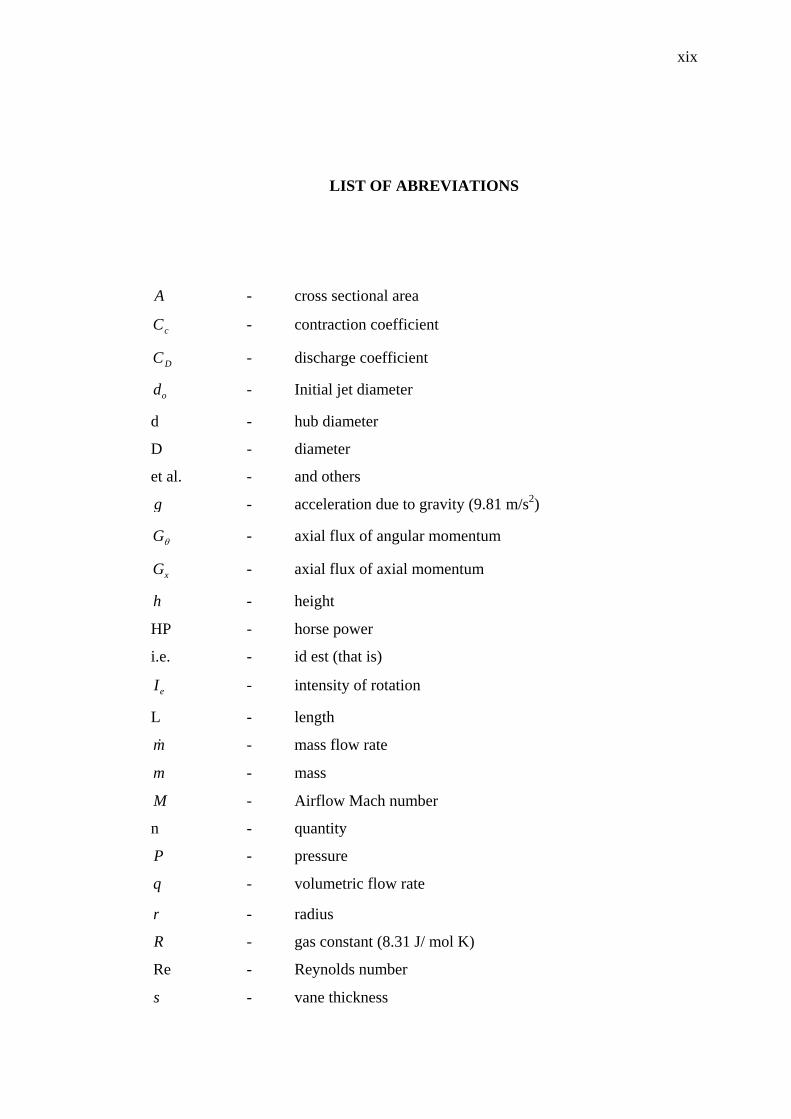
LIST OF ABREVIATIONS
A - cross sectional area
cC - contraction coefficient
DC - discharge coefficient
od - Initial jet diameter
d - hub diameter
D - diameter
et al. - and others
g - acceleration due to gravity (9.81 m/s2)
θG - axial flux of angular momentum
xG - axial flux of axial momentum
h - height
HP - horse power
i.e. - id est (that is)
eI - intensity of rotation
L - length
m& - mass flow rate
m - mass
M - Airflow Mach number
n - quantity
P - pressure
q - volumetric flow rate
r - radius
R - gas constant (8.31 J/ mol K)
Re - Reynolds number
s - vane thickness
xx
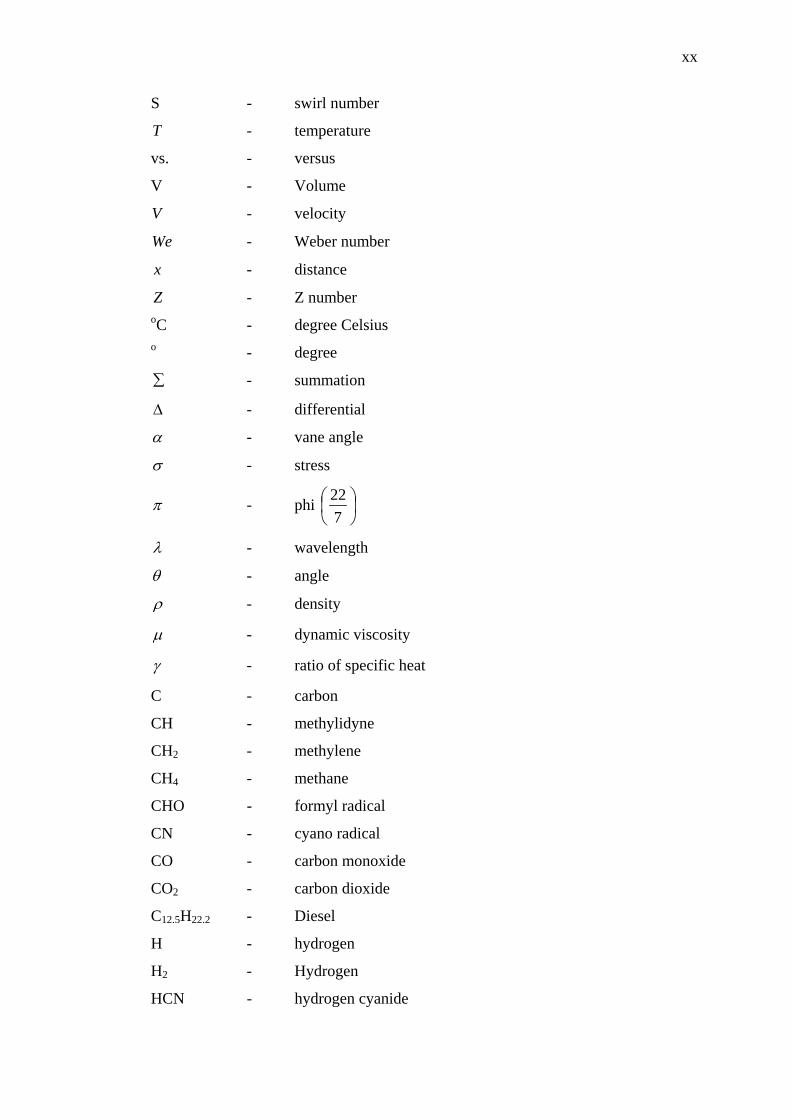
S - swirl number
T - temperature
vs. - versus
V - Volume
V - velocity
We - Weber number
x - distance
Z - Z number oC - degree Celsius o - degree
∑ - summation
∆ - differential
α - vane angle
σ - stress
π - phi ⎟⎠⎞
⎜⎝⎛
722
λ - wavelength
θ - angle
ρ - density
µ - dynamic viscosity
γ - ratio of specific heat
C - carbon
CH - methylidyne
CH2 - methylene
CH4 - methane
CHO - formyl radical
CN - cyano radical
CO - carbon monoxide
CO2 - carbon dioxide
C12.5H22.2 - Diesel
H - hydrogen
H2 - Hydrogen
HCN - hydrogen cyanide
xxi
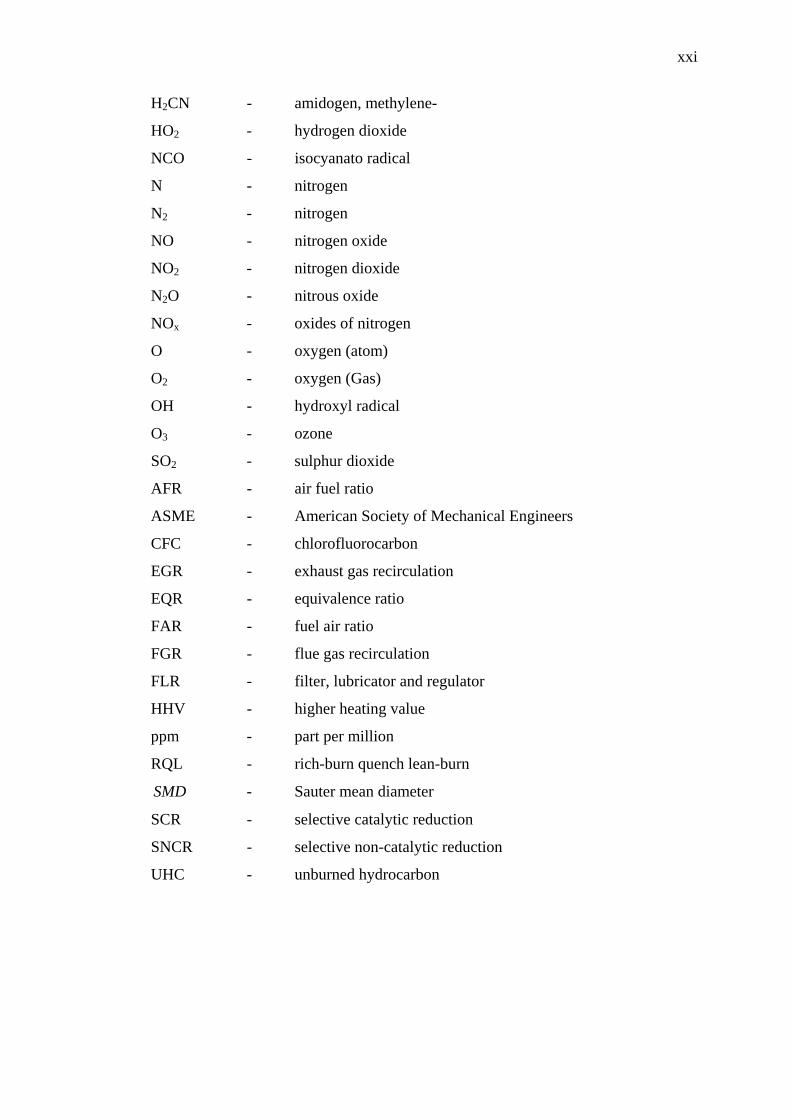
H2CN - amidogen, methylene-
HO2 - hydrogen dioxide
NCO - isocyanato radical
N - nitrogen
N2 - nitrogen
NO - nitrogen oxide
NO2 - nitrogen dioxide
N2O - nitrous oxide
NOx - oxides of nitrogen
O - oxygen (atom)
O2 - oxygen (Gas)
OH - hydroxyl radical
O3 - ozone
SO2 - sulphur dioxide
AFR - air fuel ratio
ASME - American Society of Mechanical Engineers
CFC - chlorofluorocarbon
EGR - exhaust gas recirculation
EQR - equivalence ratio
FAR - fuel air ratio
FGR - flue gas recirculation
FLR - filter, lubricator and regulator
HHV - higher heating value
ppm - part per million
RQL - rich-burn quench lean-burn
SMD - Sauter mean diameter
SCR - selective catalytic reduction
SNCR - selective non-catalytic reduction
UHC - unburned hydrocarbon
xxii
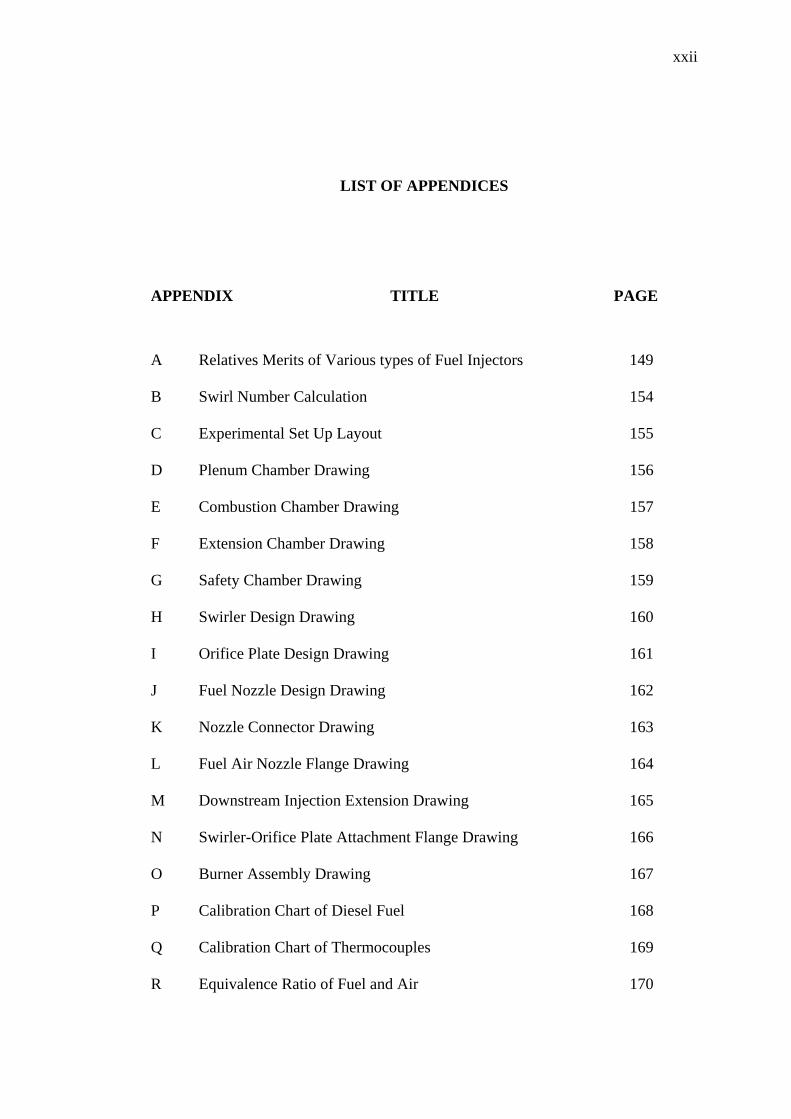
LIST OF APPENDICES
APPENDIX TITLE PAGE
A Relatives Merits of Various types of Fuel Injectors 149 B Swirl Number Calculation 154 C Experimental Set Up Layout 155 D Plenum Chamber Drawing 156 E Combustion Chamber Drawing 157 F Extension Chamber Drawing 158 G Safety Chamber Drawing 159 H Swirler Design Drawing 160 I Orifice Plate Design Drawing 161 J Fuel Nozzle Design Drawing 162 K Nozzle Connector Drawing 163 L Fuel Air Nozzle Flange Drawing 164 M Downstream Injection Extension Drawing 165 N Swirler-Orifice Plate Attachment Flange Drawing 166 O Burner Assembly Drawing 167 P Calibration Chart of Diesel Fuel 168 Q Calibration Chart of Thermocouples 169 R Equivalence Ratio of Fuel and Air 170

xxiii
S Combustion Calculation 171

CHAPTER I
INTRODUCTION
1.1 Background
Global environmental problems such as global warming, acid rain, ozone
layer depletion and photochemical smog have become serious problems all over the
world. Pollution and environmental degradation are discussed in a great deal today,
but it is often spoken of in a way that is disconnected from its cause. Conventional
energy processes can cause major problems to the environment, and it is important to
consider energy issues alongside environmental issues in order to seek solution
effectively.
The increasing use of gas turbine power plants for electricity generation, motor
vehicles and other industrial application causes atmospheric pollution. For several
decades, the gas turbine has been the prime movers for aircrafts, due to the
tremendous advantages in term of speed, fuel economy and passenger comfort.
The combustion of fossil fuels is also a major contributor of four main
environmental concerns. These environmental problems are caused by air pollution
that contains oxides of nitrogen, carbon monoxide and oxides of sulphur. These
environmental problems concern has prompted many governing bodies to legislate
new regulations regarding emissions from combustion process in the hope that these
environmental problems will be reduced.
2
1.2 Review of Previous Works
Past researchers who studied on the effect of varying the swirl strength were
mainly interested on the flow pattern and temperature profiles resulted from varying
the swirl strength. They were emphasizing the effect of swirl on the generation of
torroidal central recirculation zones and flame geometry rather than the effect of
swirl strength on emissions formation.
Mikus, T. and Heywood, J.B. (1971) in their work on automotive gas turbine
concluded that leaning out the primary zone or reducing the residence time of
conventional combustor designs using conventional fuel injection techniques was
unlikely to reduce NO emissions enough to meet emissions standard. This was due to
the presence of stoichiometric fuel and air ratio in parts of the flow within the
primary zone even if the excess air was present. To achieve a significant reduction in
NO emissions, combustors need to be developed with both a leaner and more
homogeneous fuel and air ratio distribution in the primary zone that is attainable in
conventional designs.
Mestre (1974) compared the effect of swirling and non-swirling system on
combustion. He demonstrated that swirl helps to improve combustion efficiency,
decreases all pollutants and increases flame temperature. He also observed that
during the present of swirl, a shorter blue flame was observed indicating good
mixing while non-swirling system showed a longer yellow flame indicating that there
is still some fuel left unvapourized.
A series of combustor tests were conducted by Mularz et. al. (1975) to
evaluate three improved designs of swirl-can combustor modules, using axial
swirlers and their objectives were to obtain low levels of exhaust pollutants while
maintaining high combustion efficiency at combustor operating conditions. He came
with an opinion that swirl-can modules consisted of three components; a carburettor,
an inner swirler and a flame stabiliser. The functions of the module were to mix fuel
and air, swirl the mixture, stabilise combustion in its wake and provide large
interfacial mixing areas between the bypass air around the module and combustion
gases in its wake. They found that swirl-can combustor model performed with high
3
combustion efficiency at all conditions tested but the NOx emissions were still higher
than the maximum allowable level of 20ppm which was needed to achieve the 1979
Environmental Protection Agency (EPA) emissions standards.
Meanwhile, Ballal and Lefebvre (1979), in their study, stressed that for a
premixed flame, the weak extinction limits were governed mainly by inlet air
temperature, to a lesser extent by air velocity and turbulence level and were almost
independent of pressure.
Past researchers also have studied the effect of varying the vane angle, which
in turn vary the swirl number, on combustion performance. Claypole and Syred
(1981) investigated the effect of swirl strength on the formation of NOx. At swirl
number of 3.04, much of the NOx in the exhaust gases was recirculated into the flame
front. The total emissions of NOx were reduced, however, at the expense of reduced
combustion efficiency.
Noyce and Sheppard (1982) investigated the influence of equivalence ratio on
air and fuel mixing. They suggested that at low and high power conditions the high
CO emissions could be minimised by better mixing.
Al-Kabie (1989), on the other hand, studied the effect of radial swirler on
emission reduction in gas turbine combustor. In his study, he imposes swirler
expansion ratio of 1.8 to achieve adequate combustion efficiency. Al-Kabie, in his
study, showed that high efficiency was not achieved in weak region until there was a
significant outer expansion and associated recirculation zone. However, there was a
little influence of the expansion ratio on the weak extinction limit. Alkabie have
shown that if fuel is injected into the outer recirculation zone, in the corner of the
dump expansion region, then NOx emission are high as this recirculation zone has a
high residence time and low refreshment rate with air. To minimise this effect for
burner application, the use of an orifice restriction at the outlet of the wall fuel
injector was used. The intention was to deflect any fuel in the wall region radially
inwards into the shear layer. Various non-conventional fuel injection methods was
studied such as swirler vane passage, radial central and wall injection were used with
gaseous propane and natural gas and liquid kerosene and gas oil. The test was
4
conducted using lean-lean two-stage combustion concept. He demonstrated that there
is no significant effect on NOx emissions by varying the vane angle from 20o to 60o,
hence varying the swirl number from 0.41 to 3.25, respectively. However, he found
that at very high swirl number of 3.25, NOx emissions were considerably higher than
the rest at all associated equivalence ratios for two different inlet air temperature of
400 K and 600 K. This may be due to increased residence time in the rich stabilizing
shear layer and hence increased NOx emissions. The same effect was demonstrated
when he switched from natural gas to propane. Another way to increase the strength
of swirl without changing the vane angle is to decrease the vane depth of the swirler.
Combustion efficiencies were also improved as the swirl strength increased.
Increasing the swirl strength also extends the lean flammability limits.
Bicen et. al. (1990), have reported temperature and species measurements for
annular and tubular combustors using the same axial swirler for flame stabilisation.
The annular combustor was operated at an air/fuel ratio of 29 and fuelled by natural
gas; it displayed a marked improvement in combustion efficiency, 94% compared to
69%, when the inlet air temperature was raised from 315K to 523K. This
improvement was observed to be a result of improved fuel and air mixing.
Meanwhile, the tubular combustor was operated at a leaner fuel/air ratio of 57 and
fuelled by propane, showed a more modest improvement in combustion efficiency,
97.7% compared to 98.8%, when the inlet air temperature was raised from 315K to
523K. They then concluded that from detailed measurements, the increase in
efficiency was due to improved mixing in the combustor. Whitelaw commented that
combustor aerodynamics was more dominant characteristic compared to chemical
kinetics in the primary zone combustion (Bicen, A.F. et. al, 1990).
Escott, N.H. (1993) studied the combusting flow of three method of swirling
generation namely single, coswirl and counterswirl. He used three basic fuel
injection modes of swirler vane passage, central and wall injection. Escott finds that
low NOx emission was achievable through central fuel injection mode, but the lowest
emission results were shown by wall injection method. However, Escott insisted that
the results were strongly dependent on the input temperature and pressure provided
to the flow. Escott also run an experiment on simple fuel staged injection system and
concluded that there was no improvement in either emission or stability compared to
5
non-staged modes. Coswirl and counterswirl combustion system with passage fuel
injection into half of the air flow improved the flame stability but with unacceptable
increase in NOx emissions. From his observation, he concluded that lower NOx
emission was generated by counterswirl system with deteriorated flame stability due
to more vigorous air mixing and consequently leaner fuel occurring in the interjet
shear layer.
Kim, M.N. (1995), in his study, stresses on curved blade radial swirlers with
wall injection and vane passage injection. The fuels were natural gas, propane and
gas oil. He concluded that vane passage injection mode produce lower emission
results compared to 76mm wall injection because of wall injections mode injects the
fuel in the high residence time corner recirculating zone. This created locally rich
zone and high thermal NOx. He also find that natural gas produce lower emission
compared to propane due to the better fuel and air mixing between natural gas and air
since natural gas has a lower molecular weight than propane which means high
diffusivity action and natural gas can be quickly dispersed into turbulent region of
shear layer and hence low NOx formation.
Mohd. Radzi Mohamed Yunus (2002), studied the effect of varying swirler
vane angles on emissions reduction. He found that optimum swirler vane angle for
NOx emission found to be 60o; for CO was 80o and for SO2 was 70o. He suggested
that recirculation zone size and turbulence flow affects emissions significantly.
1.3 Problem Statement
Current researchers hastily moved their intension to post combustion methods
as they found out that post combustion methods could possibly reduce emissions
twice of the pre combustion methods. But, take note that this would heavily increase
the cost which would discourage the industries to venture in. Besides that, post
combustion methods at present situation were almost impossible to apply in aircraft
engines as it would increase the engine weight which opposes the aircraft
applications requirement of producing low weight-high trust engines. This research
6
concerns on the above mentioned problems and carried out a study to discover a
better solution on reducing emission from gas turbine, mainly for aircraft
applications.
1.4 Objective of Research
The main objectives of this project are as follows:
a. To investigate and select a method of reducing pollutions from liquid fuel burner.
b. To design the liquid fuel burner system that incorporates the chosen method.
c. To fabricate the prototype, an efficient and environmental friendly liquid fuel
burner.
d. To evaluate the performance of the prototype burner.
1.5 Scopes of Research
The scope of the research is as follows:
a. Literature survey on existing liquid fuel burner and emissions reduction
techniques.
b. Preliminary design and dimensioning of liquid fuel burner.
c. Preliminary design of burner components such as air swirler, atomiser, etc.
d. Preliminary design analysis based on experimental data of the existing burner and
from simulation results.
e. Detail design of the liquid fuel burner including technical drawings for
fabrication.
f. Construction of the liquid fuel burner prototype, including other components.
g. Testing of liquid fuel burner performance:
(i) Combustion stability
(ii) Flame development and propagation
7
(iii)Emissions production/reduction
(iv) Temperature and pressure profiles across the burner
1.6 Limitation of the Study
(i) The research will be conducted using four different swirler vane angles of
30o, 40o, 50o and 60o.
(ii) Three orifice plate diameters of 20mm, 25mm and 30mm will be used for
experimental testing to study the effect of orifice plate insertion.
(iii) Fuel injection is placed at two positions that is at 15mm upstream or
downstream from the swirler exit.
(iv) Diesel fuel used was supplied by Universiti Teknologi Malaysia, which is
obtained bulkily from Petronas fuel station.
(v) The geometry of combustion chamber, fuel injector, orifice plates and
swirlers are as designed.
(vi) Fuel and injection air are pressurized constantly at 2 bar.
(vii) Flow rate of injection air is constant at 170 l/m.
(viii) Swirling air flow rate will be varied from 24 CFM to 9 CFM, which is
from 679.608 LPM to 254.853 LPM.
1.7 An Outline of the Report
This report consists of seven chapters. Chapter one describes briefly on the
problem statement of current research. Problem statement reveal lacks of previous
researches and illustrates the significant of this research. However, there were some
limitations in the study that has been expressed.
8
Chapter two discusses thoroughly on the literature study. Four main items of
gas turbine combustor; combustion chamber, flame stabilizer, fuel injector and air-
fuel system has been discussed fundamentally. The impact of the emissions towards
environment and human was explained in detail. The requirement that to be fulfilled
on producing a good combustion chamber, flame stabilizer, fuel injector and air-fuel
supply has been discussed for better understanding. Besides that, varieties of these
four items have been highlighted in this section to study the availability and
manufacturability of these items.
Meanwhile, chapter three concerns on the emissions behaviour and emissions
controlling methods. Main concern of this research is to improve the NOx emissions
as CO emissions could be reduced through good mixing of air and fuel. NOx
emission control techniques have been described briefly.
Chapter four, on the other hand, emphasize on the burner design concepts.
This chapter explains the requirement required to build a burner. All four main items
of combustor; combustion chamber, swirler, fuel injector and air fuel system design
concepts has been discussed.
Chapter five elaborates on the experimental testing setup. This chapter
describes clearly on the equipments and instrumentations used for the entire
experimental testings. There were also guidelines on how the experiment has been
conducted.
Chapter six confers about the experimental results and discussion on the
combustion performance of that carried out in the experimental testing. Results has
been compared between four different swirler vane angle of 30o, 40o, 50o and 60o
using three different orifice plate sizes of 20mm, 25mm and 30mm at upstream and
downstream injection position. The behaviour of the emission results and
temperature profiles was discussed thoroughly.
Chapter seven concludes the emission results and temperature profiles
discussions. Recommendation for future work has been stressed in this chapter to

9
provide inspiration for future researchers to continue delivering improvement in
emission reduction from pre combustion burners.
CHAPTER II
LITERATURE REVIEW
2.1 Introduction
Gas turbine technology has developed gradually and continuously over the
past fifty years. Despite continued advances in the technology of gas turbine
combustors, the need to protect the environment from combustion gaseous has led to
considerable demand to improve the combustor design.
Combustion chamber, flame stabilizer, injector and air-fuel mixture system
are the components in a combustor that should be carefully studied in order to
achieve a low emission burner system. In this thesis, the research will focus more on
the swirler vane angles as the main parameter is on lowering burner emission.
2.2 Environmental Problems
The use of fossil fuels is a major source of air pollution, in particular,
emissions of oxides of nitrogen, oxides of carbon and oxides of sulphur. Fossil fuels
combustion is a major contribution of four pressing environmental concerns, which
is, global warming, acid rain, photochemical smog and ozone depletion. This concern
has prompted many governing bodies to legislate regulations on emissions from
combustion process in the hope that these environmental problems will be reduced.
11
2.2.1 Acid Rain
Acid rain has several damaging effects on ecological system. Acid rain falls
and polluted the lakes, river and sea. Lake acidification tends to reduce the
population of its inhabitants. Many lakes around the world are losing their fish
population due to the lake acidification. Acid rain also causes damage to plants and
human health. The main source of acid rain is oxides of sulphur and nitrogen,
predominantly from the combustion processes. In general SO2 contributes about 60
percent of such precipitation, whereas NOx contributes about 35 percent. SO2 content
can be reduced by desulphurization process in the combustion chamber but this
process will tend to increase the NOx in the combustion chamber (Mellor, A.M.,
1990).
2.2.2 Ozone Depletion
Ozone layer has the ability to absorb ultra-violet (UV) radiation from the sun.
A direct UV ray can kill plants and animal cells. It also can cause skin cancer to
human. As the ozone layer absorbs ultra-violet, it may change the temperature
structure of the atmosphere and hence alter the atmospheric circulation. Ozone in the
troposphere is a greenhouse gas. It absorbs the infrared radiation and will trap heat
hence cause the earth to become warmer. The formation and destruction of the ozone
layer should always be in equilibrium to preserve the ozone layer that is protecting
the earth. However, the increased in the concentration of pollution gases in the
atmosphere such as oxides of nitrogen from the combustion processes has led to an
imbalance in this equilibrium. The destruction of the ozone layer occurs at the faster
rate then its formation. The clear sign of ozone depletion was the ‘ozone hole’ that
was reported in 1984 (Mellor, A.M., 1990). Since then, ozone hole was reported each
year.
12
2.2.3 Global Warming
Global warming or known as greenhouse effect is a phenomenon described
by a rise in the earth atmospheric temperature. This rise of temperature is caused by
the imbalance of the energy of the earth. Greenhouse gases play an important role to
reflect back the ultraviolet radiation that penetrates the earth’s atmosphere as infrared
radiation. Greenhouse gases are carbon dioxide (CO2), methane (CH4), ozone (O3),
nitrous oxide (N2O) and chlorofluorocarbon (CFC).
Atmosphere emits less energy into space than the earth’s surface. This is
because the atmosphere’s average temperature is lower, roughly -18°C. The different
between the energy emitted by the earth and the atmosphere is absorbs by the
atmosphere. This energy trapping process is called the greenhouse effect. The
greenhouse effect keeps the global temperature at a habitable 15°C rather than a
hostile -18°C (Mellor, A.M., 1990). However, if the concentration in the atmospheric
carbon dioxide increases, the global temperature will be higher. This phenomenon
will cause global climate change. CO2 is the biggest contributor to global warming.
The effect of the doubling in carbon dioxide concentration will raise the global
average surface temperature by 2 ± 1 K (Mellor, A.M., 1990).
2.2.4 Photochemical Smog
Photochemical smog is a phenomenon that happened when there are air
stagnation, abundant sunlight and high concentration of hydrocarbon and oxides of
nitrogen in the atmosphere (Escott, N.H., 1993).
Smog arises from photochemical reactions in the lower atmosphere by the
interaction of hydrocarbons and nitrogen dioxide released by the exhausts of motors
and combustion processes. This interaction results in a series of more complex
reactions producing secondary pollutants such as ozone, aldehydes, ketones and
peroxyacyl nitrates.
13
2.3 Combustor Exhaust Emissions
Generally there are four major pollutants from any combustion processes.
These are oxides of nitrogen (NOx), carbon monoxide (CO), unburned hydrocarbon
(UHC) and smoke. Sulphur dioxide (SO2) is present if the fuel used during the
combustion processes contained sulphur. In this research, concern was on the three
hazardous pollutants that are oxides of nitrogen, carbon monoxide and sulphur
dioxide since these pollutants has detrimental effect on the health and environment.
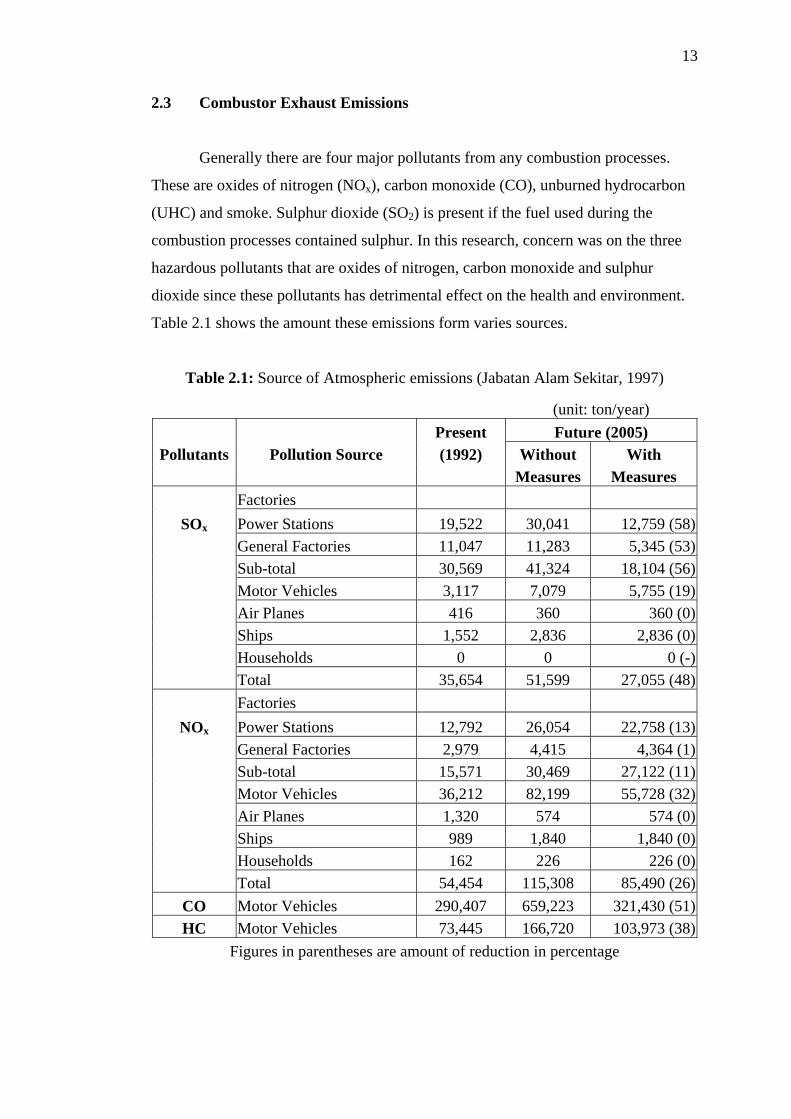
Table 2.1 shows the amount these emissions form varies sources.
Table 2.1: Source of Atmospheric emissions (Jabatan Alam Sekitar, 1997)
(unit: ton/year) Present Future (2005)
Pollutants Pollution Source (1992) Without With Measures Measures Factories
SOx Power Stations 19,522 30,041 12,759 (58) General Factories 11,047 11,283 5,345 (53) Sub-total 30,569 41,324 18,104 (56) Motor Vehicles 3,117 7,079 5,755 (19) Air Planes 416 360 360 (0) Ships 1,552 2,836 2,836 (0) Households 0 0 0 (-) Total 35,654 51,599 27,055 (48) Factories
NOx Power Stations 12,792 26,054 22,758 (13) General Factories 2,979 4,415 4,364 (1) Sub-total 15,571 30,469 27,122 (11) Motor Vehicles 36,212 82,199 55,728 (32) Air Planes 1,320 574 574 (0) Ships 989 1,840 1,840 (0) Households 162 226 226 (0) Total 54,454 115,308 85,490 (26)
CO Motor Vehicles 290,407 659,223 321,430 (51)HC Motor Vehicles 73,445 166,720 103,973 (38)
Figures in parentheses are amount of reduction in percentage
14
2.3.1 Oxides of Nitrogen
Oxides of nitrogen (NOx) are the term given for the combustion product of
nitrogen such as nitric oxide (NO), nitrogen dioxide (NO2) and nitrous oxide (N2O).
NO2 is the dominant form of NOx in fuel lean burning but NO is the dominant form
of NOx from combustion processes. The major source of nitrogen in combustion
processes is the air itself.
2.3.1.1 Nitric Oxide
Nitric oxide (NO) is the direct precursor of NO2. The rate of oxidation from
NO to NO2 is too slow to give significant conversion during the short time of
resident time in the combustion process. This reaction, however, has ample time to
take place once released into the atmosphere. NO has some harmful effects on health
but these effects are substantially less than those of an equivalent amount of NO2.
NO and NO2 interact with the smog producing atmospheric photolytic cycle in
different ways. Concentration of NO2 are generally lower than those of NO but large
concentration of NO2 as a primary pollutant can reduce the induction time for
photochemical smog since the relatively slow NO to NO2 oxidation steps is
bypassed. NO does not irritate the lungs but forms methemoglobin when absorbed.
NO is an endogenous modulator of the vascular pressure (Al-Kabie, H.S., 1989).
An additional augmentation of NO formation is the temperature fluctuation.
In turbulent flames instantaneous temperature levels will exceed the time average
temperature level due to mixing imperfection and NO formation will be increased
above the level predicted on the basis of the time average temperature (Kim, M.N.,
1995). The fluctuation occurs due to variation in the mixture ratio and bulk
movement of the flame.
NO can be produced by three different mechanism that is thermal NO,
prompt NO and fuel NO.
15
Thermal NO is produced by oxidation of atmospheric nitrogen in the post
flame gases and refers to NO formation in the combustion of lean and near
stoichiometric fuel-air mixtures as suggested by the Zeldovich chain mechanism. The
concentration of O2 is low in fuel rich combustion therefore Reaction (1.3) is less
important than in fuel lean combustion. Meanwhile, high activation energy is needed
to break the N2 triple bond in Reaction (1.2) therefore this reaction was concern in
very high temperature combustion that is greater than 1500oC (Escott, N.H., 1993).
221 O ………. (2.1) O
2NO + NNO + ………. (2.2)
2ON + ONO + ………. (2.3)
Prompt NO is produced by high speed reactions at the flame front for
hydrocarbon fuels. Term prompt NO is used because the NO is formed in the flame
front and not in the post flame gases like thermal NO. Flame temperature does not
rely on the prompt NO. Kim (1995) suggested that prompt NO is the major source of
NO emission in lean burning swirl stabilized flame. Meanwhile Fenimore (1970)
observed that the amount of prompt NO increased markedly as the flame passes from
fuel lean to fuel rich condition. The N atom produced in Reactions (1.4), (1.6) and
(1.7) then react with O2 in Reaction (1.3) to produce more NO (Escott, N.H., 1993).
2NCH + NHCN + ………. (2.4)
22 NCH + NHHCN + ………. (2.5)
22 NCH + NCNH +2 ………. (2.6)
2NC + NCN + ………. (2.7)
Fuel NO is produced by oxidation of nitrogen contained in the fuel. The fuel
nitrogen is converted to HCN in the flame zone and depending on the degree of
nitrogen conversion; the fuel NO represents a considerable portion of the total NO.
For liquid fuel, kerosene does not contain fuel bound nitrogen, but gas oil contains
significant amount of nitrogen. Fuels that contain sulphur and organically bound
nitrogen produce complicated interactions that promote the formation of further NO.
16
2.3.1.2 Nitrogen Dioxide
Nitrogen dioxide (NO2) has been known to have adverse effect on the human
respiratory system. It has an affinity for haemoglobin, which carries oxygen to body
tissues. It also forms acid in the lungs. Nitrogen dioxide is much more toxic than CO
for the same concentrations. Besides that, it also forms smog from a series of
photochemical reactions. Epidemiological studies of exposure to the nitrogen dioxide
released during cooking with gas indicate an increase frequency of respiratory illness
among children. NO2 is formed by the oxidation of NO as shown below (Escott,
N.H., 1993).
MON ++2 MNO +2 ………. (2.8)
2ONONO ++ 22 NONO + ………. (2.9)
2HONO + OHNO +2 ………. (2.10)
In hot regions of the flame the reverse of Reaction (1.9) occurs. The
conversion of NO to NO2 by Reaction (1.10) is generally slow because HO2
concentration is low, however in fuel lean conditions HO2 concentration increases
(Flagan, R.C. and Seinfeld, J.H., 1988).
2.3.1.3 Nitrous Oxide
The increase of nitrous oxide (N2O) concentration in the atmosphere
contributes to the greenhouse effect and depletes the stratospheric ozone layer and
this would increase ultraviolet radiation to the earth’s surface and with it the
occurrence of skin cancer in the population (Crutzen, P.J., 1970) and (Sothern, A.,
1979). Nitrous oxide is formed mainly from biological activity of the soil. This gas
is not a potential health problem, nor does having a damaging effect on vegetation.
Only 20% of this gas is produced by fossil fuel combustion.
N2O normally formed due to fuel NO where the fuel itself is nitrogen
bounded. However, Escott (1993) suggested that N2O could be formed through
17
prompt NO as well as in the fuel NO. The reaction of combustion product to form
N2O is as shown below (Escott, N.H., 1993).
.
OHHCN + HHNCO + ………. (2.11)
OHCN + HNCO + ………. (2.12)
OHHNCO + OHNCO 2+ ………. (2.13)
The NCO radical then reacts with NO to form:
NONCO + COON +2 ………. (2.14)
Studies have shown that temperature is a vital factor in the formation of N2O with the
maximum concentration of N2O occurring around 750oC. At temperature lower than
750oC, Reaction (1.11) dominated thus N2O prevented. As temperature increases
above 750oC, N2O is prevented by the reaction (Escott, N.H., 1993):
HON +2 OHN +2 ………. (2.15)
OHON +2 22 HON + ………. (2.16)
MON +2 MON ++2 ………. (2.17)
OON +2 22 ON + ………. (2.18)
OON +2 NONO + ………. (2.19)
2.3.2 Carbon Monoxide
Carbon monoxide (CO) has a strong affinity to the haemoglobin of the
bloodstream and is a dangerous asphyxiates. It produces carboxyhaemoglobin when
it reacts with the proteins in the lungs. Carboxyhaemoglobin reduces the oxygen-
carrying capacity of the blood and has the potential to starve the brain and other
tissues of oxygen. At a low concentration, it has potential to cause headaches, slow
reflexes, reduce manual dexterity, decrease exercise capability and cause drowsiness.
At a high concentration, carbon monoxide can cause death.
18
Rapid reaction between hydrocarbons from the fuel and the air in the
combustion process generates CO emission. This rapid reaction between
hydrocarbon fuels and air will form CH2O and CHO that will then further react with
other radicals to form CO (Escott, N.H., 1993).
OHOCH +2 OHHCO 2++ ………. (2.20)
2OCHO + 2HOCO + ………. (2.21)
MCHO + MHCO ++ ………. (2.22)
Emission level of CO can only be minimised by completing its oxidation to
carbon dioxide (CO2). Conditions favourable to the oxidation of CO are high
temperature, oxygen availability, high pressure and long residence time. The
predominant mechanism for CO oxidation is:
OHCO + HCO +2 ………. (2.23)
2.3.3 Unburned Hydrocarbon
Unburned hydrocarbon (UHC) is also a product of incomplete combustion. A
complete combustion does not produce hazardous emission, but it is impossible to
produce complete combustion because the fuel-air mixing and ignition occur at a
very rapid process. Unburned hydrocarbon is usually formed due to poor
atomisation, inadequate burning rates and the chilling effects of burner walls or any
combination of these. Some hydrocarbon species does not provide a serious health
hazard. Other hydrocarbons could cause cancer when its deposition is above certain
level. UHC also acts as a precursor to the formation of photochemical smog.
The inability to complete the combustion of the fuel affects the combustion
efficiency. So maximising the combustion efficiency could reduce emission of
hydrocarbons. Besides that, excess air also could reduce the combustion efficiency
due to the lowering of temperatures and the increase in heat losses arising as mass
19
flow rate of exhaust gases increased. Residence time is also another factor to satisfy
for good mixing in the combustor. Combustor should not be overloaded, that the heat
extraction during the combustion is controlled, so that exhaust gases are not
quenched before the combustion reactions can go to completion. This entire variable
is interrelated.
2.3.4 Oxides of Sulphur
Sulphur dioxide (SO2) presents in the combustion process when there are
sulphur content in the fuel used in the combustion process. Normal persons who
inhale sulphur dioxide for a brief period could exhibit shallower and more rapid
breathing. The presence of aerosol may sweep the sulphur dioxide molecules deep
into the respiratory system that may cause respiratory illnesses. Besides that, low
concentration of sulphur dioxide, in association of other irritant gases and particles
that are present, are sufficient to impair the function of the lungs (Crutzen, P.J.,
1970). Oxides of sulphur also act as precursor to the formation of acid rain.
2.3.5 Carbon Dioxide
Carbon dioxide emission (CO2) is stable and non-toxic but it is a greenhouse
gas and can contribute to global climate change. There is no effective process to
reduce this emission. The only way to reduce this emission is to burn less carbon.
The only way of achieving this is by using lower carbon fuels (Kim, M.N., 1995).
20
2.4 Gas Turbine Combustor
Gas turbine engines are widely used in aircraft, marine, power generation and
industrial application due to largely tremendous advantages in term of range, speed,
fuel economy, passenger comfort, compactness and high power output.
Conventional gas turbine combustion chamber essentially consists of three
main sections. These are primary, intermediate and dilution zones. The most vital
section for the combustion chamber designer is the primary zone since combustion of
fuel is initiated in this section (Al-Kabie, H.S., 1989). The achievement of complete
combustion in the primary zone is the aim of the present work which reduces the
need for other sections of the combustors fulfilling the requirement of small size and
light weight of gas turbines.
2.4.1 Operation of a Gas Turbine Combustor
Fuel
Injector Liner Cooling Holes
Fi
Th
intermedia
Dome
Primary Holes
PrimaryZone
Intermediate Zone
Dilution Zone
Intermediate Holes Dilution Holes
Diffuser
Casing r
Snout
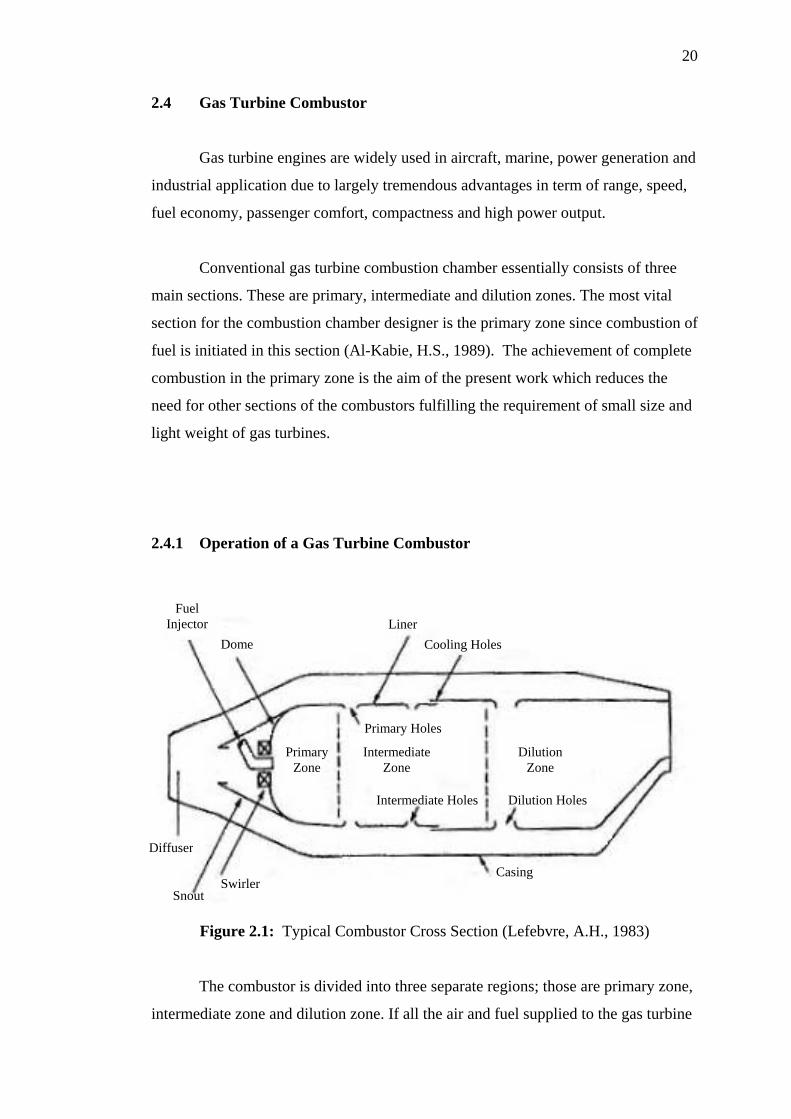
Swirlegure 2.1: Typical Combustor Cross Section (Lefebvre, A.H., 1983)
e combustor is divided into three separate regions; those are primary zone,
te zone and dilution zone. If all the air and fuel supplied to the gas turbine
21
engine were supplied into the combustor directly, the resulting mixture would have a
fuel-air ratio lower than the lean flammability limits. Thus the combustion is initiated
and stabilized by the controlled mixing of fuel and air in the primary zone and the
exact fuel-air ratio of the mixture will depend on the approach to emission reduction
that is adopted, either lean, stoichiometric or rich. Stoichiometry refers to the amount
of air required theoretically to combust completely a particular amount of fuel.
The role of the primary zone in the combustor is to ensure complete
combustion of the fuel by providing sufficient time, temperature and turbulence. The
intermediate zone serves as an extension to the primary zone providing an increased
residence time at high temperature prior to cooling and virtual freezing of reaction in
the dilution zone. Meanwhile, the role of the dilution zone is to admit the air
remaining after the combustion and wall cooling requirement have been met, and to
provide an outlet stream with a mean temperature and a temperature distribution that
are acceptable to the turbine.
2.4.2 Combustor Arrangement
There are three common combustor arrangement; tubular, annular and
tuboannular type combustors. Tubular combustor is also known as can-type
combustor.
2.4.2.1 Tubular Combustor
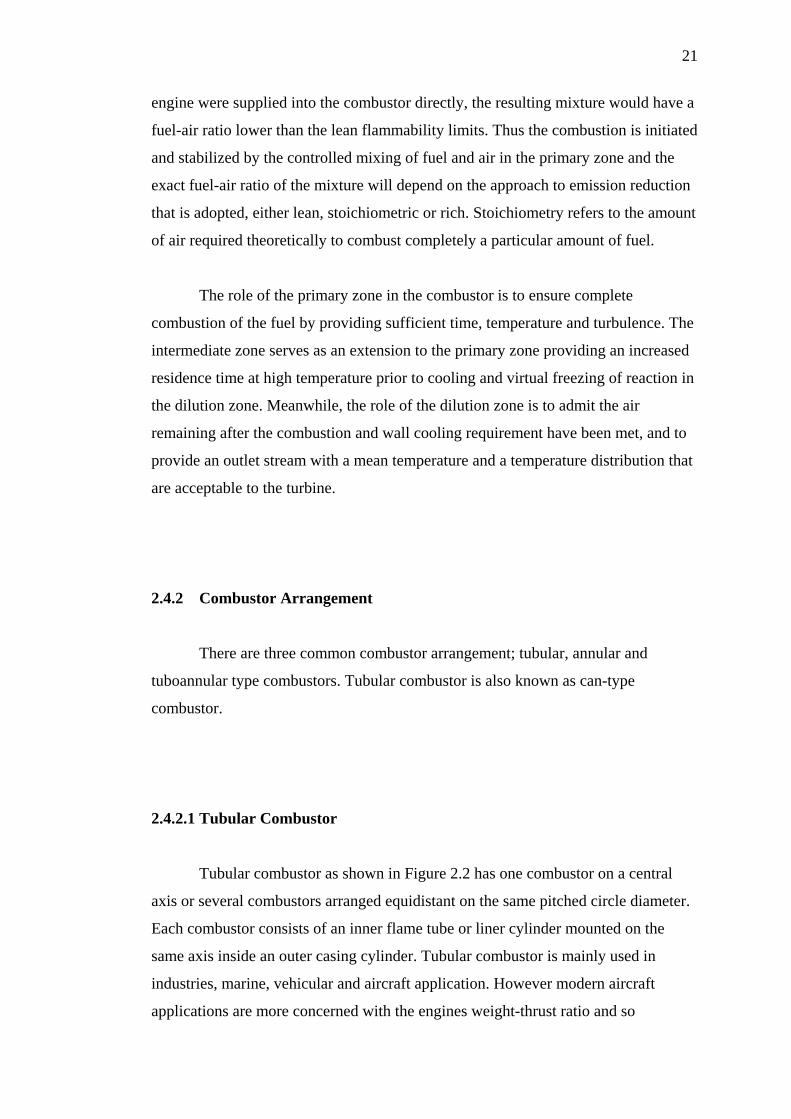
Tubular combustor as shown in Figure 2.2 has one combustor on a central
axis or several combustors arranged equidistant on the same pitched circle diameter.
Each combustor consists of an inner flame tube or liner cylinder mounted on the
same axis inside an outer casing cylinder. Tubular combustor is mainly used in
industries, marine, vehicular and aircraft application. However modern aircraft
applications are more concerned with the engines weight-thrust ratio and so
22
combustors that have a larger combustion volume, hence more thrust, are preferred.
The advantages and disadvantages of tubular combustor were shown in Table 2.2.
Main Fuel ManifoldCompressor Outlet Elbow Flange Joint
Engine Fireseal Combustion Chamber
Air Casing Primary Air Scoop Interconnector
Draft Tube Primary Fuel Manifold
Figure 2.2: Tubular Combustor (Treager, I.E., 1995)
Table 2.2: Advantages and Disadvantages of Tubular Combustor (Treager, I.E., 1995)
Advantage Disadvantage
1. Mechanically Robust 1. Bulk and weight
2. Small variation between individual
combustor in combustion and
aerodynamic performance
2. Ignitor for each combustor increases
complexity of design except for single
combustor
3. Rig testing can be performed with just
one combustor using a fraction of the
total engine air and fuel mass flow
3. Interconnection tubes between
combustors for the air flow except for
single combustor
4. Problems associated with the initiation
in combustion in all combustors
except for single combustor
5. High pressure loss
23
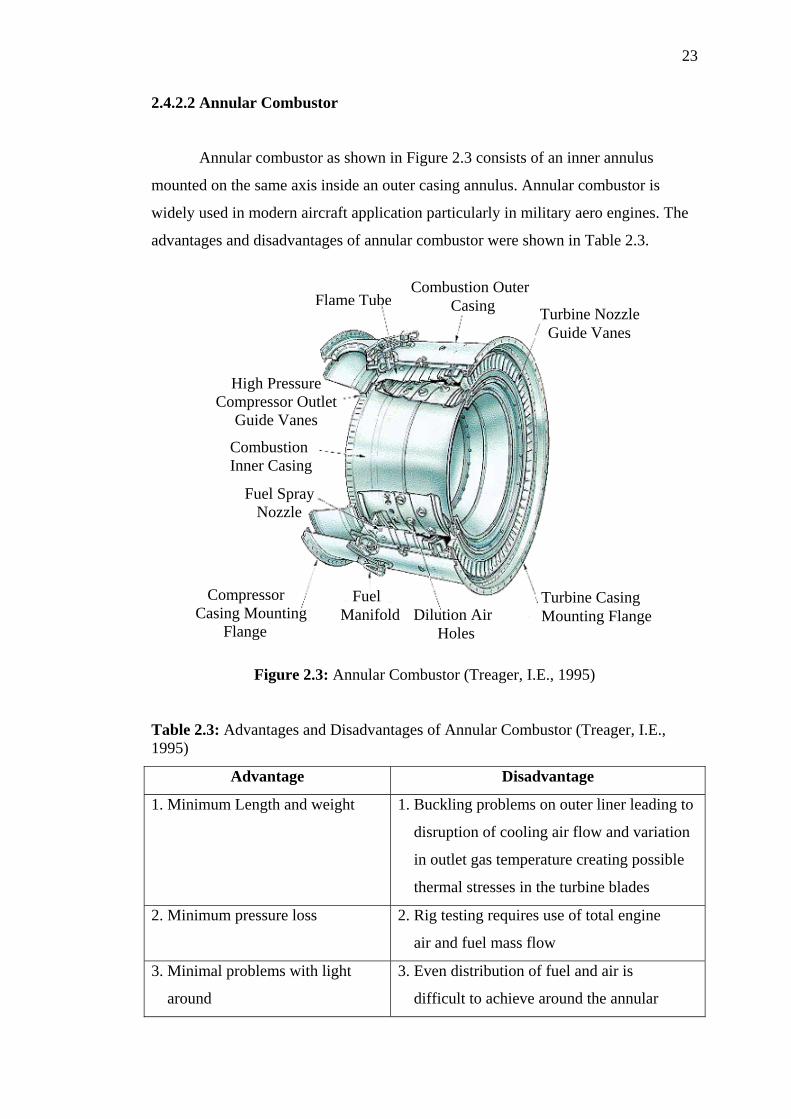
2.4.2.2 Annular Combustor
Annular combustor as shown in Figure 2.3 consists of an inner annulus
mounted on the same axis inside an outer casing annulus. Annular combustor is
widely used in modern aircraft application particularly in military aero engines. The
advantages and disadvantages of annular combustor were shown in Table 2.3.
Combustion Outer Casing e
C
Figure 2
Table 2.3: Advantages a1995)
Advantage
1. Minimum Length and
2. Minimum pressure los
3. Minimal problems wit
around
Flame Tub
Turbine Nozzle Guide Vanes
Fuel Manifold
Turbine Casing Mounting Flange Dilution Air
Holes
Compressor Casing Mounting Flange
Fuel Spray Nozzle
Combustion Inner Casing
High Pressure ompressor Outlet
Guide Vanes
.3: Annular Combustor (Treager, I.E., 1995)
nd Disadvantages of Annular Combustor (Treager, I.E.,
Disadvantage
weight 1. Buckling problems on outer liner leading to
disruption of cooling air flow and variation
in outlet gas temperature creating possible
thermal stresses in the turbine blades
s 2. Rig testing requires use of total engine
air and fuel mass flow
h light 3. Even distribution of fuel and air is
difficult to achieve around the annular
24
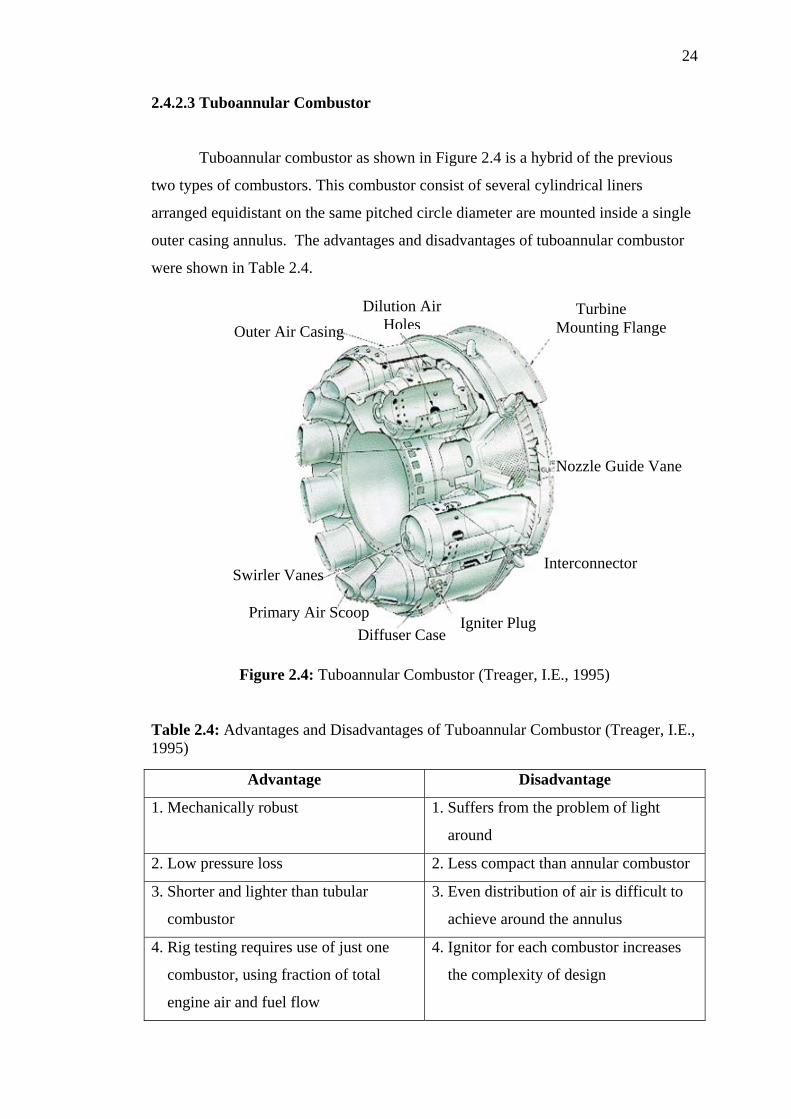
2.4.2.3 Tuboannular Combustor
Tuboannular combustor as shown in Figure 2.4 is a hybrid of the previous
two types of combustors. This combustor consist of several cylindrical liners
arranged equidistant on the same pitched circle diameter are mounted inside a single
outer casing annulus. The advantages and disadvantages of tuboannular combustor
were shown in Table 2.4.
Dilution Air Holes
Turbine Mounting FlangeOuter Air Casing
Nozzle Guide Vane
Interconnector Swirler Vanes
Primary Air ScoopIgniter Plug
Diffuser Case
Figure 2.4: Tuboannular Combustor (Treager, I.E., 1995)
Table 2.4: Advantages and Disadvantages of Tuboannular Combustor (Treager, I.E., 1995)
Advantage Disadvantage
1. Mechanically robust 1. Suffers from the problem of light
around
2. Low pressure loss 2. Less compact than annular combustor
3. Shorter and lighter than tubular
combustor
3. Even distribution of air is difficult to
achieve around the annulus
4. Rig testing requires use of just one
combustor, using fraction of total
engine air and fuel flow
4. Ignitor for each combustor increases
the complexity of design
25
2.4.3 Combustor Design Requirement
The basic function of a combustor is to convert admitted fuel and air mixture
to a temperature rise for the turbine stage. However there are wide varieties of
criteria that also need to be considered in order to achieve the best combustor design.
The criteria are (Fricker,N. and Leuckel,W., 1976):
1. The combustor must be capable of reliable and smooth ignition over a wide
range of ambient conditions.
2. After ignition, the flame must stay alight over wide range of inlet
temperature, pressure and equivalent ratio.
3. The fuel should be completely burned so that all of its chemical energy is
liberated as heat, typically modern combustors achieve combustion
efficiencies of 99.9 percent over a wide range of equivalent ratios.
4. The pressure loss of the combustor should be low, between 2-7 percent of the
combustor inlet pressure. Higher pressure loss would result in higher
compressor pressures.
5. The temperature distribution at the exit of the combustor often needs to be
altered in order to increase the life of turbine blades.
6. Low emissions of carbon monoxide, unburned hydrocarbons, oxides of
nitrogen, oxides of sulphur and soot will be necessary to pass ever more
stringent emission limits.
7. All combustor types must be designed to be durable and safe.
8. Aero engine requires short combustor length to keep the engine light weight.
9. Stationary and vehicular engines often require multifuel capability.
2.5 Flame Stabilizer
One of the main basic requirements of the combustor is to support
combustion over a wide range of operating conditions. This could be achieved by an
appropriately designed flame stabilizer. Flame stabilization could be achieved if a
sheltered region is provided to entrain and recirculates some of the hot combustion
26
burnt gases with the fresh incoming fuel and air mixture. There are several types of
flame stabilizer such as bluff bodies, opposed jets, jet mix and grid mix, axial swirler
and radial swirler.
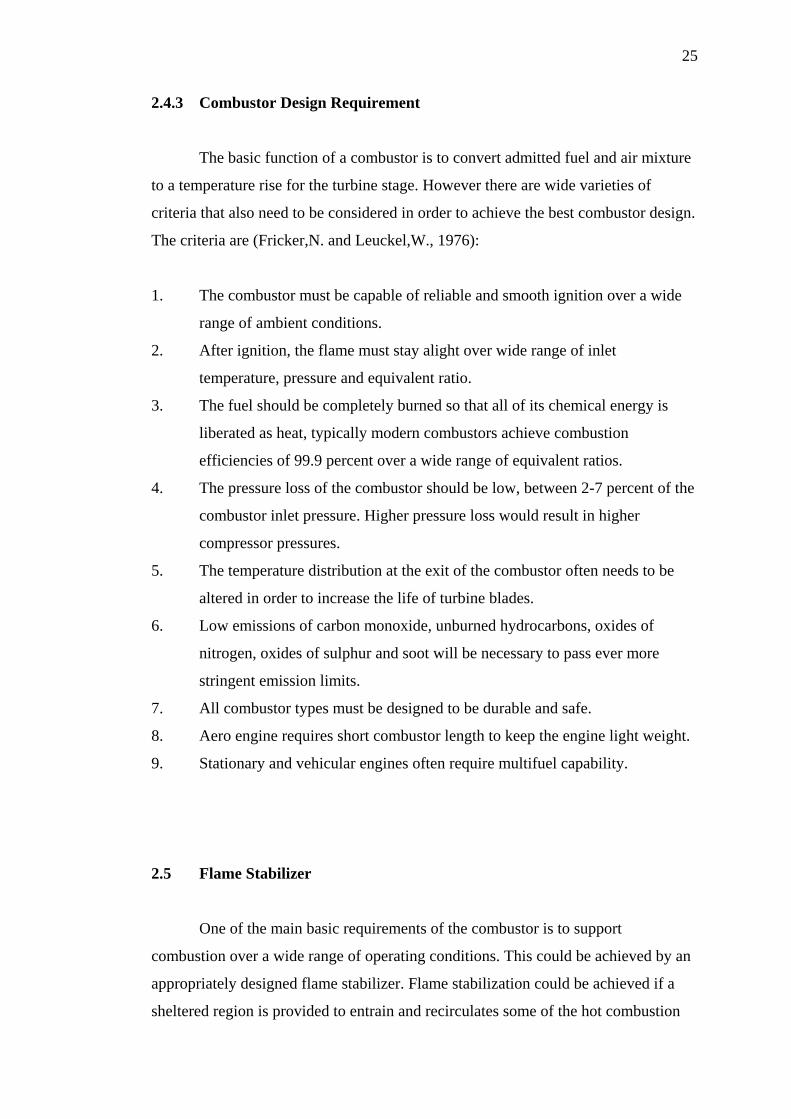
2.5.1 Bluff Body
The bluff body flame stabilizer causes a flow recirculation by creating a low
pressure zone in its near wake region.
ww
Air FloFigure 2.5: Bluff Body Fla
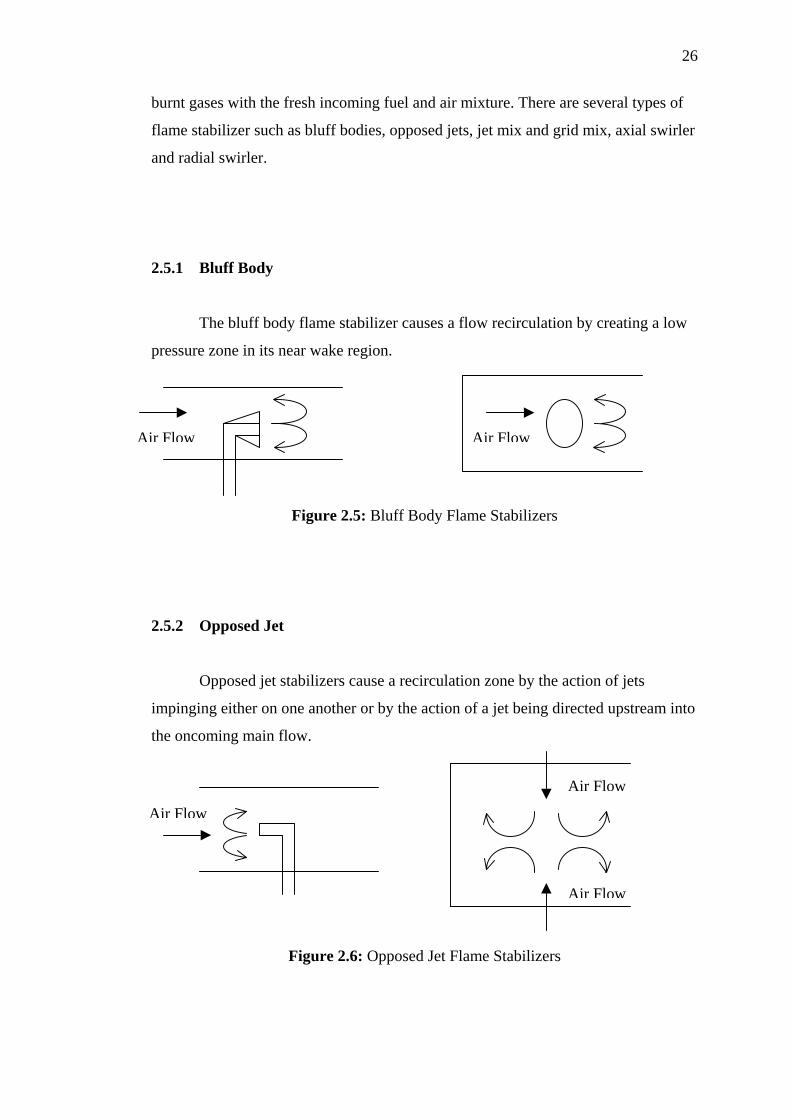
2.5.2 Opposed Jet
Opposed jet stabilizers cause a recirculati
impinging either on one another or by the action
the oncoming main flow.
w
Figure 2.6: Opposed Jet Fla
Air Flo
me Stabilizers
on zone by the action of jets
of a jet being directed upstream into
w
me Stabilizers
Air Flo
w
Air FloAir Flo
27
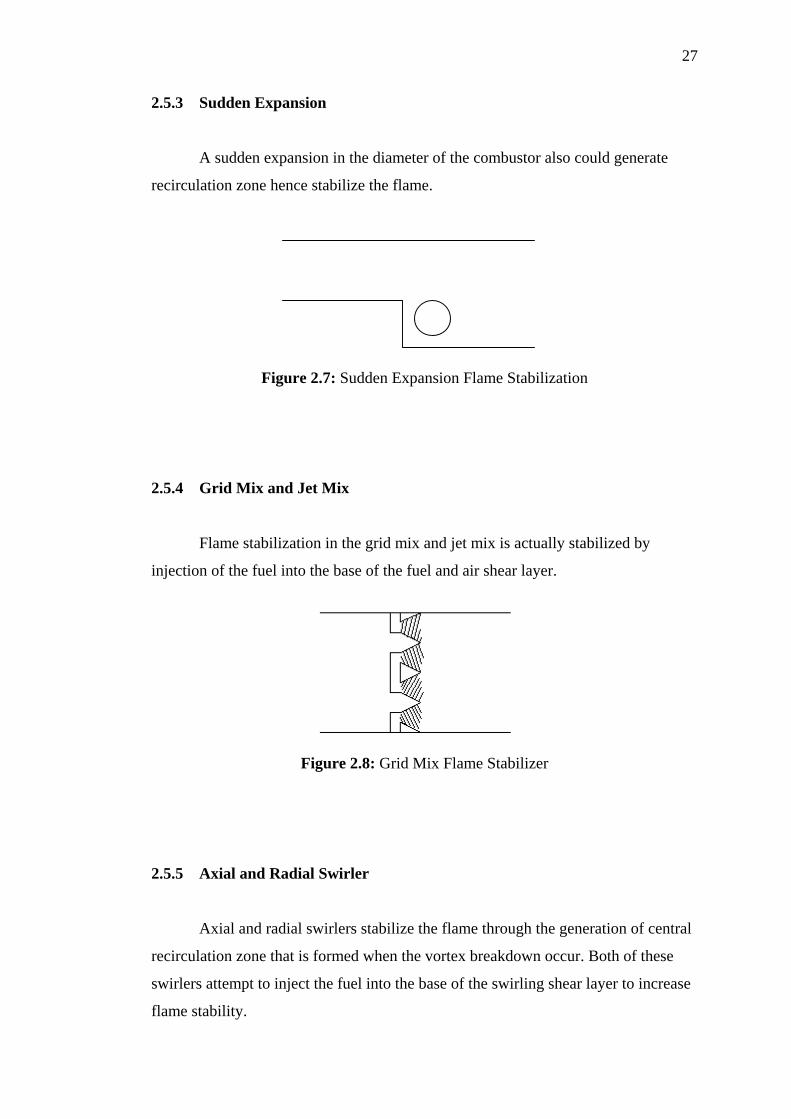
2.5.3 Sudden Expansion
A sudden expansion in the diameter of the combustor also could generate
recirculation zone hence stabilize the flame.
Figure 2.7: Sudden Expansion Flame Stabilization
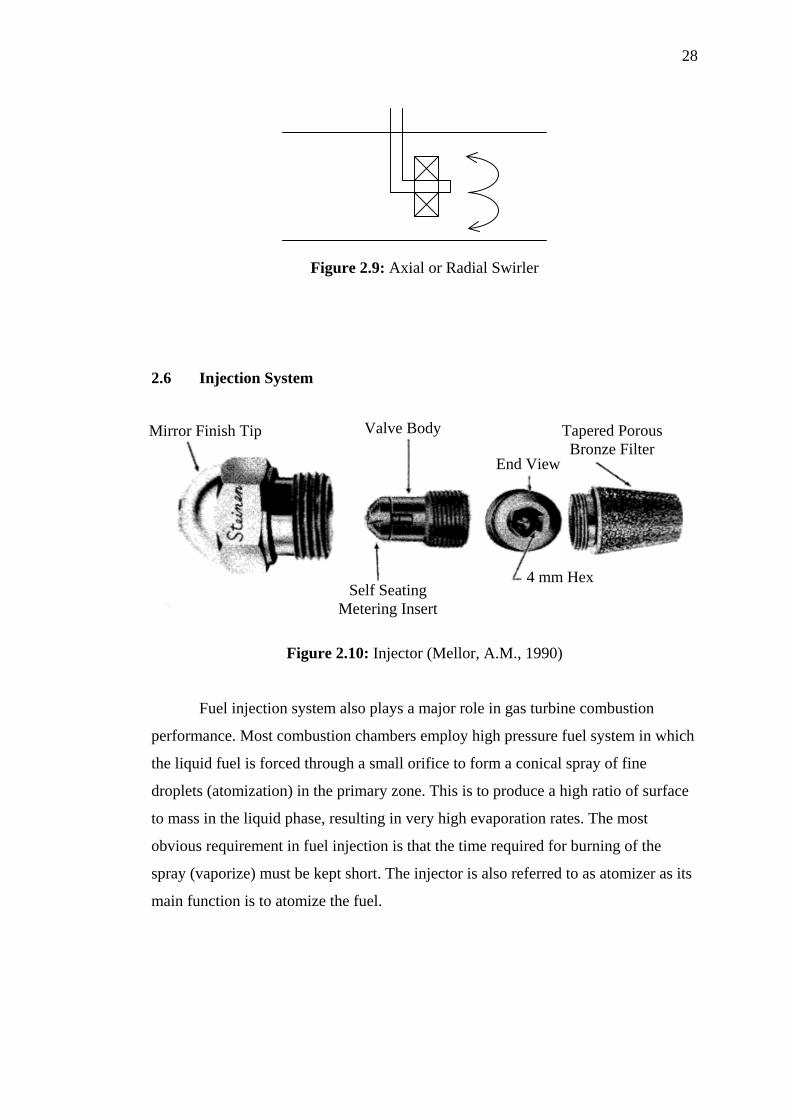
2.5.4 Grid Mix and Jet Mix
Flame stabilization in the grid mix and jet mix is actually stabilized by
injection of the fuel into the base of the fuel and air shear layer.
Figure 2.8: Grid Mix Flame Stabilizer
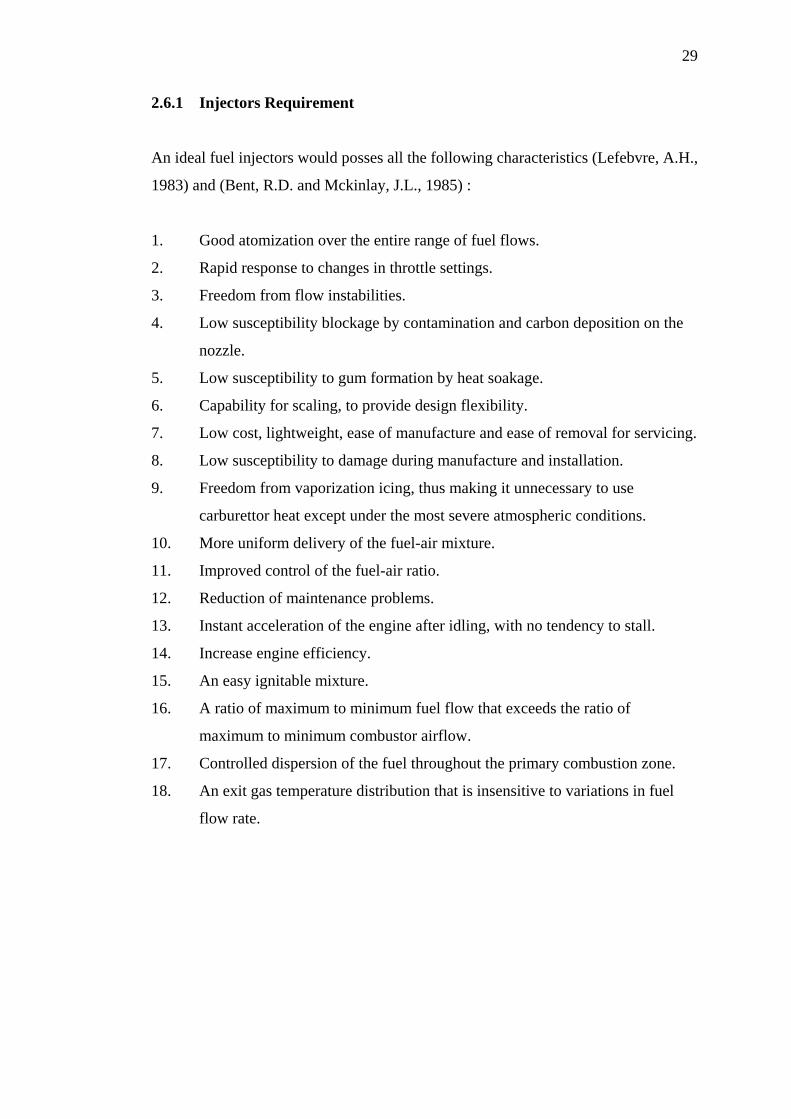
2.5.5 Axial and Radial Swirler
Axial and radial swirlers stabilize the flame through the generation of central
recirculation zone that is formed when the vortex breakdown occur. Both of these
swirlers attempt to inject the fuel into the base of the swirling shear layer to increase
flame stability.
28
Figure 2.9: Axial or Radial Swirler
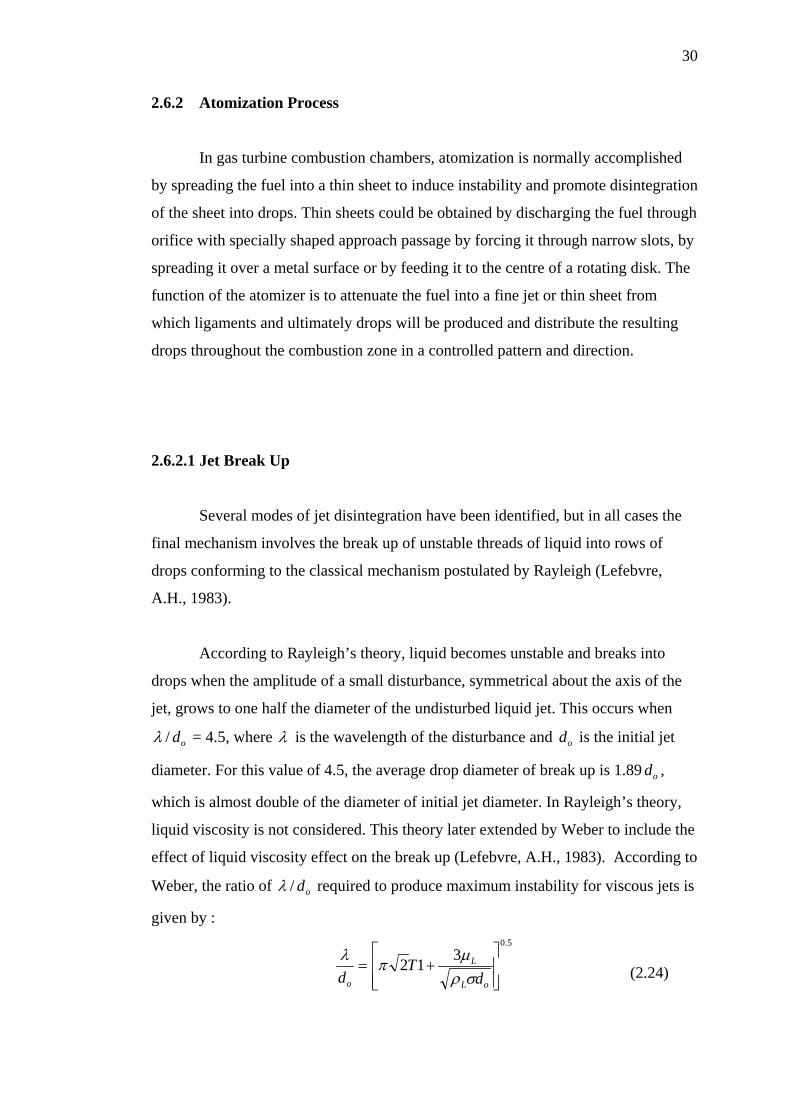
2.6 Injection System
Self Seating Metering Insert
4 mm Hex
End View
Tapered Porous Bronze Filter
Valve Body Mirror Finish Tip
Figure 2.10: Injector (Mellor, A.M., 1990)
Fuel injection system also plays a major role in gas turbine combustion
performance. Most combustion chambers employ high pressure fuel system in which
the liquid fuel is forced through a small orifice to form a conical spray of fine
droplets (atomization) in the primary zone. This is to produce a high ratio of surface
to mass in the liquid phase, resulting in very high evaporation rates. The most
obvious requirement in fuel injection is that the time required for burning of the
spray (vaporize) must be kept short. The injector is also referred to as atomizer as its
main function is to atomize the fuel.
29
2.6.1 Injectors Requirement
An ideal fuel injectors would posses all the following characteristics (Lefebvre, A.H.,
1983) and (Bent, R.D. and Mckinlay, J.L., 1985) :
1. Good atomization over the entire range of fuel flows.
2. Rapid response to changes in throttle settings.
3. Freedom from flow instabilities.
4. Low susceptibility blockage by contamination and carbon deposition on the
nozzle.
5. Low susceptibility to gum formation by heat soakage.
6. Capability for scaling, to provide design flexibility.
7. Low cost, lightweight, ease of manufacture and ease of removal for servicing.
8. Low susceptibility to damage during manufacture and installation.
9. Freedom from vaporization icing, thus making it unnecessary to use
carburettor heat except under the most severe atmospheric conditions.
10. More uniform delivery of the fuel-air mixture.
11. Improved control of the fuel-air ratio.
12. Reduction of maintenance problems.
13. Instant acceleration of the engine after idling, with no tendency to stall.
14. Increase engine efficiency.
15. An easy ignitable mixture.
16. A ratio of maximum to minimum fuel flow that exceeds the ratio of
maximum to minimum combustor airflow.
17. Controlled dispersion of the fuel throughout the primary combustion zone.
18. An exit gas temperature distribution that is insensitive to variations in fuel
flow rate.
30
2.6.2 Atomization Process
In gas turbine combustion chambers, atomization is normally accomplished
by spreading the fuel into a thin sheet to induce instability and promote disintegration
of the sheet into drops. Thin sheets could be obtained by discharging the fuel through
orifice with specially shaped approach passage by forcing it through narrow slots, by
spreading it over a metal surface or by feeding it to the centre of a rotating disk. The
function of the atomizer is to attenuate the fuel into a fine jet or thin sheet from
which ligaments and ultimately drops will be produced and distribute the resulting
drops throughout the combustion zone in a controlled pattern and direction.
2.6.2.1 Jet Break Up
Several modes of jet disintegration have been identified, but in all cases the
final mechanism involves the break up of unstable threads of liquid into rows of
drops conforming to the classical mechanism postulated by Rayleigh (Lefebvre,
A.H., 1983).
According to Rayleigh’s theory, liquid becomes unstable and breaks into
drops when the amplitude of a small disturbance, symmetrical about the axis of the
jet, grows to one half the diameter of the undisturbed liquid jet. This occurs when
od/λ = 4.5, where λ is the wavelength of the disturbance and is the initial jet
diameter. For this value of 4.5, the average drop diameter of break up is 1.89 ,
which is almost double of the diameter of initial jet diameter. In Rayleigh’s theory,
liquid viscosity is not considered. This theory later extended by Weber to include the
effect of liquid viscosity effect on the break up (Lefebvre, A.H., 1983). According to
Weber, the ratio of
od
od
od/λ required to produce maximum instability for viscous jets is
given by :
(2.24)
5.0312
⎥⎥⎦⎢
⎢⎣
=d σρ
π⎤⎡
+oL
L
o dT µλ
31
When 1µ = 0, the value of od/λ = 4.44, which is almost the same as the
value of Rayleigh’s prediction. However, when a liquid with viscosity of 0.86 kg/ms
is experimented, the ratio of od/λ for maximum instability ranged form 30 to 40.
This clearly differs from Rayleigh’s prediction.
In the case of liquid jet disintegration due to the influence of the surrounding
air, the drop size obtained is governed by the ratio of disruptive aerodynamic force
to the consolidating surface tension forceRAU2ρ od/σ . This dimensionless ratio is
also known as Weber number.
(2.25)
In the case of liquid jet disintegration without the influence of the
surrounding air, the atomization quality is dependent on jet diameter, liquid
properties density, surface tension and viscosity. This break up mechanism is
dependent to Z number.
(2.26)
2.6.2.2 Sheet Break Up
Fraser and Eisenklam, has identified three modes of sheet disintegration,
described as rim, wave and perforated sheet disintegration (Bent, R.D. and Mckinlay,
J.L., 1985).
In the rim disintegration mode, forces were created by surface tension causes
the free edge of a liquid sheet to contract into a thick rim, which then breaks up by a
mechanism corresponding to the disintegration of a free jet. When this occurs, the
resulting drops continue to move in the original flow direction, but they remain
attached to the receding surface by thin threads that also rapidly break up into rows
of drops. This mode of disintegration is most prominent where the viscosity and
σρ 0
2 dWe RA=U
oL
L
dWeZ
σρµ
==Re
5.0
32
surface tension of the liquid are both high. It tends to produce large drops, together
with numerous small satellite droplets.
In perforated sheet disintegration, holes appear in the sheet at a certain
distance from the orifice. The holes are delineated by rims formed from the liquid
that was initially included inside. These holes grow rapidly in size until the rims of
adjacent holes coalesce to produce ligaments of irregular shape that finally break up
into drops of varying size.
Atomizers that discharge the fuel in the form of sheet are usually capable of
exhibiting all three modes of sheet disintegration. Sometimes two different modes
occur simultaneously, and their relative importance can greatly influence both the
mean drop size and the drop size distribution.
2.6.3 Spray Characteristic
Combustion performance is also dependence on spray characteristic such as
mean drop size, drop size distribution, spray pattern, cone angle, dispersion and
penetration. Mean drop size and drop size distribution are important in designing the
atomizer meanwhile spray pattern, cone angle, dispersion and penetration are
governed partly by atomizer design and partly by the aerodynamics influence to
which the spray is subjected after atomization is completed.
2.6.3.1 Mean Drop Size
Mean diameter plays an important role in determining the evaporation rate
and atomization qualities of various sprays. The general idea of the mean diameter is
to replace the given spray with imaginary drops which have the same diameter while
retaining certain criteria of the original spray. The sauter mean diameter (SMD) is
the one which is most common and widely used. It is defined as the diameter of a
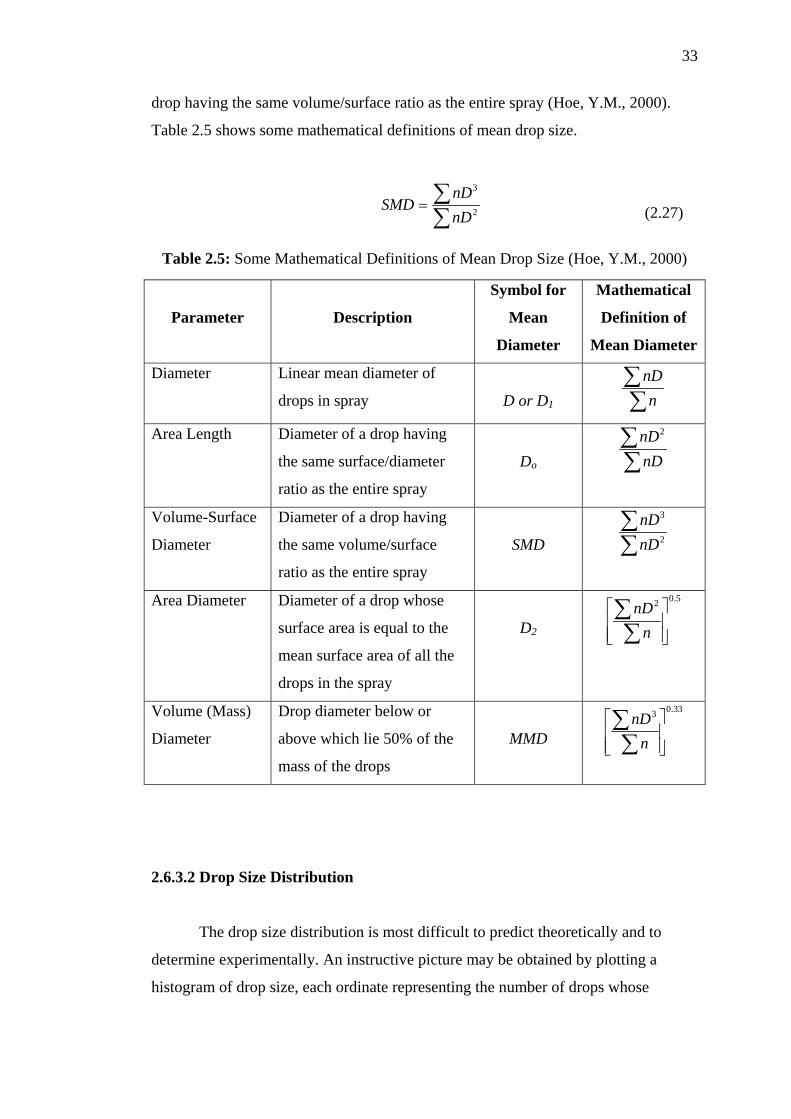
33
drop having the same volume/surface ratio as the entire spray (Hoe, Y.M., 2000).
Table 2.5 shows some mathematical definitions of mean drop size.
(2.27)
∑∑=
nDSMD 2
3nD
Table 2.5: Some Mathematical Definitions of Mean Drop Size (Hoe, Y.M., 2000)
Parameter
Description
Symbol for
Mean
Diameter
Mathematical
Definition of
Mean Diameter
Diameter Linear mean diameter of
drops in spray
D or D1 ∑∑
nnD
Area Length Diameter of a drop having
the same surface/diameter
ratio as the entire spray
Do ∑∑
nDnD2
Volume-Surface
Diameter
Diameter of a drop having
the same volume/surface
ratio as the entire spray
SMD ∑∑
2
3
nDnD
Area Diameter Diameter of a drop whose
surface area is equal to the
mean surface area of all the
drops in the spray
D2
5.02
⎥⎥⎦
⎤
⎢⎢⎣
⎡
∑∑
nnD
Volume (Mass)
Diameter
Drop diameter below or
above which lie 50% of the
mass of the drops
MMD
33.03
⎥⎥⎦
⎤
⎢⎢⎣
⎡
∑∑
nnD
2.6.3.2 Drop Size Distribution
The drop size distribution is most difficult to predict theoretically and to
determine experimentally. An instructive picture may be obtained by plotting a
histogram of drop size, each ordinate representing the number of drops whose
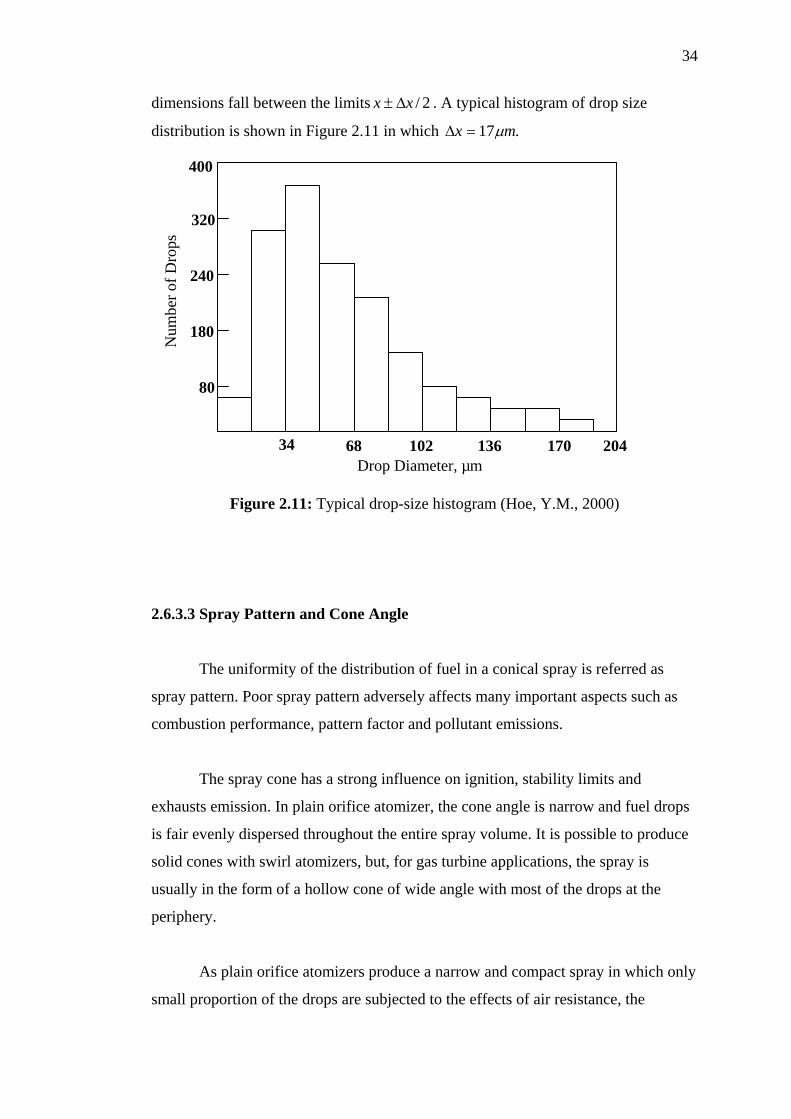
34
dimensions fall between the limits 2/xx ∆± . A typical histogram of drop size
distribution is shown in Figure 2.11 in which .17 mx µ=∆
400
320
Num
ber o
f Dro
ps
240
180
80
34 68 102 136Drop Diameter, µm
Figure 2.11: Typical drop-size histogram (Hoe, Y.M., 2000)
170 204
2.6.3.3 Spray Pattern and Cone Angle
The uniformity of the distribution of fuel in a conical spray is referred as
spray pattern. Poor spray pattern adversely affects many important aspects such as
combustion performance, pattern factor and pollutant emissions.
The spray cone has a strong influence on ignition, stability limits and
exhausts emission. In plain orifice atomizer, the cone angle is narrow and fuel drops
is fair evenly dispersed throughout the entire spray volume. It is possible to produce
solid cones with swirl atomizers, but, for gas turbine applications, the spray is
usually in the form of a hollow cone of wide angle with most of the drops at the
periphery.
As plain orifice atomizers produce a narrow and compact spray in which only
small proportion of the drops are subjected to the effects of air resistance, the
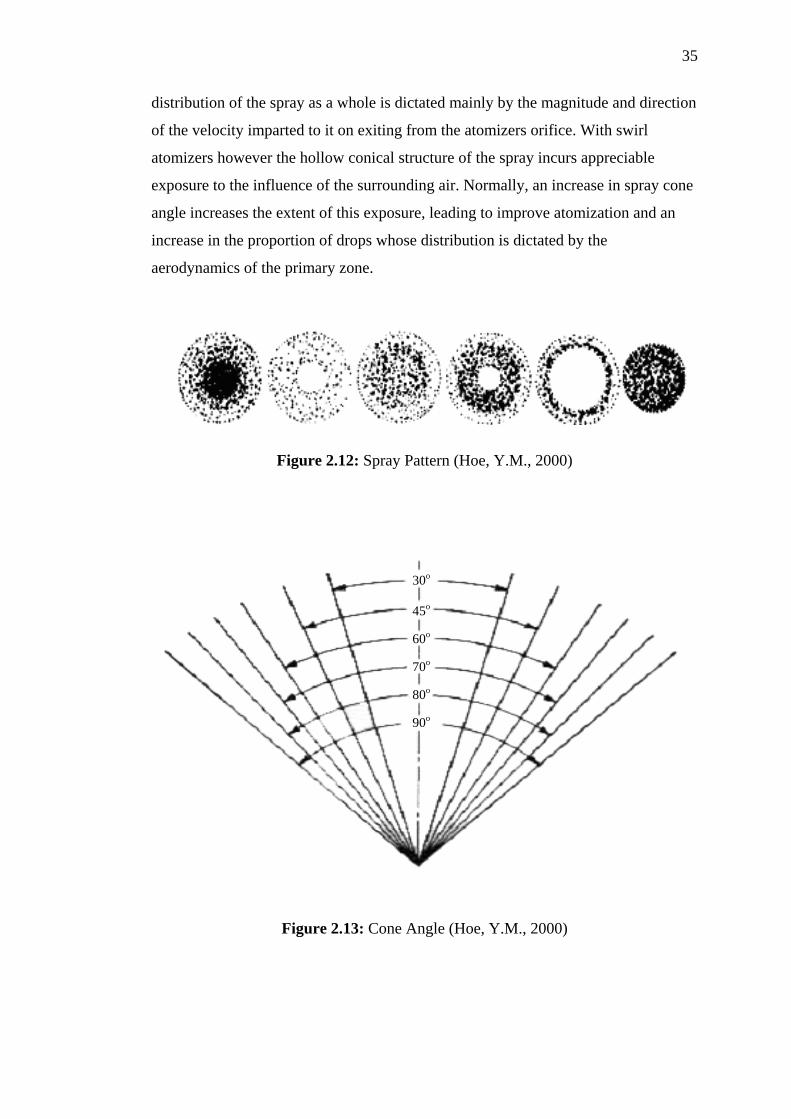
35
distribution of the spray as a whole is dictated mainly by the magnitude and direction
of the velocity imparted to it on exiting from the atomizers orifice. With swirl
atomizers however the hollow conical structure of the spray incurs appreciable
exposure to the influence of the surrounding air. Normally, an increase in spray cone
angle increases the extent of this exposure, leading to improve atomization and an
increase in the proportion of drops whose distribution is dictated by the
aerodynamics of the primary zone.
Figure 2.12: Spray Pattern (Hoe, Y.M., 2000)
30o
45o
60o
70o
80o
90o
Figure 2.13: Cone Angle (Hoe, Y.M., 2000)
36
2.6.3.4 Dispersion and Penetration
Dispersion could be expressed as the ratio of the volume of the spray to the
volume of the fuel contained within it. The advantage of a good dispersion is that the
fuel mixes rapidly with the surrounding gas. This could increase the evaporation rate
and heat release. Dispersion is small in narrow spray angle and high in wide spray
angle (Hoe, Y.M., 2000). In swirl atomizers, dispersion are governed mainly by
mean drop size, drop size distribution, cone angle, surrounding medium and fuel
properties. However, those factors that increase the spray cone angle also tends to
improve the spray dispersion.
Meanwhile, penetration of a spray may be defined as the maximum distance
of fuel reaches when injected into stagnant air. It is governed by the relative
magnitudes of two opposing forces: (1) the kinetic energy of the fuel jet and (2) the
aerodynamic resistance of the surrounding gas. The initial jet velocity is high, but as
atomization proceeds and the surface area of the spray increases, the kinetic energy
of the fuel is gradually dissipated by frictional losses to the gas. When, the drops
have finally exhausted their kinetic energy, mainly gravity and the movement of the
surrounding gas dictate their trajectory (Hoe, Y.M., 2000). In general, a compact,
narrow spray will have high penetration, while a well atomized spray of wide cone
angle, incurring more air resistance, will tend to have low penetration. In all cases,
the penetration of a spray is much greater than that of a single drop. The first drop to
be formed impart their energy to the surrounding gas, which begins to move with the
spray; the gas therefore offers less resistance to the following drops that
consequently penetrate further.
2.6.4 Types of Atomizers
There are several atomizers that are used for combustion applications. Several
types of atomizers are briefly described in this section. Relative merits of these
atomizers were simplified and accessible in Appendix A.
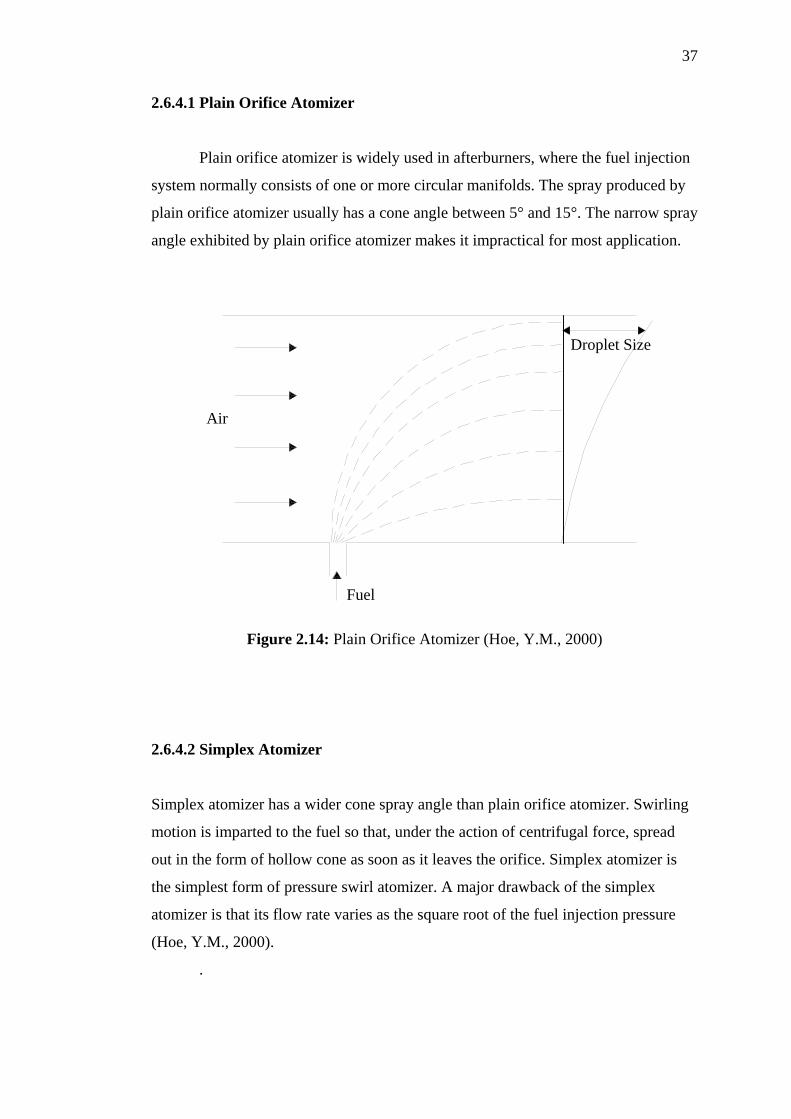
37
2.6.4.1 Plain Orifice Atomizer
Plain orifice atomizer is widely used in afterburners, where the fuel injection
system normally consists of one or more circular manifolds. The spray produced by
plain orifice atomizer usually has a cone angle between 5° and 15°. The narrow spray
angle exhibited by plain orifice atomizer makes it impractical for most application.
Droplet Size
Air
Fuel
Figure 2.14: Plain Orifice Atomizer (Hoe, Y.M., 2000)
2.6.4.2 Simplex Atomizer
Simplex atomizer has a wider cone spray angle than plain orifice atomizer. Swirling
motion is imparted to the fuel so that, under the action of centrifugal force, spread
out in the form of hollow cone as soon as it leaves the orifice. Simplex atomizer is
the simplest form of pressure swirl atomizer. A major drawback of the simplex
atomizer is that its flow rate varies as the square root of the fuel injection pressure
(Hoe, Y.M., 2000).
.
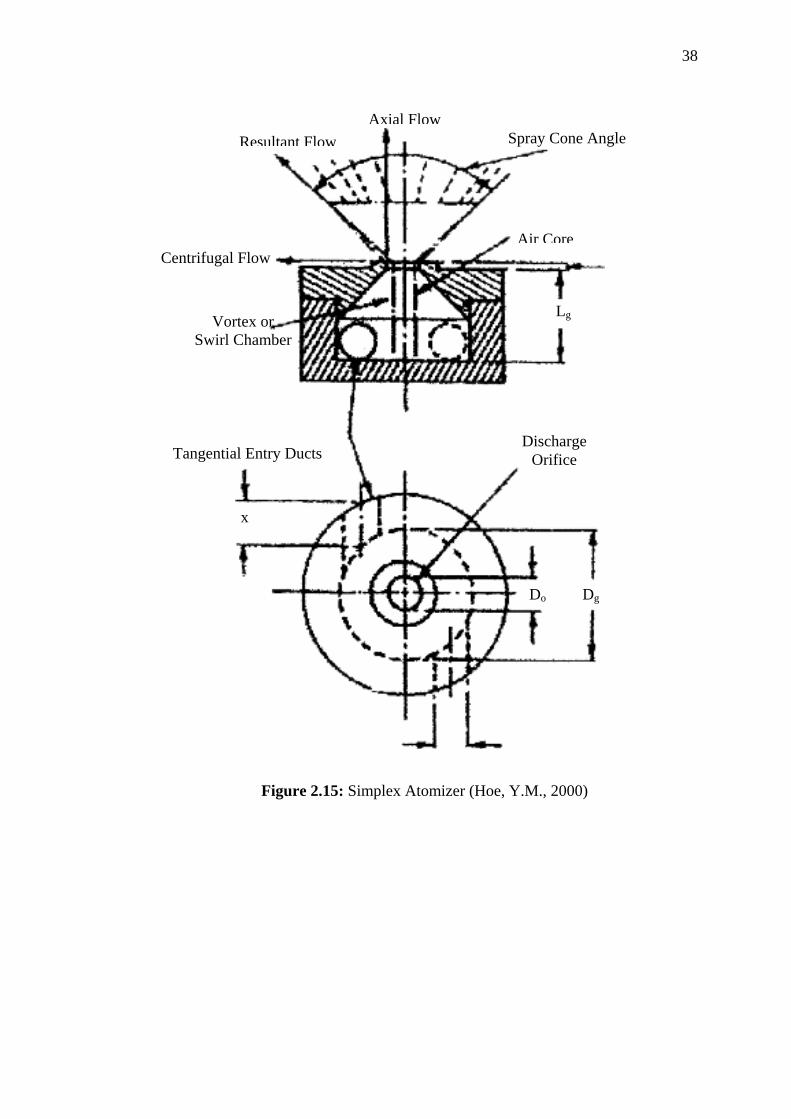
38
Axial Flow
Spray Cone Angle Resultant Flow
Air Core
Centrifugal Flow
LgVortex or
Swirl Chamber
Discharge Orifice Tangential Entry Ducts
x
DgDo
Figure 2.15: Simplex Atomizer (Hoe, Y.M., 2000)
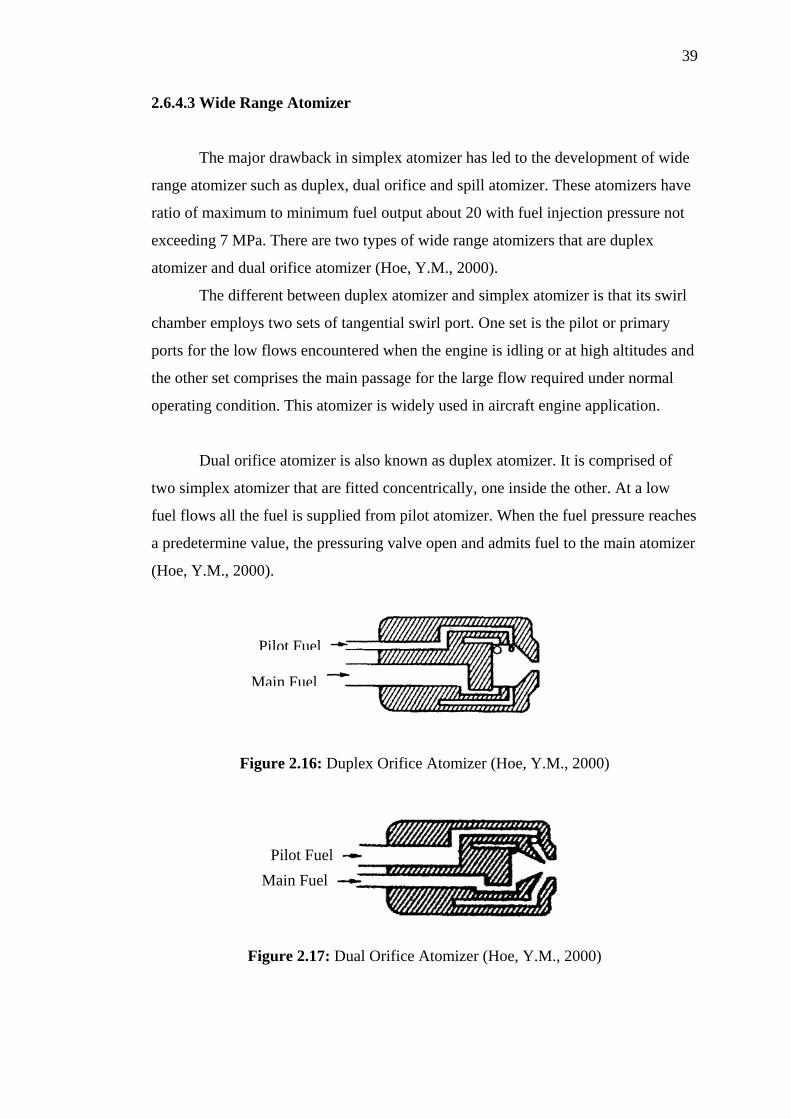
39
2.6.4.3 Wide Range Atomizer
The major drawback in simplex atomizer has led to the development of wide
range atomizer such as duplex, dual orifice and spill atomizer. These atomizers have
ratio of maximum to minimum fuel output about 20 with fuel injection pressure not
exceeding 7 MPa. There are two types of wide range atomizers that are duplex
atomizer and dual orifice atomizer (Hoe, Y.M., 2000).
The different between duplex atomizer and simplex atomizer is that its swirl
chamber employs two sets of tangential swirl port. One set is the pilot or primary
ports for the low flows encountered when the engine is idling or at high altitudes and
the other set comprises the main passage for the large flow required under normal
operating condition. This atomizer is widely used in aircraft engine application.
Dual orifice atomizer is also known as duplex atomizer. It is comprised of
two simplex atomizer that are fitted concentrically, one inside the other. At a low
fuel flows all the fuel is supplied from pilot atomizer. When the fuel pressure reaches
a predetermine value, the pressuring valve open and admits fuel to the main atomizer
(Hoe, Y.M., 2000).
F
Main Fuel
i
F
Pilot Fuel
gure 2.16: Duplex Orifice Atomizer (Hoe, Y.M., 2000)
Main FuelPilot Fuel
igure 2.17: Dual Orifice Atomizer (Hoe, Y.M., 2000)
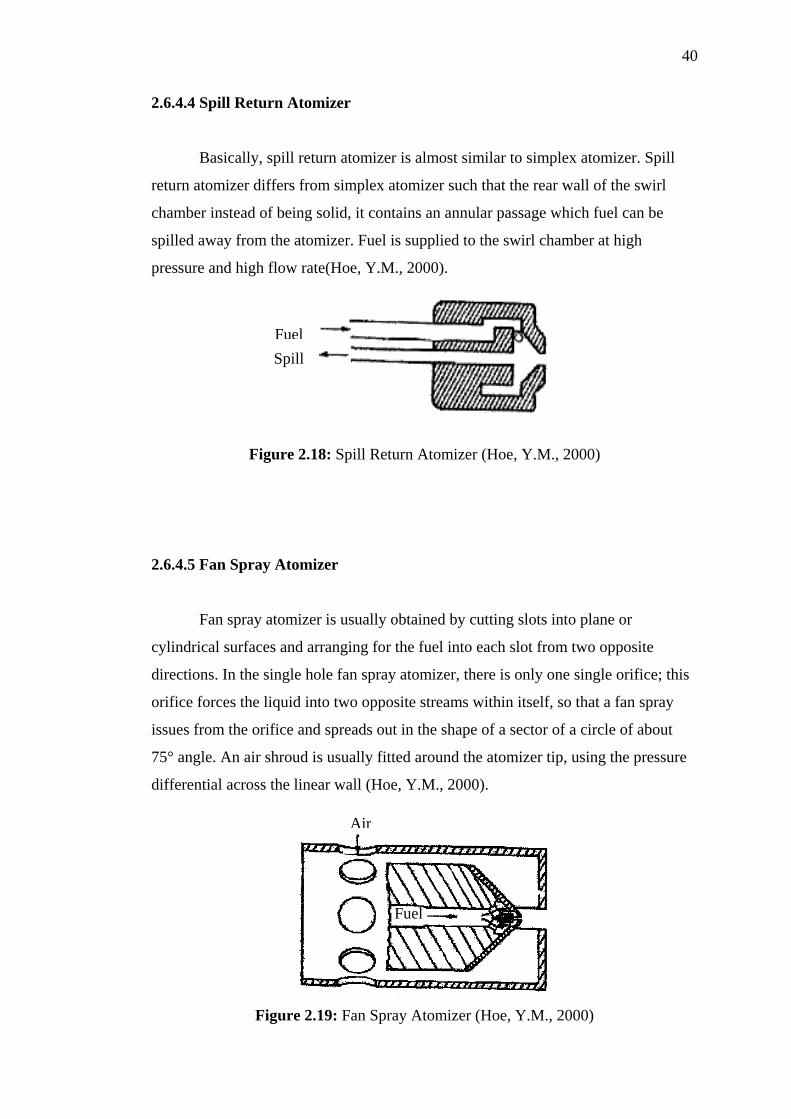
40
2.6.4.4 Spill Return Atomizer
Basically, spill return atomizer is almost similar to simplex atomizer. Spill
return atomizer differs from simplex atomizer such that the rear wall of the swirl
chamber instead of being solid, it contains an annular passage which fuel can be
spilled away from the atomizer. Fuel is supplied to the swirl chamber at high
pressure and high flow rate(Hoe, Y.M., 2000).
Spill
Figure 2.18: Spill Return Atomizer (Hoe, Y.M., 2000)
2.6.4.5 Fan Spray Atomizer
Fan spray atomizer is usually obtained by cutting slots into plane or
cylindrical surfaces and arranging for the fuel into each slot from two opposite
directions. In the single hole fan spray atomizer, there is only one single orifice; this
orifice forces the liquid into two opposite streams within itself, so that a fan spray
issues from the orifice and spreads out in the shape of a sector of a circle of about
75° angle. An air shroud is usually fitted around the atomizer tip, using the pressure
differential across the linear wall (Hoe, Y.M., 2000).
r
Figure 2.19: F
Ai
Fuel
Fuel
an Spray Atomizer (Hoe, Y.M., 2000)
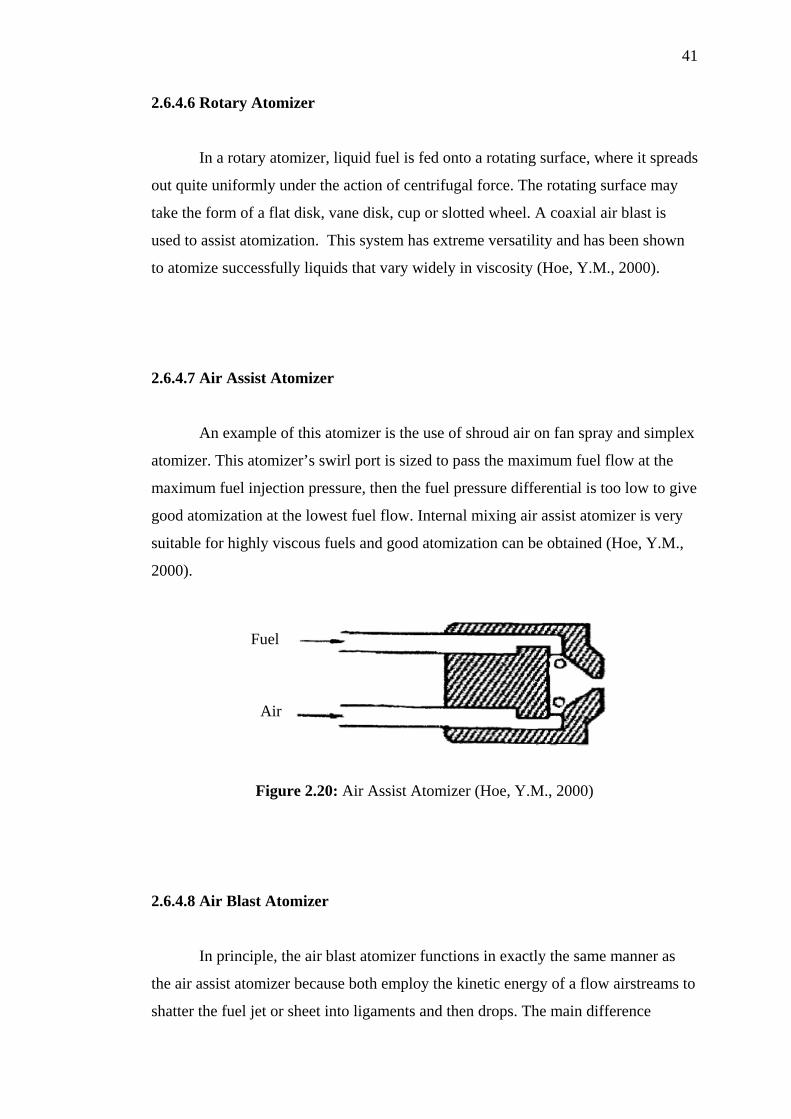
41
2.6.4.6 Rotary Atomizer
In a rotary atomizer, liquid fuel is fed onto a rotating surface, where it spreads
out quite uniformly under the action of centrifugal force. The rotating surface may
take the form of a flat disk, vane disk, cup or slotted wheel. A coaxial air blast is
used to assist atomization. This system has extreme versatility and has been shown
to atomize successfully liquids that vary widely in viscosity (Hoe, Y.M., 2000).
2.6.4.7 Air Assist Atomizer
An example of this atomizer is the use of shroud air on fan spray and simplex
atomizer. This atomizer’s swirl port is sized to pass the maximum fuel flow at the
maximum fuel injection pressure, then the fuel pressure differential is too low to give
good atomization at the lowest fuel flow. Internal mixing air assist atomizer is very
suitable for highly viscous fuels and good atomization can be obtained (Hoe, Y.M.,
2000).
2.6.4.8 Air Bla
In princ
the air assist at
shatter the fuel
Fuel
Air
Figure 2.20: Air Assist Atomizer (Hoe, Y.M., 2000)
st Atomizer
iple, the air blast atomizer functions in exactly the same manner as
omizer because both employ the kinetic energy of a flow airstreams to
jet or sheet into ligaments and then drops. The main difference
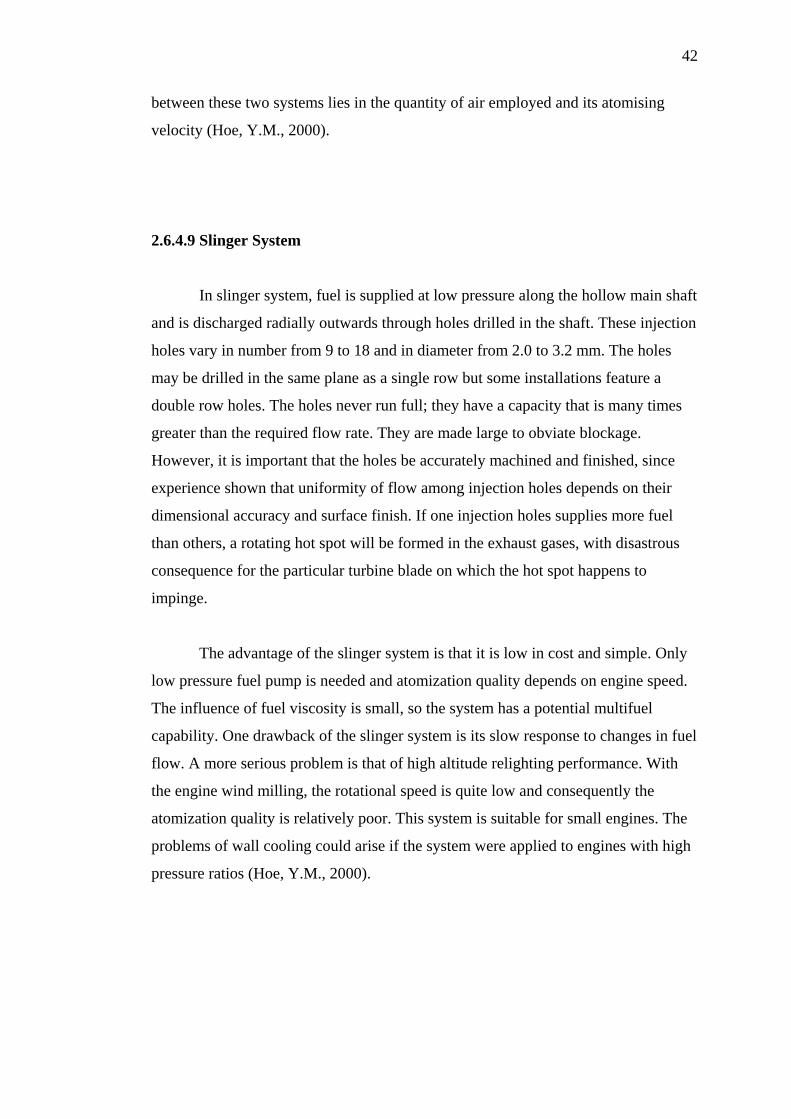
42
between these two systems lies in the quantity of air employed and its atomising
velocity (Hoe, Y.M., 2000).
2.6.4.9 Slinger System
In slinger system, fuel is supplied at low pressure along the hollow main shaft
and is discharged radially outwards through holes drilled in the shaft. These injection
holes vary in number from 9 to 18 and in diameter from 2.0 to 3.2 mm. The holes
may be drilled in the same plane as a single row but some installations feature a
double row holes. The holes never run full; they have a capacity that is many times
greater than the required flow rate. They are made large to obviate blockage.
However, it is important that the holes be accurately machined and finished, since
experience shown that uniformity of flow among injection holes depends on their
dimensional accuracy and surface finish. If one injection holes supplies more fuel
than others, a rotating hot spot will be formed in the exhaust gases, with disastrous
consequence for the particular turbine blade on which the hot spot happens to
impinge.
The advantage of the slinger system is that it is low in cost and simple. Only
low pressure fuel pump is needed and atomization quality depends on engine speed.
The influence of fuel viscosity is small, so the system has a potential multifuel
capability. One drawback of the slinger system is its slow response to changes in fuel
flow. A more serious problem is that of high altitude relighting performance. With
the engine wind milling, the rotational speed is quite low and consequently the
atomization quality is relatively poor. This system is suitable for small engines. The
problems of wall cooling could arise if the system were applied to engines with high
pressure ratios (Hoe, Y.M., 2000).
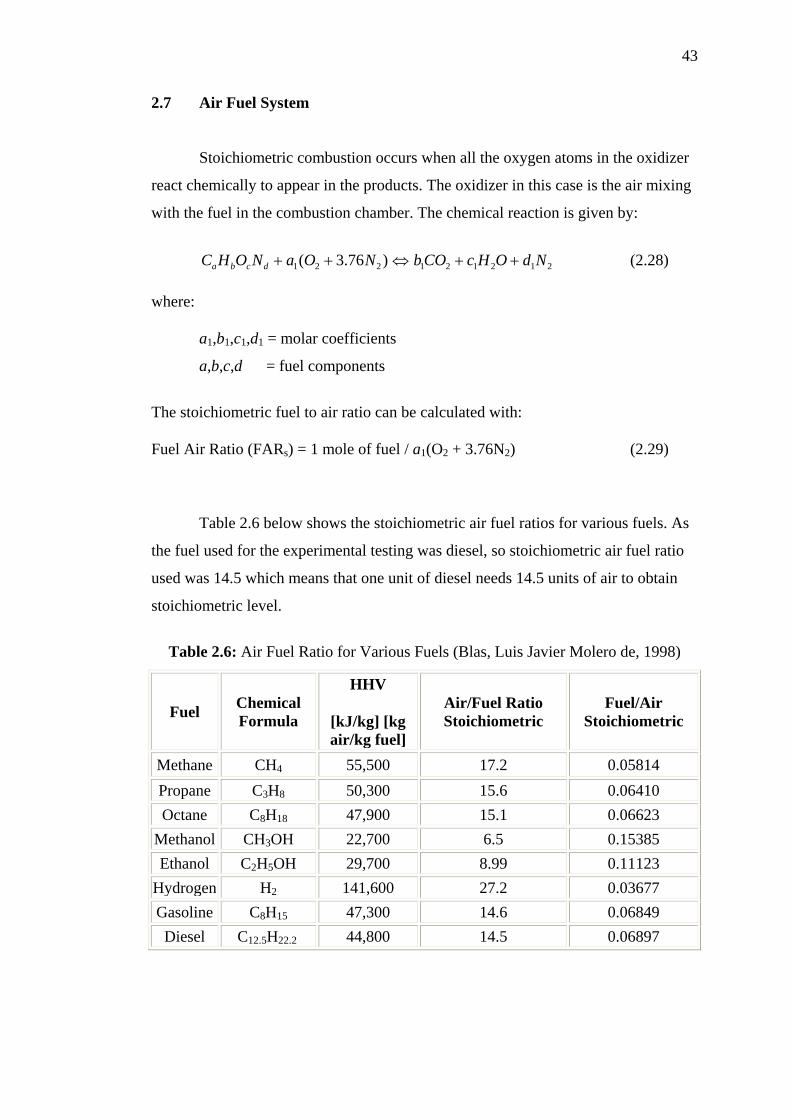
43
2.7 Air Fuel System
Stoichiometric combustion occurs when all the oxygen atoms in the oxidizer
react chemically to appear in the products. The oxidizer in this case is the air mixing
with the fuel in the combustion chamber. The chemical reaction is given by:
212121221 )76.3( NdOHcCObNOaNOHC dcba ++⇔++ (2.28)
where:
a1,b1,c1,d1 = molar coefficients
a,b,c,d = fuel components
The stoichiometric fuel to air ratio can be calculated with:
Fuel Air Ratio (FARs) = 1 mole of fuel / a1(O2 + 3.76N2) (2.29)
Table 2.6 below shows the stoichiometric air fuel ratios for various fuels. As
the fuel used for the experimental testing was diesel, so stoichiometric air fuel ratio
used was 14.5 which means that one unit of diesel needs 14.5 units of air to obtain
stoichiometric level.
Table 2.6: Air Fuel Ratio for Various Fuels (Blas, Luis Javier Molero de, 1998)
Fuel Chemical Formula
HHV
[kJ/kg] [kg air/kg fuel]
Air/Fuel Ratio Stoichiometric
Fuel/Air Stoichiometric
Methane CH4 55,500 17.2 0.05814 Propane C3H8 50,300 15.6 0.06410 Octane C8H18 47,900 15.1 0.06623
Methanol CH3OH 22,700 6.5 0.15385 Ethanol C2H5OH 29,700 8.99 0.11123
Hydrogen H2 141,600 27.2 0.03677 Gasoline C8H15 47,300 14.6 0.06849 Diesel C12.5H22.2 44,800 14.5 0.06897
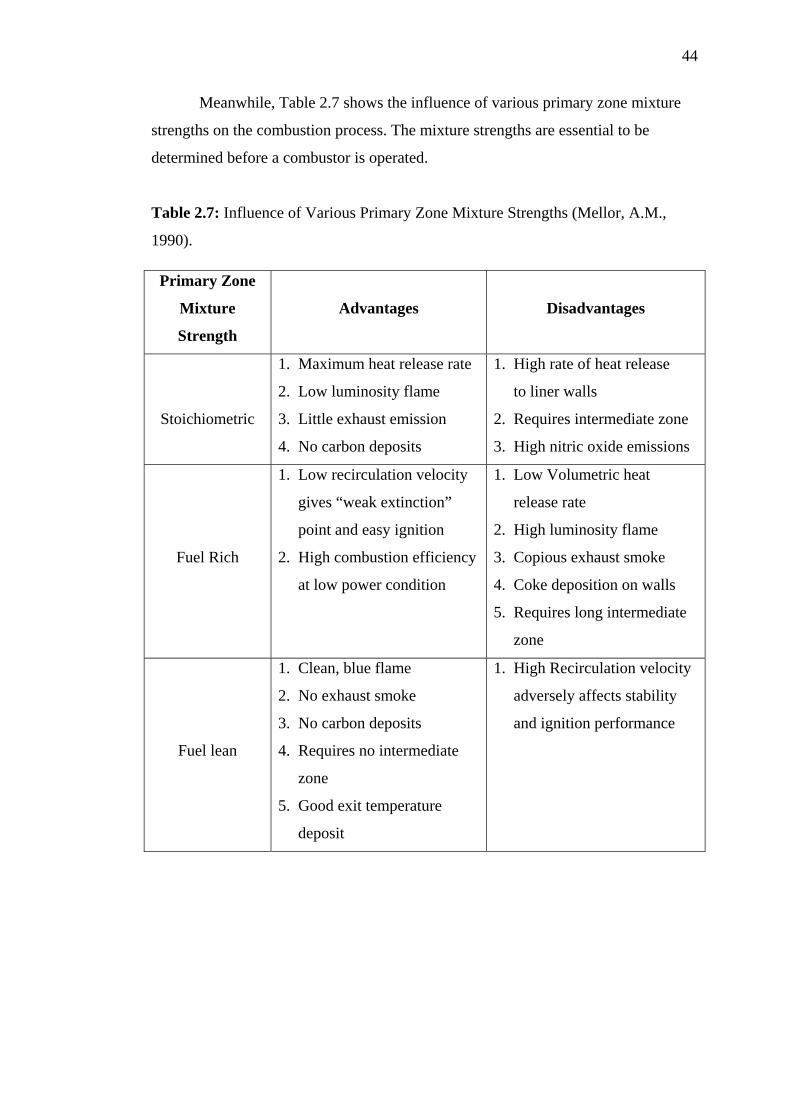
44
Meanwhile, Table 2.7 shows the influence of various primary zone mixture
strengths on the combustion process. The mixture strengths are essential to be
determined before a combustor is operated.
Table 2.7: Influence of Various Primary Zone Mixture Strengths (Mellor, A.M.,
1990).
Primary Zone
Mixture
Strength
Advantages
Disadvantages
Stoichiometric
1. Maximum heat release rate
2. Low luminosity flame
3. Little exhaust emission
4. No carbon deposits
1. High rate of heat release
to liner walls
2. Requires intermediate zone
3. High nitric oxide emissions
Fuel Rich
1. Low recirculation velocity
gives “weak extinction”
point and easy ignition
2. High combustion efficiency
at low power condition
1. Low Volumetric heat
release rate
2. High luminosity flame
3. Copious exhaust smoke
4. Coke deposition on walls
5. Requires long intermediate
zone
Fuel lean
1. Clean, blue flame
2. No exhaust smoke
3. No carbon deposits
4. Requires no intermediate
zone
5. Good exit temperature
deposit
1. High Recirculation velocity
adversely affects stability
and ignition performance
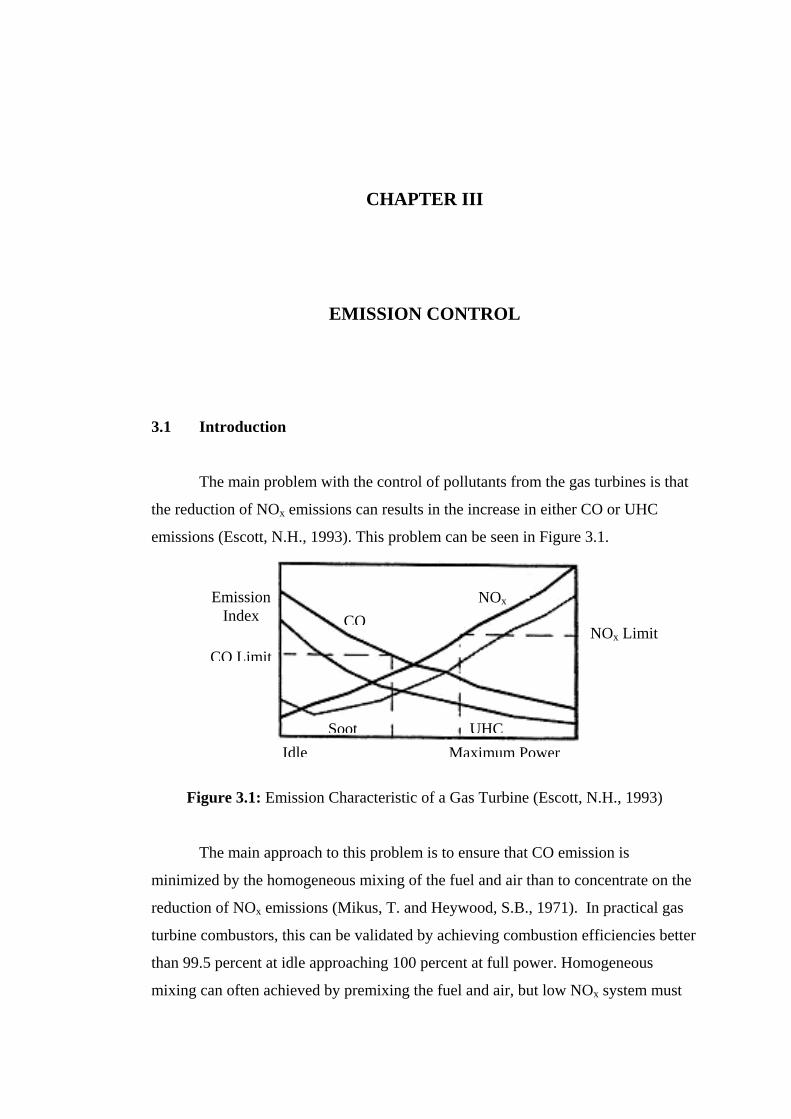
CHAPTER III
EMISSION CONTROL
3.1 Introduction
The main problem with the control of pollutants from the gas turbines is that
the reduction of NOx emissions can results in the increase in either CO or UHC
emissions (Escott, N.H., 1993). This problem can be seen in Figure 3.1.
Emission Index
NOx
NOx Limit
Figure 3.1: E
The main ap
minimized by the h
reduction of NOx em
turbine combustors
than 99.5 percent at
mixing can often ac
Idle
mission Characteristic of a
proach to this problem is
omogeneous mixing of the
issions (Mikus, T. and H
, this can be validated by a
idle approaching 100 per
hieved by premixing the f
Maximum Power
CO Limit
CO
Soot
Ga
to e
fu
eyw
chi
cen
uel
UHC
s Turbine (Escott, N.H., 1993)
nsure that CO emission is
el and air than to concentrate on the
ood, S.B., 1971). In practical gas
eving combustion efficiencies better
t at full power. Homogeneous
and air, but low NOx system must
46
also ensure that flame stability is maintained over a wide range of operating
conditions.
Most NOx reduction techniques basically involve the reduction of the peak
flame temperature to ensure that thermal NO is not formed. A reduction in the
combustor inlet temperature would reduce the formation of thermal NO but this is
not a practical solution because higher turbine inlet temperatures are required to
increase the gas turbines thermal efficiency.
3.2 Factors Influencing NOx Formation
Three main factors influences the formation of NOx are flame temperature,
flue gas residence time and the turbulence effect (Kim, M.N., 1995). The NOx
emission is proportional to the flame temperature. NOx emission increases with the
rise of flame temperature. Low flame temperature produces less NOx emission. Flue
gas residence time should be long enough to allow more time for combustion
reaction. If the mixing rate between fuel and air is high, flue gas residence time could
be reduced. Besides that, strong turbulence effect is needed to reduce NOx emission.
This could be achieved by creating pressure drop in the combustion zone that would
generate turbulence energy in the shear layer region and increases mixing rate of fuel
and air significantly (Kim, M.N., 1995).
3.3 NOx Control Techniques
There are number of ways of combustion methods to reduce NOx emission.
Basically these methods could be categorised into two techniques; prevention of NOx
formation and destruction of NOx.
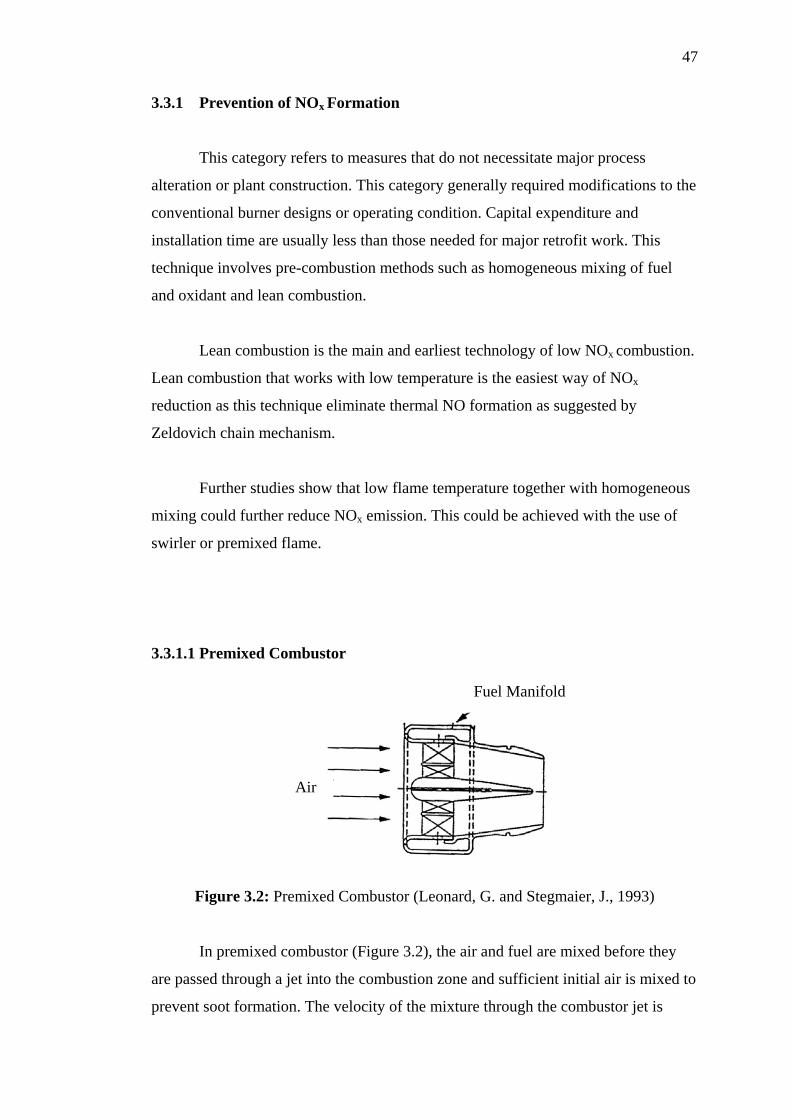
47
3.3.1 Prevention of NOx Formation
This category refers to measures that do not necessitate major process
alteration or plant construction. This category generally required modifications to the
conventional burner designs or operating condition. Capital expenditure and
installation time are usually less than those needed for major retrofit work. This
technique involves pre-combustion methods such as homogeneous mixing of fuel
and oxidant and lean combustion.
Lean combustion is the main and earliest technology of low NOx combustion.
Lean combustion that works with low temperature is the easiest way of NOx
reduction as this technique eliminate thermal NO formation as suggested by
Zeldovich chain mechanism.
Further studies show that low flame temperature together with homogeneous
mixing could further reduce NOx emission. This could be achieved with the use of
swirler or premixed flame.
3.3.1.1 Premixed Combustor
Fuel Manifold
Air
Figure 3.2: Premixed Combustor (Leonard, G. and Stegmaier, J., 1993)
In premixed combustor (Figure 3.2), the air and fuel are mixed before they
are passed through a jet into the combustion zone and sufficient initial air is mixed to
prevent soot formation. The velocity of the mixture through the combustor jet is
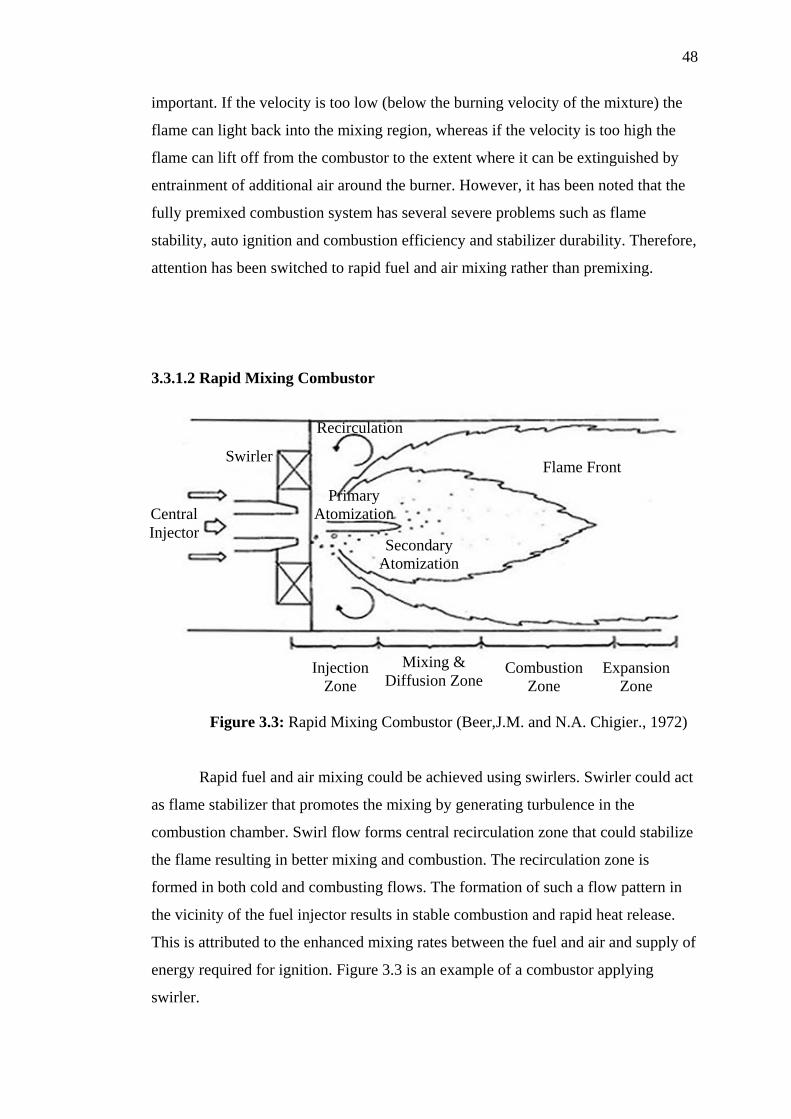
48
important. If the velocity is too low (below the burning velocity of the mixture) the
flame can light back into the mixing region, whereas if the velocity is too high the
flame can lift off from the combustor to the extent where it can be extinguished by
entrainment of additional air around the burner. However, it has been noted that the
fully premixed combustion system has several severe problems such as flame
stability, auto ignition and combustion efficiency and stabilizer durability. Therefore,
attention has been switched to rapid fuel and air mixing rather than premixing.
3.3.1.2 Rapid Mixing Combustor
Figure 3.3: Rapid Mixing Combustor (Beer,J.M. and N.A. Chigier., 1972)
Rapid fuel and air mixing could be achieved using swirlers. Swirler could act
as flame stabilizer that promotes the mixing by generating turbulence in the
combustion chamber. Swirl flow forms central recirculation zone that could stabilize
the flame resulting in better mixing and combustion. The recirculation zone is
formed in both cold and combusting flows. The formation of such a flow pattern in
the vicinity of the fuel injector results in stable combustion and rapid heat release.
This is attributed to the enhanced mixing rates between the fuel and air and supply of
energy required for ignition. Figure 3.3 is an example of a combustor applying
swirler.
Expansion Zone
Combustion Zone
Mixing & Diffusion Zone
Injection Zone
Flame Front
Recirculation
Primary Atomization
Secondary Atomization
Central Injector
Swirler
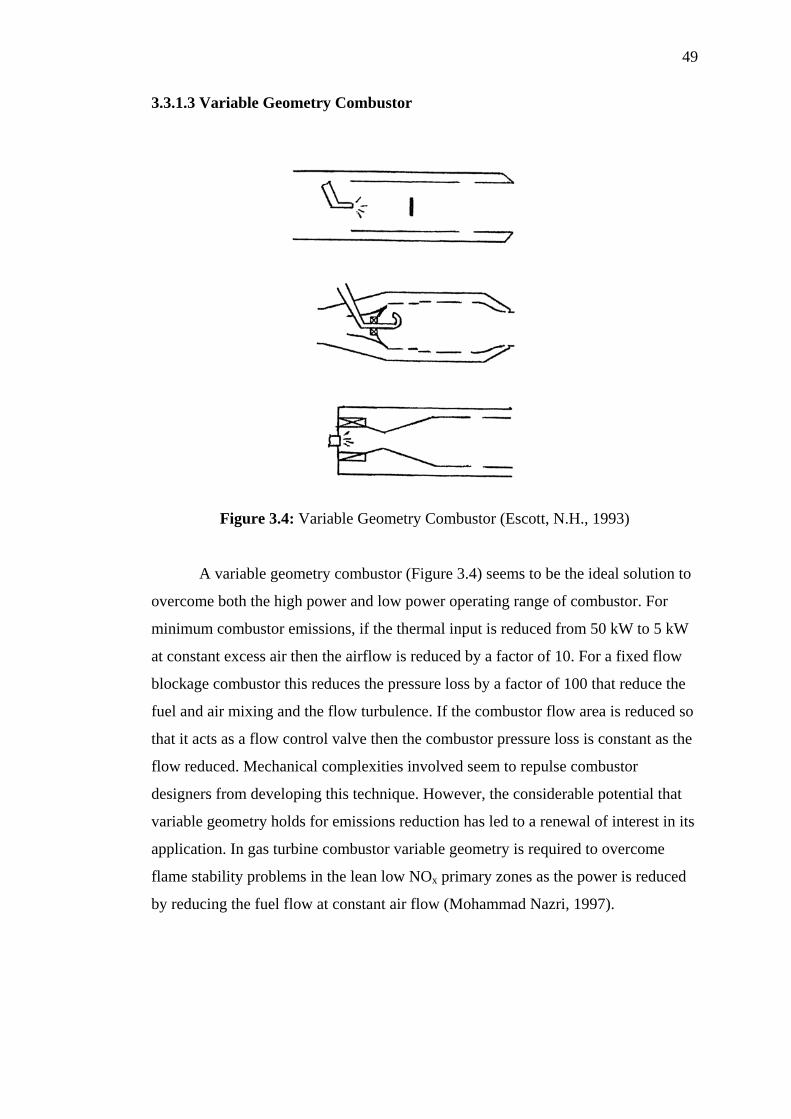
49
3.3.1.3 Variable Geometry Combustor
Figure 3.4: Variable Geometry Combustor (Escott, N.H., 1993)
A variable geometry combustor (Figure 3.4) seems to be the ideal solution to
overcome both the high power and low power operating range of combustor. For
minimum combustor emissions, if the thermal input is reduced from 50 kW to 5 kW
at constant excess air then the airflow is reduced by a factor of 10. For a fixed flow
blockage combustor this reduces the pressure loss by a factor of 100 that reduce the
fuel and air mixing and the flow turbulence. If the combustor flow area is reduced so
that it acts as a flow control valve then the combustor pressure loss is constant as the
flow reduced. Mechanical complexities involved seem to repulse combustor
designers from developing this technique. However, the considerable potential that
variable geometry holds for emissions reduction has led to a renewal of interest in its
application. In gas turbine combustor variable geometry is required to overcome
flame stability problems in the lean low NOx primary zones as the power is reduced
by reducing the fuel flow at constant air flow (Mohammad Nazri, 1997).
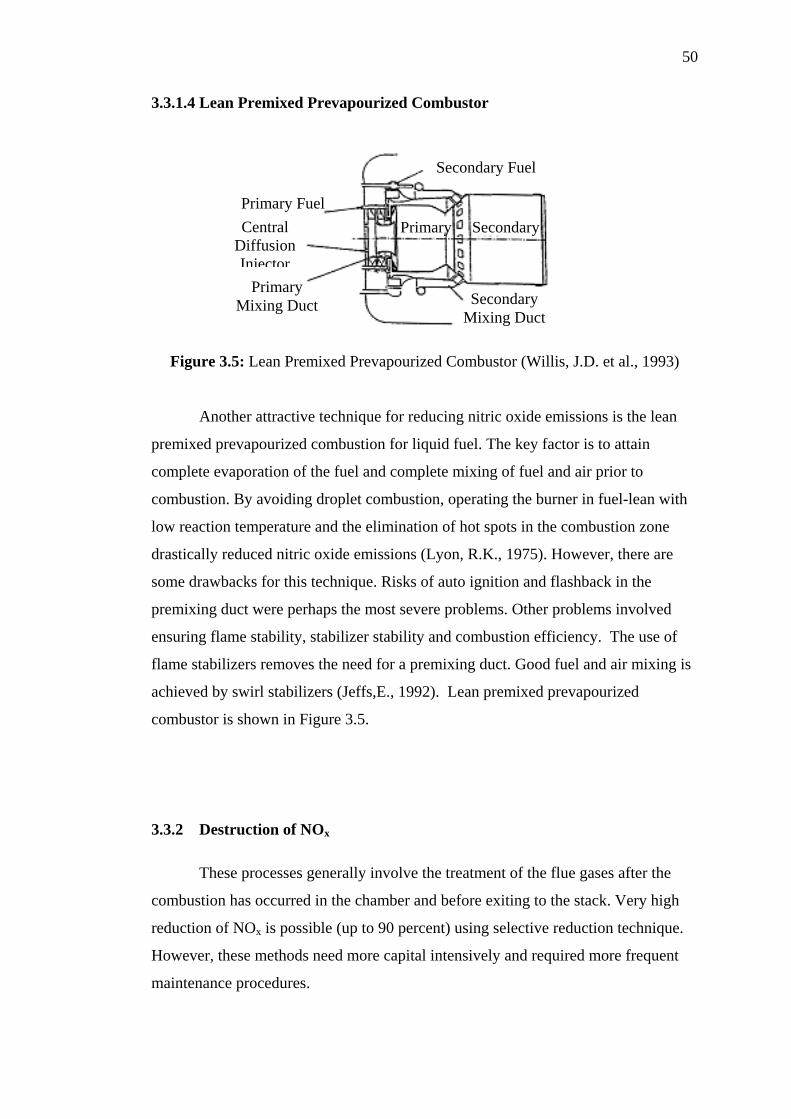
50
3.3.1.4 Lean Premixed Prevapourized Combustor
Secondary Fuel
Primary Fuel
Primary Secondary
Figure 3.5
Anoth
premixed pre
complete eva
combustion.
low reaction
drastically re
some drawba
premixing du
ensuring flam
flame stabiliz
achieved by s
combustor is
3.3.2 Destr
These
combustion h
reduction of
However, the
maintenance
Central DiffusionInjector
Primary Mixing Duct Secondary
Mixing Duct
: Lean Premixed Prevapourized Combustor (Willis, J.D. et al., 1993)
er attractive technique for reducing nitric oxide emissions is the lean
vapourized combustion for liquid fuel. The key factor is to attain
poration of the fuel and complete mixing of fuel and air prior to
By avoiding droplet combustion, operating the burner in fuel-lean with
temperature and the elimination of hot spots in the combustion zone
duced nitric oxide emissions (Lyon, R.K., 1975). However, there are
cks for this technique. Risks of auto ignition and flashback in the
ct were perhaps the most severe problems. Other problems involved
e stability, stabilizer stability and combustion efficiency. The use of
ers removes the need for a premixing duct. Good fuel and air mixing is
wirl stabilizers (Jeffs,E., 1992). Lean premixed prevapourized
shown in Figure 3.5.
uction of NOx
processes generally involve the treatment of the flue gases after the
as occurred in the chamber and before exiting to the stack. Very high
NOx is possible (up to 90 percent) using selective reduction technique.
se methods need more capital intensively and required more frequent
procedures.
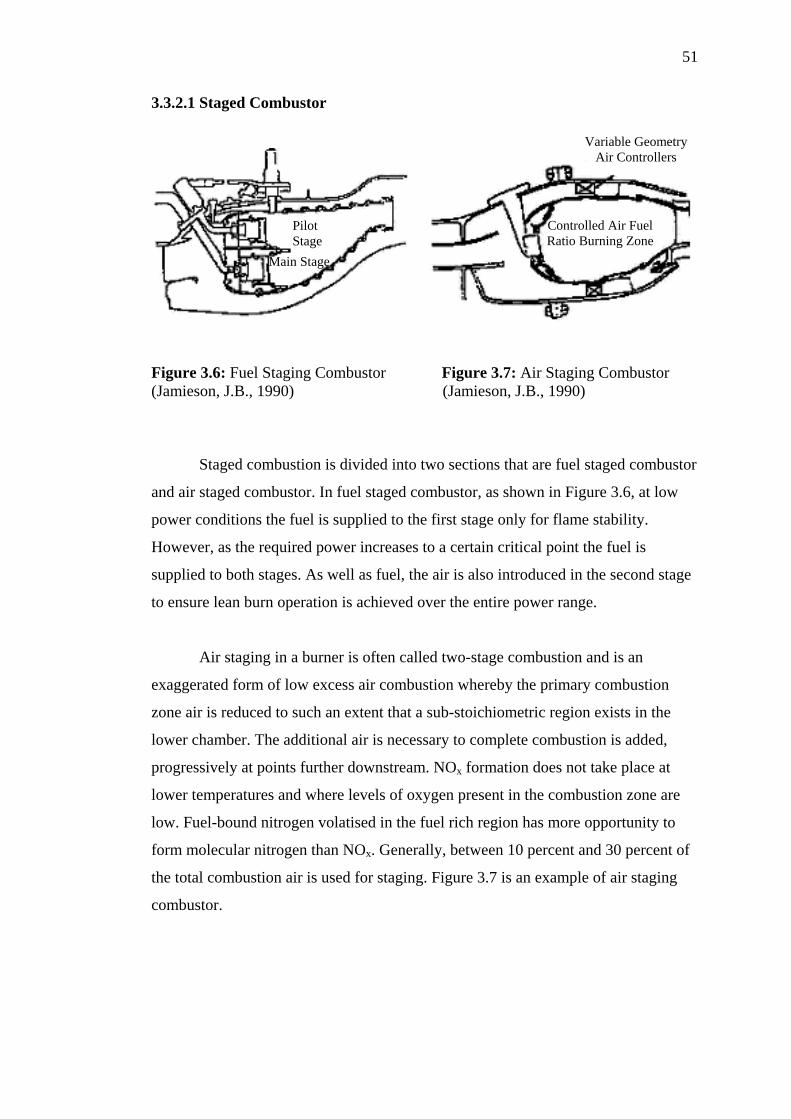
51
3.3.2.1 Staged Combustor
Variable Geometry Air Controllers
Controlled Air Fuel Ratio Burning Zone
Pilot Stage
Main Stage
Figure 3.6: Fuel Staging Combustor Figure 3.7: Air Staging Combustor (Jamieson, J.B., 1990) (Jamieson, J.B., 1990)
Staged combustion is divided into two sections that are fuel staged combustor
and air staged combustor. In fuel staged combustor, as shown in Figure 3.6, at low
power conditions the fuel is supplied to the first stage only for flame stability.
However, as the required power increases to a certain critical point the fuel is
supplied to both stages. As well as fuel, the air is also introduced in the second stage
to ensure lean burn operation is achieved over the entire power range.
Air staging in a burner is often called two-stage combustion and is an
exaggerated form of low excess air combustion whereby the primary combustion
zone air is reduced to such an extent that a sub-stoichiometric region exists in the
lower chamber. The additional air is necessary to complete combustion is added,
progressively at points further downstream. NOx formation does not take place at
lower temperatures and where levels of oxygen present in the combustion zone are
low. Fuel-bound nitrogen volatised in the fuel rich region has more opportunity to
form molecular nitrogen than NOx. Generally, between 10 percent and 30 percent of
the total combustion air is used for staging. Figure 3.7 is an example of air staging
combustor.
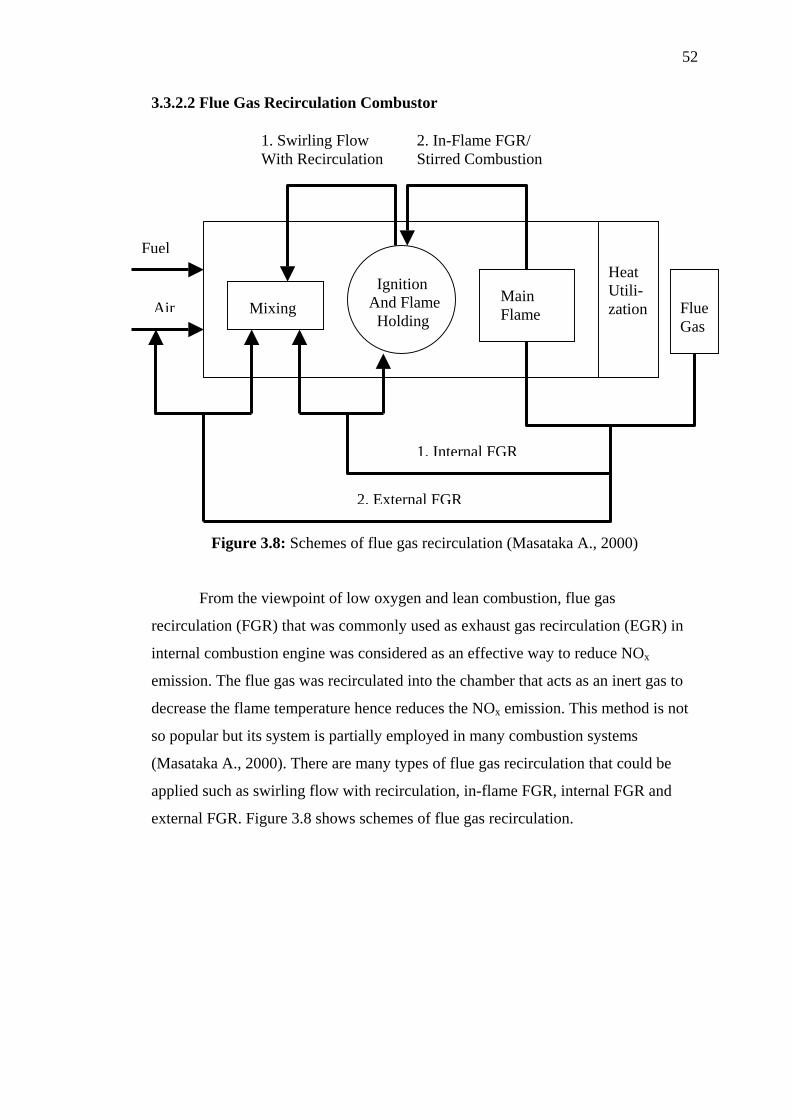
52
3.3.2.2 Flue Gas Recirculation Combustor
1. Swirling Flow With Recirculation
2. In-Flame FGR/ Stirred Combustion
Mixing Ignition And Flame Holding
Main Flame
Heat Utili-zation Flue
Gas
2. External FGR
1. Internal FGR
Fuel
Air
Figure 3.8: Schemes of flue gas recirculation (Masataka A., 2000)
From the viewpoint of low oxygen and lean combustion, flue gas
recirculation (FGR) that was commonly used as exhaust gas recirculation (EGR) in
internal combustion engine was considered as an effective way to reduce NOx
emission. The flue gas was recirculated into the chamber that acts as an inert gas to
decrease the flame temperature hence reduces the NOx emission. This method is not
so popular but its system is partially employed in many combustion systems
(Masataka A., 2000). There are many types of flue gas recirculation that could be
applied such as swirling flow with recirculation, in-flame FGR, internal FGR and
external FGR. Figure 3.8 shows schemes of flue gas recirculation.
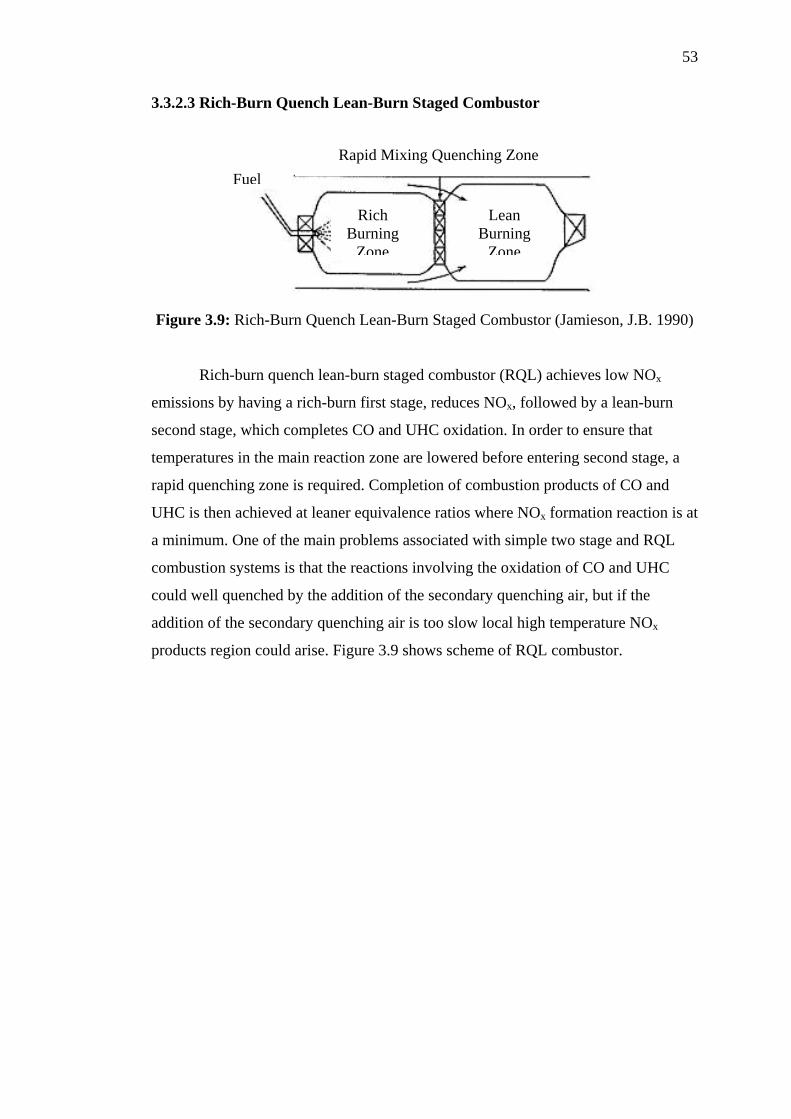
53
3.3.2.3 Rich-Burn Quench Lean-Burn Staged Combustor
Rapid Mixing Quenching Zone
B B
Figure 3.9: Rich-Burn Quench
Rich-burn quench lean-
emissions by having a rich-burn
second stage, which completes
temperatures in the main reactio
rapid quenching zone is require
UHC is then achieved at leaner
a minimum. One of the main pr
combustion systems is that the
could well quenched by the add
addition of the secondary quenc
products region could arise. Fig
Rich urning Zone
Lean-Burn Staged C
burn staged combust
first stage, reduces
CO and UHC oxidat
n zone are lowered
d. Completion of co
equivalence ratios w
oblems associated w
reactions involving t
ition of the secondar
hing air is too slow
ure 3.9 shows schem
Lean urning Zone
Fuel
ombustor (Jamieson, J.B. 1990)
or (RQL) achieves low NOx
NOx, followed by a lean-burn
ion. In order to ensure that
before entering second stage, a
mbustion products of CO and
here NOx formation reaction is at
ith simple two stage and RQL
he oxidation of CO and UHC
y quenching air, but if the
local high temperature NOx
e of RQL combustor.
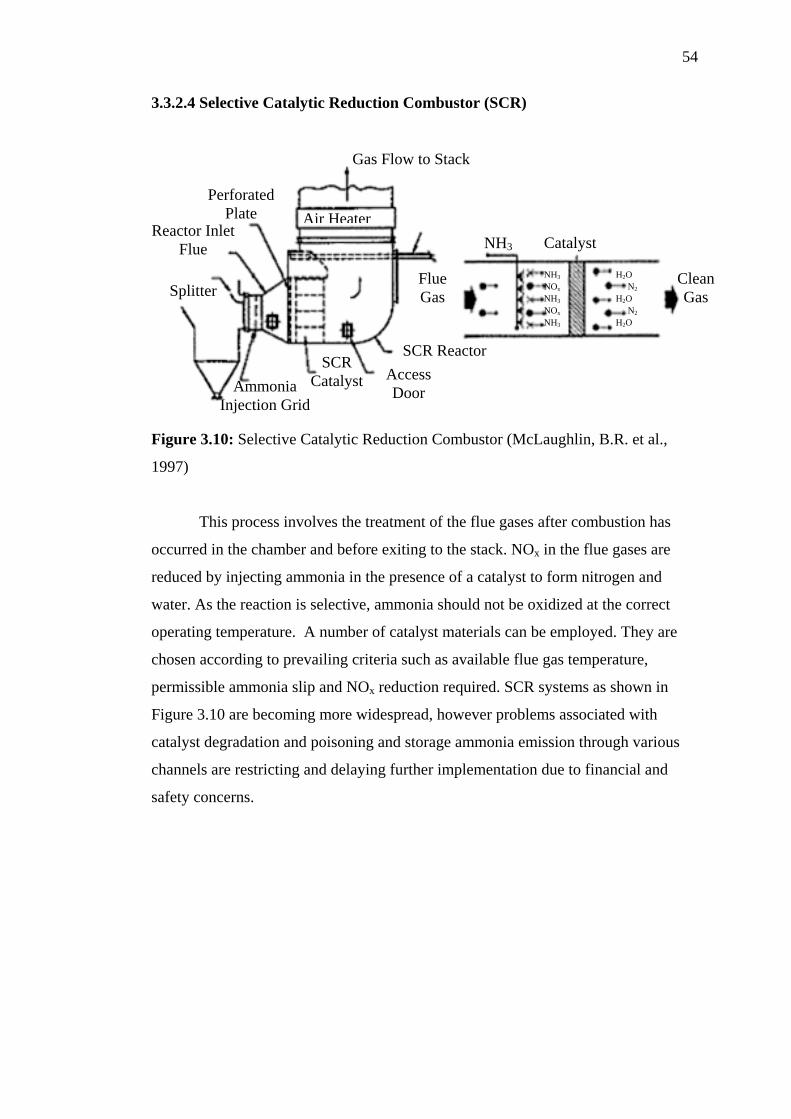
54
3.3.2.4 Selective Catalytic Reduction Combustor (SCR)
Gas Flow to Stack
Perforated Plate
Reactor InletFlue
Air HeaterCatalyst NH3
Flue Gas
Clean Gas
NH3
NH3
NOx
NH3
NOx
H2O
H2O N2
H2O N2
Splitter
SCR Reactor
Ammonia Injection Grid
SCR Catalyst Access
Door
Figure 3.10: Selective Catalytic Reduction Combustor (McLaughlin, B.R. et al.,
1997)
This process involves the treatment of the flue gases after combustion has
occurred in the chamber and before exiting to the stack. NOx in the flue gases are
reduced by injecting ammonia in the presence of a catalyst to form nitrogen and
water. As the reaction is selective, ammonia should not be oxidized at the correct
operating temperature. A number of catalyst materials can be employed. They are
chosen according to prevailing criteria such as available flue gas temperature,
permissible ammonia slip and NOx reduction required. SCR systems as shown in
Figure 3.10 are becoming more widespread, however problems associated with
catalyst degradation and poisoning and storage ammonia emission through various
channels are restricting and delaying further implementation due to financial and
safety concerns.
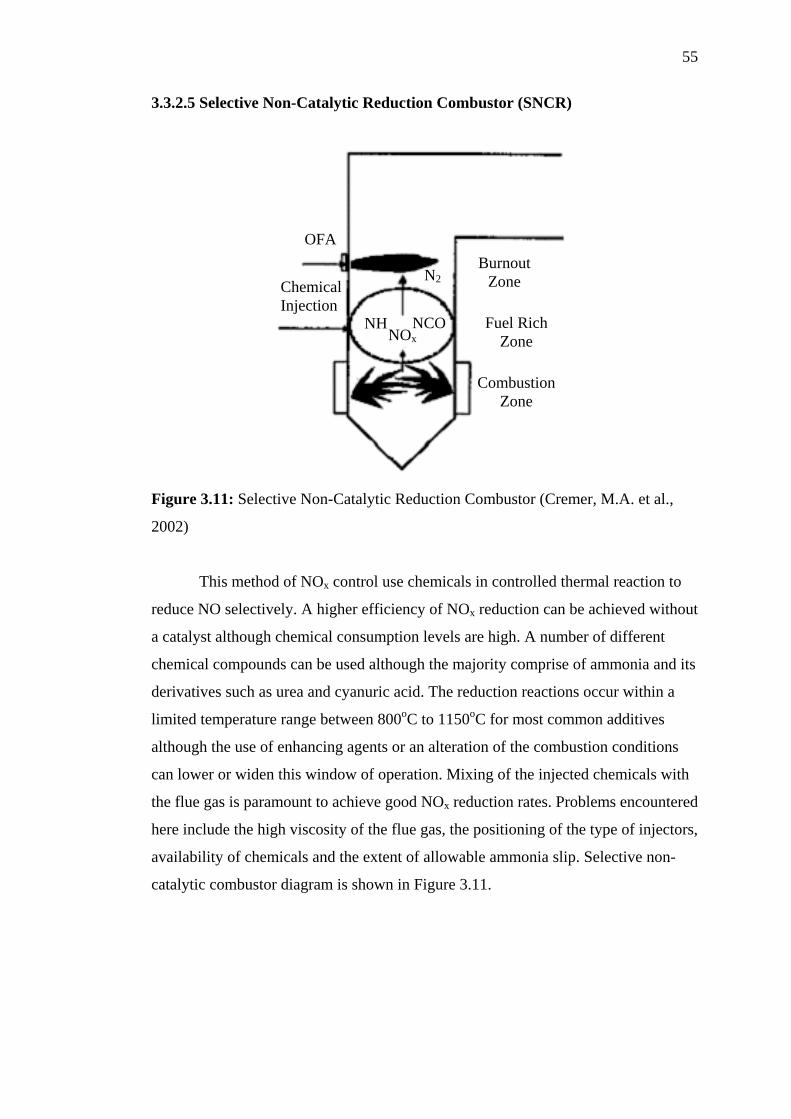
55
3.3.2.5 Selective Non-Catalytic Reduction Combustor (SNCR)
OFA Burnout
Zone N2Chemical Injection
Fuel Rich Zone
NCONOx
NH
CombustionZone
Figure 3.11: Selective Non-Catalytic Reduction Combustor (Cremer, M.A. et al.,
2002)
This method of NOx control use chemicals in controlled thermal reaction to
reduce NO selectively. A higher efficiency of NOx reduction can be achieved without
a catalyst although chemical consumption levels are high. A number of different
chemical compounds can be used although the majority comprise of ammonia and its
derivatives such as urea and cyanuric acid. The reduction reactions occur within a
limited temperature range between 800oC to 1150oC for most common additives
although the use of enhancing agents or an alteration of the combustion conditions
can lower or widen this window of operation. Mixing of the injected chemicals with
the flue gas is paramount to achieve good NOx reduction rates. Problems encountered
here include the high viscosity of the flue gas, the positioning of the type of injectors,
availability of chemicals and the extent of allowable ammonia slip. Selective non-
catalytic combustor diagram is shown in Figure 3.11.
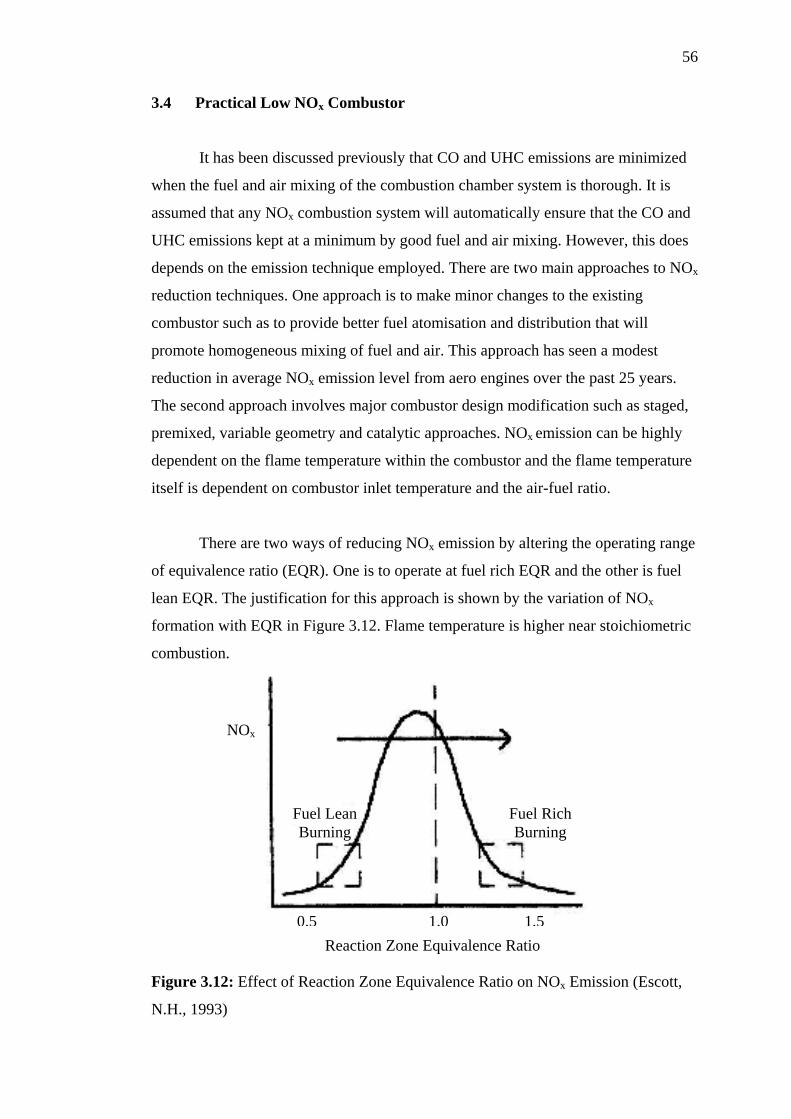
56
3.4 Practical Low NOx Combustor
It has been discussed previously that CO and UHC emissions are minimized
when the fuel and air mixing of the combustion chamber system is thorough. It is
assumed that any NOx combustion system will automatically ensure that the CO and
UHC emissions kept at a minimum by good fuel and air mixing. However, this does
depends on the emission technique employed. There are two main approaches to NOx
reduction techniques. One approach is to make minor changes to the existing
combustor such as to provide better fuel atomisation and distribution that will
promote homogeneous mixing of fuel and air. This approach has seen a modest
reduction in average NOx emission level from aero engines over the past 25 years.
The second approach involves major combustor design modification such as staged,
premixed, variable geometry and catalytic approaches. NOx emission can be highly
dependent on the flame temperature within the combustor and the flame temperature
itself is dependent on combustor inlet temperature and the air-fuel ratio.
There are two ways of reducing NOx emission by altering the operating range
of equivalence ratio (EQR). One is to operate at fuel rich EQR and the other is fuel
lean EQR. The justification for this approach is shown by the variation of NOx
formation with EQR in Figure 3.12. Flame temperature is higher near stoichiometric
combustion.
NOx
Fuel Lean Burning
Fuel Rich Burning
Figure 3.12: Effect o
N.H., 1993)
0.5
Reaction Zonef Reaction Zone Equ
1.0
Equivalence R
ivalence Ratio
1.5
atioon NOx Emission (Escott,
57
Burning in the fuel rich region of EQR could present problems with soot
formation and the necessary addition of air after the reaction zone could lead to
stoichiometric conditions and thus increase NOx emission. Burning in fuel lean
region of EQR avoids these problems but is susceptible to lean flammability and
flame blow off problems. Designing a combustor with low NOx emission approaches
present problems because the combustor has to operate over a wide range of overall
EQR, thus the air and/or the fuel is normally staged.
CHAPTER IV
BURNER DESIGN CONCEPT
4.1 Introduction
This chapter provides the complete description of the laboratory scale
experimental set up designed for testing the emission characteristic of a liquid fuel
burner. The designs are extensively dependent to the employed operating parameters
such as fuel flow rate, injection air flow rate, fuel pressure and injection air pressure.
Ideal gas turbine combustor should provide low NOx formation and
negligible CO and UHC combined with good flame stability. The success of this
ideal combustor will depend upon the thorough mixing of the fuel and air in the
primary zone. Information about the fuel and air mixing can only be adequately
retrieved by measuring local gas composition within the combustor. Mellor et al.
(1972) reported the measurements of species and temperature in an Allison J-33
combustor and the results indicated that for a well atomized fuel spray, due to
turbulence, the mixing controls the local equivalence ratios and hence reduce the
pollution formation.
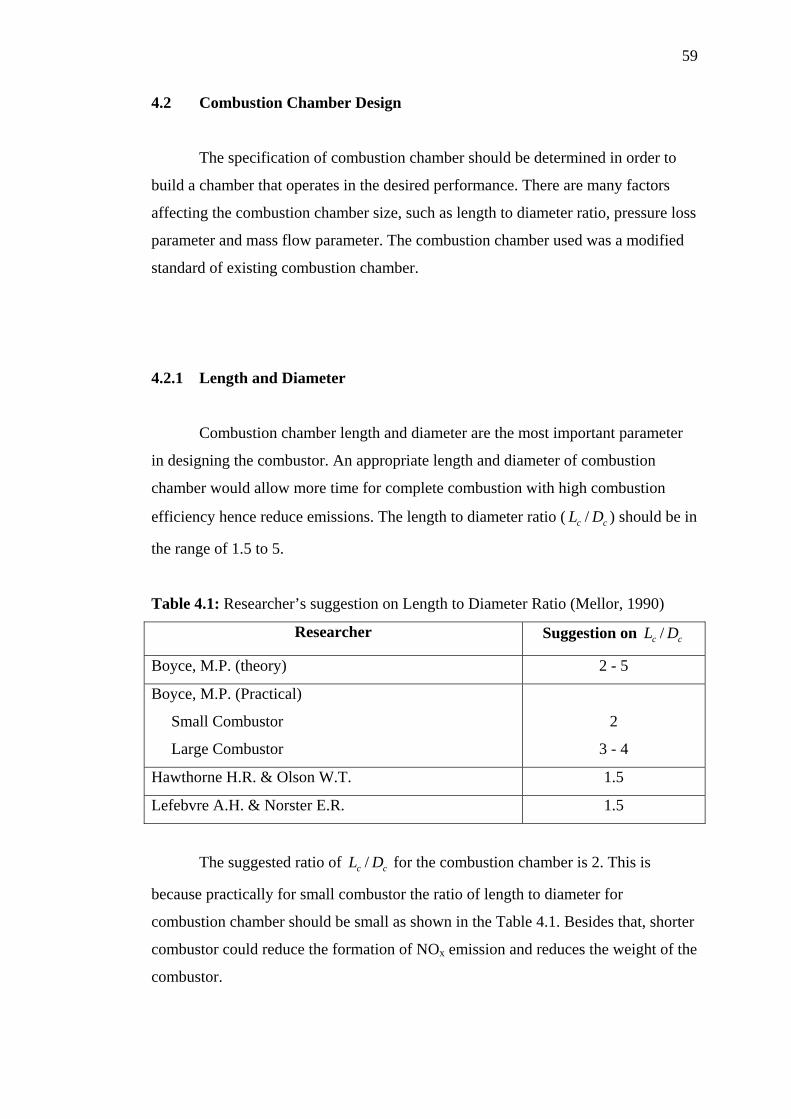
59
4.2 Combustion Chamber Design
The specification of combustion chamber should be determined in order to
build a chamber that operates in the desired performance. There are many factors
affecting the combustion chamber size, such as length to diameter ratio, pressure loss
parameter and mass flow parameter. The combustion chamber used was a modified
standard of existing combustion chamber.
4.2.1 Length and Diameter
Combustion chamber length and diameter are the most important parameter
in designing the combustor. An appropriate length and diameter of combustion
chamber would allow more time for complete combustion with high combustion
efficiency hence reduce emissions. The length to diameter ratio ( ) should be in
the range of 1.5 to 5.
cc DL /
Table 4.1: Researcher’s suggestion on Length to Diameter Ratio (Mellor, 1990)
Researcher Suggestion on cc DL /
Boyce, M.P. (theory) 2 - 5
Boyce, M.P. (Practical)
Small Combustor
Large Combustor
2
3 - 4
Hawthorne H.R. & Olson W.T. 1.5
Lefebvre A.H. & Norster E.R. 1.5
The suggested ratio of for the combustion chamber is 2. This is
because practically for small combustor the ratio of length to diameter for
combustion chamber should be small as shown in the Table 4.1. Besides that, shorter
combustor could reduce the formation of NO
cc DL /
x emission and reduces the weight of the
combustor.
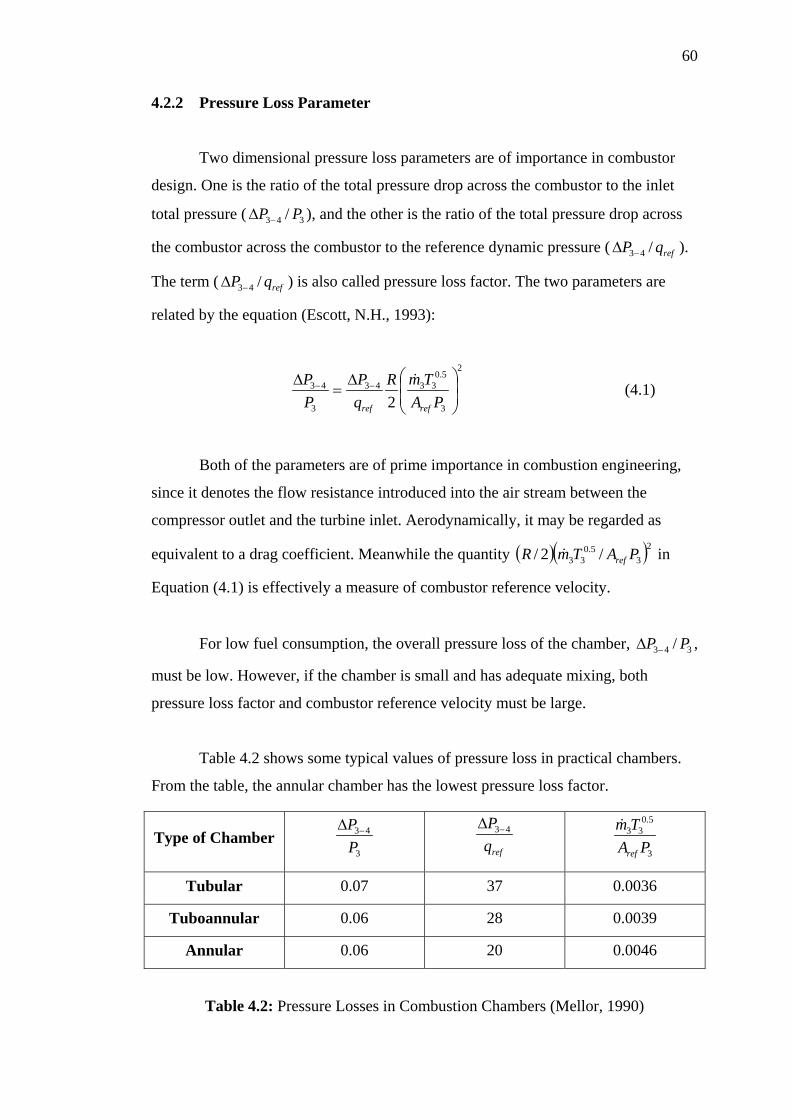
60
4.2.2 Pressure Loss Parameter
Two dimensional pressure loss parameters are of importance in combustor
design. One is the ratio of the total pressure drop across the combustor to the inlet
total pressure ( ), and the other is the ratio of the total pressure drop across
the combustor across the combustor to the reference dynamic pressure ( ).
The term ( ) is also called pressure loss factor. The two parameters are
related by the equation (Escott, N.H., 1993):
343 / PP −∆
refqP /43−∆
refqP /43−∆
2
3
5.03343
3
43
2 ⎟⎟⎠
⎞⎜⎜⎝
⎛∆=
∆ −−
PATmR
qP
PP
refref
& (4.1)
Both of the parameters are of prime importance in combustion engineering,
since it denotes the flow resistance introduced into the air stream between the
compressor outlet and the turbine inlet. Aerodynamically, it may be regarded as
equivalent to a drag coefficient. Meanwhile the quantity ( )( )235.0
33 /2/ PATmR ref& in
Equation (4.1) is effectively a measure of combustor reference velocity.
For low fuel consumption, the overall pressure loss of the chamber, ,
must be low. However, if the chamber is small and has adequate mixing, both
pressure loss factor and combustor reference velocity must be large.
343 / PP −∆
Table 4.2 shows some typical values of pressure loss in practical chambers.
From the table, the annular chamber has the lowest pressure loss factor.
Type of Chamber 3
43
PP −∆
refqP 43−∆
3
5.033
PATm
ref
&
Tubular 0.07 37 0.0036
Tuboannular 0.06 28 0.0039
Annular 0.06 20 0.0046
Table 4.2: Pressure Losses in Combustion Chambers (Mellor, 1990)
61
The relationship between size and pressure loss for the optimal cross
sectional area of the casing, for straight combustors in most industrial
combustors and some aircraft combustors are (Mellor, 1990):
refA
5.01
3
4343
3
5.033
2 ⎥⎥⎦
⎤
⎢⎢⎣
⎡⎟⎟⎠
⎞⎜⎜⎝
⎛ ∆∆=
−
−−
PP
qP
PTmRA
refref
& (4.2)
4.3 Swirler Design
Swirling jets were used for stabilization and control of flame and to achieve a
high intensity combustion. The common method of generating swirl is by using
angled vanes in the passages of air.
Most conventional combustors employ the axial flow type swirlers. The
swirler vanes were usually flat for ease of manufacture, but curved vane was
sometimes used for their better aerodynamics properties (Lefebvre, 1983). Ahmad, et
al. (1986) found problems in the achievement of adequate combustion efficiency and
stability with lean primary zones using large air flow axial swirler with central fuel
injection (Kim, 1995). Alkabie, et al. (1988) showed that these problems could be
overcome by the use of radial swirler followed by a dump expansion with their quite
different near swirler aerodynamic. For large air flow, the axial swirler has
disadvantages for accommodating more air because the expansion from the swirler is
reduced by the requirement to increase the swirler diameter. Increasing the air flow
would reduce the flow expansion to the combustor diameter. The expansion ratio
should be more than 1.5 to create a corner recirculation zone. However, this problem
is not encountered with radial swirlers since the radial swirler outlet can be
maintained constant and the vane depth increased to accommodate more air to
achieve the pressure loss required. Alkabie (1989) found the noticeable improvement
in performance and NOx emission of the radial swirler over the axial swirler due to
the immediate contact of fuel with the turbulent swirled air as it leaves the central
62
fuel injector. As proven, radial swirler provides better advantages over the axial
swirler. So, in this research, the radial swirlers would be used.
4.3.1 Rapid Mixing System
There are number of ways of producing better mixing between air and fuel.
One of the ways is by creating rapid mixing combustion system. Rapid fuel and air
mixing are best produced by using swirlers.
To achieve rapid fuel and air mixing, turbulence must be generated to
promote the mixing. Turbulence energy is created from pressure energy dissipated
downstream of the stabilizer. In swirlers, increasing the blockage or pressure drop of
the swirler can generate turbulence. Swirler pressure drop could be done in number
of ways:
(a) Increasing the swirler vane angle
(b) Decreasing the swirler outlet diameter (d/D) or increasing the swirler hub
diameter, both of which increase the swirler flow blockage
(c) Increasing the number of vanes
Besides the effect of rapid fuel and air mixing, all of these factors also
increase the size of the recirculation zone. An increase in the size of the recirculation
zone together with the turbulence generated in the shear layer region can increase
fuel and air mixing significantly.
4.3.2 Swirl Flow
Swirl flow is a main flow produced by air swirled in burner system. Such
flow is the combination of swirling motion and vortex breakdown. Swirling flow is
widely used to stabilize the flame in combustion chamber. Swirling flow induces a
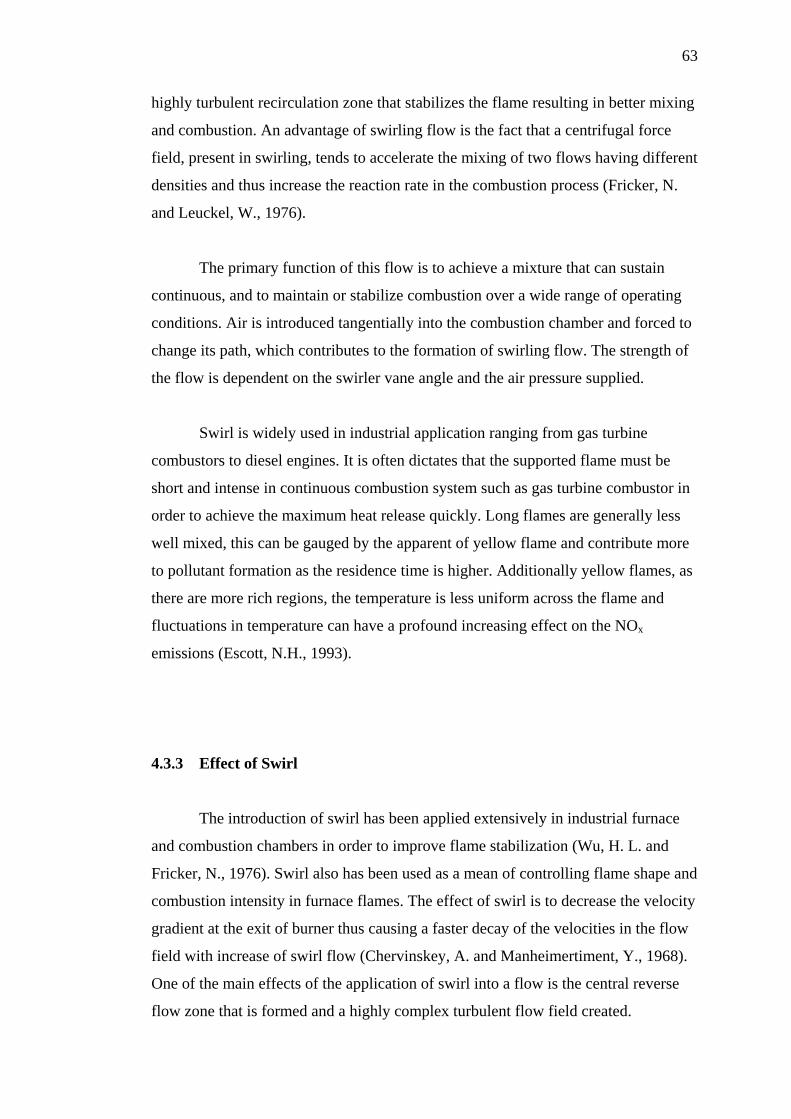
63
highly turbulent recirculation zone that stabilizes the flame resulting in better mixing
and combustion. An advantage of swirling flow is the fact that a centrifugal force
field, present in swirling, tends to accelerate the mixing of two flows having different
densities and thus increase the reaction rate in the combustion process (Fricker, N.
and Leuckel, W., 1976).
The primary function of this flow is to achieve a mixture that can sustain
continuous, and to maintain or stabilize combustion over a wide range of operating
conditions. Air is introduced tangentially into the combustion chamber and forced to
change its path, which contributes to the formation of swirling flow. The strength of
the flow is dependent on the swirler vane angle and the air pressure supplied.
Swirl is widely used in industrial application ranging from gas turbine
combustors to diesel engines. It is often dictates that the supported flame must be
short and intense in continuous combustion system such as gas turbine combustor in
order to achieve the maximum heat release quickly. Long flames are generally less
well mixed, this can be gauged by the apparent of yellow flame and contribute more
to pollutant formation as the residence time is higher. Additionally yellow flames, as
there are more rich regions, the temperature is less uniform across the flame and
fluctuations in temperature can have a profound increasing effect on the NOx
emissions (Escott, N.H., 1993).
4.3.3 Effect of Swirl
The introduction of swirl has been applied extensively in industrial furnace
and combustion chambers in order to improve flame stabilization (Wu, H. L. and
Fricker, N., 1976). Swirl also has been used as a mean of controlling flame shape and
combustion intensity in furnace flames. The effect of swirl is to decrease the velocity
gradient at the exit of burner thus causing a faster decay of the velocities in the flow
field with increase of swirl flow (Chervinskey, A. and Manheimertiment, Y., 1968).
One of the main effects of the application of swirl into a flow is the central reverse
flow zone that is formed and a highly complex turbulent flow field created.
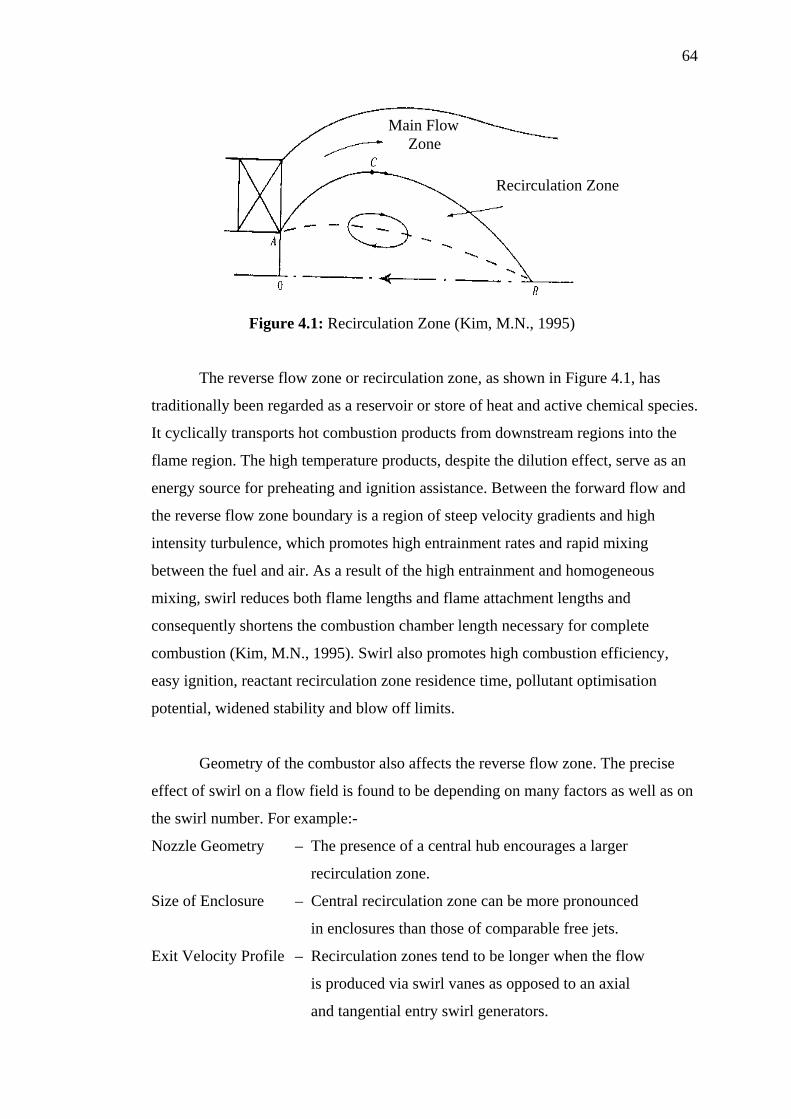
64
Main Flow Zone
Recirculation Zone
Figure 4.1: Recirculation Zone (Kim, M.N., 1995)
The reverse flow zone or recirculation zone, as shown in Figure 4.1, has
traditionally been regarded as a reservoir or store of heat and active chemical species.
It cyclically transports hot combustion products from downstream regions into the
flame region. The high temperature products, despite the dilution effect, serve as an
energy source for preheating and ignition assistance. Between the forward flow and
the reverse flow zone boundary is a region of steep velocity gradients and high
intensity turbulence, which promotes high entrainment rates and rapid mixing
between the fuel and air. As a result of the high entrainment and homogeneous
mixing, swirl reduces both flame lengths and flame attachment lengths and
consequently shortens the combustion chamber length necessary for complete
combustion (Kim, M.N., 1995). Swirl also promotes high combustion efficiency,
easy ignition, reactant recirculation zone residence time, pollutant optimisation
potential, widened stability and blow off limits.
Geometry of the combustor also affects the reverse flow zone. The precise
effect of swirl on a flow field is found to be depending on many factors as well as on
the swirl number. For example:-
Nozzle Geometry – The presence of a central hub encourages a larger
recirculation zone.
Size of Enclosure – Central recirculation zone can be more pronounced
in enclosures than those of comparable free jets.
Exit Velocity Profile – Recirculation zones tend to be longer when the flow
is produced via swirl vanes as opposed to an axial
and tangential entry swirl generators.
65
The location and the shape of the recirculation zone are a function of the
various inlets and swirl generator configurations, enclosure size, extent of reaction
and any other factor that manipulates the imposed pressure gradient. Syred and
Dahman (1965) suggest that smaller chamber diameters reduce the interference
between the flow field and furnace enclosure, thus providing a recirculation zone that
is longer and more advantageous for flame stabilization.
4.3.4 Swirl Stabilized Flame
The primary zone airflow pattern of gas turbine combustors is of major
importance of flame stability. Various types of airflow pattern are employed, but one
feature common to all is the creation of a torroidal reverse flow. This torroidal vortex
system plays an important role in flame stabilization since it entrains and recirculates
a portion of the hot combustion product to mix with the incoming air and fuel.
One of the most effective ways to induce recirculation flow in the primary
zone is by fitting a swirler around the fuel injector. This type of recirculation zone
may provide better mixing than that obtained by other means such as bluff body.
This is because of the strong shear regions, high turbulence and rapid mixing rates
produced by the swirling action. Besides that, the presence of a solid surface
exposed to the high temperature is reduced and the deposition of coke such as occur
on bluff bodies in heterogeneous combustion is also reduced.
Swirl increases the production of turbulence above that generated by non-
swirling flows because the presence of the tangential velocity component provides
additional velocity gradient. Swirling also increases the turbulence burning velocity
to ensure blow off does not occur. Besides that, recirculation vortex produced by
swirl acts as a heat source forcing combustion product to move upstream and mix
with the partially premixed reactant. This increases the amount of contact between
fuel, air and hot combustion products (Syred, N. and Beer, J.M., 1974). An additional
factor that explains why swirl has a stabilizing effect is that stagnation points are
found at upstream and / or downstream positions of central recirculation zone. This
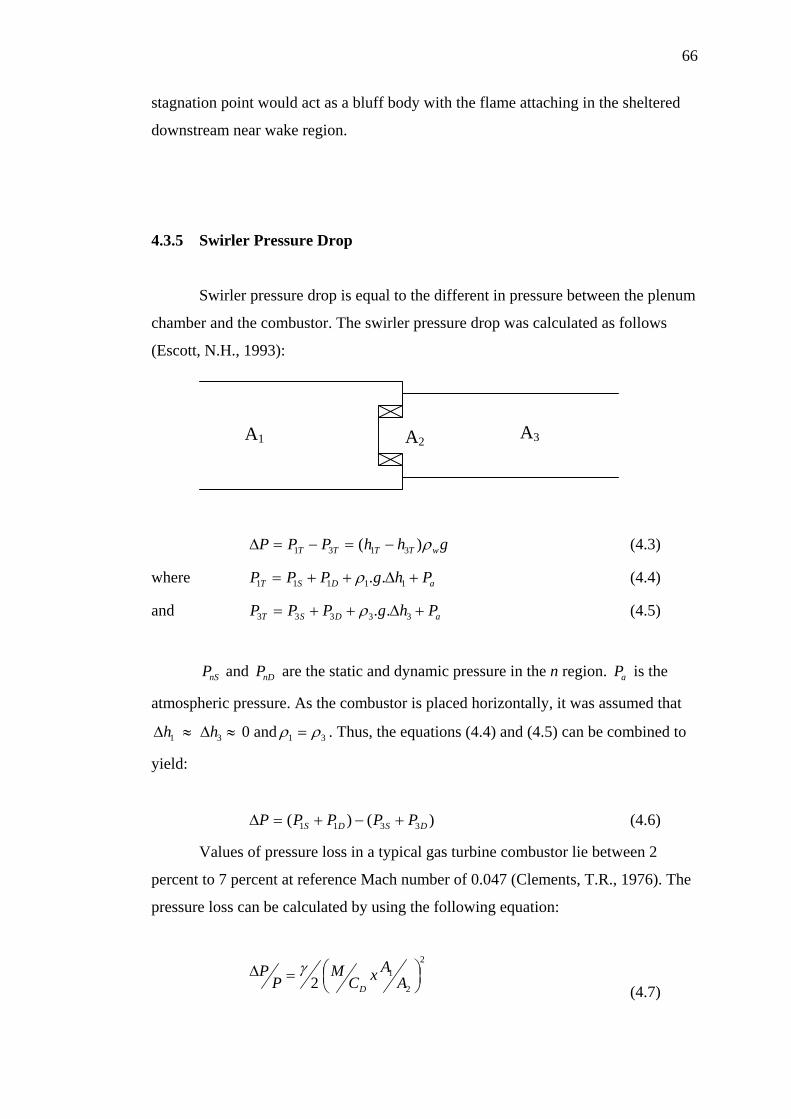
66
stagnation point would act as a bluff body with the flame attaching in the sheltered
downstream near wake region.
4.3.5 Swirler Pressure Drop
Swirler pressure drop is equal to the different in pressure between the plenum
chamber and the combustor. The swirler pressure drop was calculated as follows
(Escott, N.H., 1993):
ghhPPP wTTTT ρ)( 3131 −=−=∆ (4.3)
A2 A3 A1
where aDST PhgPPP +∆++= 11111 ..ρ (4.4)
and aDST PhgPPP +∆++= 33333 ..ρ (4.5)
and are the static and dynamic pressure in the n region. is the
atmospheric pressure. As the combustor is placed horizontally, it was assumed that
0 and
nSP nDP aP
1h∆ ≈ 3h∆ ≈ 31 ρρ = . Thus, the equations (4.4) and (4.5) can be combined to
yield:
)()( 3311 DSDS PPPPP +−+=∆ (4.6)
Values of pressure loss in a typical gas turbine combustor lie between 2
percent to 7 percent at reference Mach number of 0.047 (Clements, T.R., 1976). The
pressure loss can be calculated by using the following equation:
2
2
12 ⎟
⎠⎞⎜
⎝⎛=∆
AAxC
MP
PD
γ (4.7)
67
where,
=∆P
P Swirler Pressure loss =DC Swirler discharge coefficiency
=γ Ratio of specific heat , = Combustor and swirler open area 1A 2A
=M Airflow Mach number
4.3.6 Swirl Number
Experimental studies have shown that the flame size, shape, stability and
combustion intensity are affected by the degree of swirl imposed on the flow. This
degree of swirl is denoted by the swirl number S, which is a non-dimensional number
characterizing the amount of rotation imposed to the flow. An advantage of swirling
flow combustion is the fact that a centrifugal force field, present in swirling or vortex
flow, tends to accelerate the mixing of two flows having different densities and thus
increase the reaction rate in the combustion process.
The common method of generating swirl is by using angled vanes in the
passages of air. The characteristic of the swirling flow depends on the swirler vane
angle. Basically there are two types of swirler design; axial swirler and radial swirler.
Most conventional combustor employs the axial flow type of swirler. The swirler
vane is usually flat for ease of manufacture, but curved vane is sometimes performed
for their better aerodynamic properties.
Alkabie, et al (1988) found problems in the achievement of adequate
combustion efficiency and stability with lean primary zones using large air flow axial
swirler with central fuel injection. Alkabie, et al (1988) showed that these problems
could be overcome by the use of radial swirler followed by dump expansion with
their quite different near swirler aerodynamic. Flat vane swirler is inefficient because
they run under stalled condition.
68
Swirl number represents the axial flux of swirl momentum divided by the
axial flux of axial momentum and is widely used for characterizing the intensity of
swirl in enclosed and fully separated flow. That is (Kim, M.N., 1995)
2DG
GSx ×
= θ (4.8)
Where:
θG = Axial flux of angular momentum
xG = Axial flux of axial momentum
2D = Nozzle radius
This is a very basic calculation of a swirl number. There is better suggestion
on the calculation for the swirl number. Claypole and Syred (1981) proposed a
geometrical swirl number, which was taken as non-dimensional measure of the
tangential momentum supplied to the flow and if perfect mixing and conservation of
momentum is assumed, then the swirl number can be defined in terms of the
geometry of the combustor.
gS
teog ArrS π= (tangential flow / total flow)2 (4.9)
where:
=tA Area of tangential inlets =er Radius of the exit of the combustor
=or Radius of the tangential inlets from the centre of the combustor
In the present work, swirl number calculation based on Leuckel method
would be employed. This method would not much represent the real situation.
However, Leuckel method was a basic method used to simulate the effectiveness of
fuel and air mixture for a particular swirler vane angle. Past researchers agree that
there is an optimum value of swirl number, where above that value, the emissions
will begin to increase. Kim (1995) proposed that swirl number higher that 3.25
would raise the emissions. From, the Leuckel method swirl number calculation, swirl
vane angle of 70o and above were not recommended. Swirl number, σ calculation
based on Leuckel method was as follow (Appendix B):
69
(4.10)
απψ
cos.2.
1rsn
=
(4.11) ψασ =
Tan−1
Where,
=n number of Vanes =s Thickness of Vanes
=1r Swirler Outlet Area =α Swirler Vane Angle
4.4 Fuel Injector Design
Fuel injection could be provided by three distinct injection methods: central
fuel injection, vane passage fuel injection and wall fuel injection. The common
method of fuel injection in swirl stabilized flows is injection axially through the
centre of the swirler. However, another variation from conventional central axial fuel
injection is to inject the fuel radially from the central axis across the entering air jet.
The present work is involved with the former method of fuel injection. In this
research, fuel injector would not be emphasized much as the rationality of having
injector in this research is to serve its purpose of injecting fuel into the combustion
chamber. However, for the intention of optimizing emissions reduction, injector
could be one of a major contributor.
CHAPTER V
EXPERIMENTAL SET UP
5.1 Introduction
In this chapter, the experimental rig set up and procedures used for the
assessment of various radial swirler angle performances were described. Combustion
rig description, fuel injection and exhaust gas sampling shall also be described.
5.2 Experimental Set Up
The general rig set-up for the liquid fuel burner test is shown in Appendix C.
The rig was placed horizontally on a movable trolley. The combustion zone consists
of 4 chambers that are plenum chamber, combustion chamber, extension chamber
and safety chamber.
The air is introduced through the inlet pipe and flows axially into the plenum
chamber before entering the combustion chamber through the radial swirler of 40
mm outlet diameter that is installed at exit plane of plenum chamber. The amount of
air entering the combustor is controlled by the air swirler’s minimum area.
71
The rig is equipped with a central fuel injector. The inside diameter of the
combustor is 163 mm and the total length is 852 mm. The combustor was cooled by
convection from the ambient air. The length of the combustion chamber is
representative of the minimum used in aero engines but is generally shorter than the
combustors used in gas turbines. Diesel fuel was used for the testing, which was
supplied by Universiti Teknologi Malaysia, obtained from Petronas fuel station.
An extension chamber was introduced because the test is conducted in both
fuel lean and fuel rich regions where the flames in the fuel rich region are generally
long. An additional chamber was also introduced for the safety of gas sampling
probe and gas measurement purpose. The gas analyzer will be placed at the exit
plane of safety chamber.
Tests on exhaust emission were carried out using 4 different swirler vane
angles of 30o, 40o, 50o and 60o. Central fuel injector was placed in dual situations,
upstream (Figure 5.3) and downstream (Figure 5.4) of the swirler exit plane. Besides
the swirler vane angles, orifice plates with different orifice sizes also will be varied.
Orifice sizes of 20mm, 25mm and 30mm will be used.
The exhaust gas sampling probe was placed at the end pipe of combustion
chamber. The gas analyzer used in these tests was the portable Kane May gas
analyzer that could measures oxides of nitrogen, sulphur dioxide and carbon
monoxide emission.
5.2.1 Liquid Fuel Burner
A liquid fuel burner has been developed after considering on its design
concepts. Burner consists of three main components that are combustion chamber,
swirler and fuel injector. Modification on the existing combustion chamber and
injector were performed to produce desired output of stable combustion over wide
range of equivalence ratio with combustion temperature of less than 1200oC. The
temperature shall be less than 1200oC because it is difficult to work under very hot
72
environment. Furthermore, the allowable temperature to reach gas analyzer sensors is
40oC. Temperature of less than 1000oC was hardly achievable as the desired output
was to hold combustion over wide range of equivalence ratio that is from 0.55 to 1.1.
5.2.1.1 Combustion Chamber
The entire burner system consists of four chambers; plenum chamber,
combustion chamber, extension chamber and safety chamber. The plenum chamber
was built at of 1.5. Air and fuel were delivered to plenum chamber before
there were introduced into the combustion chamber. Fuel injector was located in the
plenum chamber. Combustion chamber was built at ratio of 2. Combustion
chamber was built at diameter of 163mm with length of 338mm. An extension
chamber is designed at ratio of 1.5 for a fuel rich region experimental
purpose, as the flame obtained in this region is generally long. An additional safety
chamber is mounted at the end of extension chamber for a safety and measurement
purpose. This will allow lower temperature of combustion product to be measured by
gas analyzer, as the gas analyser should not be exposed to high temperature of
combustion product. The detail of plenum chamber, combustion chamber, extension
chamber and safety chamber were as shown in Appendix D, Appendix E, Appendix
F and Appendix G respectively.
cc DL /
cc DL /
cc DL /
5.2.1.2 Swirler and Orifice Plate
The experiment was conducted using four existing radial swirlers with
swirler vane angle of 30o, 40o, 50o and 60o. The swirlers were prepared by previous
researcher using CNC machine in Kolej Universiti Tun Hussein Onn, Batu Pahat,
Johor. Orifice plate of 25mm and 30mm were also been in place when this research
was conducted. An additional 20mm orifice plate was fabricated to investigate
performance of smaller orifice plate size. All swirlers and orifice plates were
73
fabricated using mild steel. The detail of swirler design and orifice plate design were
in the appendix H and Appendix I respectively.
5.2.1.3 Injector Design
Injector consists of two components; nozzle connector and the nozzle. The
nozzle was made using a recyclable hollow pin with an opening of 1mm as shown in
Appendix J. This injector upholds the principle of an air assisted plain orifice
atomizer, combination of plain atomizer and air assist atomizer. An air assist injector
was used in the present work as this injector is very suitable for highly viscous fuels
and good atomisation could be obtained. Besides that, it could provide good
atomisation at low fuel flow rate. Meanwhile, the nozzle connector was fabricated to
deliver fuel and atomizing air to the nozzle. The nozzle connector allows the
atomizing air pumped to nozzle evenly all around. The nozzle connector design was
shown in Appendix K.
Other components designs such as fuel air nozzle flange, downstream
injection extension, swirler-orifice plate attachment flange were as shown in
Appendix L, Appendix M and Appendix N respectively. The overall burner assembly
drawing was also attached in Appendix O.
5.2.2 Fuel System
Fuel transportation system consists of fuel tank and a compressed air supply.
Fuel was drawn vertically into the nozzle connector with the assist of compressed air.
This is to increase the fuel pressure. The fuel should be pressurized to improve its
atomizing properties while injected into the combustion chamber. The air and fuel
should be properly delivered into the combustion chamber to get good mixing of fuel
and air in order to produce low emission combustion. Diesel fuel was also introduced
74
into the combustion chamber through the nozzle connector. The fuel was delivered
with constant air pressure of 2 bar and fuel flow rate of 50 ml/min.
5.2.2.1 Fuel Tank
The fuel tank was prepared using cylindrical recyclable tank that could
uphold compressed air until 10 bar. A safety pressure valve was placed on the left
top of the tank for safety reason. The tank was pressurized by compressed air at 2
bar. The fuel was drawn from bottom of the tank so that the fuel could flow smoothly
and pressurized by the compressed air. The tank capacity is 15 litres.
5.2.2.2 Air Compressor
An air compressor with 0.373 kW output power and pressurizing capacity of
10 bar was used to serve a purpose of assisting the fuel to be delivered into the
combustion chamber.
5.2.3 Air Supply System
Besides the fuel system, air supply system was another system which requires
attention. Air is an equally important as a fuel to be in the combustion chamber as it
is needed to promote mixing of fuel and air. The air was introduced into the plenum
chamber in two different ways. Swirling air was introduced in the plenum chamber
with constant pressure of 2 bar while the air flow rate was varied. This air was forced
to change its path by swirler’s vane angle that contributes to the formation of
swirling flow. Meanwhile, the atomizing air that was used to assist the fuel was
introduced in the combustion chamber through a nozzle connector with constant
pressure of 2 bar.
75
5.2.3.1 Air Compressor
An air compressor with 1.865 kW output power and pressurizing capacity of
10 bar was used for air atomizing purpose. Bigger compressor was essential for this
process as to provide sufficient air for atomizing purpose. Smaller tank capacity air
compressor unable to deliver high flow rate of air.
5.2.3.2 Blower
A 0.249 kW blower was used in this experimental testing. This blower could
provide air capacity of 0.707925 m3/min (25 CFM). The blower was used to provide
air for swirling option. For the point of swirling motion, air flow rate was the main
concern rather than the air pressure. The volume of air should be sufficient enough to
generate desired equivalence ratio.
5.2.4 Instrumentation
Filter, Lubricator and Regulator gauges, flow meters, pressure gauges, gas
sampling probe, thermocouples and gas analyzer were additional instruments needed
in this experimental testing. Flow meters, thermocouples and gas analyzer were
calibrated due to experimental testing. The flow meter, on the other hand, was
calibrated for the desired medium prior to experimental testing. The water flow meter
was calibrated for diesel as the fuel used was diesel. The calibration chart was as
shown in Appendix P. Meanwhile, thermocouples were calibrated for its sensitivity
and accuracy using ice cubes and boiled water. The calibration results were attached
in Appendix Q.
76
5.2.4.1 Filter, Lubricator and Regulator Gauge
Three Filter, Lubricator and Regulator (FLR) were used in this experimental
testing. The FLR was mounted one each for both compressors and another one for
the blower. The purpose of the FLR is to filter out water from compress air, lubricate
the joints and regulate the pressure for stable pressure supply.
5.2.4.2 Flow Meters
Two air flow meters and a water flow meter that was calibrated for diesel was
used for experimental testing. The air flow meters are used to measure airflow rate
supplied for swirling and fuel atomizing. Meanwhile the fuel flow meter is used to
measure the flow rate of the fuel.
5.2.4.3 Pressure Gauge
Pressure gauge was used to measure and control the pressure supplied to the
tank and combustor. Three pressure gauges were used in this experimental testing.
One pressure gauge was used for air swirling pressure control and the others for fuel
pressurizing and fuel atomizing control.
5.2.4.4 Gas Sampling Probe
An ‘8’ configuration gas sampling probe was used for mean exit sampling.
The flue gas sample will be drawn to the gas analyser through the ‘8’ configuration
gas sampling probe to measure oxides of nitrogen, carbon monoxide and sulphur
dioxide. It consisted of a ‘8’ configuration bended stainless steel tube and welded at
the end. The gas sampling probe is shown in Figure 5.1
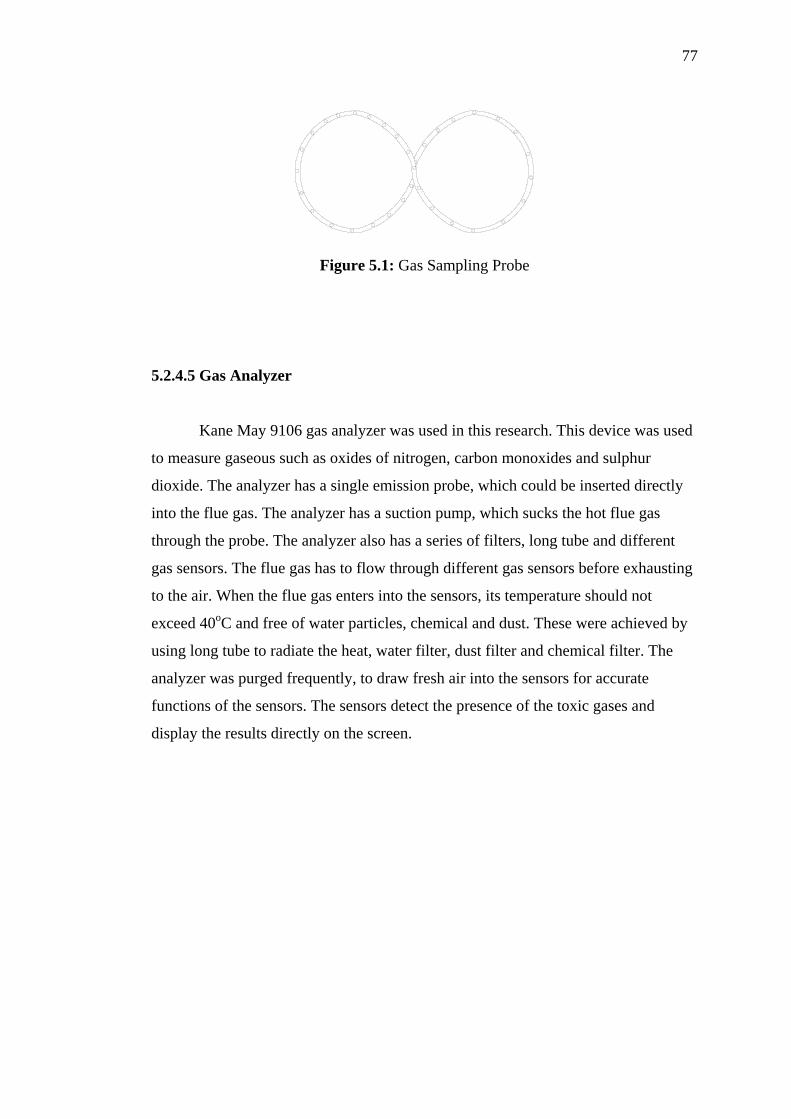
77
Figure 5.1: Gas Sampling Probe
5.2.4.5 Gas Analyzer
Kane May 9106 gas analyzer was used in this research. This device was used
to measure gaseous such as oxides of nitrogen, carbon monoxides and sulphur
dioxide. The analyzer has a single emission probe, which could be inserted directly
into the flue gas. The analyzer has a suction pump, which sucks the hot flue gas
through the probe. The analyzer also has a series of filters, long tube and different
gas sensors. The flue gas has to flow through different gas sensors before exhausting
to the air. When the flue gas enters into the sensors, its temperature should not
exceed 40oC and free of water particles, chemical and dust. These were achieved by
using long tube to radiate the heat, water filter, dust filter and chemical filter. The
analyzer was purged frequently, to draw fresh air into the sensors for accurate
functions of the sensors. The sensors detect the presence of the toxic gases and
display the results directly on the screen.
78
5.3 General Test Procedure
1. A swirler vane angle of 30o and 30mm orifice plate with upstream
injection configuration is mounted at the exit plane of plenum chamber.
2. The gas analyzer system is switched on 10 minutes prior to experimental
testing to stabilize the analyzer’s electronics. The thermocouple recorder,
compressors and blower should also be switched on.
3. The air blower valve is turned on. Once the compressor reaches its upper
pressure limit, the compressor valve should be turned on. All pressure
gauges and flow meter is checked to be in the operating conditions.
4. The air blower is set at 24 CFM to provide equivalence ratio of 0.562.
5. Fuel valve is turned on and the fuel is ignited to start the combustion
using a torch. Pressure gauges and flow meters are rechecked to be in the
operating conditions.
6. Once the flame is stabilized, the emissions are measured using the gas
analyzer. The temperatures obtained from the thermocouple are recorded.
7. The air blower capacity is lessen to designate the flow rate. All 8 reading
at each fuel setting is repeated to determine the emissions and
temperatures.
8. Steps one to seven are repeated for swirler vane angle of 40o, 50o and 60o
with orifice plate sizes of 30mm, 25mm and 20mm with upstream
injection configuration.
9. Steps two to seven are once again repeated with swirler vane angle 30o,
40o, 50o and 60o swirler vane angle for orifice plate sizes of 30mm, 25mm
and 20mm with downstream injection configuration.
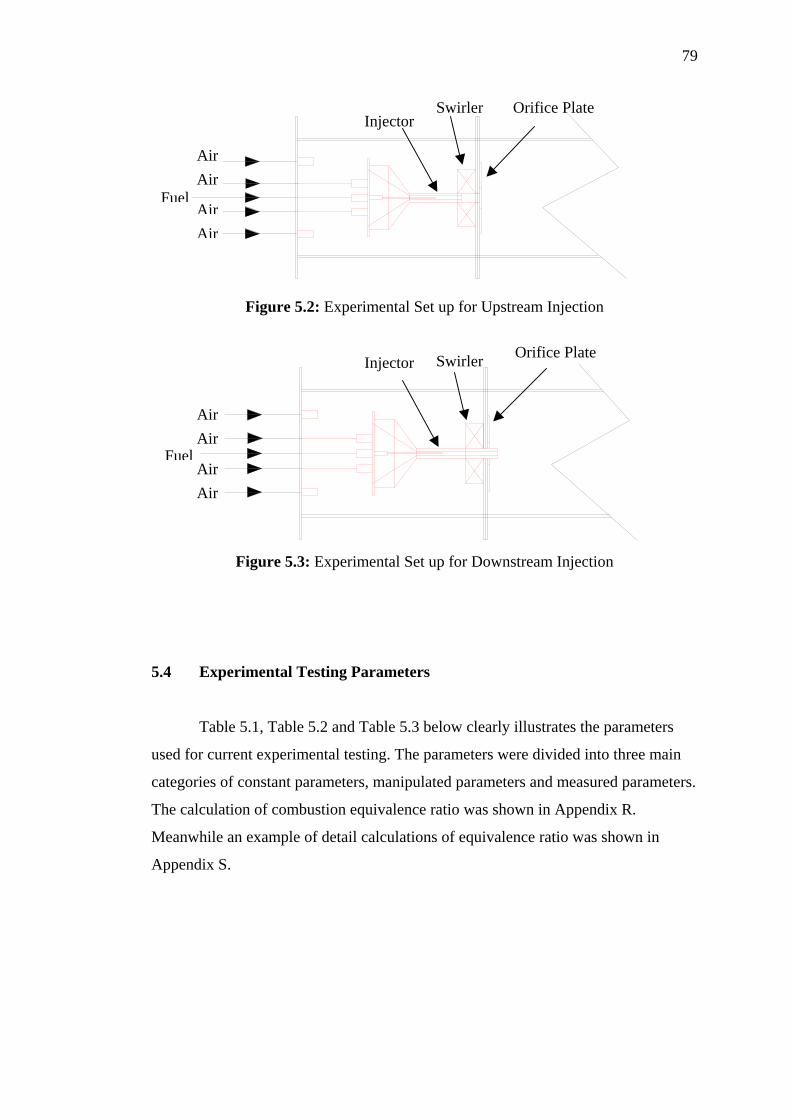
79
SwirlerInjector
Orifice Plate
Air Air
5.4
used f
catego
The ca
Meanw
Appen
Air
AirFigure 5.2: Experimental Set up for Upstream Injection
Orifice Plate SwirlerInjector
Air Air AirAir
Fuel
Fuel
Figure 5.3: Experimental Set up for Downstream Injection
Experimental Testing Parameters
Table 5.1, Table 5.2 and Table 5.3 below clearly illustrates the parameters
or current experimental testing. The parameters were divided into three main
ries of constant parameters, manipulated parameters and measured parameters.
lculation of combustion equivalence ratio was shown in Appendix R.
hile an example of detail calculations of equivalence ratio was shown in
dix S.
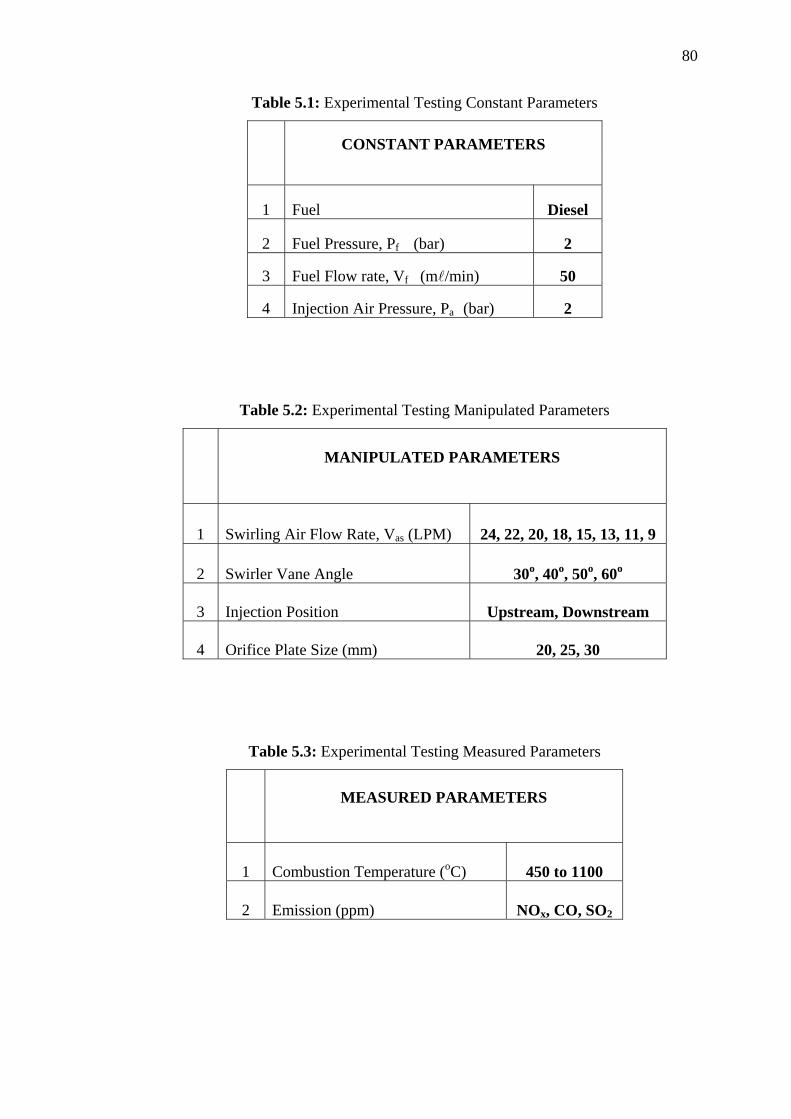
80
Table 5.1: Experimental Testing Constant Parameters
CONSTANT PARAMETERS
1 Fuel Diesel
2 Fuel Pressure, Pf (bar) 2
3 Fuel Flow rate, Vf (ml/min) 50
4 Injection Air Pressure, Pa (bar) 2
Table 5.2: Experimental Testing Manipulated Parameters
MANIPULATED PARAMETERS
1 Swirling Air Flow Rate, Vas (LPM) 24, 22, 20, 18, 15, 13, 11, 9
2 Swirler Vane Angle 30o, 40o, 50o, 60o
3 Injection Position Upstream, Downstream
4 Orifice Plate Size (mm) 20, 25, 30
Table 5.3: Experimental Testing Measured Parameters
MEASURED PARAMETERS
1 Combustion Temperature (oC) 450 to 1100
2 Emission (ppm) NOx, CO, SO2
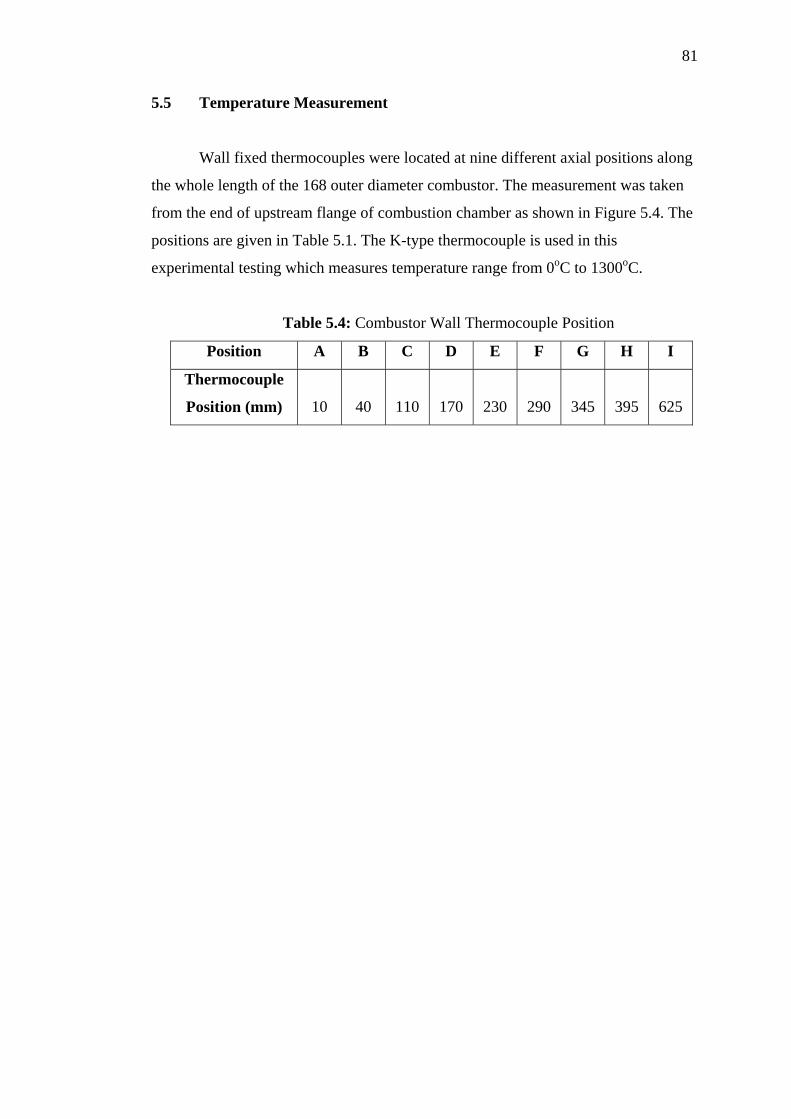
81
5.5 Temperature Measurement
Wall fixed thermocouples were located at nine different axial positions along
the whole length of the 168 outer diameter combustor. The measurement was taken
from the end of upstream flange of combustion chamber as shown in Figure 5.4. The
positions are given in Table 5.1. The K-type thermocouple is used in this
experimental testing which measures temperature range from 0oC to 1300oC.
Table 5.4: Combustor Wall Thermocouple Position
Position A B C D E F G H I
Thermocouple
Position (mm)
10
40
110
170
230
290
345
395
625
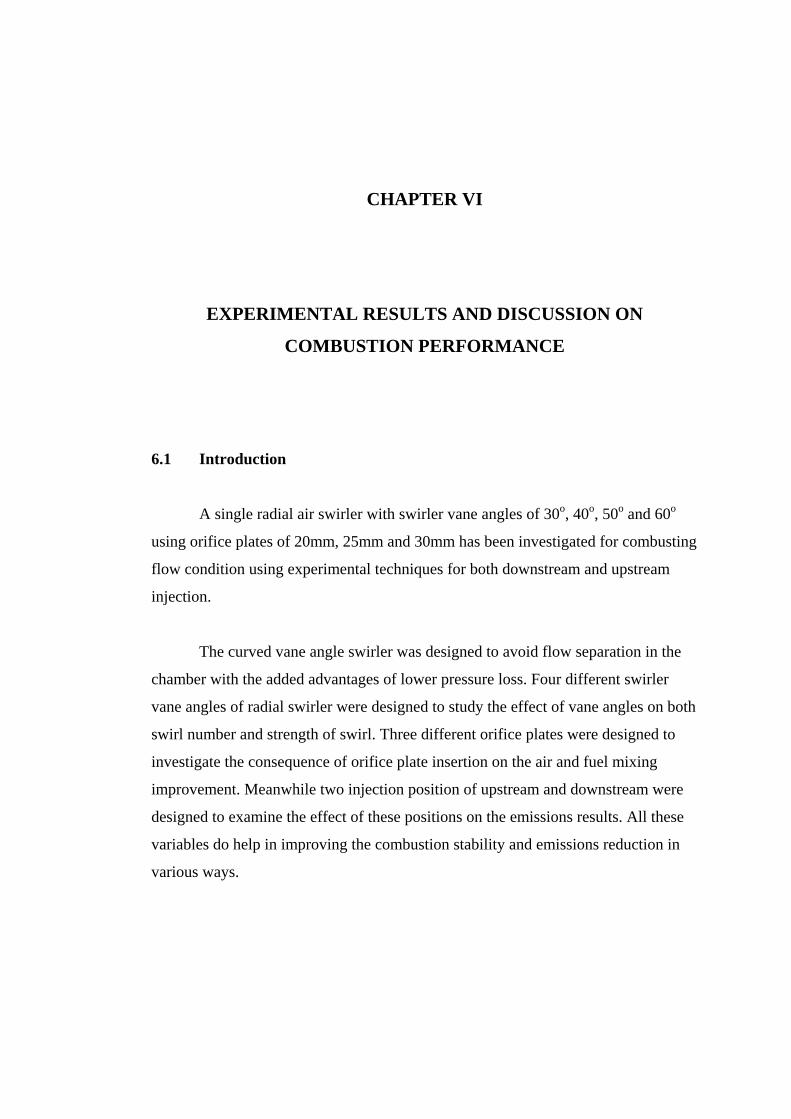
CHAPTER VI
EXPERIMENTAL RESULTS AND DISCUSSION ON
COMBUSTION PERFORMANCE
6.1 Introduction
A single radial air swirler with swirler vane angles of 30o, 40o, 50o and 60o
using orifice plates of 20mm, 25mm and 30mm has been investigated for combusting
flow condition using experimental techniques for both downstream and upstream
injection.
The curved vane angle swirler was designed to avoid flow separation in the
chamber with the added advantages of lower pressure loss. Four different swirler
vane angles of radial swirler were designed to study the effect of vane angles on both
swirl number and strength of swirl. Three different orifice plates were designed to
investigate the consequence of orifice plate insertion on the air and fuel mixing
improvement. Meanwhile two injection position of upstream and downstream were
designed to examine the effect of these positions on the emissions results. All these
variables do help in improving the combustion stability and emissions reduction in
various ways.
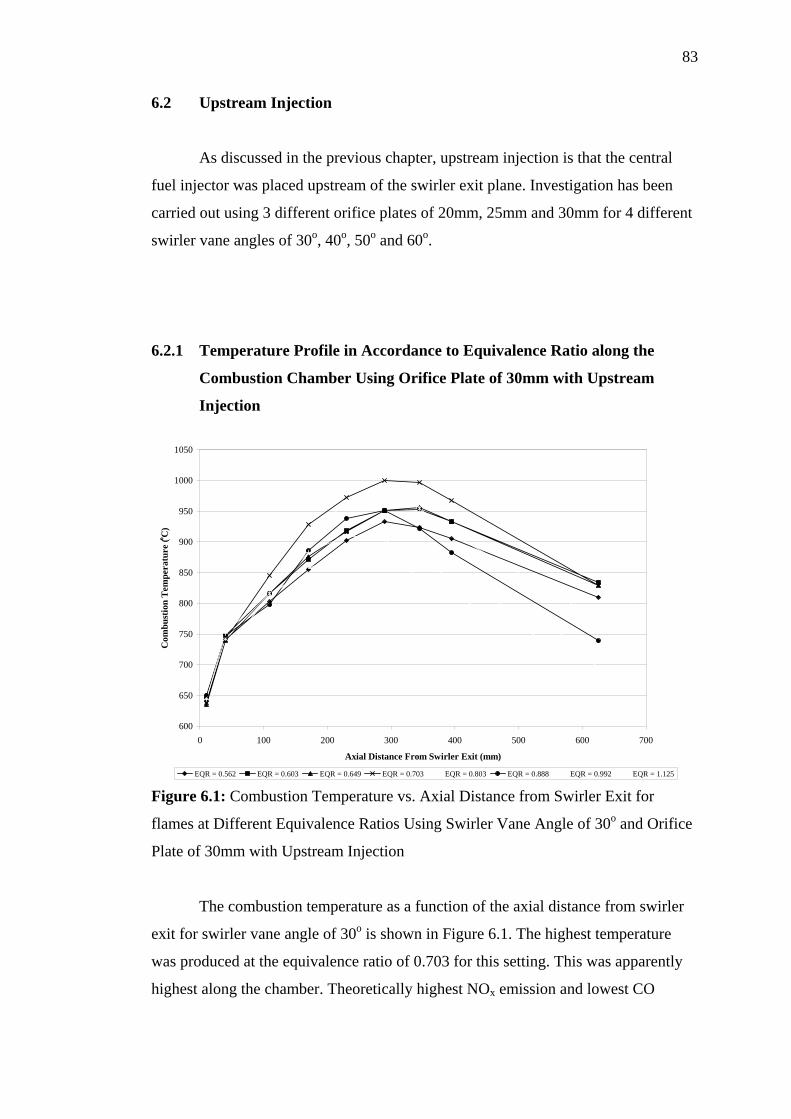
83
6.2 Upstream Injection
As discussed in the previous chapter, upstream injection is that the central
fuel injector was placed upstream of the swirler exit plane. Investigation has been
carried out using 3 different orifice plates of 20mm, 25mm and 30mm for 4 different
swirler vane angles of 30o, 40o, 50o and 60o.
6.2.1 Temperature Profile in Accordance to Equivalence Ratio along the
Combustion Chamber Using Orifice Plate of 30mm with Upstream
Injection
600
650
700
750
800
850
900
950
1000
1050
0 100 200 300 400 500 600 700
Axial Distance From Swirler Exit (mm)
Com
bust
ion
Tem
pera
ture
(o C)
EQR = 0.562 EQR = 0.603 EQR = 0.649 EQR = 0.703 EQR = 0.803 EQR = 0.888 EQR = 0.992 EQR = 1.125 Figure 6.1: Combustion Temperature vs. Axial Distance from Swirler Exit for
flames at Different Equivalence Ratios Using Swirler Vane Angle of 30o and Orifice
Plate of 30mm with Upstream Injection
The combustion temperature as a function of the axial distance from swirler
exit for swirler vane angle of 30o is shown in Figure 6.1. The highest temperature
was produced at the equivalence ratio of 0.703 for this setting. This was apparently
highest along the chamber. Theoretically highest NOx emission and lowest CO
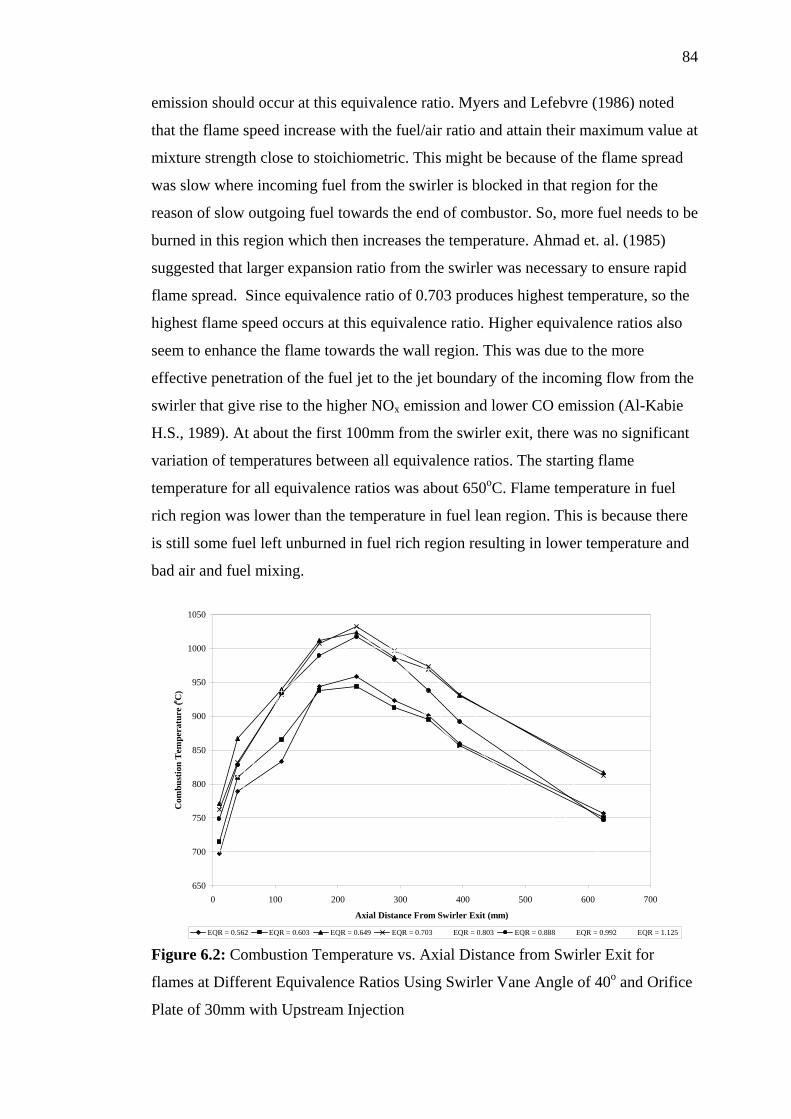
84
emission should occur at this equivalence ratio. Myers and Lefebvre (1986) noted
that the flame speed increase with the fuel/air ratio and attain their maximum value at
mixture strength close to stoichiometric. This might be because of the flame spread
was slow where incoming fuel from the swirler is blocked in that region for the
reason of slow outgoing fuel towards the end of combustor. So, more fuel needs to be
burned in this region which then increases the temperature. Ahmad et. al. (1985)
suggested that larger expansion ratio from the swirler was necessary to ensure rapid
flame spread. Since equivalence ratio of 0.703 produces highest temperature, so the
highest flame speed occurs at this equivalence ratio. Higher equivalence ratios also
seem to enhance the flame towards the wall region. This was due to the more
effective penetration of the fuel jet to the jet boundary of the incoming flow from the
swirler that give rise to the higher NOx emission and lower CO emission (Al-Kabie
H.S., 1989). At about the first 100mm from the swirler exit, there was no significant
variation of temperatures between all equivalence ratios. The starting flame
temperature for all equivalence ratios was about 650oC. Flame temperature in fuel
rich region was lower than the temperature in fuel lean region. This is because there
is still some fuel left unburned in fuel rich region resulting in lower temperature and
bad air and fuel mixing.
650
700
750
800
850
900
950
1000
1050
0 100 200 300 400 500 600 700
Axial Distance From Swirler Exit (mm)
Com
bust
ion
Tem
pera
ture
(o C)
EQR = 0.562 EQR = 0.603 EQR = 0.649 EQR = 0.703 EQR = 0.803 EQR = 0.888 EQR = 0.992 EQR = 1.125 Figure 6.2: Combustion Temperature vs. Axial Distance from Swirler Exit for
flames at Different Equivalence Ratios Using Swirler Vane Angle of 40o and Orifice
Plate of 30mm with Upstream Injection
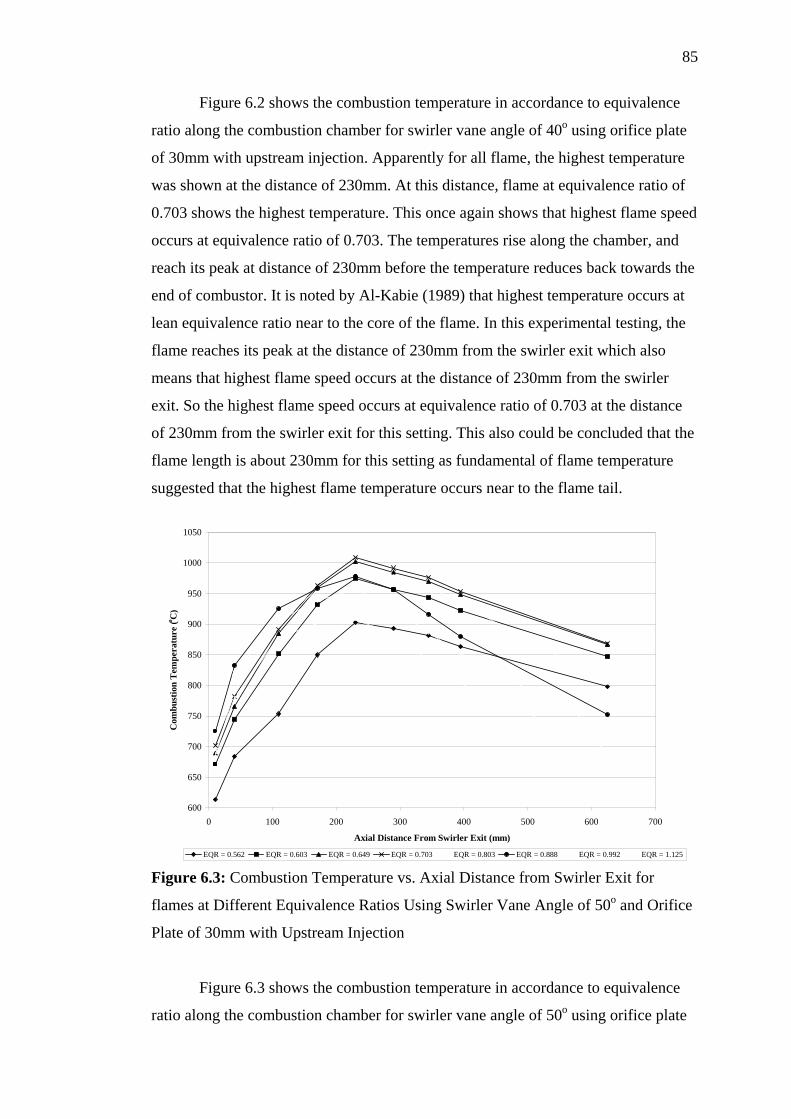
85
Figure 6.2 shows the combustion temperature in accordance to equivalence
ratio along the combustion chamber for swirler vane angle of 40o using orifice plate
of 30mm with upstream injection. Apparently for all flame, the highest temperature
was shown at the distance of 230mm. At this distance, flame at equivalence ratio of
0.703 shows the highest temperature. This once again shows that highest flame speed
occurs at equivalence ratio of 0.703. The temperatures rise along the chamber, and
reach its peak at distance of 230mm before the temperature reduces back towards the
end of combustor. It is noted by Al-Kabie (1989) that highest temperature occurs at
lean equivalence ratio near to the core of the flame. In this experimental testing, the
flame reaches its peak at the distance of 230mm from the swirler exit which also
means that highest flame speed occurs at the distance of 230mm from the swirler
exit. So the highest flame speed occurs at equivalence ratio of 0.703 at the distance
of 230mm from the swirler exit for this setting. This also could be concluded that the
flame length is about 230mm for this setting as fundamental of flame temperature
suggested that the highest flame temperature occurs near to the flame tail.
600
650
700
750
800
850
900
950
1000
1050
0 100 200 300 400 500 600 700
Axial Distance From Swirler Exit (mm)
Com
bust
ion
Tem
pera
ture
(o C)
EQR = 0.562 EQR = 0.603 EQR = 0.649 EQR = 0.703 EQR = 0.803 EQR = 0.888 EQR = 0.992 EQR = 1.125
Figure 6.3: Combustion Temperature vs. Axial Distance from Swirler Exit for
flames at Different Equivalence Ratios Using Swirler Vane Angle of 50o and Orifice
Plate of 30mm with Upstream Injection
Figure 6.3 shows the combustion temperature in accordance to equivalence
ratio along the combustion chamber for swirler vane angle of 50o using orifice plate
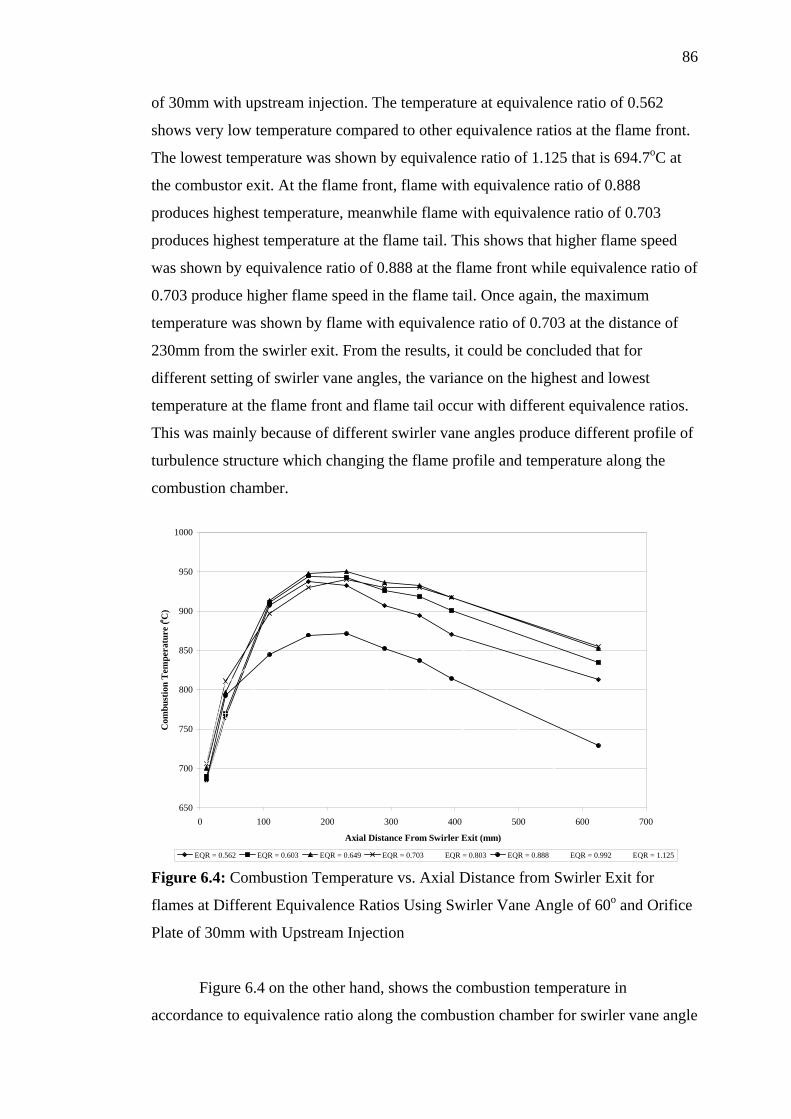
86
of 30mm with upstream injection. The temperature at equivalence ratio of 0.562
shows very low temperature compared to other equivalence ratios at the flame front.
The lowest temperature was shown by equivalence ratio of 1.125 that is 694.7oC at
the combustor exit. At the flame front, flame with equivalence ratio of 0.888
produces highest temperature, meanwhile flame with equivalence ratio of 0.703
produces highest temperature at the flame tail. This shows that higher flame speed
was shown by equivalence ratio of 0.888 at the flame front while equivalence ratio of
0.703 produce higher flame speed in the flame tail. Once again, the maximum
temperature was shown by flame with equivalence ratio of 0.703 at the distance of
230mm from the swirler exit. From the results, it could be concluded that for
different setting of swirler vane angles, the variance on the highest and lowest
temperature at the flame front and flame tail occur with different equivalence ratios.
This was mainly because of different swirler vane angles produce different profile of
turbulence structure which changing the flame profile and temperature along the
combustion chamber.
650
700
750
800
850
900
950
1000
0 100 200 300 400 500 600 700
Axial Distance From Swirler Exit (mm)
Com
bust
ion
Tem
pera
ture
(o C)
EQR = 0.562 EQR = 0.603 EQR = 0.649 EQR = 0.703 EQR = 0.803 EQR = 0.888 EQR = 0.992 EQR = 1.125 Figure 6.4: Combustion Temperature vs. Axial Distance from Swirler Exit for
flames at Different Equivalence Ratios Using Swirler Vane Angle of 60o and Orifice
Plate of 30mm with Upstream Injection
Figure 6.4 on the other hand, shows the combustion temperature in
accordance to equivalence ratio along the combustion chamber for swirler vane angle
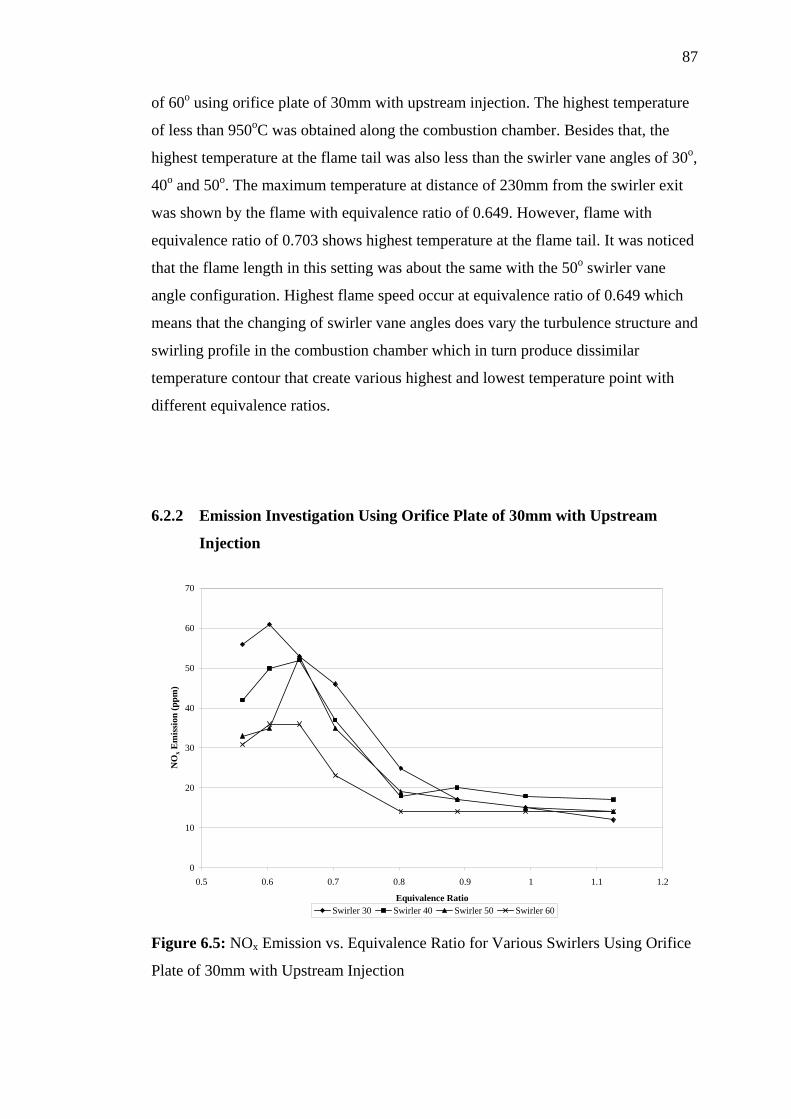
87
of 60o using orifice plate of 30mm with upstream injection. The highest temperature
of less than 950oC was obtained along the combustion chamber. Besides that, the
highest temperature at the flame tail was also less than the swirler vane angles of 30o,
40o and 50o. The maximum temperature at distance of 230mm from the swirler exit
was shown by the flame with equivalence ratio of 0.649. However, flame with
equivalence ratio of 0.703 shows highest temperature at the flame tail. It was noticed
that the flame length in this setting was about the same with the 50o swirler vane
angle configuration. Highest flame speed occur at equivalence ratio of 0.649 which
means that the changing of swirler vane angles does vary the turbulence structure and
swirling profile in the combustion chamber which in turn produce dissimilar
temperature contour that create various highest and lowest temperature point with
different equivalence ratios.
6.2.2 Emission Investigation Using Orifice Plate of 30mm with Upstream
Injection
0
10
20
30
40
50
60
70
0.5 0.6 0.7 0.8 0.9 1 1.1 1.2
Equivalence Ratio
NO
x Em
issi
on (p
pm)
Swirler 30 Swirler 40 Swirler 50 Swirler 60
Figure 6.5: NOx Emission vs. Equivalence Ratio for Various Swirlers Using Orifice
Plate of 30mm with Upstream Injection
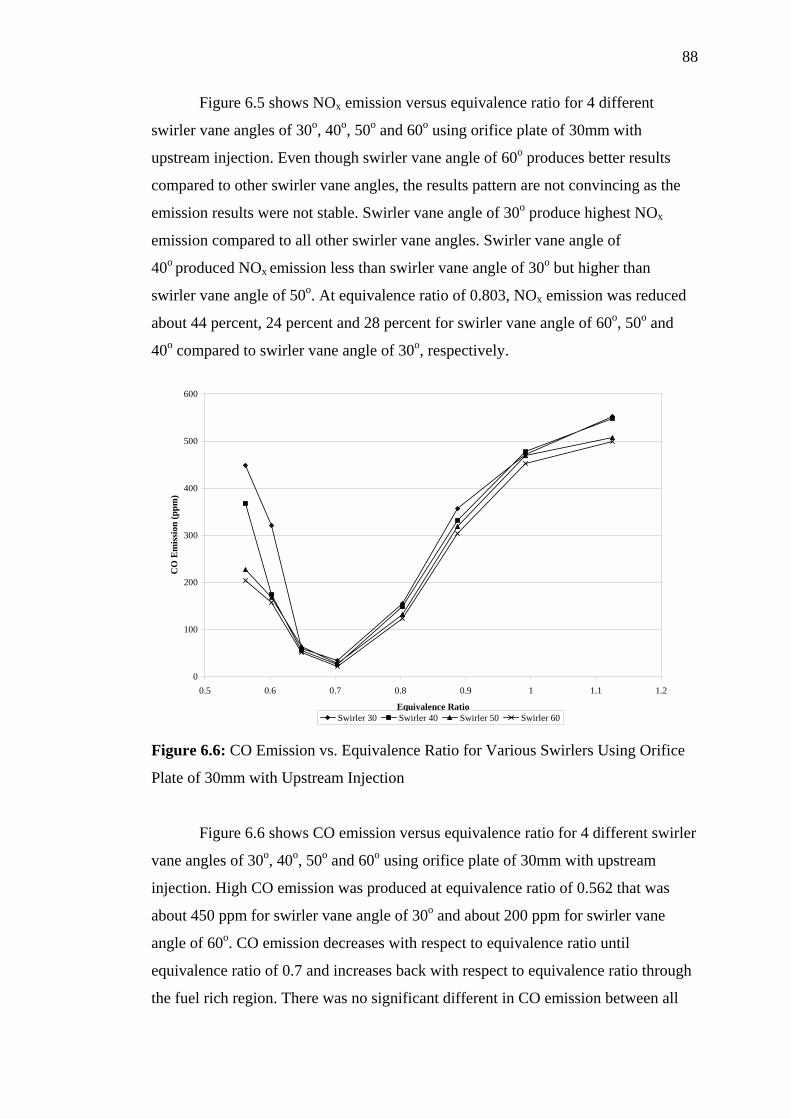
88
Figure 6.5 shows NOx emission versus equivalence ratio for 4 different
swirler vane angles of 30o, 40o, 50o and 60o using orifice plate of 30mm with
upstream injection. Even though swirler vane angle of 60o produces better results
compared to other swirler vane angles, the results pattern are not convincing as the
emission results were not stable. Swirler vane angle of 30o produce highest NOx
emission compared to all other swirler vane angles. Swirler vane angle of
40o produced NOx emission less than swirler vane angle of 30o but higher than
swirler vane angle of 50o. At equivalence ratio of 0.803, NOx emission was reduced
about 44 percent, 24 percent and 28 percent for swirler vane angle of 60o, 50o and
40o compared to swirler vane angle of 30o, respectively.
0
100
200
300
400
500
600
0.5 0.6 0.7 0.8 0.9 1 1.1 1.2
Equivalence Ratio
CO
Em
issi
on (p
pm)
Swirler 30 Swirler 40 Swirler 50 Swirler 60
Figure 6.6: CO Emission vs. Equivalence Ratio for Various Swirlers Using Orifice
Plate of 30mm with Upstream Injection
Figure 6.6 shows CO emission versus equivalence ratio for 4 different swirler
vane angles of 30o, 40o, 50o and 60o using orifice plate of 30mm with upstream
injection. High CO emission was produced at equivalence ratio of 0.562 that was
about 450 ppm for swirler vane angle of 30o and about 200 ppm for swirler vane
angle of 60o. CO emission decreases with respect to equivalence ratio until
equivalence ratio of 0.7 and increases back with respect to equivalence ratio through
the fuel rich region. There was no significant different in CO emission between all
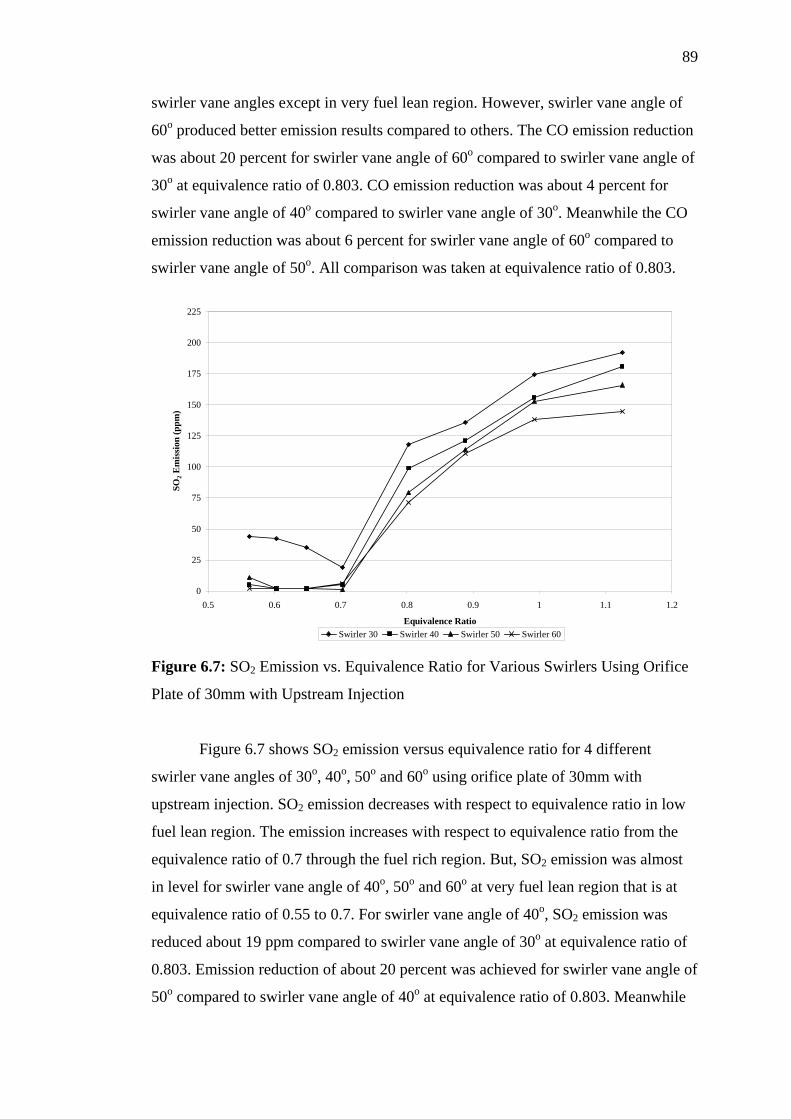
89
swirler vane angles except in very fuel lean region. However, swirler vane angle of
60o produced better emission results compared to others. The CO emission reduction
was about 20 percent for swirler vane angle of 60o compared to swirler vane angle of
30o at equivalence ratio of 0.803. CO emission reduction was about 4 percent for
swirler vane angle of 40o compared to swirler vane angle of 30o. Meanwhile the CO
emission reduction was about 6 percent for swirler vane angle of 60o compared to
swirler vane angle of 50o. All comparison was taken at equivalence ratio of 0.803.
0
25
50
75
100
125
150
175
200
225
0.5 0.6 0.7 0.8 0.9 1 1.1 1.2
Equivalence Ratio
SO2 E
mis
sion
(ppm
)
Swirler 30 Swirler 40 Swirler 50 Swirler 60 Figure 6.7: SO2 Emission vs. Equivalence Ratio for Various Swirlers Using Orifice
Plate of 30mm with Upstream Injection
Figure 6.7 shows SO2 emission versus equivalence ratio for 4 different
swirler vane angles of 30o, 40o, 50o and 60o using orifice plate of 30mm with
upstream injection. SO2 emission decreases with respect to equivalence ratio in low
fuel lean region. The emission increases with respect to equivalence ratio from the
equivalence ratio of 0.7 through the fuel rich region. But, SO2 emission was almost
in level for swirler vane angle of 40o, 50o and 60o at very fuel lean region that is at
equivalence ratio of 0.55 to 0.7. For swirler vane angle of 40o, SO2 emission was
reduced about 19 ppm compared to swirler vane angle of 30o at equivalence ratio of
0.803. Emission reduction of about 20 percent was achieved for swirler vane angle of
50o compared to swirler vane angle of 40o at equivalence ratio of 0.803. Meanwhile
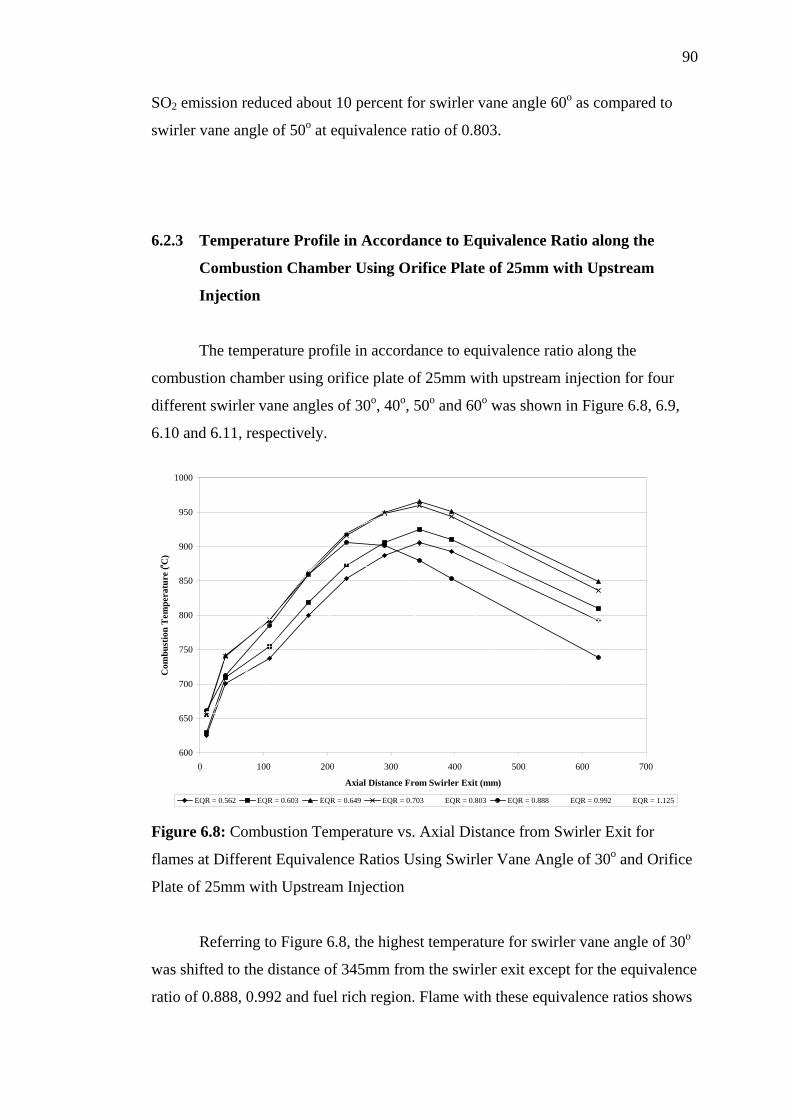
90
SO2 emission reduced about 10 percent for swirler vane angle 60o as compared to
swirler vane angle of 50o at equivalence ratio of 0.803.
6.2.3 Temperature Profile in Accordance to Equivalence Ratio along the
Combustion Chamber Using Orifice Plate of 25mm with Upstream
Injection
The temperature profile in accordance to equivalence ratio along the
combustion chamber using orifice plate of 25mm with upstream injection for four
different swirler vane angles of 30o, 40o, 50o and 60o was shown in Figure 6.8, 6.9,
6.10 and 6.11, respectively.
600
650
700
750
800
850
900
950
1000
0 100 200 300 400 500 600 700
Axial Distance From Swirler Exit (mm)
Com
bust
ion
Tem
pera
ture
(o C)
EQR = 0.562 EQR = 0.603 EQR = 0.649 EQR = 0.703 EQR = 0.803 EQR = 0.888 EQR = 0.992 EQR = 1.125 Figure 6.8: Combustion Temperature vs. Axial Distance from Swirler Exit for
flames at Different Equivalence Ratios Using Swirler Vane Angle of 30o and Orifice
Plate of 25mm with Upstream Injection
Referring to Figure 6.8, the highest temperature for swirler vane angle of 30o
was shifted to the distance of 345mm from the swirler exit except for the equivalence
ratio of 0.888, 0.992 and fuel rich region. Flame with these equivalence ratios shows
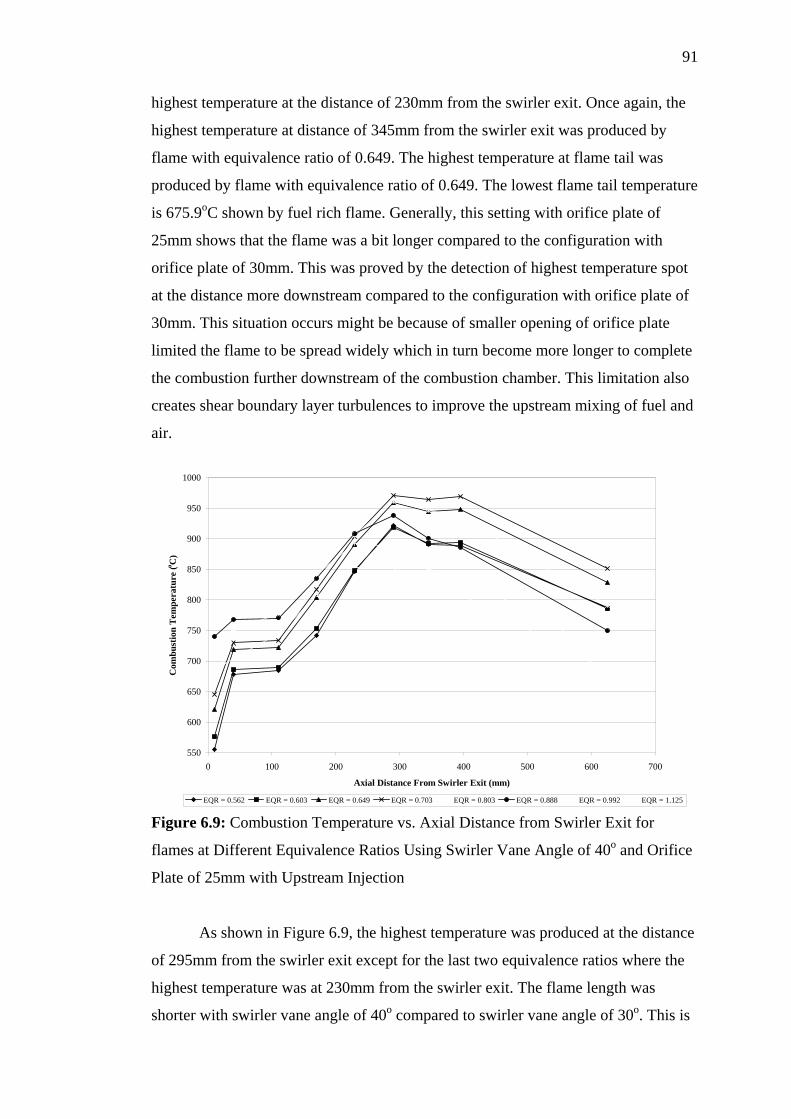
91
highest temperature at the distance of 230mm from the swirler exit. Once again, the
highest temperature at distance of 345mm from the swirler exit was produced by
flame with equivalence ratio of 0.649. The highest temperature at flame tail was
produced by flame with equivalence ratio of 0.649. The lowest flame tail temperature
is 675.9oC shown by fuel rich flame. Generally, this setting with orifice plate of
25mm shows that the flame was a bit longer compared to the configuration with
orifice plate of 30mm. This was proved by the detection of highest temperature spot
at the distance more downstream compared to the configuration with orifice plate of
30mm. This situation occurs might be because of smaller opening of orifice plate
limited the flame to be spread widely which in turn become more longer to complete
the combustion further downstream of the combustion chamber. This limitation also
creates shear boundary layer turbulences to improve the upstream mixing of fuel and
air.
550
600
650
700
750
800
850
900
950
1000
0 100 200 300 400 500 600 700
Axial Distance From Swirler Exit (mm)
Com
bust
ion
Tem
pera
ture
(o C)
EQR = 0.562 EQR = 0.603 EQR = 0.649 EQR = 0.703 EQR = 0.803 EQR = 0.888 EQR = 0.992 EQR = 1.125 Figure 6.9: Combustion Temperature vs. Axial Distance from Swirler Exit for
flames at Different Equivalence Ratios Using Swirler Vane Angle of 40o and Orifice
Plate of 25mm with Upstream Injection
As shown in Figure 6.9, the highest temperature was produced at the distance
of 295mm from the swirler exit except for the last two equivalence ratios where the
highest temperature was at 230mm from the swirler exit. The flame length was
shorter with swirler vane angle of 40o compared to swirler vane angle of 30o. This is
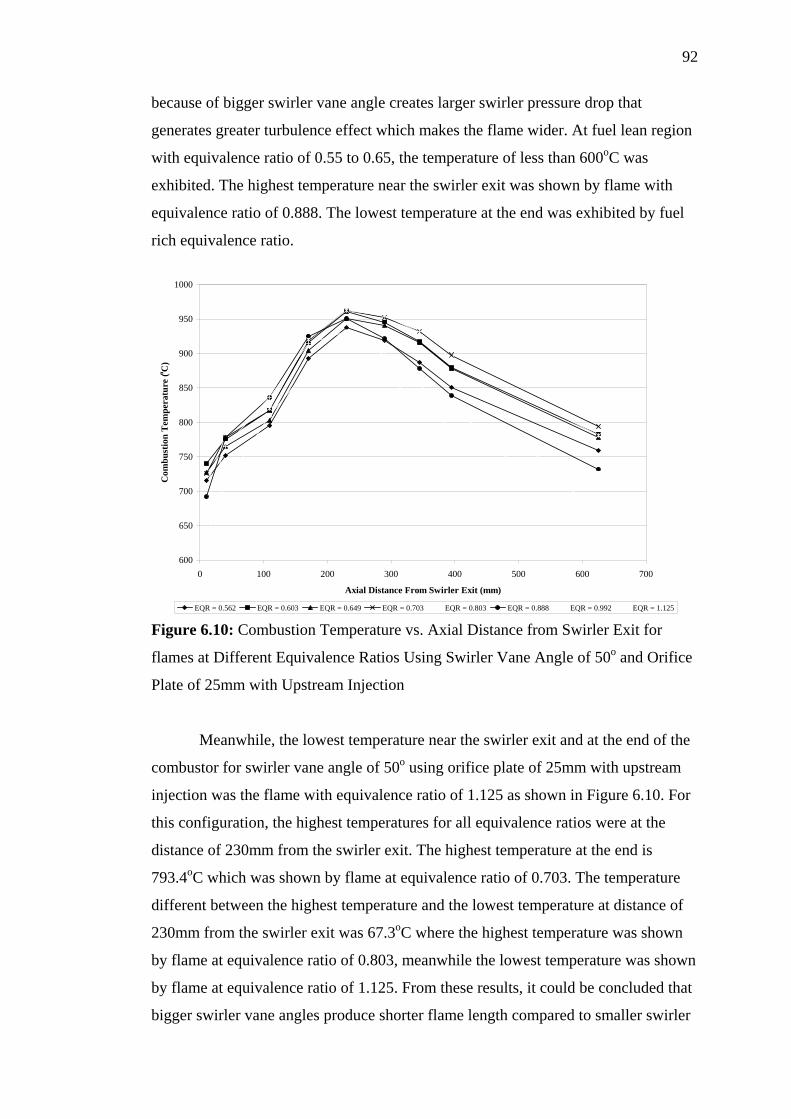
92
because of bigger swirler vane angle creates larger swirler pressure drop that
generates greater turbulence effect which makes the flame wider. At fuel lean region
with equivalence ratio of 0.55 to 0.65, the temperature of less than 600oC was
exhibited. The highest temperature near the swirler exit was shown by flame with
equivalence ratio of 0.888. The lowest temperature at the end was exhibited by fuel
rich equivalence ratio.
600
650
700
750
800
850
900
950
1000
0 100 200 300 400 500 600 700
Axial Distance From Swirler Exit (mm)
Com
bust
ion
Tem
pera
ture
(o C)
EQR = 0.562 EQR = 0.603 EQR = 0.649 EQR = 0.703 EQR = 0.803 EQR = 0.888 EQR = 0.992 EQR = 1.125 Figure 6.10: Combustion Temperature vs. Axial Distance from Swirler Exit for
flames at Different Equivalence Ratios Using Swirler Vane Angle of 50o and Orifice
Plate of 25mm with Upstream Injection
Meanwhile, the lowest temperature near the swirler exit and at the end of the
combustor for swirler vane angle of 50o using orifice plate of 25mm with upstream
injection was the flame with equivalence ratio of 1.125 as shown in Figure 6.10. For
this configuration, the highest temperatures for all equivalence ratios were at the
distance of 230mm from the swirler exit. The highest temperature at the end is
793.4oC which was shown by flame at equivalence ratio of 0.703. The temperature
different between the highest temperature and the lowest temperature at distance of
230mm from the swirler exit was 67.3oC where the highest temperature was shown
by flame at equivalence ratio of 0.803, meanwhile the lowest temperature was shown
by flame at equivalence ratio of 1.125. From these results, it could be concluded that
bigger swirler vane angles produce shorter flame length compared to smaller swirler
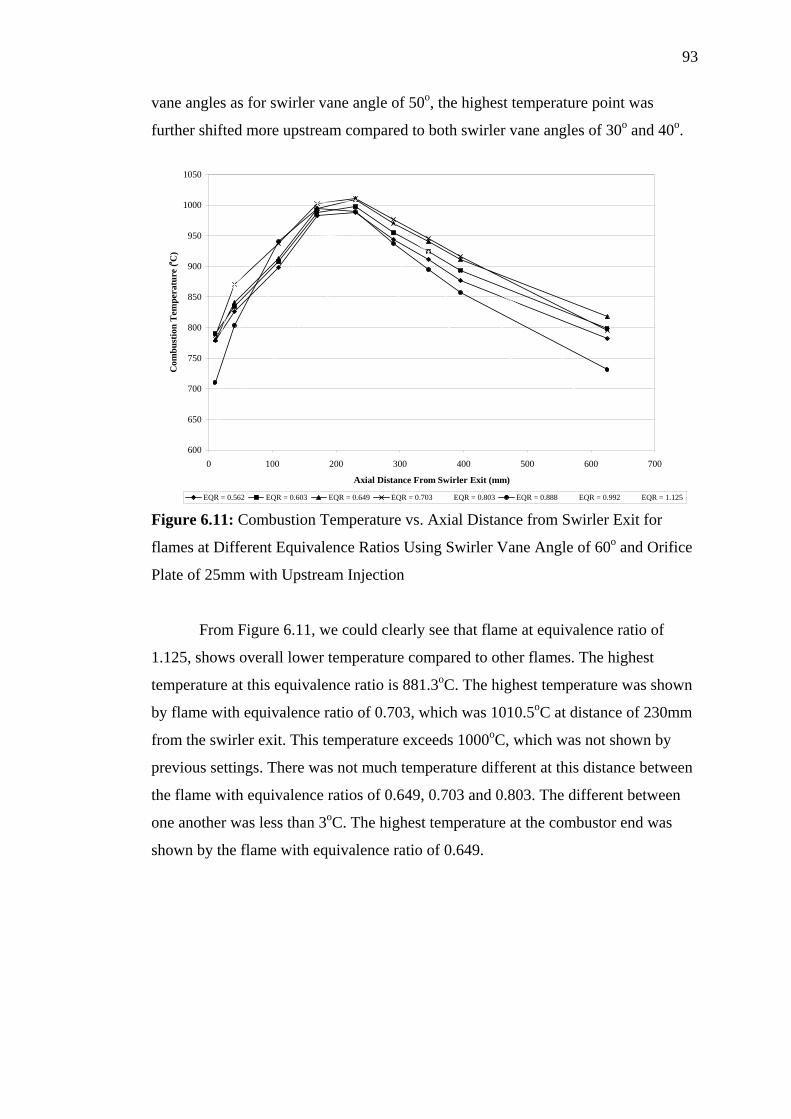
93
vane angles as for swirler vane angle of 50o, the highest temperature point was
further shifted more upstream compared to both swirler vane angles of 30o and 40o.
600
650
700
750
800
850
900
950
1000
1050
0 100 200 300 400 500 600 700
Axial Distance From Swirler Exit (mm)
Com
bust
ion
Tem
pera
ture
(o C)
EQR = 0.562 EQR = 0.603 EQR = 0.649 EQR = 0.703 EQR = 0.803 EQR = 0.888 EQR = 0.992 EQR = 1.125 Figure 6.11: Combustion Temperature vs. Axial Distance from Swirler Exit for
flames at Different Equivalence Ratios Using Swirler Vane Angle of 60o and Orifice
Plate of 25mm with Upstream Injection
From Figure 6.11, we could clearly see that flame at equivalence ratio of
1.125, shows overall lower temperature compared to other flames. The highest
temperature at this equivalence ratio is 881.3oC. The highest temperature was shown
by flame with equivalence ratio of 0.703, which was 1010.5oC at distance of 230mm
from the swirler exit. This temperature exceeds 1000oC, which was not shown by
previous settings. There was not much temperature different at this distance between
the flame with equivalence ratios of 0.649, 0.703 and 0.803. The different between
one another was less than 3oC. The highest temperature at the combustor end was
shown by the flame with equivalence ratio of 0.649.
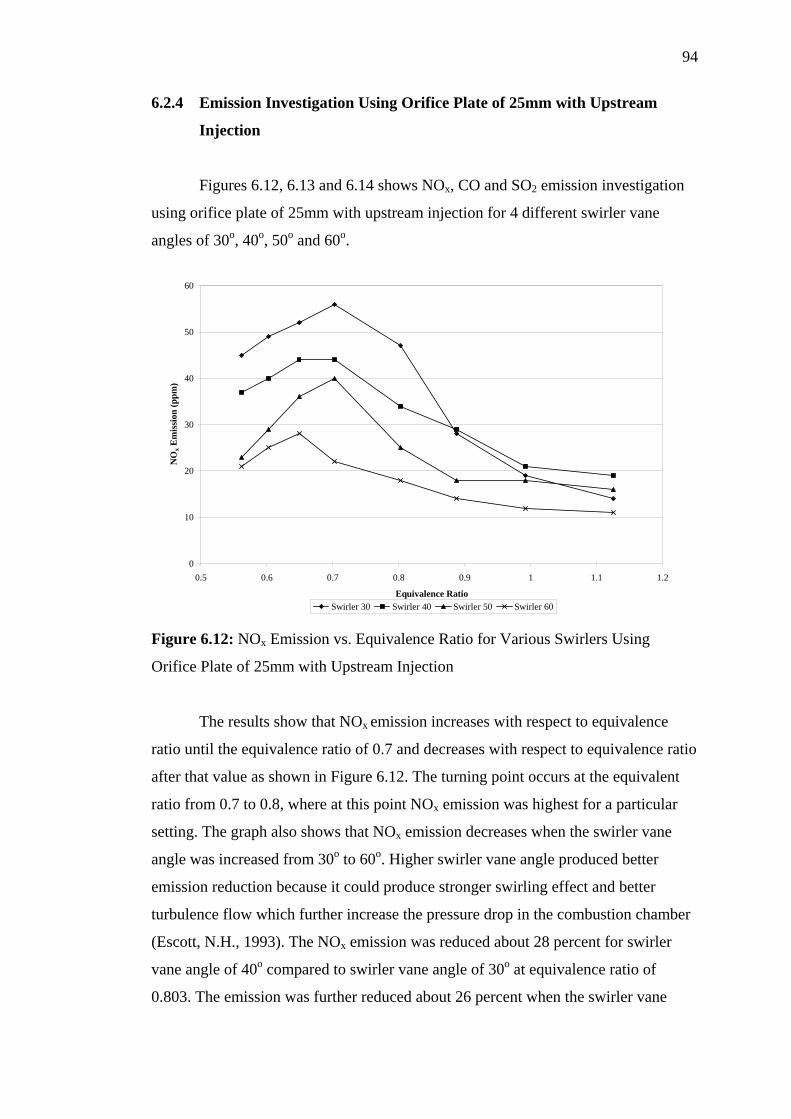
94
6.2.4 Emission Investigation Using Orifice Plate of 25mm with Upstream
Injection
Figures 6.12, 6.13 and 6.14 shows NOx, CO and SO2 emission investigation
using orifice plate of 25mm with upstream injection for 4 different swirler vane
angles of 30o, 40o, 50o and 60o.
0
10
20
30
40
50
60
0.5 0.6 0.7 0.8 0.9 1 1.1 1.2
Equivalence Ratio
NO
x Em
issi
on (p
pm)
Swirler 30 Swirler 40 Swirler 50 Swirler 60 Figure 6.12: NOx Emission vs. Equivalence Ratio for Various Swirlers Using
Orifice Plate of 25mm with Upstream Injection
The results show that NOx emission increases with respect to equivalence
ratio until the equivalence ratio of 0.7 and decreases with respect to equivalence ratio
after that value as shown in Figure 6.12. The turning point occurs at the equivalent
ratio from 0.7 to 0.8, where at this point NOx emission was highest for a particular
setting. The graph also shows that NOx emission decreases when the swirler vane
angle was increased from 30o to 60o. Higher swirler vane angle produced better
emission reduction because it could produce stronger swirling effect and better
turbulence flow which further increase the pressure drop in the combustion chamber
(Escott, N.H., 1993). The NOx emission was reduced about 28 percent for swirler
vane angle of 40o compared to swirler vane angle of 30o at equivalence ratio of
0.803. The emission was further reduced about 26 percent when the swirler vane
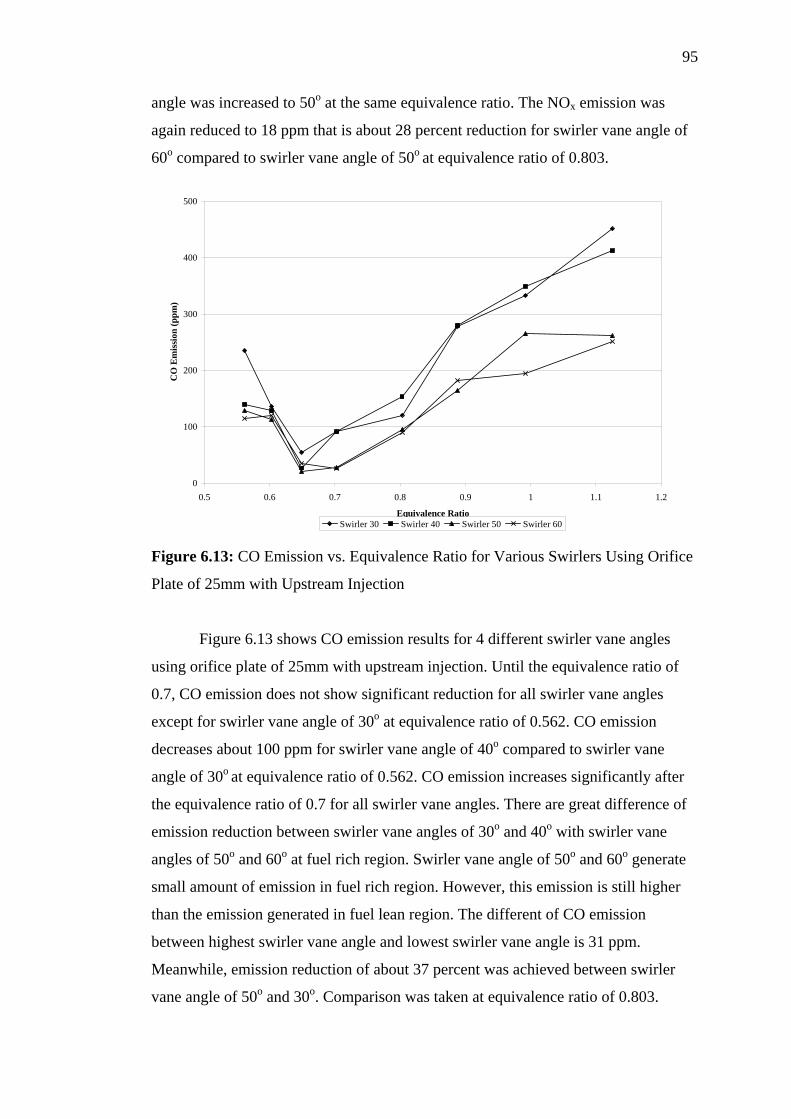
95
angle was increased to 50o at the same equivalence ratio. The NOx emission was
again reduced to 18 ppm that is about 28 percent reduction for swirler vane angle of
60o compared to swirler vane angle of 50o at equivalence ratio of 0.803.
0
100
200
300
400
500
0.5 0.6 0.7 0.8 0.9 1 1.1 1.2
Equivalence Ratio
CO
Em
issi
on (p
pm)
Swirler 30 Swirler 40 Swirler 50 Swirler 60 Figure 6.13: CO Emission vs. Equivalence Ratio for Various Swirlers Using Orifice
Plate of 25mm with Upstream Injection
Figure 6.13 shows CO emission results for 4 different swirler vane angles
using orifice plate of 25mm with upstream injection. Until the equivalence ratio of
0.7, CO emission does not show significant reduction for all swirler vane angles
except for swirler vane angle of 30o at equivalence ratio of 0.562. CO emission
decreases about 100 ppm for swirler vane angle of 40o compared to swirler vane
angle of 30o at equivalence ratio of 0.562. CO emission increases significantly after
the equivalence ratio of 0.7 for all swirler vane angles. There are great difference of
emission reduction between swirler vane angles of 30o and 40o with swirler vane
angles of 50o and 60o at fuel rich region. Swirler vane angle of 50o and 60o generate
small amount of emission in fuel rich region. However, this emission is still higher
than the emission generated in fuel lean region. The different of CO emission
between highest swirler vane angle and lowest swirler vane angle is 31 ppm.
Meanwhile, emission reduction of about 37 percent was achieved between swirler
vane angle of 50o and 30o. Comparison was taken at equivalence ratio of 0.803.
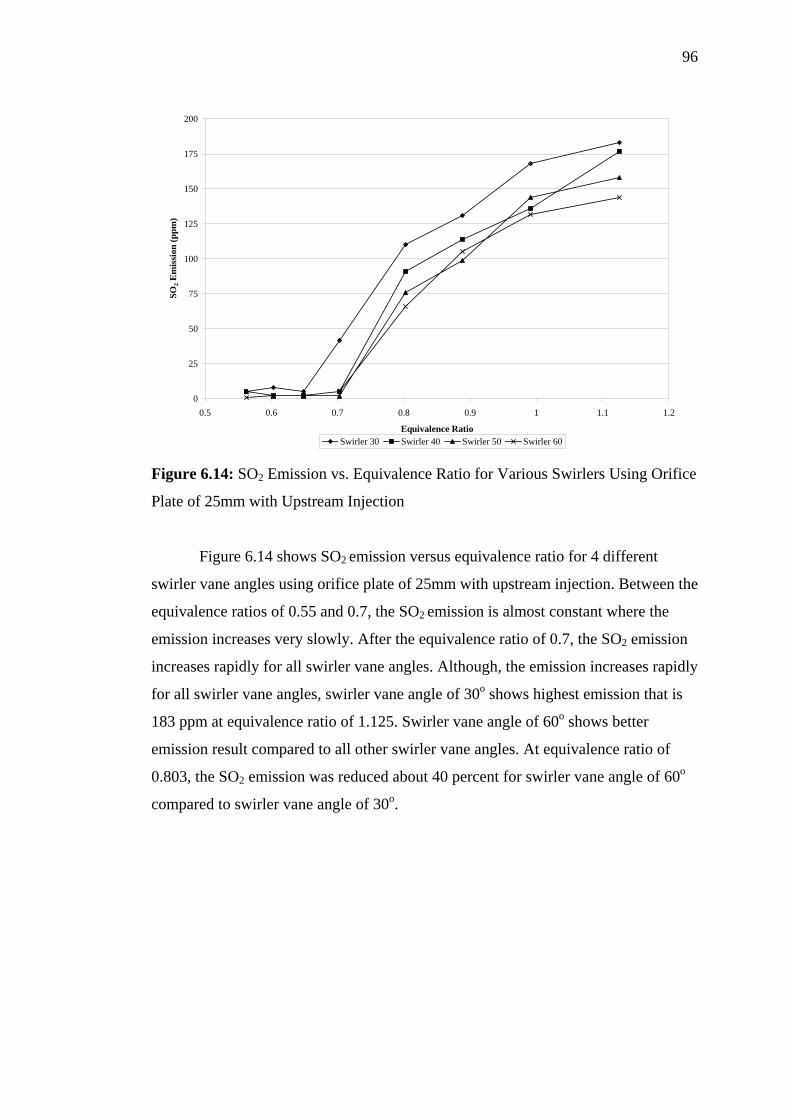
96
0
25
50
75
100
125
150
175
200
0.5 0.6 0.7 0.8 0.9 1 1.1 1.2
Equivalence Ratio
SO2 E
mis
sion
(ppm
)
Swirler 30 Swirler 40 Swirler 50 Swirler 60 Figure 6.14: SO2 Emission vs. Equivalence Ratio for Various Swirlers Using Orifice
Plate of 25mm with Upstream Injection
Figure 6.14 shows SO2 emission versus equivalence ratio for 4 different
swirler vane angles using orifice plate of 25mm with upstream injection. Between the
equivalence ratios of 0.55 and 0.7, the SO2 emission is almost constant where the
emission increases very slowly. After the equivalence ratio of 0.7, the SO2 emission
increases rapidly for all swirler vane angles. Although, the emission increases rapidly
for all swirler vane angles, swirler vane angle of 30o shows highest emission that is
183 ppm at equivalence ratio of 1.125. Swirler vane angle of 60o shows better
emission result compared to all other swirler vane angles. At equivalence ratio of
0.803, the SO2 emission was reduced about 40 percent for swirler vane angle of 60o
compared to swirler vane angle of 30o.
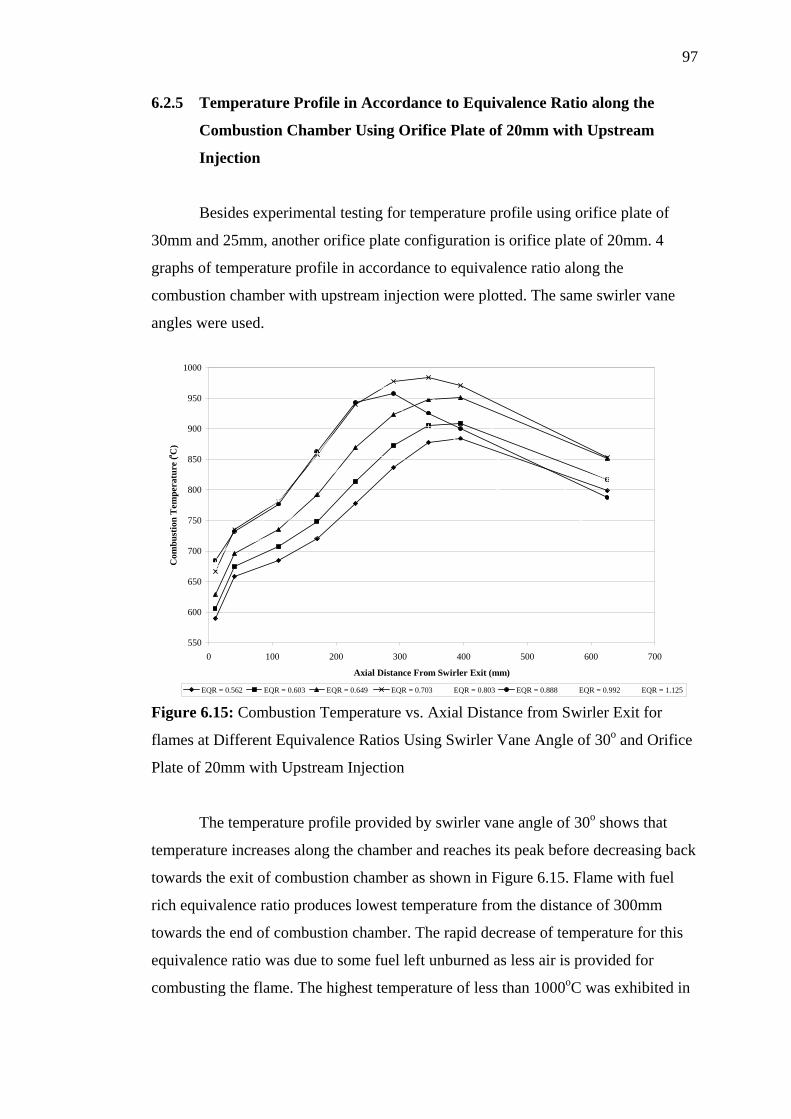
97
6.2.5 Temperature Profile in Accordance to Equivalence Ratio along the
Combustion Chamber Using Orifice Plate of 20mm with Upstream
Injection
Besides experimental testing for temperature profile using orifice plate of
30mm and 25mm, another orifice plate configuration is orifice plate of 20mm. 4
graphs of temperature profile in accordance to equivalence ratio along the
combustion chamber with upstream injection were plotted. The same swirler vane
angles were used.
550
600
650
700
750
800
850
900
950
1000
0 100 200 300 400 500 600 700
Axial Distance From Swirler Exit (mm)
Com
bust
ion
Tem
pera
ture
(o C)
EQR = 0.562 EQR = 0.603 EQR = 0.649 EQR = 0.703 EQR = 0.803 EQR = 0.888 EQR = 0.992 EQR = 1.125 Figure 6.15: Combustion Temperature vs. Axial Distance from Swirler Exit for
flames at Different Equivalence Ratios Using Swirler Vane Angle of 30o and Orifice
Plate of 20mm with Upstream Injection
The temperature profile provided by swirler vane angle of 30o shows that
temperature increases along the chamber and reaches its peak before decreasing back
towards the exit of combustion chamber as shown in Figure 6.15. Flame with fuel
rich equivalence ratio produces lowest temperature from the distance of 300mm
towards the end of combustion chamber. The rapid decrease of temperature for this
equivalence ratio was due to some fuel left unburned as less air is provided for
combusting the flame. The highest temperature of less than 1000oC was exhibited in
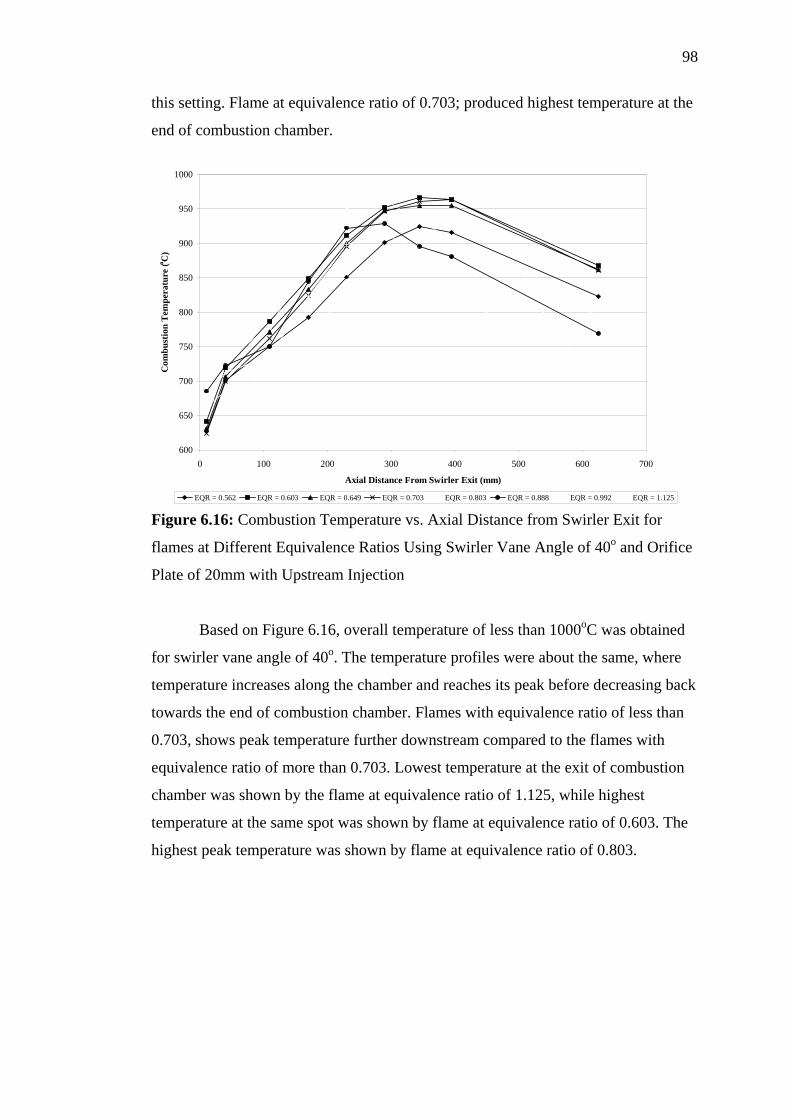
98
this setting. Flame at equivalence ratio of 0.703; produced highest temperature at the
end of combustion chamber.
600
650
700
750
800
850
900
950
1000
0 100 200 300 400 500 600 700
Axial Distance From Swirler Exit (mm)
Com
bust
ion
Tem
pera
ture
(o C)
EQR = 0.562 EQR = 0.603 EQR = 0.649 EQR = 0.703 EQR = 0.803 EQR = 0.888 EQR = 0.992 EQR = 1.125 Figure 6.16: Combustion Temperature vs. Axial Distance from Swirler Exit for
flames at Different Equivalence Ratios Using Swirler Vane Angle of 40o and Orifice
Plate of 20mm with Upstream Injection
Based on Figure 6.16, overall temperature of less than 1000oC was obtained
for swirler vane angle of 40o. The temperature profiles were about the same, where
temperature increases along the chamber and reaches its peak before decreasing back
towards the end of combustion chamber. Flames with equivalence ratio of less than
0.703, shows peak temperature further downstream compared to the flames with
equivalence ratio of more than 0.703. Lowest temperature at the exit of combustion
chamber was shown by the flame at equivalence ratio of 1.125, while highest
temperature at the same spot was shown by flame at equivalence ratio of 0.603. The
highest peak temperature was shown by flame at equivalence ratio of 0.803.
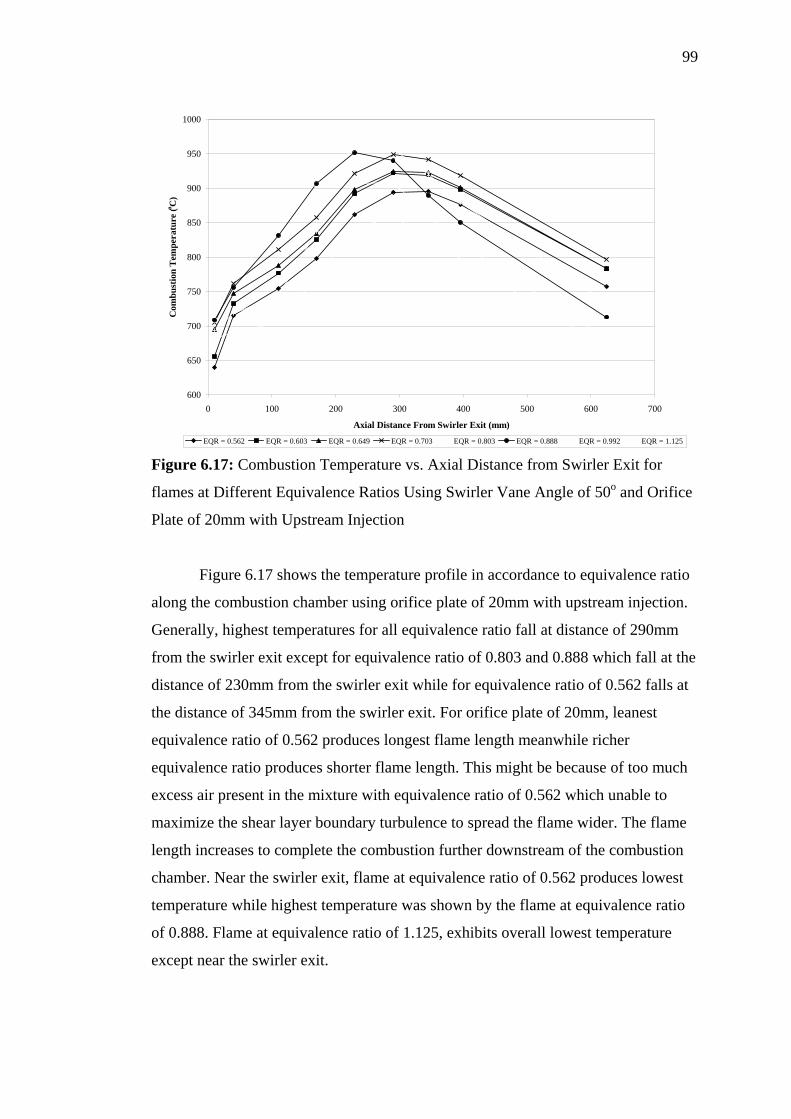
99
600
650
700
750
800
850
900
950
1000
0 100 200 300 400 500 600 700
Axial Distance From Swirler Exit (mm)
Com
bust
ion
Tem
pera
ture
(o C)
EQR = 0.562 EQR = 0.603 EQR = 0.649 EQR = 0.703 EQR = 0.803 EQR = 0.888 EQR = 0.992 EQR = 1.125
Figure 6.17: Combustion Temperature vs. Axial Distance from Swirler Exit for
flames at Different Equivalence Ratios Using Swirler Vane Angle of 50o and Orifice
Plate of 20mm with Upstream Injection
Figure 6.17 shows the temperature profile in accordance to equivalence ratio
along the combustion chamber using orifice plate of 20mm with upstream injection.
Generally, highest temperatures for all equivalence ratio fall at distance of 290mm
from the swirler exit except for equivalence ratio of 0.803 and 0.888 which fall at the
distance of 230mm from the swirler exit while for equivalence ratio of 0.562 falls at
the distance of 345mm from the swirler exit. For orifice plate of 20mm, leanest
equivalence ratio of 0.562 produces longest flame length meanwhile richer
equivalence ratio produces shorter flame length. This might be because of too much
excess air present in the mixture with equivalence ratio of 0.562 which unable to
maximize the shear layer boundary turbulence to spread the flame wider. The flame
length increases to complete the combustion further downstream of the combustion
chamber. Near the swirler exit, flame at equivalence ratio of 0.562 produces lowest
temperature while highest temperature was shown by the flame at equivalence ratio
of 0.888. Flame at equivalence ratio of 1.125, exhibits overall lowest temperature
except near the swirler exit.
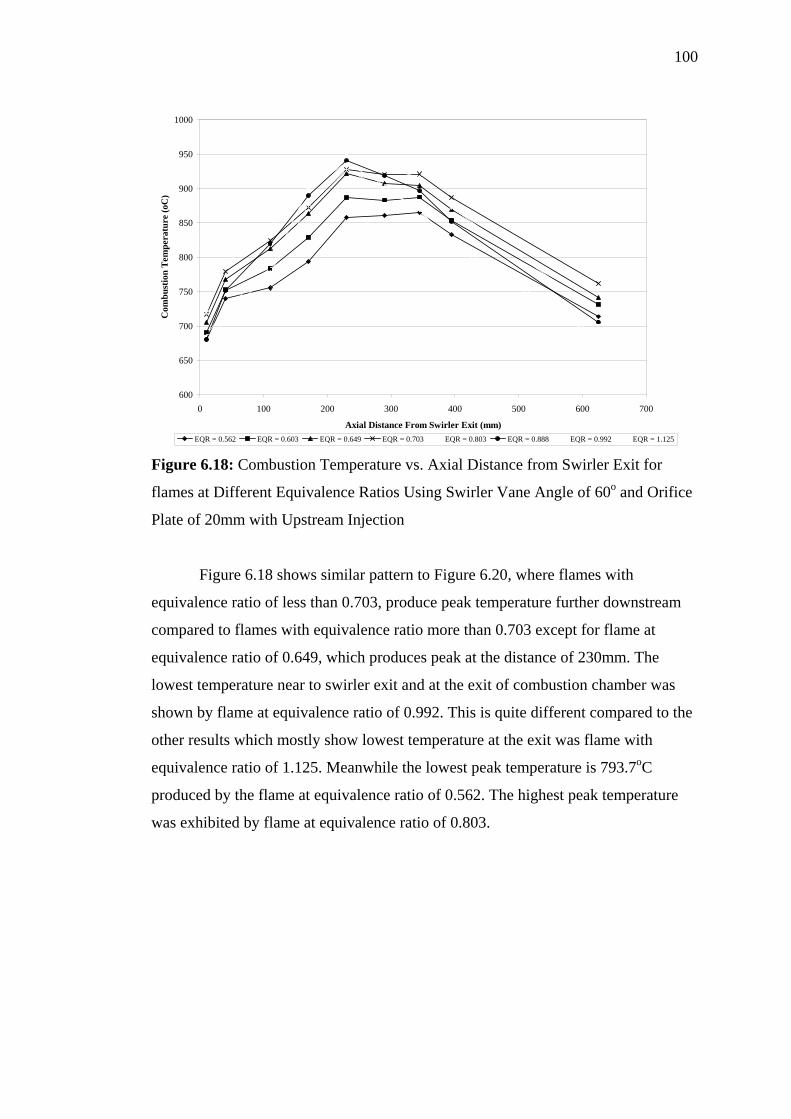
100
600
650
700
750
800
850
900
950
1000
0 100 200 300 400 500 600 700
Axial Distance From Swirler Exit (mm)
Com
bust
ion
Tem
pera
ture
(oC
)
EQR = 0.562 EQR = 0.603 EQR = 0.649 EQR = 0.703 EQR = 0.803 EQR = 0.888 EQR = 0.992 EQR = 1.125
Figure 6.18: Combustion Temperature vs. Axial Distance from Swirler Exit for
flames at Different Equivalence Ratios Using Swirler Vane Angle of 60o and Orifice
Plate of 20mm with Upstream Injection
Figure 6.18 shows similar pattern to Figure 6.20, where flames with
equivalence ratio of less than 0.703, produce peak temperature further downstream
compared to flames with equivalence ratio more than 0.703 except for flame at
equivalence ratio of 0.649, which produces peak at the distance of 230mm. The
lowest temperature near to swirler exit and at the exit of combustion chamber was
shown by flame at equivalence ratio of 0.992. This is quite different compared to the
other results which mostly show lowest temperature at the exit was flame with
equivalence ratio of 1.125. Meanwhile the lowest peak temperature is 793.7oC
produced by the flame at equivalence ratio of 0.562. The highest peak temperature
was exhibited by flame at equivalence ratio of 0.803.
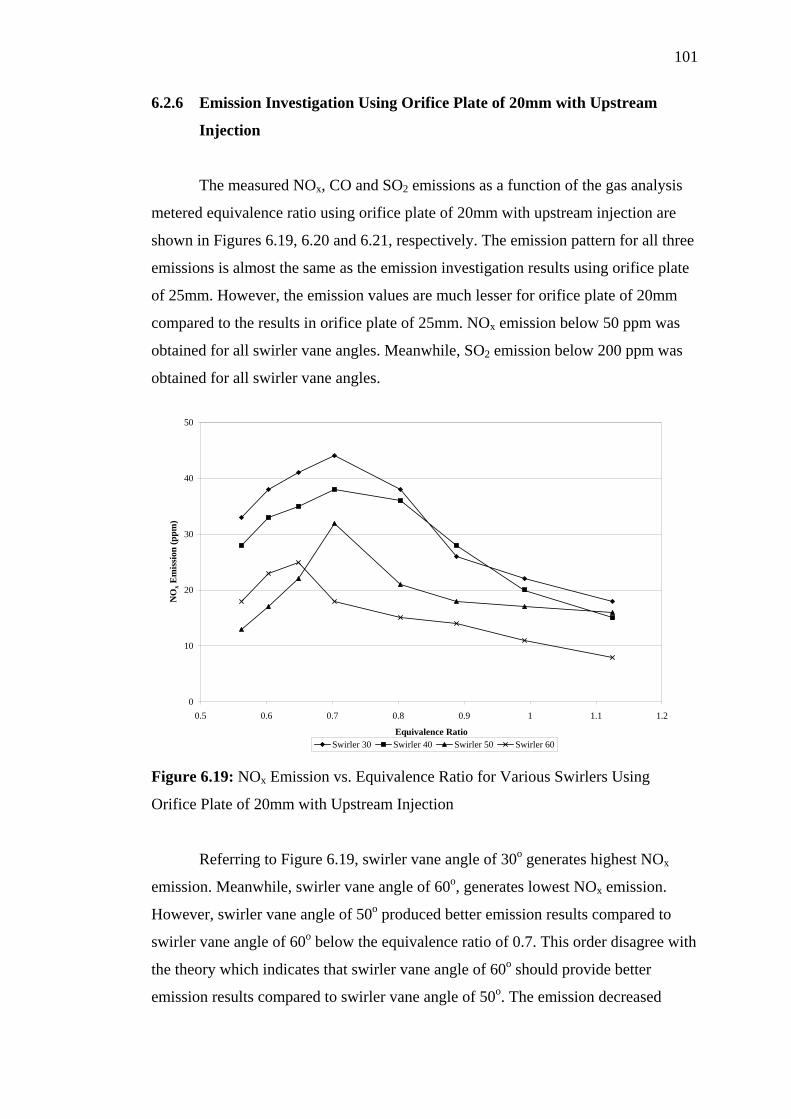
101
6.2.6 Emission Investigation Using Orifice Plate of 20mm with Upstream
Injection
The measured NOx, CO and SO2 emissions as a function of the gas analysis
metered equivalence ratio using orifice plate of 20mm with upstream injection are
shown in Figures 6.19, 6.20 and 6.21, respectively. The emission pattern for all three
emissions is almost the same as the emission investigation results using orifice plate
of 25mm. However, the emission values are much lesser for orifice plate of 20mm
compared to the results in orifice plate of 25mm. NOx emission below 50 ppm was
obtained for all swirler vane angles. Meanwhile, SO2 emission below 200 ppm was
obtained for all swirler vane angles.
0
10
20
30
40
50
0.5 0.6 0.7 0.8 0.9 1 1.1 1.2
Equivalence Ratio
NO
x Em
issi
on (p
pm)
Swirler 30 Swirler 40 Swirler 50 Swirler 60 Figure 6.19: NOx Emission vs. Equivalence Ratio for Various Swirlers Using
Orifice Plate of 20mm with Upstream Injection
Referring to Figure 6.19, swirler vane angle of 30o generates highest NOx
emission. Meanwhile, swirler vane angle of 60o, generates lowest NOx emission.
However, swirler vane angle of 50o produced better emission results compared to
swirler vane angle of 60o below the equivalence ratio of 0.7. This order disagree with
the theory which indicates that swirler vane angle of 60o should provide better
emission results compared to swirler vane angle of 50o. The emission decreased
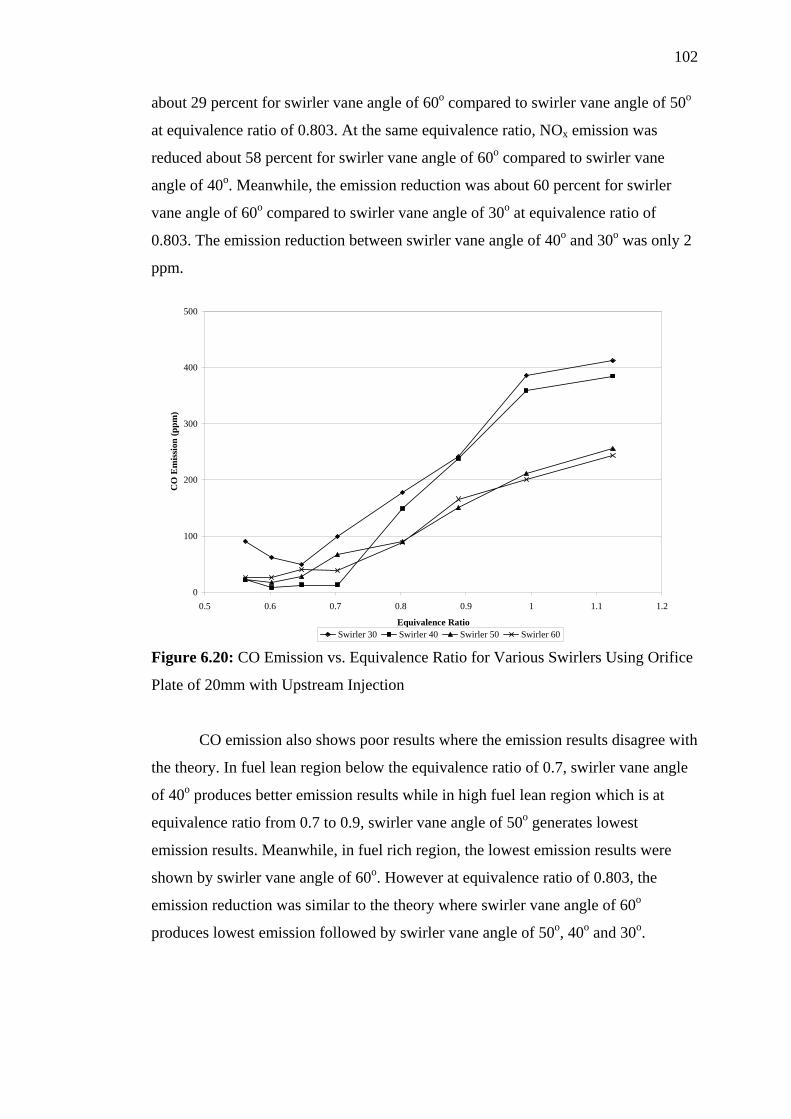
102
about 29 percent for swirler vane angle of 60o compared to swirler vane angle of 50o
at equivalence ratio of 0.803. At the same equivalence ratio, NOx emission was
reduced about 58 percent for swirler vane angle of 60o compared to swirler vane
angle of 40o. Meanwhile, the emission reduction was about 60 percent for swirler
vane angle of 60o compared to swirler vane angle of 30o at equivalence ratio of
0.803. The emission reduction between swirler vane angle of 40o and 30o was only 2
ppm.
0
100
200
300
400
500
0.5 0.6 0.7 0.8 0.9 1 1.1 1.2
Equivalence Ratio
CO
Em
issi
on (p
pm)
Swirler 30 Swirler 40 Swirler 50 Swirler 60 Figure 6.20: CO Emission vs. Equivalence Ratio for Various Swirlers Using Orifice
Plate of 20mm with Upstream Injection
CO emission also shows poor results where the emission results disagree with
the theory. In fuel lean region below the equivalence ratio of 0.7, swirler vane angle
of 40o produces better emission results while in high fuel lean region which is at
equivalence ratio from 0.7 to 0.9, swirler vane angle of 50o generates lowest
emission results. Meanwhile, in fuel rich region, the lowest emission results were
shown by swirler vane angle of 60o. However at equivalence ratio of 0.803, the
emission reduction was similar to the theory where swirler vane angle of 60o
produces lowest emission followed by swirler vane angle of 50o, 40o and 30o.
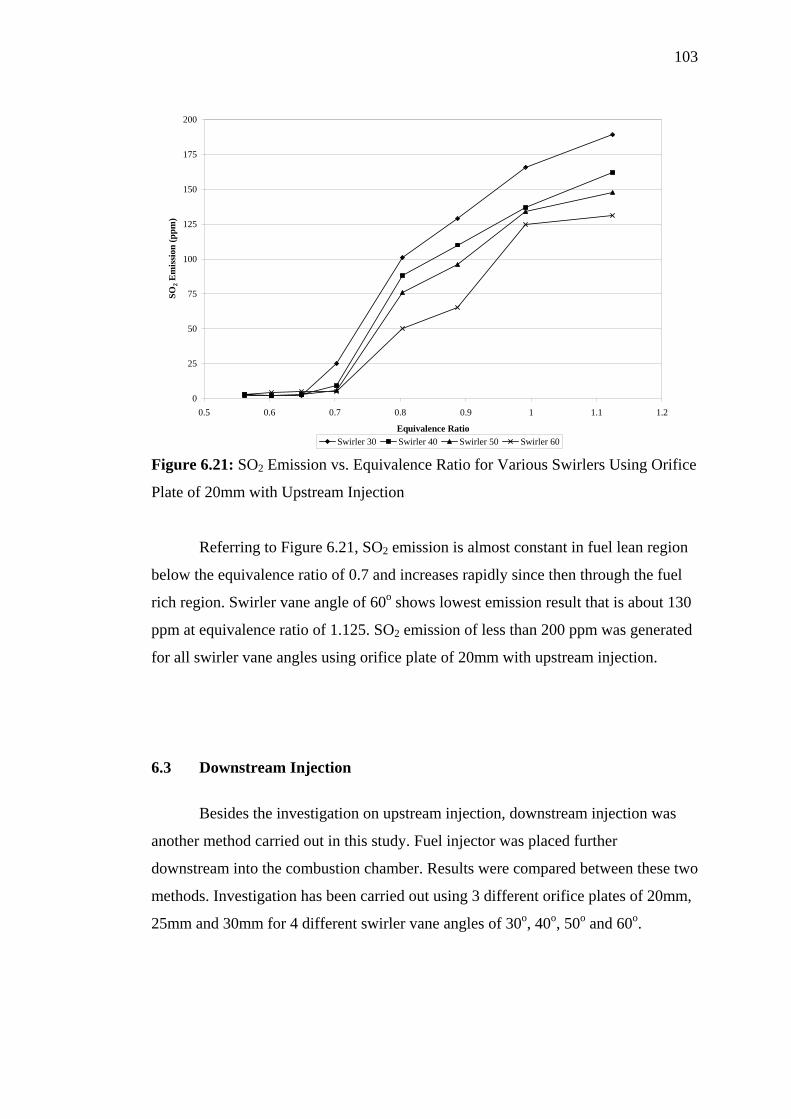
103
0
25
50
75
100
125
150
175
200
0.5 0.6 0.7 0.8 0.9 1 1.1 1.2
Equivalence Ratio
SO2 E
mis
sion
(ppm
)
Swirler 30 Swirler 40 Swirler 50 Swirler 60 Figure 6.21: SO2 Emission vs. Equivalence Ratio for Various Swirlers Using Orifice
Plate of 20mm with Upstream Injection
Referring to Figure 6.21, SO2 emission is almost constant in fuel lean region
below the equivalence ratio of 0.7 and increases rapidly since then through the fuel
rich region. Swirler vane angle of 60o shows lowest emission result that is about 130
ppm at equivalence ratio of 1.125. SO2 emission of less than 200 ppm was generated
for all swirler vane angles using orifice plate of 20mm with upstream injection.
6.3 Downstream Injection
Besides the investigation on upstream injection, downstream injection was
another method carried out in this study. Fuel injector was placed further
downstream into the combustion chamber. Results were compared between these two
methods. Investigation has been carried out using 3 different orifice plates of 20mm,
25mm and 30mm for 4 different swirler vane angles of 30o, 40o, 50o and 60o.
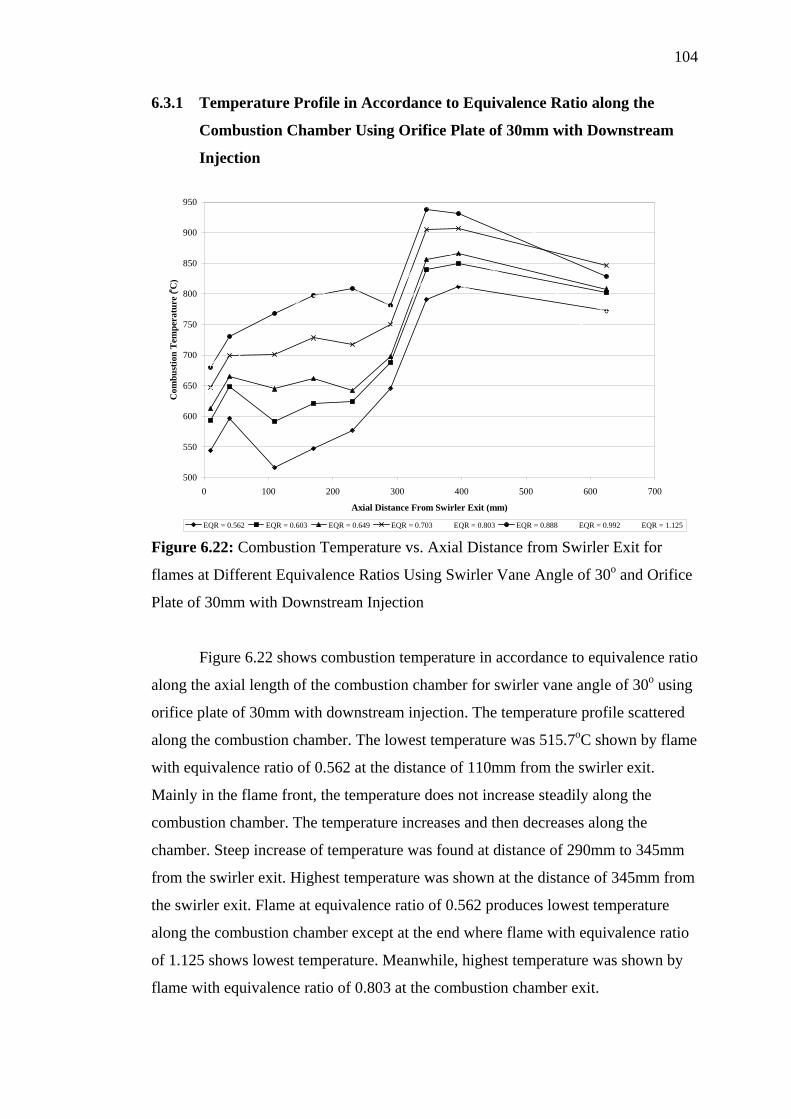
104
6.3.1 Temperature Profile in Accordance to Equivalence Ratio along the
Combustion Chamber Using Orifice Plate of 30mm with Downstream
Injection
500
550
600
650
700
750
800
850
900
950
0 100 200 300 400 500 600 700
Axial Distance From Swirler Exit (mm)
Com
bust
ion
Tem
pera
ture
(o C)
EQR = 0.562 EQR = 0.603 EQR = 0.649 EQR = 0.703 EQR = 0.803 EQR = 0.888 EQR = 0.992 EQR = 1.125 Figure 6.22: Combustion Temperature vs. Axial Distance from Swirler Exit for
flames at Different Equivalence Ratios Using Swirler Vane Angle of 30o and Orifice
Plate of 30mm with Downstream Injection
Figure 6.22 shows combustion temperature in accordance to equivalence ratio
along the axial length of the combustion chamber for swirler vane angle of 30o using
orifice plate of 30mm with downstream injection. The temperature profile scattered
along the combustion chamber. The lowest temperature was 515.7oC shown by flame
with equivalence ratio of 0.562 at the distance of 110mm from the swirler exit.
Mainly in the flame front, the temperature does not increase steadily along the
combustion chamber. The temperature increases and then decreases along the
chamber. Steep increase of temperature was found at distance of 290mm to 345mm
from the swirler exit. Highest temperature was shown at the distance of 345mm from
the swirler exit. Flame at equivalence ratio of 0.562 produces lowest temperature
along the combustion chamber except at the end where flame with equivalence ratio
of 1.125 shows lowest temperature. Meanwhile, highest temperature was shown by
flame with equivalence ratio of 0.803 at the combustion chamber exit.
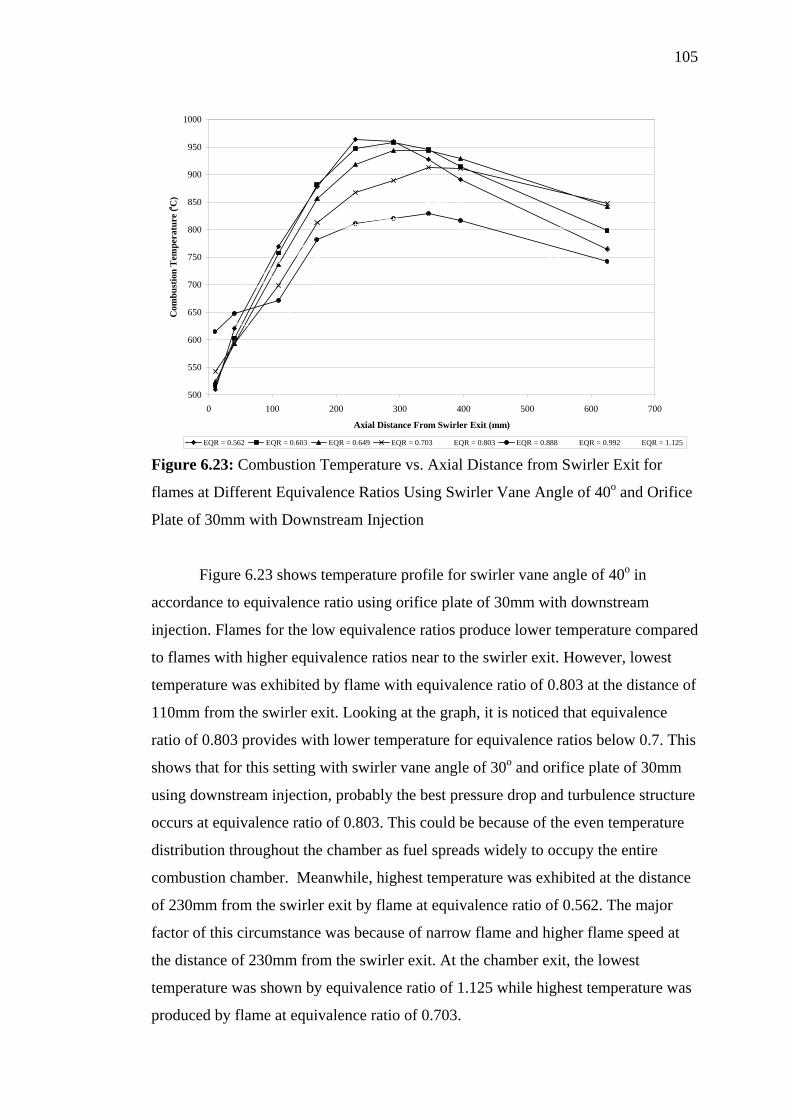
105
500
550
600
650
700
750
800
850
900
950
1000
0 100 200 300 400 500 600 700
Axial Distance From Swirler Exit (mm)
Com
bust
ion
Tem
pera
ture
(o C)
EQR = 0.562 EQR = 0.603 EQR = 0.649 EQR = 0.703 EQR = 0.803 EQR = 0.888 EQR = 0.992 EQR = 1.125 Figure 6.23: Combustion Temperature vs. Axial Distance from Swirler Exit for
flames at Different Equivalence Ratios Using Swirler Vane Angle of 40o and Orifice
Plate of 30mm with Downstream Injection
Figure 6.23 shows temperature profile for swirler vane angle of 40o in
accordance to equivalence ratio using orifice plate of 30mm with downstream
injection. Flames for the low equivalence ratios produce lower temperature compared
to flames with higher equivalence ratios near to the swirler exit. However, lowest
temperature was exhibited by flame with equivalence ratio of 0.803 at the distance of
110mm from the swirler exit. Looking at the graph, it is noticed that equivalence
ratio of 0.803 provides with lower temperature for equivalence ratios below 0.7. This
shows that for this setting with swirler vane angle of 30o and orifice plate of 30mm
using downstream injection, probably the best pressure drop and turbulence structure
occurs at equivalence ratio of 0.803. This could be because of the even temperature
distribution throughout the chamber as fuel spreads widely to occupy the entire
combustion chamber. Meanwhile, highest temperature was exhibited at the distance
of 230mm from the swirler exit by flame at equivalence ratio of 0.562. The major
factor of this circumstance was because of narrow flame and higher flame speed at
the distance of 230mm from the swirler exit. At the chamber exit, the lowest
temperature was shown by equivalence ratio of 1.125 while highest temperature was
produced by flame at equivalence ratio of 0.703.
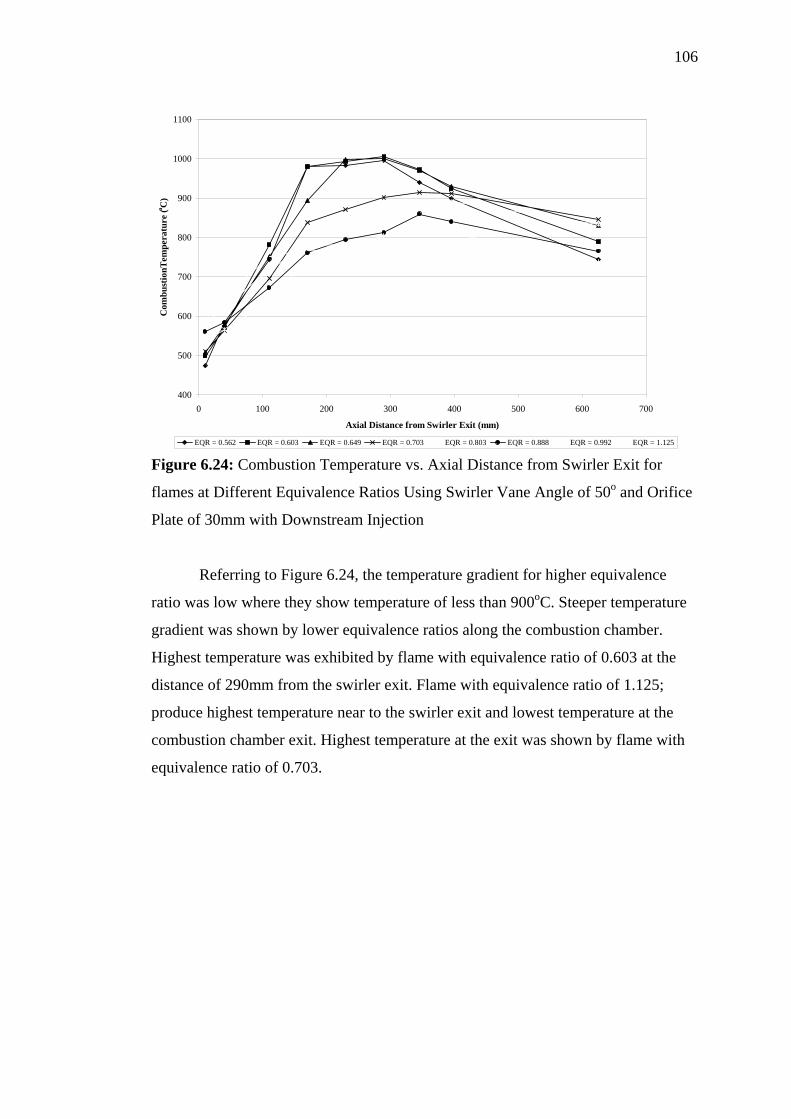
106
400
500
600
700
800
900
1000
1100
0 100 200 300 400 500 600 700
Axial Distance from Swirler Exit (mm)
Com
bust
ionT
empe
ratu
re (o C
)
EQR = 0.562 EQR = 0.603 EQR = 0.649 EQR = 0.703 EQR = 0.803 EQR = 0.888 EQR = 0.992 EQR = 1.125 Figure 6.24: Combustion Temperature vs. Axial Distance from Swirler Exit for
flames at Different Equivalence Ratios Using Swirler Vane Angle of 50o and Orifice
Plate of 30mm with Downstream Injection
Referring to Figure 6.24, the temperature gradient for higher equivalence
ratio was low where they show temperature of less than 900oC. Steeper temperature
gradient was shown by lower equivalence ratios along the combustion chamber.
Highest temperature was exhibited by flame with equivalence ratio of 0.603 at the
distance of 290mm from the swirler exit. Flame with equivalence ratio of 1.125;
produce highest temperature near to the swirler exit and lowest temperature at the
combustion chamber exit. Highest temperature at the exit was shown by flame with
equivalence ratio of 0.703.
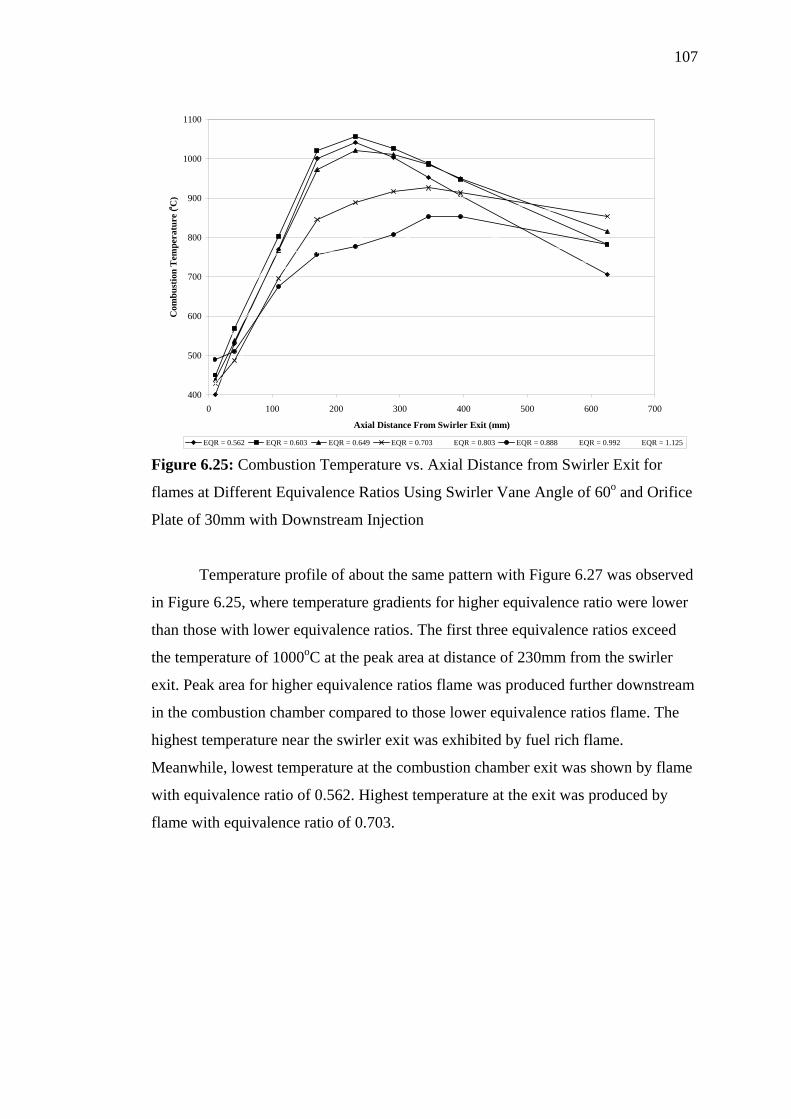
107
400
500
600
700
800
900
1000
1100
0 100 200 300 400 500 600 700
Axial Distance From Swirler Exit (mm)
Com
bust
ion
Tem
pera
ture
(o C)
EQR = 0.562 EQR = 0.603 EQR = 0.649 EQR = 0.703 EQR = 0.803 EQR = 0.888 EQR = 0.992 EQR = 1.125 Figure 6.25: Combustion Temperature vs. Axial Distance from Swirler Exit for
flames at Different Equivalence Ratios Using Swirler Vane Angle of 60o and Orifice
Plate of 30mm with Downstream Injection
Temperature profile of about the same pattern with Figure 6.27 was observed
in Figure 6.25, where temperature gradients for higher equivalence ratio were lower
than those with lower equivalence ratios. The first three equivalence ratios exceed
the temperature of 1000oC at the peak area at distance of 230mm from the swirler
exit. Peak area for higher equivalence ratios flame was produced further downstream
in the combustion chamber compared to those lower equivalence ratios flame. The
highest temperature near the swirler exit was exhibited by fuel rich flame.
Meanwhile, lowest temperature at the combustion chamber exit was shown by flame
with equivalence ratio of 0.562. Highest temperature at the exit was produced by
flame with equivalence ratio of 0.703.
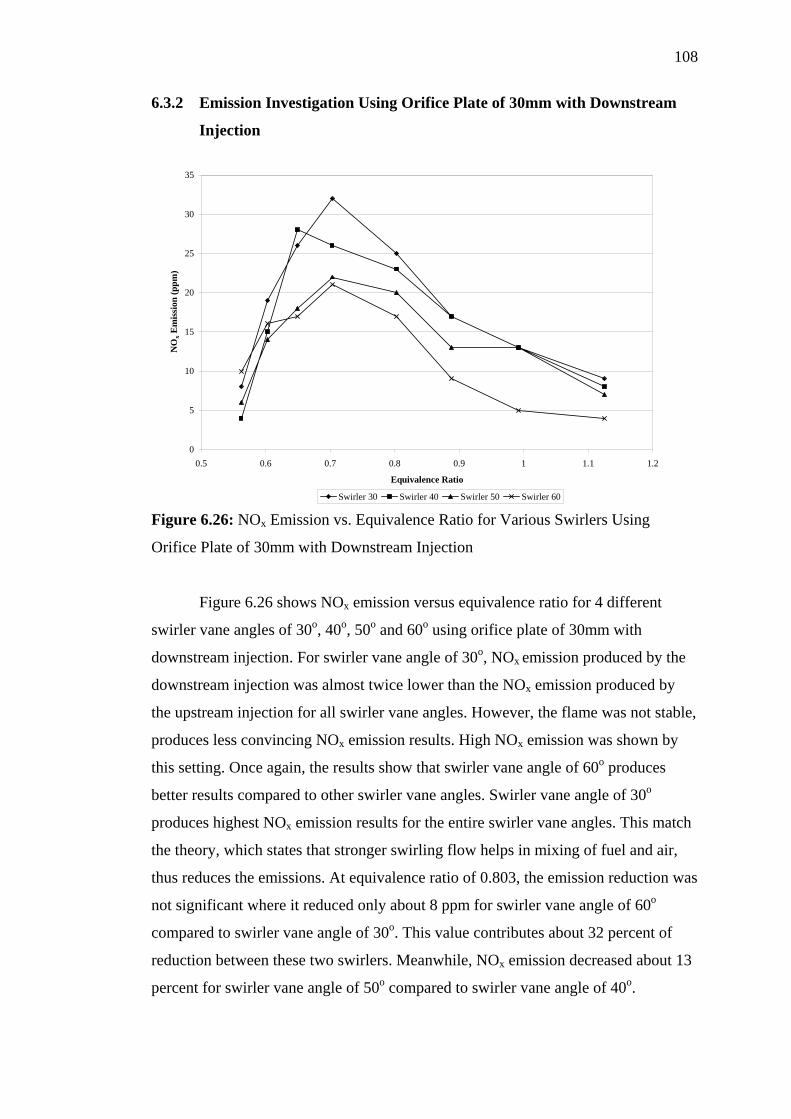
108
6.3.2 Emission Investigation Using Orifice Plate of 30mm with Downstream
Injection
0
5
10
15
20
25
30
35
0.5 0.6 0.7 0.8 0.9 1 1.1 1.2
Equivalence Ratio
NO
x Em
issi
on (p
pm)
Swirler 30 Swirler 40 Swirler 50 Swirler 60 Figure 6.26: NOx Emission vs. Equivalence Ratio for Various Swirlers Using
Orifice Plate of 30mm with Downstream Injection
Figure 6.26 shows NOx emission versus equivalence ratio for 4 different
swirler vane angles of 30o, 40o, 50o and 60o using orifice plate of 30mm with
downstream injection. For swirler vane angle of 30o, NOx emission produced by the
downstream injection was almost twice lower than the NOx emission produced by
the upstream injection for all swirler vane angles. However, the flame was not stable,
produces less convincing NOx emission results. High NOx emission was shown by
this setting. Once again, the results show that swirler vane angle of 60o produces
better results compared to other swirler vane angles. Swirler vane angle of 30o
produces highest NOx emission results for the entire swirler vane angles. This match
the theory, which states that stronger swirling flow helps in mixing of fuel and air,
thus reduces the emissions. At equivalence ratio of 0.803, the emission reduction was
not significant where it reduced only about 8 ppm for swirler vane angle of 60o
compared to swirler vane angle of 30o. This value contributes about 32 percent of
reduction between these two swirlers. Meanwhile, NOx emission decreased about 13
percent for swirler vane angle of 50o compared to swirler vane angle of 40o.
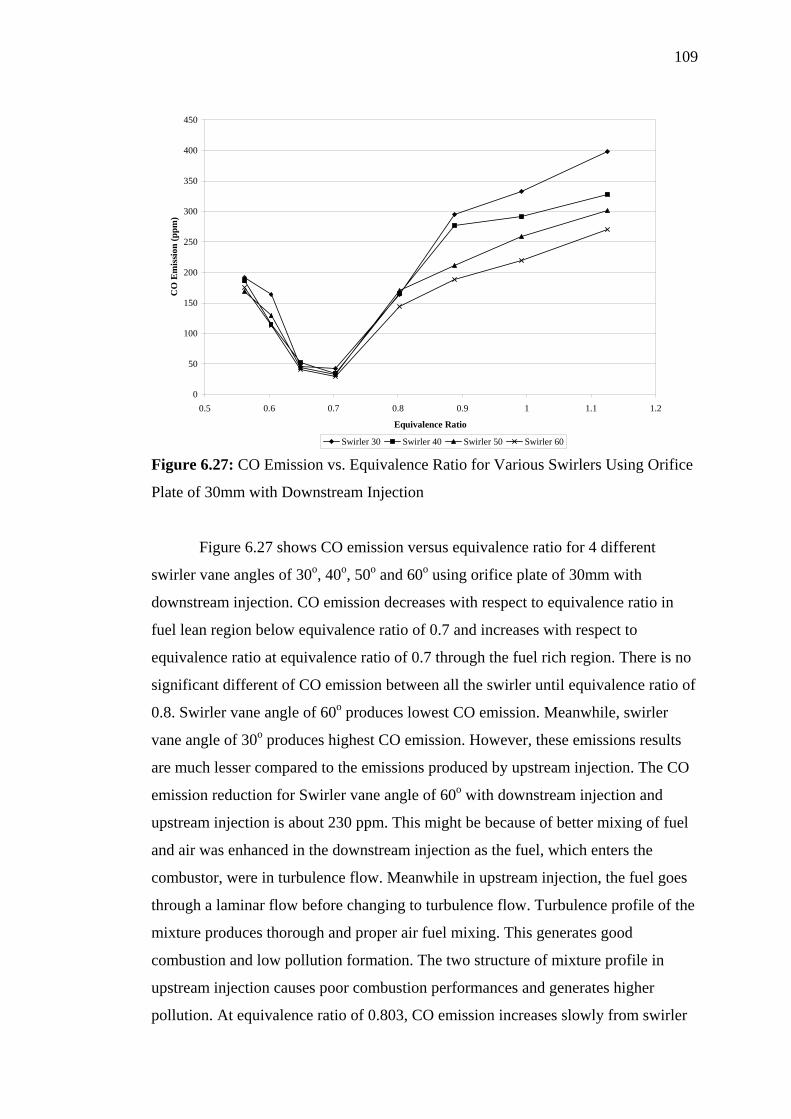
109
0
50
100
150
200
250
300
350
400
450
0.5 0.6 0.7 0.8 0.9 1 1.1 1.2
Equivalence Ratio
CO
Em
issi
on (p
pm)
Swirler 30 Swirler 40 Swirler 50 Swirler 60 Figure 6.27: CO Emission vs. Equivalence Ratio for Various Swirlers Using Orifice
Plate of 30mm with Downstream Injection
Figure 6.27 shows CO emission versus equivalence ratio for 4 different
swirler vane angles of 30o, 40o, 50o and 60o using orifice plate of 30mm with
downstream injection. CO emission decreases with respect to equivalence ratio in
fuel lean region below equivalence ratio of 0.7 and increases with respect to
equivalence ratio at equivalence ratio of 0.7 through the fuel rich region. There is no
significant different of CO emission between all the swirler until equivalence ratio of
0.8. Swirler vane angle of 60o produces lowest CO emission. Meanwhile, swirler
vane angle of 30o produces highest CO emission. However, these emissions results
are much lesser compared to the emissions produced by upstream injection. The CO
emission reduction for Swirler vane angle of 60o with downstream injection and
upstream injection is about 230 ppm. This might be because of better mixing of fuel
and air was enhanced in the downstream injection as the fuel, which enters the
combustor, were in turbulence flow. Meanwhile in upstream injection, the fuel goes
through a laminar flow before changing to turbulence flow. Turbulence profile of the
mixture produces thorough and proper air fuel mixing. This generates good
combustion and low pollution formation. The two structure of mixture profile in
upstream injection causes poor combustion performances and generates higher
pollution. At equivalence ratio of 0.803, CO emission increases slowly from swirler
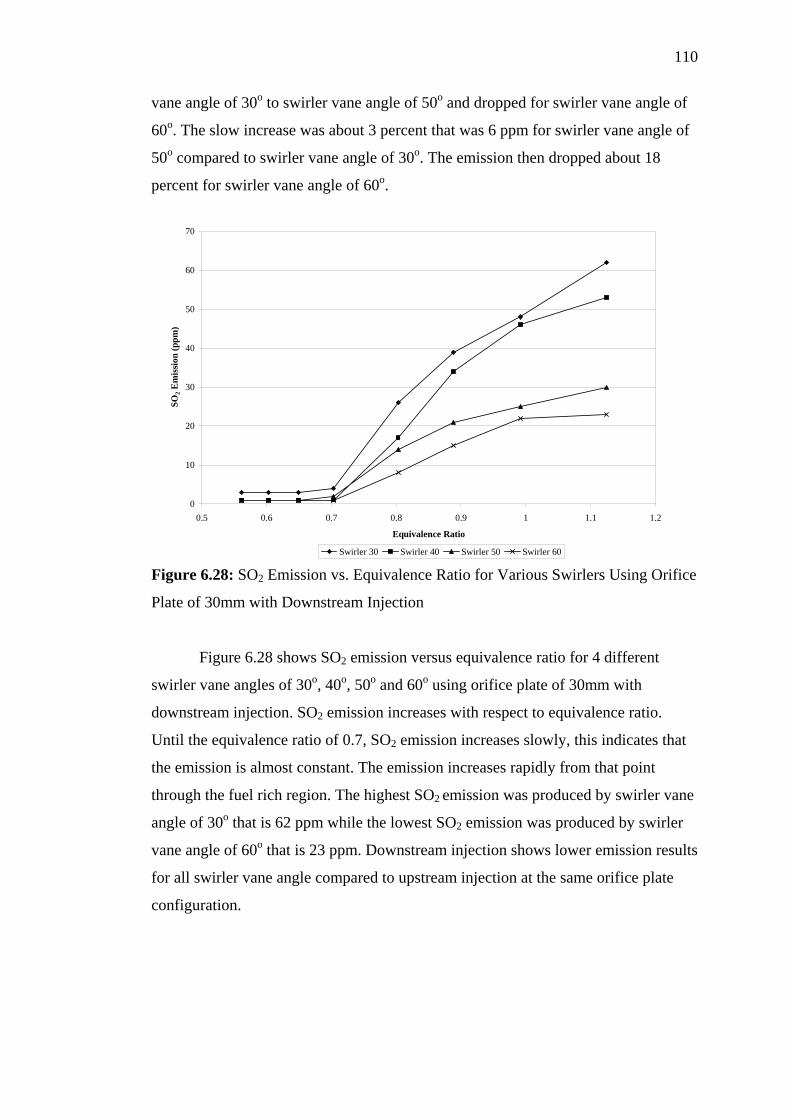
110
vane angle of 30o to swirler vane angle of 50o and dropped for swirler vane angle of
60o. The slow increase was about 3 percent that was 6 ppm for swirler vane angle of
50o compared to swirler vane angle of 30o. The emission then dropped about 18
percent for swirler vane angle of 60o.
0
10
20
30
40
50
60
70
0.5 0.6 0.7 0.8 0.9 1 1.1 1.2
Equivalence Ratio
SO2 E
mis
sion
(ppm
)
Swirler 30 Swirler 40 Swirler 50 Swirler 60 Figure 6.28: SO2 Emission vs. Equivalence Ratio for Various Swirlers Using Orifice
Plate of 30mm with Downstream Injection
Figure 6.28 shows SO2 emission versus equivalence ratio for 4 different
swirler vane angles of 30o, 40o, 50o and 60o using orifice plate of 30mm with
downstream injection. SO2 emission increases with respect to equivalence ratio.
Until the equivalence ratio of 0.7, SO2 emission increases slowly, this indicates that
the emission is almost constant. The emission increases rapidly from that point
through the fuel rich region. The highest SO2 emission was produced by swirler vane
angle of 30o that is 62 ppm while the lowest SO2 emission was produced by swirler
vane angle of 60o that is 23 ppm. Downstream injection shows lower emission results
for all swirler vane angle compared to upstream injection at the same orifice plate
configuration.
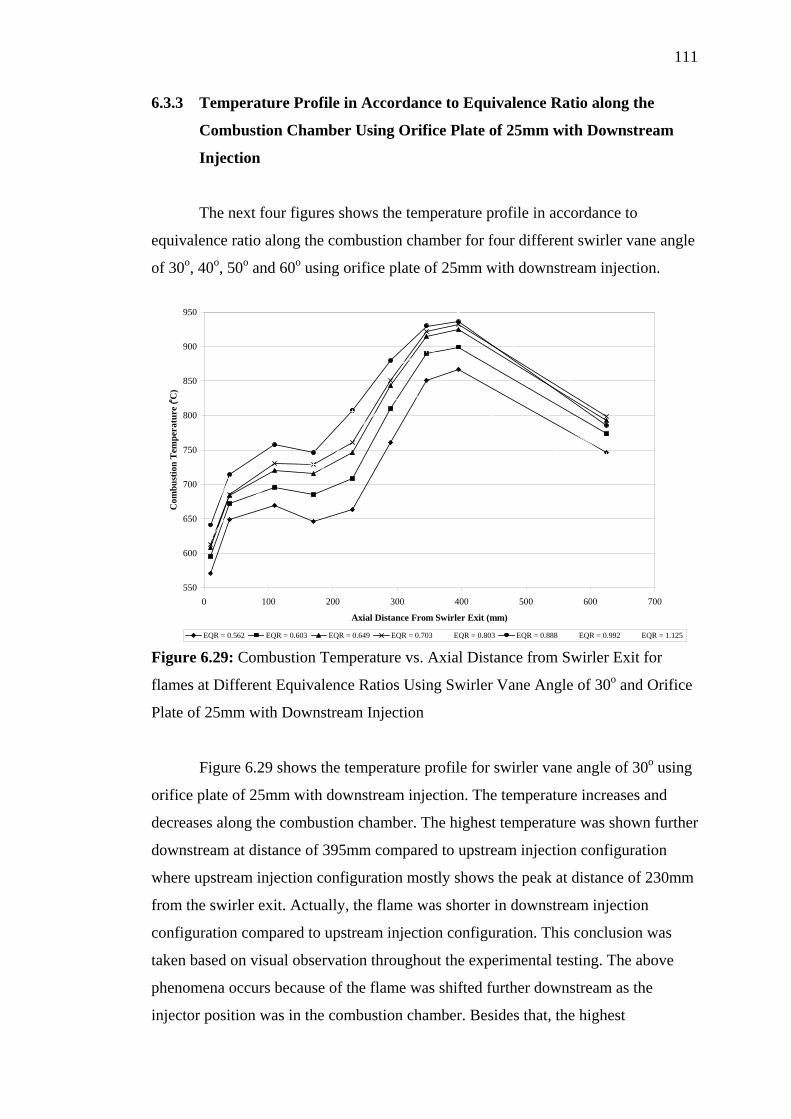
111
6.3.3 Temperature Profile in Accordance to Equivalence Ratio along the
Combustion Chamber Using Orifice Plate of 25mm with Downstream
Injection
The next four figures shows the temperature profile in accordance to
equivalence ratio along the combustion chamber for four different swirler vane angle
of 30o, 40o, 50o and 60o using orifice plate of 25mm with downstream injection.
550
600
650
700
750
800
850
900
950
0 100 200 300 400 500 600 700
Axial Distance From Swirler Exit (mm)
Com
bust
ion
Tem
pera
ture
(o C)
EQR = 0.562 EQR = 0.603 EQR = 0.649 EQR = 0.703 EQR = 0.803 EQR = 0.888 EQR = 0.992 EQR = 1.125 Figure 6.29: Combustion Temperature vs. Axial Distance from Swirler Exit for
flames at Different Equivalence Ratios Using Swirler Vane Angle of 30o and Orifice
Plate of 25mm with Downstream Injection
Figure 6.29 shows the temperature profile for swirler vane angle of 30o using
orifice plate of 25mm with downstream injection. The temperature increases and
decreases along the combustion chamber. The highest temperature was shown further
downstream at distance of 395mm compared to upstream injection configuration
where upstream injection configuration mostly shows the peak at distance of 230mm
from the swirler exit. Actually, the flame was shorter in downstream injection
configuration compared to upstream injection configuration. This conclusion was
taken based on visual observation throughout the experimental testing. The above
phenomena occurs because of the flame was shifted further downstream as the
injector position was in the combustion chamber. Besides that, the highest
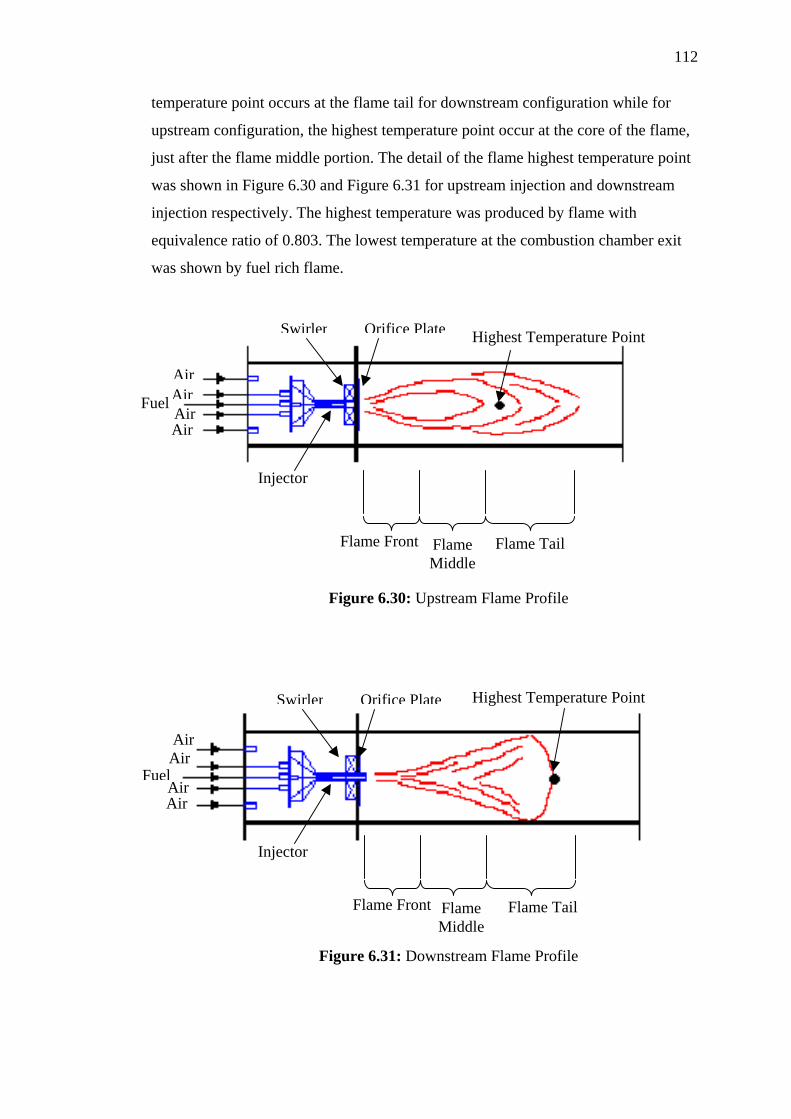
112
temperature point occurs at the flame tail for downstream configuration while for
upstream configuration, the highest temperature point occur at the core of the flame,
just after the flame middle portion. The detail of the flame highest temperature point
was shown in Figure 6.30 and Figure 6.31 for upstream injection and downstream
injection respectively. The highest temperature was produced by flame with
equivalence ratio of 0.803. The lowest temperature at the combustion chamber exit
was shown by fuel rich flame.
r e Highest Temperature Point
Fuel
Air
r AiFlame Front Flame Middle
Flame Tail
Highest Temperature Point
Air Air
Injector
Figure 6.30: Upstream Flame Profile
r e
Air Air
FuelAir
Inj
Air
Swirle
Swirle
F
ector
Figur
Orifice Plat
Orifice Plat
lame Front Flame Middle
Flame Tail
e 6.31: Downstream Flame Profile
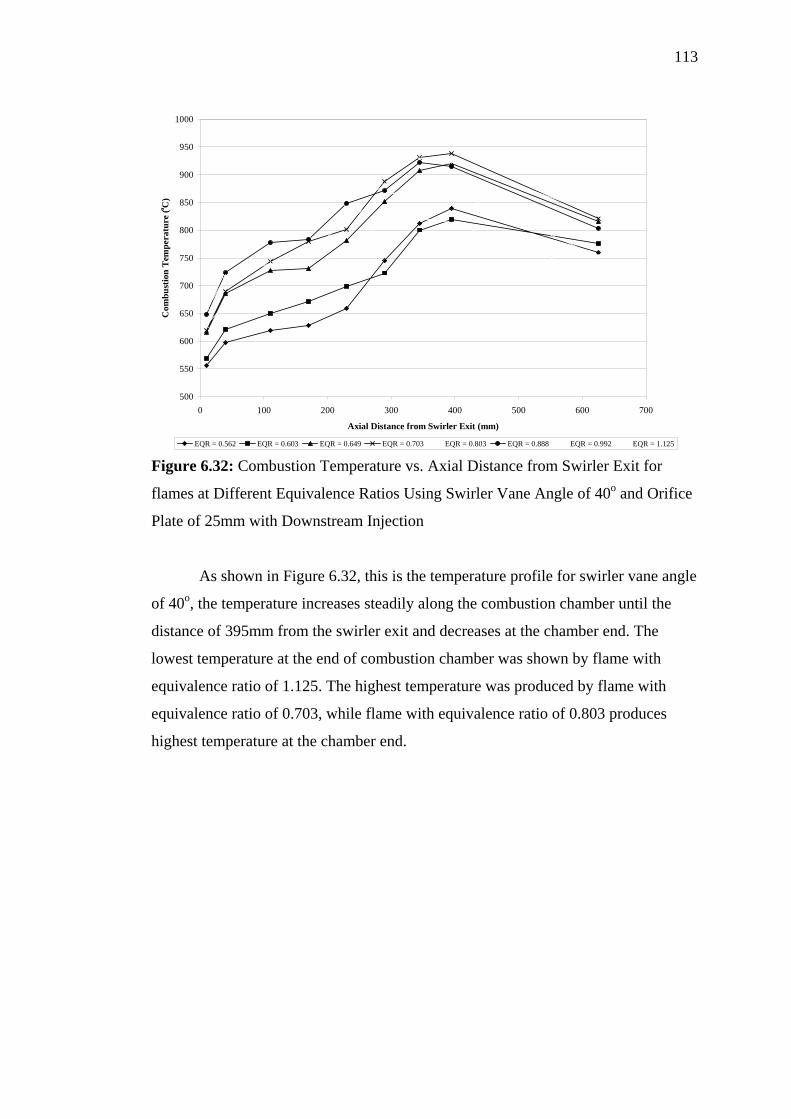
113
500
550
600
650
700
750
800
850
900
950
1000
0 100 200 300 400 500 600 700
Axial Distance from Swirler Exit (mm)
Com
bust
ion
Tem
pera
ture
(o C)
EQR = 0.562 EQR = 0.603 EQR = 0.649 EQR = 0.703 EQR = 0.803 EQR = 0.888 EQR = 0.992 EQR = 1.125 Figure 6.32: Combustion Temperature vs. Axial Distance from Swirler Exit for
flames at Different Equivalence Ratios Using Swirler Vane Angle of 40o and Orifice
Plate of 25mm with Downstream Injection
As shown in Figure 6.32, this is the temperature profile for swirler vane angle
of 40o, the temperature increases steadily along the combustion chamber until the
distance of 395mm from the swirler exit and decreases at the chamber end. The
lowest temperature at the end of combustion chamber was shown by flame with
equivalence ratio of 1.125. The highest temperature was produced by flame with
equivalence ratio of 0.703, while flame with equivalence ratio of 0.803 produces
highest temperature at the chamber end.
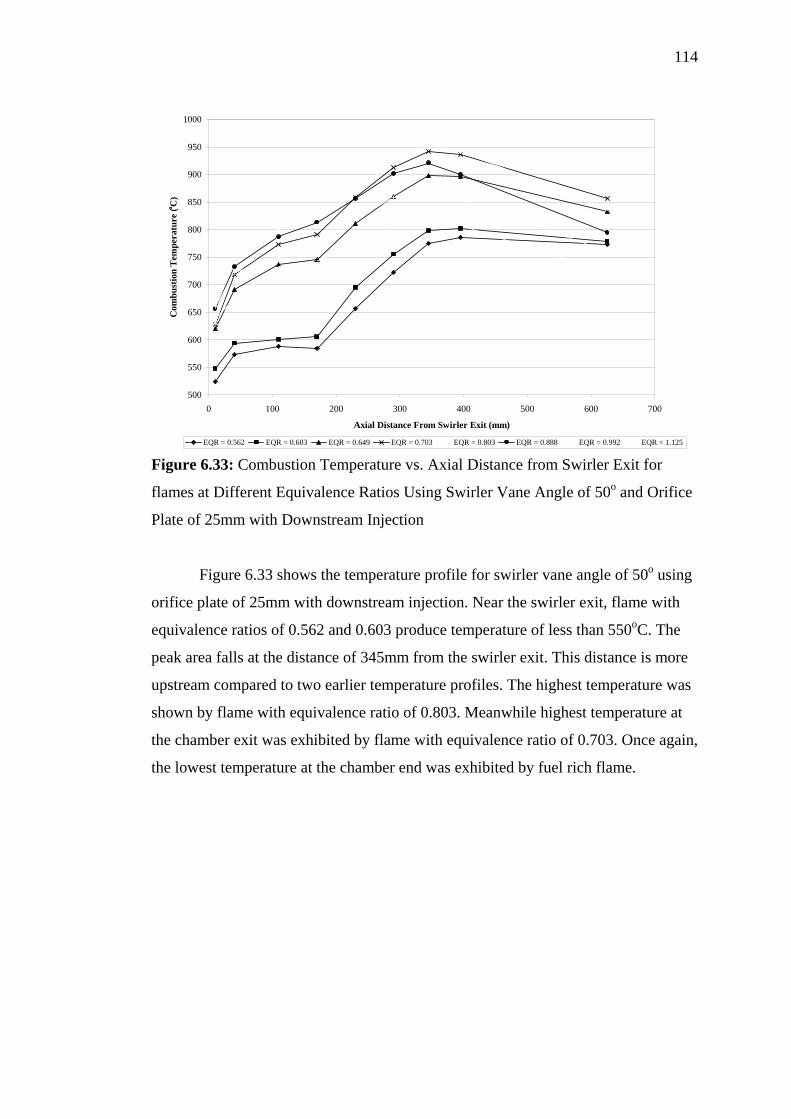
114
500
550
600
650
700
750
800
850
900
950
1000
0 100 200 300 400 500 600 700
Axial Distance From Swirler Exit (mm)
Com
bust
ion
Tem
pera
ture
(o C)
EQR = 0.562 EQR = 0.603 EQR = 0.649 EQR = 0.703 EQR = 0.803 EQR = 0.888 EQR = 0.992 EQR = 1.125 Figure 6.33: Combustion Temperature vs. Axial Distance from Swirler Exit for
flames at Different Equivalence Ratios Using Swirler Vane Angle of 50o and Orifice
Plate of 25mm with Downstream Injection
Figure 6.33 shows the temperature profile for swirler vane angle of 50o using
orifice plate of 25mm with downstream injection. Near the swirler exit, flame with
equivalence ratios of 0.562 and 0.603 produce temperature of less than 550oC. The
peak area falls at the distance of 345mm from the swirler exit. This distance is more
upstream compared to two earlier temperature profiles. The highest temperature was
shown by flame with equivalence ratio of 0.803. Meanwhile highest temperature at
the chamber exit was exhibited by flame with equivalence ratio of 0.703. Once again,
the lowest temperature at the chamber end was exhibited by fuel rich flame.
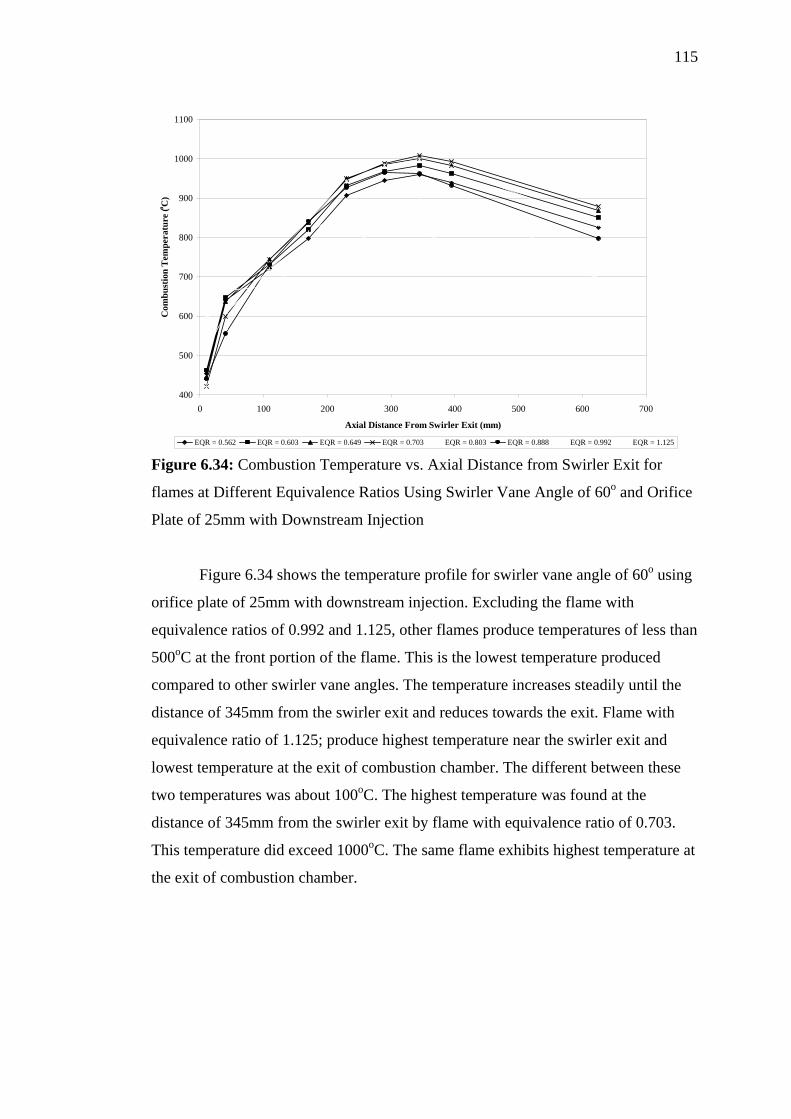
115
400
500
600
700
800
900
1000
1100
0 100 200 300 400 500 600 700
Axial Distance From Swirler Exit (mm)
Com
bust
ion
Tem
pera
ture
(o C)
EQR = 0.562 EQR = 0.603 EQR = 0.649 EQR = 0.703 EQR = 0.803 EQR = 0.888 EQR = 0.992 EQR = 1.125 Figure 6.34: Combustion Temperature vs. Axial Distance from Swirler Exit for
flames at Different Equivalence Ratios Using Swirler Vane Angle of 60o and Orifice
Plate of 25mm with Downstream Injection
Figure 6.34 shows the temperature profile for swirler vane angle of 60o using
orifice plate of 25mm with downstream injection. Excluding the flame with
equivalence ratios of 0.992 and 1.125, other flames produce temperatures of less than
500oC at the front portion of the flame. This is the lowest temperature produced
compared to other swirler vane angles. The temperature increases steadily until the
distance of 345mm from the swirler exit and reduces towards the exit. Flame with
equivalence ratio of 1.125; produce highest temperature near the swirler exit and
lowest temperature at the exit of combustion chamber. The different between these
two temperatures was about 100oC. The highest temperature was found at the
distance of 345mm from the swirler exit by flame with equivalence ratio of 0.703.
This temperature did exceed 1000oC. The same flame exhibits highest temperature at
the exit of combustion chamber.
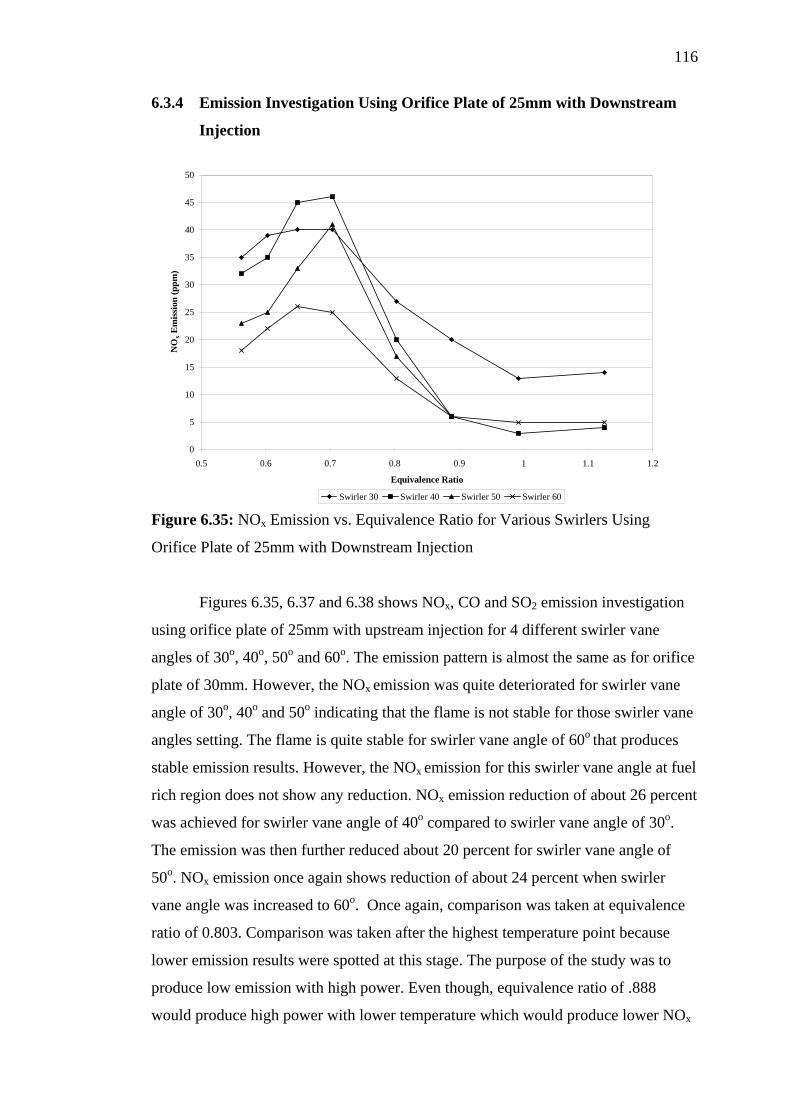
116
6.3.4 Emission Investigation Using Orifice Plate of 25mm with Downstream
Injection
0
5
10
15
20
25
30
35
40
45
50
0.5 0.6 0.7 0.8 0.9 1 1.1 1.2
Equivalence Ratio
NO
x Em
issi
on (p
pm)
Swirler 30 Swirler 40 Swirler 50 Swirler 60 Figure 6.35: NOx Emission vs. Equivalence Ratio for Various Swirlers Using
Orifice Plate of 25mm with Downstream Injection
Figures 6.35, 6.37 and 6.38 shows NOx, CO and SO2 emission investigation
using orifice plate of 25mm with upstream injection for 4 different swirler vane
angles of 30o, 40o, 50o and 60o. The emission pattern is almost the same as for orifice
plate of 30mm. However, the NOx emission was quite deteriorated for swirler vane
angle of 30o, 40o and 50o indicating that the flame is not stable for those swirler vane
angles setting. The flame is quite stable for swirler vane angle of 60o that produces
stable emission results. However, the NOx emission for this swirler vane angle at fuel
rich region does not show any reduction. NOx emission reduction of about 26 percent
was achieved for swirler vane angle of 40o compared to swirler vane angle of 30o.
The emission was then further reduced about 20 percent for swirler vane angle of
50o. NOx emission once again shows reduction of about 24 percent when swirler
vane angle was increased to 60o. Once again, comparison was taken at equivalence
ratio of 0.803. Comparison was taken after the highest temperature point because
lower emission results were spotted at this stage. The purpose of the study was to
produce low emission with high power. Even though, equivalence ratio of .888
would produce high power with lower temperature which would produce lower NOx
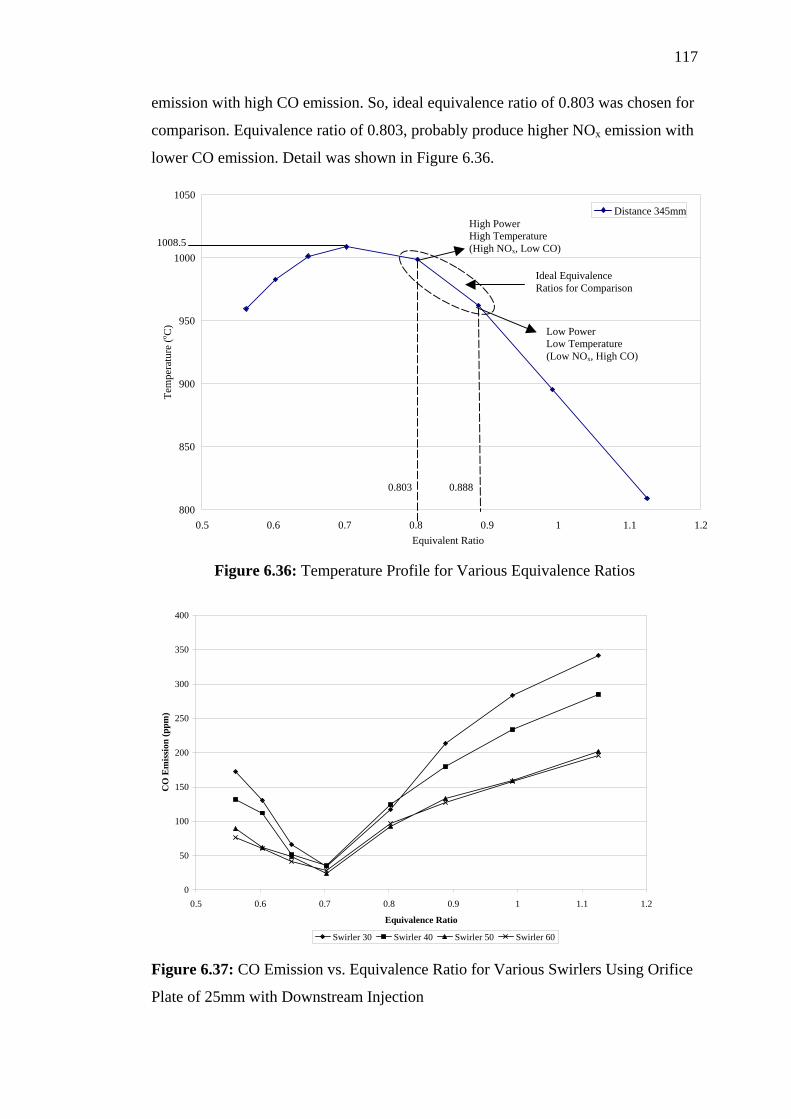
117
emission with high CO emission. So, ideal equivalence ratio of 0.803 was chosen for
comparison. Equivalence ratio of 0.803, probably produce higher NOx emission with
lower CO emission. Detail was shown in Figure 6.36.
1008.5
Tem
pera
ture
(o C)
0.8 0.9 1 1.1
Distance 345mm
Ideal Equivalence Ratios for Comparison
Low Power Low Temperature (Low NOx, High CO)
High Power High Temperature (High NOx, Low CO)
0.8880.803
0.70.60.5
1050
1000
950
900
850
8001.2
Equivalent Ratio
Figure 6.36: Temperature Profile for Various Equivalence Ratios
0
50
100
150
200
250
300
350
400
0.5 0.6 0.7 0.8 0.9 1 1.1 1.2
Equivalence Ratio
CO
Em
issi
on (p
pm)
Swirler 30 Swirler 40 Swirler 50 Swirler 60 Figure 6.37: CO Emission vs. Equivalence Ratio for Various Swirlers Using Orifice
Plate of 25mm with Downstream Injection
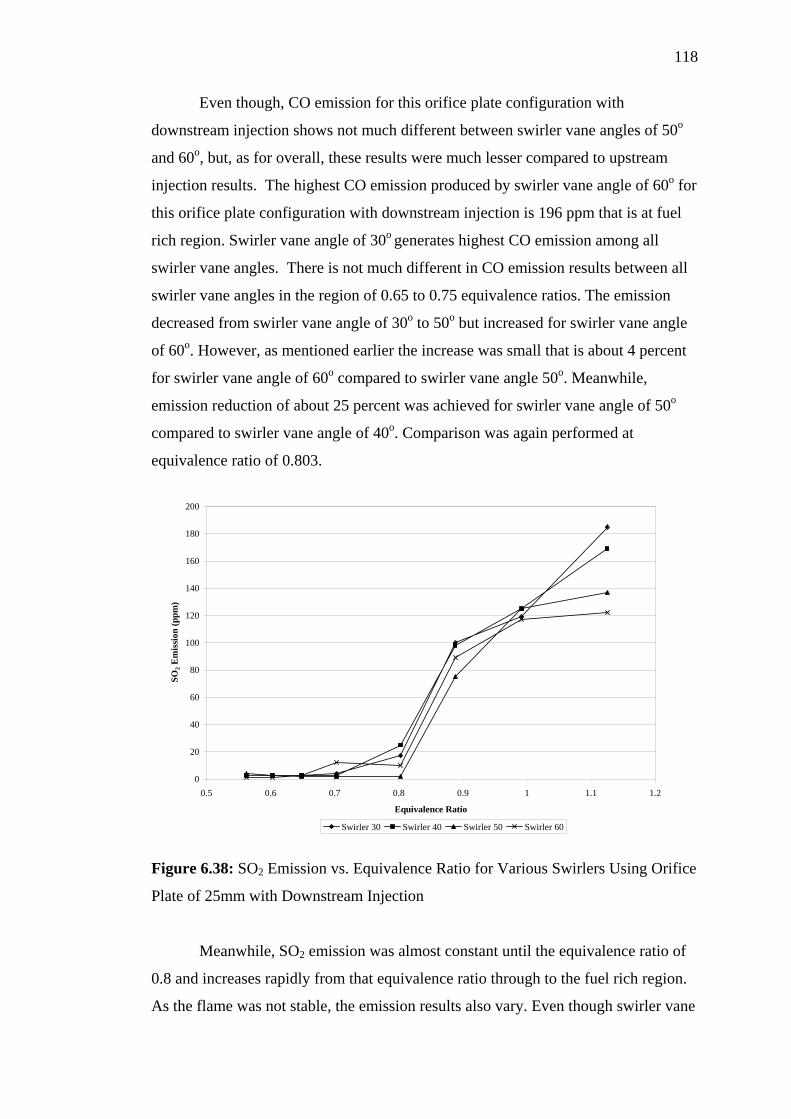
118
Even though, CO emission for this orifice plate configuration with
downstream injection shows not much different between swirler vane angles of 50o
and 60o, but, as for overall, these results were much lesser compared to upstream
injection results. The highest CO emission produced by swirler vane angle of 60o for
this orifice plate configuration with downstream injection is 196 ppm that is at fuel
rich region. Swirler vane angle of 30o generates highest CO emission among all
swirler vane angles. There is not much different in CO emission results between all
swirler vane angles in the region of 0.65 to 0.75 equivalence ratios. The emission
decreased from swirler vane angle of 30o to 50o but increased for swirler vane angle
of 60o. However, as mentioned earlier the increase was small that is about 4 percent
for swirler vane angle of 60o compared to swirler vane angle 50o. Meanwhile,
emission reduction of about 25 percent was achieved for swirler vane angle of 50o
compared to swirler vane angle of 40o. Comparison was again performed at
equivalence ratio of 0.803.
0
20
40
60
80
100
120
140
160
180
200
0.5 0.6 0.7 0.8 0.9 1 1.1 1.2
Equivalence Ratio
SO2 E
mis
sion
(ppm
)
Swirler 30 Swirler 40 Swirler 50 Swirler 60
Figure 6.38: SO2 Emission vs. Equivalence Ratio for Various Swirlers Using Orifice
Plate of 25mm with Downstream Injection
Meanwhile, SO2 emission was almost constant until the equivalence ratio of
0.8 and increases rapidly from that equivalence ratio through to the fuel rich region.
As the flame was not stable, the emission results also vary. Even though swirler vane
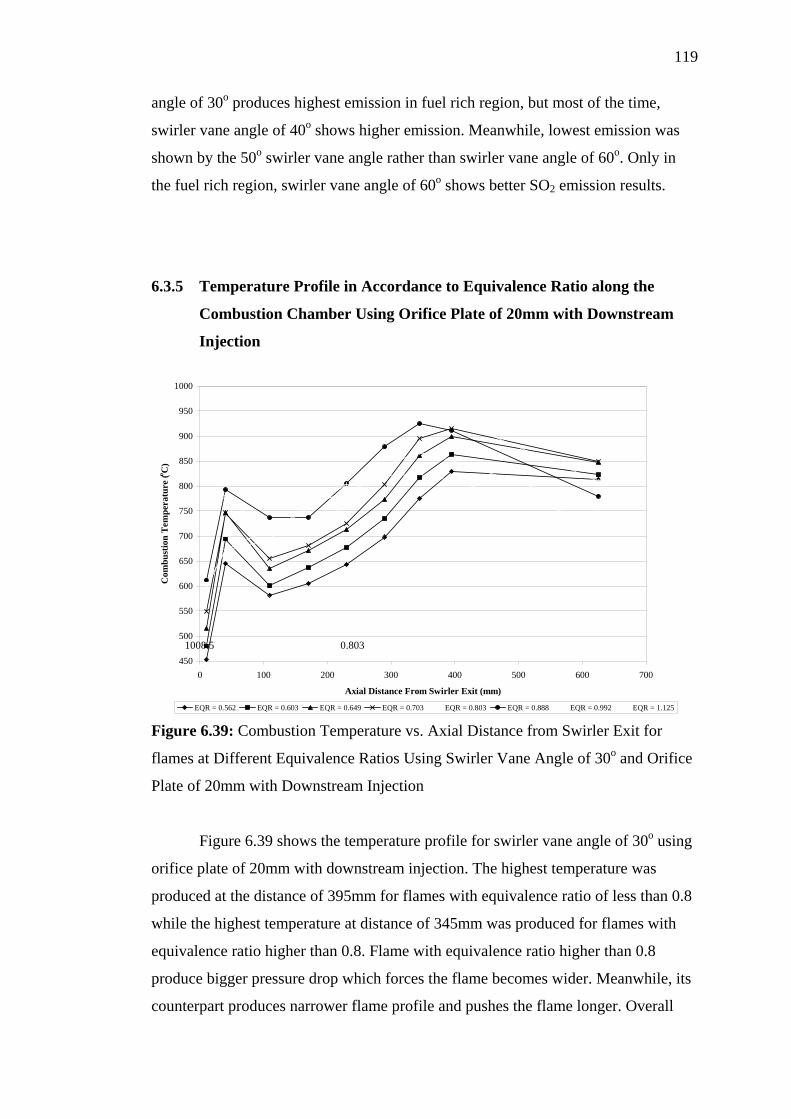
119
angle of 30o produces highest emission in fuel rich region, but most of the time,
swirler vane angle of 40o shows higher emission. Meanwhile, lowest emission was
shown by the 50o swirler vane angle rather than swirler vane angle of 60o. Only in
the fuel rich region, swirler vane angle of 60o shows better SO2 emission results.
6.3.5 Temperature Profile in Accordance to Equivalence Ratio along the
Combustion Chamber Using Orifice Plate of 20mm with Downstream
Injection
450
500
550
600
650
700
750
800
850
900
950
1000
0 100 200 300 400 500 600 700
Axial Distance From Swirler Exit (mm)
Com
bust
ion
Tem
pera
ture
(o C)
EQR = 0.562 EQR = 0.603 EQR = 0.649 EQR = 0.703 EQR = 0.803 EQR = 0.888 EQR = 0.992 EQR = 1.125
1008.5 0.803
Figure 6.39: Combustion Temperature vs. Axial Distance from Swirler Exit for
flames at Different Equivalence Ratios Using Swirler Vane Angle of 30o and Orifice
Plate of 20mm with Downstream Injection
Figure 6.39 shows the temperature profile for swirler vane angle of 30o using
orifice plate of 20mm with downstream injection. The highest temperature was
produced at the distance of 395mm for flames with equivalence ratio of less than 0.8
while the highest temperature at distance of 345mm was produced for flames with
equivalence ratio higher than 0.8. Flame with equivalence ratio higher than 0.8
produce bigger pressure drop which forces the flame becomes wider. Meanwhile, its
counterpart produces narrower flame profile and pushes the flame longer. Overall
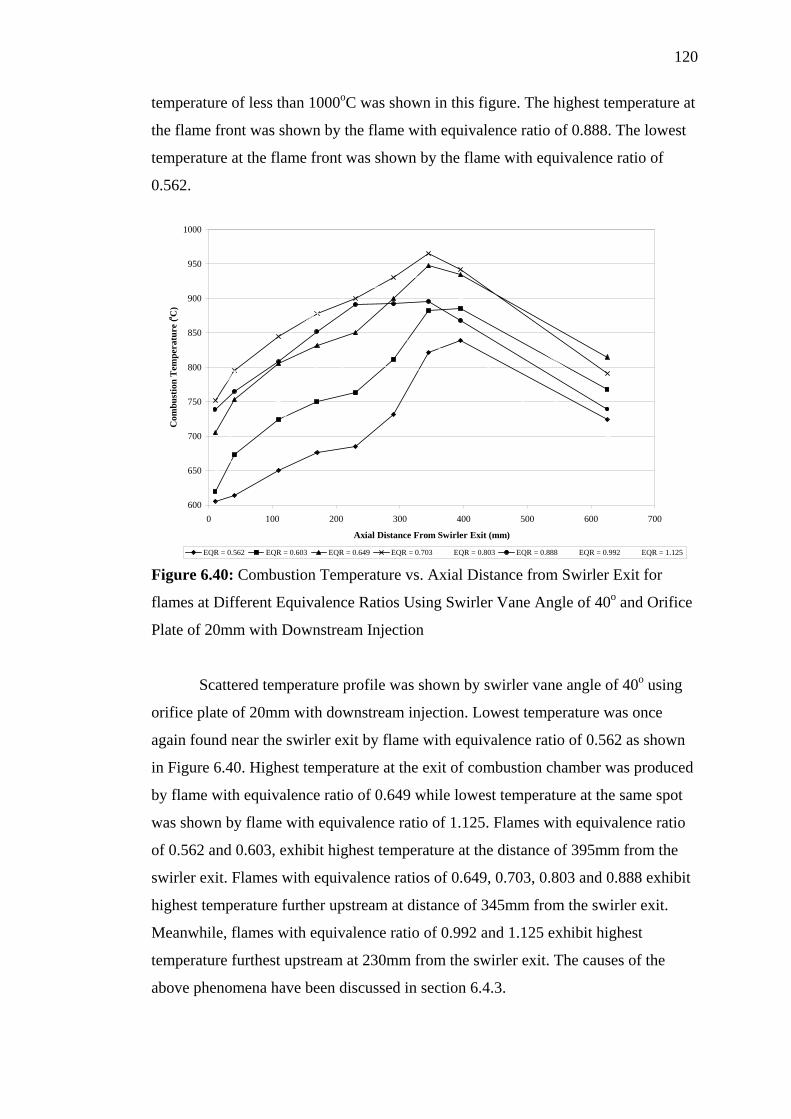
120
temperature of less than 1000oC was shown in this figure. The highest temperature at
the flame front was shown by the flame with equivalence ratio of 0.888. The lowest
temperature at the flame front was shown by the flame with equivalence ratio of
0.562.
600
650
700
750
800
850
900
950
1000
0 100 200 300 400 500 600 700
Axial Distance From Swirler Exit (mm)
Com
bust
ion
Tem
pera
ture
(o C)
EQR = 0.562 EQR = 0.603 EQR = 0.649 EQR = 0.703 EQR = 0.803 EQR = 0.888 EQR = 0.992 EQR = 1.125 Figure 6.40: Combustion Temperature vs. Axial Distance from Swirler Exit for
flames at Different Equivalence Ratios Using Swirler Vane Angle of 40o and Orifice
Plate of 20mm with Downstream Injection
Scattered temperature profile was shown by swirler vane angle of 40o using
orifice plate of 20mm with downstream injection. Lowest temperature was once
again found near the swirler exit by flame with equivalence ratio of 0.562 as shown
in Figure 6.40. Highest temperature at the exit of combustion chamber was produced
by flame with equivalence ratio of 0.649 while lowest temperature at the same spot
was shown by flame with equivalence ratio of 1.125. Flames with equivalence ratio
of 0.562 and 0.603, exhibit highest temperature at the distance of 395mm from the
swirler exit. Flames with equivalence ratios of 0.649, 0.703, 0.803 and 0.888 exhibit
highest temperature further upstream at distance of 345mm from the swirler exit.
Meanwhile, flames with equivalence ratio of 0.992 and 1.125 exhibit highest
temperature furthest upstream at 230mm from the swirler exit. The causes of the
above phenomena have been discussed in section 6.4.3.
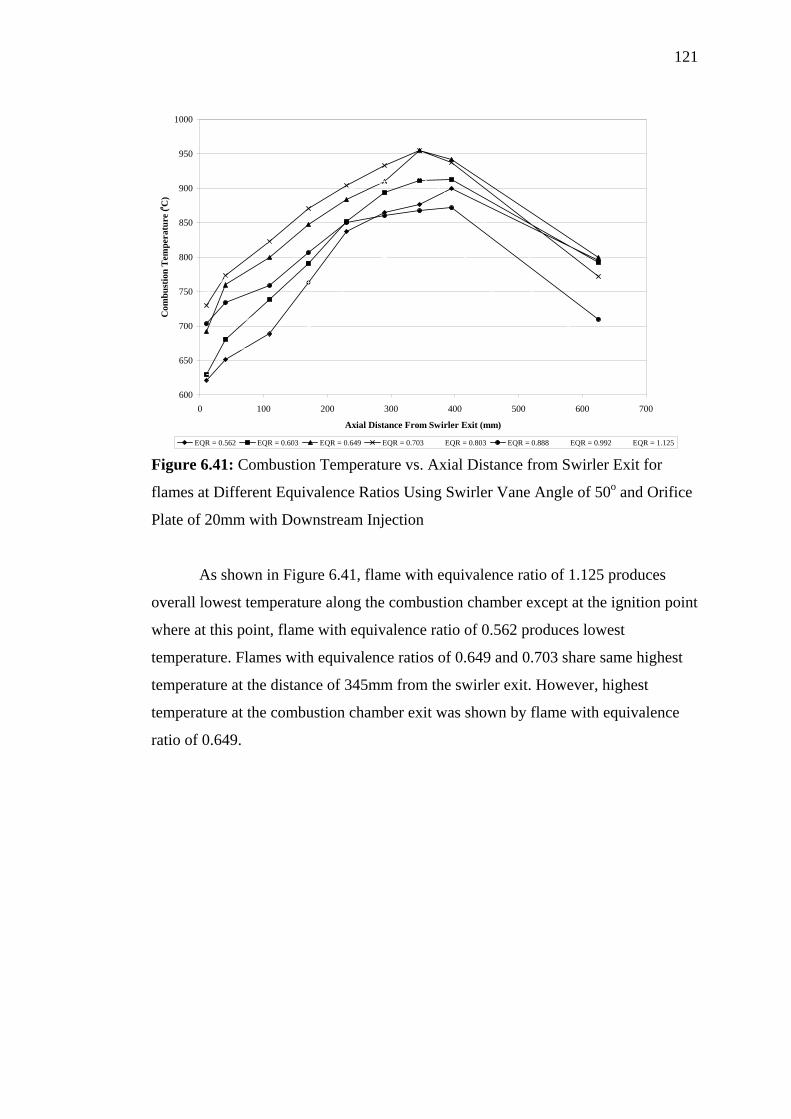
121
600
650
700
750
800
850
900
950
1000
0 100 200 300 400 500 600 700
Axial Distance From Swirler Exit (mm)
Com
bust
ion
Tem
pera
ture
(o C)
EQR = 0.562 EQR = 0.603 EQR = 0.649 EQR = 0.703 EQR = 0.803 EQR = 0.888 EQR = 0.992 EQR = 1.125 Figure 6.41: Combustion Temperature vs. Axial Distance from Swirler Exit for
flames at Different Equivalence Ratios Using Swirler Vane Angle of 50o and Orifice
Plate of 20mm with Downstream Injection
As shown in Figure 6.41, flame with equivalence ratio of 1.125 produces
overall lowest temperature along the combustion chamber except at the ignition point
where at this point, flame with equivalence ratio of 0.562 produces lowest
temperature. Flames with equivalence ratios of 0.649 and 0.703 share same highest
temperature at the distance of 345mm from the swirler exit. However, highest
temperature at the combustion chamber exit was shown by flame with equivalence
ratio of 0.649.
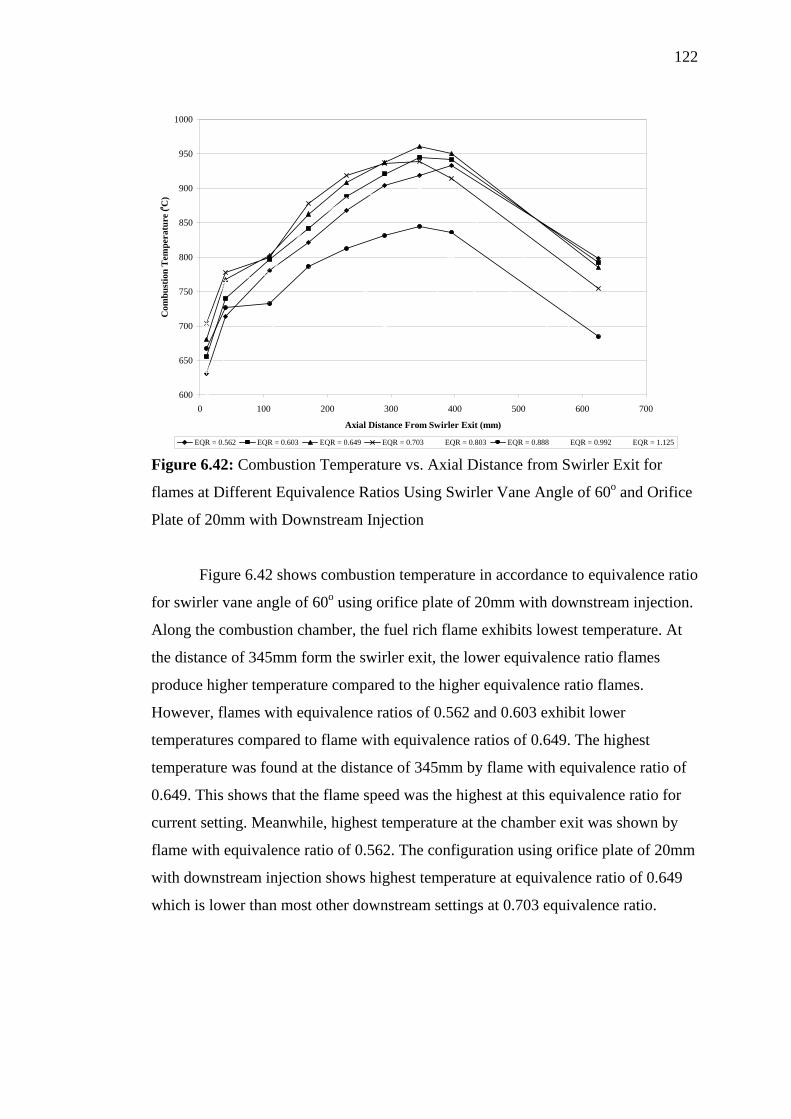
122
600
650
700
750
800
850
900
950
1000
0 100 200 300 400 500 600 700
Axial Distance From Swirler Exit (mm)
Com
bust
ion
Tem
pera
ture
(o C)
EQR = 0.562 EQR = 0.603 EQR = 0.649 EQR = 0.703 EQR = 0.803 EQR = 0.888 EQR = 0.992 EQR = 1.125 Figure 6.42: Combustion Temperature vs. Axial Distance from Swirler Exit for
flames at Different Equivalence Ratios Using Swirler Vane Angle of 60o and Orifice
Plate of 20mm with Downstream Injection
Figure 6.42 shows combustion temperature in accordance to equivalence ratio
for swirler vane angle of 60o using orifice plate of 20mm with downstream injection.
Along the combustion chamber, the fuel rich flame exhibits lowest temperature. At
the distance of 345mm form the swirler exit, the lower equivalence ratio flames
produce higher temperature compared to the higher equivalence ratio flames.
However, flames with equivalence ratios of 0.562 and 0.603 exhibit lower
temperatures compared to flame with equivalence ratios of 0.649. The highest
temperature was found at the distance of 345mm by flame with equivalence ratio of
0.649. This shows that the flame speed was the highest at this equivalence ratio for
current setting. Meanwhile, highest temperature at the chamber exit was shown by
flame with equivalence ratio of 0.562. The configuration using orifice plate of 20mm
with downstream injection shows highest temperature at equivalence ratio of 0.649
which is lower than most other downstream settings at 0.703 equivalence ratio.
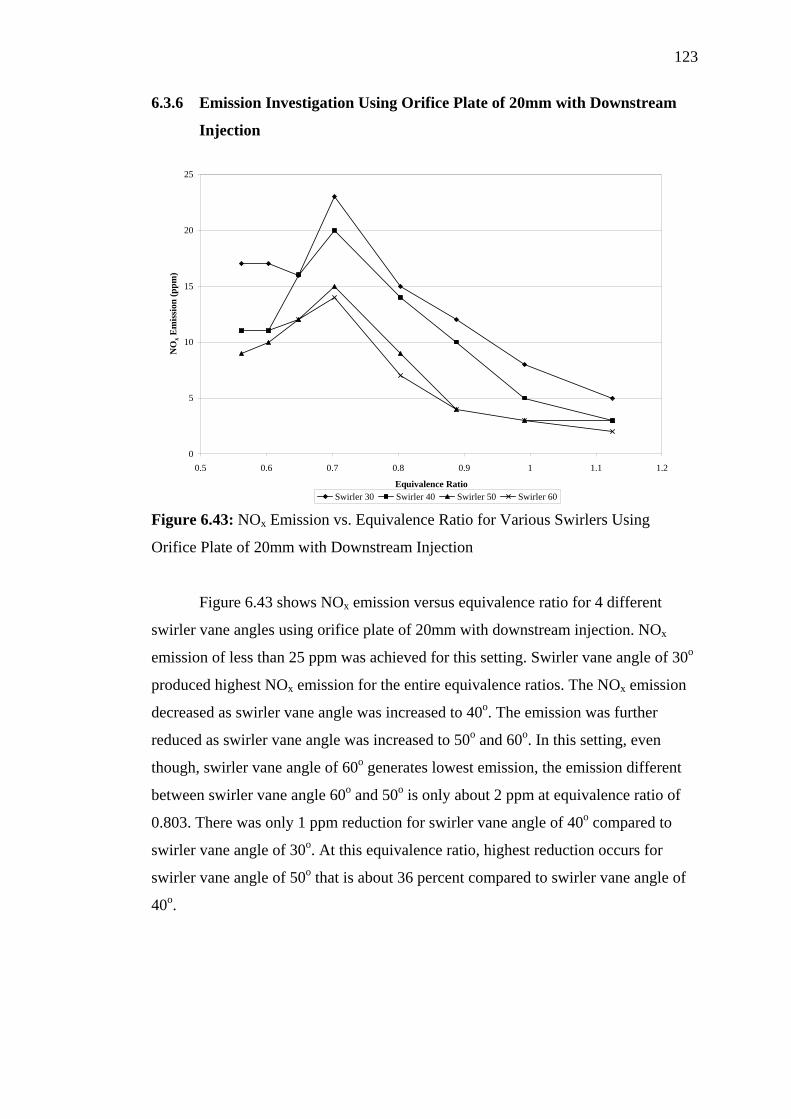
123
6.3.6 Emission Investigation Using Orifice Plate of 20mm with Downstream
Injection
0
5
10
15
20
25
0.5 0.6 0.7 0.8 0.9 1 1.1 1.2
Equivalence Ratio
NO
x Em
issi
on (p
pm)
Swirler 30 Swirler 40 Swirler 50 Swirler 60 Figure 6.43: NOx Emission vs. Equivalence Ratio for Various Swirlers Using
Orifice Plate of 20mm with Downstream Injection
Figure 6.43 shows NOx emission versus equivalence ratio for 4 different
swirler vane angles using orifice plate of 20mm with downstream injection. NOx
emission of less than 25 ppm was achieved for this setting. Swirler vane angle of 30o
produced highest NOx emission for the entire equivalence ratios. The NOx emission
decreased as swirler vane angle was increased to 40o. The emission was further
reduced as swirler vane angle was increased to 50o and 60o. In this setting, even
though, swirler vane angle of 60o generates lowest emission, the emission different
between swirler vane angle 60o and 50o is only about 2 ppm at equivalence ratio of
0.803. There was only 1 ppm reduction for swirler vane angle of 40o compared to
swirler vane angle of 30o. At this equivalence ratio, highest reduction occurs for
swirler vane angle of 50o that is about 36 percent compared to swirler vane angle of
40o.
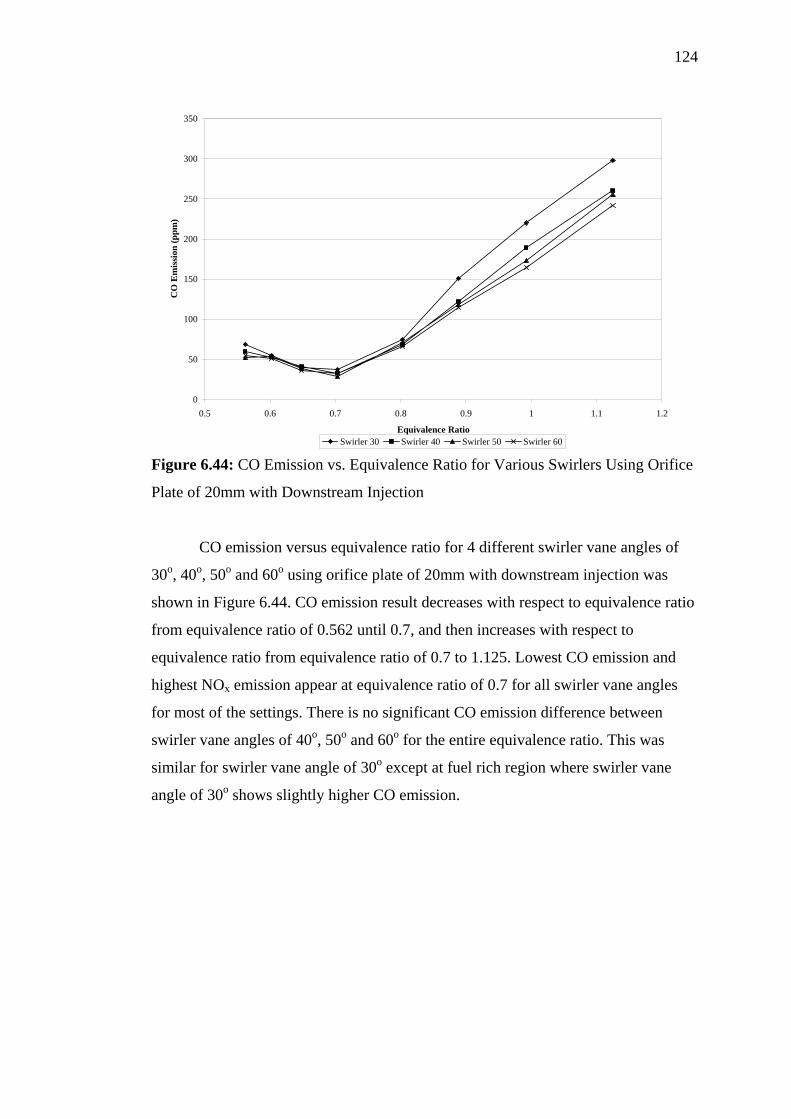
124
0
50
100
150
200
250
300
350
0.5 0.6 0.7 0.8 0.9 1 1.1 1.2
Equivalence Ratio
CO
Em
issi
on (p
pm)
Swirler 30 Swirler 40 Swirler 50 Swirler 60 Figure 6.44: CO Emission vs. Equivalence Ratio for Various Swirlers Using Orifice
Plate of 20mm with Downstream Injection
CO emission versus equivalence ratio for 4 different swirler vane angles of
30o, 40o, 50o and 60o using orifice plate of 20mm with downstream injection was
shown in Figure 6.44. CO emission result decreases with respect to equivalence ratio
from equivalence ratio of 0.562 until 0.7, and then increases with respect to
equivalence ratio from equivalence ratio of 0.7 to 1.125. Lowest CO emission and
highest NOx emission appear at equivalence ratio of 0.7 for all swirler vane angles
for most of the settings. There is no significant CO emission difference between
swirler vane angles of 40o, 50o and 60o for the entire equivalence ratio. This was
similar for swirler vane angle of 30o except at fuel rich region where swirler vane
angle of 30o shows slightly higher CO emission.
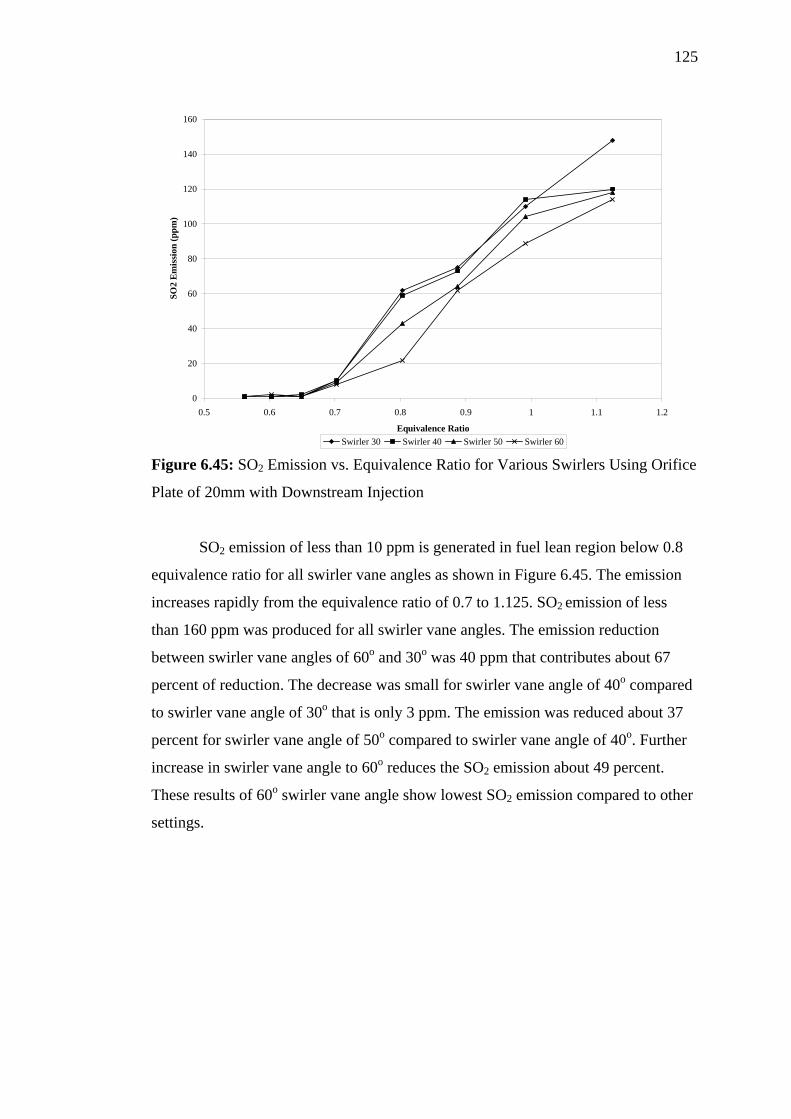
125
0
20
40
60
80
100
120
140
160
0.5 0.6 0.7 0.8 0.9 1 1.1 1.2
Equivalence Ratio
SO2
Em
issi
on (p
pm)
Swirler 30 Swirler 40 Swirler 50 Swirler 60 Figure 6.45: SO2 Emission vs. Equivalence Ratio for Various Swirlers Using Orifice
Plate of 20mm with Downstream Injection
SO2 emission of less than 10 ppm is generated in fuel lean region below 0.8
equivalence ratio for all swirler vane angles as shown in Figure 6.45. The emission
increases rapidly from the equivalence ratio of 0.7 to 1.125. SO2 emission of less
than 160 ppm was produced for all swirler vane angles. The emission reduction
between swirler vane angles of 60o and 30o was 40 ppm that contributes about 67
percent of reduction. The decrease was small for swirler vane angle of 40o compared
to swirler vane angle of 30o that is only 3 ppm. The emission was reduced about 37
percent for swirler vane angle of 50o compared to swirler vane angle of 40o. Further
increase in swirler vane angle to 60o reduces the SO2 emission about 49 percent.
These results of 60o swirler vane angle show lowest SO2 emission compared to other
settings.
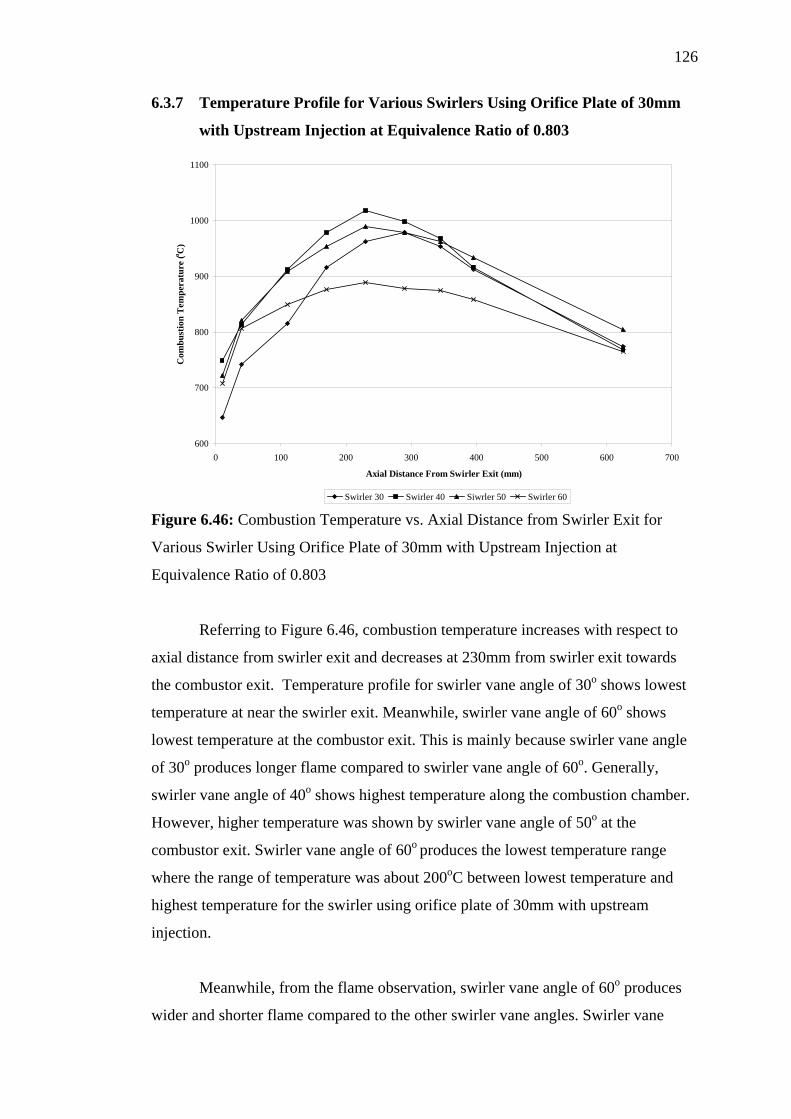
126
6.3.7 Temperature Profile for Various Swirlers Using Orifice Plate of 30mm
with Upstream Injection at Equivalence Ratio of 0.803
600
700
800
900
1000
1100
0 100 200 300 400 500 600 700
Axial Distance From Swirler Exit (mm)
Com
bust
ion
Tem
pera
ture
(o C)
Swirler 30 Swirler 40 Siwrler 50 Swirler 60 Figure 6.46: Combustion Temperature vs. Axial Distance from Swirler Exit for
Various Swirler Using Orifice Plate of 30mm with Upstream Injection at
Equivalence Ratio of 0.803
Referring to Figure 6.46, combustion temperature increases with respect to
axial distance from swirler exit and decreases at 230mm from swirler exit towards
the combustor exit. Temperature profile for swirler vane angle of 30o shows lowest
temperature at near the swirler exit. Meanwhile, swirler vane angle of 60o shows
lowest temperature at the combustor exit. This is mainly because swirler vane angle
of 30o produces longer flame compared to swirler vane angle of 60o. Generally,
swirler vane angle of 40o shows highest temperature along the combustion chamber.
However, higher temperature was shown by swirler vane angle of 50o at the
combustor exit. Swirler vane angle of 60o produces the lowest temperature range
where the range of temperature was about 200oC between lowest temperature and
highest temperature for the swirler using orifice plate of 30mm with upstream
injection.
Meanwhile, from the flame observation, swirler vane angle of 60o produces
wider and shorter flame compared to the other swirler vane angles. Swirler vane
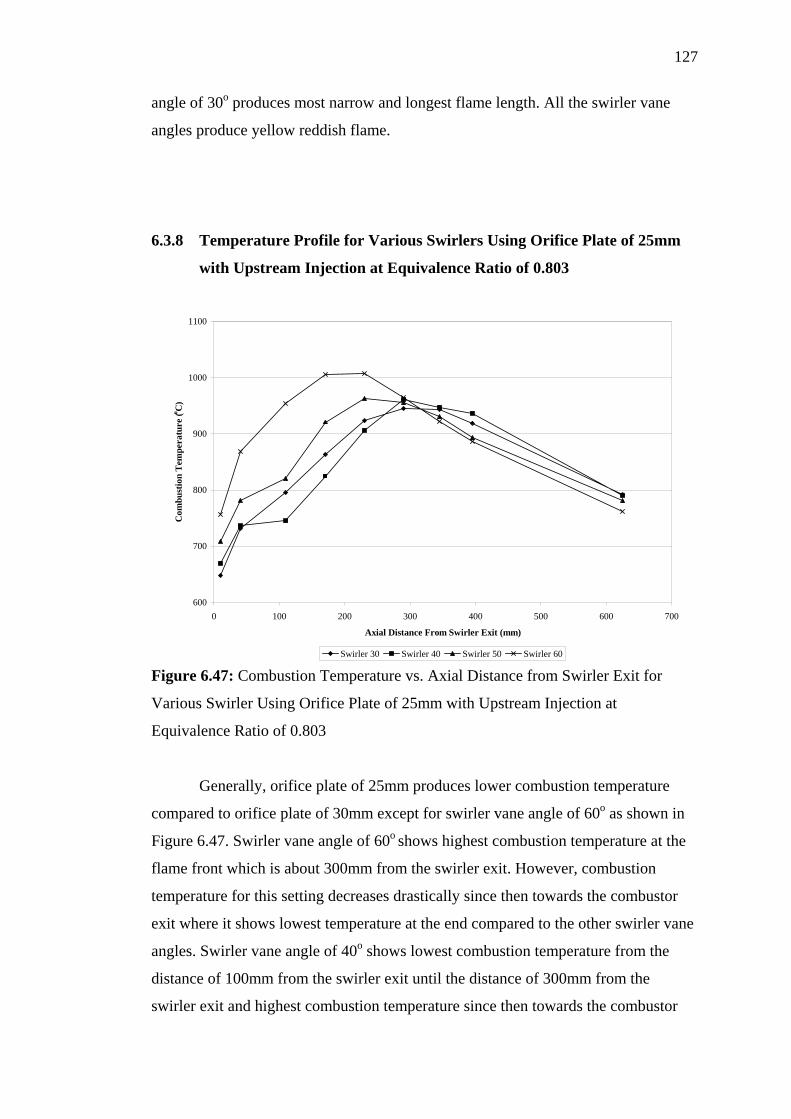
127
angle of 30o produces most narrow and longest flame length. All the swirler vane
angles produce yellow reddish flame.
6.3.8 Temperature Profile for Various Swirlers Using Orifice Plate of 25mm
with Upstream Injection at Equivalence Ratio of 0.803
600
700
800
900
1000
1100
0 100 200 300 400 500 600 700
Axial Distance From Swirler Exit (mm)
Com
bust
ion
Tem
pera
ture
(o C)
Swirler 30 Swirler 40 Swirler 50 Swirler 60 Figure 6.47: Combustion Temperature vs. Axial Distance from Swirler Exit for
Various Swirler Using Orifice Plate of 25mm with Upstream Injection at
Equivalence Ratio of 0.803
Generally, orifice plate of 25mm produces lower combustion temperature
compared to orifice plate of 30mm except for swirler vane angle of 60o as shown in
Figure 6.47. Swirler vane angle of 60o shows highest combustion temperature at the
flame front which is about 300mm from the swirler exit. However, combustion
temperature for this setting decreases drastically since then towards the combustor
exit where it shows lowest temperature at the end compared to the other swirler vane
angles. Swirler vane angle of 40o shows lowest combustion temperature from the
distance of 100mm from the swirler exit until the distance of 300mm from the
swirler exit and highest combustion temperature since then towards the combustor
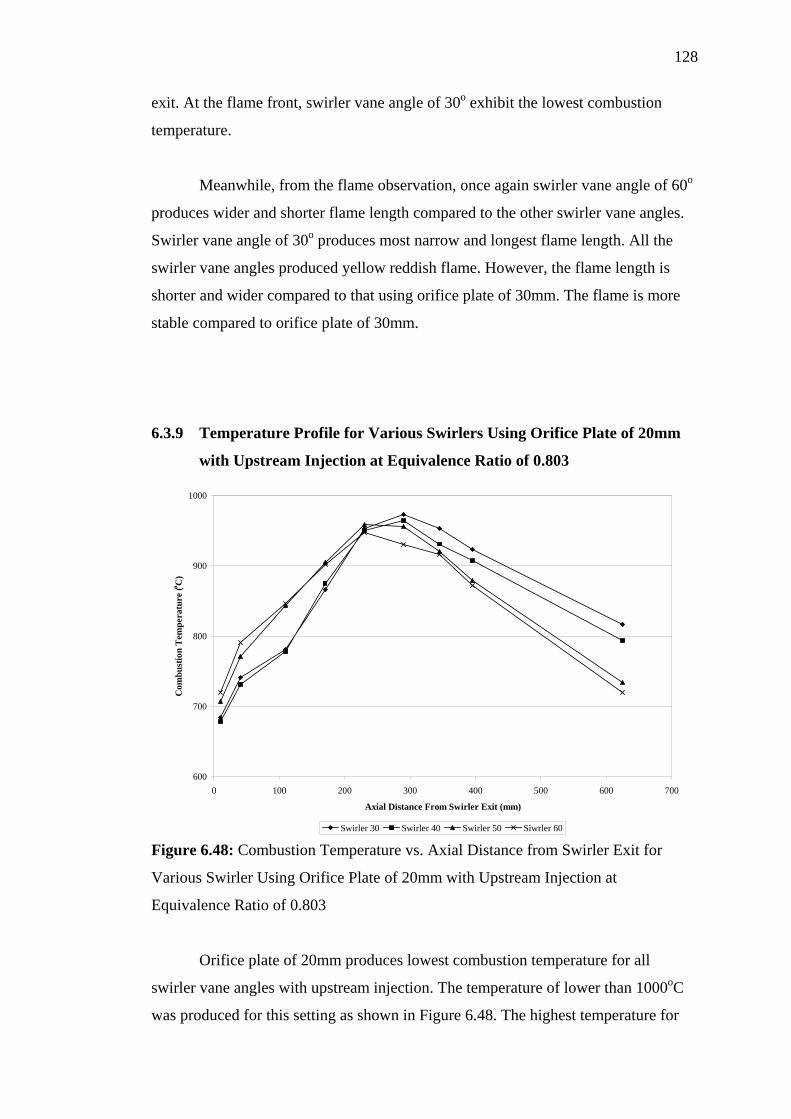
128
exit. At the flame front, swirler vane angle of 30o exhibit the lowest combustion
temperature.
Meanwhile, from the flame observation, once again swirler vane angle of 60o
produces wider and shorter flame length compared to the other swirler vane angles.
Swirler vane angle of 30o produces most narrow and longest flame length. All the
swirler vane angles produced yellow reddish flame. However, the flame length is
shorter and wider compared to that using orifice plate of 30mm. The flame is more
stable compared to orifice plate of 30mm.
6.3.9 Temperature Profile for Various Swirlers Using Orifice Plate of 20mm
with Upstream Injection at Equivalence Ratio of 0.803
600
700
800
900
1000
0 100 200 300 400 500 600 700
Axial Distance From Swirler Exit (mm)
Com
bust
ion
Tem
pera
ture
(o C)
Swirler 30 Swirler 40 Swirler 50 Siwrler 60 Figure 6.48: Combustion Temperature vs. Axial Distance from Swirler Exit for
Various Swirler Using Orifice Plate of 20mm with Upstream Injection at
Equivalence Ratio of 0.803
Orifice plate of 20mm produces lowest combustion temperature for all
swirler vane angles with upstream injection. The temperature of lower than 1000oC
was produced for this setting as shown in Figure 6.48. The highest temperature for
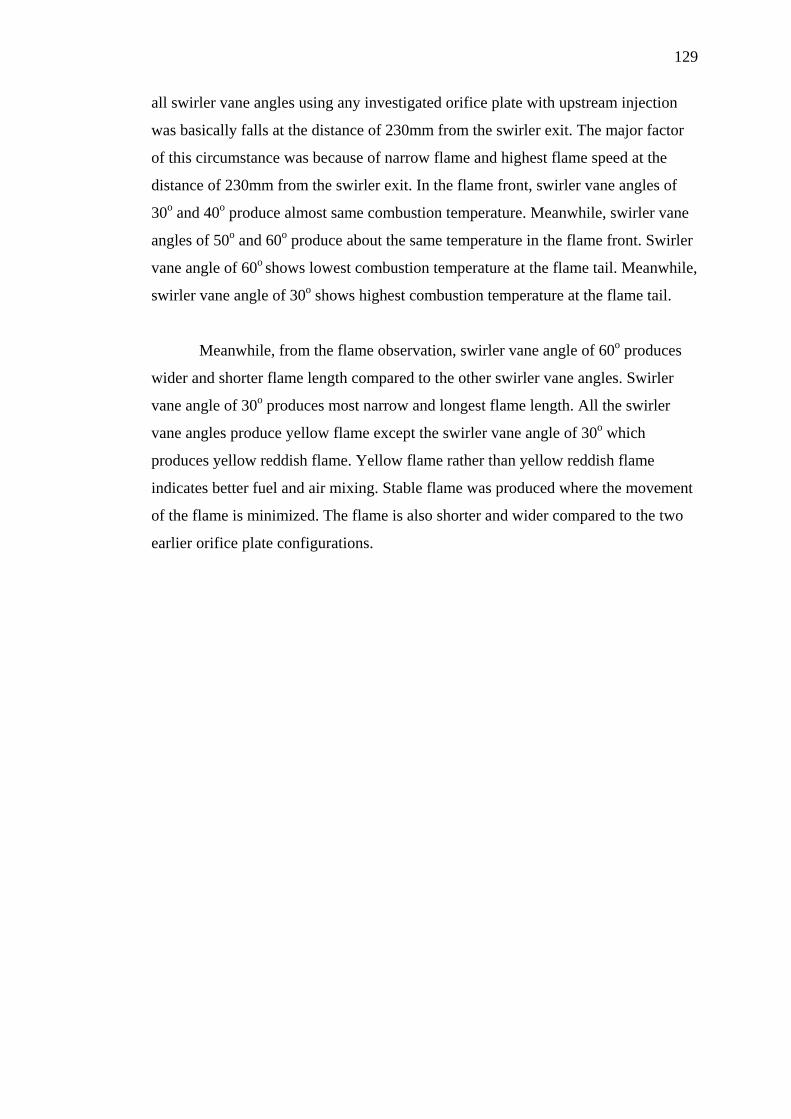
129
all swirler vane angles using any investigated orifice plate with upstream injection
was basically falls at the distance of 230mm from the swirler exit. The major factor
of this circumstance was because of narrow flame and highest flame speed at the
distance of 230mm from the swirler exit. In the flame front, swirler vane angles of
30o and 40o produce almost same combustion temperature. Meanwhile, swirler vane
angles of 50o and 60o produce about the same temperature in the flame front. Swirler
vane angle of 60o shows lowest combustion temperature at the flame tail. Meanwhile,
swirler vane angle of 30o shows highest combustion temperature at the flame tail.
Meanwhile, from the flame observation, swirler vane angle of 60o produces
wider and shorter flame length compared to the other swirler vane angles. Swirler
vane angle of 30o produces most narrow and longest flame length. All the swirler
vane angles produce yellow flame except the swirler vane angle of 30o which
produces yellow reddish flame. Yellow flame rather than yellow reddish flame
indicates better fuel and air mixing. Stable flame was produced where the movement
of the flame is minimized. The flame is also shorter and wider compared to the two
earlier orifice plate configurations.
130
6.3.10 Temperature Profile for Various Swirlers Using Orifice Plate of 30mm
with Downstream Injection at Equivalence Ratio of 0.803
400
500
600
700
800
900
1000
0 100 200 300 400 500 600 700
Axial Distance From Swirler Exit (mm)
Com
bust
ion
Tem
pera
ture
(oC
)
Swirler 30 Swirler 40 Swirler 50 Swirler 60 Figure 6.49: Combustion Temperature vs. Axial Distance from Swirler Exit for
Various Swirler Using Orifice Plate of 30mm with Downstream Injection at
Equivalence Ratio of 0.803
Figure 6.49 shows combustion temperature as a functional of the axial
distance from swirler exit. The figure shows relationship of combustion temperature
between swirler vane angles of 30o, 40o, 50o and 60o using orifice plate of 30mm
with downstream injection. Temperature of less than 1000oC was exhibited in this
figure for all swirler vane angles indicating that thermal NO mechanism for NOx
formation was prevented. Swirler vane angle of 30o produces highest temperature
along the chamber. This is followed by swirler vane angles of 40o and 50o at the
flame front. At the flame front, lowest temperature was exhibited by swirler vane
angle of 60o. Meanwhile, swirler vane angle of 40o shows lowest temperature at the
combustor exit. The highest temperature point for all swirler vane angles is shifted to
the distance of about 350mm from the swirler exit using downstream injection
configuration. The circumstances of these phenomena were explained in section
6.4.3. However, for swirler vane angles of 50o and 60o, highest temperature was
exhibited at the distance of about 400mm from the swirler exit.
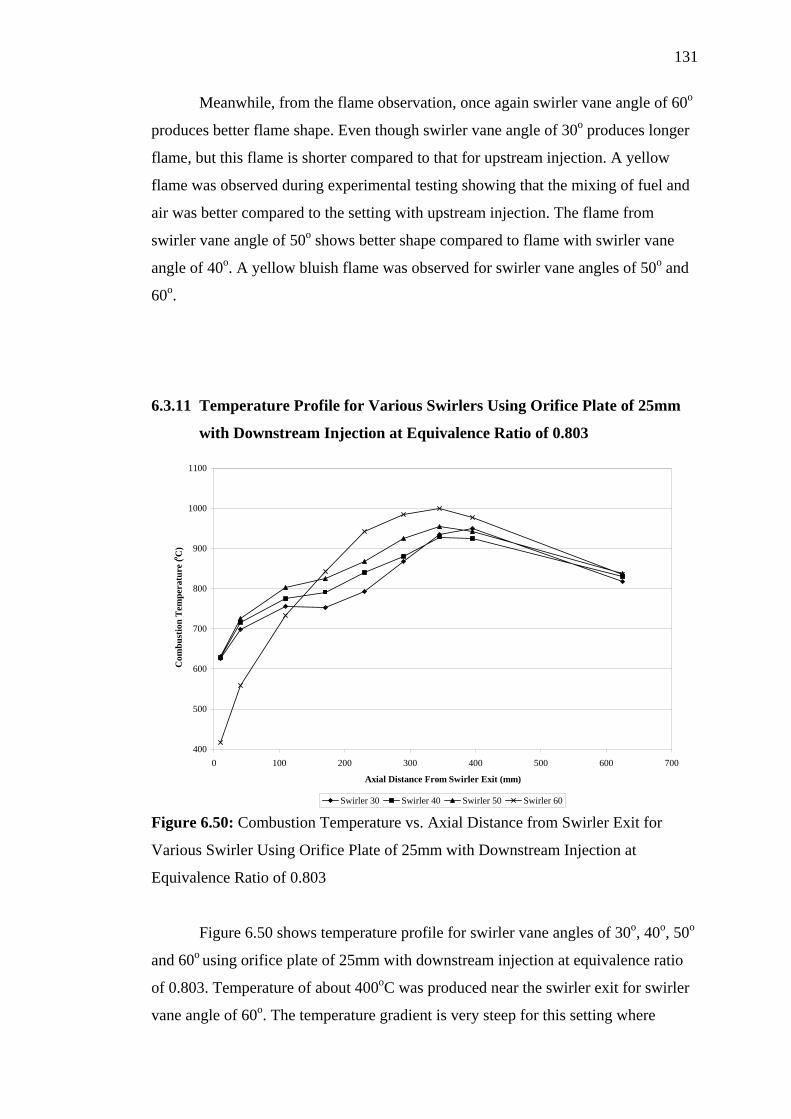
131
Meanwhile, from the flame observation, once again swirler vane angle of 60o
produces better flame shape. Even though swirler vane angle of 30o produces longer
flame, but this flame is shorter compared to that for upstream injection. A yellow
flame was observed during experimental testing showing that the mixing of fuel and
air was better compared to the setting with upstream injection. The flame from
swirler vane angle of 50o shows better shape compared to flame with swirler vane
angle of 40o. A yellow bluish flame was observed for swirler vane angles of 50o and
60o.
6.3.11 Temperature Profile for Various Swirlers Using Orifice Plate of 25mm
with Downstream Injection at Equivalence Ratio of 0.803
400
500
600
700
800
900
1000
1100
0 100 200 300 400 500 600 700
Axial Distance From Swirler Exit (mm)
Com
bust
ion
Tem
pera
ture
(o C)
Swirler 30 Swirler 40 Swirler 50 Swirler 60 Figure 6.50: Combustion Temperature vs. Axial Distance from Swirler Exit for
Various Swirler Using Orifice Plate of 25mm with Downstream Injection at
Equivalence Ratio of 0.803
Figure 6.50 shows temperature profile for swirler vane angles of 30o, 40o, 50o
and 60o using orifice plate of 25mm with downstream injection at equivalence ratio
of 0.803. Temperature of about 400oC was produced near the swirler exit for swirler
vane angle of 60o. The temperature gradient is very steep for this setting where
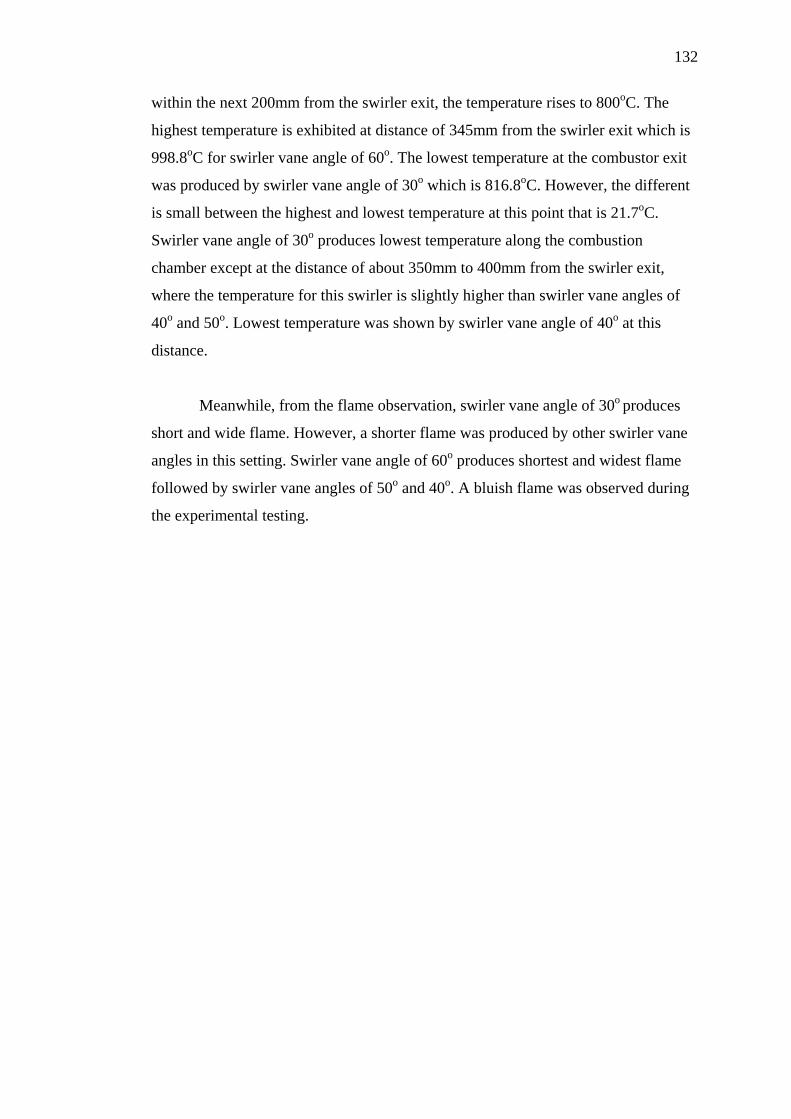
132
within the next 200mm from the swirler exit, the temperature rises to 800oC. The
highest temperature is exhibited at distance of 345mm from the swirler exit which is
998.8oC for swirler vane angle of 60o. The lowest temperature at the combustor exit
was produced by swirler vane angle of 30o which is 816.8oC. However, the different
is small between the highest and lowest temperature at this point that is 21.7oC.
Swirler vane angle of 30o produces lowest temperature along the combustion
chamber except at the distance of about 350mm to 400mm from the swirler exit,
where the temperature for this swirler is slightly higher than swirler vane angles of
40o and 50o. Lowest temperature was shown by swirler vane angle of 40o at this
distance.
Meanwhile, from the flame observation, swirler vane angle of 30o produces
short and wide flame. However, a shorter flame was produced by other swirler vane
angles in this setting. Swirler vane angle of 60o produces shortest and widest flame
followed by swirler vane angles of 50o and 40o. A bluish flame was observed during
the experimental testing.
133
6.3.12 Temperature Profile for Various Swirlers Using Orifice Plate of 20mm
with Downstream Injection at Equivalence Ratio of 0.803
500
600
700
800
900
1000
0 100 200 300 400 500 600 700
Axial Distance From Swirler Exit (mm)
Com
bust
ion
Tem
pera
ture
(o C)
Swirler 30 Swirler 40 Swirler 50 Swirler 60 Figure 6.51: Combustion Temperature vs. Axial Distance from Swirler Exit for
Various Swirler Using Orifice Plate of 20mm with Downstream Injection at
Equivalence Ratio of 0.803
For this setting, swirler vane angle of 60o shows lowest combustion
temperature along the combustion chamber except at the distance of 10mm from the
swirler exit, where swirler vane angle of 30o produces lowest temperature. Producing
lower temperature was good in term of preventing the risk of thermal NOx formation.
However, low temperature also could be because of less homogeneous mixing of fuel
and air. However, in present situation, the lower temperature was caused by uniform
distribution of air and fuel mixing which reduces the flame speed at highest
temperature point. This is because less homogeneous mixing of air and fuel would
generate high CO emission which is contradictory with these experimental results. At
the flame front, swirler vane angle of 30o produces lower temperature compared to
swirler vane angle of 50o. Meanwhile, swirler vane angle of 40o shows highest
temperature at the flame front. About 300mm from the combustor exit, temperature
for swirler vane angles of 30o and 40o shifted place where swirler vane angle of 30o
produces highest temperature among all other swirler vane angles. Once again the
134
highest temperature for all swirler vane angles located at distance of 345mm from
swirler exit.
Meanwhile, from the flame observation, swirler vane angle of 60o produces
the shortest and widest flame. It could be concluded that, the flame for swirler vane
angle of 60o using orifice plate of 20mm with downstream injection was the shortest
and widest compared to all other settings. Swirler vane angle of 30o produces longer
and narrower flame in this setting. However, the flame is much shorter compared to
the other settings that were discussed before. The flame was also blue in colour
indicating that the best fuel and air mixing was produced by swirler vane angle of 60o
using orifice plate of 20mm with downstream injection. Swirler vane angle of 50o
produces shorter and wider flame compared to swirler vane angle of 40o.
6.4 Discussion on Combustion Temperature Profile
As shown previously, combustion temperature was highest at the middle
section of the combustion chamber. Generally for swirler vane angle of 30o, the
highest temperature point exist further downstream of the combustion chamber
compared to the other swirler vane angles for all setting. This is followed by swirler
vane angles of 40o, 50o and 60o, respectively. The highest peak temperature for
swirler vane angle of 60o was the nearest to the swirler exit. This shows that swirler
vane angle of 60o produces shortest flame amongst all, meanwhile swirler vane angle
of 30o produces longest flame amongst all. This is due to better mixing of fuel and air
produced in higher swirler vane angle. Higher swirler vane angle generates bigger
reverse flow zone and widen the flame angle which in turn reduce the flame length
(Morcos, V.H. and Abdel-Rahim, Y.M., 1999). Besides that, swirler vane angle of
60o produces lowest discharge temperature compared to other swirler vane angles.
This is followed by swirler vane angles of 50o, 40o and 30o. This shows that bigger
swirler vane angles do reduce the overall flame temperature.
Orifice plate insertion does not show any significant different on the flame
length even though smaller orifice plate exhibit shorter and wider flame due to bigger
135
swirler pressure drop at the swirler outlet phase which maximizes the swirler outlet
shear layer turbulence (Escott, N.H., 1993). However, smaller orifice plate
configuration did reduce the peak temperature of the flame. Even though this does
not apply for all settings, it does apply for most of the settings. Orifice plate of 30mm
with upstream injection exhibit high peak temperature exceeding 1000oC for all
swirler vane angles except for swirler vane angle of 60o which produces highest peak
temperature of 950.1oC. Meanwhile, for upstream injection, other orifice plate
configurations produce flame temperature of less than 1000oC for all swirler vane
angles except for swirler vane angle of 60o with orifice plate of 25mm which shows
highest peak temperature of 1010.5oC. For downstream injection, all swirler vane
angles with orifice plate of 20mm and 25mm produce flame temperature of less than
1000oC. Flame temperature of more than 1000oC was exhibited for swirler vane
angle of 60o with orifice plate of 25mm and 30mm. Smaller orifice plates exhibit
higher flame temperature compared to the bigger ones. This was aligned with Kim’s
(1995) suggestion. However, in upstream injection, orifice plate of 20mm shows
lower temperature than orifice plate of 25mm.
Beside these two aspects, equivalence ratio does play the key role on the
flame length characteristic. Even though the peak temperature was almost the same
for all equivalence ratios for a particular setting, but fuel lean equivalence ratios
produce shorter flame length. This could be because of more air is present in the
chamber which completes the combustion earlier compared to fuel rich equivalence
ratios. Fuel rich equivalence ratios produce longest flame length because more fuel
and less air exist in the combustion chamber forces the flame to increase its length to
complete its combustion outside the chamber. At fuel lean equivalence ratio below
0.8, the flame was short and narrow. The flame then gets wider with gradual increase
in flame length with the increase of equivalence ratio. Once the flame reaches it peak
temperature limit, further increase of equivalence ratio shows decrease of flame
angle and rapid increase in flame length.
Besides that, downstream injection also shows shorter flame length compared
to upstream injection. Downstream injection exhibit lower peak temperature
compared to upstream injection. More complete combustion was exhibited with
downstream injection rather than upstream injection as the flame produced was blue
136
in colour shows fuel was burned completely. Yellow and reddish flame as exhibited
in upstream injection indicated that there are some fuel was left unburned. Wider
flame was also exhibited with downstream injection. This might be because of
downstream injection provides steeper boundary of velocity gradients and higher
intensity turbulence between the forward flow and the reverse flow zone that
promotes high entrainment rates and rapid mixing between the fuel and air.
However, all variation that has been studied does share the same factor to
improve both fuel atomization process and mixing between fuel and air, causing
intensive combustion with short flame.
6.5 Comparison on Varying Orifice Plate Diameter and Injection Position
Orifice plate of 20mm with downstream injection produces lowest emissions
compared to the other settings. The NOx emission was reduced about 17 percent for
orifice plate of 20mm with upstream injection compared to orifice plate of 25mm
with same injection position. Orifice plate of 30mm with upstream injection exhibit
lower NOx emission compared to orifice plate of 25mm with upstream injection at
equivalence ratio of 0.803. However, this result does not reflect the overall
comparison. NOx emission was higher with orifice plate of 30mm compared to the
orifice plate 25mm for all of the equivalence ratios except at equivalence ratios of
0.803 and 0.888. NOx emission at equivalence ratio of 0.888 was the same for both
orifice plates.
CO emission was reduced about 23 percent and 29 percent for orifice plates
of 25mm and 20mm with upstream injection respectively compared to orifice plate
of 30mm with upstream injection. The CO emission reduction of less than 10ppm
was obtained between orifice plate of 25mm and 20mm with upstream injection.
Same pattern of emission results was shown in SO2 emission where orifice
plate of 30mm exhibits highest emission while orifice plate of 20mm exhibits lowest
emission in upstream injection position. Orifice plate of 30mm with upstream
137
injection produces 71 ppm of SO2 emission, which was reduced to 66 ppm when
orifice plate of 25mm with upstream injection was used. The emission was further
reduced about 24 percent when replaced with orifice plate of 20mm at the same
injection point.
In downstream injection, NOx emission was reduced about 24 percent for
orifice plate of 25mm compared to orifice plate of 30mm. Meanwhile, NOx emission
reduction about 59 percent was achieved for orifice plate of 20mm compared to
orifice plate of 30mm. Lowest NOx emission was achieved by this setting that is 7
ppm.
CO emission also shows emission improvement when smaller orifice plate
was used. CO emission of less than 100 ppm was obtained using orifice plates of
25mm and 20mm for both injection positions. CO emission decreased about 33
percent for orifice plate of 25mm with downstream injection compared to orifice
plate of 30mm with downstream injection. Further decrease in orifice plate diameter
to 20mm reduced CO emission to 66 ppm.
Meanwhile, SO2 emission in downstream injection shows 2 ppm rise in
emission for orifice plate of 25mm compared to orifice plate of 30mm at equivalence
ratio of 0.803. This was apparent for all equivalence ratios. Further decrease in
orifice plate diameter increases the SO2 emission. In downstream injection, highest
SO2 emission was shown by orifice plate of 20mm that is 22 ppm.
Meanwhile from the point of injection position, for orifice plate of 30mm,
CO emission and SO2 emission show reduction in emission results while NOx
emission shows rise in emission results. When using orifice plate of 30mm, CO
emission and SO2 decrease about 16 percent and 89 percent respectively for
downstream injection compared to upstream injection. The NOx emission rise was 4
ppm for orifice plate of 30mm with downstream injection compared to orifice plate
of 30mm with upstream injection. However, NOx emission actually decreases for all
other equivalence ratios for orifice plate of 30mm with downstream injection
compared to orifice plate of 30mm with upstream injection except for equivalence
ratio of 0.803.
138
NOx emission was also reduced about 28 percent for orifice plate of 25mm
with downstream injection compared to orifice plate of 25mm with upstream
injection. The CO emission for this orifice plate was almost the same where
upstream injection configuration shows CO emission of 90 ppm while downstream
injection configuration shows higher 7 ppm at 97 ppm of CO emission. At
equivalence ratios from 0.649 to 0.803, orifice plate of 25mm with upstream
injection produces lower CO emission compared to orifice plate of 25mm with
downstream injection. Meanwhile SO2 emission dropped about 85 percent for orifice
plate of 25mm with downstream injection compared to orifice plate of 25mm with
upstream injection. The SO2 emission different between these two settings was 56
ppm.
Downstream injection configuration shows lower NOx emission compared to
upstream injection configuration for orifice plate of 20mm. NOx emission was
reduced about 53 percent for orifice plate of 20mm with downstream injection
compared to the upstream injection. CO emission was reduced to 66 ppm from 88
ppm, which is about 25 percent reduction for downstream injection compared to
upstream injection for orifice plate of 20mm. Meanwhile, SO2 emission was reduced
about 56 percent for orifice plate of 20mm downstream injection compared to orifice
plate of 20mm with upstream injection.
CHAPTER VII
CONCLUSION AND RECOMMENDATION
FOR FUTURE WORK
7.1 General Conclusions
Swirler could support combustion over a wide range of operating conditions
through the generation of central recirculation zone that is formed when the vortex
breakdown occur. Turbulence effect in the combustion chamber also could be
generated by increasing the blockage or pressure drop of the swirler (Kim, M.N.,
1995). Swirlers produce rapid fuel and air mixing which also creates turbulence
effect in the combustion chamber. Swirling flow induces a highly turbulent
recirculation zone which stabilizes the flame resulting in better mixing and
combustion. Another effect of swirl is to decrease the velocity gradient at the exit of
burner thus causing a faster decay of the velocities in the flow field with increase the
swirl flow (Kim, M.N., 1995). Besides that, swirl reduces both flame lengths and
flame attachment lengths and consequently shortens the combustion chamber length
necessary for complete combustion. Swirl also promotes high combustion efficiency,
easy ignition, reactant recirculation zone residence time, pollutant optimisation
potential, widened stability and blow off (Escott, N.H. 1993). Besides that,
recirculation vortex produced by swirl acts as a heat source forcing combustion
product to move upstream and mix with the partially premixed reactant. This
increases the amount of contact between fuel, air and hot combustion products.
140
Orifice plate, on the other hand, reduces the pressure at the swirler outlet
phase, so that the swirler outlet shear layer turbulence was maximized to assist in
mixing of fuel and air. Outlet orifice or swirler shroud also creates the flow pressure
loss at the outlet plane rather than in the vane passage which maximizes the shear
layer turbulence. Orifice plate insertion also increases the total pressure loss and thus
for a specific orifice plate the airflow was reduced with decreasing orifice diameter.
Smaller orifice sizes enhance better mixing due to improved upstream mixing.
Beside that, orifice plate insertion helps to prevent fuel from entraining into the
corner recirculation zone that will create local rich zone thus generates lower NOx
emission by eliminating locally rich region (Al-Kabie, H.S., 1989). Locally rich
region tends to generate locally high NOx emission that contributes to overall high
NOx emission. Smaller orifice plates outlet do increase the velocity of the air and fuel
at the swirler shroud thus reduce the risk of flashback. However, this velocity should
not be to high as lift off could occur and cause blow off of combustion. The increase
in velocity also would increase the Reynolds number which increases the strength of
turbulence effect and thus reduces the combustions residence time. Other than that,
from the aerodynamic factor, air and fuel mixing rate increases as the pressure drop
in the swirler outlet increases (Escott, N.H., 1993).
Meanwhile, proper injection positions assist in more complete combustion.
Better mixing of fuel and air was enhanced in the downstream injection as the fuel,
which enters the combustor, was in turbulence flow. Meanwhile in upstream
injection, the fuel goes through a laminar flow before changing to turbulence flow.
Downstream injection provide steeper boundary of velocity gradients and higher
intensity turbulence between the forward flow and the reverse flow zone, that
promotes high entrainment rates and rapid mixing between the fuel and air. Due to
high entrainment and increased mixedness of the jets, flame length was reduced
while increasing the diameter of the flame. This resulted in a more complete
combustion (Escott, N.H., 1993).
141
7.2 Conclusion on Combustion Performance
From the results obtained, orifice plate of 20mm produced best emission
results compared to orifice plates of 25mm and 30mm. This proved that orifice plate
does help to create the swirler pressure loss at the swirler outlet so that the swirler
outlet shear layer turbulence was maximized to assist in mixing of fuel and air.
Smaller orifice plate produces better emission results compared to the larger one.
Larger orifice plates produces higher local rich region near the fuel injector outlet,
which in turn generate more emissions. Smaller orifice helps to prevent fuel from
entraining into the corner recirculation zone that will create local rich zone (Kim, M.
N., 1995). Small orifice plate size enhances better mixing than the larger ones due to
improved upstream mixing. This once again could be attributed to good mixing
resulted from the smaller area that generates higher turbulence due to increased
swirling of the fuel and air mixture prior to combustion.
Besides the orifice plate effects, varying swirler vane angle also does helps in
mixing the fuel and air thoroughly prior to ignition and hence reduces emissions.
Swirler vane angle of 60o exhibit better emission results compared to other swirler
vane angles. Increasing the swirler vane angles increases the swirl intensity that helps
in promoting the mixing of fuel and air. Besides that, it also increases the reverse
flow of hot burned gases back into the burner. The high temperature of this product
serves as an energy source for preheating and ignition assistance for the incoming
fresh combustible mixture (Al-Kabie, H.S., 1989). The process goes into a cycle and
this keep the flame from extinguishing or having to ignite continuously. Varying
swirler vane angle does vary its swirl strength which was expressed in terms of swirl
number. One way of increasing the swirl number is by increasing the vane angle of
the swirler. Increasing swirler vane angle from 30o to 60o would increase the swirl
number from 0.706 to 2.534 hence increases the swirl intensity of the flow which
increases the recirculation zone length and diameter. Longer recirculation zone
provides flame stability and reduction in emissions. Yet, once the recirculation zone
achieved a certain length, further increased in swirl number will not have much
effect on the length of recirculation zone. At this point it is considered that the
central recirculation zone has been well established. However, most of the plotted
142
graphs do agree with Alkabie’s (1989) view stating that there is no significant effect
on NOx emissions by varying the vane angle from 20o to 60o.
Swirl has several important effects on combustion system. Swirler increases
the blockage or pressure drop in the combustion chamber. This pressure drop
generates turbulence, which supply rapid fuel and air mixing to promote the mixing.
Turbulence energy is created from pressure energy dissipated downstream of the
stabilizer. The most important effect of swirl in combustion process is that it
improves flame stability and extends flammability limit. From the results, higher
pressure drop was created by swirler vane angle of 60o which gives most stable
flame. This is followed by swirler vane angles of 50o, 40o and 30o. Swirler vane angle
of 30o has bigger vane opening which reduces its swirl velocity. Low swirl velocity
generates less swirler pressure drop in the chamber (Kim, M.N., 1995).
When air is tangentially introduced into the combustion chamber, it is forced
to change its path, which contributes to the formation of swirling flow. Low pressure
in the core centre of the swirling flow is retrieving the jet flow in the combustion
chamber and thus, produces the not-so-good slope of axial pressure. Meanwhile at
the optimum swirler angle, the swirl finds its own direction and as a result, swirl
vortex is formed (Nazri, 1997).
The downstream injection shows better emissions results compared to the
upstream injection. This is because better mixing of fuel and air was enhanced in the
downstream injection as the fuel, which enters the combustor, were in turbulence
flow. Meanwhile in upstream injection, the fuel goes through a laminar flow before
changing to turbulence flow. Downstream injection provide steeper boundary of
velocity gradients and higher intensity turbulence between the forward flow and the
reverse flow zone that promotes high entrainment rates and rapid mixing between the
fuel and air. Due to high entrainment and increased homogeneous mixing of the jets,
flame length was reduced while increasing the diameter of the flame. This resulted in
a more complete combustion.
In low fuel lean region, the content of carbon monoxide emission decreases
with the increase of equivalence ratio meanwhile the NOx emission rise with the
143
increase of equivalence ratio. This was anticipated due to the fact that any measure of
decreasing NOx will tend to increase CO since both emissions were on the different
side of the balance.
As for conclusion, swirler vane angle of 60o using orifice plate of 20mm with
downstream injection produces the lowest emissions results compared to other
settings in this project. Meanwhile, swirler vane angle of 30o using orifice plate of
30mm with upstream injection produces the highest emission results. Higher swirler
vane angles with smaller orifice plate configurations show lower emission results.
Meanwhile the downstream injection produces lower emission compared to the
upstream injection setting.
7.3 Conclusions on Emission Results
Even though three pollutants i.e. NOx, CO and SO2 were studied in this
project, NOx emission was the main pollutant that needs to be reduced. CO emission
could be minimized by homogeneous mixing of the fuel and air.
The relation between the combustion performance to the swirlers, orifice
plates and injection positions has been studied in the present work. All other
operating parameters were kept constant such as fuel pressure, swirling air pressure,
injection air pressure, injection air flow rate and fuel flow rate. Only swirling air
flow rate was varied.
Even though NOx emission shown by swirler vane angle of 30o using orifice
plate of 30mm with upstream injection was low at equivalence ratio of 0.803, for
overall, this swirler vane angle produces highest emissions compared to the other
setting in the present work. Highest NOx emissions shown by this setting is 61 ppm
at equivalence ratio of 0.603. Lowest NOx emission was shown by swirler vane angle
of 60o using orifice plate of 20mm with downstream injection. As mentioned earlier,
higher swirler vane angle with smaller orifice plate size exhibit better emission
144
results. Meanwhile downstream injection produces lower emission results compared
to upstream injection.
7.4 Conclusions on Temperature Profiles
The base emissions formation in the present work is Prompt NO. Thermal
NO was prevented as the combustion temperature is below 1300oC. Fuel NO
formation is also prevented as the fuel used in this study is not nitrogen bound fuel.
Higher swirler vane angles with smaller orifice plates produce shorter and
wider flame. Higher swirler vane angle with smaller orifice plate reduces flame
length that is necessary for complete combustion and generates bigger reverse flow
zone which widen the flame diameter (Morcos, V.H. and Abdel-Rahim, Y.M., 1999).
Meanwhile smaller orifice, due to improved upstream injection and maximized shear
layer turbulence, widen the flame diameter. Wider flame was also exhibited with
downstream injection. This is because downstream injection provides steeper
boundary of velocity gradients and higher intensity turbulence between the forward
flow and the reverse flow zone that promotes high entrainment rates and rapid
mixing between the fuel and air. Upstream injection configuration produces
yellowish flames indicating that there is some fuel left unburned and incomplete
combustion. Meanwhile downstream injection configuration produces bluish flames
indicating more complete combustion occur in this phase. The highest temperature
point or peak temperature occurs further downstream of combustion chamber for
orifice plate of 30o compared to other swirler vane angles. Peak temperature for
swirler vane angle of 60o was the nearest to swirler outlet. Smaller orifice plate also
does reduce the peak temperature thus reduce the NOx emission. NOx emission
increases parallel with temperature rise.
145
7.5 Recommendation for Future Work
The present work shows higher swirler vane angle produces better emission
results. However, past researchers do agree that there is an optimum swirler vane
setting where further increase in swirler vane angle increases the emissions. More
swirler vane angles should be studied to investigate this optimum setting such as 70o
and 80o. Besides that, more precise swirler vane angle degree should take into
consideration. Rather than studies between swirler angle of 50o and 60o, swirler vane
angles of 51o, 52o, 58o, 59o should also be considered to produce optimum swirler
vane setting. Besides that, varying the swirler vane depth would also provide some
extra advantages on emission reduction.
Meanwhile, from the injection mode, present work employs a single 1mm
hole. Smaller diameter holes should also be considered to produce smaller fuel
droplet and atomization of fuel could easily be established. Besides that, comparison
between single and multiple injector holes could also be studied. Wall injection and
vane passage injection may also be considered in the future work.
The measurement of local velocity profiles and the turbulent intensities of the
combustor flow field especially that near the swirler outlet will add crucial
information to the present experimental and theoretical results.
146
REFERENCES
Ahmad, N.T., Andrews, G.E., Kowkabi, M. and Sharif, S.F. (1986). International
Journal Turbo and Jet Engines, 3, pp. 319-329.
Al-kabie, H.S., Andrews, G.E. & Ahmad, N.T. (1988). Lean Low NOx Primary
Zones using Radial Swirlers. ASME. 88-GT-245.
Al-Kabie, H.S. (1989). Radial Swirlers for Low Emissions Gas Turbine
Combustion. University of Leeds, Dept. of Fuel & Energy: PhD.
Aurther H. Lefebvre. (1983). Gas Turbine Combustion. Hemisphere Publishing
Corporation.
Beer,J.M. and N.A. Chigier. (1972). Combustion Aerodynamics. Applied Science
Publishers Ltd.
Blas, Luis Javier Molero de. (1998). Pollution Formation and Interaction in the
Combustion of Heavy Liquids Fuels. University of London, England. PhD.
Blazowski, W.S. and Walsh, D.E. (1975). Catalytic Combustion: An Important
Consideration for Future Applications. Combustion Science Technologies. Vol.
10. pp. 233-244.
Chervinskey, A. and Manheimertiment, Y. (1968). Effect of Swirl on Flame
Stabilization. Israel Journal of Technology. Vol. 6. No. 2. pp 25-31.
Claypole, T.C., and Syred, N. (1981). The Effect of Swirl Burner Aerodynamics on
NOx Formation. Eighteenth Symposium (International) on Combustion, pp.81-89.
Clements, T.R. (1976). Effects of Swirling Flow on Augmentor Performance,
Phase 1 and 2, NASA-CR-135024.
Collete, R.J. (1985). Update on NOx Emission Control Technology at Combustion
Engineering. Joint Symposium on Stationery Combustion NOx Control. EPRI.
Cremer, M.A., Adams, B.R., Boll, D.E. and O’Connor, D.C. (2002). Demonstration
of Rich Reagent Injection for NOx Control in AmerenUE’s Sioux Unit 1.
Reaction Engineering International. Salt Lake City.
Crutzen, P. J. (1970). The Influence of Nitrogen Oxides on the Atmospheric Ozone
Content. Quarterly Journal of the Royal Meteorological Society. Vol. 96. pp.
320-325.
147
Escott, N.H. (1993). Ultra Low NOx Gas Turbine Combustion Chamber Design.
University of Leeds, Dept. of Fuel & Energy: PhD.
Fenimore, C.P. (1970). Formation of Nitric Oxide in Premixed Hydrocarbon Flames.
13th Symposium (International) on Combustion. The Combustion Institute.
Pittsburgh. Pp. 373-380.
Flagan, R.C. & Seinfeld, J.H. (1988). Fundamental of Air Pollution Engineering.
Prentice Hall.
Fricker, N. & Leuckel, W. (1976). The characteristic of Swirl Stabilized Natural
Gas Flames Part 3 ; The effect of Swirl and Burner Mouth Geometry on Flame
Stability. Journal of the Institute of Fuel. pp 152-158.
Goddard, P.R. (1996). Reburning. University of Leeds, Dept. of Fuel & Energy:
PhD.
Hoe, Y.M. (2000). Fuel Injection Design and Development for a Combustor.
Universiti Teknologi Malaysia. B. Eng.
Jamieson, J.B. (1990). Twenty-first Century Aero Engine Design: The Enviromental
Factor. Proc. Inst. Mech. Engrs. Vol. 204. pp. 119-134.
Jeffs, E. (1992). Gas Turbine Show: ASME Stresses Low Emissions and High
Efficiency. Turbomachinery International.
Kaiman Lee. (1973). Air Pollution: Its Effect on The Urban Man And His
Adaptive Strategies. Bolton. Environmental Design and Research Centre.
Kim, M.N. (1995). Design Of Low NOx Gas Turbine Combustion Chamber.
University Of Leeds, Dept. of Fuel & Energy: PhD.
Krill, W.V., Kesselring, J.P. and Chu, E.K. (1979). Catalytic Combustion for Gas
Turbine Applications. ASME paper 70-GT-188: Gas Turbine Conference Exhibit
and Solar Energy Conference. San Diego.
Leuckel, W. (1967). Swirl Intensities, Swirl Types and Energy losses of Different
Swirl Generating Devices. IFRF Document. No. GO2/a/16
Leonard, G. and Stegmaier, J. (1993). Development of an Aeroderivative Gas
Turbine Dry Low Emissions Combustion System. ASME Paper 93-GT-288.
Lyon, R.K. (1975). U.S. Patent No. 390000554.
Masataka Arai. (2000). Flue Gas Recirculation for Low NOx Combustion System.
2000 International Joint Power Generation Conference. Florida.
McLaughlin, B.R., Jones Jr., E.A. and Lewis, E.C. (1997). Selective Catalyst
Reduction (SCR) Retrofit at San Diego Gas and Electric Company South Bay
148
Generation Station. EPRI-DOE-EPA Combined Utility Air Pollution Control
Symposium. Washington.
Mellor, A. M., Anderson, R, D., Altenkirch, R. A. and Tuttle, J. H. (1972). Emissions
From and Within an Allison J-33 Combustor. Combustion Science Technology.
Vol. 6. pp. 169-176.
Mellor, A.M. (1990). Design of Modern Turbine Combustor. Nashville, USA.
Academic Press Limited.
Mestre, A. (1974). Efficiency and Pollutant Formation Studies in a Swirling Flow
Combustor, The American Society of Mech.Engineers, New York.
Mikus, T. and Heywood, S.B. (1971). The Automotive Gas Turbine and Nitric Oxide
Emissions. Combustion Science Technology. Vol 24. pp. 149-158.
Mohammad Nazri. (1997). Emissions from Gas Burners, Their Impact on the
Environment and Abatement Techniques. Jurnal Mekanikal. Jilid I. pp. 50-70.
Morcos, V.H. and Abdel-Rahim, Y.M. (1999). Parametric Study of Flame Length in
Straight and Swirl Light Fuel oil Burners. Journal of the Institute of Fuel. Pp.
979-985.
Ralph D. Bent & James L. Mckinlay. (1985). Aircraft Power Plants 5th Edition.
McGraw Hill Book Company.
Sothern, A. (1979). Emission from Gas Turbine Lecture prepared for a short
course on Emission from Combustion Processes. Leeds. University of Leeds.
Syred, N. and Dahman, K.R. (1965). Effect on High Confinement upon the
Aerodynamics of Swirl Burners. Journal of Energy. pp 111-127
Syred, N. and Beer, J.M. (1974). Combustion in Swirling Flows: A Review.
Combustion and Flame. Vol. 23. pp. 143-201.
Treager, I.E. (1995). Aircraft Gas Turbine Engine Technology. 3rd Ed. Glencoe
McGraw-Hill, Inc.
Willis, J.D., Toon, I.J., Schweiger, T. and Owen, D.A. (1993). Industrial RB211 Dry
Low Emission Combustion. ASME Paper 93-GT-391.
Wu, H. L. and Fricker, N. (1976). The Characteristic of Swirl Stabilized Natural
Gas Flames Part 2; The Behaviour of Swirling Jet Flames in a Narrow
Cylindrical Furnace. Journal of the Institute of Fuel. pp. 144-151.
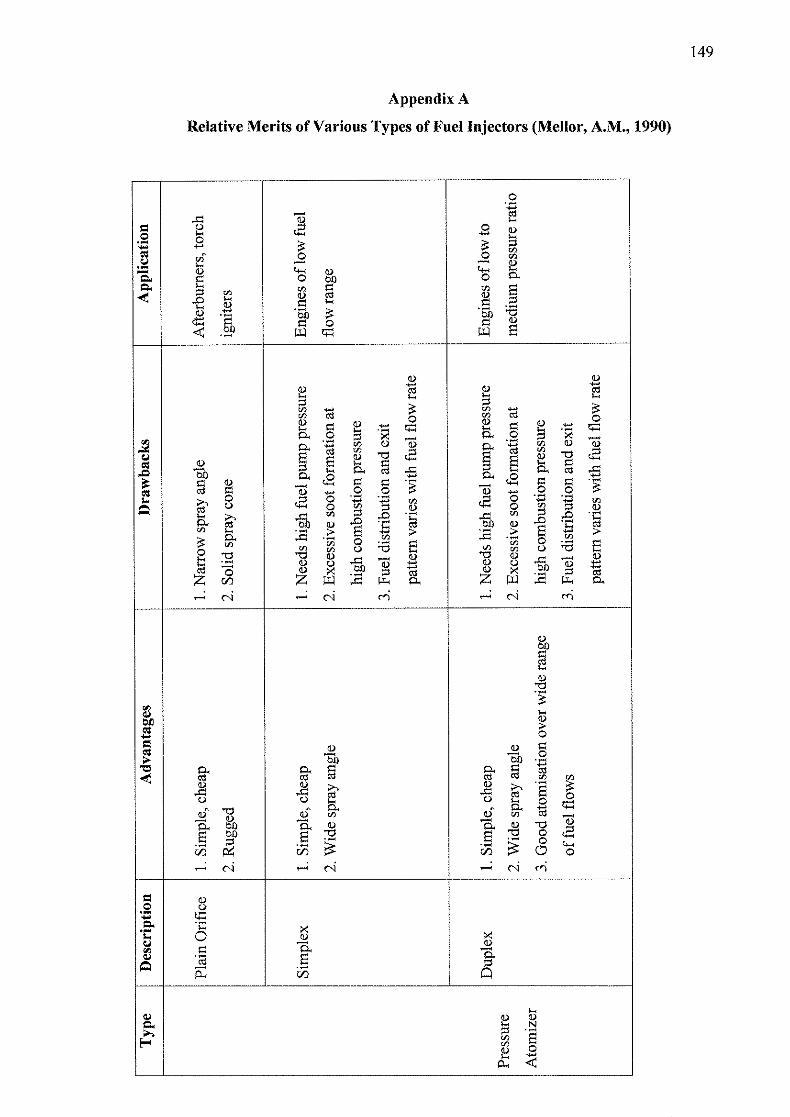
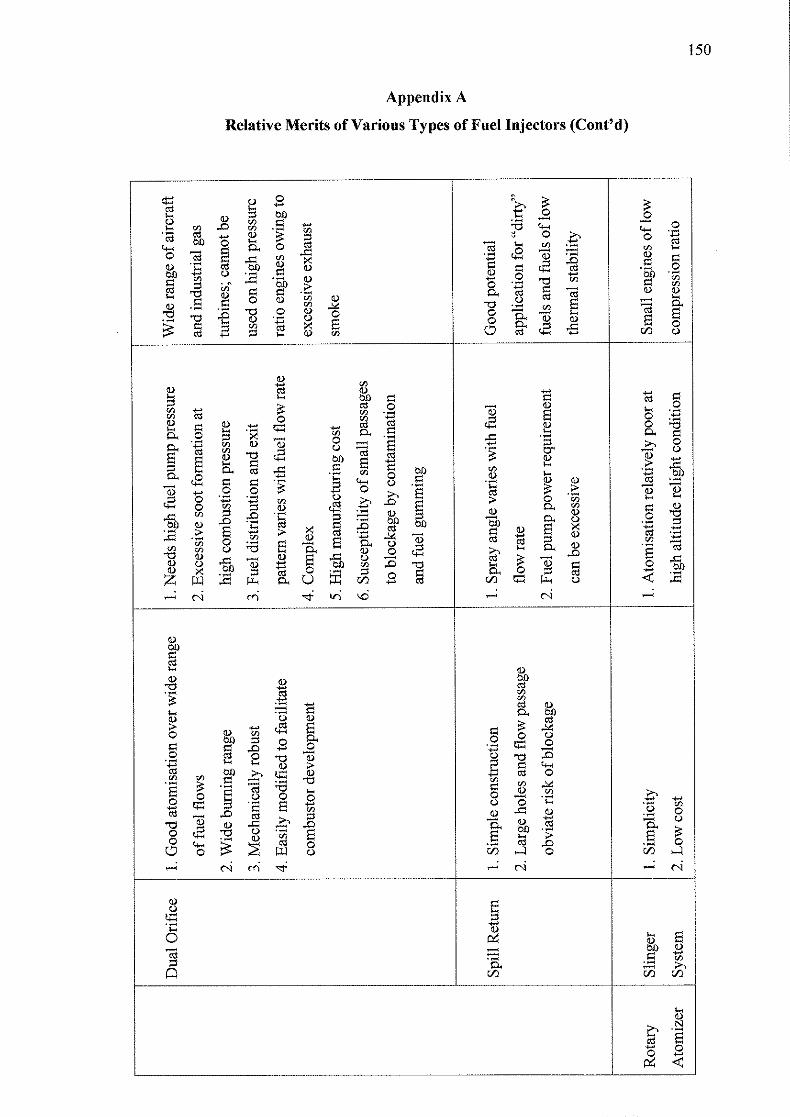
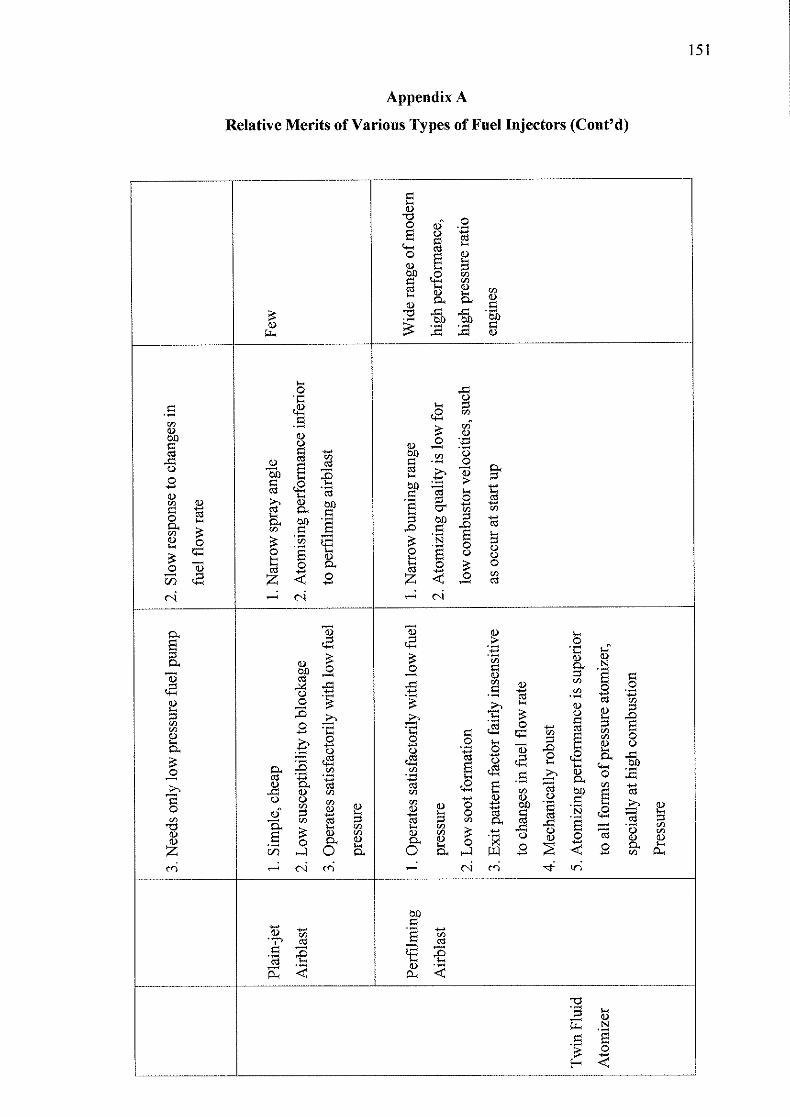
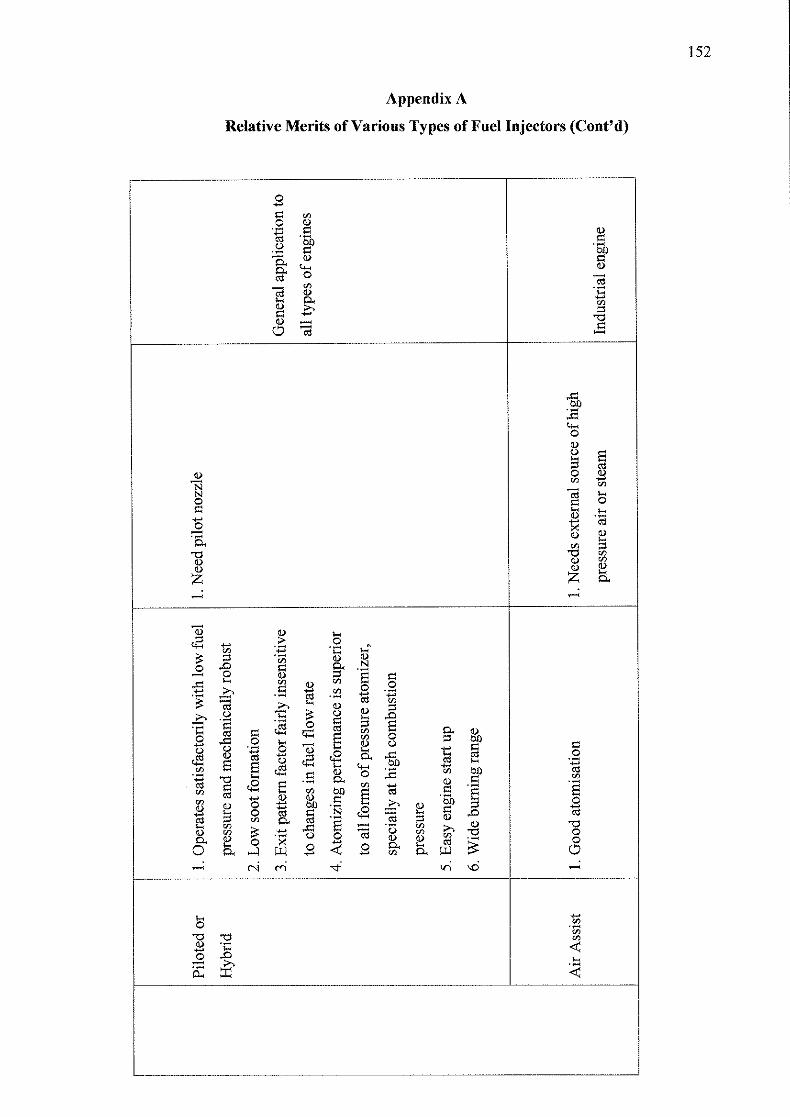
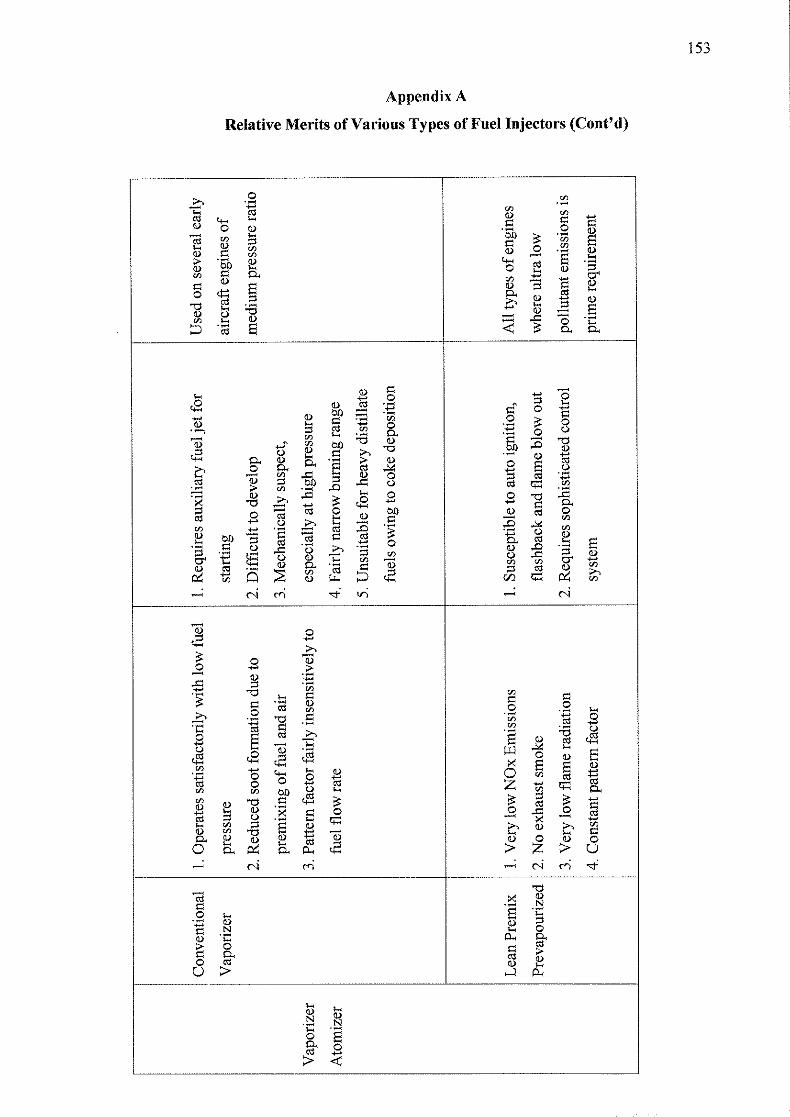
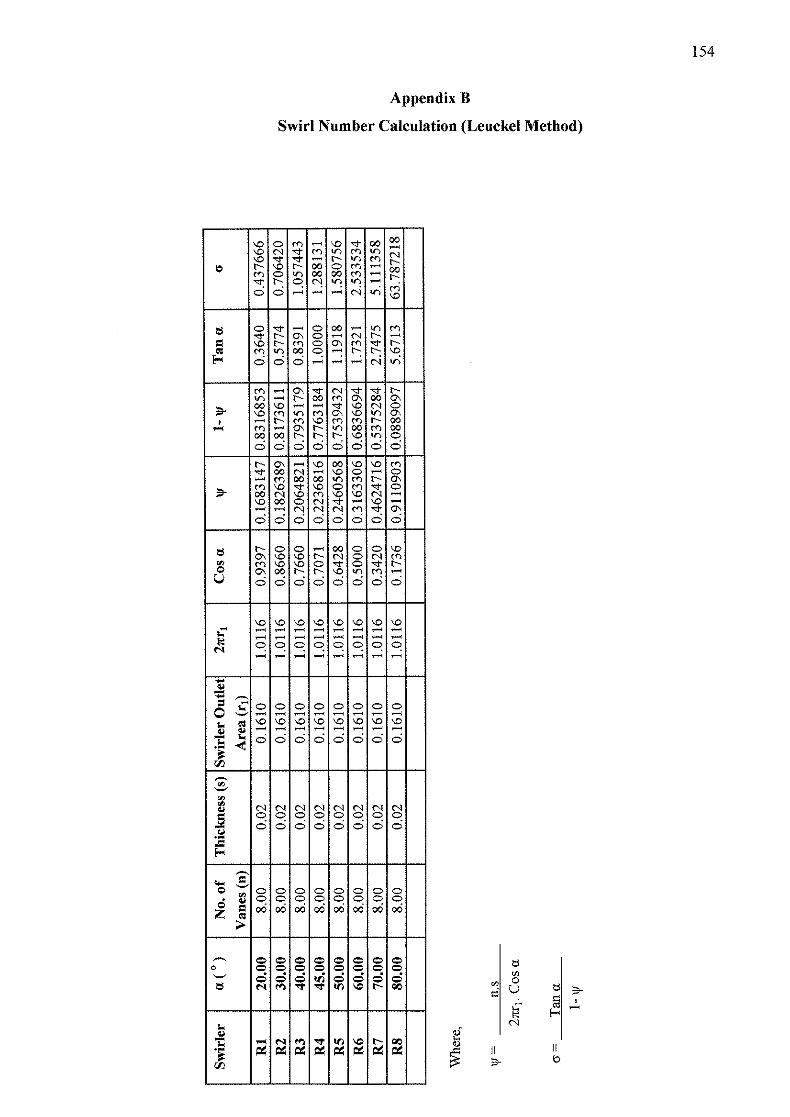
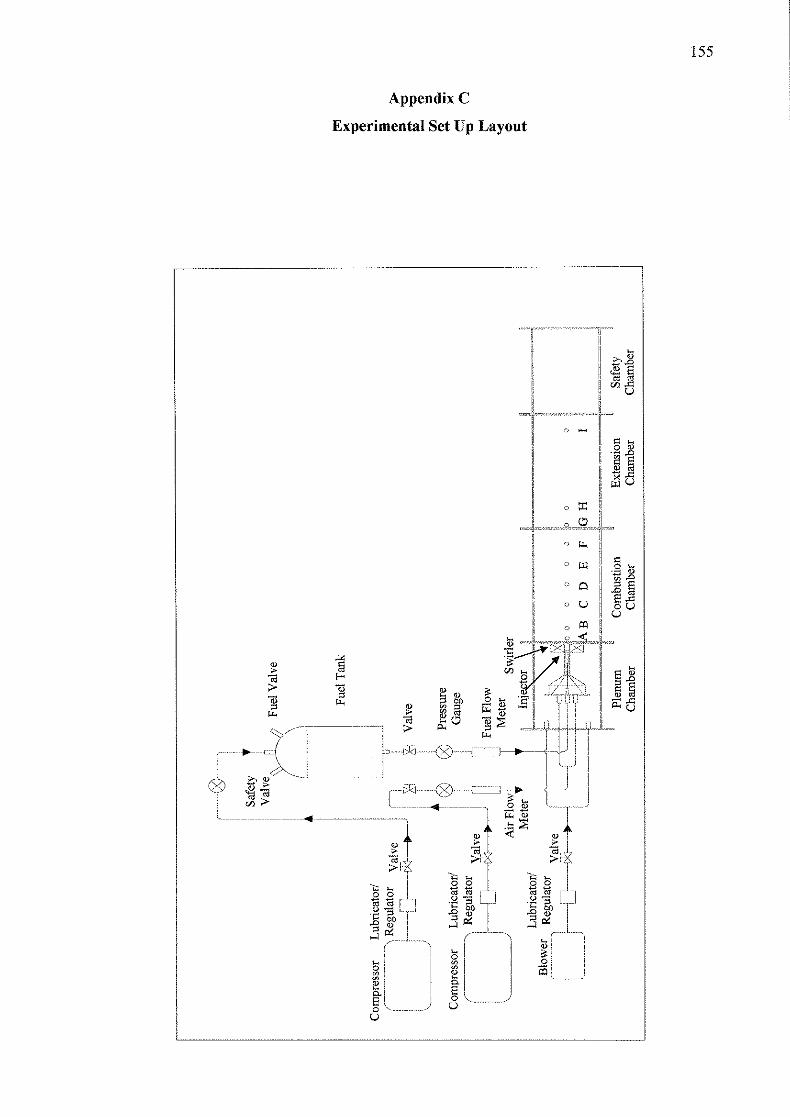
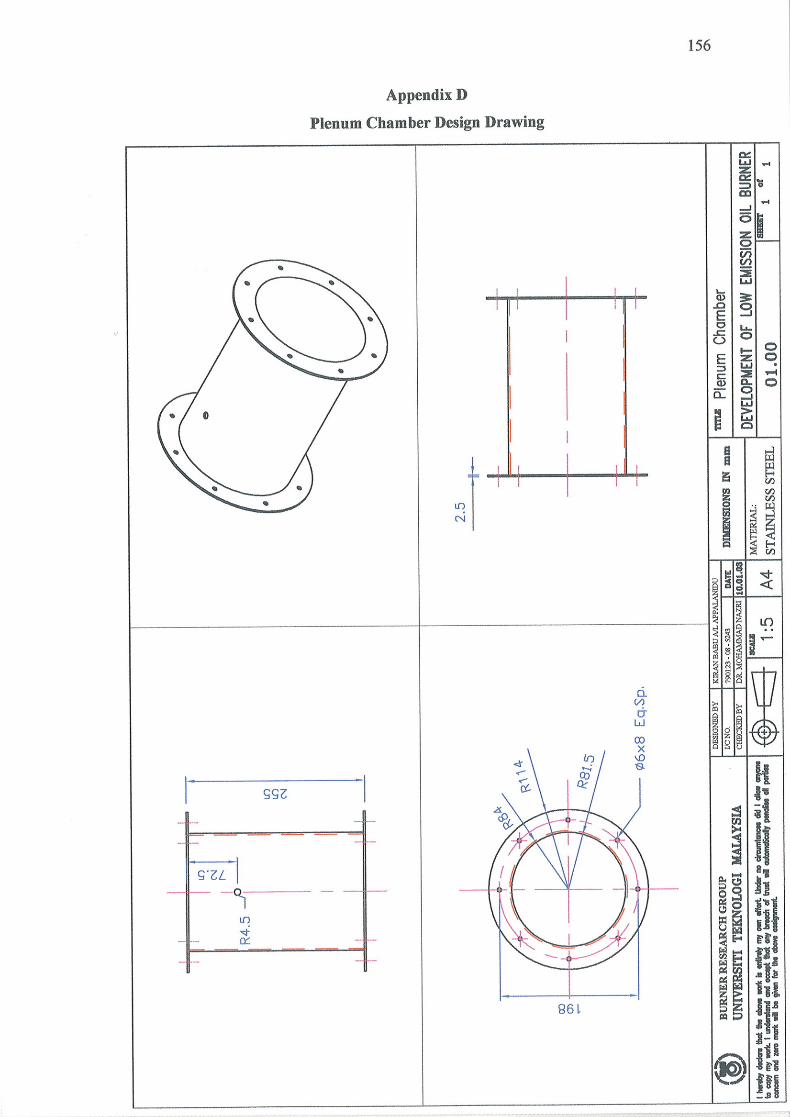
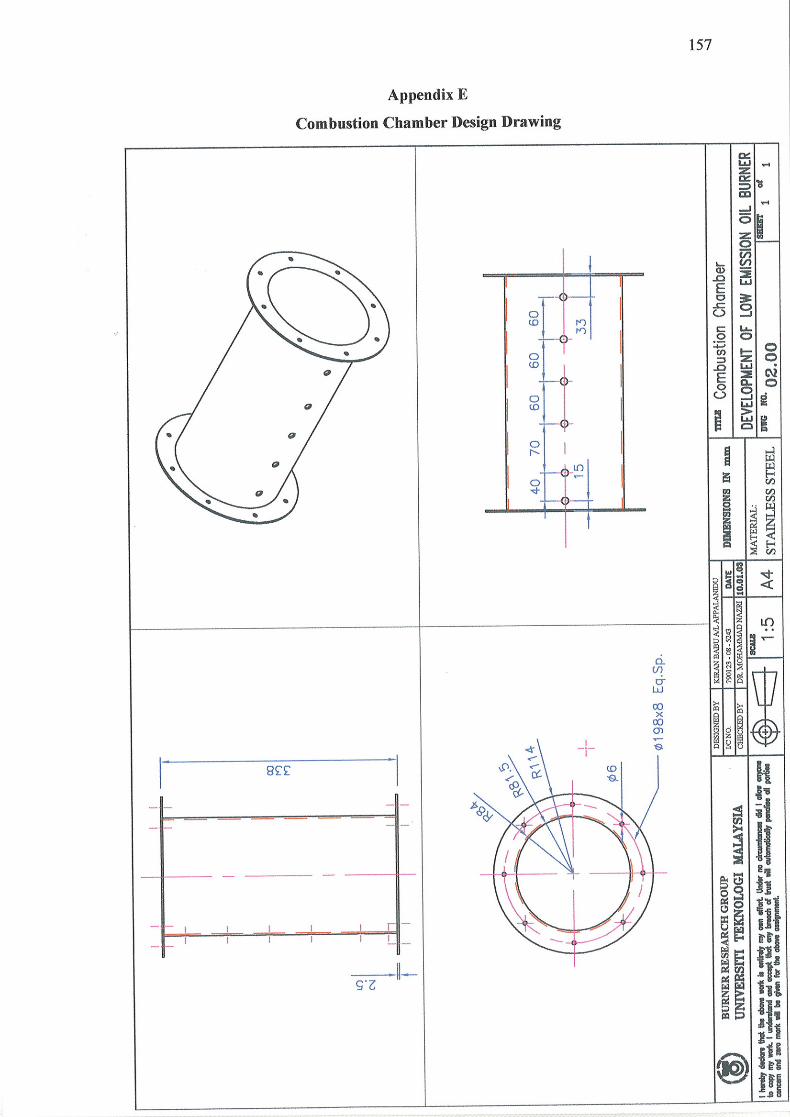
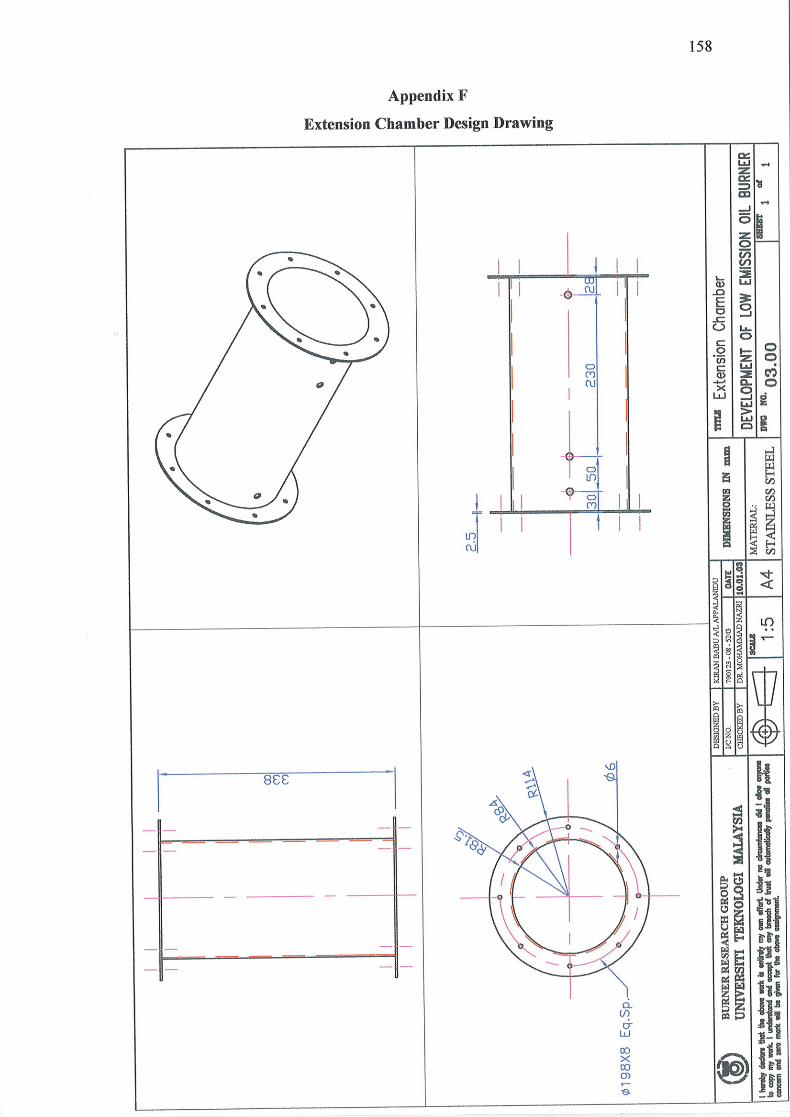
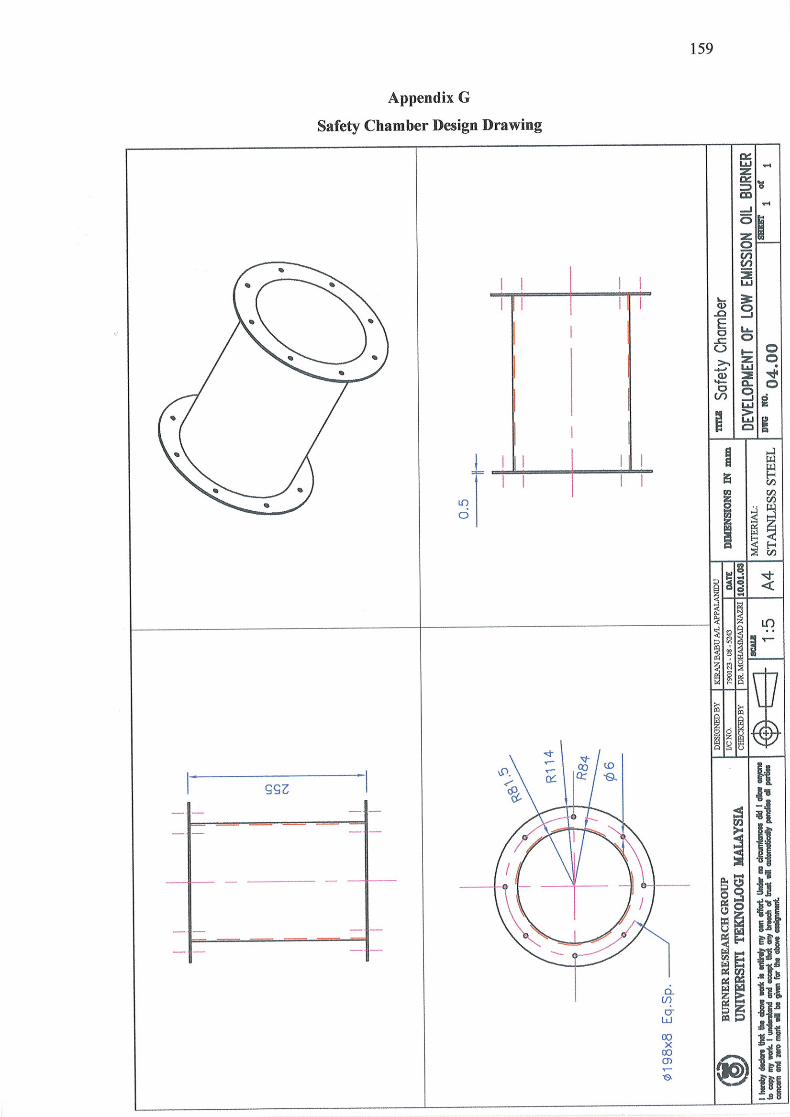
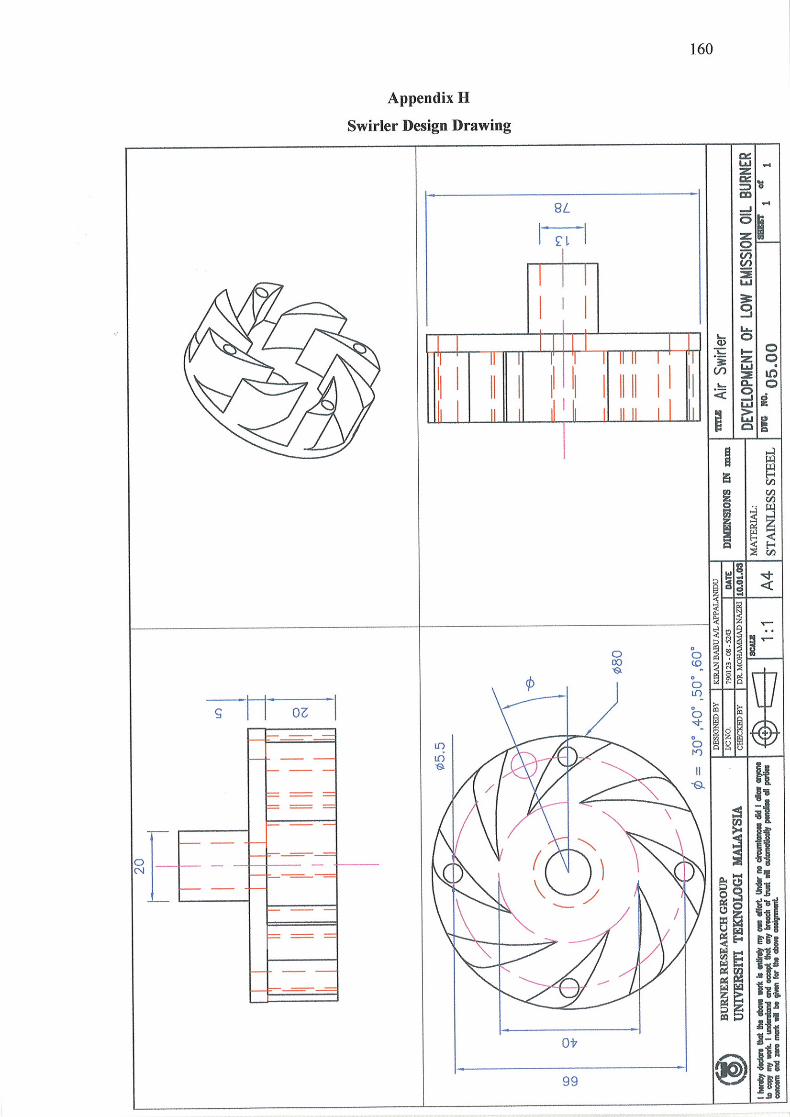
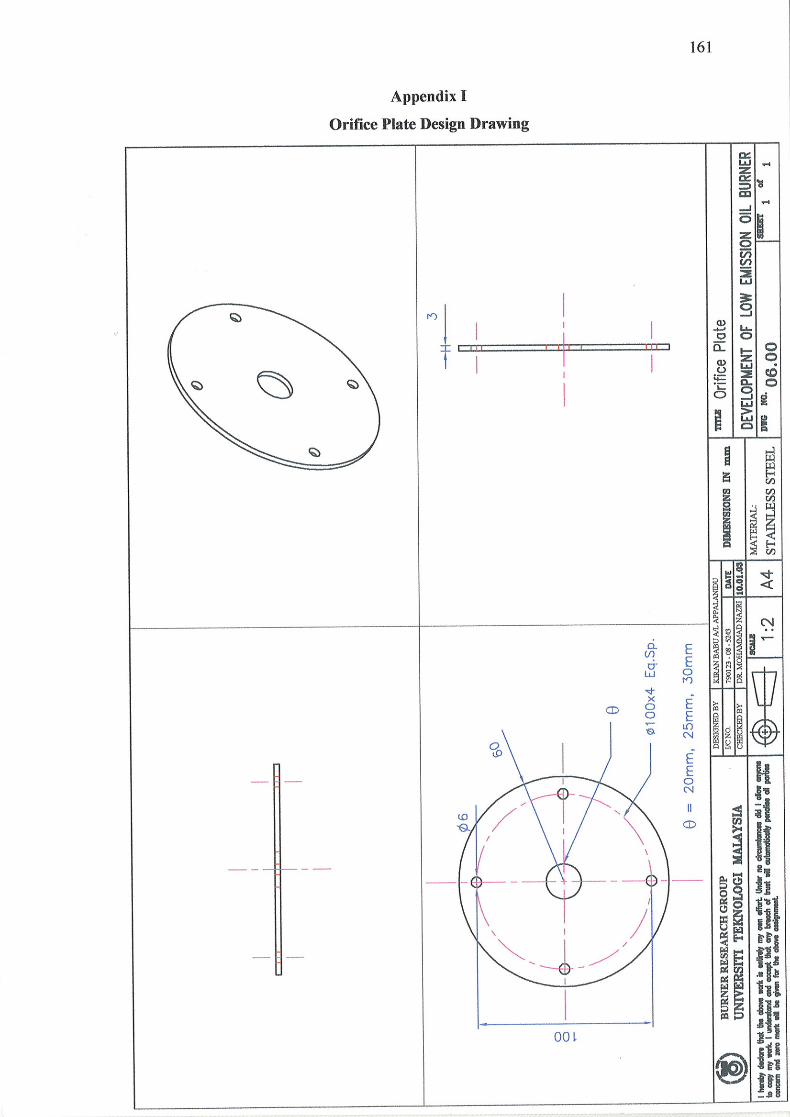
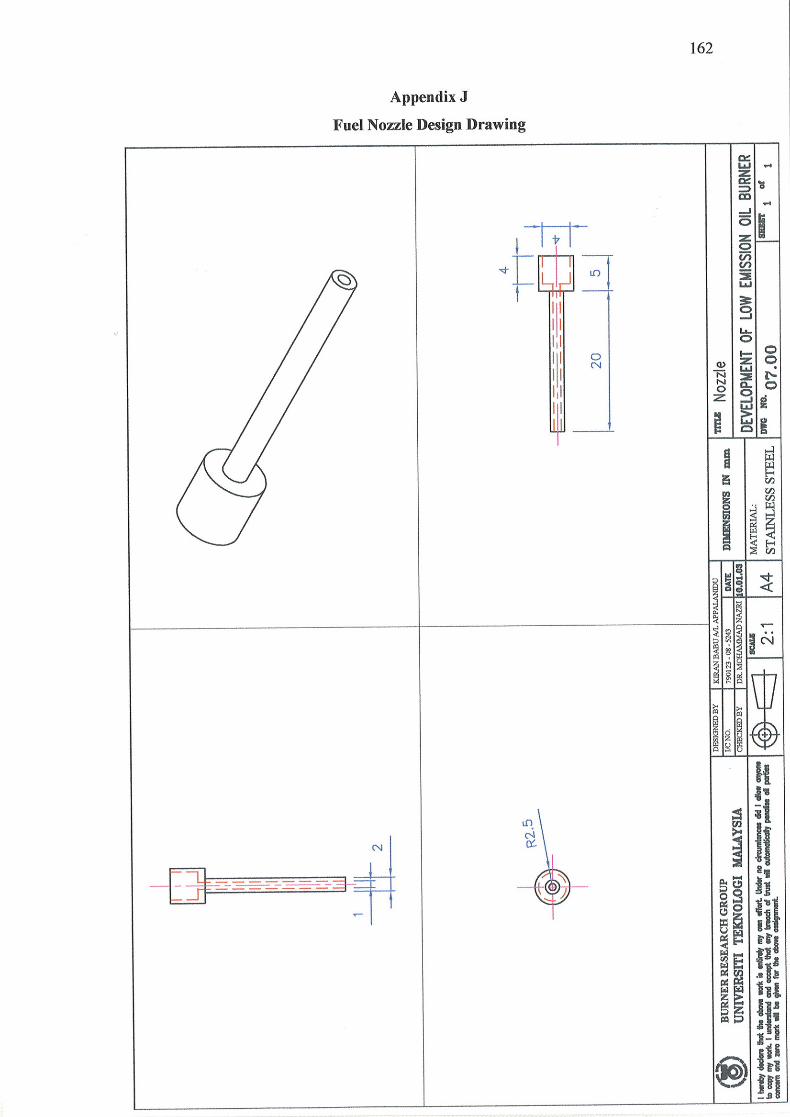
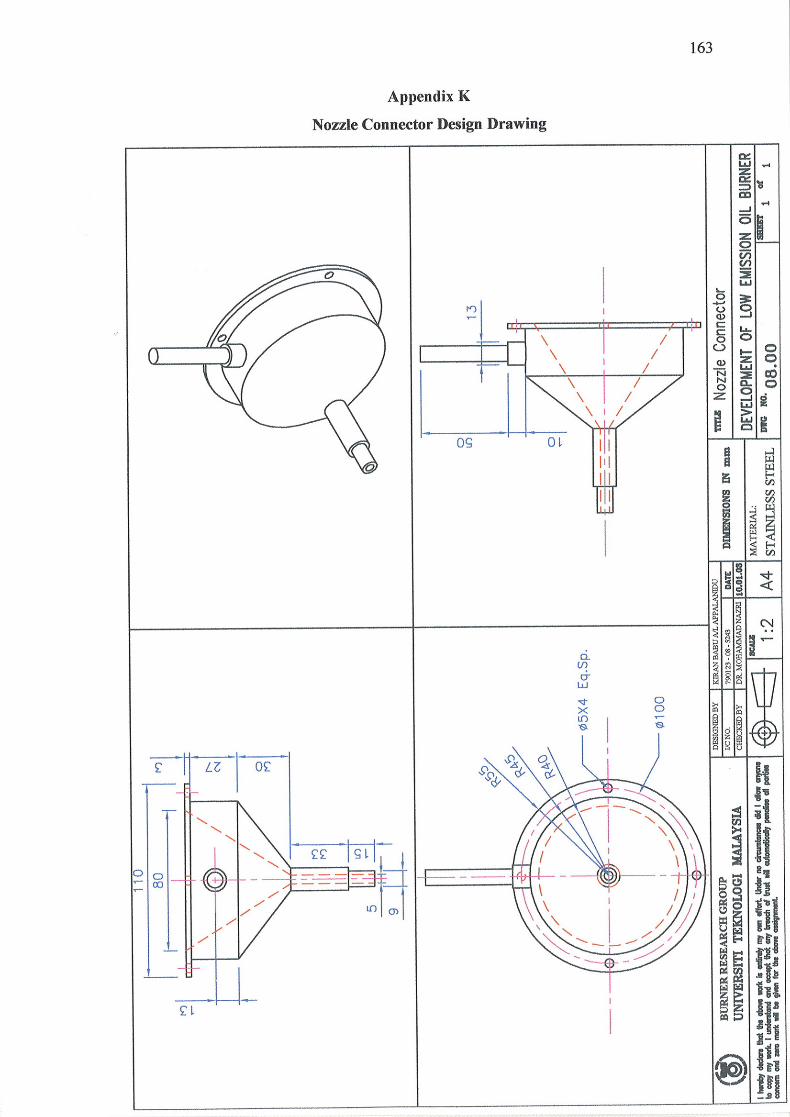
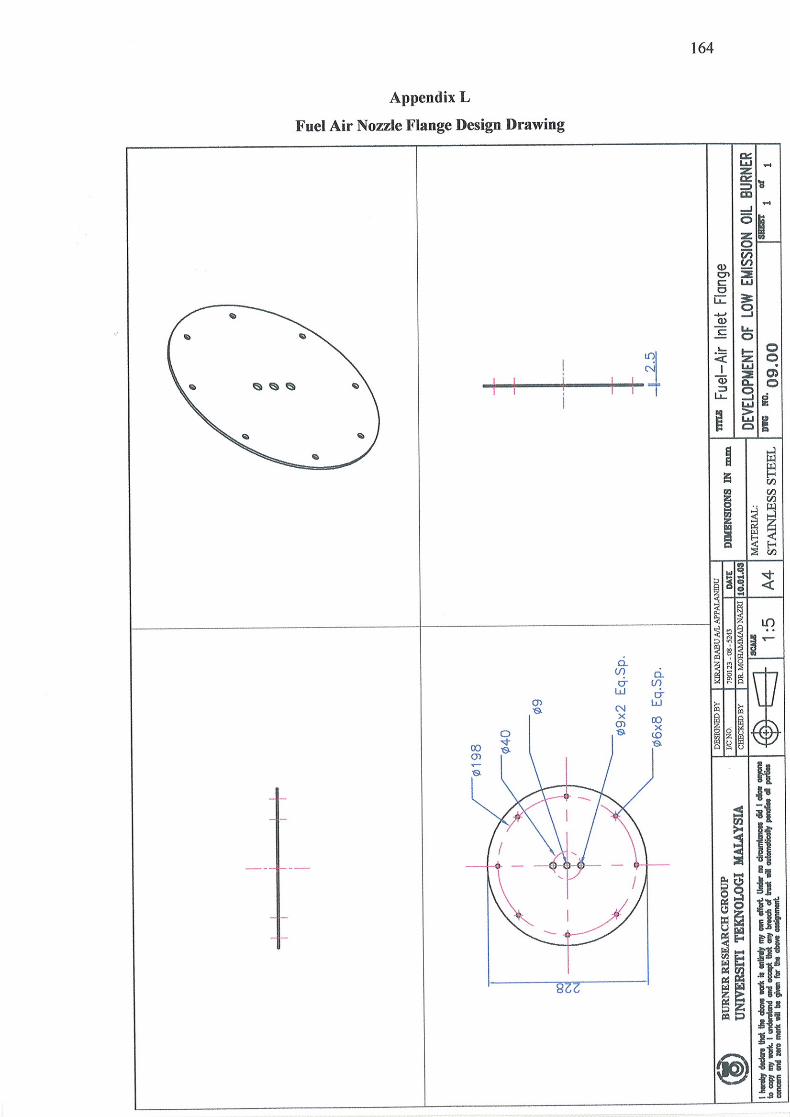
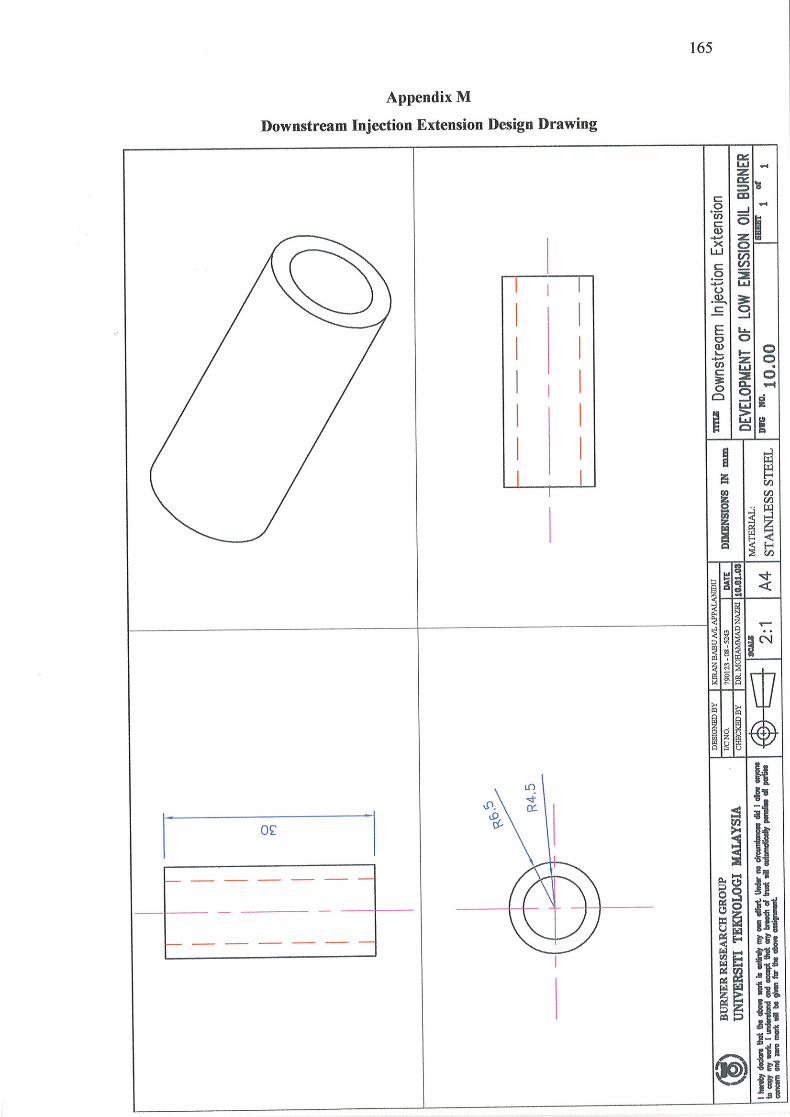
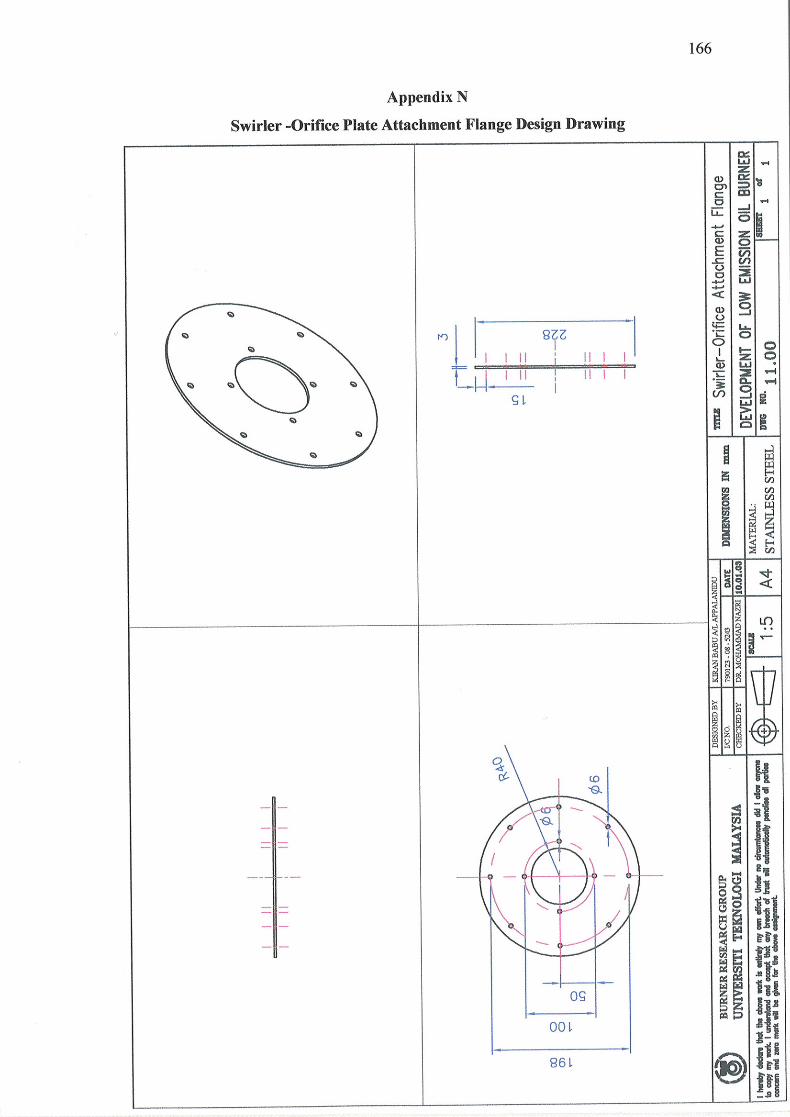
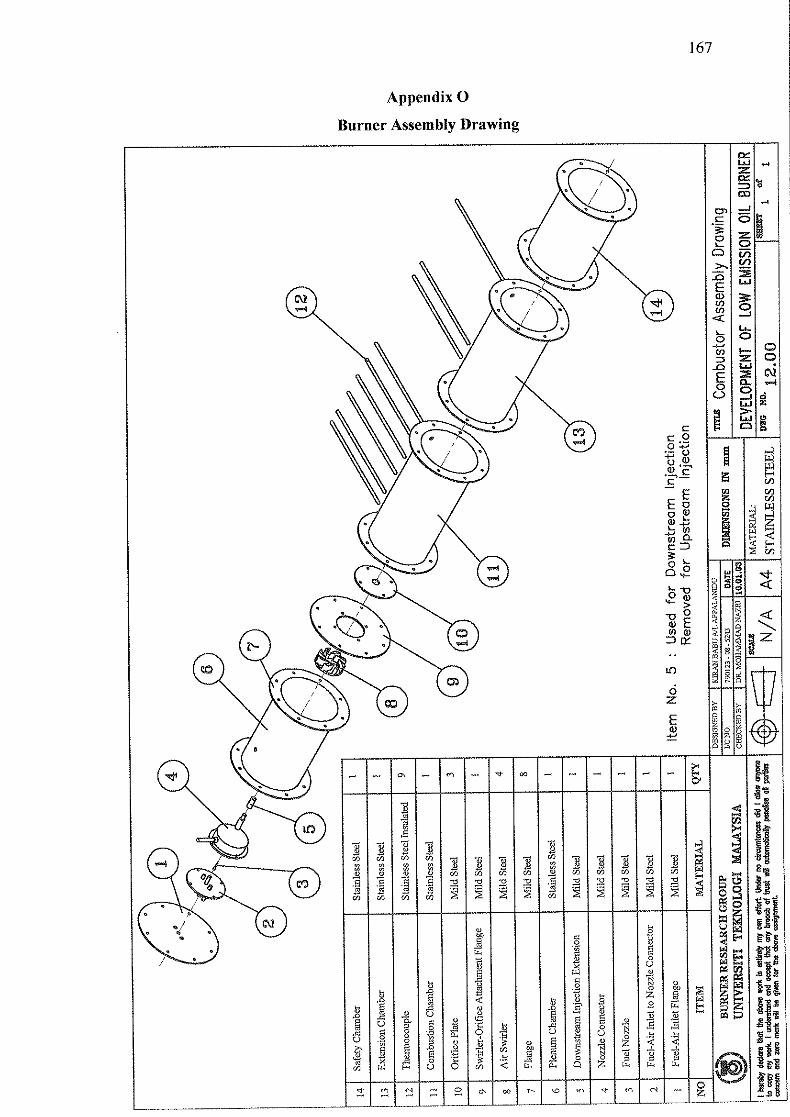
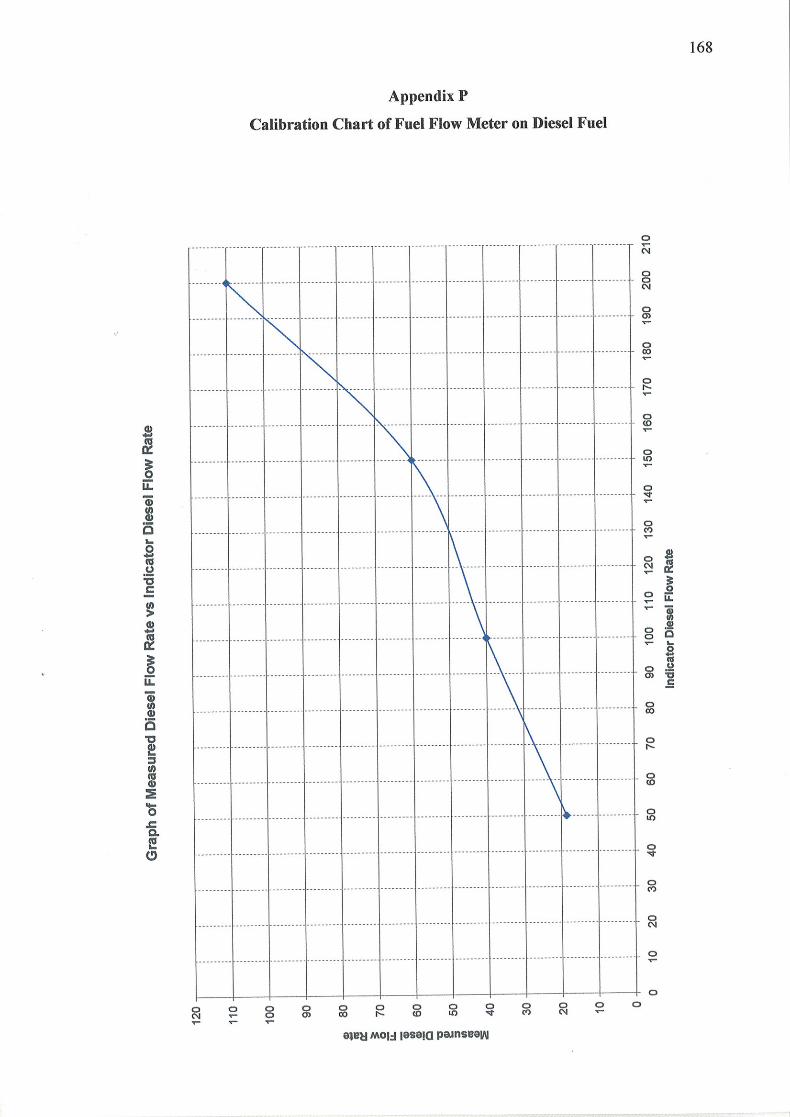
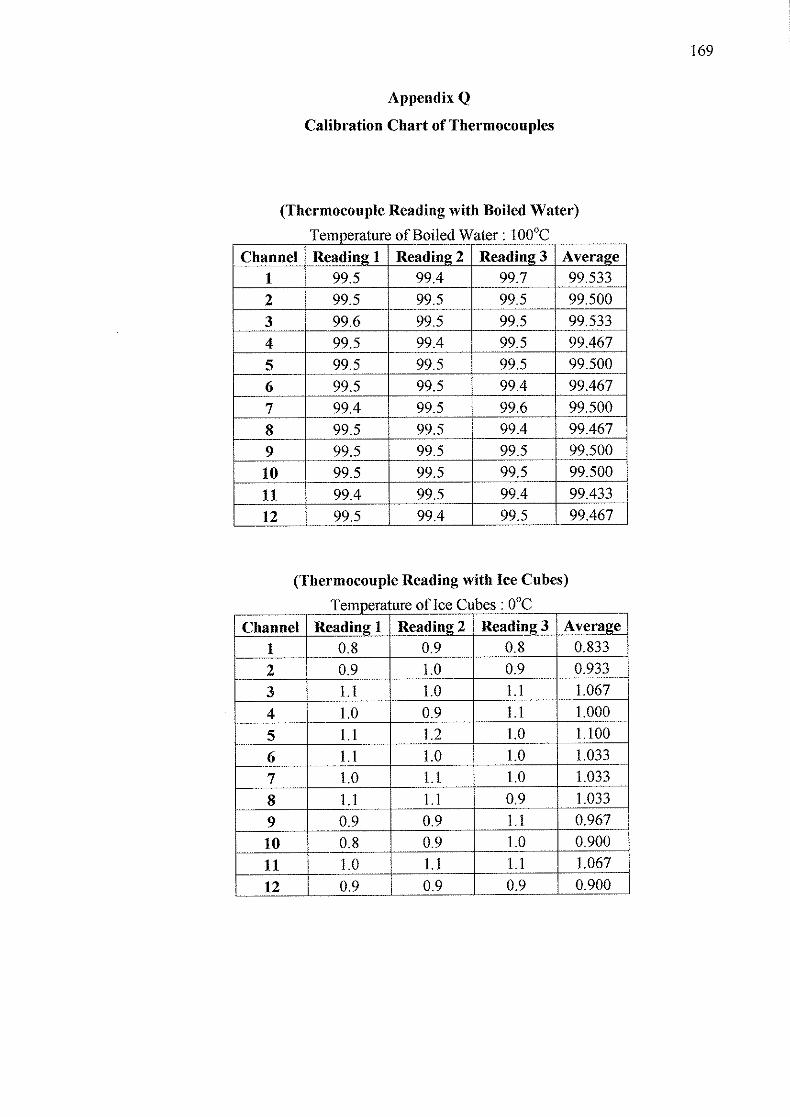
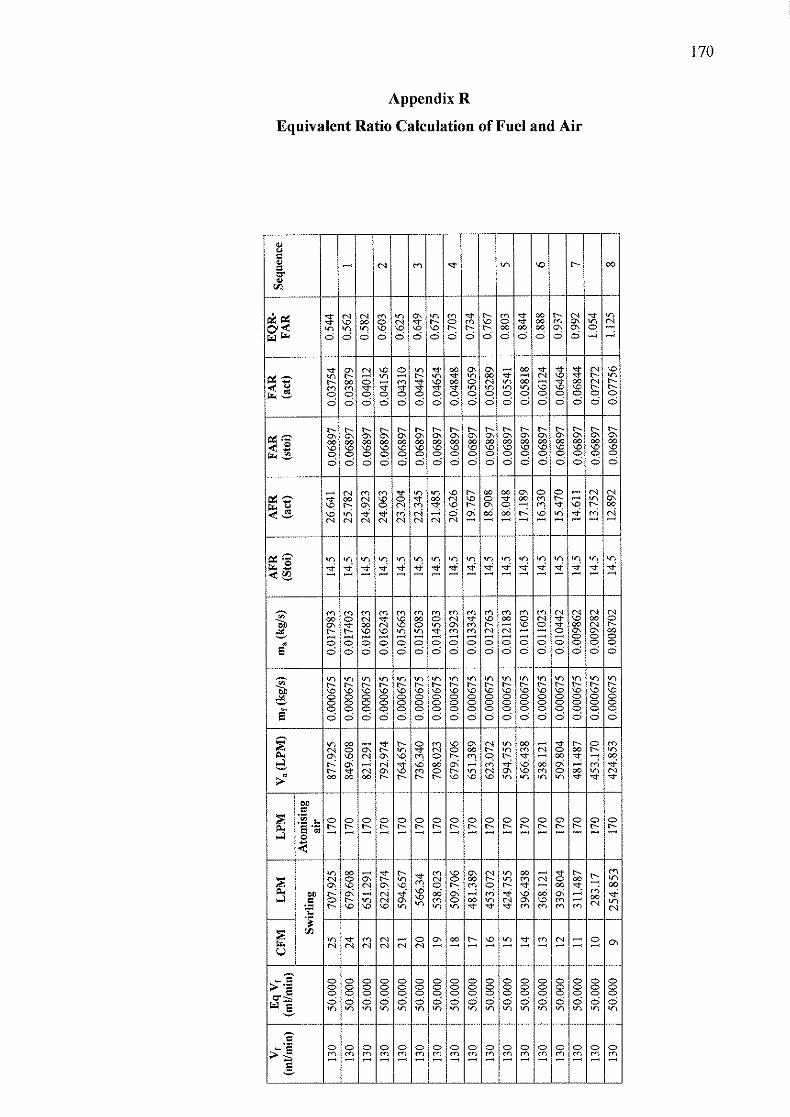
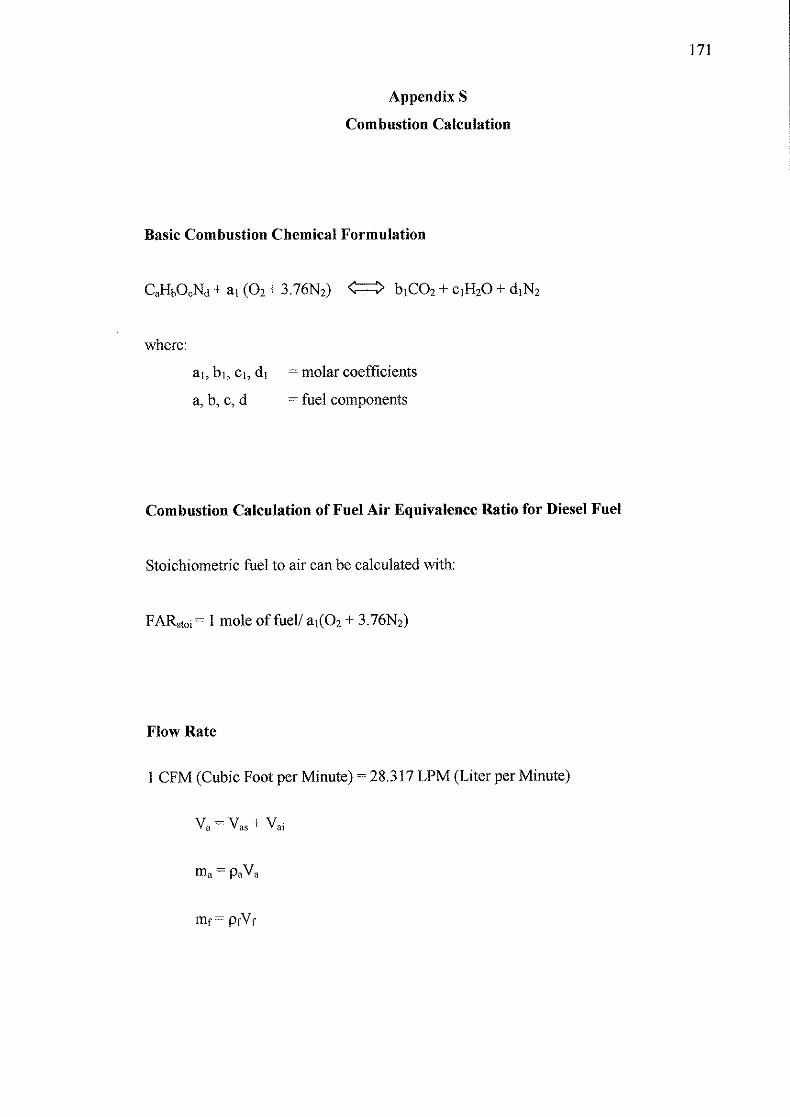
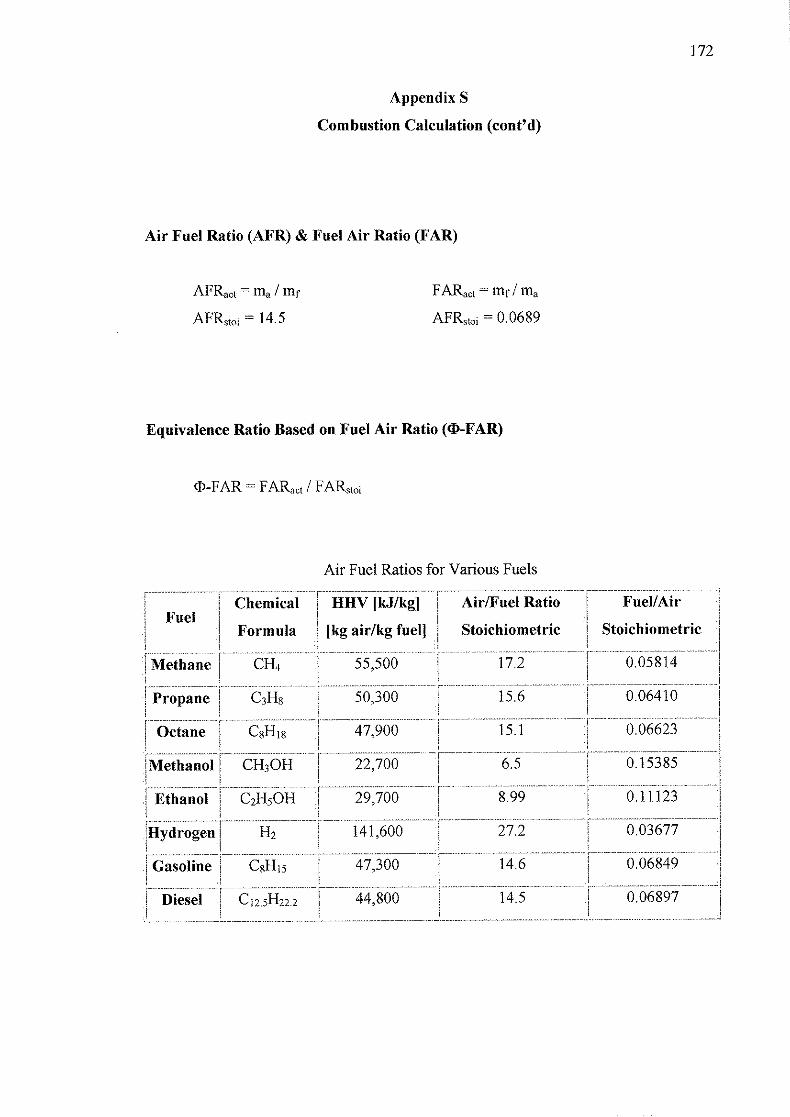
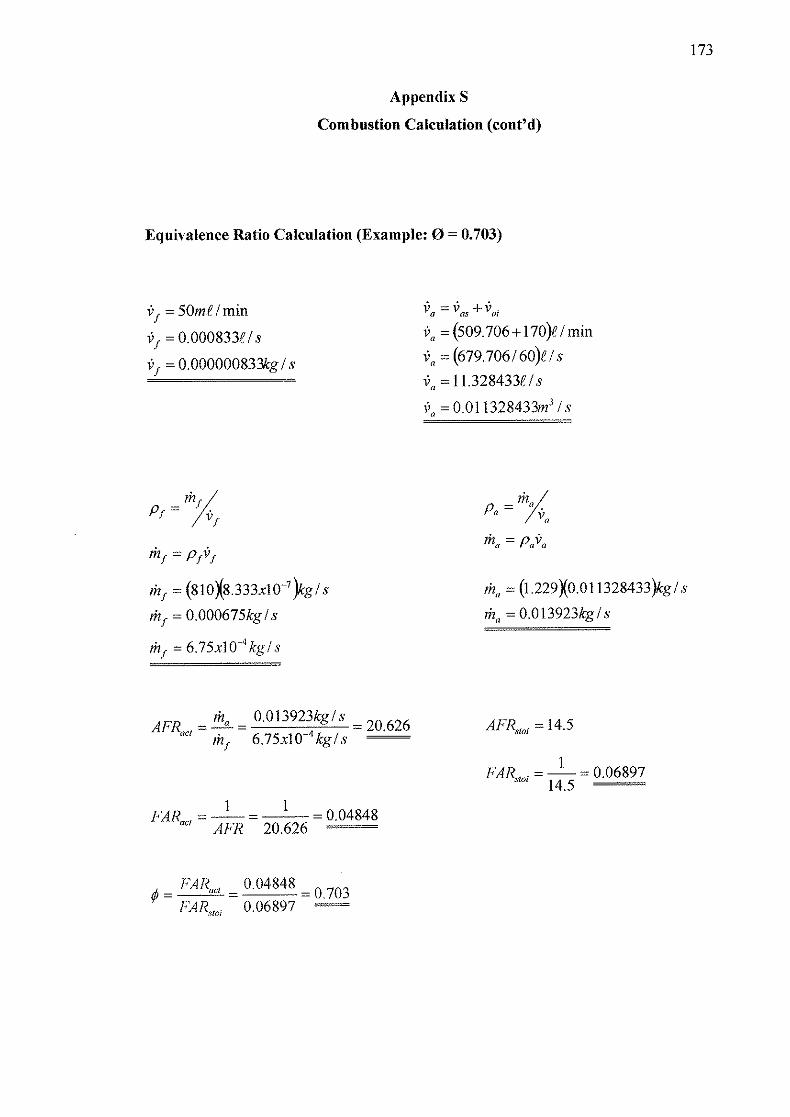
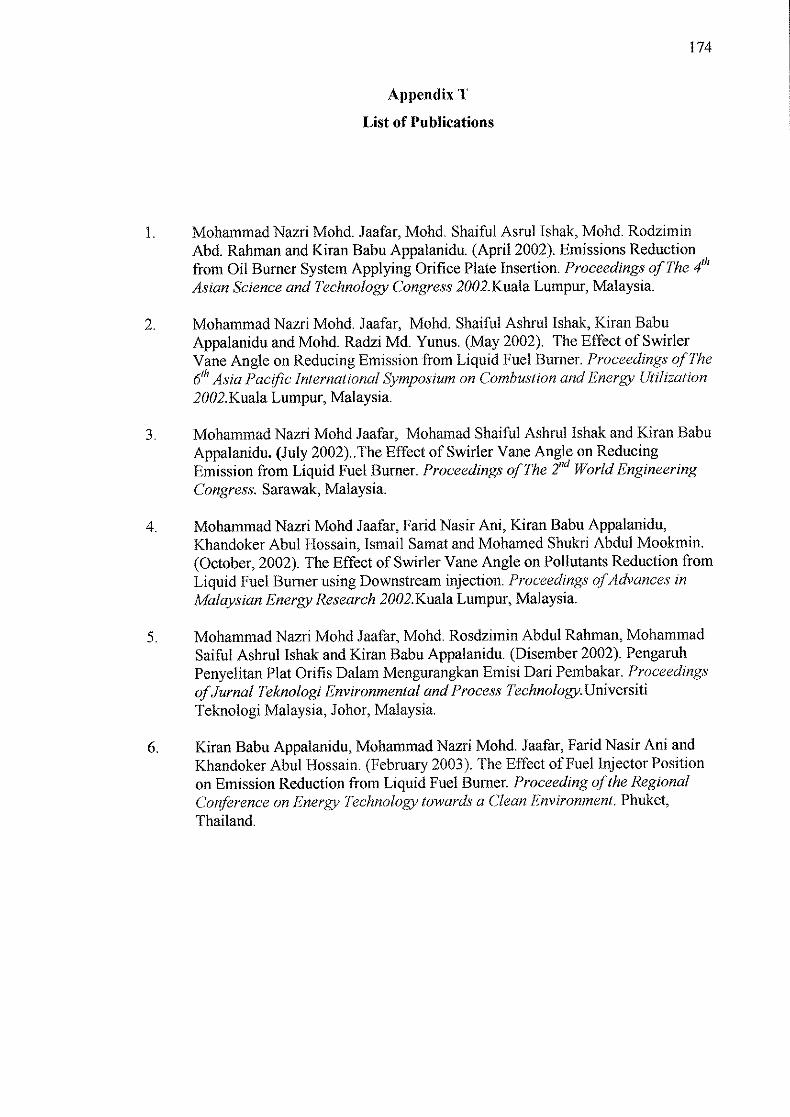


![ATOMİZER NOZUL NEMLENDİRİCİLER Marka ABSIBE / Menei …relax-air.com/(S(a1ruaz55ma3o5ozwbde5lg55))/NEMLENDIRME.pdf · Üç Nozullu Paket Cihaz [21 kg/h] 2499.- 75.-Digital Higrostat](https://img.pdfslide.tips/doc/110x75/5c1c290009d3f206658b9419/atomizer-nozul-nemlendiriciler-marka-absibe-menei-relax-aircomsa1ruaz55ma3o5ozwbde5lg55.jpg)


![ATOMİZER NOZUL NEMLENDİRİCİLER Marka ABSIBE / Menei …S(jmc30545vlf1an4545vrezvo))/NEMLENDIRME.pdf · Üç Nozullu Paket Cihaz [21 kg/h] 2499.- 75.-Digital Higrostat 295.- On](https://img.pdfslide.tips/doc/110x75/5c83c8a209d3f291698c08aa/atomizer-nozul-nemlendiriciler-marka-absibe-menei-sjmc30545vlf1an4545vrezvo.jpg)