Embed Size (px)
DESCRIPTION
Land Use Planning. Making Physical Connections – Part 1 How Much Land Do I Need For What?. The Inventory. Current Land Data SIC Codes – 2, 4, 6 digit Land Based Classification System. SIC Codes. Nine one-digit groups - #3 Trade 67 two digit groups – Retail> food 294 three-digit groups - PowerPoint PPT Presentation
Citation preview

Land Use PlanningLand Use Planning
Making Physical Connections – Part 1
How Much Land Do I Need For What?

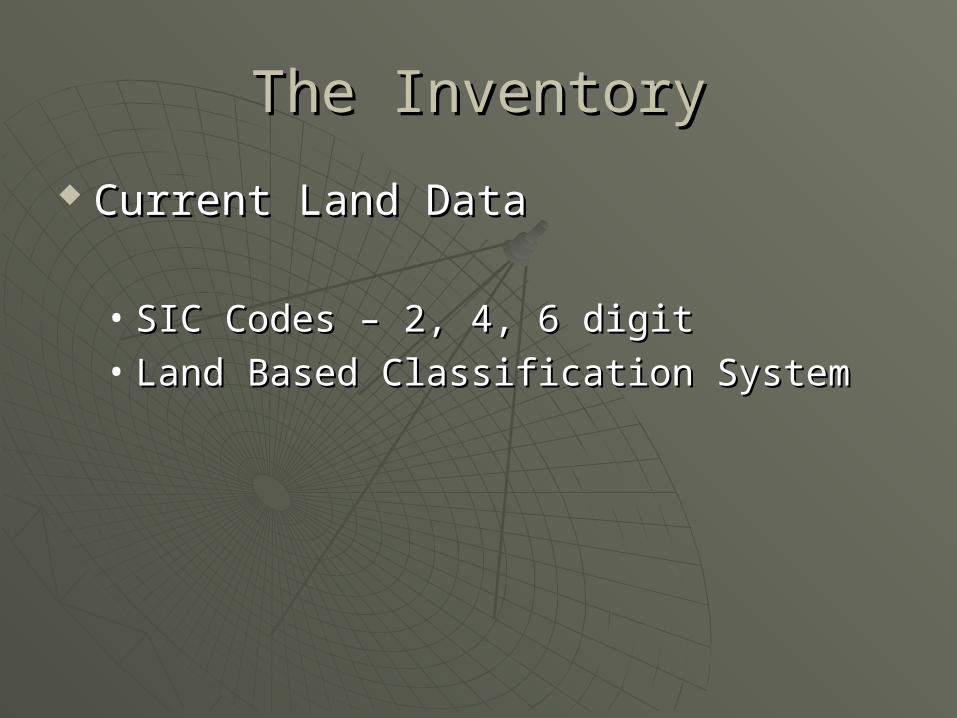
The InventoryThe Inventory
Current Land DataCurrent Land Data
• SIC Codes – 2, 4, 6 digitSIC Codes – 2, 4, 6 digit• Land Based Classification SystemLand Based Classification System

SIC CodesSIC Codes
Nine one-digit groups - #3 TradeNine one-digit groups - #3 Trade 67 two digit groups – Retail> food67 two digit groups – Retail> food 294 three-digit groups 294 three-digit groups 772 four digit groups772 four digit groups 3457 six digit groups3457 six digit groups Auxiliary groupsAuxiliary groups

Example SIC CodesExample SIC Codes
0259 - Egg farms – poultry except 0259 - Egg farms – poultry except chicken and turkeychicken and turkey
0279 - Honey Production0279 - Honey Production 5999 - Hot tubs – retail5999 - Hot tubs – retail 3716 - Recreational Vehicles3716 - Recreational Vehicles 7377 - Computer Rentals7377 - Computer Rentals http://www.wave.net/upg/immigration/sic_index.htmlhttp://www.wave.net/upg/immigration/sic_index.html

Land Based SystemLand Based System
Activity CodesActivity Codes Function CodesFunction Codes Ownerships CodesOwnerships Codes Site CodesSite Codes Structure CodesStructure Codes
Classification Data BaseClassification Data Base

Product – Current MapProduct – Current Map
The land useThe land use Structure TypeStructure Type Age of structureAge of structure ConditionCondition ConformanceConformance

Current Parcel UsesCurrent Parcel Uses

Lot By Lot – Land UseLot By Lot – Land Use

Building Condition MapBuilding Condition Map

Next Step - StandardsNext Step - Standards
Purpose – To compare our Purpose – To compare our community’s land use to current community’s land use to current standardsstandards
Outcome – To pinpoint deficienciesOutcome – To pinpoint deficiencies Link – To program needs into future Link – To program needs into future
land use planland use plan

Journey To Land UseJourney To Land Use When you When you
come to a fork come to a fork in the road – in the road – take ittake it
Yogi BeraYogi Bera
Before Going On!Before Going On!
Three Characteristics of PopulationThree Characteristics of Population
• Size (basic yardstick for space needs)Size (basic yardstick for space needs)• Composition (age, household type ..)Composition (age, household type ..)• Spatial Distribution (where people are Spatial Distribution (where people are
located)located)

Population TermsPopulation Terms
Estimate – applies only to a time period Estimate – applies only to a time period between censuses or the current timebetween censuses or the current time
Projection – Is a set of methods to Projection – Is a set of methods to determine future population size based on determine future population size based on past assumptionspast assumptions
Forecast – Effort to accurately predict a Forecast – Effort to accurately predict a future population point based on modeled future population point based on modeled assumptionsassumptions

Population DataPopulation Data
Primary Data – how do you obtain Primary Data – how do you obtain local primary data?local primary data?
Secondary Data – Census?Secondary Data – Census?

Population StandardsPopulation Standards
Determine growth factorsDetermine growth factors Project populationProject population Compare rates of growth/decrease Compare rates of growth/decrease
with peerswith peers Use comparative models to Use comparative models to
determine reasons for variance from determine reasons for variance from peerspeers

The MethodsThe Methods
The Big Four MethodsThe Big Four Methods
• Trend ExtrapolationTrend Extrapolation• Ratio/ShareRatio/Share• Disaggregate/simulation/componentDisaggregate/simulation/component• Symptomatic AssociationSymptomatic Association
Trend ExtrapolationTrend Extrapolation
Quick – dirty – but generally works in Quick – dirty – but generally works in normal populationsnormal populations
Linear ModelLinear Model Exponential Change – compounding Exponential Change – compounding
method. Rate of change is constant method. Rate of change is constant but the absolute change increases but the absolute change increases with compoundingwith compounding

Linear SeriesLinear Series
L inear Trend

Exponentials - PolynomialsExponentials - Polynomials
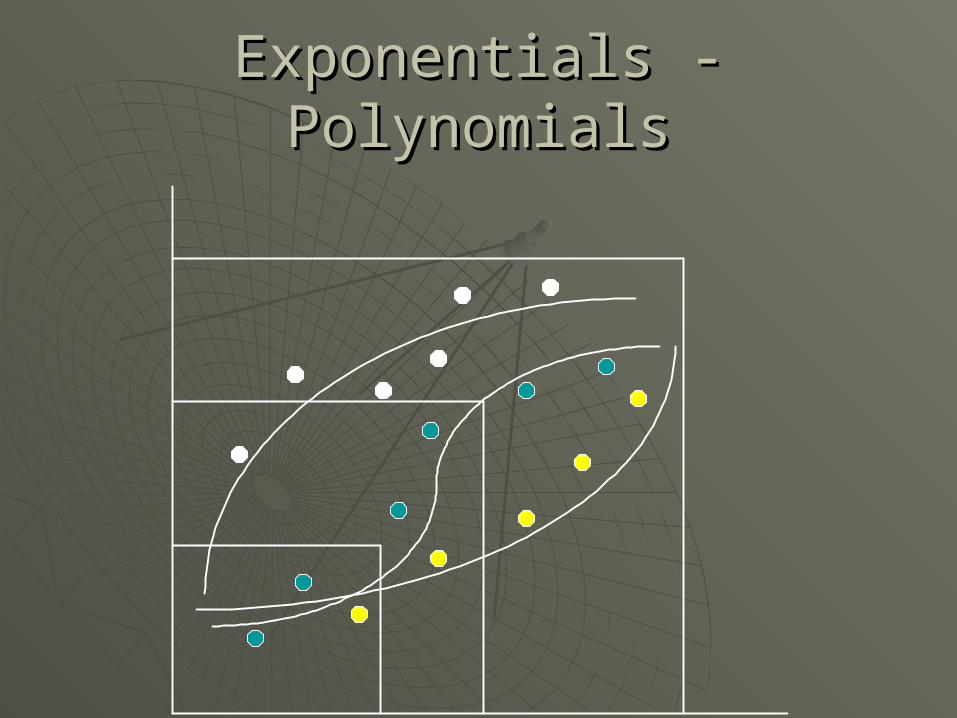
Patterns of smaller and smaller Patterns of smaller and smaller incremental growthincremental growth
Complicated patterns of growth Complicated patterns of growth change on regular frequencieschange on regular frequencies
Explosive then incipient growthExplosive then incipient growth
Exponentials - PolynomialsExponentials - Polynomials

Ratio- ShareRatio- Share
Used only to estimate the ratio of Used only to estimate the ratio of small unit population to a small unit population to a larger/known unitlarger/known unit
Extraterritorial areasExtraterritorial areas CEA unitsCEA units
Unknown Population
Known Population

DisaggregateDisaggregate
Cohort – component methodCohort – component method Components of change methods – Components of change methods –
Chicago transportation/land modelChicago transportation/land model Vacancy/housing estimate modelsVacancy/housing estimate models
Cohorts
Symptomatic ModelsSymptomatic Models
A statistical equation is applied to A statistical equation is applied to known indicators:known indicators:• JobsJobs• Building permitsBuilding permits• School EnrollmentSchool Enrollment• Water/power consumptionWater/power consumption

Population Variants – Estimate Population Variants – Estimate Projection IntervalsProjection Intervals
Est. World Pop 1950 – 2,523Est. World Pop 1950 – 2,523 Est. World Pop 1990 – 5,687Est. World Pop 1990 – 5,687 Low Variant 2050 – 7,662Low Variant 2050 – 7,662 Medium Variant 2050 – 9,366Medium Variant 2050 – 9,366 High Variant 2050 – 11,156High Variant 2050 – 11,156
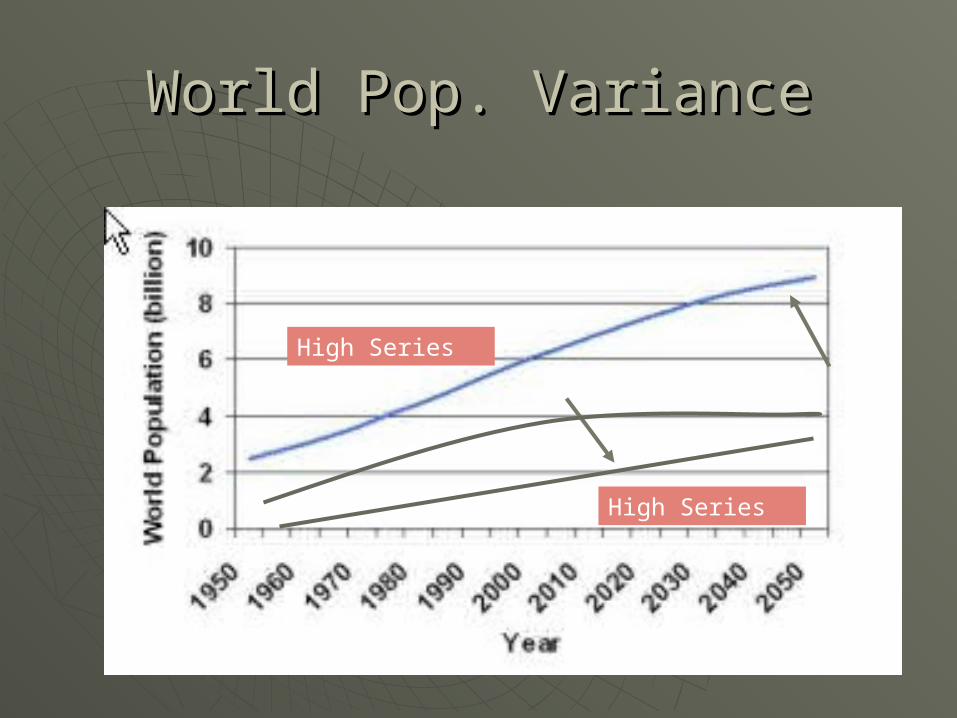
World Pop. VarianceWorld Pop. Variance
High Series
High Series

Population Method ProblemsPopulation Method Problems
Forecasting when you should be Forecasting when you should be projectingprojecting
The long range fairy (25 years)The long range fairy (25 years) Very rapid gainsVery rapid gains Small area analysis rather than city Small area analysis rather than city
as a wholeas a whole Large area analysis rather than just Large area analysis rather than just
the reporting districtthe reporting district


Translate PopulationTranslate Population
Housing needsHousing needs Retail/Trade NeedsRetail/Trade Needs Facilities needsFacilities needs Manufacturing needsManufacturing needs Open space needsOpen space needs

Translating RequirementsTranslating Requirements
Per capita approach – standardsPer capita approach – standards• Requires an LOS assumptionRequires an LOS assumption
5.6 Ac. Parkland per 1,000
245 Structures per five miles per pumper
Pad to parking ratio of 3:1
&5% water retention of record 10 year event

Translating RequirementsTranslating Requirements
Demand approachDemand approach• Based on current investigation of actual Based on current investigation of actual
demand under the assumption that one demand under the assumption that one size does not fit allsize does not fit all
• Income distribution approachIncome distribution approach• Survey approach for mass transitSurvey approach for mass transit• Maintenance and useful life approachMaintenance and useful life approach
Set Density StandardsSet Density Standards
L.U.I Index (Land Use Intensity)L.U.I Index (Land Use Intensity)
Calculation of the of floor area ratio to the open space ratio
Ranges from 1 du/40Ac. To 650 du’s/Ac
Calculate slack space equal to about 25% of all land area that is used for roads, facilities, and utilities

Just Checking!Just Checking!
Housing NeedsHousing Needs
DisaggregationDisaggregation• Unit demand per population mixUnit demand per population mix• Average square feet per mixAverage square feet per mix• Pad sitePad site• Parking RatioParking Ratio• Per/L.U.I mixPer/L.U.I mix

Density = 4.0 DU/Ac 8 units on
2 Ac.
Lot Size
9,114 sf
PAD =
1,490 sf
Parking
500 sf

9.55 DUs/Ac 32 units on 3.35 Ac
Lot size
3,465 sf
PAD
1,120 sf
Parking
220 sf

Retail Trade NeedsRetail Trade Needs
Neighborhood TradeNeighborhood Trade• Maximum travel distance = 4 minMaximum travel distance = 4 min• Gross sf per family = 175Gross sf per family = 175• Typical requirement = 7.5 acresTypical requirement = 7.5 acres• Parking Ratio 2 to 1Parking Ratio 2 to 1• Total requirements 319,200 sfTotal requirements 319,200 sf

Community ClusterCommunity Cluster
Community ClusterCommunity Cluster• Maximum travel distance = 15 minMaximum travel distance = 15 min• Gross sf per family = 35 sfGross sf per family = 35 sf• Typical requirement = 25 Ac (also Typical requirement = 25 Ac (also
equals one Super Wal-Martequals one Super Wal-Mart• Parking Ratio = 3 to 1Parking Ratio = 3 to 1• Pad site = 412,500 – 1,250,000sfPad site = 412,500 – 1,250,000sf

Regional ShoppingRegional Shopping
Regional Scale Facilities – 60 milesRegional Scale Facilities – 60 miles 100,000 population served100,000 population served Gross sf per family = 40Gross sf per family = 40 Pad sites = 1.1 million sfPad sites = 1.1 million sf Parking ratio = 4 –1Parking ratio = 4 –1 Total site requirements 60 Ac.Total site requirements 60 Ac.

BA = BU IL DING ARE AS P = P E DE ST R IANARE A
T A = T RANS P ORT AT IONARE A
BU A
S P + BA = CA (1,100,000 S F )
RA - 555,000 S F
T A = 1,665,000
545,000 S F
Buff er A rea = 250,000 S F
RE GIONAL SHOP P ING CE NT E R ON 70 Ac .GROS S L AND NE E DS = 3,015,000 S F
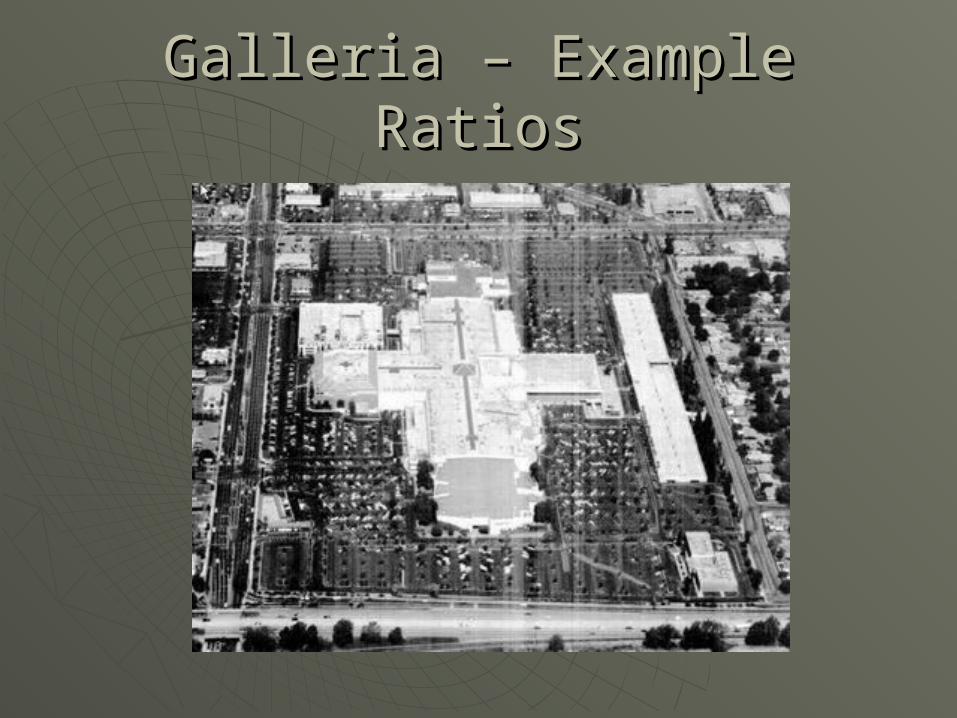
Galleria – Example RatiosGalleria – Example Ratios

Regional SuperBlockRegional SuperBlock

Another ViewAnother View

Facilities CalculationsFacilities Calculations
Roads – streets – public parking and Roads – streets – public parking and utility easements = .30 grossutility easements = .30 gross
Land Fill = 80 Ac per 20,000 served Land Fill = 80 Ac per 20,000 served or 170 sf per personor 170 sf per person
Sewer = 60 Ac. Per 10,000 served or Sewer = 60 Ac. Per 10,000 served or 85 Ac with sludge injection85 Ac with sludge injection
Water = 252 Ac Ft. processed per Water = 252 Ac Ft. processed per 100 persons = 34 Ac/10,000 pers100 persons = 34 Ac/10,000 pers

Land Use Ratio - VisualLand Use Ratio - Visual

High Density Mobile Home ParkHigh Density Mobile Home Park

Facilities ……………Facilities ……………
Schools – Neighborhood SystemSchools – Neighborhood System Kindergarten Center – 15 Ac (220)Kindergarten Center – 15 Ac (220) Elementary Center – 20 Ac (240)Elementary Center – 20 Ac (240) Middle School - 40 Ac (650)Middle School - 40 Ac (650) High School 60 Ac (1,250) High School 60 Ac (1,250)

School SitesSchool Sites

Middle School SiteMiddle School Site

NEIGHBORHOOD
UNIT
SYSTEM
160 Ac Target
5,000 persons per average unit

Manufacturing NeedsManufacturing Needs
CONCEPTSCONCEPTS• Working force as a percent of pop.Working force as a percent of pop.• Working industrial force as a percent of Working industrial force as a percent of
the labor force / participation ratethe labor force / participation rate• Total Gross Area per 1,000 is about 20 Total Gross Area per 1,000 is about 20
Ac Ac • Reserve calculations = 50 yearsReserve calculations = 50 years

Labor Force ParticipationLabor Force Participation
Males 1960 –69.8Males 1960 –69.8 Males 1999 – 73.1Males 1999 – 73.1 Females 1960 – 58.6 Females 1960 – 58.6 Females 1999 – 68.5Females 1999 – 68.5
• FOR SINGLE PERSONSFOR SINGLE PERSONS

Labor Force ParticipationLabor Force Participation
Males 1960 – 89.2Males 1960 – 89.2 Males 1999 – 77.6Males 1999 – 77.6 Females 1960 – 31.9 Females 1960 – 31.9 Females 1999 – 61.2Females 1999 – 61.2
FOR MARRIED COUPLESFOR MARRIED COUPLES

Largest Job GrowthLargest Job Growth
Projected 2000 – 2006Projected 2000 – 2006• Computing EngineersComputing Engineers• Systems AnalystsSystems Analysts• CashiersCashiers• Data ProcessorsData Processors• Retail SalespersonsRetail Salespersons• General Office ClerksGeneral Office Clerks• Truck drivers – light and heavyTruck drivers – light and heavy• http://www.census.gov/prod/99pubs/99statab/sec13.pdfhttp://www.census.gov/prod/99pubs/99statab/sec13.pdf

Manufacturing GrowthManufacturing Growth
1970 – 20.7 million1970 – 20.7 million 1980 – 21.9 million1980 – 21.9 million 1990 – 21.3 million1990 – 21.3 million 2000 – 20.4 million2000 – 20.4 million 2010 – 20.7 million2010 – 20.7 million

Open SpaceOpen Space
DefinitionDefinition
• Land specifically dedicated or reserved Land specifically dedicated or reserved for active or passive recreation or for for active or passive recreation or for conservation purposesconservation purposes
• The most rapidly growing and The most rapidly growing and demanded land base in the U.S.demanded land base in the U.S.

Open Space StandardsOpen Space Standards
The National Parks and Recreation The National Parks and Recreation Association now sets a standard of Association now sets a standard of 10 Ac. Per 1,000 residents in active 10 Ac. Per 1,000 residents in active and passive recreational facilities and passive recreational facilities (not conserved land)(not conserved land)
Open Space Has Many UsesOpen Space Has Many Uses

Remember CemeteriesRemember Cemeteries

Some Additional ThoughtsSome Additional Thoughts
Some land uses are hard to
figure out

Many are Protective of Their Many are Protective of Their Land UsesLand Uses

Some are REALLY ProtectiveSome are REALLY Protective

Some Land Uses Are Very Some Land Uses Are Very SpecializedSpecialized

Redneck Sign of the WeekRedneck Sign of the Week

Ugly House of the WeekUgly House of the Week

Restaurant of the WeekRestaurant of the Week