Embed Size (px)
Citation preview
LAPORAN AKHIR PROJEKPENYELIDIKAN JANGKA PANJANG
(IRPA R&D)
(Project Number: 08-02-05-2185 EA006)
TAJUK PROJEKPROCESS FOR HIGH VALUE PRODUCTS FROMPYROLYSIS OF SCRAP TIRES USING FLUIDIZED
BED
NAMA PENYELIDIKDR RIDZUAN ZAKARIA
DR MOHAMAD ZAILANI ABU BAKARPROF ABDUL RAHMAN MOHAMED
LAMPIRAN-LAMPIRANDAN KEPUTUSAN-KEPUTUSAN
DARIPADA PENYELIDIKAN
IIIIII
The 17th Symposium of Malaysian Chemical Engineers(SOMChE 2003)
PROCEEDINGS:SOMChE 2003
THEME:
Roles of Chemical Engineers for Sustainability of SmallMedium Industries (SMI)
The Copthorne Orchid HotelTanjung Bungah, Penqng, Malaysia
29 - 30th December 2003 .
I
UNIVERSITI SAINS MALAYSIA
School of Chemical EngineeringEngineering CampusUniversiti Sains Malaysia
Institution of ChemicalEngineers Malaysia
614
INTRODUCTION
'School a/Chemical Engineering, Engineering Campus,University Sains Malaysia. J4300 Nibong Tebal Seberang Perai Selatan,Penang Malaysia.
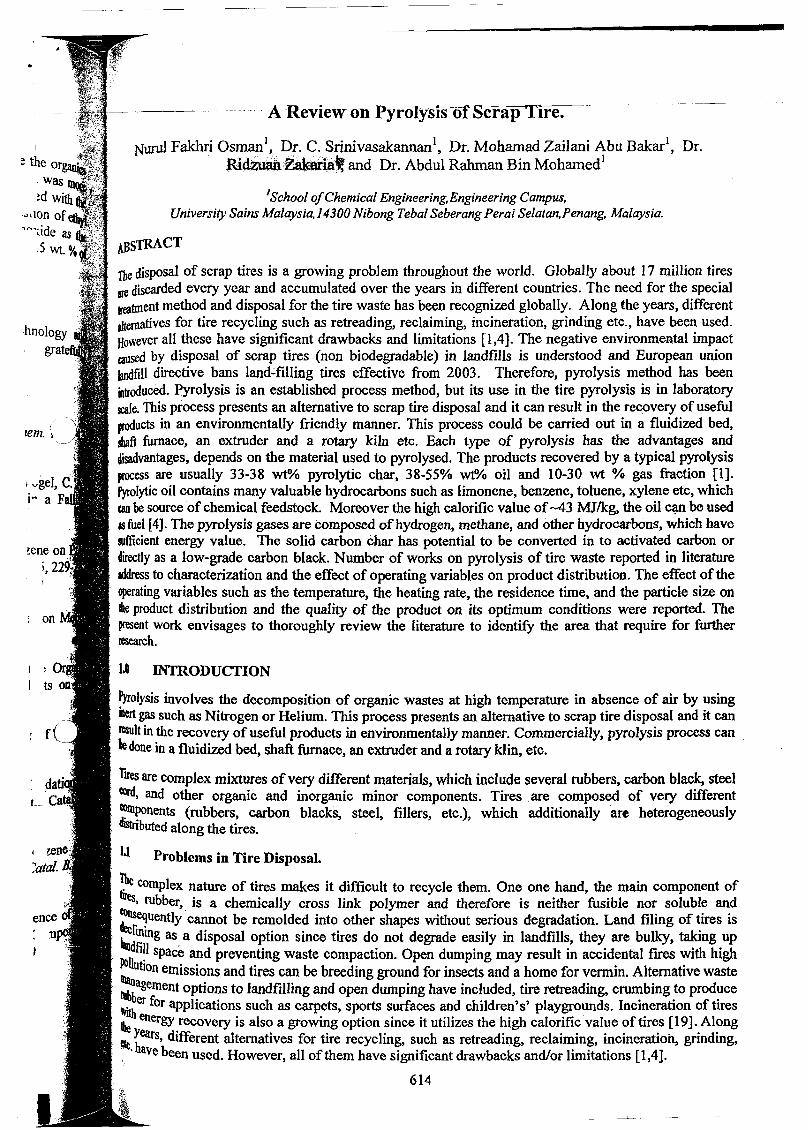
. A Reviewun PyrolySlsoIScrap 'fire.
Nurul Fakhri Osmanl,Dr. C:S,rinivasakannan1, Dr. Mohamad Zailani Abu Bakarl, Dr.
Ri~~a~ and Dr. Abdul Rahman Bin Mohamed I
Problems in Tire Disposal.
~e complex nature of tires makes it difficult to recycle them. One one hand, the main component oftires, rubber, is a chemically cross link polymer and therefore is neither fusible nor soluble and::~uently cannot be remolded into other shapes without serious degradation. Land filing of tires islin hnIDg as. a disposal option since tires do not degrade easily in landfills, they are bulky, taking uppo~fi!l space and preventing waste compaction. Open dumping may result in accidental fires with highIlIanUtion emissions and tires can be breeding ground for insects and a home for vermin. Alternative wasteh1bbagement options to landfilling and open dumping have included, tire retreading, crumbing to producetrither for applications such as carpets, sports surfaces and children's' playgrounds. Incineration of tires!he energy.recovery is also a growing option since it utilizes the high calorific value of tires [19]. Along'k1ears, different alternatives for tire recycling, such as retreading, reclaiming, incineration, grinding,
. aVe been used. However, all of them have significant drawbacks and/or limitations [1,4].
The disposal of scrap tires is a growing problem throughout the world. Globally about 17 million tiresare discarded every year and accumulated over the years in different countries. The need for the specialtreatment method and disposal for the tire waste has been recognized globally. Along the years, differentalternatives for tire recycling such as retreading, reclaiming, incineration, grinding etc., have been used.However all these have significant drawbacks and limitations [1,4]. The negative environmental impactcaused by disposal of scrap tires (non biodegradable) in landfills is understood and European unionlandfill directive bans land':filling tires effective from 2003. Therefore, pyrolysis method has beenirtroduced. Pyrolysis is an established process method, but its use in the tire pyrolysis is in laboratoryscale. This process presents an alternative to scrap tire disposal and it can result in the recovery of usefulproducts in an environmentally friendly manner. This process could be carried out in a fluidized bed,shaft furnace, an extruder and a rotary kiln etc. Each type of pyrolysis has the advantages anddisadvantages, depends on the material used to pyrolysed. The products recovered by a typical pyrolysisprocess are usually 33-38 wtO/o pyrolytic char, 38-55% wt% oil and 10-30 wt % gas fraction [I].Pyrolytic oil contains many valuable hydrocarbons such as limonene, benzene, toluene, xylene etc, whichcan be source of chemical feedstock. Moreover the high calorific value of--43 MJlkg, the oil c~ be usedas fuel [4]. The pyrolysis gases are composed of hydrogen, methane, and other hydrocarbons, which havesufficient energy value. The solid carbon char has potential to be converted in to activated carbon ordirectly as a low-grade carbon black. Number of works on pyrolysis of tire waste reported in literatureIddress to characterization and the effect of operating variables on product distribution. The effect of theoperating variables such as the temperature, the heating rate, the residence time, and the particle size on1he product distribution and the quality of the product on its optimum conditions were reported. Thepresent work envisages to thoroughly review the literature to identify the area that require for furtherresearch.
~olysis involves the decomposition of organic wastes at high temperature in absence of air by usingmert gas such as Nitrogen or Helium. This process presents an alternative to scrap tire disposal and it canresult in the recovery of useful products in environmentally manner. Commercially, pyrolysis process canbe done in a fluidized bed, shaft furnace, an extruder and a rotary klin, etc.
riles are complex mixtures of very different materials, which include several rubbers, carbon black, steelCOrd, and other organic and inorganic minor components. Tires. are composed of very different~~nents (rubbers, carbon blacks, steel, fillers, etc.), which additionally are heterogeneously
. IIQlfJbuted along the tires.
1.1
I
rem. i
~ the or. was~d with·
·"Lion of,mdde as
.5 wt.%
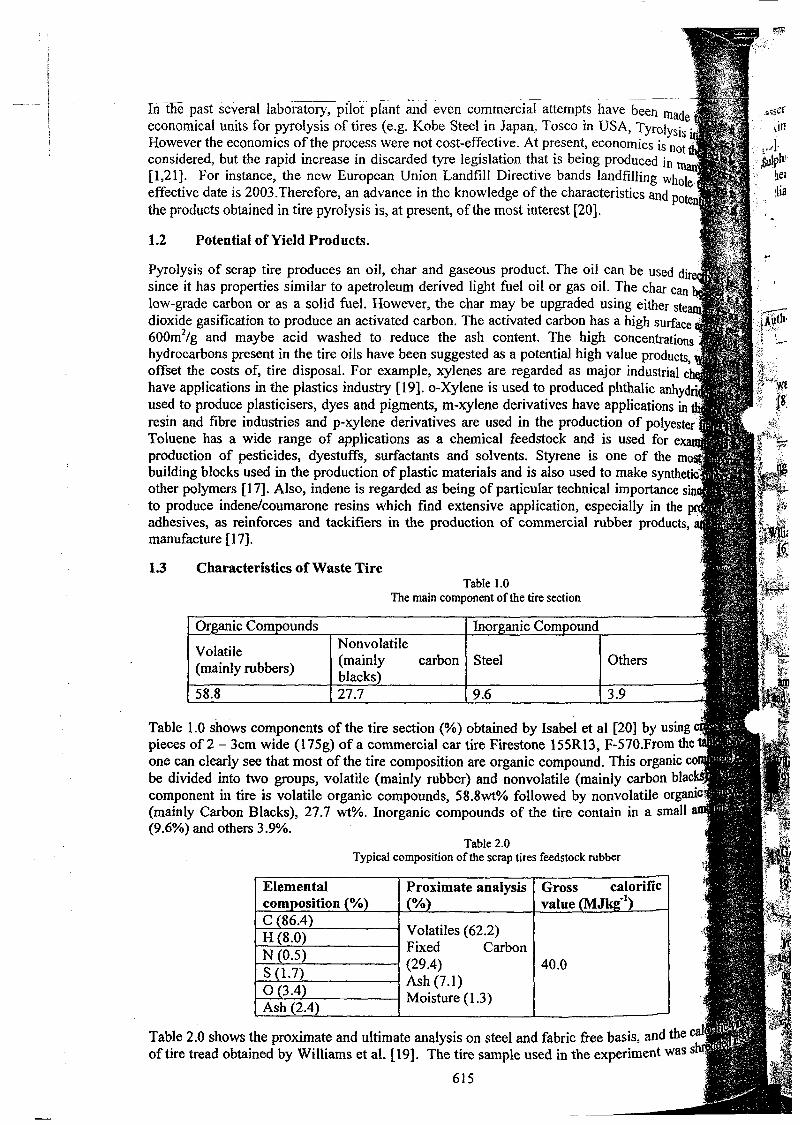
Table 2.0Typical composition of the scrap tires feedstock rubber
Others
3.9
Table 1.0The main component of the tire section
27.7 9.6
Nonvolatile(mainly carbon Steelblacks
Elemental Proximate analysis Gross calorificcomposition (%) (%) value (MJIuf1
)
C (86.4)Volatiles (62.2)H (8.0)
N (0.5)Fixed Carbon
S (1.7)(29.4) 40.0
0(3.4)Ash (7.1)
Ash (2.4)Moisture (1.3)
Volatile(mainly rubbers)
58.8
1.3 Characteristics of Waste Tire
Table 1.0 shows components of the tire section (%) obtained by Isabel et al [20] by usingpieces of2 - 3cm wide (17Sg) ofa commercial car tire Firestone 155R13, F-S70.From theone can clearly see that most of the tire composition are organic compound. This organic cobe divided into two groups, volatile (mainly rubber) and nonvolatile (mainly carbon blac ~
component in tire is volatile organic compounds, 58.8v.rfOlo followed by nonvolatile organic(mainly Carbon Blacks), 27.7 wt%. Inorganic compounds of the tire contain in a small(9.6%) and others 3.9%.
Table 2.0 shows the proximate and ultimate analysis on steel and fabric free basis, and the calof tire tread obtained by Williams et al. [19]. The tire sample used in the experiment was s
615
-._-----
Intbe past sevenillilboratory, pilot plant and even commercial attempts have been madeconomical units for .pyrolysis of tires (e.g. Kobe Steel in .Japan, Tosco in USA, Tyrolysis
e.
However the economics of the process were not cost-effective. At present, economics is notconsidered, but the rapid increase in discarded tyre legislation that is being produced in[1,21]. For instance, the new European Union Landfill Directive bands landfilling wholeffective date is 2003.Therefore, an advance in the knowledge of the characteristics and po~the products obtained in tire pyrolysis is, at present, of the most interest [20].
Pyrolysis of scrap tire produces an oil, char and gaseous product. The oil can be used dirsince it has properties similar to apetroleum derived light fuel oil or gas oil. The char canlow-grade carbon or as a solid fuel. However, the char may be upgraded using either ste .dioxide gasification to produce an activated carbon. The activated carbon has a high surface600m2/g and maybe acid washed to reduce the ash content. The high concentrationshydrocarbons present in the tire oils have been suggested as a potential high value products,offset the costs of, tire disposal. For example, xylenes are regarded as major industrial chave applications in the plastics industry [19]. o-Xylene is used to produced phthalic anhydri.used to produce plasticisers, dyes and pigments, m-xylene derivatives have applications inresin and fibre industries and p-xylene derivatives are used in the production of polyester'"Toluene has a wide range of applications as a chemical feedstock and is used for exproduction of pesticides, dyestuffs, surfactants and solvents. Styrene is one of the mbuilding blocks used in the production of plastic materials and is also used to make syntheticother polymers (17]. Also, indene is regarded as being of particular technical importance sinto produce indene/coumarone resins which find extensive application, especially in the padhesives, as reinforces and tackifiers in the production of commercial rubber products,manufacture (17].
1.2 Potential of Yield Products.
Static bedreactor
TGA analyzerin Helium asan inert gas.
Fluidised bedpyrolysis
Smaller scalefixed bedreactor withshorter gasresidence hotzone.
Rotary Klinreactor
Equipmentused
Char yielddecreased from40~/o to36~/o as thetemperatureincreased.
% CharRemarks
Char nearlyconstant atmean value37.8wt% as thetemperatureincreased.
Small influenceof temperaturein char ield.
The char yielddecreased asthe heating rateincreased
Decreased charyield from56.6wt% to40.2~/o as thetemperatureincreased.
Increased ofchar yield asthe temperatureincreased.
Char yieldincreased from38~/o to40wt% as thetemperatureincreased.
120s
Shortergasresidence.
ResidenceTime
20K/min80K/min
5Kmin-1
Heatingrate
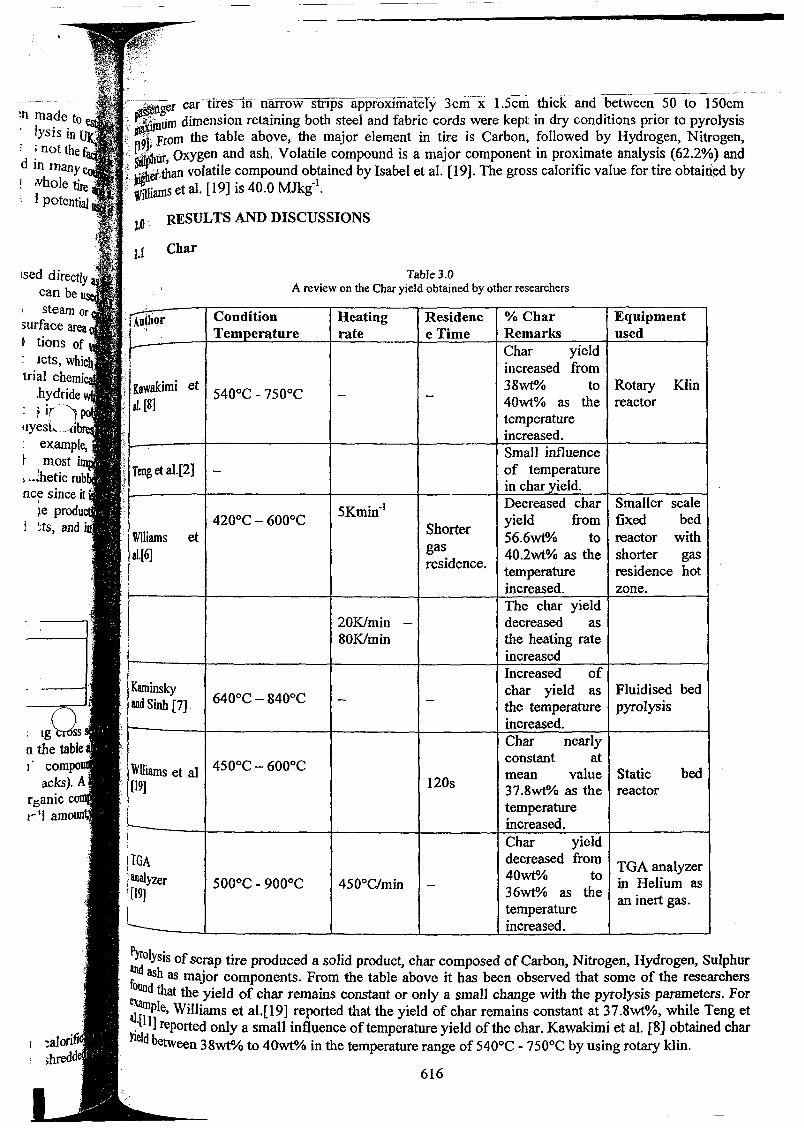
Table 3.0A review on the Char yield obtained by other researchers
ConditionTem erature
et
616
~OIYSiS of scrap tire produced a solid product, char composed of Carbon, Nitrogen, Hydrogen, SulphurfI ash as major components. From the table above it has been observed that some of the researchers°und that the yield of char remains constant or only a small change with the pyrolysis parameters. For~Ple, Williams et al.[19] reported that the yield of char remains constant at 37.8~1o, while Teng et:\ 1] reported only a small influence of temperature yield of the char. Kawakimi et al. [8] obtained char
Yie dbetween 38~.Io to 40wt% in the temperature range of 540°C - 750°C by using rotary kIin.
"'~--~-(Jer cartires--ln narrow stripS approXllnateTy:3cm-XCScm thick and--between 50 to 150cmtim dimension retaining both steel and fabric cords were kept in dry conditions prior to pyrolysis
'9jFrom the table above, the major element in tire is Carbon, followed by Hydrogen, Nitrogen,~hlit, Oxygen and ash. Volatile compound is a major component in proximate analysis (62.2%) and~edhan volatile ~ompound o~~ined by Isabel et al. [19]. The gross calorific value for tire obtained byWilliams et a1. [19] IS 40.0 MJkg .
1.0 - RESULTS AND DISCUSSIONS
2J Char
: IgQS.n the table,
compoacks). A
r5anic cIr'l amoun~:
!sed directlycan besteam or
surface areaI· tions of: lets, whicbtrial chemi
,hydride: ~ ir-~
Ilyest... ---lIb~ example,~ most Unf ••~hetic rub :nee since it .
~e produJ ;ts, and'.
:n made to; lysis in: ; not the f:d in many! Nhole tire: I potential
Obtained maximoil ield at 32.5wt"A
Obtained23wtO/o oil.
Obtained oil40wt% at T= 64and 27wt% at t,
840oe.
Results
eontinously-fedvertical reactor wothrotating grate purgedby a counter currentofNitro en.
Rotary Klin Reactor
Small scale 50g,Nitrogen purge bedreactor
Static bed reactor
Large scale 1 tonnebatch tire rol sis unit
Rotary klin reactor
Fluidised bed reactor
E ui ment
120 s
Residence Time E ui ment
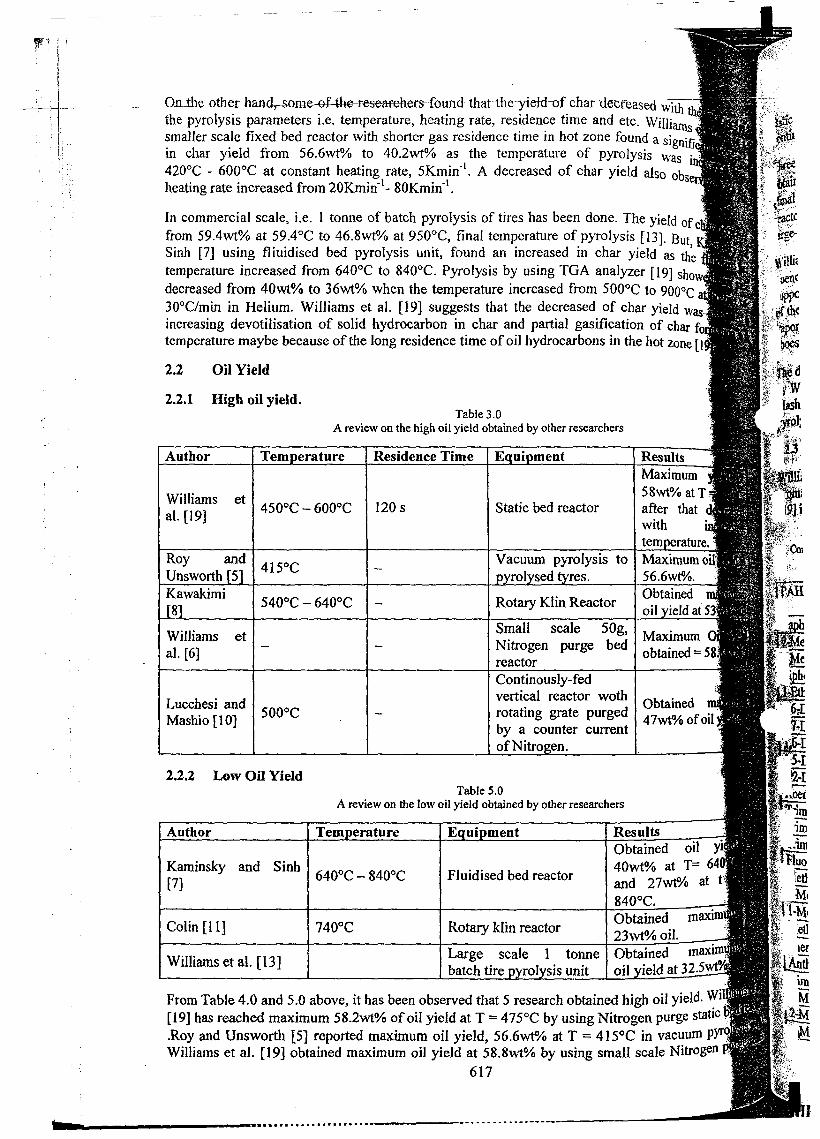
Table 5.0A review on the low oil yield obtained by other researchers
Table 3.0A review on the high oil yield obtained by other researchers
Tern erature
Tern erature
Williams et al. [13]
Author
Kaminsky and Sinh[7] 6400 e - 8400e
Colin [11]
Kawakimi8]
Lucchesi andMashio llO)
Roy andUnsworth 5
Williams etal. [6]
Williamsal. [19]
Author
2.2.1 High oil yield.
From Table 4.0 and 5.0 above, it has been observed that 5 research obtained high oil yield. Wi[19] has reached maximum 58.2wt% of oil yield at T =475°e by using Nitrogen purge static ','.Roy and Unsworth [5] reported maximum oil yield, 56.6wt% at T = 415°e in vacuum pyrWilliams et al. [19] obtained maximum oil yield at 58.8""1% by using small scale Nitrogen
617
2.2.2 Low Oil Yield
On.1he otherhand,wrne of the researchers-found"thattheyiefd-of char decreased \viththe pyrolysis parameters i.e. temperature, heating rate, residence time and etc. Williamssmaller scale fixed bed reactor with shorter gas residence time in hot zone found a sign' fjin char yield from 56.6wt% to 40.2wt% as the temperature of pyrolysis was 1.1
4200 e - 6000 e at constant heating rate, 5Kmin· l. A decreased of char yield also obs .
heating rate increased from 20Kmin-1- 80Kmin-l
• '
In commercial scale, i.e. 1 tonne of batch pyrolysis of tires has been done. The yield of cfrom 59.4wt% at 59.4°e to 46.8wt% at 950oe, final temperature of pyrolysis [13]. ButSinh [7] using fliuidised bed pyrolysis unit, found an increased in char yield as th~
temperature increased from 6400 e to 840oe. Pyrolysis by using TGA analyzer [19] show'decreased from 40""t% to 36wt% when the temperature increased from 5000 e to 9000C30oe/min in Helium. Williams et al. [19] suggests that the decreased of char yield wasincreasing devotiIisation of solid hydrocarbon in char and partial gasification of char fitemperature maybe because of the long residence time of oil hydrocarbons in the hot zone [I
2.2 Oil Yield
..' ..----------_ _----_ _----------------
. With-tire
.. :ams et '
l gnificantwas iner
; observed'
ield of char] 3ut, Kalll'
the flui9] showed~ O°C at h,I :i was a. char fo
: me [19].
! (-'". )-_..//
I S---:.ulUm yielto/ at T =4. hat dec
mc>erature.,umoilyi, %.
~ined max:'i :l at 53wtf
j d. Willi'e static bed)
n pyrol,)gen P
I
----------- -
-- ,.,-----'------
1bed -reactor 'while~'Lucchesi and Masnio[ 10] obtained 47wt% at T = 500°C by using'i>usly-fed vertical reactor with rotating grate purged by counter-current Nitrogen gas.
"authors reported that they obtained a low oil yield. Kaminsky and Sinh [7] reported that they, maximum oil yield 40wt% at temperature 640°C and decreased to 27wt% at temperature 840°C~ll1perature) in Fluidized bed reactor. Colin [11] reported 23wt% oil yield by using rotary kIin:~perated at 740Q C. Finally, Williams et a1. [13] obtained oil yield of maximum 32.5wt% forcale 1 tonne batch tire pyrolysis unit.
",(~i"3mS et al. [19] mentioned that higher heating rates with short hot zone residence time and rapiding of the products regarded as favoring the formation of liquid products. This statement is
'fted other authors findings. Roy and Unsworth [5] obtained 56.6wtOJO of oil yield by rapid removal: gasses by the vacuum process reactor.Cypress and Bettens [12] increased the removal pyrolysis
Ar~ from scrap tires from secondary hot zone by increasing the flow of Nitrogen carrier. The result~~tJiat by reducing the secondary reaction, the yield of oil increased.
.j';", ~,
, l'ht'~eCreased in oil yield with increasing temperature and corresponding increased in gas yield observed, b)I~WIliarriS et a1. [19]. Other workers, such as, Williams et a1. [6,13], Kaminsky and Sinh, Luches and~bio [10] all found significant decreased in oil yield and increased of gas yield as the temperature ofP}TQlysis is increased.
11J Polycyclic Aromatic HydrocarbonIn:,';
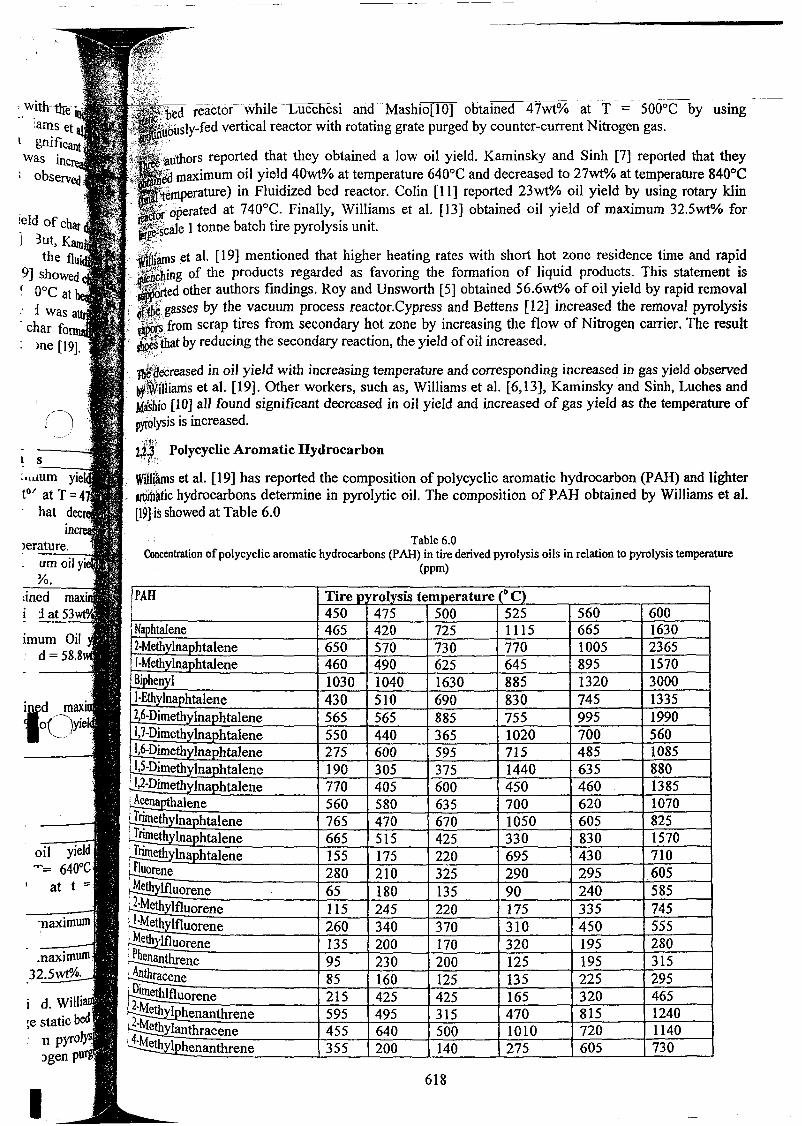
Wllli)ms et a1. [19] has reported the composition of polycyclic aromatic hydrocarbon (PAH) and lighterart>itJlltic hydrocarbons determine in pyrolytic oil. The composition of PAH obtained by Williams et al.[19]is showed at Table 6.0
Table 6.0Concentration ofpolycyclic aromatic hydrocarbons (PAH) in tire derived pyrolysis oils in relation to pyrolysis temperature
(ppm)
IPAR Tire v "rolysis temperature (0 C)! 450 475 500 525 560 600,I Naphtalene 465 420 725 1115 665 16302-Methylnaphtalene 650 570 730 770 1005 2365I·Methylnaphtalene 460 490 625 645 895 1570
I Biphenyl 1030 1040 1630 885 1320 3000I·Ethylnaphtalene 430 510 690 830 745 13352,6-DimethYlnaphtalene 565 565 885 755 995 19901.7-Dimethvlnaphtalene 550 440 365 1020 700 5601,6-Dimethvlnaphtalene 275 600 595 715 485 10851.5·Dimethvlnaphtalene 190 305 375 1440 635 880
U.2-Dhnethylnaphtalene 770 405 600 450 460 1385l Acenapthalene 560 580 635 700 620 1070~rimethYlnaphtalene 765 470 670 1050 605 825lJrimethylnaphtalene 665 515 425 330 830 1570,TrimethYlnaphtalene 155 175 220 695 430 710:Fluorene 280 210 325 290 295 605iMe~lfluorene 65 180 135 90 240 585:2·Methylfluorene 115 245 220 175 335 745: I'Methylfluorene 260 340 370 310 450 555;Met.!!}'lfluorene 135 200 170 320 195 280~ Phenanthrene 95 230 200 125 195 315.Anthracene 85 160 125 135 225 295D'
:2unethlfluorene 215 425 425 165 320 465i 2-MethYlohenanthrene 595 495 315 470 815 1240, 'Methylanthracene 455 640 500 1010 720 1140i 4'Met~lphenanthrene 355 200 140 275 605 730
618
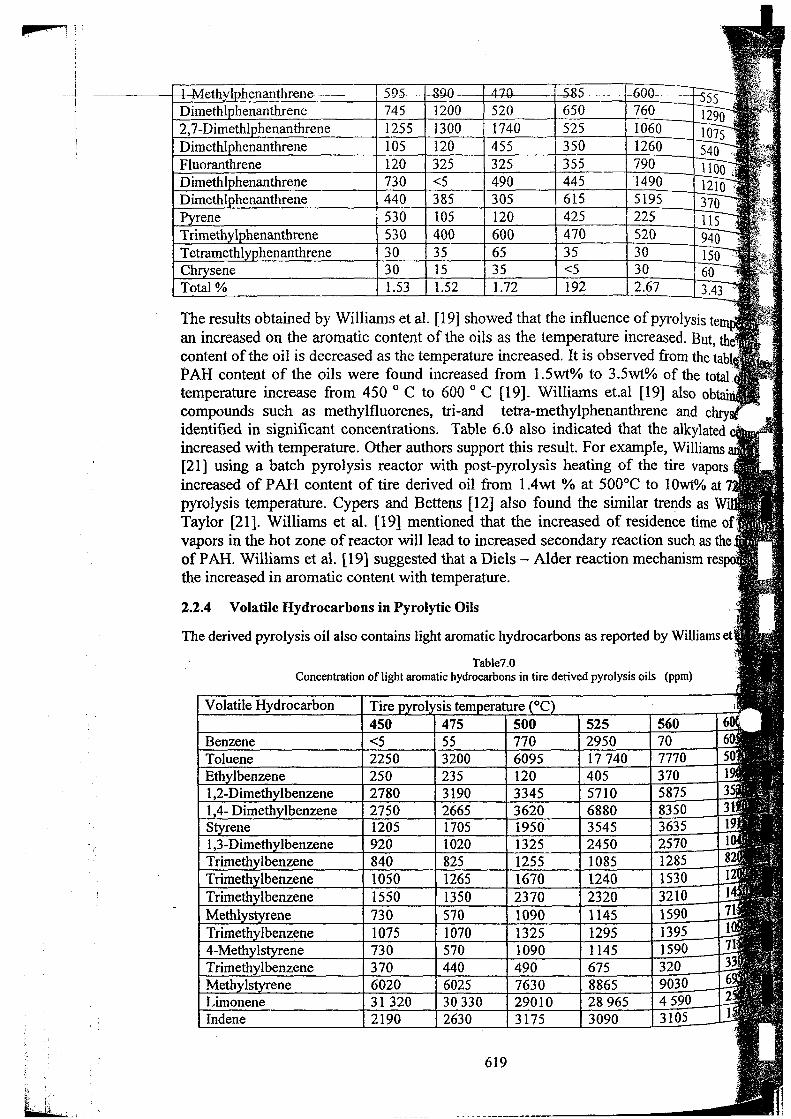
The results obtained by Williams et al. [19] showed that the influence of pyrolysis teman increased on the aromatic content of the oils as the temperature increased. But, thcontent of the oil is decreased as the temperature increased. It is observed from the tabtPAH content of the oils were found increased from 1.5wt% to 3.5wt% of the totaltemperature increase from 450 0 C to 600 0 C [19]. Williams et.al [19] also ob '.compounds such as methylfluorenes, tri-and tetra-methylphenanthrene and chryidentified in significant concentrations. Table 6.0 also indicated that the alkylatedincreased with temperature. Other authors support this result. For example, Williams[21] using a batch pyrolysis reactor with post-pyrolysis heating of the tire vaporsincreased of PAH content of tire derived oil from 1Awt % at 500°C to 10wtOio at 7pyrolysis temperature. Cypers and Bettens [12] also found the similar trends as W'Taylor [21]. Williams et aI. [19] mentioned that the increased of residence time ofvapors in the hot zone of reactor will lead to increased secondary reaction such as theof PAH. Williams et al. [19] suggested that a Diels - Alder reaction mechanism resthe increased in aromatic content with temperature.
2.2.4 Volatile Hydrocarbons in Pyrolytic Oils
The derived pyrolysis oil also contains light aromatic hydrocarbons as reported by Williams et .
Table7.0Concentration of light aromatic hydrocarbons in tire derived pyrolysis oils (ppm)
Volatile Hydrocarbon Tire450 475 500 525 560<5 55 770 2950 702250 3200 6095 17740 7770250 235 120 405 3702780 3190 3345 5710 58752750 2665 3620 6880 83501205 1705 1950 3545 3635920 1020 1325 2450 2570840 825 1255 1085 12851050 1265 1670 1240 15301550 1350 2370 2320 3210730 570 1090 1145 15901075 1070 1325 1295 1395730 570 1090 1145 1590370 440 490 675 3206020 6025 7630 8865 903031320 30330 29010 28965 45902190 2630 3175 3090 3105
619
f;:;
~L...USbj"-',.tt
"-, i -- - --- -- -- ----------------
:olysis t
But,the
f the to ', 0 ob
d ,/-,
alkyk_
I iams: aporslwt% at
l as Wiime of
.ch as the,t respo',
the concentration of VolatiteuAromatic Hydrocarbon (VAHLTh~c:P11c~ntrations of VAH _tconcentratlons, [19]. This statement is supported by other researchers, such as, Williams
arted 0.47 wt% toluene, I.78wt% xylene/limonene up to 7.43wt% of pyrolysis oil in a smallpurge static batch reactor at 420°C. The table indicated that the concentration of VAH)th increasing temperature from 525°C to 560°C, but at higher temperature, 600°C the
of VAH decreased. When the temperature of pyrolysis increased, the concentration ofcreased but concentration of benzene, toluene and styrene increased. Similarly, Pakdel et al.
Jd tires in a 3.5kglh found that increasing temperature of the hearts in the vacuum pyrolysis60e to 510°C result an increase in the concentration of benzene, toluene and xylenes but,
toncentration of limonene. Cypres and Bettens [12] obtained higher concentration of volatileom the pyrolysis of tires with post-pyrolysis vapors. Wolfson et al. [9] used fixed bed batch,tires obtained significant concentration of benzene,toluene xylene and styrene in oil derived6ed by temperature. In addition, Kaminsky and Sinh [7] reported high concentration of"atic compounds by using fluidized bed pyrolysis unit at temperature range from 6400 e to,iamS et al. [19] suggested that above the pyrolysis temperature 525 - 560°C, the degradatione occur, results the consequent decreased in concentration of Limonene in oil. TheofLimonene at higher temperature has reported by other researchers [14,16,18].
al. [19] analysed gas yield in packed column gas chromatography and indicated H2, C~, COd minor concentration of other hydrocarbon gasses. Butadiene, C4Hti was the main gasis formed from the thermal degradation of the polymer butadiene-styrene rubber used in the
e of tires [19]. This findings is supported by other authors, for example, Cypress and Bettensested that methane and ethane result from secondary aromatization reactions which produce'ydrocarbons. Roy and Unsworth [5] and Kaminsky and Sinh [7] have also shown the gas phase, mainly of H2, CO, COl. and hydrocarbons including C~, C2Hti, C2H4, C2~, C3Hs, C3~,
and C4~' Other authors' detected the presence of other product such as S02 and NH3y Teng et al. [2] and H2S detected by Wolfson and co-workers. The gasses generated have a
t calorific value in the order of 40MJ/m3 and it has been suggested that the gasses may be used;,the total energy requirement of the pyrolysis plant, [19].
ation of char involve in several factor, such temperature, heating rate, residence time,.Jeactor, efficiency of heat transfer from hot surfaces within tire mass and gas residence
lime:'~ hot zone. Higher heating rates with short hot zone residence time and rapid quenching of. dJe~rOducts regarded as favoring the formation of liquid products. Increasing the temperature of
pyro1isis caused decreased in concentration of Limonene, but increasing concentration ofbenzene, toluene and styrene.
5.0 REFERENCES
I. J.W,Jang, T.S.Yoo, J.H.Oh, I. Iwasaki, Conser.Recycl. 22(1998) 1-14.
2. H.Teng, M.A. Serio, R.Bassilakis, P.W. Morrison, P.R. Solomon, Am.Chem.soc.Div.Fue1 Chern.27, (1992) 533-554.
P.T.Williams, S.Besler. T.D. Taylor, Fuel 69 (1990) 1474-1482.
C. Roy, J. Unsworth, Pilot plant demonstration of used tyres vacuum pyrolysis, in: G.L. Ferrero,K.Maniatis, A. Buekens, A.V. Bridgwater (Eds.), Pyrolysis and Gasification, Elsevier AppliedScience,London, UK, 1989.
W. Kaminsky, H. Sinn, Pyrolysis of plastic waste and scrap tyres using a fluidised bed process, in:J:L. Jones, S.B. Radding (Eds.), Thermal Conversion of Solid Wastes and Biomass, ACS SympoS1U1llSeries 130, American Chemical Society Publishers, Washington DC, 1980.
620
-------,---- ----
Pi
- --6. S. Kawak~~anaka; T;Sakai,Fyr-elysisprocess-for--scra '.S.B.Radding (Eds.), Thermal Conversion of Solid Wastes and Biomass, ACS Sy~ t
130,American Chemical Society Publishers, Washington DC, 1980.
7. D.E. Wolfson, J.A. Beckman, J.G. Walters, DJ. Bennett, Destructive distillation ofUSDept. ofInterior, Bureau of Mines Report ofInvestigations 7302 (1969).
8. G.. Collin, Pyrolytic recovery of raw materials from special wastes, in: J.t. I'Radding(Eds.), Thermal Conversion of Solid Wastes and Biomass, ACS Symposium'AmericanChemical Society Publishers, Washington DC, 1980.
9. R Cypres, B. Bettens, Production of benzoles and active carbon from wasteplasticmaterials by means of pyrolysis with simultaneous post-cracking, in: G.L. FManiatis, A.Buekens, A.V. Bridgwater (Eds.), Pyrolysis and Gasification, Elsevier AppliLondon,UK, 1989.
621
----- -
International Conference on Environment 2006 (ICENV 2006)J3-J5 November 2006, Penang, Malaysia.
ADSORPTION OF METHYLENE BLUE DYE USINGACTIVATED CARBON ADSORBENT FROM WASTE TIRES
NURULHUDA AMRI, RIDZUAN ZAKARIA* and MOHAMAD ZAILANI ABU BAKARSchool ofChemical Engineering. Engineering Campus, Universiti Sains Malaysia,
14300 Nibong Tebal, Penang, Malaysia*Corresponding author. Fax: +604-5941013
Email address:[email protected]
ABSTRACT
The adsorption of methylene blue dye from aqueous solutions on activated carbon from wastetires was studied in a batch system at initial concentration (l00-500mg/L) at temperature30°C. The activated carbon was prepared using two-step chemical activation with potassiumhydroxide (KOH) at ratio KOH/char = 3. The carbonization process is at 600°C for 1 hourwith nitrogen flowrate 100ml/min followed by activation with the same nitrogen flowrate at760°C for 1 hour. The adsorption isotherms were determined by shaking 0.1 g of activatedcarbon with 100mi methylene blue dye solutions. The initial and final concentrations ofmethylene blue in aqueous solution were analyzed by UV-Visible Spectrophotometer(Shimadzu, UV-I60I) at wavelength of 665nm. The experimental isotherm data wereanalyzed using Langmuir and Freundlich isotherm models. The results show that Langmuirisotherm describes the experimental data well. Adsorption capacity of the adsorbent obtainedfrom Langmuir model up to 227.27 mg/g.
Keywords: Methylene blue dye; Activated carbon; Chemical activation; Adsorptionisotherms.
INTRODUCTIONThe disposal of tires represents a major environmental issue throughout the world.
Globally more than 330 million tires are discarded every year and accumulated over the yearsin different countries [1]. The disposal and reprocessing tires are difficult since they containcomplex mixture of different materials such as rubber, carbon black, steel cord and otherorganic and inorganic minor components [2].
Waste tires that have been increasingly taking up large amount of valuable landfillspace have been considered as an alternative precursor for activated carbons [3-8]. Generallythere are two processes for preparation of activated carbon: physical activation and chemicalactivation. Physical activation involves carbonization of carbonaceous materials followed byactivation of the resulting char in the presence of activating agents such as C02 or steam.While, chemical activation is known as a single or two step method of preparation ofactivated carbon in the presence of chemical agents. The chemical activation usually takesplace at a temperature lower than that used in physical activation, therefore it can improve thepore development in the carbon structure because the effect of chemicals. The carbon yieldsof chemical activation are higher than physical one [9].
The adsorption process is used for the removal of colors, odors, biological matter andorganic matter from process or waste effluents [10]. Activated carbons are the most widelyused adsorbents due to their adsorption abilities for organic pollutants. The high adsorptioncapacities of activated carbons are usually related to their high surface area, pore volume andporosity. Microporous carbons are generally used in gas-phase adsorption because of the
International Conference on Environment 2006 (ICENV 2006)13-15 November 2006, Penang, Malaysia.
small gas molecules, whereas mesoporous carbons are mostly used in liquid-phase adsorption[II]. With the existence of mesopores in carbon the diffusion in large or hydrated moleculesto the carbon interior would be less obstructive, hence the equilibrium capacity of the carbonwould be high [12].
Aqueous adsorption tests were conducted on produced activated carbon with the aimof producing further evidence about their porous structure and also for assessing potentialapplications in the water treatment industry. The adsorption properties of active carbon aregenerally estimated by detennining the isothenn of adsorption from liquid phase. Adsorbatescan serve as a model compound for checking the adsorption of medium size organicsmolecules from aqueous solutions.
The aim of this work was to investigate the adsorption of dye on prepared activatedcarbon using methylene blue as a model component. Laboratory batch isothenn studies wereconducted to evaluate the adsorption capacity of activated carbon. The effects of contactstime and initial adsorbate concentration were studied. The Langmuir and Freundlich isothennmodels were tested for their applicability. The results intend to offer the tire derived carbonsa potential application in the field ofwastewater treatment.
EXPERIMENTAL PROCEDUREPreparation of the activated carbon by KOH activation. The experiments will be carriedout initially by carbonization process. A certain amount of waste tires (diameter = 0.425 mm)was put on the tray and placed inside the batch muffle furnace. The temperature was rampedfrom the ambient temperature to 600°C and kept for I hour under nitrogen flow rate. The charproduct then was cooled down to room temperature and stored in an air tight container.
The next step is impregnation procedure. The tire char was well dispersed in KOHsolutions in a stainless steel beakers with water:KOH:char equal to 3:3:1 by mass, denoted asthe KOH/char ratio = 3. The beaker was immersed in a constant temperature shaker bath. Themixing will be perfonned at 30°C and lasted 3 hr to make sure the potassium hydroxidepellets were completely dissolved. Then the beaker was placed inside an oven at temperature110°C for 24 hour for dehydrating purpose.
The chemically treated char was placed inside a batch muffle furnace reactor and heatedto 760°C under nitrogen flow of 100 ml/min for I hour. The activated product was cooledunder the nitrogen flow to room temperature and washed with deionized water. The samplewas then poured to a beaker containing 0.1 M HCI (250cm3
) and stirred for I hour. They werefinally washed with hot water until the conductivity of the filtrate is less than I0J.ls. This is toensure that all the KOH used for activation is removed before the carbon is taken forcharacterization. The carbon will be dried at 105°C until it is bone dry and stored in air tightsample holder.
Procedures for adsorption experiments. The activated carbon was characterized for itsadsorption capacity using methlene blue dye. A methylene blue solution of 1500mg/m3
concentration was prepared in appropriate volumetric flask. The stock solution will be dilutedto the desired initial concentrations (100-500 mg/L) for batch equilibrium studies. An amountofO.lg of activated carbon will be introduced into a 100mi of 100 to 500mg/L of methyleneblue solution, and kept in a laboratory shaker for 48 hours at 30°C. The samples will bewithdrawn at appropriate time interval using a glass syringe to detennine the residualconcentration of the solutions. For high concentrations, 0.1 cm3 of the solution will bewithdrawn and diluted to 50 cm3 using deionized water before detennining the residualconcentration using UV-Spectrophotometer at 665nm wavelength for methylene blue dye.
The amount of adsorbates adsorbed at time, qt and at equilibrium condition, qe will becalculated according to the Equation (l) and (2) below.
International Conference on Environment 2006 (ICENV 2006)13-15 November 2006, Penang, Malaysia.
(Co -Ct)Vqt =
w(1)
(2)
Where Co and Ce are initial and equilibrium adsorbate concentration, mglL. Ct is adsorbateconcentration at time, mg/L. V is volume of solution, L and w is weight ofadsorbent, g.
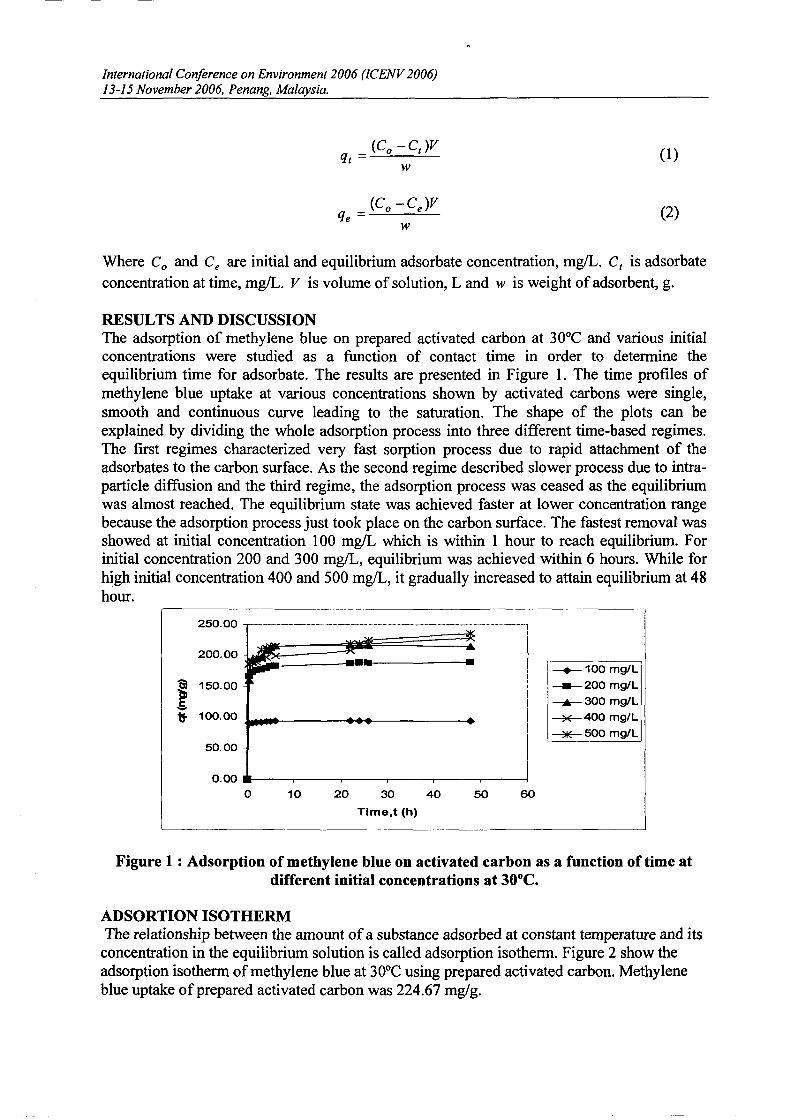
RESULTS AND DISCUSSIONThe adsorption of methylene blue on prepared activated carbon at 30°C and various initialconcentrations were studied as a function of contact time in order to determine theequilibrium time for adsorbate. The results are presented in Figure 1. The time profiles ofmethylene blue uptake at various concentrations shown by activated carbons were single,smooth and continuous curve leading to the saturation. The shape of the plots can beexplained by dividing the whole adsorption process into three different time-based regimes.The first regimes characterized very fast sorption process due to rapid attachment of theadsorbates to the carbon surface. As the second regime described slower process due to intraparticle diffusion and the third regime, the adsorption process was ceased as the equilibriumwas almost reached. The equilibrium state was achieved faster at lower concentration rangebecause the adsorption process just took place on the carbon surface. The fastest removal wasshowed at initial concentration 100 mglL which is within 1 hour to reach equilibrium. Forinitial concentration 200 and 300 mg/L, equilibrium was achieved within 6 hours. While forhigh initial concentration 400 and 500 mglL, it gradually increased to attain equilibrium at 48hour.
250.00 -_ -.--.-..--.-.._ - - - --- - -..-.. - -- --..-----.- ----..----..-·--·····--······--1
200.00
, 150.00
-'tf' 100.00 Ml..----....-------+
-+-100 mg/L____ 200 mg/L
----.- 300 mg/L
~400mg/L
---7IE- 500 mg/L50.00
605020 30 40
Time,t (h)
10
0.00 .._--,----,------.---,-------,----1o
Figure 1 : Adsorption of methylene blue on activated carbon as a function of time atdifferent initial concentrations at 30°C.
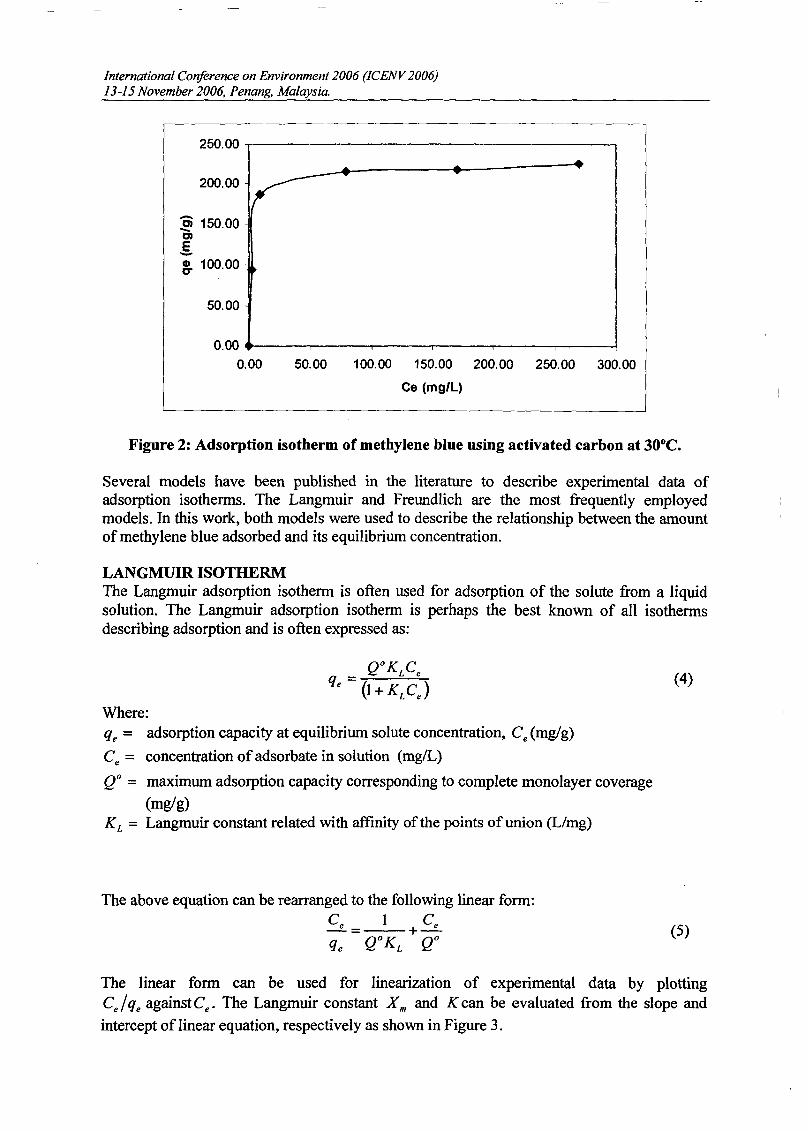
ADSORTION ISOTHERMThe relationship between the amount of a substance adsorbed at constant temperature and its
concentration in the equilibrium solution is called adsorption isotherm. Figure 2 show theadsorption isotherm ofmethylene blue at 30°C using prepared activated carbon. Methyleneblue uptake ofprepared activated carbon was 224.67 mg/g.
International Conference on Environment 2006 (ICENV 2006)/3-15 November 2006, Penang, Malaysia.
250.00 -r----------------------,
200.00
:§i 150.00ClE-8- 100.00 ~
50.00
100.00 150.00 200.00 250.00 300.00
Ce (mg/L)
50.00
0.00 .-.----,-----;---.,...---....,-------,-----1
0.00
Figure 2: Adsorption isotherm of methylene blue using activated carbon at 30°C.
Several models have been published in the literature to describe experimental data ofadsorption isotherms. The Langmuir and Freundlich are the most frequently employedmodels. In this work, both models were used to describe the relationship between the amountofmethylene blue adsorbed and its equilibrium concentration.
LANGMUIR ISOTHERMThe Langmuir adsorption isotherm is often used for adsorption of the solute from a liquidsolution. The Langmuir adsorption isotherm is perhaps the best known of all isothermsdescribing adsorption and is often expressed as:
(4)
Where:qe = adsorption capacity at equilibrium solute concentration, Ce(mg/g)
Ce = concentration of adsorbate in solution (mg/L)
QO = maximum adsorption capacity corresponding to complete monolayer coverage(mg/g)
K L = Langmuir constant related with affinity of the points of union (Llmg)
The above equation can be rearranged to the following linear form:Ce 1 Ce-= +-qe QOKL QO (5)
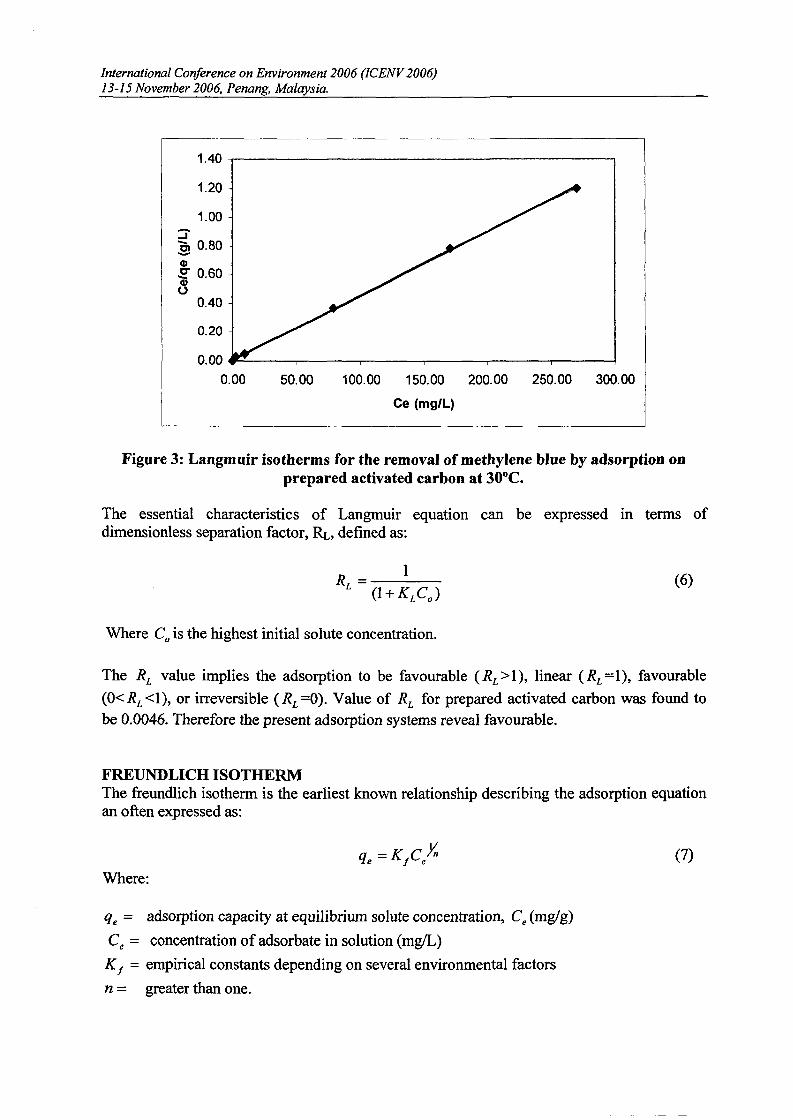
The linear form can be used for linearization of experimental data by plottingCe!qe againstCe • The Langmuir constant X m and Kcan be evaluated from the slope andintercept of linear equation, respectively as shown in Figure 3.
-----~--- -~ ~-
International Conference on Environment 2006 (ICENV 2006)13-15 November 2006. Penang. Malaysia.
1.40 ,-----------------------,
100.00 150.00 200.00 250.00 300.00
Ce (mg/L)
50.00
0.00 ....-=------,---..,----,----,.-----r-----;
0.00
0.20
0.40
::Jm0.80-1.00
1.20
Gl~ 0.60Glo
Figure 3: Langmuir isotherms for the removal of methylene blue by adsorption onprepared activated carbon at 30°C.
The essential characteristics of Langmuir equation can be expressed m terms ofdimensionless separation factor, RL, defined as:
(6)
Where Co is the highest initial solute concentration.
The RL value implies the adsorption to be favourable (RL >1), linear (RL = 1), favourable
(O<RL <1), or irreversible (RL =0). Value of RL for prepared activated carbon was found tobe 0.0046. Therefore the present adsorption systems reveal favourable.
FREUNDLICH ISOTHERMThe freundlich isotherm is the earliest known relationship describing the adsorption equationan often expressed as:
q =KCYne f e(7)
Where:
qe = adsorption capacity at equilibrium solute concentration, Ce(mg/g)
Ce = concentration of adsorbate in solution (mg/L)
K f = empirical constants depending on several environmental factors
n = greater than one.
International Conference on Environment 2006 (ICENV 2006)13-15 November 2006, Penang, Malaysia.
The equation is conveniently used in the linear form by taking the logarithmic of both sidesas:
1logqe =logK j +-logCen
(8)
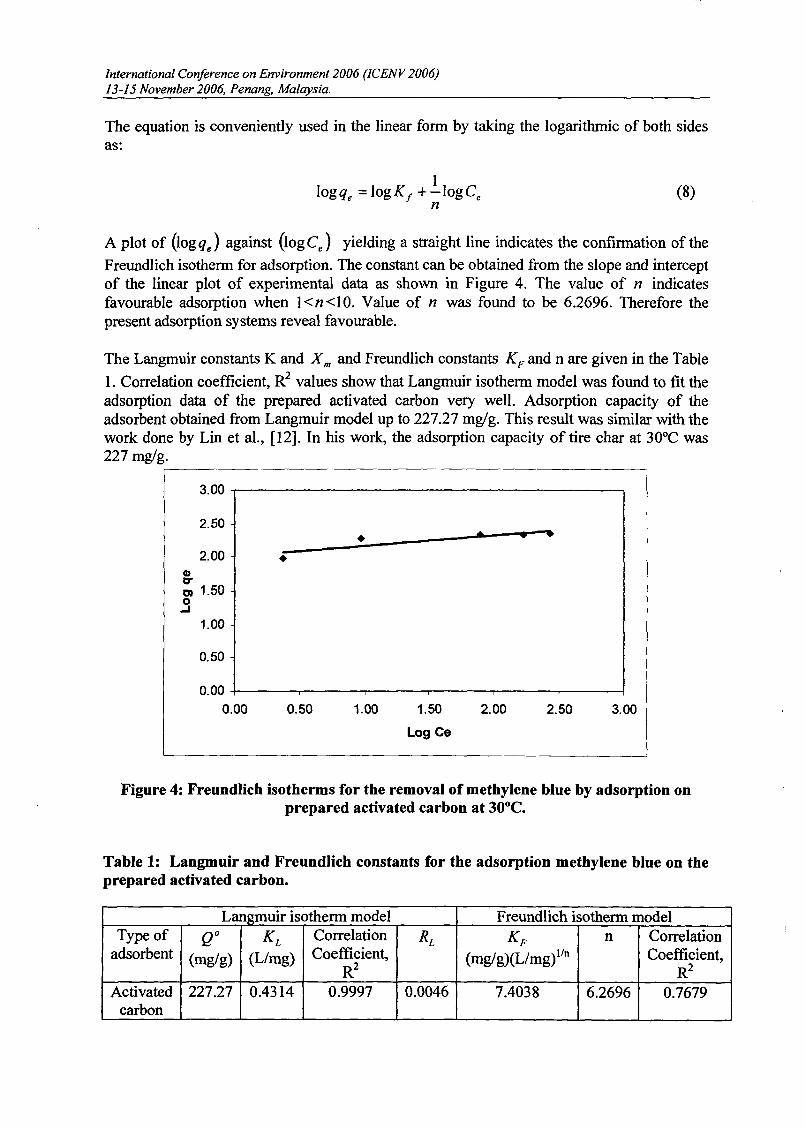
A plot of {logqJ against (IogCJ yielding a straight line indicates the confinnation of the
Freundlich isotherm for adsorption. The constant can be obtained from the slope and interceptof the linear plot of experimental data as shown in Figure 4. The value of n indicatesfavourable adsorption when 1< n <10. Value of n was found to be 6.2696. Therefore thepresent adsorption systems reveal favourable.
The Langmuir constants K and X m and Freundlich constants KFand n are given in the Table
1. Correlation coefficient, R2 values show that Langmuir isotherm model was found to fit theadsorption data of the prepared activated carbon very well. Adsorption capacity of theadsorbent obtained from Langmuir model up to 227.27 mg/g. This result was similar with thework done by Lin et aI., [12]. In his work, the adsorption capacity of tire char at 30°C was227 mg/g.
3.00 ,-----------------------,
2.50
• • .....2.00 •
CDc:rCD 1.50o
..J
1.00
0.50
3.002.502.001.50
Log Ce
1.000.50
0.00 -f-----,---...,----,...-----,------r-----l
0.00
Figure 4: Freundlich isotherms for the removal of methylene blue by adsorption onprepared activated carbon at 30°C.
Table 1: Langmuir and Freundlich constants for the adsorption methylene blue on theprepared activated carbon.
Langmuir isotherm model Freundlich isotherm modelType of QO KL Correlation RL KF n Correlation
adsorbent (mg/g) (Llmg) Coefficient, (mglg)(Llmg)lIn Coefficient,R2 R2
Activated 227.27 0.4314 0.9997 0.0046 7.4038 6.2696 0.7679carbon
--- --------
International Conference on Environment 2006 (ICENV 2006)13-15 November 2006, Penang, Malaysia.
CONCLUSIONThe experimental data of adsorption studies on methylene blue using prepared activatedcarbon was described well to Langmuir adsorption isotherm model. This indicates thatadsorption of methylene blue from aqueous solutions shows monolayer coverage of theadsorbate on the carbon surface and a full access of the adsorbate to all pores [12].Adsorption capacity of the adsorbent obtained from Langmuir model up to 227.27 mg/g. Thepresent study concludes that the production of activated carbon adsorbents from waste tirerubber can provide a two-fold environmental and economic benefit: A recycling path iscreated for waste vehicles tires and new low-cost adsorbents are produced for commercial usein wastewater treatment.
ACKNOWLEGDEMENTThe authors acknowledge the Long-term IRPA grant provided by MOSTI for this presentwork. The authors also very thankful to the school of Chemical Engineering, Universiti SainsMalaysia for providing the facilities and constant encouragement.
REFERENCES[1] Cunliffe A.M. and Williams P.T., Influence ofprocess conditions on the rate of
activation of chars derived from pyrolysis ofused tyres, Energy Fuels, Vol13(1), 1999, pp166-75.
[2] Rodriguez Isabel, D.M., M.F. Laresgoiti, M.A. Cabrero, A. Torres, M.J. Chomon,B. Caballero, Pyrolysis of scrap tyres, Fuel Proc.Tech, Vol 92, 2001, pp. 9-22.
[3] Merchant, A.A. and M.A. Petrich, Pyrolysis of scrap tires and conversion of charsto activated carbon, AIChE J, Vol 39(8), 1993, pp. 1370-1376.
[4] Sun, J., T.A. Brady, M.J. Rood, C.M. Lehman, M. Rostam-Abadi and A.A. Lizzi,Adsorbed natural gas storage with activated carbons made from Illinois coals andscrap tires, Energy Fuels, Vol 11, 1997, pp. 316-322.
[5] Allen, J.L., J.L. Gatz and P.e. Eklund, Applications for activated carbons from usedtires; butane working capacity, Carbon, Vol 37, 1999, pp.1485-1459.
[6] Teng, H., Y.C. Lin and L.Y. Hsu, Production of activated carbons from pyrolysis ofwaste tires impregnated with potassium hydroxide, Journal Air Waste ManagementAssoc, Vol 50, 2000, pp. 1940-1946.
[7] Ariyadejwanich, P., W. Tanthapanichakoon, K. Nakagawa, S.R. Mukai and HTamon, Preparation and characterization of mesoporous activated carbon fromwaste tires, Carbon, Vol 40-41, 2003, pp. 157-164.
[8] Stavropoulos, G.G., Precursor materials suitability for super activated carbonsproduction, Fuel Processing Technolog, Vol 86,2005, pp. 1165-1173.
[9] Ahmadpour, A., Do and 0.0, The preparation of activated carbon from macadamianutshell by chemical activation, Carbon, Vol 35, 1997, pp. 1723-1732.
[10] Wu, F.e. and R.L. Tseng, Preparation of highly surface area carbon from fir woodby KOH etching and e02 gasification for adsorption of dyes and phenols fromwater, Colloids and Interface Science, Vol 294, 2006, pp. 21-30.
[11] Srinivasakannan, C. and M.Z.A. Bakar, Production of activated carbon from rubberwood sawdust, Biomass & Bioenergy, Vol 27, 2004, pp. 89-96.
[12] Lin, Y.R. and H. Teng, Mesoporous carbons from waste tire char and theirapplication in wastewater discoloration, Microporous and Mesoporous Materials,Vol 54, 2002,pp. 167-174.
- -- ---_._---
Symposium ofMalaysian Chemical Engineers (SOMChE) 2007,11 - 1:ih of December 2007, Selangor, Malaysia
ADSORPTION OF PHENOL USING ACTIVATED
CARBON ADSORBENT FROM WASTE TYRES
NURULHUDA AMRl, RlDZUAN ZAKARlA* and MOHAMAD ZAILANI ABU
BAKAR
School of Chemical Engineering. Engineering Campus, Universiti Sains Malaysia,
14300 Nibong TebaI, Penang, Malaysia
*Corresponding author. Fax: +604-5941013
Email address:[email protected]
ABSTRACT
The adsorption of phenol from aqueous solutions on activated carbon from waste tyres
was studied in a batch system at initial concentration (l00-500mg/L) at temperature
30°C. The activated carbon was prepared using two-step physiochemical activation with
potassium hydroxide (KOH) at ratio KOH/char = 5. The carbonization process is at
800°C for 1 hour with nitrogen flowrate 150ml/min followed by activation with the
carbon dioxide flowrate 150ml/min at 850°C for 2 hour. The adsorption isotherms were
determined by shaking O.lg of activated carbon with IOOml phenol solutions. The initial
and final concentrations of phenol in aqueous solution were analyzed by UV-Visible
Spectrophotometer (Shimadzu, UV-1601) at wavelength of 270nm. The experimental
isotherm data were analyzed using Langmuir and Freundlich isotherm models. The
equilibrium data for phenol adsorption was fit well to both isotherm models with R2 value
0.9911 and 0.9907 respectively. The rates of adsorption were found to conform to the
pseudo-second-order kinetics with good correlation. Adsorption capacity of the adsorbent
obtained from Langmuir model up to 238.095 mg/g.
Symposium ofMalaysian Chemical Engineers (SOMChE) 2007,11 - 1jh ofDecember 2007, Selangor, Malaysia
1.0 Introduction
Phenol and related compounds are toxic to human and aquatic life, creating an oxygen
demand in receiving waters. Phenolic pollutants occur in wastewater of a number of
industries, such as petroleum refineries, petrochemical, steel mills, coke oven plants, coal
gas, synthetic resins, pharmaceuticals, paints, plywood industries, and mine discharge
[Patterson, 1975]. Chronic toxic effects due to the phenol pollution reported in humans
include vomiting, anorexia, difficulty in swallowing, liver and kidney damage,
headhache, fainting and other mental disturbances [Fawell, 1988]. The demand for the
removal of organics compounds including phenol has been increased by the increasing
the industrial wastewaters. The Department of Environment (DOE) of Malaysia has set
the maximum concentration of phenol as O.OOlmglL for standard A and 1.0mglL for
standard B in the industrial effluent discharge to Malaysia inland waters (Environment
Quality Act, 2001).
These organics compounds are considered as priority pollutants since they are harmful to
organisms at low concentrations and can be toxic when present elevated levels and are
suspected to be carcinogens [Ozkaya, 2006]. Therefore, it is necessary to remove phenol
from industrial effluents before discharging into the water stream.
Various treatment methods are available for removal of phenol including adsorption,
reverse osmosis, chemical oxidation, ion exchange, distillation, precipitation, gas
stripping, solvent extraction, complexation, and bio-remediation [Mukherjee et al, 2006].
Among all these methods, adsorption by activated carbon (AC) is the best and most
frequently used treatment method for separation toxic pollutant from water environment.
The use of activated carbon for adsorption treatment was first recorded more than two
hundred years ago [ ]. In waste water treatment, activated carbon is powerful adsorbent
because it has a large surface area and pore volume, which allows the removal of
organics compounds, heavy metal ions and colors [Hsieh and Teng, 2000]. Although
activated carbon adsorption is considered as the best available technologies for the
Symposium of Malaysian Chemical Engineers (SOMChE) 2007,11 - 1jh ofDecember 2007, Selangor, Malaysia
removal of organic compounds, but it is still considered highly expensive according to
the market price of commercial activated carbon available. Therefore, more inexpensive
and effective activated carbon adsorbent need to be found for removal of phenol in
wastewater treatment so that the strict regulation on the concentration of phenol in
wastewater can be implemented.
Recently, there has been an increasingly amount of literature devoted to the study of
preparation activated carbon from agricultural and solid wastes for the cheaper adsorbent
which can be used for the removal organics compounds such as phenol [(Kennedy et, aI,
2007), (Mukherjee et, al, 2006), (Wu et, al, 2006), (Tseng et, al, 2006), (Wu et, aI, 2005),
(Srivastava et, aI, 2006), (Tanthapanichakoon et. aI, 2005), (Ariyadejwanich et. aI, 2003),
(Miguel et. al, 2003), (Rengaraj et. aI, 2002), (Helleur et. aI, 2001)]. Regarding to the
literature studies, it was proved that, among several solid wastes, activated carbons
prepared from waste tyres are considered highly mesoporous and have remarkably high
adsorption capacity for large molecules (Nakagawa et. aI., 2004). In some applications,
especially those involving large molecules or macromolecules which cannot easily
penetrate into the micropores (<2 run diameter) and adsorb onto them, the activated
carbons should possess not only micropores but also interconnecting mesopores (Hsieh
and Teng, 2000; Tarnai et. aI., 1999).
The purpose of this work was to determine the adsorption potential of prepared activated
carbon from waste tyres for removal of phenol from wastewater. Laboratory batch
isotherm studies were conducted to evaluate the adsorption capacity of the activated
carbon adsorbent. Effects of contacts time and initial phenol concentration have been
investigated. Langmuir and Freundlich isotherm models were tested for their applicability
with the experimental data. The kinetics of adsorption ofphenol on the adsorbent has also
been studied using pseudo-first order and pseudo-second order kinetic models.
Symposium ofMalaysian Chemical Engineers (SOMChE) 2007,11 - 1jh ofDecember 2007, Selangor. Malaysia
2.0 Experimental
2.1 Experimental rig
~------------i
8 ~ :~ - i r---r-------,
I II IIIIIII
~---- \ 10
1 2
3
7
5
Gas Out
Oil
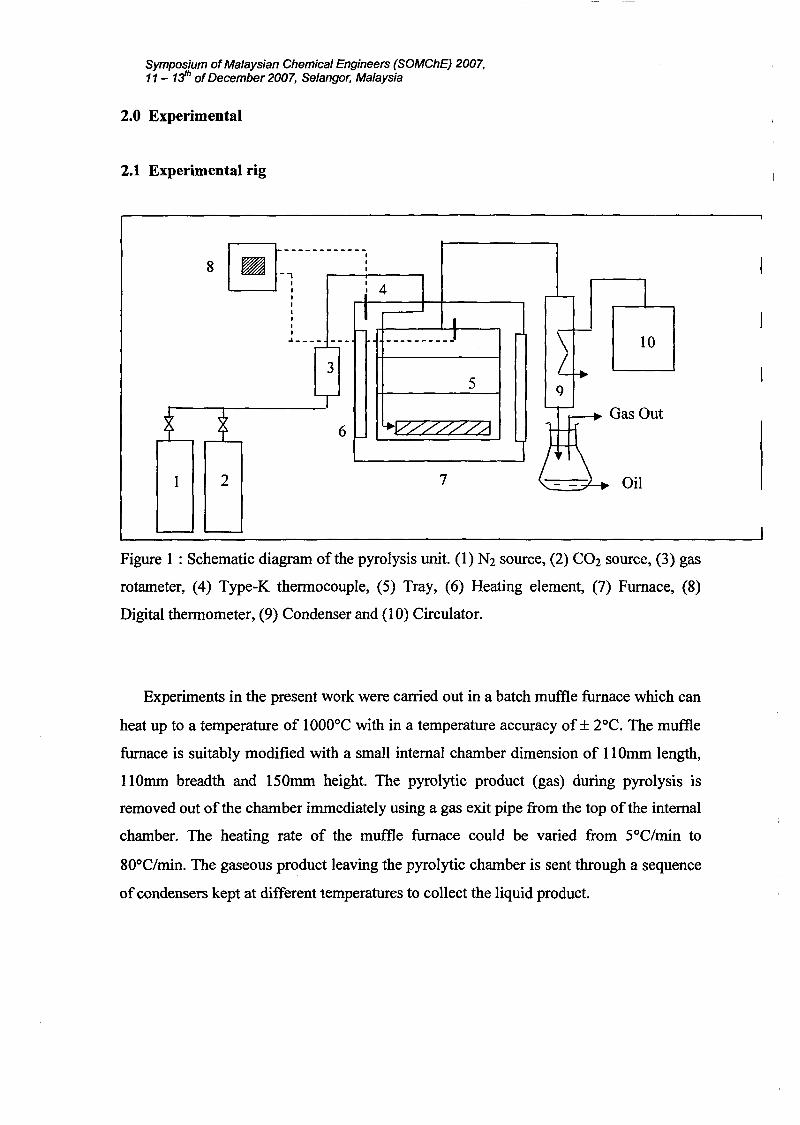
Figure 1 : Schematic diagram of the pyrolysis unit. (1) N2 source, (2) CO2 source, (3) gas
rotameter, (4) Type-K thermocouple, (5) Tray, (6) Heating element, (7) Furnace, (8)
Digital thermometer, (9) Condenser and (10) Circulator.
Experiments in the present work were carried out in a batch muffle furnace which can
heat up to a temperature of 1000°C with in a temperature accuracy of ± 2°C. The muffle
furnace is suitably modified with a small internal chamber dimension of 11 Omm length,
1l0mm breadth and 150mm height. The pyrolytic product (gas) during pyrolysis is
removed out of the chamber immediately using a gas exit pipe from the top of the internal
chamber. The heating rate of the muffle furnace could be varied from SOC/min to
80°C/min. The gaseous product leaving the pyrolytic chamber is sent through a sequence
ofcondensers kept at different temperatures to collect the liquid product.
Symposium ofMalaysian Chemical Engineers (SOMChE) 2007,11 - 1jh ofDecember 2007, Selangor. Malaysia
2.2 Preparation of the activated carbon by physiochemical activation method
The experiments will be carried out initially by carbonization process. A certain
amount of waste tires (diameter = 0.425 mm) was put on the tray and placed inside the
batch muffle furnace. The temperature was ramped from the ambient temperature to
800°C and kept for 1 hour under nitrogen flow rate. The char product then was cooled
down to room temperature and stored in an air tight container.
The next step is impregnation procedure. The tire char was well dispersed in KOH
solutions in a stainless steel beakers with water:KOH:char equal to 5:5:1 by mass,
denoted as the KOH/char ratio = 5. The beaker was immersed in a constant temperature
shaker bath. The mixing will be performed at 30°C and lasted 3 hr to make sure the
potassium hydroxide pellets were completely dissolved. Then the beaker was placed
inside an oven at temperature 110°C for 24 hour for dehydrating purpose.
The chemically treated char was placed inside a batch muffle furnace reactor and
heated to 850°C under nitrogen flow of 150 ml/min. After the temperature reached the
setting point, the gas flow will be switched to carbon dioxide at flow rate of 150 mlImin
for 2 hour. The activated products were then will be cooled under the nitrogen flow to
room temperature. The sample was then poured to a beaker containing 0.1 M HCl
(250cm3) and stirred for 1 hour. They were finally washed with hot water until the
conductivity of the filtrate is less than 1O~s. This is to ensure that all the KOH used for
activation is removed before the carbon is taken for adsorption study. The carbon will be
dried at 105°C until it is bone dry and stored in air tight sample holder.
2.3 Procedures for adsorption experiments
The activated carbon was characterized for its adsorption capacity using phenol. A
phenol solution of 1500mglm3 concentration was prepared in appropriate volumetric
flask. The stock solution will be diluted to the desired initial concentrations (100-500
mg/L) for batch equilibrium studies. An amount of O.lg of activated carbon will be
introduced into a 100ml of 100 to 500mg/L of phenol solution, and kept in a laboratory
shaker for 48 hours at 30°C. The samples will be withdrawn at appropriate time interval
Symposium ofMalaysian Chemical Engineers (SOMChE) 2007,11 - 1i h ofDecember 2007, Selangor, Malaysia
using a glass syringe to determine the residual concentration of the solutions. For high
concentrations, 0.1 cm3 of the solution will be withdrawn and diluted to 50 cm3 using
deionized water before determining the residual concentration using UV
Spectrophotometer at 270nm wavelength for phenol.
The amount of adsorbates adsorbed at time, qt and at equilibrium condition, qe
will be calculated according to the Equation (1) and (2) below.
(1)
(2)
Where Co and Ce are initial and equilibrium adsorbate concentration, mg/L. Ct is
adsorbate concentration at time, mg/L. V is volume of solution, L and w is weight of
adsorbent, g.
3.0 Results and discussion
3.1 Effect initial concentration of phenol
Effect of initial concentration phenol, Coon the adsorption capacity, qt as a function of
time is shown in Fig. 1. The amount of phenol adsorbed per unit weight of adsorbent
increased with increase in phenol concentration. When the initial concentration increased
from 100 to 500 mg/L, the adsorption capacity increased from 58.65 mg/g to 163.21
mg/g. It is because the initial concentration plays an important role which provides the
necessary driving force to overcome the resistances to the mass transfer of phenol
between the aqueous and the solid phases [Srivasta, et. aI, 2006]. The interaction between
phenol and the prepared activated carbon adsorbent also enhances with the increasing of
the initial concentration. Thus, it can be concluded higher initial concentration enhances
the adsorption uptake ofphenol.
Symposium ofMalaysian Chemical Engineers (SOMChE) 2007,11 - 13" ofDecember 2007, Selangor, Malaysia
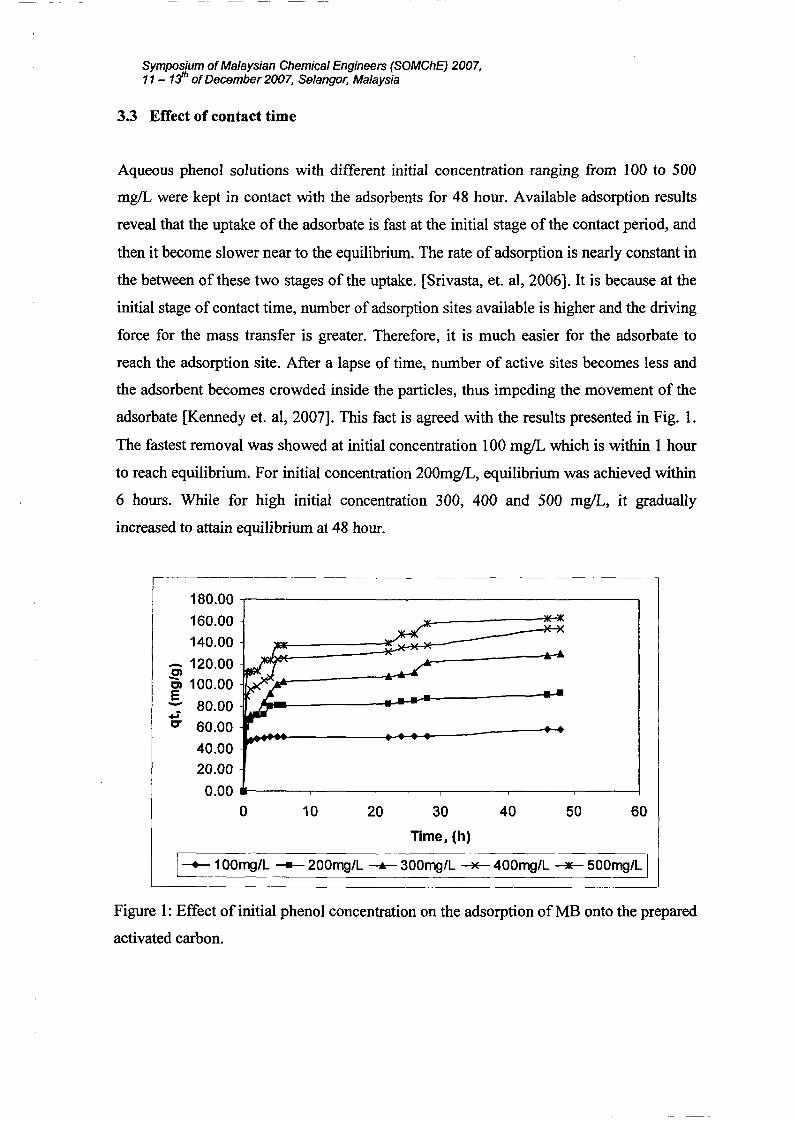
3.3 Effect of contact time
Aqueous phenol solutions with different initial concentration ranging from 100 to 500
mg/L were kept in contact with the adsorbents for 48 hour. Available adsorption results
reveal that the uptake of the adsorbate is fast at the initial stage of the contact period, and
then it become slower near to the equilibrium. The rate of adsorption is nearly constant in
the between of these two stages of the uptake. [Srivasta, et. aI, 2006]. It is because at the
initial stage of contact time, number of adsorption sites available is higher and the driving
force for the mass transfer is greater. Therefore, it is much easier for the adsorbate to
reach the adsorption site. After a lapse of time, number of active sites becomes less and
the adsorbent becomes crowded inside the particles, thus impeding the movement of the
adsorbate [Kennedyet. aI, 2007]. This fact is agreed with the results presented in Fig. l.
The fastest removal was showed at initial concentration 100 mg/L which is within 1 hour
to reach equilibrium. For initial concentration 200mg/L, equilibrium was achieved within
6 hours. While for high initial concentration 300, 400 and 500 mg/L, it gradually
increased to attain equilibrium at 48 hour.
~~~~~--~~~------~-~----
60504030
Time, (h)
2010
180.00 -r----------------------,160.00
140.00
:Ei 120.00C) 100.00E--: 80.00-0" 60.00
40.0020.00
0.00 .........----,-----,-----.,.----,-----,------t
o
[-+- 100mg/L --- 200mg/L -.- 300mg/L~ 400mg/L --.- 500mg/L I
Figure 1: Effect of initial phenol concentration on the adsorption of MB onto the prepared
activated carbon.
50.00 100.00 150.00 200.00 250.00 300.00 350.00
Ce, (mgll)
Symposium of Malaysian Chemical Engineers (SOMChE) 2007,11 - 11" ofDecember 2007, Selangor, Malaysia
3.3 Adsorption isotherms
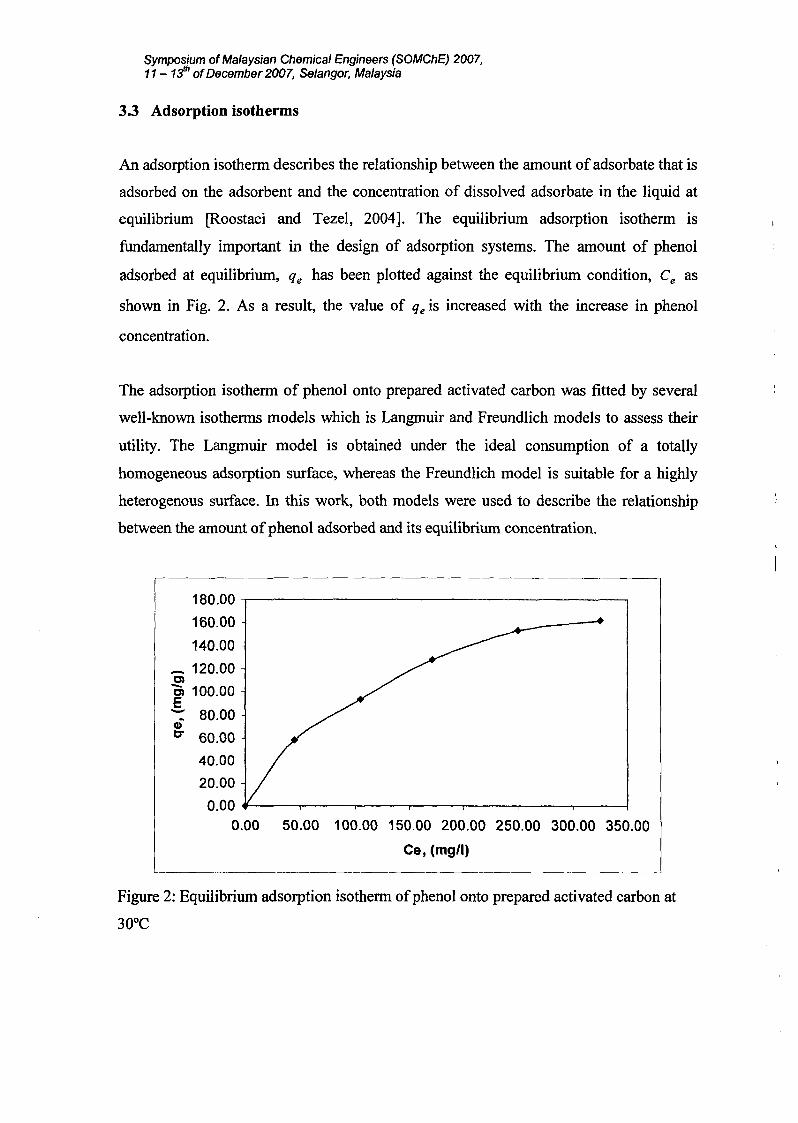
An adsorption isothenn describes the relationship between the amount of adsorbate that is
adsorbed on the adsorbent and the concentration of dissolved adsorbate in the liquid at
equilibrium [Roostaei and Tezel, 2004]. The equilibrium adsorption isothenn is
fundamentally important in the design of adsorption systems. The amount of phenol
adsorbed at equilibrium, qe has been plotted against the equilibrium condition, Ce as
shown in Fig. 2. As a result, the value of qe is increased with the increase in phenol
concentration.
The adsorption isothenn of phenol onto prepared activated carbon was fitted by several
well-known isothenns models which is Langmuir and Freundlich models to assess their
utility. The Langmuir model is obtained under the ideal consumption of a totally
homogeneous adsorption surface, whereas the Freundlich model is suitable for a highly
heterogenous surface. In this work, both models were used to describe the relationship
between the amount ofphenol adsorbed and its equilibrium concentration.
180.00 .------------------------,
160.00
140.00
_ 120.00C)
OJ 100.00E-:: 80.00Q)
C" 60.00
40.00
20.00
0.00 ...-----,,-----,----,---.,.-----,----,-----1
0.00
L- _
Figure 2: Equilibrium adsorption isothenn ofphenol onto prepared activated carbon at
30°C
Symposium ofMalaysian Chemical Engineers (SOMChE) 2007,11 - 1:1h of December 2007, Selangor, Malaysia
3.3.1 Langmuir isotherms
The Langmuir adsorption isotherm is often used for adsorption of the solute from a liquid
solution. The Langmuir adsorption isotherm is perhaps the best known of all isotherms
describing adsorption and is often expressed as:
Where:
qe = adsorption capacity at equilibrium solute concentration, Ce(mg/g)
Ce = concentration of adsorbate in solution (mg/L)
QO = maximum adsorption capacity corresponding to complete monolayer coverage
(mg/g)
KL = Langmuir constant related with affinity of the points ofunion (L/mg)
The above equation can be rearranged to the following linear form:
(4)
(5)
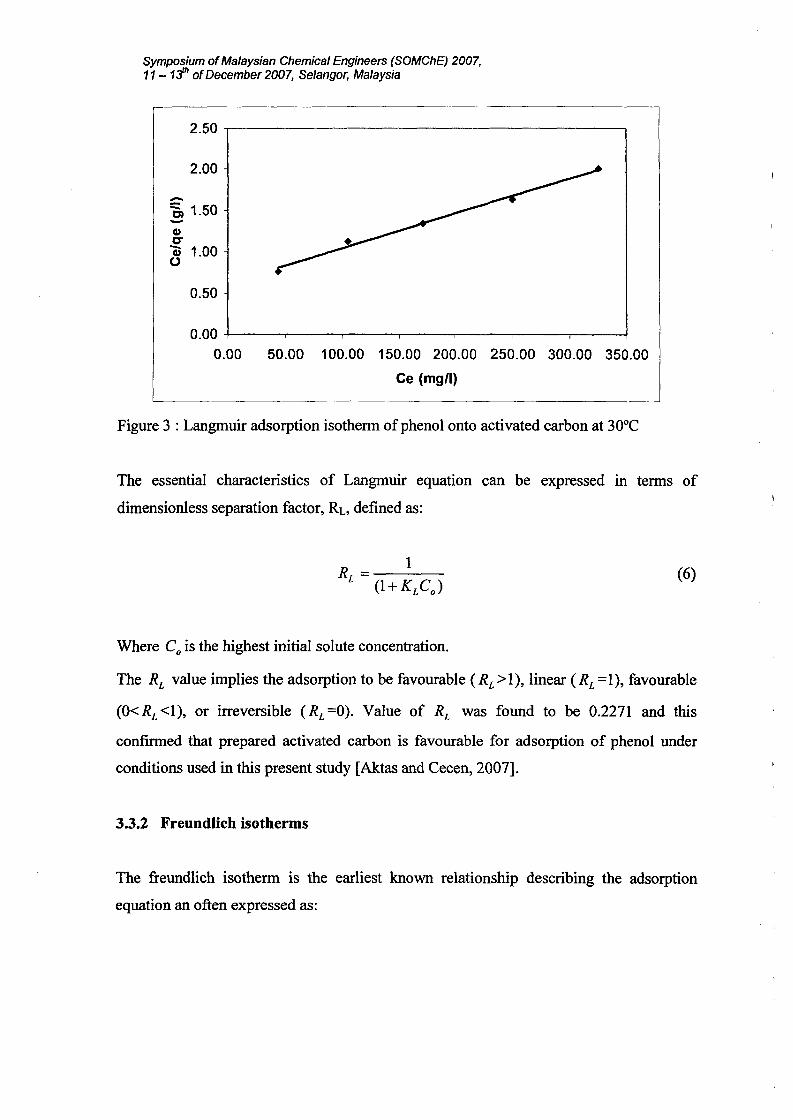
The linear form can be used for linearization of experimental data by plotting
Ce / qe against Ce' The Langmuir constant QO and K can be evaluated from the slope and
intercept of linear equation, respectively as shown in Figure 3.
Symposium ofMalaysian Chemical Engineers (SOMChE) 2007,11-1:ih ofDecember 2007, Selangor, Malaysia
50.00 100.00 150.00 200.00 250.00 300.00 350.00
Ce (mgtl)
0.00 -t----r--------,,....-------,.-----.-----,-----r-----..1
0.00
0.50
2.50 ,.------
CI)0-Cii 1.00o
-~ 1.50-2.00
Figure 3 : Langmuir adsorption isotherm of phenol onto activated carbon at 30°C
The essential characteristics of Langmuir equation can be expressed III terms of
dimensionless separation factor, RL, defined as:
(6)
Where Co is the highest initial solute concentration.
The RL value implies the adsorption to be favourable (RL>I), linear (RL=1), favourable
(O<RL<I), or irreversible (RL=0). Value of RL was found to be 0.2271 and this
confirmed that prepared activated carbon is favourable for adsorption of phenol under
conditions used in this present study [Aktas and Cecen, 2007].
3.3.2 Freundlich isotherms
The freundlich isotherm is the earliest known relationship describing the adsorption
equation an often expressed as:
Symposium ofMalaysian Chemical Engineers (SOMChE) 2007,11 - 1jh ofDecember 2007, Selangor, Malaysia
q =K eXe f e
Where:
qe = adsorption capacity at equilibrium solute concentration, Ce(mg/g)
Ce = concentration of adsorbate in solution (mg/L)
K f = empirical constants depending on several environmental factors
n = greater than one.
(7)
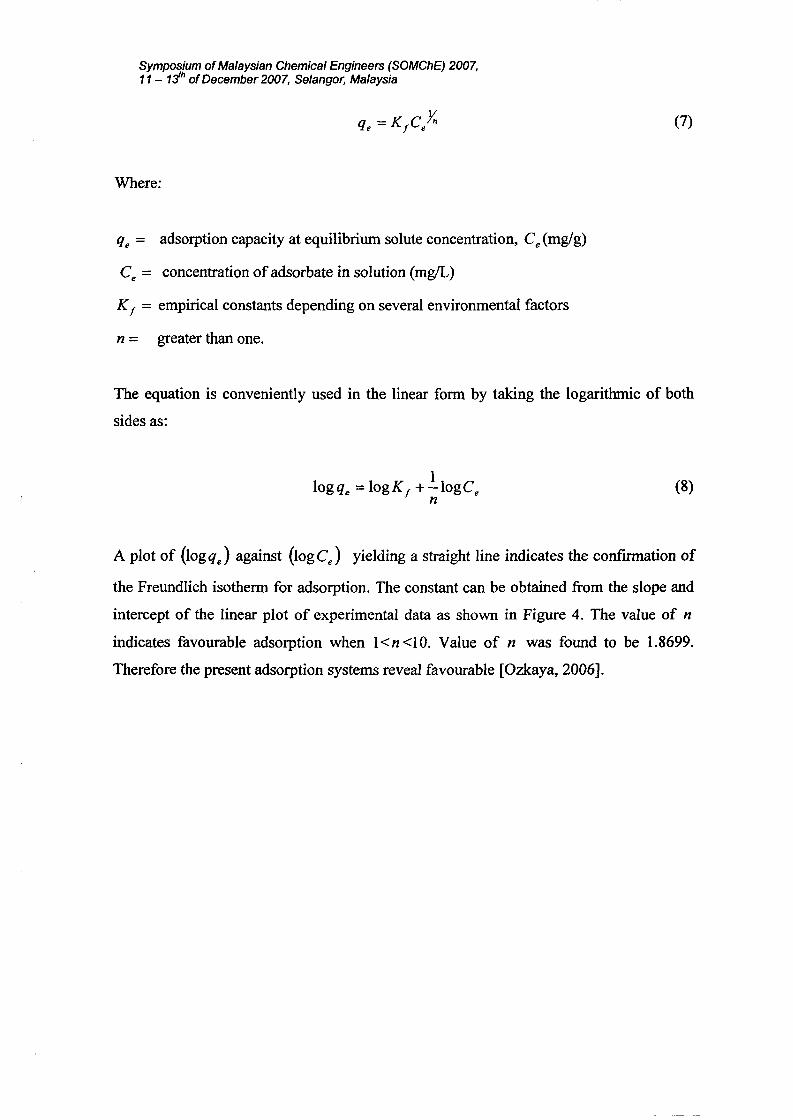
The equation is conveniently used in the linear form by taking the logarithmic of both
sides as:
1logqe = logKf +-logCen
(8)
A plot of (logqe) against (log Ce) yielding a straight line indicates the confirmation of
the Freundlich isotherm for adsorption. The constant can be obtained from the slope and
intercept of the linear plot of experimental data as shown in Figure 4. The value of n
indicates favourable adsorption when 1< n <10. Value of n was found to be 1.8699.
Therefore the present adsorption systems reveal favourable [Ozkaya, 2006].
Symposium ofMalaysian Chemical Engineers (SOMChE) 2007,11 - 1:fh of December 2007, Selangor, Malaysia
2.702.502.302.10
Log Ce
1.901.70
2.30 -r-----------------------.,
2.20
2.10
CD 2.000-m 1.90o..J 1.80
1.70
1.60
1.50 -1-----,----,---,------,----,----1
1.50
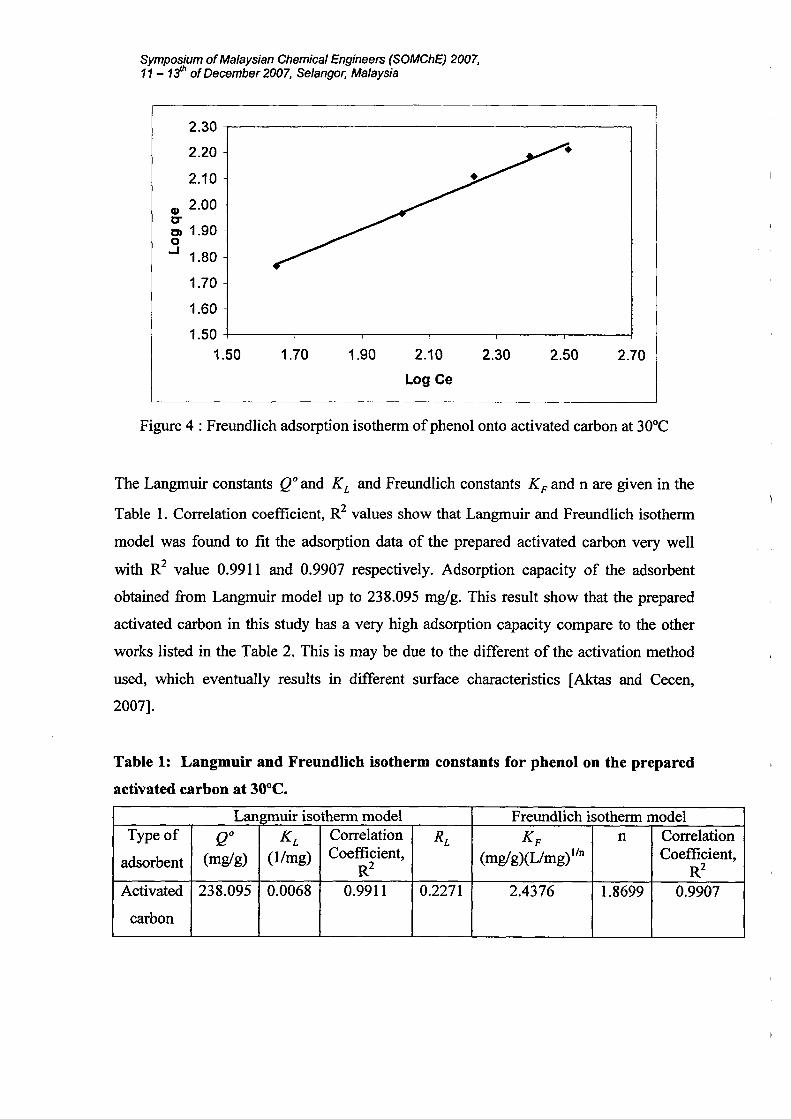
Figure 4 : Freundlich adsorption isotherm ofphenol onto activated carbon at 30°C
The Langmuir constants QO and KL and Freundlich constants KF and n are given in the
Table 1. Correlation coefficient, R2 values show that Langmuir and Freundlich isotherm
model was found to fit the adsorption data of the prepared activated carbon very well
with R2 value 0.9911 and 0.9907 respectively. Adsorption capacity of the adsorbent
obtained from Langmuir model up to 238.095 mg/g. This result show that the prepared
activated carbon in this study has a very high adsorption capacity compare to the other
works listed in the Table 2. This is may be due to the different of the activation method
used, which eventually results in different surface characteristics [Aktas and Cecen,
2007].
Table 1: Langmuir and Freundlich isotherm constants for phenol on the prepared
activated carbon at 30°C.
LanRIDuir isotherm model Freundlich isotherm modelType of QO K L Correlation RL K F n Correlation
adsorbent (mg/g) (l/mg) Coefficient, (mg/g)(L/mg) lIn Coefficient,R2 R2
Activated 238.095 0.0068 0.9911 0.2271 2.4376 1.8699 0.9907
carbon
-- -- ---------------- -
Symposium ofMalaysian Chemical Engineers (SOMChE) 2007,11 - 1jh of December 2007, Selangor, Malaysia
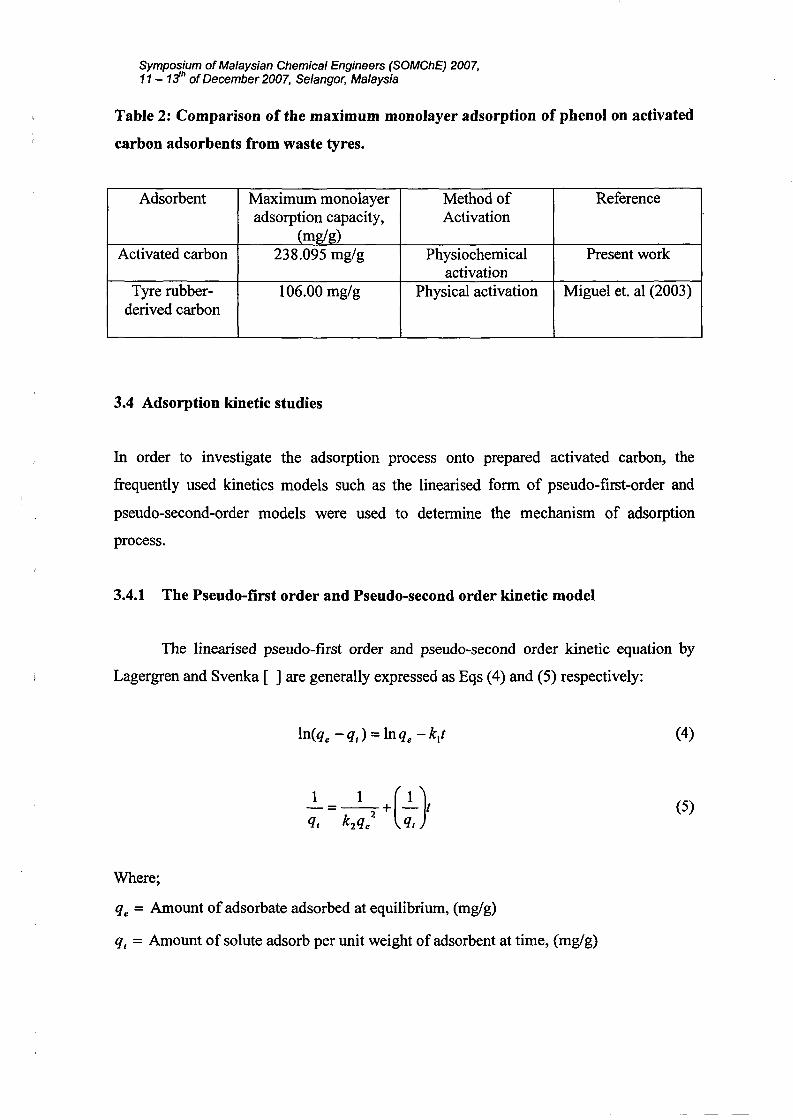
Table 2: Comparison of the maximum monolayer adsorption of phenol on activated
carbon adsorbents from waste tyres.
Adsorbent Maximum monolayer Method of Referenceadsorption capacity, Activation
(mg/g)Activated carbon 238.095 mg/g Physiochemical Present work
activationTyre rubber- 106.00 mg/g Physical activation Miguel et. al (2003)
derived carbon
3.4 Adsorption kinetic studies
In order to investigate the adsorption process onto prepared activated carbon, the
frequently used kinetics models such as the linearised form of pseudo-fIrst-order and
pseudo-second-order models were used to determine the mechanism of adsorption
process.
3.4.1 The Pseudo-first order and Pseudo-second order kinetic model
The linearised pseudo-first order and pseudo-second order kinetic equation by
Lagergren and Svenka [ ] are generally expressed as Eqs (4) and (5) respectively:
Where;
qe = Amount of adsorbate adsorbed at equilibrium, (mg/g)
q, = Amount of solute adsorb per unit weight of adsorbent at time, (mg/g)
(4)
(5)
~- ---- -- - ---------
Symposium ofMalaysian Chemical Engineers (SOMChE) 2007,11 - 1jh of December 2007, Selangor, Malaysia
kl = Rate constant of pseudo-first order sorption (l/hr)
k2 = Rate constant of pseudo-second order sorption (g/hr.mg)
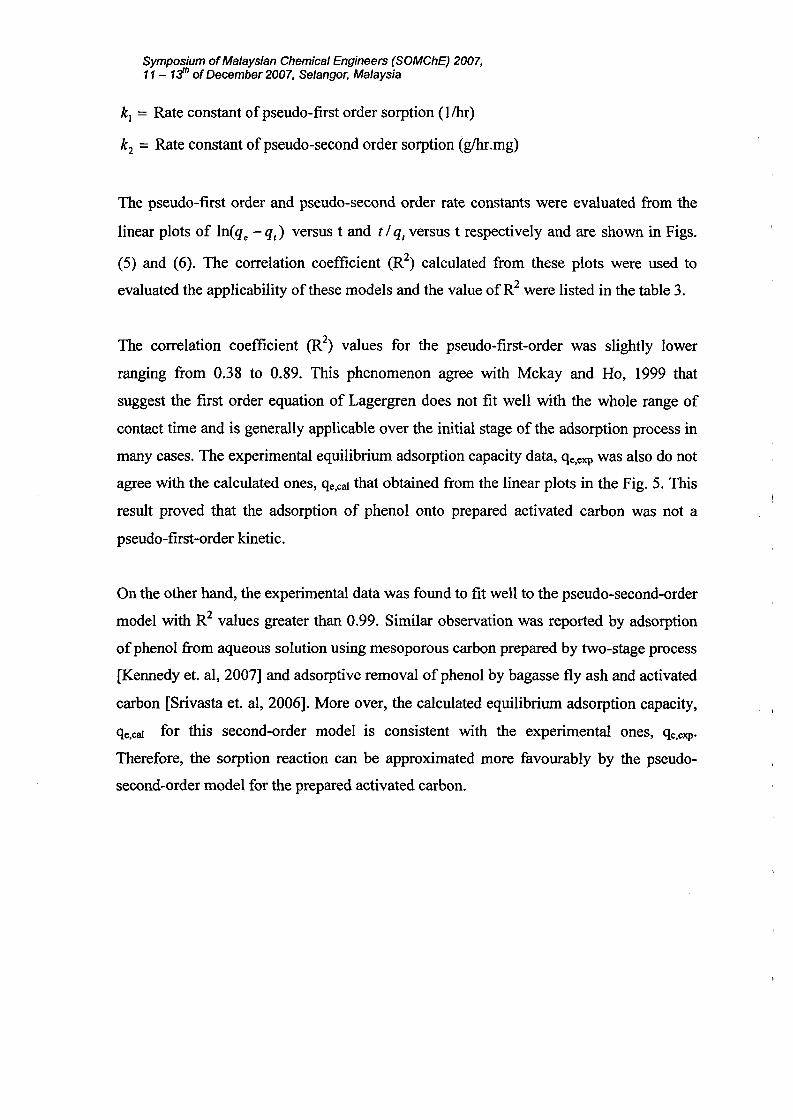
The pseudo-first order and pseudo-second order rate constants were evaluated from the
linear plots of In(qe - q,) versus t and t / q, versus t respectively and are shown in Figs.
(5) and (6). The correlation coefficient (R2) calculated from these plots were used to
evaluated the applicability of these models and the value ofR2 were listed in the table 3.
The correlation coefficient (R2) values for the pseudo-first-order was slightly lower
ranging from 0.38 to 0.89. This phenomenon agree with Mckay and Ho, 1999 that
suggest the first order equation of Lagergren does not fit well with the whole range of
contact time and is generally applicable over the initial stage of the adsorption process in
many cases. The experimental equilibrium adsorption capacity data, qe,exp was also do not
agree with the calculated ones, qe,cal that obtained from the linear plots in the Fig. 5. This
result proved that the adsorption of phenol onto prepared activated carbon was not a
pseudo-first-order kinetic.
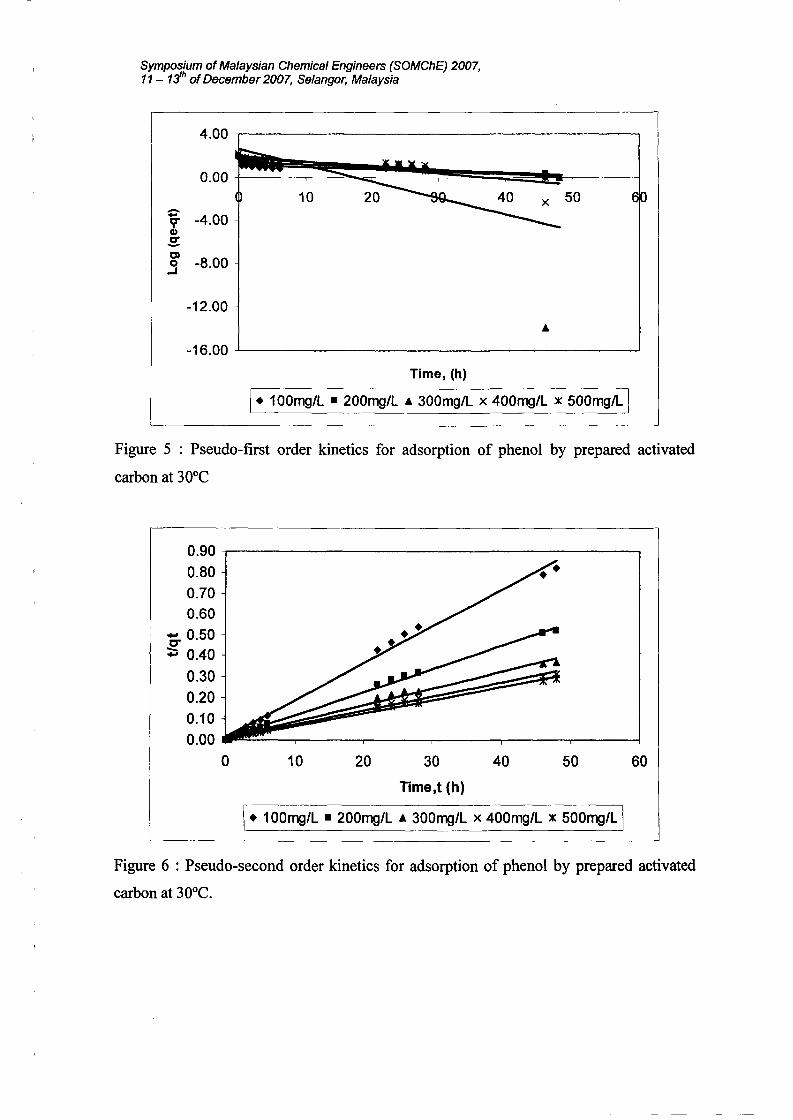
On the other hand, the experimental data was found to fit well to the pseudo-second-order
model with R2 values greater than 0.99. Similar observation was reported by adsorption
ofphenol from aqueous solution using mesoporous carbon prepared by two-stage process
[Kennedy et. aI, 2007] and adsorptive removal ofphenol by bagasse fly ash and activated
carbon [Srivasta et. aI, 2006]. More over, the calculated equilibrium adsorption capacity,
qe,cal for this second-order model is consistent with the experimental ones, qe,exp.
Therefore, the sorption reaction can be approximated more favourably by the pseudo
second-order model for the prepared activated carbon.
Symposium ofMalaysian Chemical Engineers (SOMChE) 2007,11 - 1:ih ofDecember 2007, Selangor, Malaysia
4.00
0.0010 x 50
~ -4.009'CD,g:Cl
-8.000..I
-12.00
-16.00
Time, (h)
I. 100mg/L • 200mg/L • 300mg/L x 400mg/L x 500mg/L IFigure 5 : Pseudo-first order kinetics for adsorption of phenol by prepared activated
carbon at 30°C
10 20 30 40 50 60
Time,t (h)
0.90 -,-----------------------,
0.800.700.60
'& 0.50;:; 0.40
0.300.200.100.00
o
\. 100mg/L • 200mg/L • 300mg/L x 400mg/L x 500mg/L I
Figure 6 : Pseudo-second order kinetics for adsorption of phenol by prepared activated
carbon at 30°C.
Symposium ofMalaysian Chemical Engineers (SOMChE) 2007,11 - 1;jh ofDecember 2007, Selangor, Malaysia
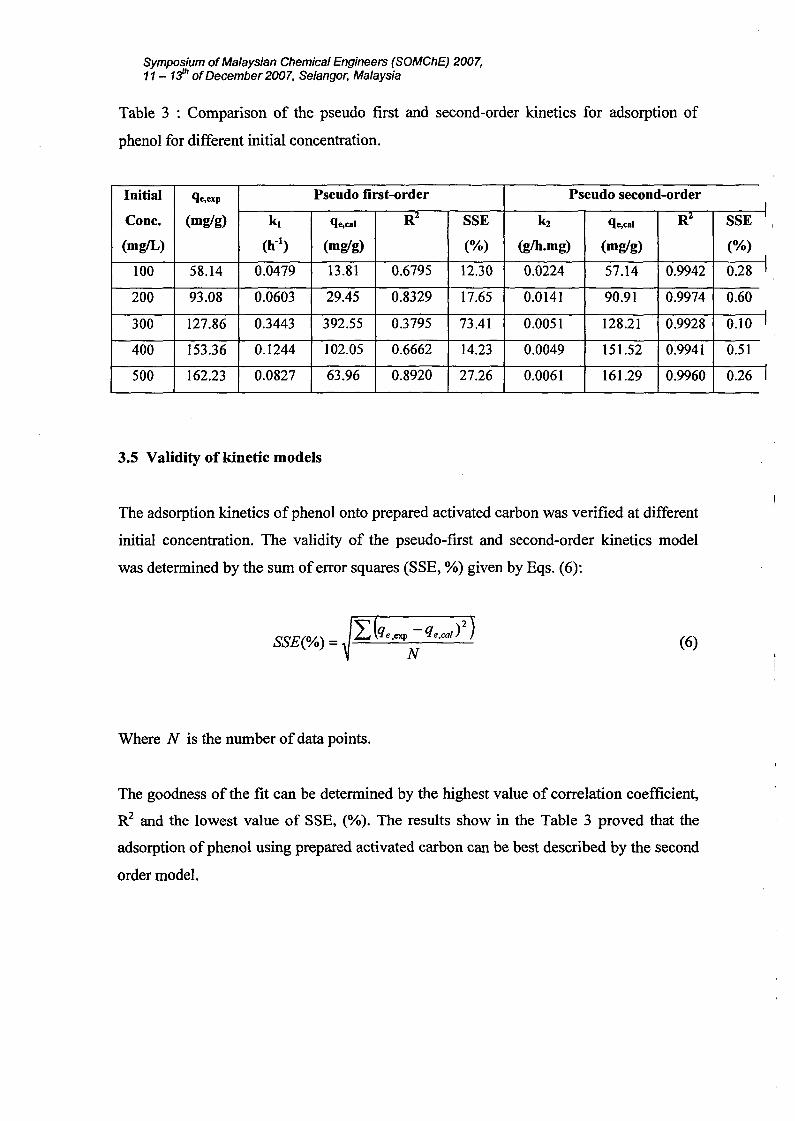
Table 3 : Comparison of the pseudo first and second-order kinetics for adsorption of
phenol for different initial concentration.
Initial qe,exp Pseudo first-order Pseudo second-order
Cone. (mglg) k1 qe,cal R1 SSE k2 qe,cal R1 SSE
(mgIL) (h-1) (mglg) (%) (g/h.mg) (mglg) (%)I
100 58.14 0.0479 13.81 0.6795 12.30 0.0224 57.14 0.9942 0.28 I
200 93.08 0.0603 29.45 0.8329 17.65 0.0141 90.91 0.9974 0.60
300 127.86 0.3443 392.55 0.3795 73.41 0.0051 128.21 0.9928 0.10 I
400 153.36 0.1244 102.05 0.6662 14.23 0.0049 151.52 0.9941 0.51
500 162.23 0.0827 63.96 0.8920 27.26 0.0061 161.29 0.9960 0.26 I
3.5 Validity of kinetic models
The adsorption kinetics ofphenol onto prepared activated carbon was verified at different
initial concentration. The validity of the pseudo-first and second-order kinetics model
was determined by the sum oferror squares (SSE, %) given by Eqs. (6):
88£(%) = (6)
Where N is the number of data points.
The goodness of the fit can be determined by the highest value of correlation coefficient,
R2 and the lowest value of SSE, (%). The results show in the Table 3 proved that the
adsorption of phenol using prepared activated carbon can be best described by the second
order model.
Symposium ofMalaysian Chemical Engineers (SOMChE) 2007,11 - 1jh of December 2007, Selangor, Malaysia
ACKNOWLEGDEMENT
The authors acknowledge the Long-term IRPA grant provided by MOSTI for this present
work. The authors also very thankful to the school of Chemical Engineering, Universiti
Sains Malaysia for providing the facilities and constant encouragement.
References:
[1] lW. Patterson, Industrial Wastewater Treatment Technology, Wastewater Treatment
Technology, Ann Arbor Science Inc. 1975..
[2] J.K Fawell, S. Hunt, Environmental Toxicology: Organic Pollutants, Halstd Press,
John Wiley & Sons, NY, 1988,398.
[3] Environmental Quality Act, Sewage and Industrial Effluent in Environment Quality
Act and regulations, laws of malysia.12th Ed. MDC Publisher Printers Sdn. Bhd.,
Malysia,61.
[4] Ozkaya, 8., Adsorption and Desorption of phenol on activated carbon and a
comparison ofisothenn models, Journal of Hazardous Materials B129 (2006) 158-163.
[5] Mukherjee, S., Kumar, S., Misra, A.K., Fan, M., Removal of phenols from water
environment by activated carbon, bagasse ash and wood charcoal, Chemical Engineering
Journal, 2006.
[6] Hsieh, C.T. and Teng, H., Influence of mesopore volume and adsorbate size on
adsorption capacities of activated carbons in aqueous solutions, Carbon 38 (2000)863
869.
Symposium ofMalaysian Chemical Engineers (SOMChE) 2007,11 - 1i h of December 2007, Selangor, Malaysia
[7] Nakagawa, K., Namba, A., Mukai, S.R, Tamon, H., Ariyadejwanich, P.,
Tanthapanichakoon, W., Adsorption of phenol and reactive dye from aqueous solution on
activated carbons derived from solid wastes, Water Research 38 (2004) 1791-1798
[8] Tamai, H., Yoshida, T., Sasaki, M., Yasuda, H.,Dye adsorption on mesoporous
activated carbon fiber obtained from pitch containing yttrium complex, Carbon 37 (1999)
983-989.
[9] Tanthapanichakoon, W., Ariyadejwanich, P., Japthong, P., Nakagawa, K., Mukai,
S.R, Tamon, H., Adsorption-desorption characteristics of phenol and reactive dys from
aqueous solution on mesoporous activated carbon prepared from waste tires, Water
Research 39 (2005) 1347-1353.
[10] Helleur, R, Popovic, N., Ikura, M., Stanciulescu, M. and Liu, D., Characterization
and potential applications ofpyrolytic char from ablative pyrolysis of used tire, Journal of
Analytical and Applied Pyrolysis, Vol 58-59, pp 813-824,2001.
[11] Ariyadejwanich, P., Tanthapanichakoon, W., Nakagawa, K., Mukai, S.R and
Tamon, H., Preparation and characterization of mesoporous activated carbon from waste
tires, Carbon, Vol 40-41, pp 157-164,2003.
[12] Miguel, G.S., Fowler, G.D. and Sollars, C.J., A study of the characteristics of
activated carbons produced by steam and carbon dioxide activation of waste tyre rubber,
Carbon 41, pp 1009-1016,2003.
[13] Tseng, RL., Tseng, S.K. and Wu F.e, Preparation ofhigh surface area carbons from
corncob with KOH etching plus C02 gasification for the adsorption of dyes and phenols
from water, Colloids and Surfaces, Vol 279, pp 69-70,2006.
---~------------
Symposium ofMalaysian Chemical Engineers (SOMChE) 2007,11 - 1i h ofDecember 2007, Selangor, Malaysia
[14] Wu, F.C. and Tseng, R.L., Preparation of highly porous carbon from fir wood by
KOH etching and C02 gasification for adsorption of dyes and phenols from water,
Colloids and Interface Science, Vol 294, pp 21-30,2006.
[15] Wu, F.C., Tseng, R.L. and Juang, R.S., Preparation of highly microporous carbons
from fir wood by KOH activation for adsorption of dyes and phenols from water,
Separation purification Technology, Vol 47, pp 10-19,2005.
[16] Srivastava, V.C., Swamy, M.M., Mall, I.D., Prasad, B., Mishra, I.M., Adsorptive
removal of phenol by bagasse fly ash and activated carbon: Equilibrium, kinetics and
thermodynamics, Colloids and Surfaces, Vol 272, pp 89-104, 2006.
[17] Roostaei, N. and Tezel, F.H.,Removal of phenol from aqueous solutions by
adsorption, Journal of Environment Management 70 (2004) 157-164.
[18] Rengaraj, S., Moon, S.H., Sivabalan, R, Arabindoo, B., Murugesan, V., Agricultural
solid waste for the removal of organics: adsorption of phenol from water and wastewater
by palm seed coat activated carbon, Waste Management 22 (2002) 543-548.
[19] Kennedy, L.J., Vijaya, J.J., Kayalvizhi, K., Sekaran, G., Adsorption of phenol from
aqueous solutions using mesoporous carbon prepared by two stage process, Chemical
Engineering Journal, 2007.
[20] Aktas, O. and Cecen, F., Adsorption, Desorption and bioregenemtion in the
treatment of 2-chlorophenol with activated carbon, Journal of Hazardous Materials 141
(2007) 769-777.
\ )!L
[1L-)
--~
;
i
J
-I
,.J
PRODUCTION OF ACTIVATED CARBONS FROMPYROLYSIS OF WASTE TYRES IMPREGNATED WITHPOTASSIUM HYDROXIDE (KOH) AND INFLUENCE OF
OPERATING VARIABLES
By
LEE FOOLOON
Thesis submitted in partial fulfillment of the requirements forthe degree of Bachelor of Chemical Engineering
May 2006
11
u
U
lJ
U
I.__ J
--",
Ii
.-3
ABSTRACT
Activated carbons are prepared from many carbonaceous materials such as biomass and
organic wastes. Pyrolysis is an established technique for the disposal different kinds of
solid wastes including the tire, polymer and rubber wastes. Since very limited work
pertaining to the utilization of the waste tires into activated carbon has been reported in
literature especially by using the chemical activation method with potassium hydroxide
(KOH) acts as activating agent, the present work is to study the influence of activation
temperature (500 - 800°C) and activation time (60, 90 and 120 min) at a fixed
impregnation ratio (KOH : tire) of4 on the production of activated carbon from scrap tires
by pyrolysis impregnated with potassium hydroxide. Experiments were conducted in a lab
scale muffle furnace under the pUrging of pure nitrogen. The precursor material with
impregnation a~ent is pyrolyzed under a prescribed condition. A yield of activated carbon
of 86.7% is obtained for pyrolysis temperature of 800°C. This resulted the activation
temperature of 800°C is the optimum temperature for production of activated carbon. The
adsorption capacity in methylene blue and phenol are estimated by using spectrophotometer.
It was found that maximum methylene blue number of 146 was obtained while the
maximum adsorption capacity of phenol was 20.9 mglg AC. The adsorption of adsorbates
is found to increase with increase in activation temperature or with decrease in the yield of
activated carbon. Adsorption Isotherms of activated carbons prepared from waste tires are
then determined. Based on the adsorption tests conducted by adsorption of activated
carbons on methylene blue and phenol solution, it follows Langmuir adsorption Isotherm
with favorable adsorption effectiveness.
Xlll
il_
rL
CHAPTERS
RESULTS AND DISCUSSION
l5.1 CHARACTERISTICS OF THE SAMPLE PYROLYSED
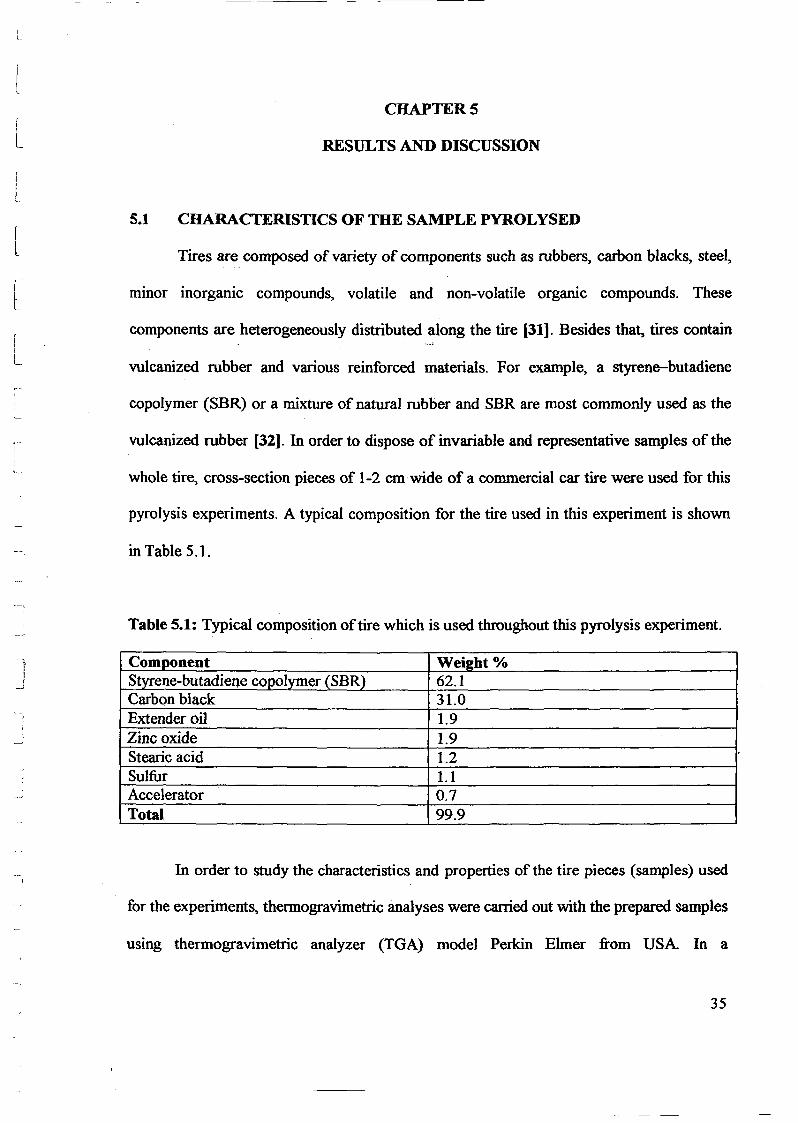
Tires are composed of variety of components such as rubbers, carbon blacks, steel,
r---j
L
minor inorganic compounds, volatile and non-volatile organic compounds. These
components .are heterogeneously distributed along the tire [31]. Besides that, tires contain
vulcanized rubber and various reinforced materials. For example, a styrene-butadiene
copolymer (SBR) or a mixture of natural rubber and SBR are most commonly used as the
vulcanized rubber [32]. In order to dispose of invariable and representative samples of the
whole tire, cross-section pieces of 1-2 cmwide of a commercial car tire were used for this
pyrolysis experiments. A typical composition for the tire used in this experiment is shown
in Table 5.1.
Table 5.1: Typical composition oftire which is used throughout this pyrolysis experiment.
Component Weh!ht %Styrene-butadiene copolymer (SBR) 62.1Carbon black 31.0Extender oil 1.9Zinc oxide 1.9Stearic acid 1.2Sulfur 1.1Accelerator 0.7Total 99.9
In order to study the characteristics and properties of the tire pieces (samples) used
for the experiments, thermogravimetric analyses were carried out with the prepared samples
using thermogravimetric analyzer (TGA) model Perkin Elmer from USA In a
35
u
oUJ~l
J
JJ
J
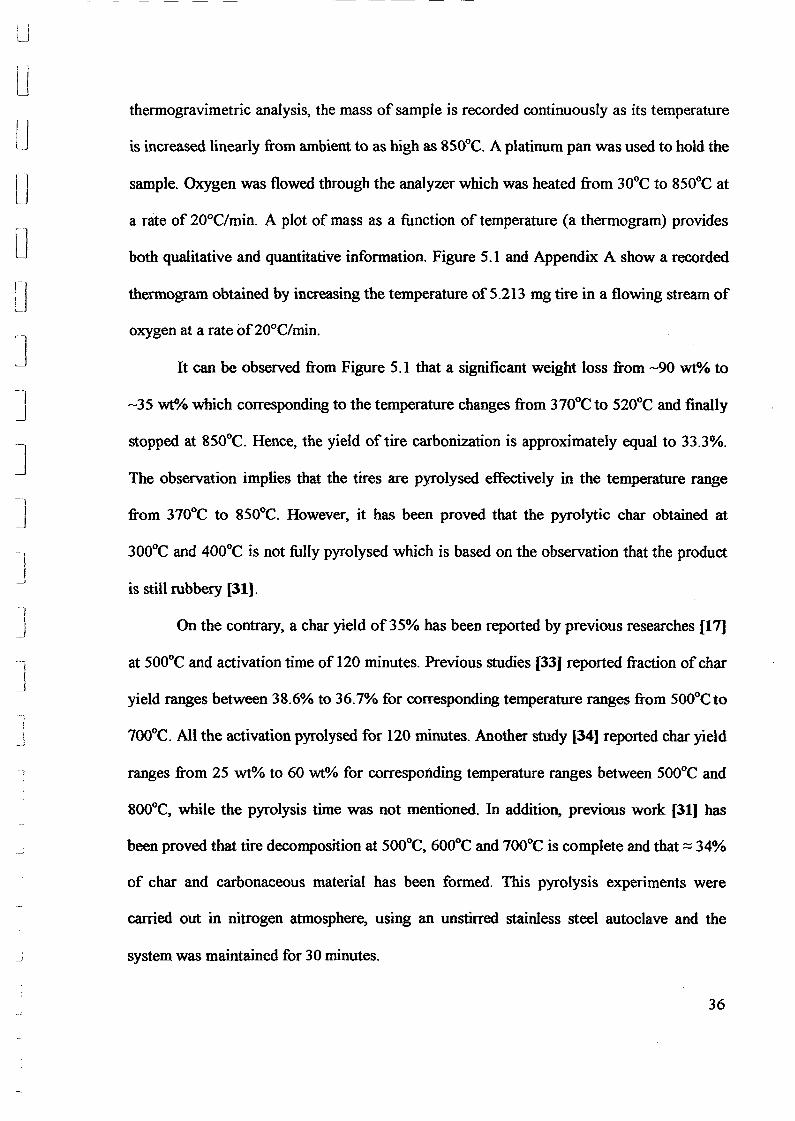
thermogravimetric analysis, the mass of sample is recorded continuously as its temperature
is increased linearly from ambient to as high as 850°C. A platinum pan was used to hold the
sample. Oxygen was flowed through the analyzer which was heated from 30°C to 850°C at
a rate of 20°C/min. A plot of mass as a function of temperature (a thermogram) provides
both qualitative and quantitative information. Figure 5.1 and Appendix A show a recorded
thermogram obtained by increasing the temperature of 5.213 mg tire in a flowing stream of
oxygen at a rate of20°C/min.
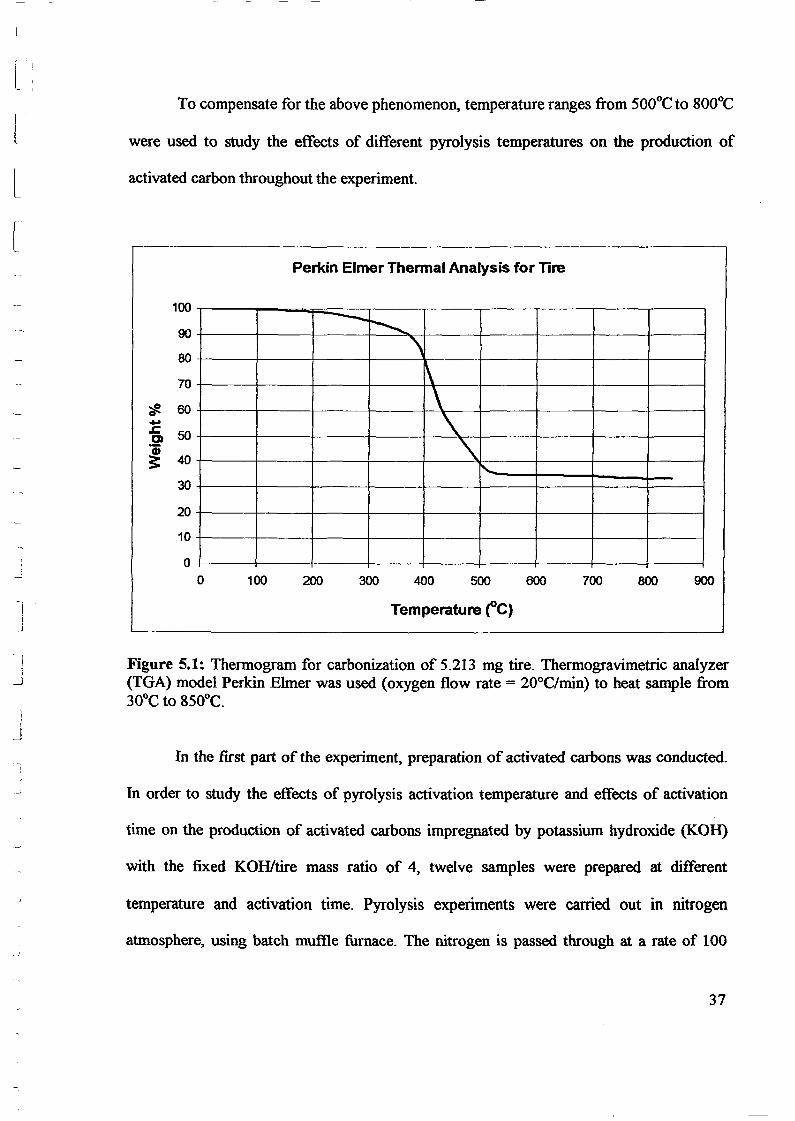
It can be observed from Figure 5.1 that a significant weight loss from -90 wtOlO to
-35 wtOlO which corresponding to the temperature changes from 370°C to 520°C and finally
stopped at 8SOoC. Hence, the yield of tire carbonization is approximately equal to 33.3%.
The observation implies that the tires are pyrolysed effectively in the temperature range
from 370°C to 850°C. However, it has been proved that the pyrolytic char obtained at
300°C and 400°C is not fully pyrolysed which is based on the observation that the product
is still rubbery [31).
On the contrary, a char yield of35% has been reported by previous researches [17]
at 500°C and activation time of 120 minutes. Previous studies [33J reported fraction ofchar
yield ranges between 38.6% to 36.7% for corresponding temperature ranges from 500°C to
700°C. All the activation pyrolysed for 120 minutes. Another study [34] reported char yield
ranges from 25 wt% to 60 wtO.Io for corresponding temperature ranges between 500°C and
800°C, while the pyrolysis time was not mentioned. In addition, previous work [31J has
been proved that tire decomposition at 500°C, 600°C and 700°C is complete and that:::: 34%
of char and carbonaceous material has been formed. This pyrolysis experiments were
carried out in nitrogen atmosphere, using an unstirred stainless steel autoclave and the
system was maintained for 30 minutes.
36
I 'I
l
ll[
To compensate for the above phenomenon, temperature ranges from 500°C to 800°C
were used to study the effects of different pyrolysis temperatures on the production of
activated carbon throughout the experiment.
Perkin Elmer Thermal Analysis for Tire
---..r--.......\~\\
".....
J
100
90
80
70
::§? 600-~ 50C)
~ 40
30
20
10
oo 100 200 300 400 500 600 700 800 900
J
Temperature cae)
Figure 5.1: Thermogram for carbonization of 5.213 mg tire. Thermogravimetric analyzer(TGA) model Perkin Elmer was used (oxygen flow rate = 20°C/min) to heat sample from30°C to 850°C.
In the first part of the experiment, preparation of activated carbons was conducted.
In order to study the effects of pyrolysis activation temperature and effects of activation
time on the production of activated carbons impregnated by potassium hydroxide (KOH)
with the fixed KOHltire mass ratio of 4, twelve samples were prepared at different
temperature and activation time. Pyrolysis experiments were carried out in nitrogen
atmosphere, using batch muffle furnace. The nitrogen is passed through at a rate of 100
37
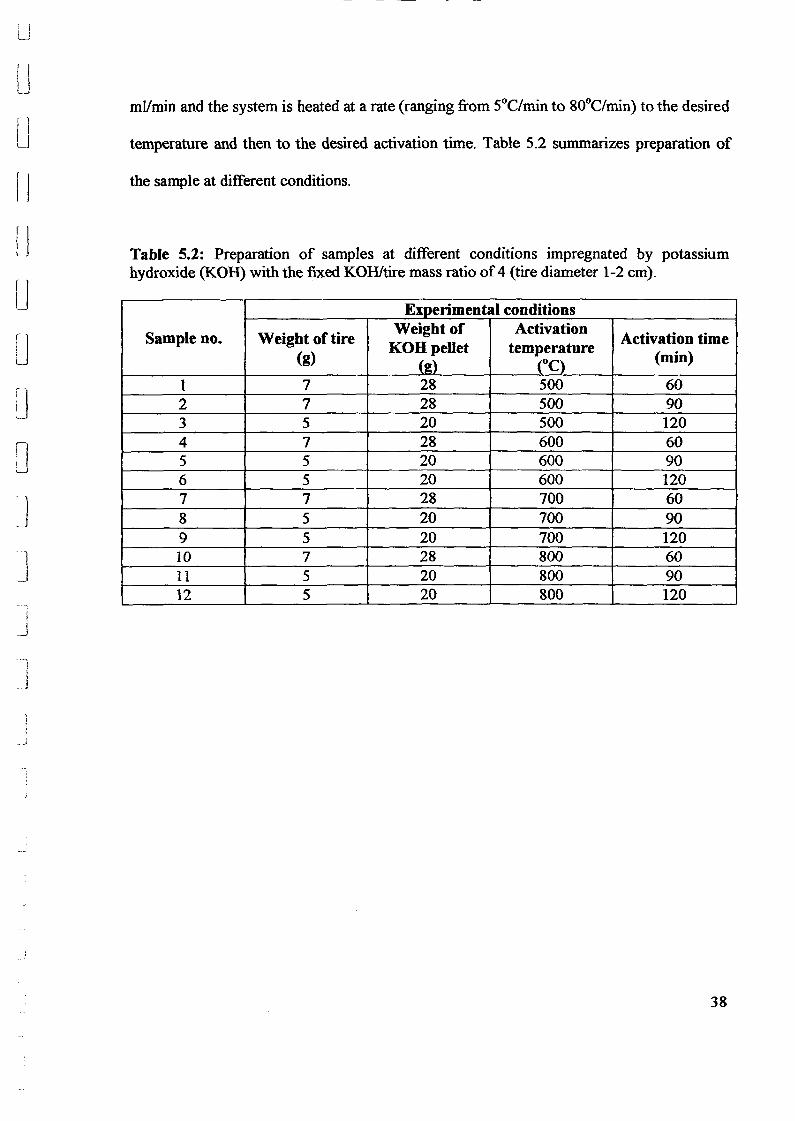
l ILJ
lJi 1
U
u
-1J
].,!
mllmin and the system is heated at a rate (ranging from SOC/min to 80°C/min) to the desired
temperature and then to the desired activation time. Table 5.2 summarizes preparation of
the sample at different conditions.
Table 5.2: Preparation of samples at different conditions impregnated by potassiumhydroxide (KOH) with the fixed KOH/tire mass ratio of4 (tire diameter 1-2 cm).
Experimental conditions
Sample no. Weight of tireWeight of Activation
Activation timeKOHpellet temperature
(g) (g) (OC) (min)
1 7 28 500 602 7 28 500 903 5 20 500 1204 7 28 600 605 5 20 600 906 5 20 600 1207 7 28 700 608 S 20 700 909 5 20 700 12010 7 28 800 6011 5 20 800 9012 5 20 800 120
38
l
5.2 YIELD OF ACTIVATED CARBON
Activated carbon was obtained after pyrolysis of scrap tires by using potassium
hydroxide (KOH) as activating agent. A fixed amount oftires and pellet KOH was prepared
to be placed in the batch muflle furnace. Pyrolysis was carried out at SOO°C, 600°C, 700°C
and 800°C in nitrogen atmosphere. Nitrogen was passed through at a rate of 100 ml/min
and the sample was heated to the desired temperature and desired activation time (60 min,
90 min and 120 min). The pyrolysed samples were washed repeatedly (filtration) with
distilled water until free of cWoride ions (determined by the conductivity reading of the
filtrate). Once the activating agent was removed (if the conductivity of the filtrate is less
than 10 J..ls), the sample was dried at 10SoC until it was bone-dried.
The purpose of washing the pyrolysed sample was to ensure that all the KOH used
for activation was removed before the carbon was taken for characterization. Previous
study [13] has shown that the unwashed sample does not show any N2 adsorption. This
happened due to the porosity created in the carbon samples wa~ blocked by the potassium
compounds that must be removed to obtain an accessible microporosity.
The washing step is the last stage in the preparation of a chemically activated
carbon. Most ofthe study (13, 14, 16,35,36] has the common washing stage, which is the
pyrolysed mixture was leached in water and acid solutions to remove the chemical
activating agent. In the present study, the pyrolysed mixture only washed several times by
distilled water as previous study [13] has concluded that an acid washing could be avoided
because the results are not very different from those obtained with water washing.
39
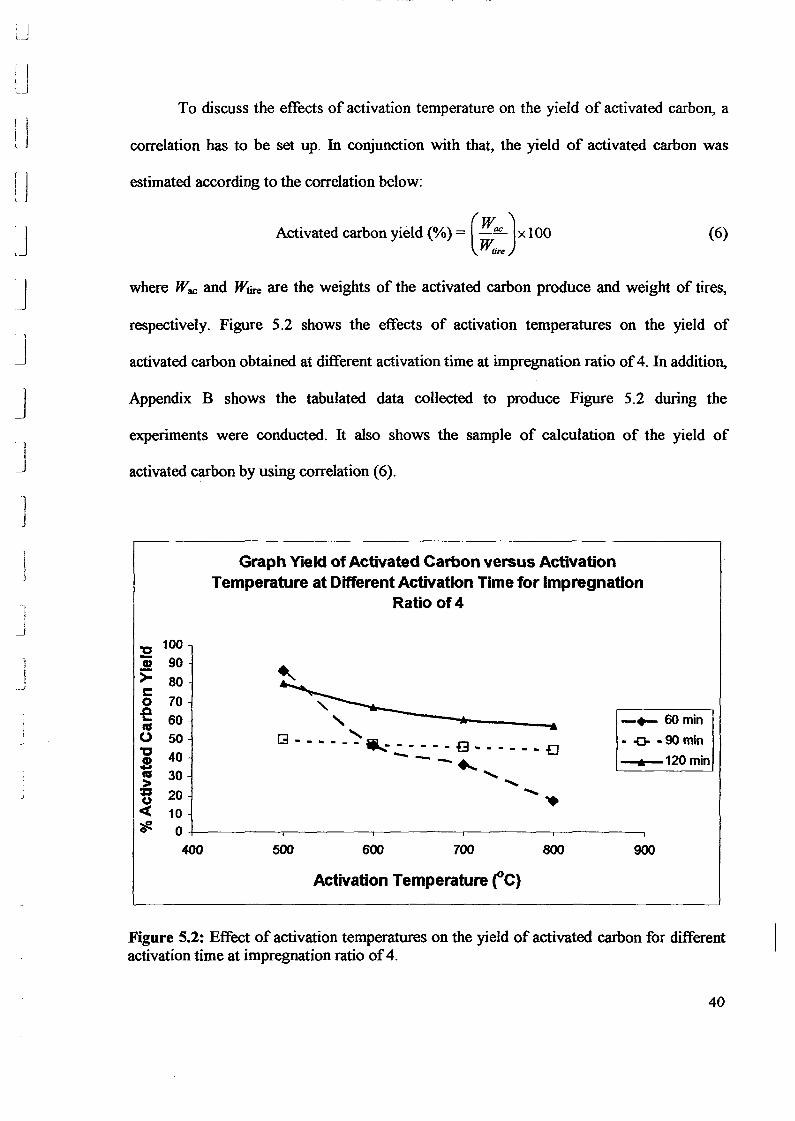
r If j
U
f ILJ
To discuss the effects of activation temperature on the yield of activated carbon, a
correlation has to be set up. In conjunction with that, the yield of activated carbon was
activated carbon obtained at different activation time at impregnation ratio of4. In addition,
respectively. Figure 5.2 shows the effects of activation temperatures on the yield of
Appendix B shows the tabulated data collected to produce Figure 5.2 during the
where Wac and Wtire are the weights of the activated carbon produce and weight of tires,
(6)Activated carbon yield (%) = ( Wac ) X 100Wtire
estimated according to the correlation below:UJJJJJ
experiments were conducted. It also shows the sample of calculation of the yield of
activated carbon by using correlation (6).
1J
J
,
I--~
Graph Yield ofActivated Carbon versus ActivationTemperature at Different Activation Time for Impregnation
Ratio of4
E100
CD 90~>= 80
E:0 70 "'-of! 60 , -+- 60 minca
[3 .... __ ::- --0 50 • -0- -90 min"C 40
...... ::-- •• - f3 .. - - • - • £]120 min.! -- ..... *ca 30 ......
> "".. 20 ""u ..<C 10?F- 0
400 500 600 700 800 900
Activation Temperature rC)
Figure 5.2: Effect of activation temperatures on the yield of activated carbon for differentactivation time at impregnation ratio of4.
40
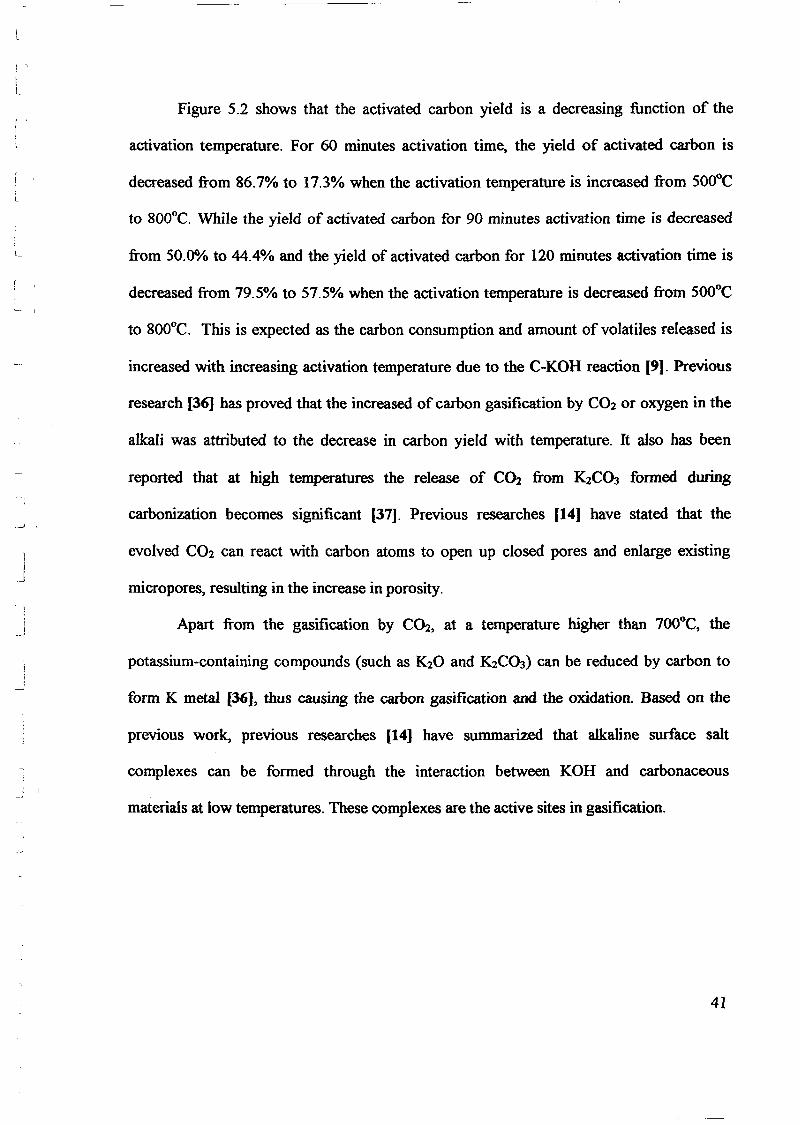
iL
l_ J
----------------
Figure 5.2 shows that the activated carbon yield is a decreasing function of the
activation temperature. For 60 minutes activation time, the yield of activated carbon is
decreased from 86.7% to 17.3% when the activation temperature is increased from 500°C
to 800°e. While the yield of activated carbon for 90 minutes activation time is decreased
from 50.00.10 to 44.4% and the yield of activated carbon for 120 minutes activation time is
decreased from 79.5% to 57.5% when the activation temperature is decreased from 500°C
to 800°C. This is expected as the carbon consumption and amount of volatiles released is
increased with increasing activation temperature due to the C-KOH reaction [9]. Previous
research [36] has proved that the increased of carbon gasification by C02 or oxygen in the
alkali was attributed to the decrease in carbon yield with temperature. It also has been
reported that at high temperatures the release of CCh from K2COJ formed during
carbonization becomes significant [37]. Previous researches [14] have stated that the
evolved C02 can react with carbon atoms to open up closed pores and enlarge existing
micropores, resulting in the increase in porosity.
Apart from the gasification by C02, at a temperature higher than 700°C, the
potassium-containing compounds (such as K20 and K2C03) can be reduced by carbon to
form K metal [36], thus causing the carbon gasification and the oxidation. Based on the
previous work, previous researches [14] have summarized that alkaline surface salt
complexes can be formed through the interaction between KOH and carbonaceous
materials at low temperatures. These complexes are the active sites in gasification.
41
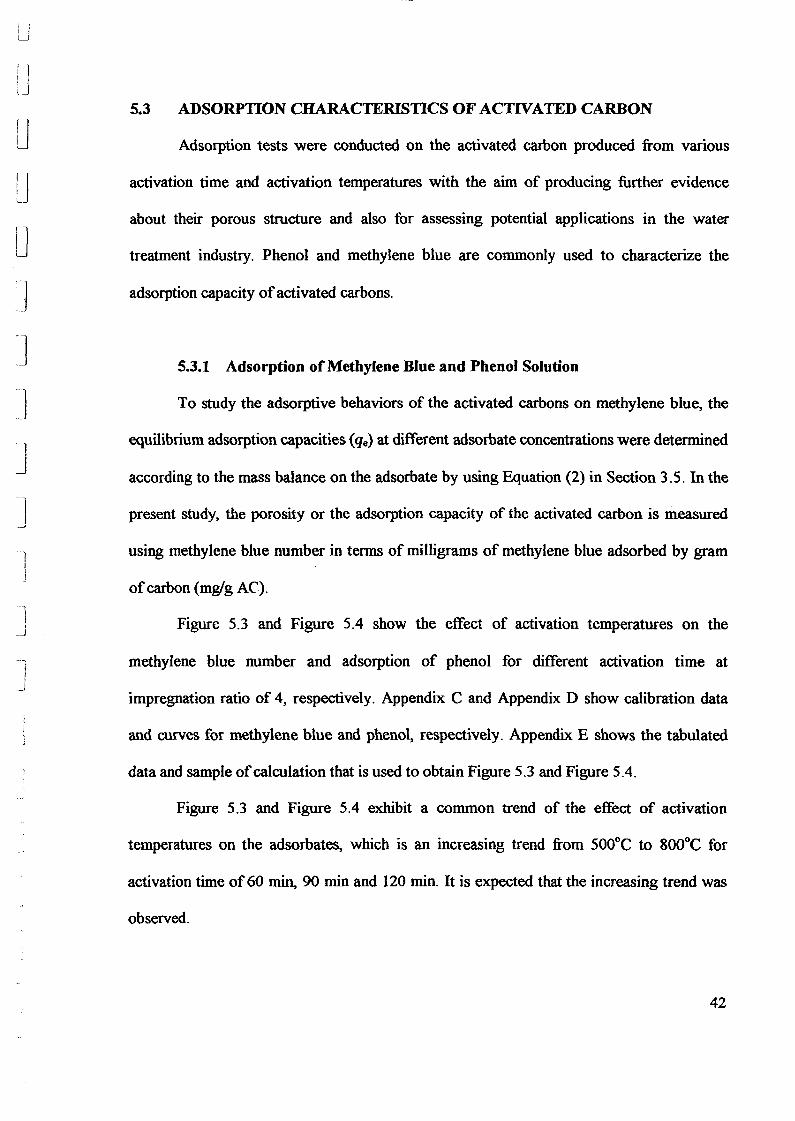
! iI ILJ
r Iu
u5.3 ADSORPTION CHARACTERISTICS OF ACTIVATED CARBON
Adsorption tests were conducted on the activated carbon produced from various
lJuJJJ]
]
1I,
_--l
]
activation time and activation temperatures with the aim of producing further evidence
about their porous structure and also for assessing potential applications in the water
treatment industry. Phenol and methylene blue are commonly used to characterize the
adsorption capacity ofactivated carbons.
5.3.1 Adsorption ofMethylene Blue and Phenol Solution
To study the adsorptive behaviors of the activated carbons on methylene blue, the
equilibrium adsorption capacities (qe) at different adsorbate concentrations were determined
according to the mass balance on the adsorbate by using Equation (2) in Section 3.5. In the
present study, the porosity or the adsorption capacity of the activated carbon is measured
using methylene blue number in terms of milligrams of methylene blue adsorbed by gram
ofcarbon (mglg AC).
Figure 5.3 and Figure 5.4 show the effect of activation temperatures on the
methylene blue number and adsorption of phenol for different activation time at
impregnation ratio of 4, respectively. Appendix C and Appendix D show calibration data
and curves for methylene blue and phenol, respectively. Appendix E shows the tabulated
data and sample ofcalculation that is used to obtain Figure 5.3 and Figure 5.4.
Figure 5.3 and Figure 5.4 exhibit a common trend of the effect of activation
temperatures on the adsorbates, which is an increasing trend from 500°C to 800°C for
activation time of 60 min, 90 min and 120 min. It is expected that the increasing trend was
observed.
42
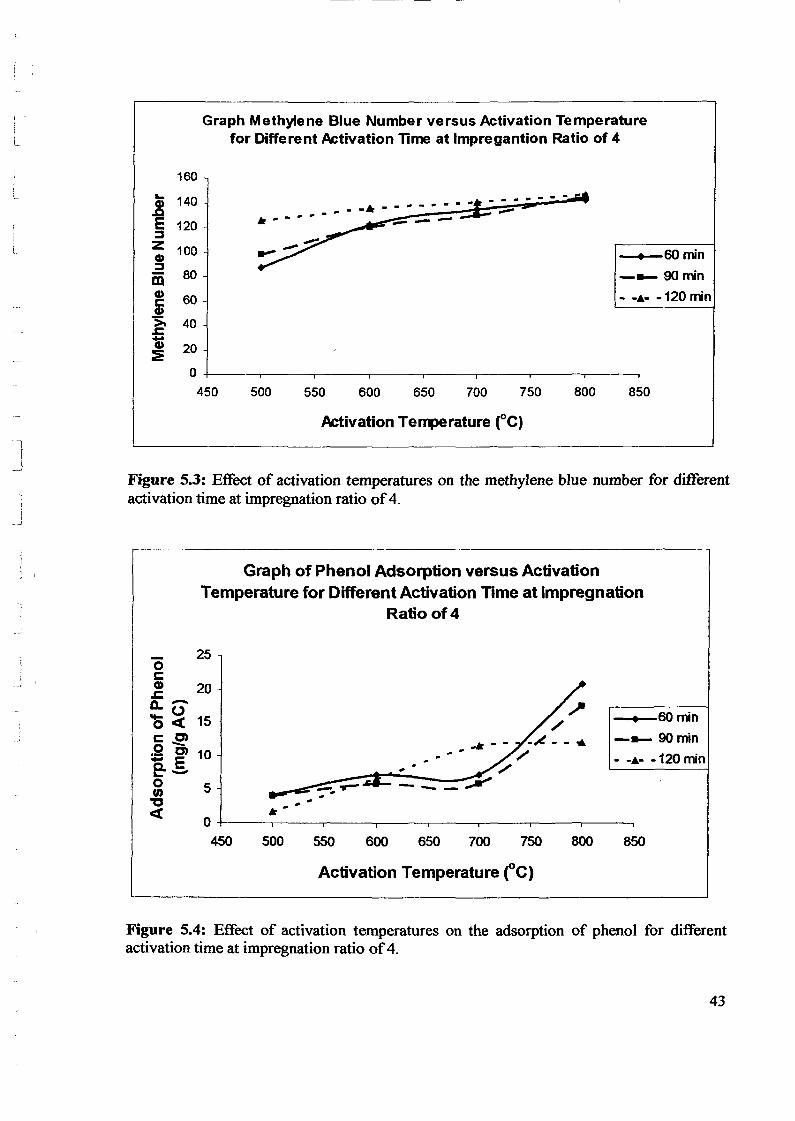
, .!
L
Graph Methylene Blue Number versus Activation Temperaturefor Different Activation Time at Impregantion Ratio of 4
850
• 60 min- __ 90 min
- -&- -120 min
800750
--- ., . ... - -
700650600550
,., - -....... ,. ............ .. .. -,,-- .... -----
500
160.. 140CD
~ 120~
Z 100CD::::I
iii 80CD 60cCD>. 40.ca; 20~
0450
l_
Activation TerJ1)erature (OC)
1:
Figure 5.3: Effect of activation temperatures on the methylene blue number for differentactivation time at impregnation ratio of4.
Graph of Phenol Adsorption versus ActivationTemperature for Different Activation Time at Impregnation
Ratio of4
850
• 60 min- __ 90 min
- -&- -120 min
800750700650
/'/
.... - - -~ - - .... .. /.. /'- __ :::;:i"'"
600
- 250cCD 20.c0.-.... 0 150<c9},2 C) 10- E~-0 5U)'0 .. ..< It
0450 500 550
Activation Temperature rC)
Figure 5.4: Effect of activation temperatures on the adsorption of phenol for differentactivation time at impregnation ratio of4.
43
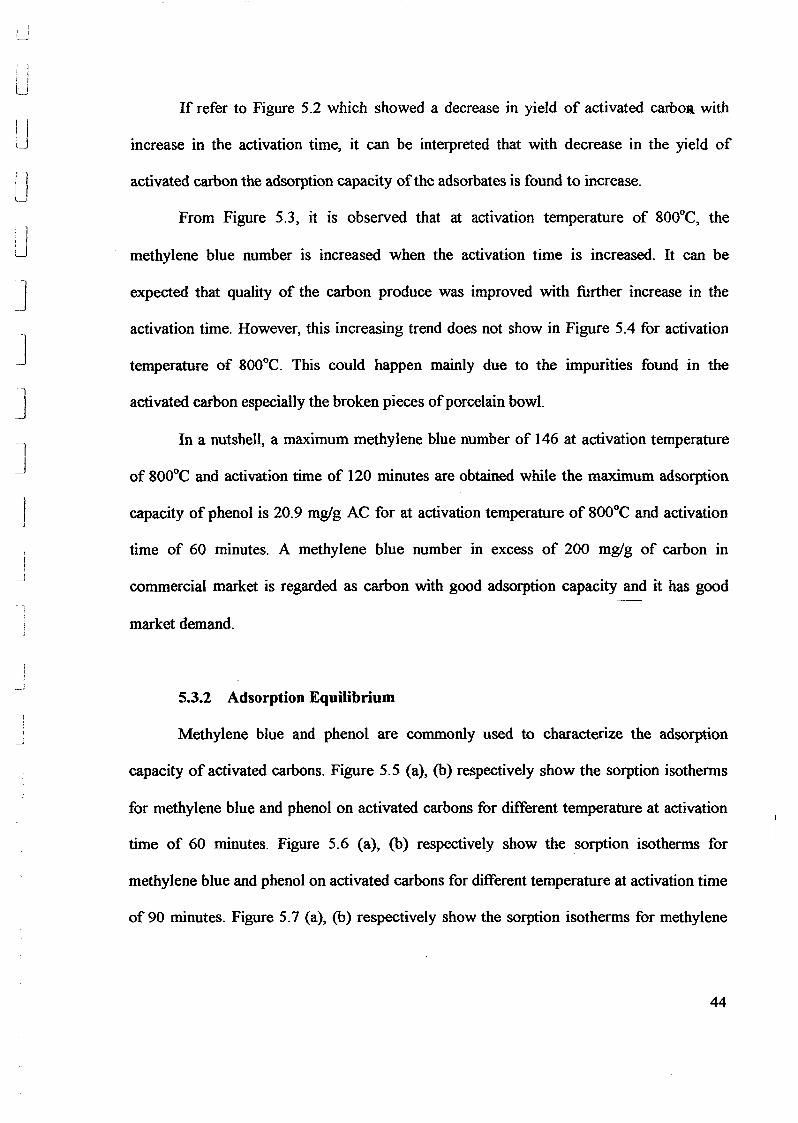
i 1~ ~
i iU
u')I I
U
JJJJ1
J
1__.J
_J
If refer to Figure 5.2 which showed a decrease in yield of activated carboI!l with
increase in the activation time. it can be interpreted that with decrease in the yield of
activated carbon the adsorption capacity ofthe adsorbates is found to increase.
From Figure 5.3, it is observed that at activation temperature of 800°C. the
methylene blue number is increased when the activation time is increased. It can be
expected that quality of the carbon produce was improved with further increase in the
activation time. However, this increasing trend does not show in Figure 5.4 for activation
temperature of 800°C. This could happen mainly due to the impurities found in the
activated carbon especially the broken pieces ofporcelain bowl.
In a nutshell, a maximum methylene blue number of 146 at activation temperature
of 800°C and activation time of 120 minutes are obtained while the maximum adsorption
capacity of phenol is 20.9 mglg AC for at activation temperature of 800°C and activation
time of 60 minutes. A methylene blue number in excess of 200 mglg of carbon in
commercial market is regarded as carbon with good adsorption capacity and it has good
market demand.
5.3.2 Adsorption Equilibrium
Methylene blue and phenol are commonly used to characterize the adsorption
capacity of activated carbons. Figure 5.5 (a). (b) respectively show the sorption isotherms
for methylene blue and phenol on activated carbons for different temperature at activation
time of 60 minutes. Figure 5.6 (a). (b) respectively show the sorption isotherms for
methylene blue and phenol on activated carbons for different temperature at activation time
of 90 minutes. Figure 5.7 (a). (b) respectively show the sorption isotherms for methylene
44
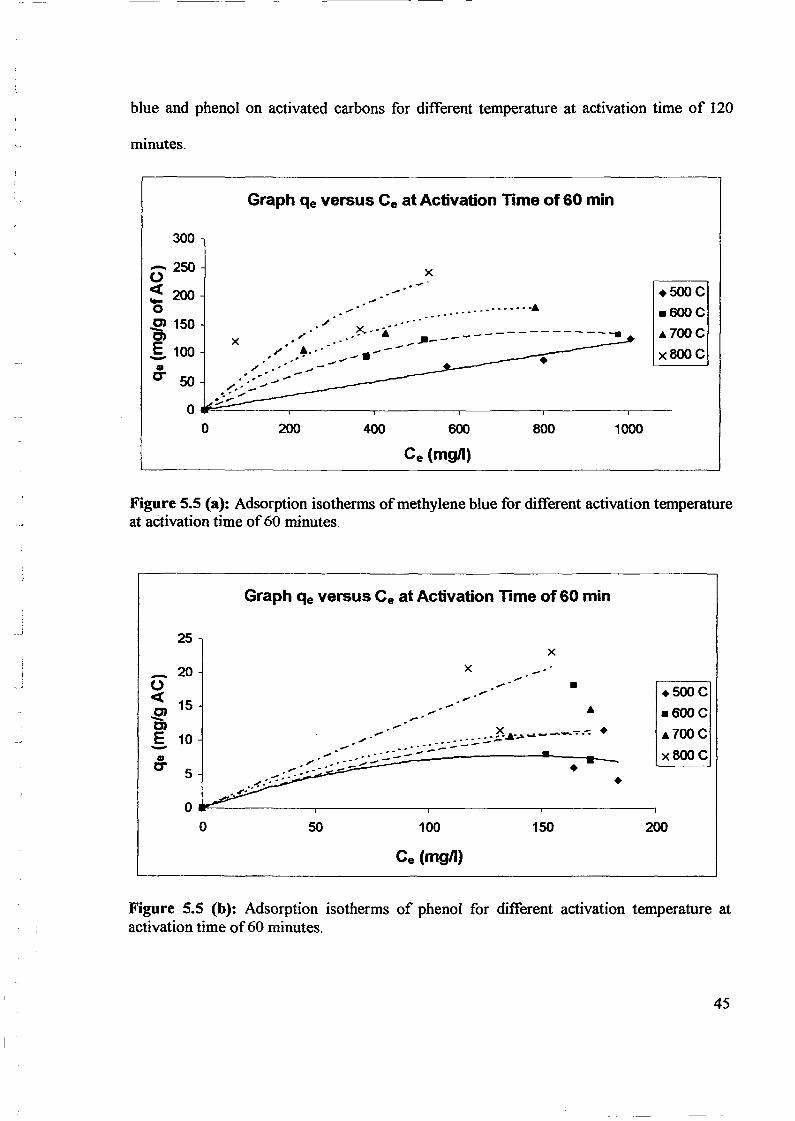
--- ----------
blue and phenol on activated carbons for different temperature at activation time of 120
minutes.
Graph qe versus Ce at Activation Time of 60 min
300
+5OOC
.600eA 70De
x800C
1000
x.......
_.' .' .• , _..•••.•• ·A.. '
600 800
Ce (mgJI)
200 400
- 250o<t 200'0~ 150 ./ x "A't» x ." .E 100 ,,' A•• ••• - .....
......... ~ #.. ." -.a- 50 . '.~:. -.;~ ,- ..... ...../ .... ",.-'
~ ":,. ....OW""'~---.--------,------.------.-----.----
o
Figure 5.5 (a): Adsorption isotherms ofmethylene blue for different activation temperatureat activation time of60 minutes.
Graph qe versus Ce at Activation Time of 60 min
+5ooe
.600e
A700C
x800C
200
++
x......
150
.... .....x
....
100
.................. .._.:...::.::..-J5.....~"""~-_.~.--: +
.... -:- -........... :-- -..... -....
50
25
- 200<t 15.gE 10-GICT 5
00
Figure 5.5 (b): Adsorption isotherms of phenol for different activation temperature atactivation time of60 minutes.
45
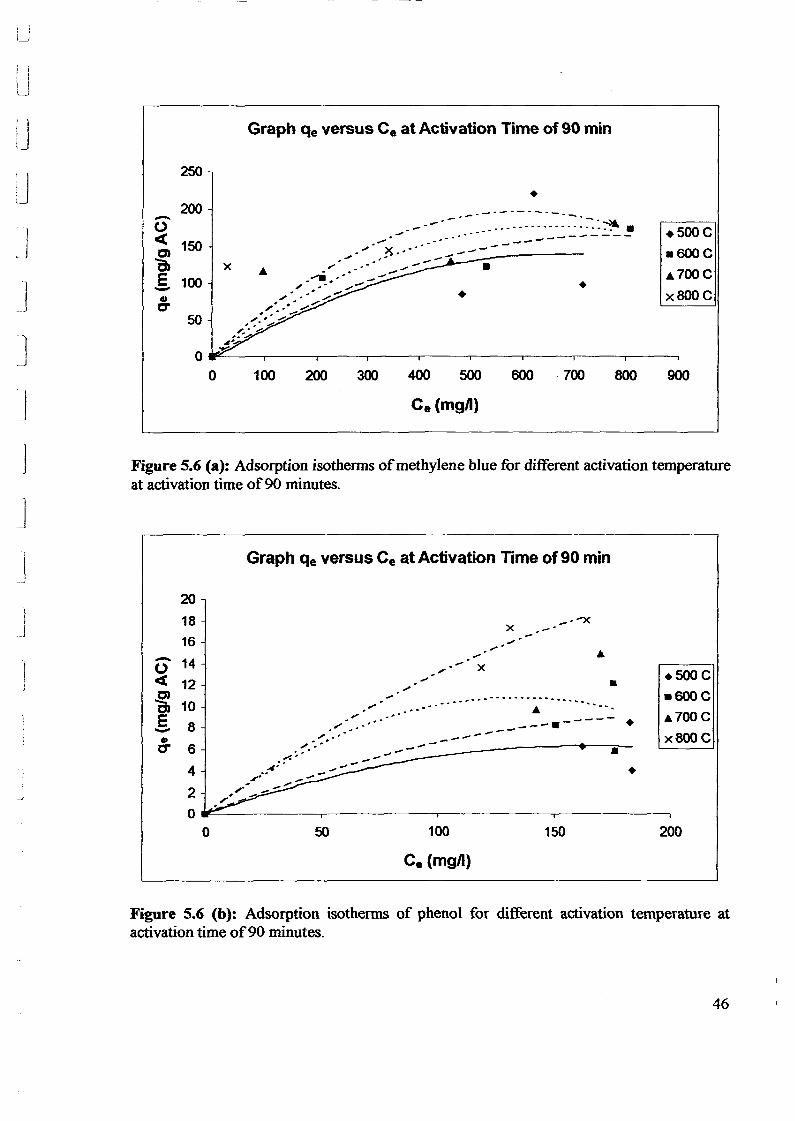
: il--!
u Graph qe versus Ce at Activation Time of 90 min
•lJ
JJ1
-~
J
250
200-0« 150CJ)-CJ)
E 100-GIC"
50
00 100 200 300 400 500 600 700 800
.5OOC
.600C
.700C
x800C
900
JJ
Figure 5.6 (a): Adsorption isotherms ofmethylene blue for different activation temperatureat activation time of 90 minutes.
Graph qe versus Ce at Activation Time of 90 min
.500C
.600C
.700C
x800C
200
•
•
_.-X
150
x
.-". --- _-- .. ........
....,--' x
100
Ce (mgn)
---.----- ..,... ..... --------=-------.......-..-
50
20
18
16
o 14« 12~C) 10.§. 8
GI
0" 6
4
2
O~=---------.------.-------.---------,
o
I...j
1J
Figure 5.6 (b): Adsorption isotherms of phenol for different activation temperature atactivation time of90 minutes.
46
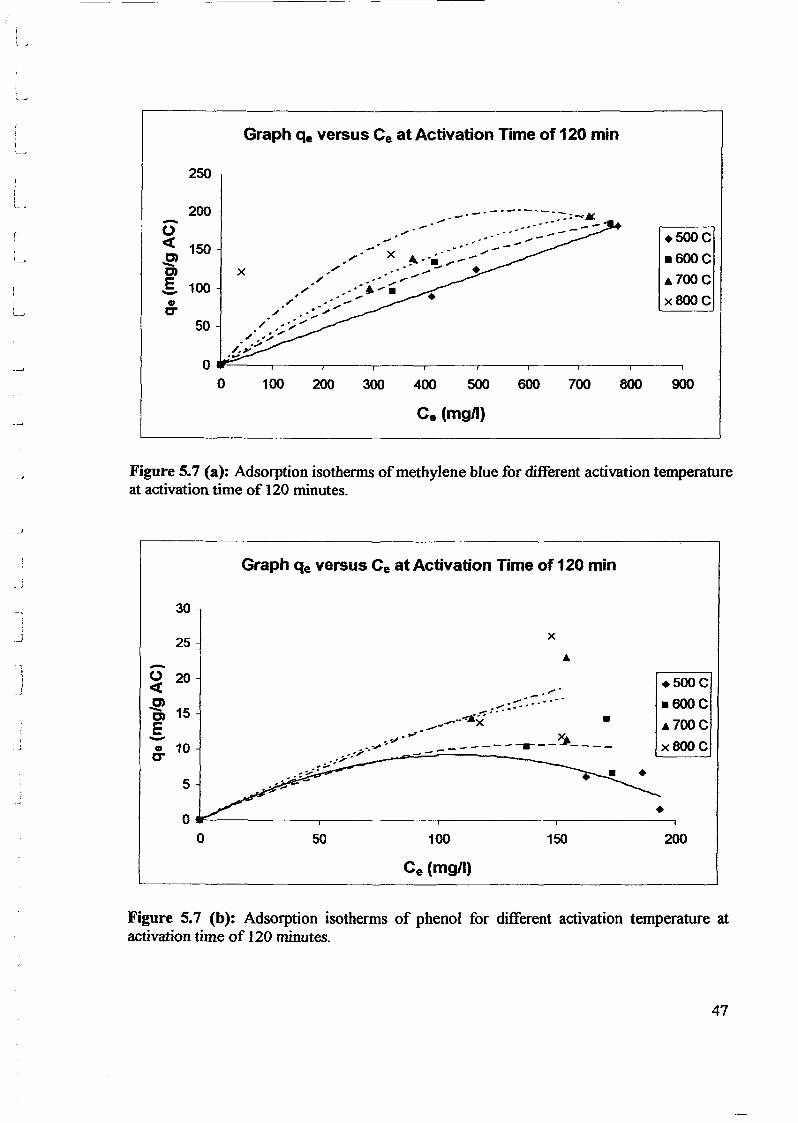
Graph qe versus Ce at Activation Time of 120 min
250
I,~
200-0« 150.E»C)
E 100-•C"50
00 100 200 300 400 500 600 700 800
.SOOC
.600C
A700C
x800C
900
Figure 5.7 (a): Adsorption isothenns ofmethylene blue for different activation temperatureat activation time of 120 minutes.
,_.-!
Graph qe versus Ce at Activation Time of 120 min
x
200
.5OOC
.600C
A700C
x800C
•15010050
....... ~:::::-... -
<JJi....-:. • •_--- x.-
.v·~ ~.., ....;. _---------r-- ----.. :;..:~.:; ,
.:;.-........~. ',... ...
30
25
-0 20«.E» 15C)
E-• 10C"
5
00
J
Ce (mgJI)
Figure 5.7 (b): Adsorption isotherms of phenol for different activation temperature atactivation time of 120 minutes.
47
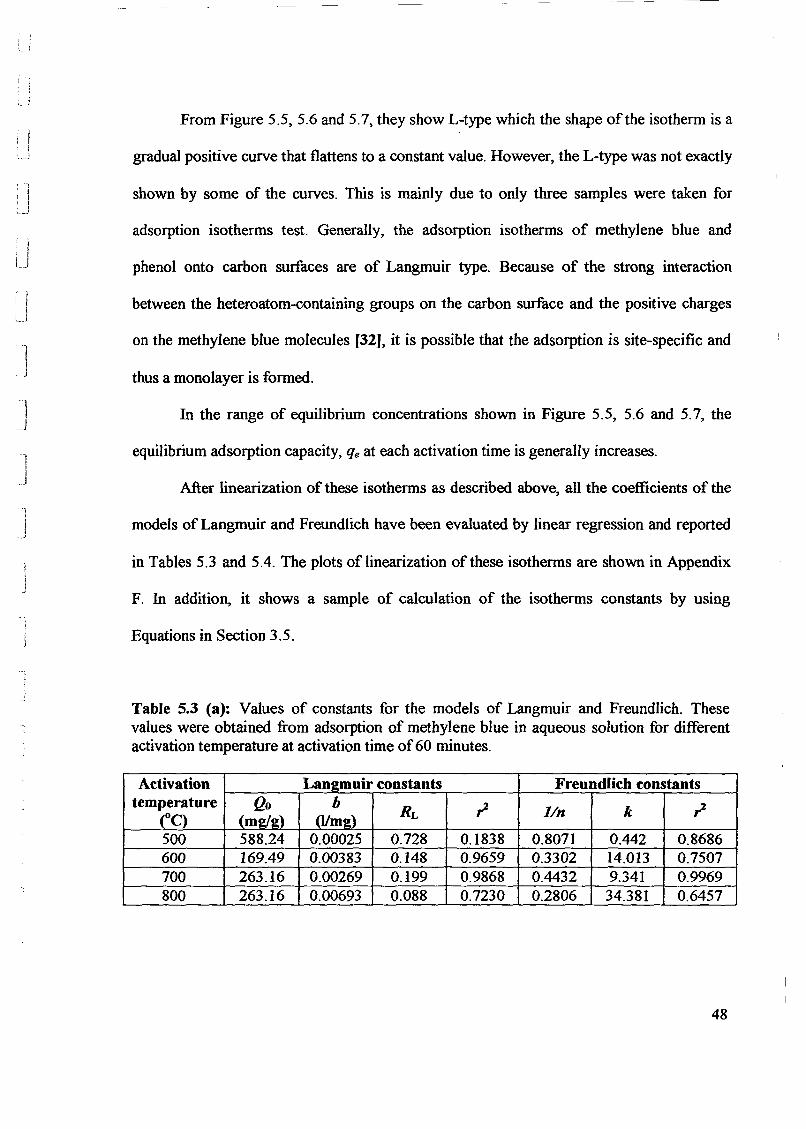
Iu
iJif
U[I,--J
]1
J
]_.J
1I
_.1
!_J
From Figure 5.5, 5.6 and 5.7, they show L-type which the shape ofthe isotherm is a
gradual positive curve that flattens to a constant value. However, the L-type was not exactly
shown by some of the curves. This is mainly due to only three samples were taken for
adsorption isotherms test. Generally, the adsorption isotherms of methylene blue and
phenol onto carbon surfaces are of Langmuir type. Because of the strong interaction
between the heteroatom-containing groups on the carbon surface and the positive charges
on the methylene blue molecules [32], it is possible that the adsorption is site-specific and
thus a monolayer is formed.
In the range of equilibrium concentrations shown in Figure 5.5, 5.6 and 5.7, the
equilibrium adsorption capacity, qe at each activation time is generally increases.
After linearization of these isotherms as described above, all the coefficients of the
models of Langmuir and Freundlich have been evaluated by linear regression and reported
in Tables 5.3 and 5.4. The plots of linearization of these isotherms are shown in Appendix
F. In addition, it shows a sample of calculation of the isotherms constants by using
Equations in Section 3.5.
Table 5.3 (a): Values of constants for the models of Langmuir and Freundlich. Thesevalues were obtained from adsorption of methylene blue in aqueous solution for differentactivation temperature at activation time of60 minutes.
Activation Lan2muir constants Freundlich constantstemperature Qo b RL ~ lin k ~(C) (mwg) (Vmg)
500 588.24 0.00025 0.728 0.1838 0.8071 0.442 0.8686600 169.49 0.00383 0.148 0.9659 0.3302 14.013 0.7507700 263.16 0.00269 0.199 0.9868 0.4432 9.341 0.9969800 263.16 0.00693 0.088 0.7230 0.2806 34.381 0.6457
48
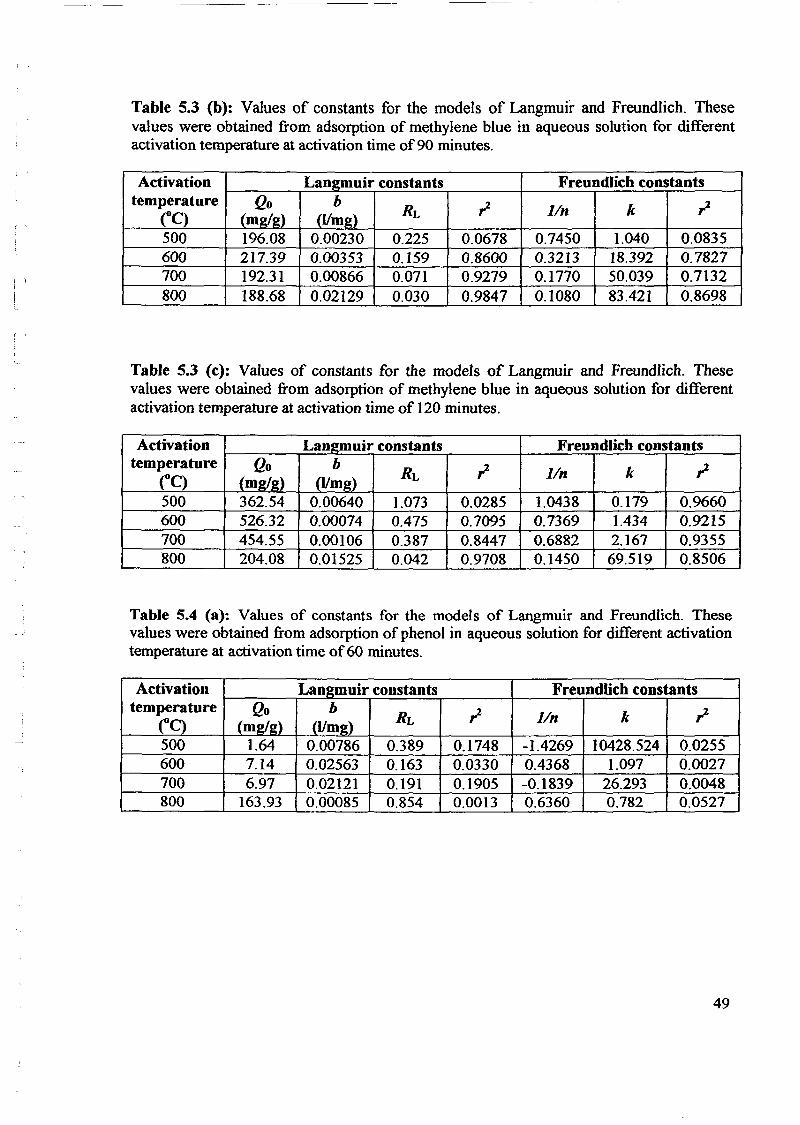
, )
Table 5.3 (b): Values of constants for the models of Langmuir and Freundlich. Thesevalues were obtained from adsorption of methylene blue in aqueous solution for differentactivation temperature at activation time of 90 minutes.
Activation Lan2muir constants Freundlich constantstemperature Qo b
RL,:z lin k ,:z
C'C) (mg/g) (I/mg)500 196.08 0.00230 0.225 0.0678 0.7450 1.040 0.0835600 217.39 0.00353 0.159 0.8600 0.3213 18.392 0.7827700 192.31 0.00866 0.071 0.9279 0.1770 50.039 0.7132800 188.68 0.02129 0.030 0.9847 0.1080 83.421 0.8698
Table 5.3 (c): Values of constants for the models of Langmuir and Freundlich. Thesevalues were obtained from adsorption of methylene blue in aqueous solution for differentactivation temperature at activation time of 120 minutes.
Activation Lan2muir constants Freundlich constantstemperature Qo b
RL ,:z lin k ,:zC'C) (mg/g) (I/mg)500 362.54 0.00640 1.073 0.0285 1.0438 0.179 0.9660600 526.32 0.00074 0.475 0.7095 0.7369 1.434 0.9215700 454.55 0.00106 0.387 0.8447 0.6882 2.167 0.9355800 204.08 0.01525 0.042 0.9708 0.1450 69.519 0.8506
Table 5.4 (a): Values of constants for the models of Langmuir and Freundlich. Thesevalues were obtained from adsorption of phenol in aqueous solution for different activationtemperature at activation time of60 minutes.
Activation Lan2muir constants Freundlich constantstemperature Qo b
RL ,:z lin k ,:zC'C) (mg/g) (11mg)500 1.64 0.00786 0.389 0.1748 -1.4269 10428.524 0.0255600 7.14 0.02563 0.163 0.0330 0.4368 1.097 0.0027700 6.97 0.02121 0.191 0.1905 -0.1839 26.293 0.0048800 163.93 0.00085 0.854 0.0013 0.6360 0.782 0.0527
49
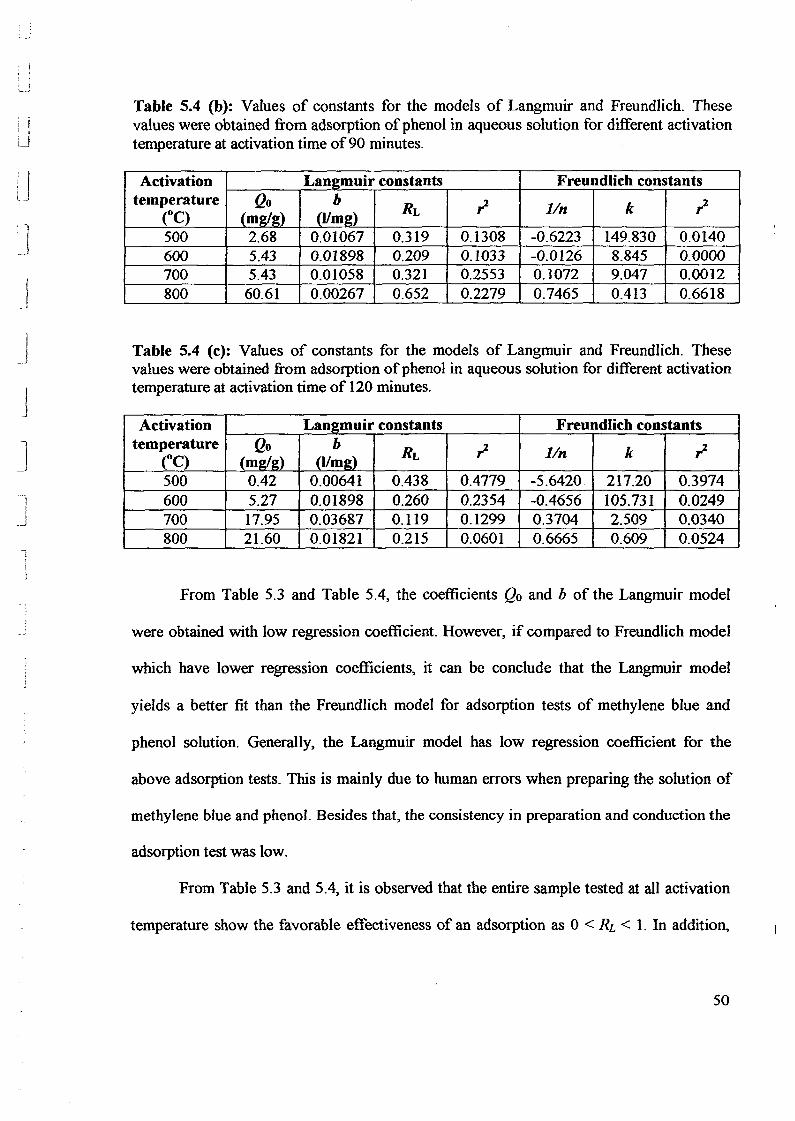
i, !
U
IIL. ~.J
JJ
J1
Table 5.4 (b): Values of constants for the models of Langmuir and Freundlich. Thesevalues were obtained from adsorption of phenol in aqueous solution for different activationtemperature at activation time of90 minutes.
Activation Langmuir constants Freundlich constantstemperature Qo b
RL ,;J lin k ,;J(DC) (mw~d (11m2)500 2.68 0.01067 0.319 0.1308 -0.6223 149.830 0.0140600 5.43 0.01898 0.209 0.1033 -0.0126 8.845 0.0000700 5.43 0.01058 0.321 0.2553 0.1072 9.047 0.0012800 60.61 0.00267 0.652 0.2279 0.7465 0.413 0.6618
Table 5.4 (c): Values of constants for the models of Langmuir and Freundlich. Thesevalues were obtained from adsorption ofphenol in aqueous solution for different activationtemperature at activation time of 120 minutes.
Activation Lan2muir constants Freundlich constantstemperature Qo b
RL ,;J lin k ,;J(DC) (mwg) (11mg)500 0.42 0.00641 0.438 0.4779 -5.6420 217.20 0.3974600 5.27 0.01898 0.260 0.2354 -0.4656 105.731 0.0249700 17.95 0.03687 0.119 0.1299 0.3704 2.509 0.0340800 21.60 0.01821 0.215 0.0601 0.6665 0.609 0.0524
From Table 5.3 and Table 5.4, the coefficients Qo and b of the Langmuir model
were obtained with low regression coefficient. However, if compared to Freundlich model
which have lower regression coefficients, it can be conclude that the Langmuir model
yields a better fit than the Freundlich model for adsorption tests of methylene blue and
phenol solution. Generally, the Langmuir model has low regression coefficient for the
above adsorption tests. This is mainly due to human errors when preparing the solution of
methylene blue and phenol. Besides that, the consistency in preparation and conduction the
adsorption test was low.
From Table 5.3 and 5.4, it is observed that the entire sample tested at all activation
temperature show the favorable effectiveness of an adsorption as 0 < RL < 1. In addition,
50
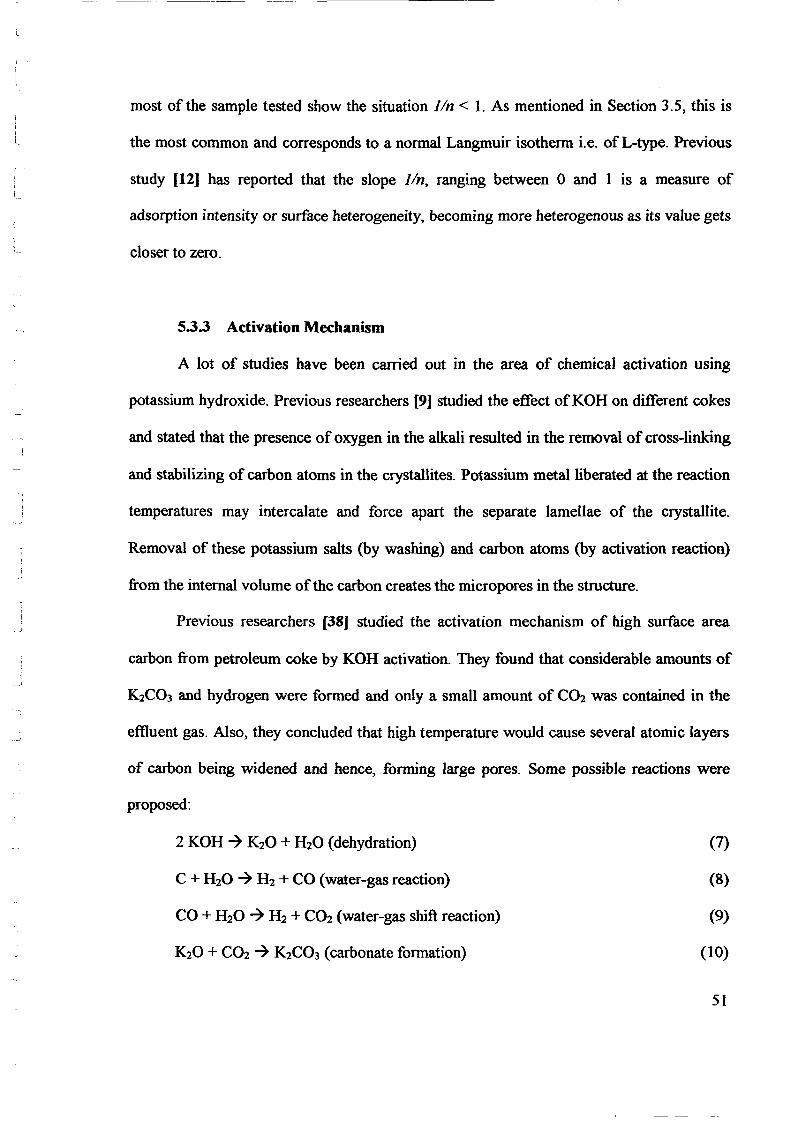
iL
.J
most of the sample tested show the situation lin < 1. As mentioned in Section 3.5, this is
the most common and corresponds to a normal Langmuir isotherm i.e. ofL-type. Previous
study [12] has reported that the slope lin, ranging between 0 and 1 is a measure of
adsorption intensity or surface heterogeneity, becoming more heterogenous as its value gets
closer to zero.
5.3.3 Activation Mechanism
A lot of studies have been carried out in the area of chemical activation using
potassium hydroxide. Previous researchers [9] studied the effect ofKOH on different cokes
and stated that the presence of oxygen in the alkali resulted in the removal of cross-linking
and stabilizing of carbon atoms in the crystallites. Potassium metal liberated at the reaction
temperatures may intercalate and force apart the separate lamellae of the crystallite.
Removal of these potassium salts (by washing) and carbon atoms (by activation reaction)
from the internal volume ofthe carbon creates the micropores in the structure.
Previous researchers [38] studied the activation mechanism of high surface area
carbon from petroleum coke by KOH activation. They found that considerable amounts of
K2C03 and hydrogen were formed and only a small amount of CO2 was contained in the
eflluent gas. Also, they concluded that high temperature would cause several atomic layers
of carbon being widened and hence, forming large pores. Some possible reactions were
proposed:
C + H20 ~ H2 + CO (water-gas reaction)
CO + H20 ~ H2 + C02 (water-gas shift reaction)
(7)
(8)
(9)
(10)
51
When the activation temperature exceeds 700°C, a considerable amount of metallic
potassium is formed due to the following possible reactions:
J
1_ J
1-~
1j
1I__.J
K20 + C ~ 2 K + CO (reduction by carbon)
(11)
(12)
52
1 1
UNIVERSITI SAINS MALAVSIASCHOOL OF CHEMICAL ENGINEERING
ENGINEERING CAMPUS
THE STUDY ON THE INFLUENCES OFOPERATING VARIABLES IN THE PRODUCTION
OF ACTIVATED CARBON FROM WASTESCRAPTYRES
CATHERINE LIMMatrie No.: 70471
April 2006
. 1...-. ---.1
r!
ABSTRACf
This final year project presents a study on the influences of activation time and
impregnation ratio in the production of activated carbon from waste scrap tyres. The
activated carbons were produced from waste scrap tyres and potassium hydroxide (KOH)
was used as an activating agent. Chemical activation was used to produce the activated
carbons under the temperature of 800°C. In this project, three series were produced using
different activation time: 60min, 90min and 120min. Every series contains fives
impregnation ratios from 1 to 5. The adsorption capacity of the activated carbons were
tested by using methylene blue and phenol. The influences of different operating variables
during chemical activation such as activation time and impregnation ratio on the carbon
yield and the adsorption characteristics were explored and the optimum preparation
conditions were recommended. A carbon yield ranging from 12.63% to 75.'58% was
obtained for activation time ranging from 60min to 120min. The highest amount adsorbed
for phenol and methylene blue were 30.47mglg AC and 173.45mglg AC respectively. The
optimum operating condition for preparing the activated carbon is 800°C, 60min and a
impregnation ratio of 4. BET surface areas could not be determined and presented in this
report because the Autosorb Surface Area Analyzer is out oforder.
VI
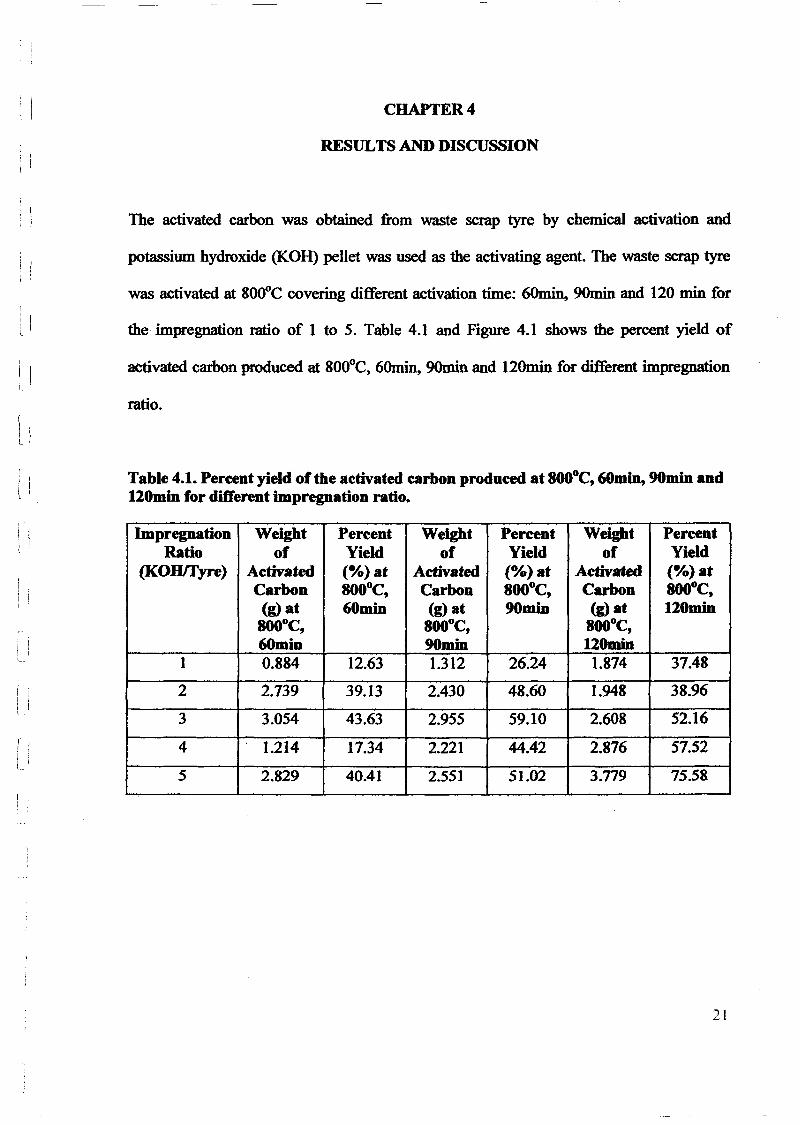
i il '
i I. !
i Il I
\ IJ ,I 'L I
IIi IL '
i i
1.,1
I
I j
i- 1I I, I'---
i •I \
l I
CHAPTER 4
RESULTS AND DISCUSSION
The activated carbon was obtained from waste scrap tyre by chemical activation and
potassium hydroxide (KOH) pellet was used as the activating agent. The waste scrap tyre
was activated at 8000e covering different activation time: 6Omin, 90min and 120 min for
the impregnation ratio of 1 to 5. Table 4.1 and Figure 4.1 shows the percent yield of
activated carbon produced at 800oe, 60min, 90min and 120min for different impregnation
ratio.
Table 4.1. Percent yield of the activated carbon produced at 800°C, 6Omin, 90min and120min for different impregnation ratio.
Impregnation Weight Percent Weight Percent Weight PercentRatio of Yield of Yield of Yield
(KOHlfyre) Activated (%)8t Activated (%)at Activated (%)atCarbon 800°C, Carbon 800°C, Carbon 800°C,(g)at 60min (g) at 90min (g) at 120min
800°C, 800°C, 800°C,60min 90min 120min
1 0.884 12.63 1.312 26.24 1.874 37.48
2 2.739 39.13 2.430 48.60 1.948 38.96
3 3.054 43.63 2.955 59.10 2.608 52.16
4 1.214 17.34 2.221 44.42 2.876 57.52
5 2.829 40.41 2.551 51.02 3.779 75.58
21
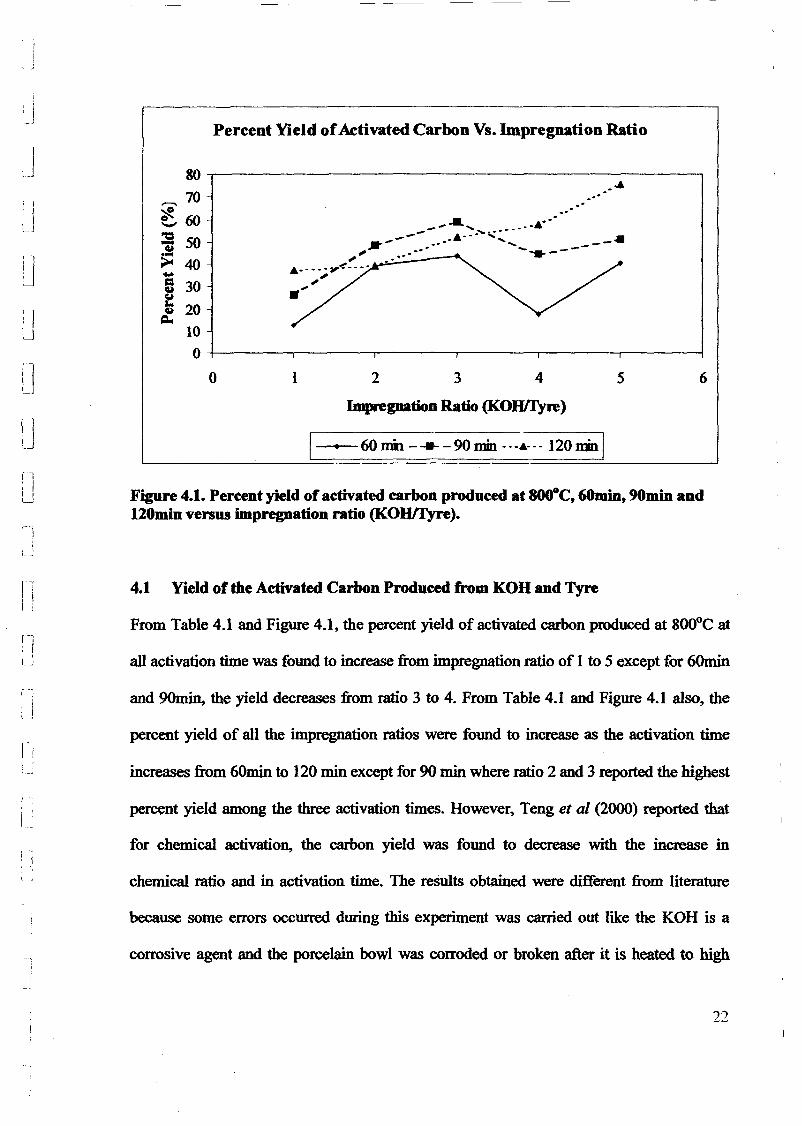
Percent Yield ofActivated Carbon Vs. Impregnation Ratio
----i~60 min - --- - 90 min -- .&- -- 120 min I
65
....'......,
234
Impregnation Ratio (KOHffyre)
1
... .................. A ' _ A--- .. '- -_.,,- -------" .. ",. ---
& •. __ -"."1:----
,,"....
80-.----------------------------,........ 70~60~50....>40-5 30~~ 20
100+------r------,-----,-----r------r---~----1
o
Figure 4.1. Percent yield of activated carbon produced at 800°C, 6Omin, 90min and120min versus impregnation ratio (KOHlfyre).
r iI ;I..."
lJr j
uuuUf1L--,
4.1 Yield of the Activated Carbon Produced from KOH and Tyre
From Table 4.1 and Figure 4.1, the percent yield of activated carbon produced at 800°C at
all activation time was found to increase from impregnation ratio of 1 to 5 except for 60min
and 9Omin, the yield decreases from ratio 3 to 4. From Table 4.1 and Figure 4.1 also, the
percent yield of all the impregnation ratios were found to increase as the activation time
increases from 60min to 120 min except for 90 min where ratio 2 and 3 reported the highest
percent yield among the three activation times. However, Teng et al (2000) reported that
, ~, for chemical activation, the carbon yield was found to decrease with the increase in
chemical ratio and in activation time. The results obtained were different from literature
because some errors occurred during this experiment was carried out like the KOH is a
corrosive agent and the porcelain bowl was corroded or broken after it is heated to high
- f-_.J
:j
iLJ
iI .
Li
(
I 'u
(i !Li
r] ,L_.~
temperature. Some of the pieces of porcelain bowl will be mixed with the activated carbon
when the activated carbon is transferred from the porcelain bowl to conical flask and it is
hard to be separated from the activated carbon. As a consequence, this will contribute to the
percent yield of the activated carbon produced. On the other hand, some of the activated
carbon could not be completely taken out from the porcelain bowl and some ofit was stuck
on the filter paper and hard to be taken out. Ariyadejwanich et al (2002) reported a
carbonization yield of around 35% for physical activation. From the results of this
experiment and the results from journal, it is clearly shown that the carbon yield from
chemical activation is more than the yield from physical activation. Besides that, the
activated carbon with a much more ordered structure is produced from chemical activation
and once the chemical agent is eliminated after the heat treatment, the porosity is so much
developed.
4.2 Aqueous Adsorption Capacity ofActivated Carbon Produced from KOH andTyre.
Aqueous adsorption tests were conducted on activated carbon produced at 8ooGC, 60min,
90min and 120min for different impregnation ratio with the aim of producing further
evidence about its POlOJJS structure and also for assessing potential applications in the water
treatment industry. Phenol is preferentially adsorbed in small and medium sized micropores
while methylene blue is mainly adsorbed in medium and large micropores. Table 4.24.3
and Figure 4.24.3 shows the adsorption capacity for phenol and methylene blue by 0.2g of
activated carbon produced at 800GC, 60min, 90min and 120min for different impregnation
ratio.
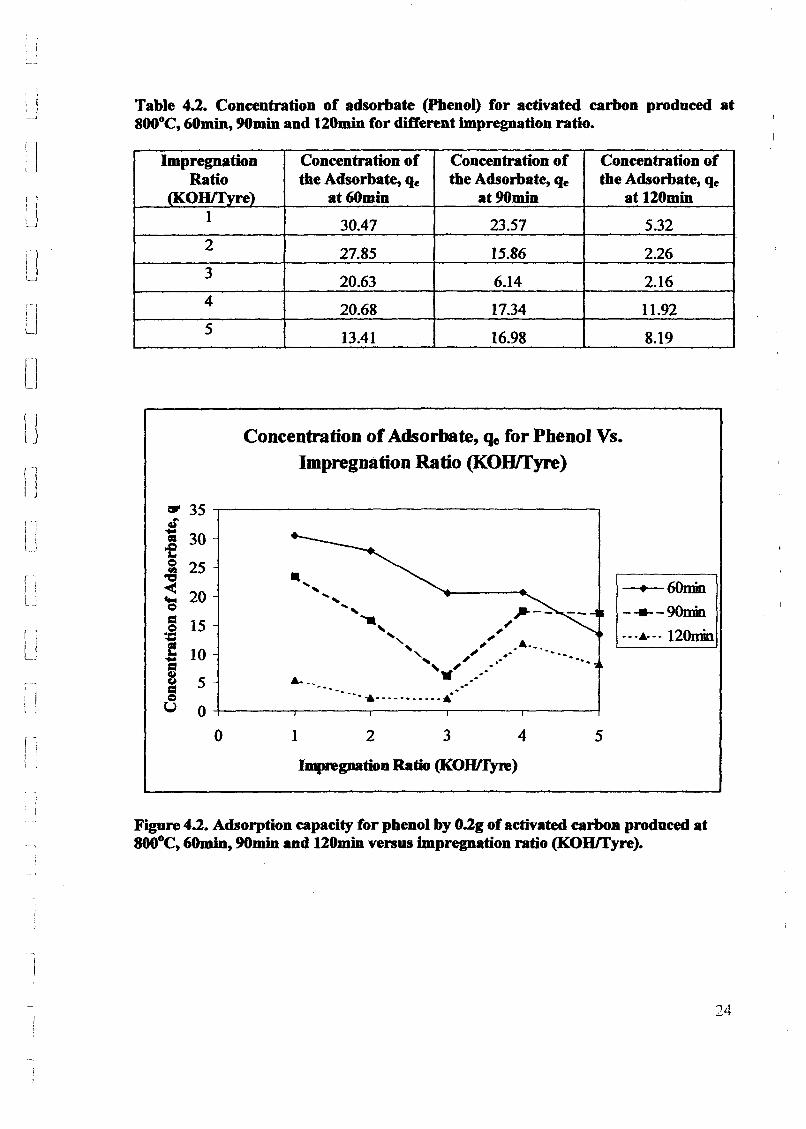
: ILJ
u'I! I
LJ
Table 4.2. Concentration of adsorbate (phenol) for activated carbon produced at800°C, 60min, 90min and 120min for different impregnation ratio.
Impregnation Concentration of Concentration of Concentration ofRatio the Adsorbate, qe the Adsorbate, qe the Adsorbate, qe
(KOHlfyre) at60min at90min at 120min1 30.47 23.57 5.322 27.85 15.86 2.263 20.63 6.14 2.164 20.68 17.34 11.925 13.41 16.98 8.19
uConcentration ofAdsorbate, qe for Phenol Vs.
Impregnation Ratio (KOHffyre)
Impregnation Ratio (KOWI'yre)
• 60min
- ... -9Omin
......... 120min
542 31
..............
....... ~-- --...., ,~
..., '" ~' " ." '.- .. -.',,' ....... -'.. .0............-_ .
~ 35..~....
30all
of~ 25
"C:'-< 20CS= 15~f 10....=~ 5CI
~U 0
0
( 'i
l ij tL)
i iI 'I
,---i iI II IL_:
Figure 4.2. Adsorption capacity for phenol by O.2g of activated carbOB produced at800°C, 60min, 90min and 120min venus impregnation ratio (KOHlfyre).
24
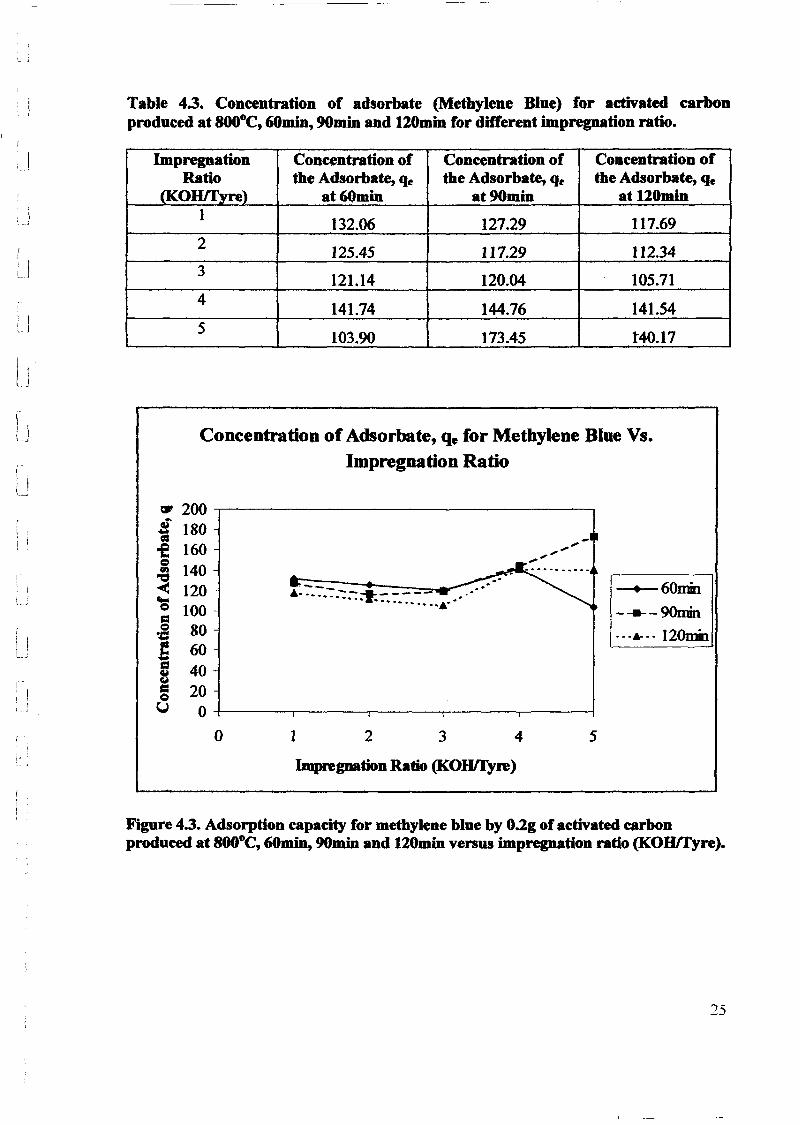
) Ii..--..J
r 1L~
u
Table 4.3. Concentration of adsorbate (Methylene Blue) for activated carbonproduced at 800°C, 60min, 90min and 120min for different impregnation ratio.
Impregnation Concentration of Concentration of Concentration ofRatio the Adsorbate, qe the Adsorbate, qe the Adsorbate, qe
(KOlllI'yre) at60min at90min at 120min1
132.06 127.29 117.692
125.45 117.29 112.343
121.14 120.04 105.714
141.74 144.76 141.545
103.90 173.45 140.17
Concentration of Adsorbate, qe for Methylene Blue Vs.Impregnation Ratio
1 2 3 4 5
Impregnation Ratio (KOWIyre)
-~;,;
;'~_._-._.---
... .' ~.._-- .."~". --:t:-----~."" -.-.-. -. " .-..... -.~...
ri :
l I
~ 200 ,..--------------------,
.( 180of 160e§ 140~ 120'S 100
J 80
i :Cl 20eU O-t------r-----.-----...------,-----i
o
• 60min
- -9Omin.-.~ 120min
Figure 4.3. Adsorption capacity for methylene blue by O.2g of activated carbonproduced at 800°C, 6Omin, 90min and 120min versus impregnation ratio (KOHlfyre).
i I
LJ
1
U( ji '
lJ
(i, I
i \''-.J
r 1.
! ILJ
1'1I ;
!
From Table 42-4.3 and Figure 4.2-4.3, it was found that for all the three activation time,
the amount adsorbed by both phenol and methylene blue decreased from impregnation ratio
of I to 3 and then increased from ratio 3 to 4 and then decreased again from ratio 4 to 5. For
the activation time of~ the amount adsorbed by methylene blue increased from
impregnation ratio of 4 to 5 instead of decreased. For both the phenol and methylene blue
adsorption, the amount adsorbed was found to decrease with activation time except for the
activation time of 90min where ratio 4 and 5 reported the highest amount adsorbed among
the three activation times. Phenol adsorption depends not only on the porous properties of
the adsorbent but also on its surface properties. Due to its higher ash content, it is
reasonable to assume that the surface of the prepared activated carbon was somewhat
hydrophilic in natw'e, leading to a lower phenol adsorption if compare to methylene blue
adsorption. The high ash content interfered in filtration thus causing the final conductivity
for the ratio of 3 to be the highest among the 5 ratios. As a consequence, the amount
adsorbed for impregnation ratio of3 always reported the lowest among the 5 ratios for both
phenol and methylene blue test. This indicates that the porosity created in the activated
carbon is blocked by the potassium compounds that must be removed to obtain an
accessible microporosity. For phenol test, ratio 1 always reported the highest amount
adsorbed by phenol because the KOH is thoroughly removed in washing stage.
4.3 Adsorption Equilibrium
The adsorption isotherms ofphenol at 45°C are shown in Figme 4.5-4.7 and the adsorption
isotherms ofmethylene blue at 30°C are shown in Figure 4.11-4.13. There is a widely used
two-parameter Langmuir equation given as follows:
26
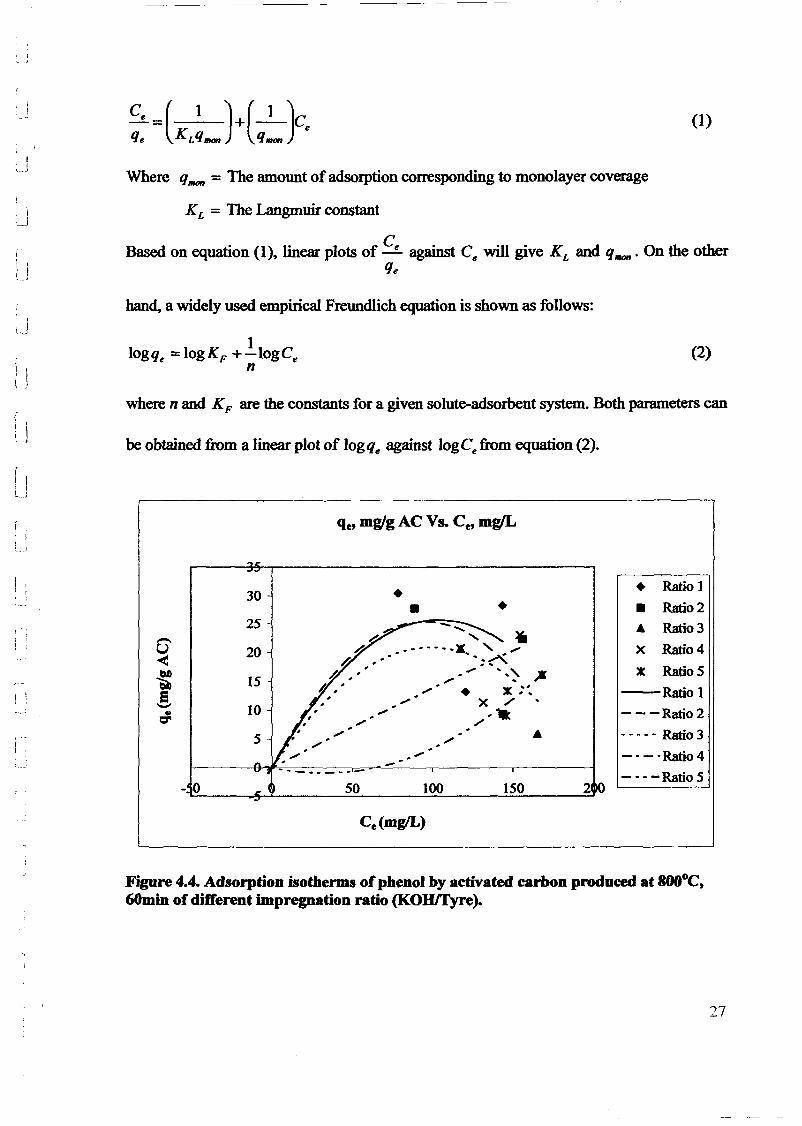
(1)
Where q_ = The amount ofadsorption corresponding to monolayer coverage
K L = The Langmuir constant
Based on equation (1), linear plots of Ce against Ce will give K L and q1/lOfl. On the otherqe
hand, a widely used empirical Freundlich equation is shown as follows:
1logqe == logKF +-logCen
(2)
( I
! \L..J
where n and KF are the constants for a given solute-adsorbent system. Both parameters can
be obtained from a linear plot of logqe against logCefrom equation (2).
• Ratio 1
• Ratio 2
• Ratio 3x Ratio4
:lie RatioS
-Ratiol
- --Ratio2._-.- Ratio 3
_·--Ratio4
- - - -RatioS2150
•
., • :lie ,I1,/ X ./
1-.;'
., A.,
100
• •
50
30
25-U 20-<~ 15e- 10..t::l"
5
- 0
t__ J
r --~
\
Ce(mgIL)
Figure 4.4. Adsorption isotherms ofphenol by activated carbon produced at SHoe,60min of ditTerent impregnation ratio (KOHffy~).
27
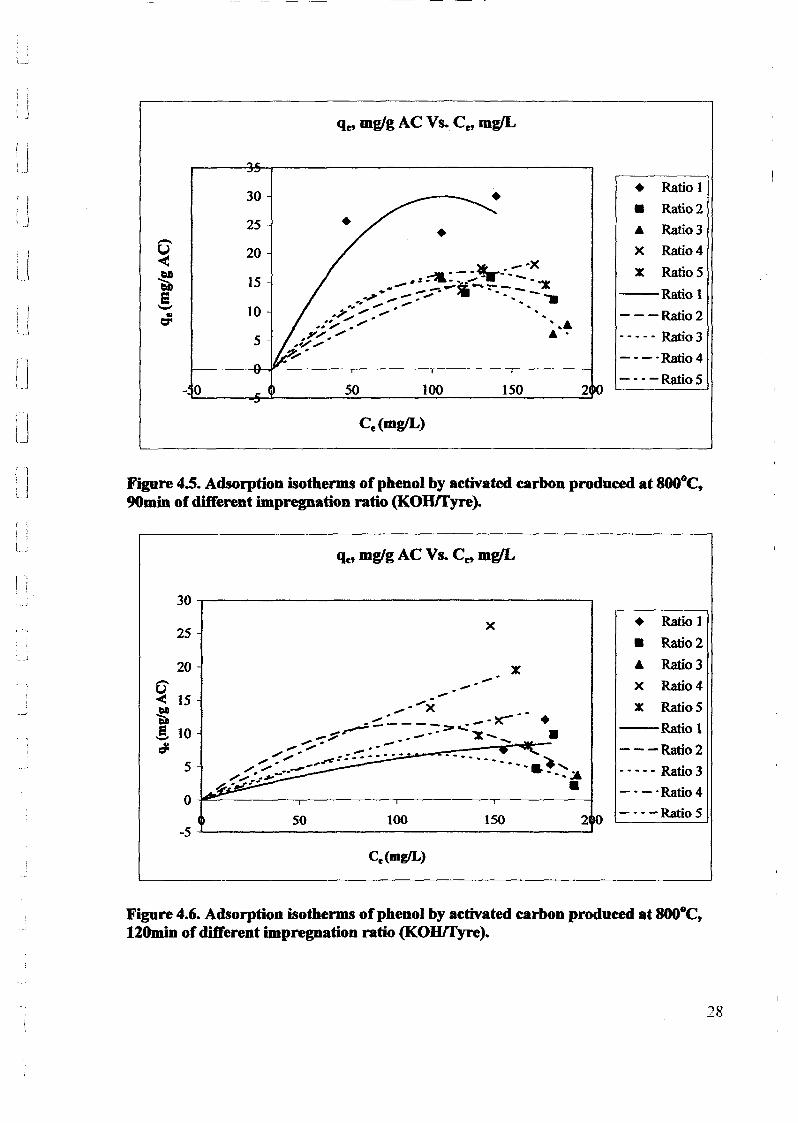
q~ mglg AC Vs. Ce, mgIL
iL!
! I, I\ .J
1\
U
u- 0
30
25
20
15
10
5
Ce(mgIL)
2
• Ratio 1
• Ratio 2
• Ratio 3X Ratio 4
X Ratio 5
--Ratio 1
---Ratio2
- - • - - Ratio 3
--_°Ratio4
- - - -Ratio 5
IIl.-i
Figure 4.5. Adsorption isotherms of phenol by activated carbon produced at 800°C,90min of different impregnation ratio (KOHlfyre).
( j
\ 'L~
,.I
Qe, mglg AC Vs. Cet mgIL
30...------------------------,
0-1-==-------.------.--------..-------1
-
X
-• Ratio I
• Ratio 2
• Ratio 3X Ratio 4
% Ratio 5
-Ratio 1
---Ratio2. .•.• Ratio 3
_. - ° Ratio 4_ .• -Ratio 5
2ISO10050
-·.....x."'" ...~____ ._-x- •-,,- _.'~~'X- •
,... -:,. ....-: ~.'_"._--=:"':"":'_:_"4....~ac::_:..... ,. .',.~. ..-.- ....
./ ~ - ,,c - . . . - . . . . . "/,. -- ' ....../,.:.',#0'.- .•• .".
.;!;. •• •
20
5
25
g...... 15
~!. 10r/<
-5 -'--------------------------1Ce(mgIL)
Figure 4.6. Adsorption isotherms of phenol by activated carbon produced at 800°C,120min of different impregnation ratio (KOHlfyre).
28
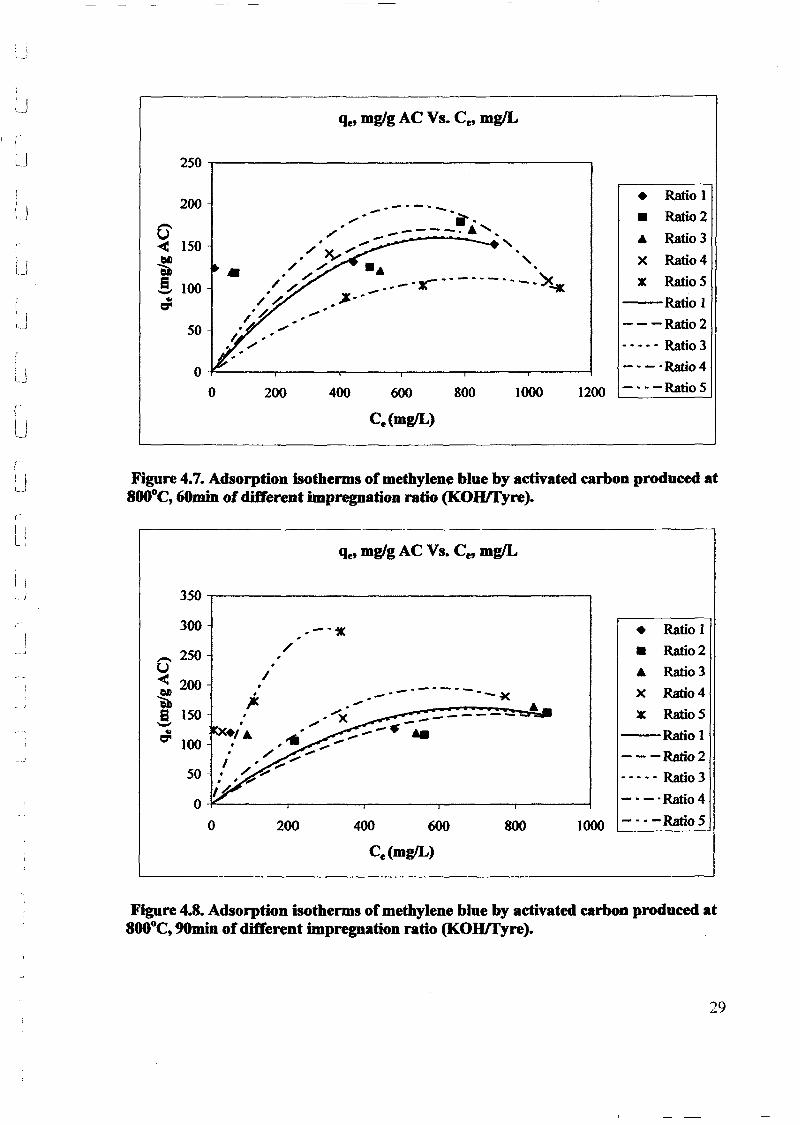
qe' mg/g AC Vs. Ce, mgIL
Figure 4.7. Adsorption isotherms of methylene blue by activated carbon produced at800oC,6Omin of different impregnation ratio (KOHffyre).
.."..---- .........". ...
i ----.A', .... ."... ,.. ..... ," v," •. ~ ". / /: -. .
/ ./.. /. .. - .r- --- --- --- -X-.c/~ ~_.-
/h ......"
I.. /:.
LJ
u
II'-.. ..1
".\
U
LJ
250
200
U< 150
~E! 100-4!~
50
00 200 400 800 1000 1200
• Ratio 1
• Ratio2
• Ratio 3X Ratio 4
J: Ratio S
-Ratio 1
---Ratio2
- - - - - Ratio 3
- - - .Ratio 4
----RatioS
r :L'
qe, mg/g AC Vs. Cet mgIL
• Ratio 1
• Ratio 2• Ratio 3x Ratio4
X Ratio 5
-Ratio!
-- -Ratio 2
- - -. - Ratio 3
- - - . Ratio 4
-_·-RatioS1000800
------
600400
..-..--.----- ...... ~-.--"Ie
/
200
..I.
;...
50
O-i"'----...-----...-----,.----,...------;
o
350 -r---------------------,
300
_ 250U< 200~,! ISO..~100
" .,t
!I !
Figure 4.8. Adsorption isotherms of methylene blue by activated carbon produced at800°C,90min of different impregnation ratio (KOlUfyre).
29
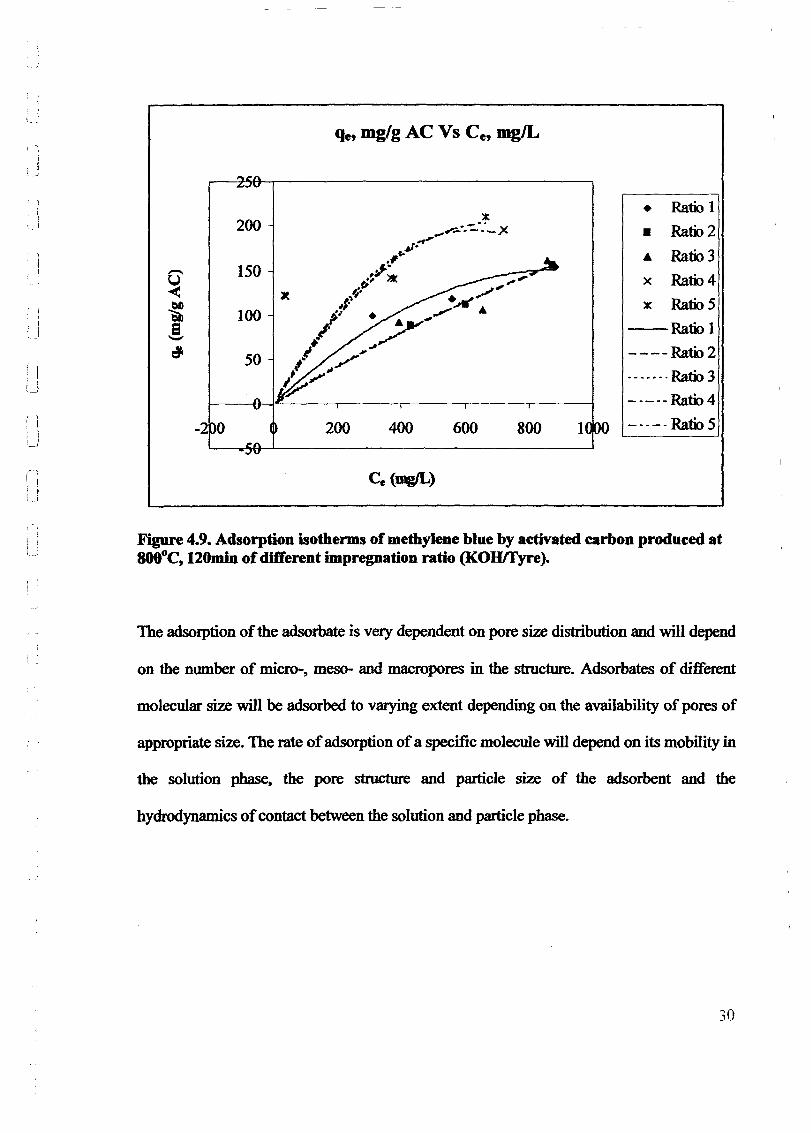
t.
qe, mg/g AC Vs Ce, mglL
1
I~_ .J
. ii,,-,
! j• It,J
IIi !u
{i!
[1
-2 0
200
150
100
50
200 400
Ce (mgIL)
600 800 1
• Ratio 1
• Ratio 2
4 Ratio 3
X Ratio4
:Ii: Ratio 5
--Ratio 1
----Rafu2
_······Rafu3
-----Rafu4
-----Rafu5
Figure 4.9. Adsorption isotherms ofmethylene blue by activated carbon produced at800°C, 120min of different impregnation ratio (KOIllfyre).
The adsorption ofthe adsorbate is very dependent on pore size distribution and will depend
on the number of micro-, meso- and macropores in the structure. Adsorbates of different
molecular size will be adsorbed to varying extent depending on the availability of pores of
appropriate size. The rate ofadsorption of a specific molecule will depend on its mobility in
the solution phase, the pore structure and particle size of the adsorbent and the
hydrodynamics ofcontact between the solution and particle phase.
30
UNIVERSITI· SAINS MAlAYSIASCHOOL OF CHEMICALENGINHAING
ENGINEERING CAMPUS·
:P~SPARATIONOFACTIVATEEDCARStJflPtft$)"WASTE ·TIREE BY CHEMICAL ACTIVATllfJNAND
ADSOliPT/ON PERFORMANOe
CHIN SlOW TENGMattie No.: 73109
April 2007
PREPARATION OF AcnvATFD CARBON FROM WASTE TIRES BY CHEMICAL ACTIVATION AND ADSORPTIONPERFORMANCES
ABTRACT
A sand fluidized bed reactor is used for pyrolysis of waste tires in producing char
and chemical activation of char to prepare activated carbon. Waste tire is an abundant
and non-biodegradable material was used to prepare activated carbon by chemical
activation with potassium hydroxide (KOH) as the activating agent at various
parameters. The parameters include activation temperature, activation time and
impregnation ratio. The yield of activated carbon is increased when both of the
activation temperature and activation time is decreased. However, the yield ofactivated
carbon is decreased when the impregnation ratio is increased except for impregnation
ratio 4. The adsorption equilibrium and kinetics of phenol on such carbon were then
studied at 30"C for 48 hours. The equilibrium data for phenol adsorption well fitted to
Langmuir isotherm equation, with a maximum monolayer adsorption capacity of
238.10 mglg. The best quality of activated carbon was obtained at an activation time,
temperature and impregnation ratio of 2 h, 850 and 4 respectively. The characteristics
of typical commercial activated carbon were measured and compared. The adsorption
kinetics shows that pseudo-second"'Ol'der rate fitted the adsorption kinetics better than
pseudo-first-order rate equation.
Keywords: Activated carbon; Waste tires; Pyrolysis; Phenol Adsorption; Isotherms;
Kinetics
ix
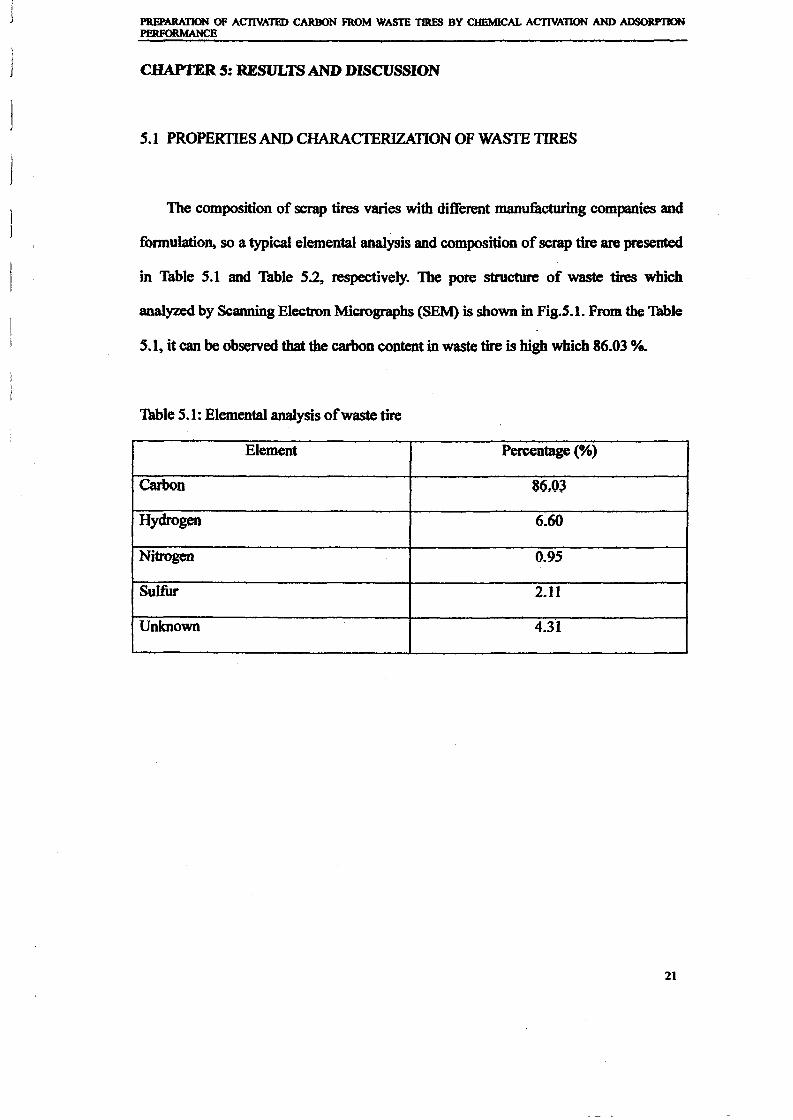
------- -- _._-----------------
PREPARATION OF ACTIVATED CARBON FROM WASTE TIRES BY CHEMICAL AcnvATION AND ADSORPTIONPERFORMANCE
CHAPTER S: RESULTS AND DISCUSSION
5.1 PROPERTIES AND CHARACTERIZATION OF WASTE TIRES
The composition of scrap tires varies with different manufacturing companies and
formulation, so a typical elemental analysis and composition of scrap tire are presented
in Table 5.1 and Table 5.2, respectively. The pore structure of waste tires which
analyzed by Scanning Electron Micrographs (SEM) is shown in Fig.S.l. From the Table
5.1, it can be observed that the carbon content in waste tire is high which 86.03 %.
Table 5.1: Elemental analysis ofwaste tire
Element Percentage (%)
Carbon 86.()~
Hydrogen 6.60
Nitrogen 0.95
Sulfur 2.11
Unknown 4.31
21
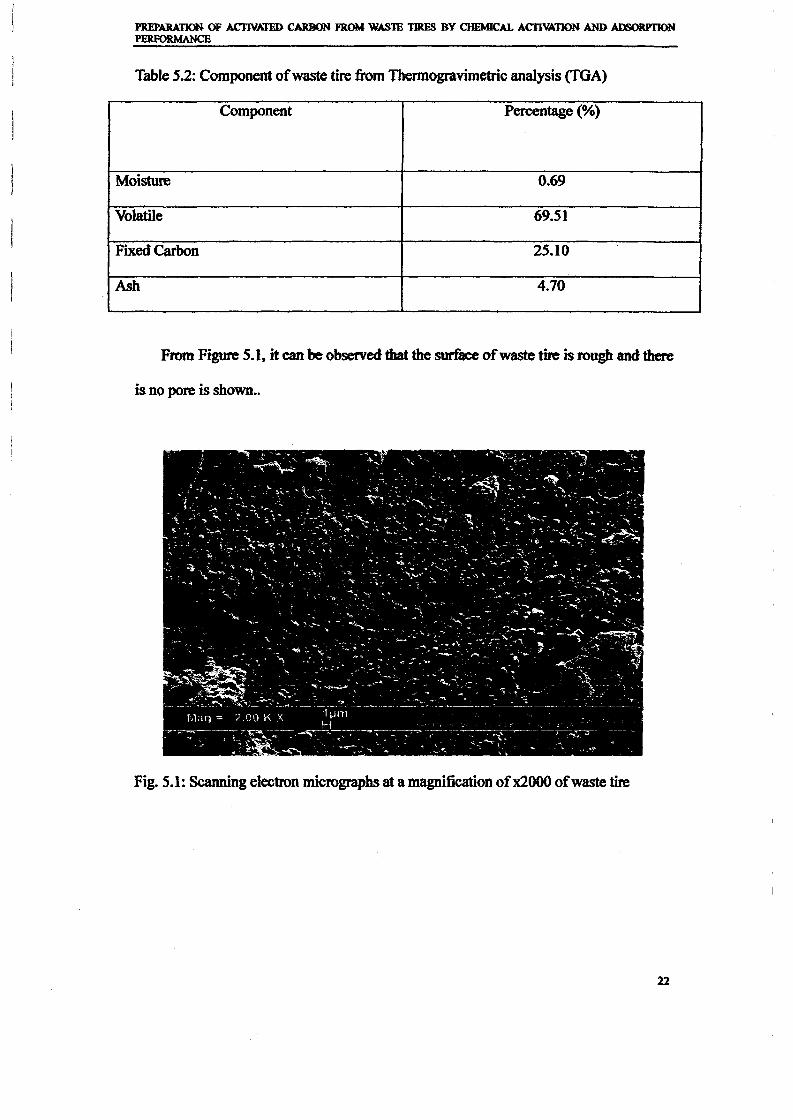
l'REPARAnoN OF ACJlVJJED CARBON FROM WASTE TIRES BY CHEMICAL ACTIVATION AND ADSORPTIONPERFORMANCE
Table 5.2: Component ofwaste tire from Thermogravimetric analysis (TGA)
Component Percentage (%)
Moisture 0.69
Volatile 69.51
Fixed Carbon 25.10
Ash 4.70
From Figure 5.1, it can be observed that the surface ofwaste tire is rough and there
is no pore is shoWD••
Fig. 5.1: Scanning electron micrographs at a magnification ofx2000 ofwaste tire
PREPARATION OF ACI1VATED CARBON FROM WASTE TIRES BY CHEMICAL ACIlVA110N AND ADSORPI1ONPERFORMANCE
5.2 PROPERTIES OF CHAR FROM PYROLYSIS IN FLUIDIZED BED
The cbemical composition of the pyrolytic char produced by fluidized bed reactor
PY19J~,~ w»~ ;,s gjvmJ mr.,bJ~ ,5,3tTh~ P9~ ,$f.JY~ 9f~ ~bw ~$b9wnmff&~~!
From Table 5.3. it bas shown that the percentage ofcarboa\ hydrog~ nitrogen and
.$JlltiJr ~~~PY19~~ in tJwd~ ~~m~ wltb~~..~ ;,$~
to reaction is occurred during pyrolysis ofwaste tire. The main chemical reaction could
WasteThes (1)
In this work, only the char is analyzed. The char is analyzed by SEM (Scanning
~J~n mj~gm~) lpQb~e the~~ ID9rnbpJ98Y wbiJe~~$m9P 9f
char produced can be analyzed by Elemental analysis. It is important to analysis the
~~ of ~~~ ~Jw j,~ y~ foJ' timb~ ~mi91) ~ 19 proa!l~
activated carbon.
Further activation process for pyrolytic char is necessaJ)' because it contains almost
III ~~ m91J1J),i~ !'9mPP~~m in~,~~ ~ .$jgJ1ifi~t ~QPQt of~ndM,~J;Jy
products formed during pyrolysis process.
23
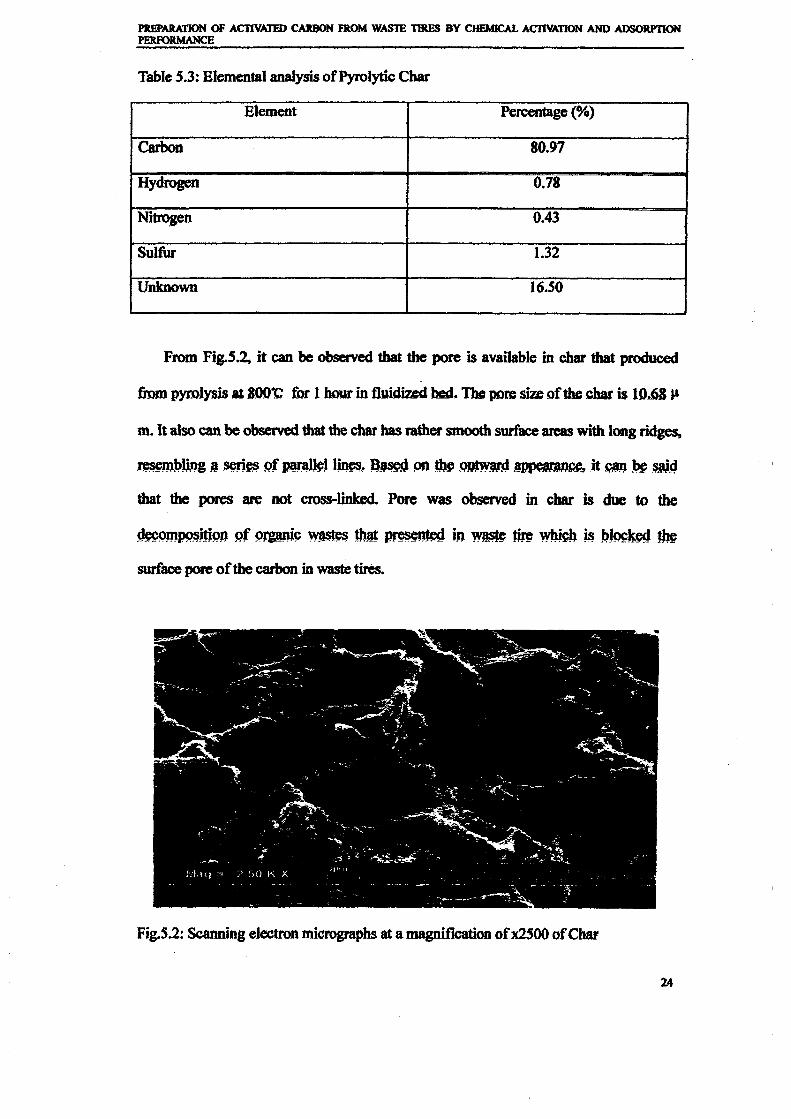
PREPARATION OF ACTIVATED CARBON FROM WASTE TIRES BY CHEMICAL ACTIVATION AND ADSORPTIONPERFORMANCE
Table 5.3: Elemental analysis ofPyrolytic Char
Element Percentage (%)
Carbon 80.97
Hydrogen 0.78
NitroJeD 0.43
Sulfur 1.32
Unknown 16.50
From Fig.S.4 it can be observed that the pore is avat1able in char that produced
from pyrolysis at JOO-c for I hour in flllidizal bed. The pores~ ofthc ~bar is 10.63 J.L
m. It also can be observed that the char has rather smooth surface areas with long rid~
~~Jmg ll.~~ 9f~J J~~ B~ M J:b~~ll~.,it gm.~~g
that the pores are not cross-linked. Pore was observed in char is due to the
~m~Jti9u 9f 9JWP.»9~ tbJ1:~ in~ me wm~b l$ pJwk~ .~
surface pore ofthe carbon in waste tires.
Fig.S.2: Scanning electron micrographs at amagniiJeation ofx2S00 ofCbat
24
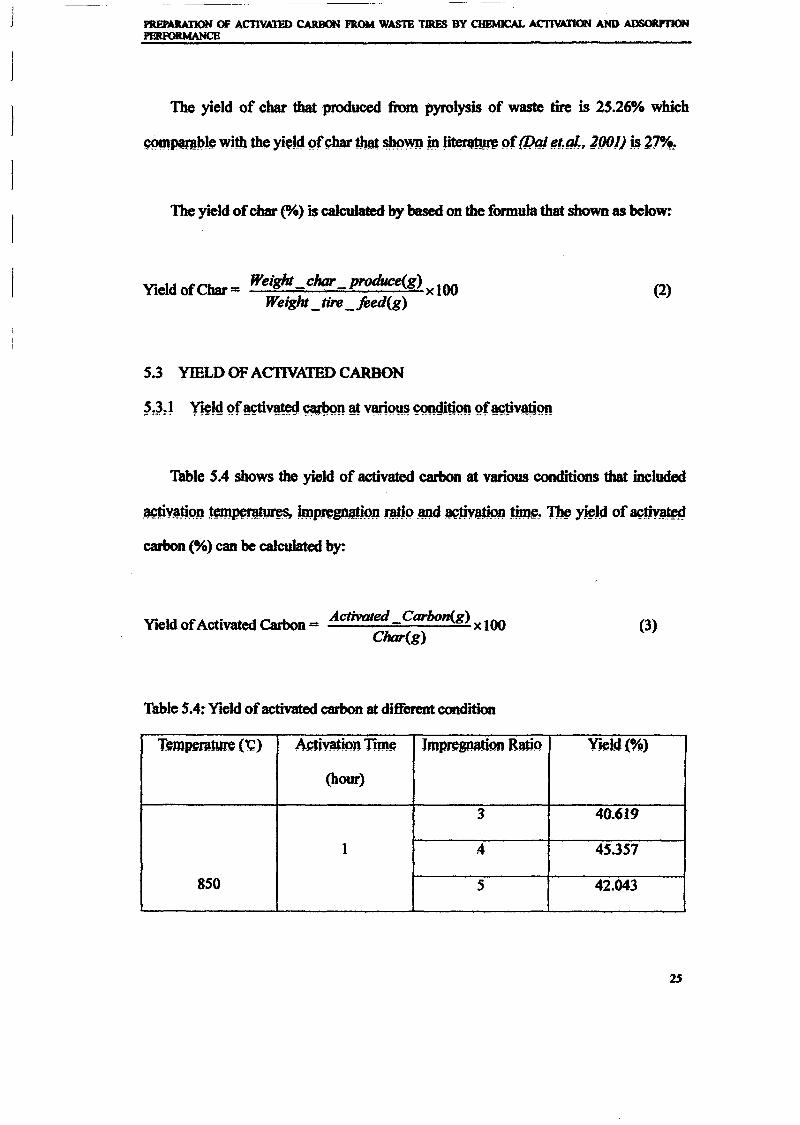
I"RF.PAJtJJION OF ACTIVATED CARBON FROM WASTE TIRES BY CHEMICAL AC11VA11ON AND ADSORPTIONPERFORMANCE
The yield of char that produced from pyrolysis of waste tire is 25.26% which
~PM!bl~ wjtbthe yield 9fPII,ar~.sb9~ b11i~ 9f(!)qj t!l.r#, Jf)(JJ) js Z~4~
The yield ofchar (%) is calculated by based on the formula that shown as below:
Yield ofChar = Weight char_produce(g) xlOOWeight _ tire_feed(g)
5.3 YIELD OF ACTIVATED CARBON
(2)
Table 5.4 shows the yield of activated carbon at various conditions that included
.~pnP9~ ~~~ jm~gQ3tjOO ~9Mel ~pyMjQP. tim~~ Tb~ yj~J~ of~~~
carbon (%) can be calculated by:
Yield ofActivated carbon == Activated Carbon(g) xl00Char(g)
Table 5.4: Yield ofactivated carbon at different condition
(3)
Tempmnrre ee) Ac.tivatiPn nme bnpn:gnati~ RatiQ Yield(~)
(hour)
3 40.619
1 4 45.357
850 5 42.043
25
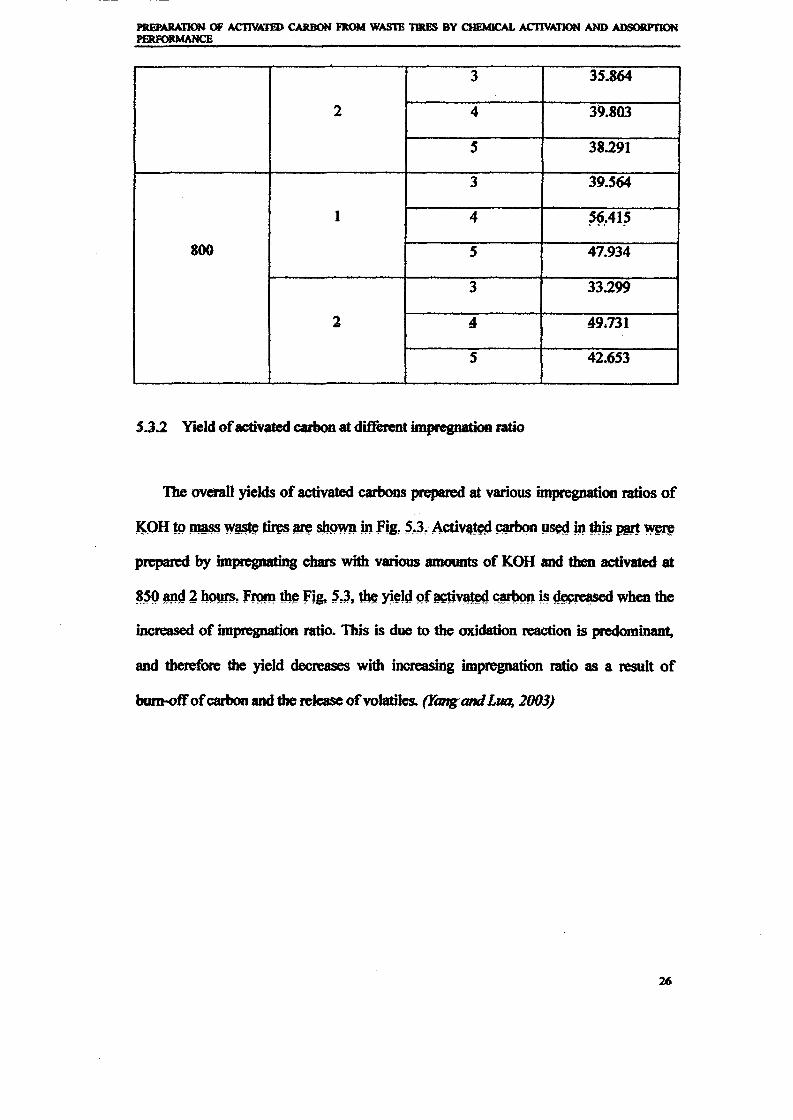
------- ---- -----
PREPARATION Of ACnVATfD CARBON FROM WASTE TIRES BY CHEMICAL AC11VATJON AND ADSORPTIONPERFORMANCE
3 35.864
2 4 39.803
5 38.291
3 39.564
1 4 ~~..41~
800 5 47.934
3 33.299
2 A 49.731
5 42.653
S.J.2 Yield ofactivated carbon at different impregnation ratio
The overall yields ofactivated carbons prepared at various impregnation ratios of
~OH t9~W~.Pre$~ $b9~mfig! ,s!3! Af;tivl~~ Ysed mj:bj.$ PIrt~
prepared by impregnating chars with various amounts of KOH and then activated at
~,sp Md 2 b9!mi~ from tb~ fig. ,s.J, the yi~ld 9f~~~ i!;~when the
increased of impregnation ratio. This is due to the oxidation reaction is predominant,
and therefore the yield decreases with increasing impregnation ratio as a result of
burn-offofcarbon and the release ofvolatiles. (YangandLua. 2(03)
26
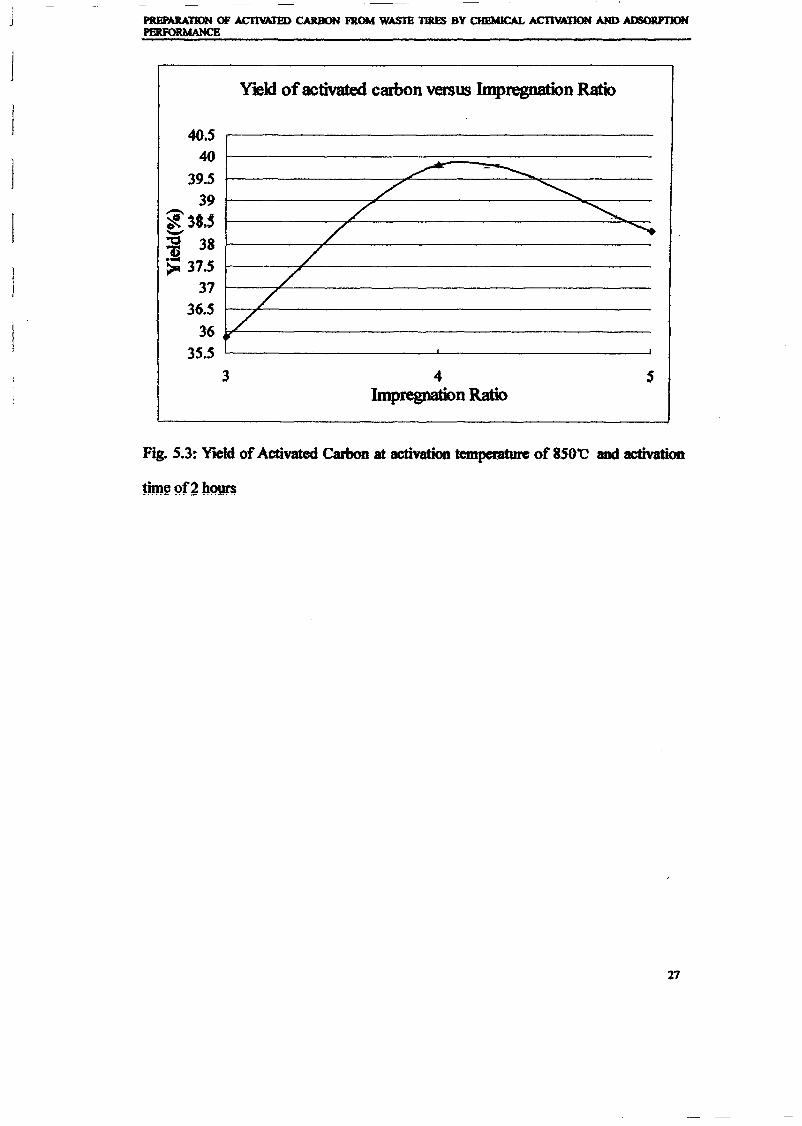
PREPARATION OF ACllVATED CARBON ROM WASTE TIRES BY CHEMICAL ACIlVA1lON AND ADSORPTIONPERFORMANCE
~ .--........../' ~
/ ~/ -....
//
//
J
1
]
Ij
4O.S40
39.S39
~38.,'-'=i 38>: 37.S
37
36.S
36
35.53
YIeld ofactivated carbon vers~ Impregnation Ratio
4Impregnation Ratio
Fig. 5.3: YlCkl of Activated Carbon at activation temperature of 8S0'C and activation
Ym{l9f2b9~
27
PREPARATION OF AC11VATEI> CARBON fROM WAST£ TIRES BY CHEMICAL ACTIVATION AND ADSORPTIONPERFORMANCE
5.3.3 Yield otActivated Carbon at different Activation rune
Based on the various activation condition ofactivated~ a graph which yields
9f~V~~V~~ bm:~n;gmt,Q<m i~ P.J9~.1t ~ t9 i~fy ~. e.tf~ of~b
parameter to the yield ofactivated carbon that produced from chemical activation in a
~. The y~J{J 9f~V~~ (or Ym'Y iWYy~oll tim{: y~ iJllpreg~~
ratio is plotted and shown in Fig. 5.4 and Fig.S.S.
From the Fig.5.6 and Fig.S.7, the yield of activated carbon is decreased with the
~~iQg pf activauoo~~ tile Iiam~ ~vatiQfl ~~$ ~~ JSQ'P ~
800'U. This is due to a complete bum-offofcarbon is occurred. Furtbennore, the extent
9f9~~Q~~on~ prQP9fP9oolJy wb~ ~vlti9P time~Thus, ~~
yield ofactivated carbon is deceased with the increased ofactivation time.
21
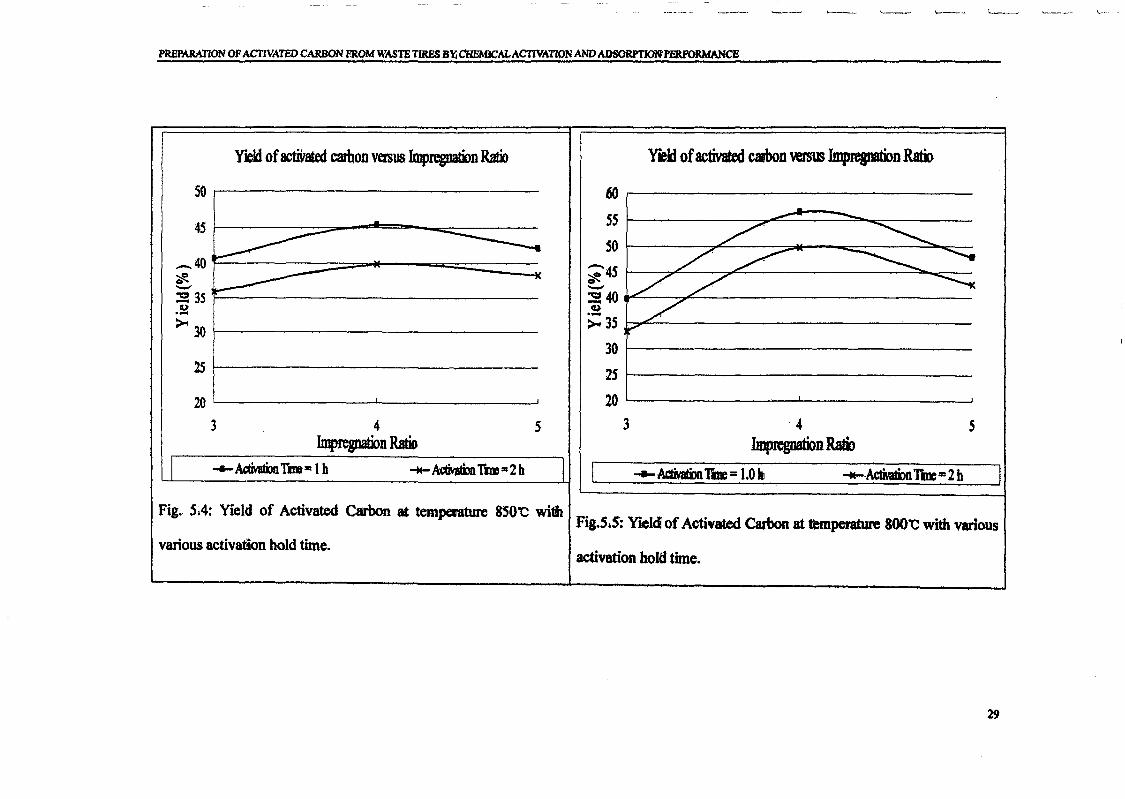
~nONOF ACTIVATED CARBON FROM WASTE TIRES Bl';CHEMlCALACTIVATIONAND ADSORPTION/PERFORMANCE
yJekl ofactiVated carbon versus Impregnatim Rat» Vtekl ofactivated callbon versm Impregnati>n Ram
s 54~nRati>
60 .------------------
55 L----~~==:::::::=~----
SO ~---..",£.--___::;;oM_-_=___----:::::~-
~4S ~-..".L--~---------="'"_'--:s! 40 JIoC------,,,IC---------------Go)
>: 3S I---~------------'----
30 ~----------------
2S 1------------------20 l-.- L..-.- --J
3
SO r-----------------
---ActiwtimTn=1h ~ActiYatimTw:;2h
45 1-------=_.-.11::=:=---_=------
2Sf-----------------20 l-- --l- --J
3 4ImpregnationRatio
>0 30 f------------------
_ 40 r-------=:::::::::::~,........- ~;:;:::::::::=~'#. I--:::= 3S "F-----------------Ii).-
Fig.. S;4: Yield of Activated Carbon at temperature SSO"C wi.Fig.SS: Yield ofActivated Carbon at temperature 800"C with various
various activation hold time.activation hold time.
29
PREPARATION OF ACDVATED CARBON FROM WASTE TIRES BY CHEMICAL ACTIVATION AND ADSORPTIONPERFORMANCE
5.3.4 Yield otActivated Carbon at dit'terent Activation Temperature
For vary activation tempel'8ttln\ a yield of activated carbon versus impregnation
nW9 j~ pJ9~ m:J~ ~9WP. mfj&~!() ~d fjg!~!7!~th fj&~~() M4 fjg.~!7~ ~WP.
that the increasing ofactivation temperature reduced the yield ofactivated carbonat the
saJJ)e ~v~p» Pm!' 9f 1 bpPr mKI Zb99fS re~~Jy~ ~ ~ ~y~ t9 ~ jm:~mg
amount of volatiles is released during the increasing activation temperature from
These phenomena are also manifested in the decreasing volatile content and increasing
to predominance of the loss in volatiles over carbon consumption for incmtsing
However, for the impregnation ratio of 3, the increased of activation temperature
b~s ~U&btIy in~~ yj~lg pf aetiv~fed~» (or both ~YmiPQ Qm{' 9f J bpm'
and 2 hour. . Yield is increased is due to the amount ofKOH is not sufficient to cover
~ ~~f;)m~ the c~! Th~f~ m~ ~~ pf ~v~p(m ~peIi~ mimpregnation ratio 3 promotes the more pyrolysis and evaporation occurred. As a result,
30
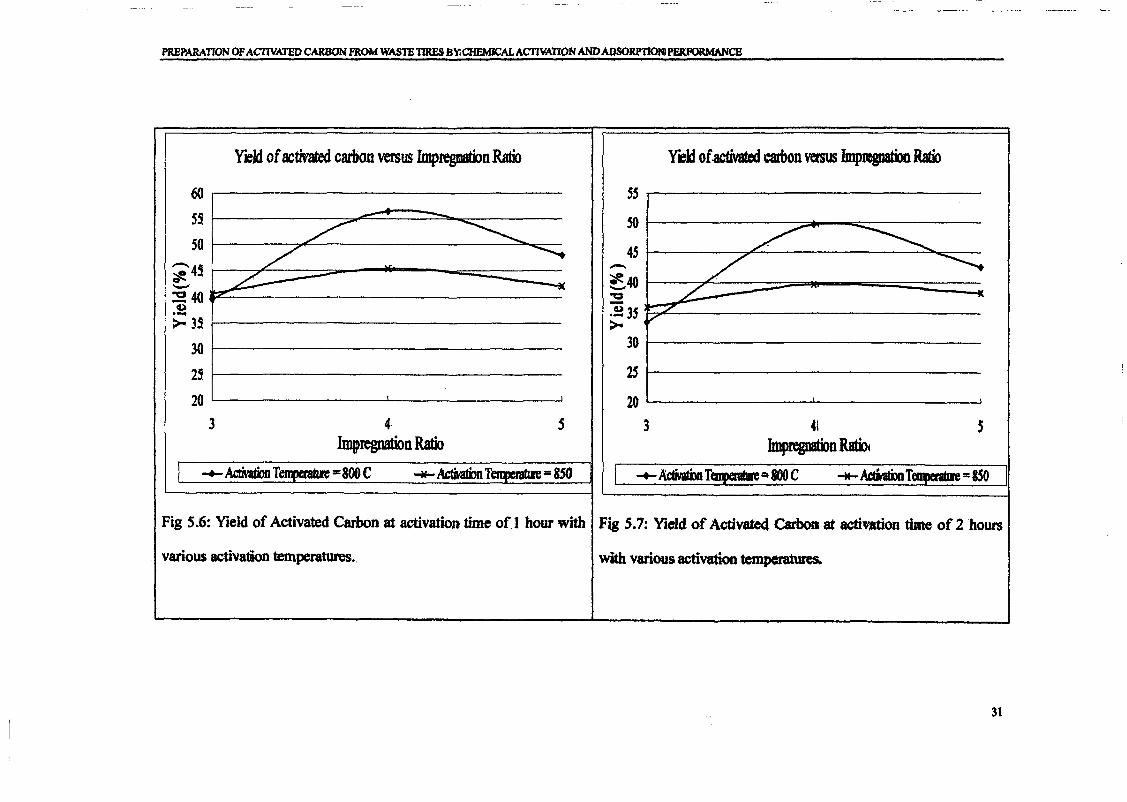
PREPARATION OFAcnvATED CARBON FROM WASTE TIRES BljCHEMlCALACTIVATIONANDADSORPTIONIPFJUlORMANCE
Yield ofactivated carbon versus ImpregaaOOnRatio y.,klof~ eamon versusImp~ Ratb
60 5S ,
55 - - SO'~' ~ / ~50/ --...... 45 7 ~~4S
...-
~ ~40"-" -ill
~::240 ~ ~-u·~35.- '/>- 35 >-
30 30
25 2S
20 203 4 5 3 41 S
Impregnation Ratio ImpregoaOOn Rati>~
I .......Activatbn Te =800C .....~n1i =850 I -4-AcfMDmT..-"'tOOC +-ActMtbnTeap:ratwe= BSO IFig 5.6: Yield of Activated Carbon at activation! time of1 hour with Fig 5.7: Yield of Activated Carbon at actiVAtion time of 2 hours
various activation temperatures., with various activation temperatures.
31
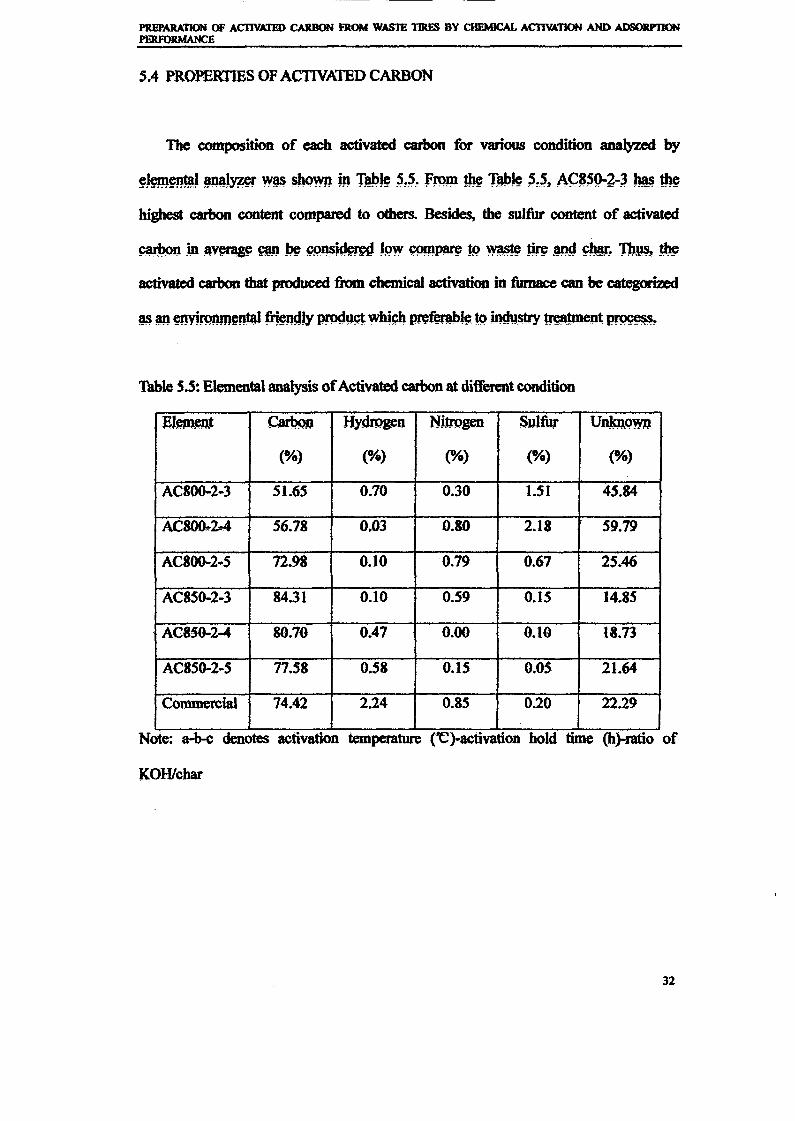
PREP.4RA'l1ON OF ACTIVATED CARBON FROM WASlE TIRF.S BY CHEMICAL ACTIVATION AND ADSORPTIONPERFORMANCE
5.4 PROPBlUIES OF ACTIVATED CARBON
The composition of each activated carbon for various condition analyzed by
~J~~~!!~!!Jmr~ ~b9WP in rl!~J~ ~~~! from ~ r,llk; ~!~, A~S~P-2-~ ~ tb~
highest carbon content compared to others. Besides, the sulfur content of activated
~in~:yp~~~~~~Jpw~~t9~~~~.Th~~
activated carbon that produced from chemical activation in furnace can be categorized
~~ ~vm:mmpm3J fii~Jy ~yglwm~b OO'f~bJ~ ~~~~~~
Table S.5: Elemental analysis ofActivated carbon at different condition
EJmemt Cwboo HydTQFn N· Sulfur lJ~wn. "ItJQgen
(%) (%) (%) (%) (%)
ACSQO-2..3 51.65 0.70 0.30 1.51 45.84
AC~2.-4 56.18 0.03 0.80 2.18 59.79
ACSQO-2..5 72.98 0.10 0.19 0.67 25.46
AC850-2-3 84.31 0.10 0.59 0.15 14.85
AC8j0-2-4 80.70 0.47 0.00 0.10 18.73
AC850-2-S 17.58 0.58 0.15 0.05 21.64
Commercial 74.42 2.24 0.85 0.20 22.29
Note: a-b-c denotes activation temperature (~)-activation hold time (h)-ratio of
KOHlchar
32
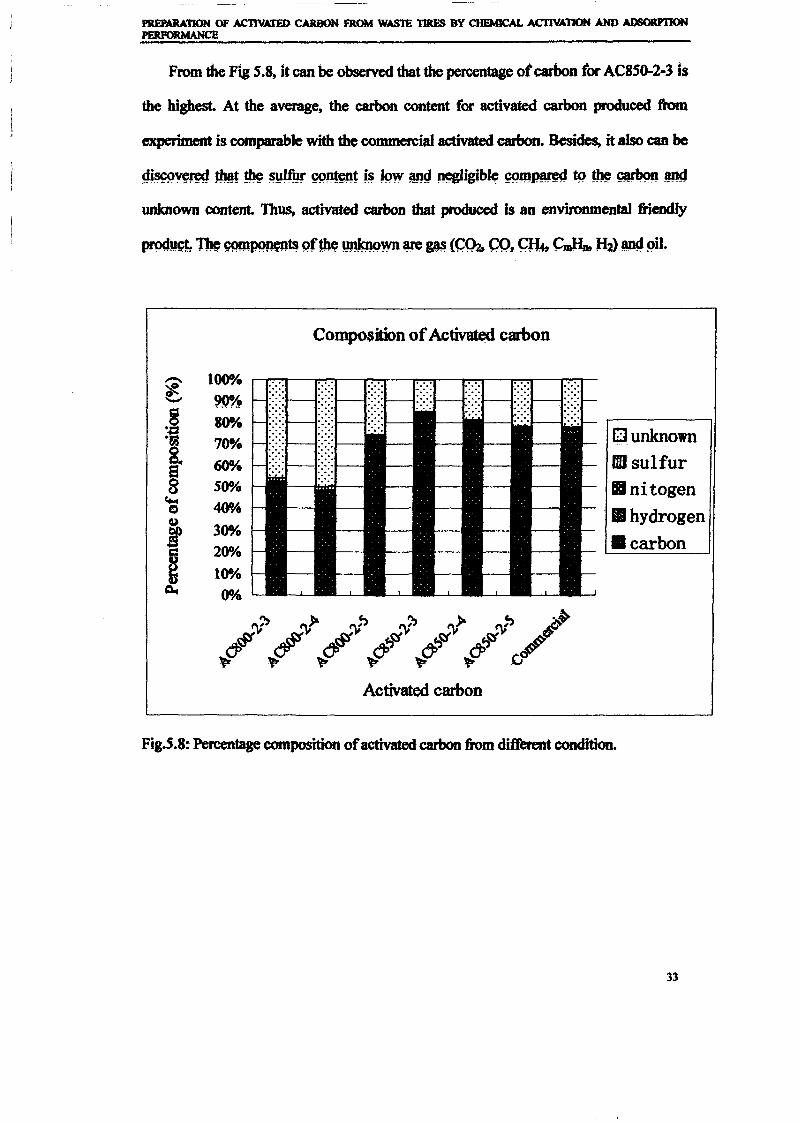
PREPARATION OF ACnVATED CARBON FROM WASTE TIRES BY CHEMICAL ACTIVATION AND ADSORPTIONPERFORMANCE
From the Fig 5.8, it can be observed that the percentage orcarbon tor AC8So-2·3 is
the highest. At the average, the carbon content for activated carbon produced trom
experiment is comparable with the commerciaJ activated carbon. Besides. it also can be
9:i,~Y~ ~t ~ ~lfur ~m~t i~ JQW ~~ n~gibl~ (X)m~ tq ~~~
unknown rontent. Thus, activated carbon that produced is an environmental friendly
Composition ofActivated carbon
~ 100%~ · . .....~ 9()%g SOO,4
'+:1 · .•ps70%
~ 6()0,4 ·.8 SooA.
f+.t 400,40Go)
30%f~
2ooIO
tooA.~ 0010
o unknownIII. sulfur
IInitogenII hydrogen• carbon
Fig.S.S: Percentage composition ofactivated carbon fromdi1ferent condition.
33
PREPARA'I1ON OF ACTIVATFD CARBON FROM WASTE 1'IRFS 8Y CHEMICAL ACTIVATION AND ADSORP'J1ONPERFORMANCE
s.s ADSORPTION PHENOL PERFORMANCE
5.5.1 Adsorption Isotherm
Adsorption isotherm study is canied out on two well-known isothenns which are
Langmuir Isotherm is a monolayer adsorption which means the surface of the
~~ j~ lmWQrm ~t j~ ~U ~ @d~tJ9P ~Jt~~ ~ ~~~ ~~i~ ~~
molecules do not interact and occurs through the same mechanism. At the maximum
on the free surface ofthe adsorbent (activated carbon).
However, for Freundlich Isotherm, the surface ofthe activated carbon particles was
The applicability of the isothcnn equation is compared by judging the linear
34
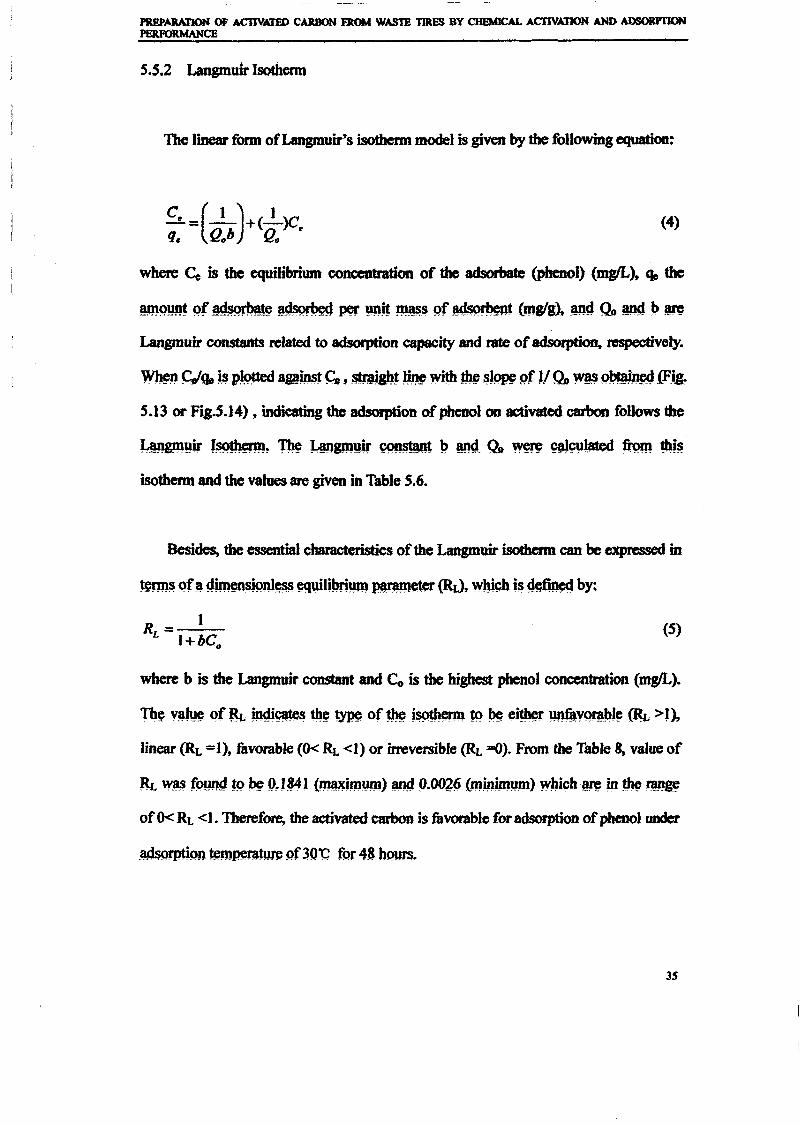
PREPAlVJION OF AC11VIJED CARBON FRoOM WASTE TIRES BY CHEMICAL ACI1VATJON AND ADSORPTIONPERFORMANCE
5.5.2 Langmuir Isothenn
The linear form ofLangmuir's isothelJlt model is given by the following equation:
(4)
where Cc is the equih"brium concentration of the adsorbate (phenol) (mgIL), <Ie the
~9Y»t 9f~~~~ per ~jt~ 9f J!~~Pt (Dlg!g), ~mJ Qo~ ~ Qte
Langmuir constants related to adsorption capacity and rate ofadsorption, respectively.
Wb~ ~ge ~p~a~ Ce, ~gb~ Jm9 wi.~ lJt9 ~JPP9 Qf J! Qo~p~.(F.ig~
5.13 or Fig.5.14) , indicating the adsolption of phenol on activated carbon follows the
~gmYif l~! ~ ~gmyir~ l? ~... Qo w~ ~~I~ ft'Qm ~~
isothenn and the values are given in Table 5.6.
Besides, the essential characteristics of the Langmuir isotherm can be expressed in
term~ ()f~ 4jm~~()nl~ ~1iJ:m~ ~ter (lq), whk;b i~~~ by;
(5)
where b is the Langmuir constant and Co is the highest phenol concentration (mWL).
Th~ V~Y9 of & iOOi~ tb~ ~ of~ ~~~ t9 ~ ei~ ~Y9rnbJ~ ~ >1),
linear <RL =1), favorable (0<~ <1) or irreversible <RL =0). From the Table 8, value of
&. W~ f()ood wIJ9 P,I~1 (~Illt.Jm) ~ ().OO2li (lIlmilm~lJl) Which·~ in rJJ9 r:@IJ~
of0< RL <I. Therefore, the activated carbon is favorable for adsorption ofphenol under
35
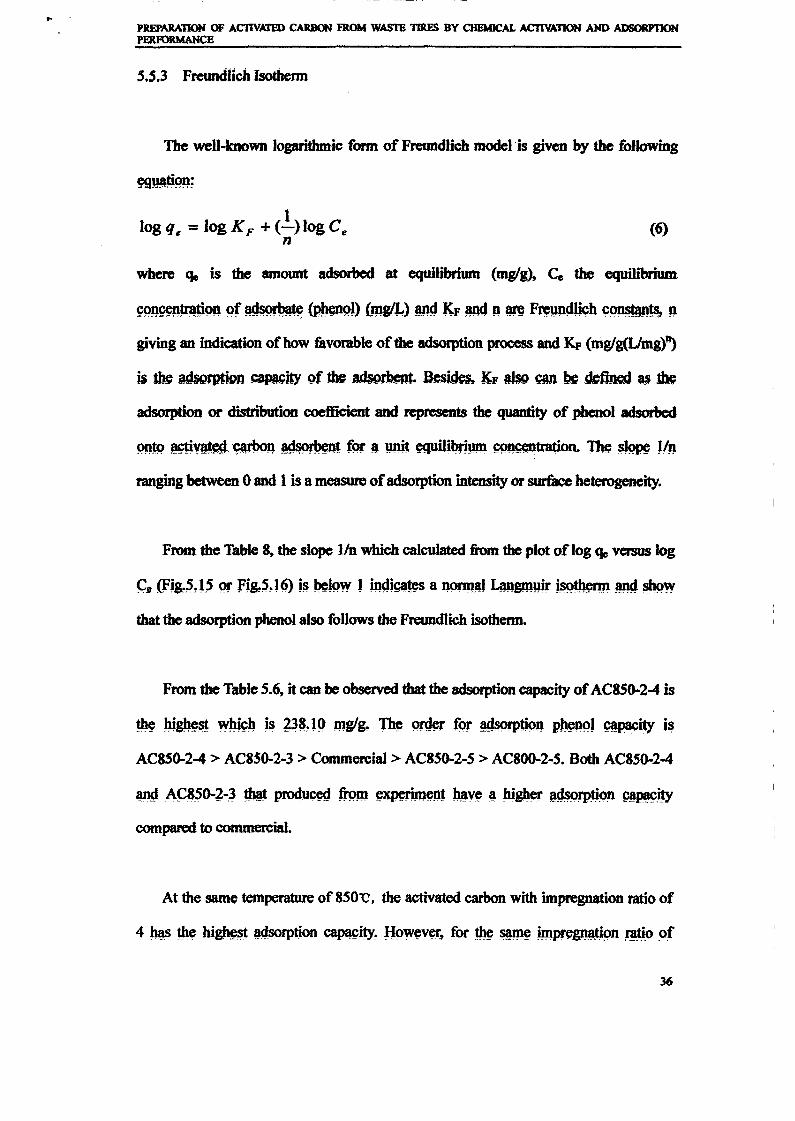
,.PREPARATION OF ACJ1VATED CAIlBON FROM WASTE TIRES BY CHEMICAL AcnvATION AND ADSOIlP11ONPERF01lMANCE
5.5.3 Freundlich Isothenn
The well-known logarithmic form of Freundlich model-is given by the following
1log q, = log K F + (-)Iog Cen
(6)
where Cfo is the amount adsorbed at equilibrium (mglg), Ce the equilibrium
~~~mwQ~ 9f~~-~n (~gIl..)~ ~F !m4 P.~ F~yp.~b ~~!S., p.
giving an indication of how favorable of the adsorption process and Kt: (IIlgfg(Umg)~
is the~n ~ity Qf 1be adsorbent Besides, L aJso~ be defineJJ u ~
adsorption or distribution coefficient and represents the quantity of phenol adsorbed
ranging between 0 and 1 is a measure ofadsorption intensity or surface heterogeneity.
From the Table ~ the slope lin which calculated fiom the plot of log <Ie versus log
that the adsorption phenol also follows the Freundlich isotherm.
From the Table 5.6, it can be observed that the adsorption capacity ofACSS()..2-4 is
~~ Ngb~~ w~b i~ ~3~ l () mg/g~ ~ 9nJ~ for ~rpD9P. P~P.91 ~pacity i~
ACSS0-2-4 > ACSS0-2-3 > Commercial> AC8So-2-S > ACSOO-2-S. Both ACSSo-2-4
1,P1~ AC~5O-~-~ ~t produ~ trom ~~nt ~Yt' _~ NgIl~ ~tic:)Jl~~.itY
compared to commercial.
At the same temperature of 8S0'C. the activated carbon with impregnation ratio of
36
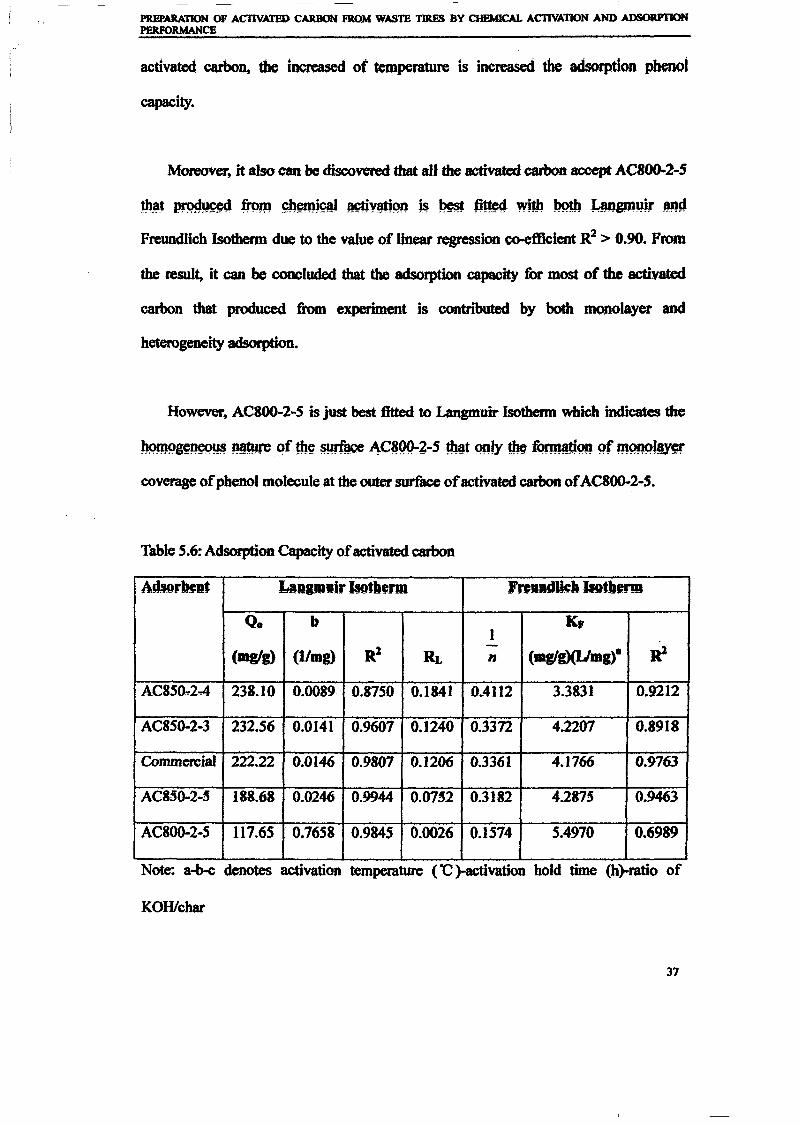
PREPARATION OF ACJ1VA11ID CARBON FROM WASTE TIR.FS BY CHEMICAL ACTIVATION AND ADSOItPTIONPERFORMANCE
activated carbon, the increased ot temperature is increased the adsorption phenol
capacity.
Moreover, it also can be discovered that all the activated carbon accept AC800-2-S
~~J~ from ~~~ ~y@~ ~ ~ fl~4 wJtb 00tb LmJgrn~ ~
Freundlich Isotherm due to the value of linear regression co-efficient R2 > 0.90. From
the result, it oan be concluded that the adsorption capacity for most of the actiYated
carbon that produced from experiment is contributed by both monolayer and
heterogeneity adsorption.
However, AC800-2-S is just best fitted to Langmuir Isotherm which indicates the
~p~~~~ of tb~~AC~OO-~-S ~t ()~Jy ~. fommtic:m ()f~~..Y~
coverage ofphenol molecule at the outer surface ofactivated carbon ofAC800-2·S.
Table 5.6: Adsorption Capacity ofactivated carbon
&bor~lIt Mmpgjr IIofltenD I'regadJielallotJa,rm
Q. b K,I
R2 -~(mglg) (t/mg) HI. n (mglg)(Umgt
AC8Sa.2--4 238.10 0.0089 0.8750 0.1841 OA112 3.3831 0.9212
AC850·2·3 232.56 0.0141 0.9607 0.1240 0.3372 4.2207 0.8918
Commercial 222.22 0.0146 0.9807 0.1206 0.3361 4.1766 0.9763
AC85Q-2-5 188.68 0.0246 0.9944 0.0752 0.3182 4.2875 0.9463
AC800·2·5 117.65 0.7658 0.9845 0.0026 0.1574 5.4970 0.6989
Note: a-b-c denotes activation temperature ("C )-activation hold time (b)-ratio of
KOHlchal'
37
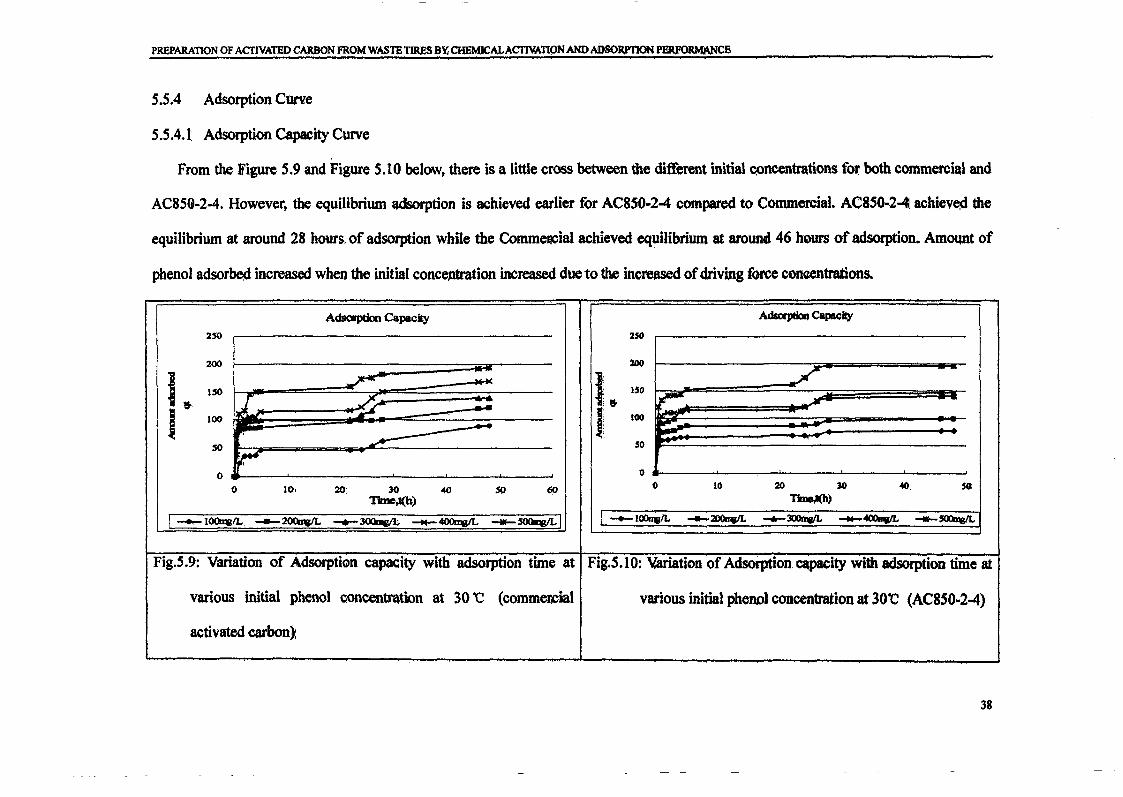
PREPARATION OF ACTIVATED CARBON FROM WASTE TIRES BY,CHEMlCALACTIVATIONAND ADSORP'IlON PERFORMANCE
5.5.4 Adsorption Curve
5.5.4.1 Adsorption capacity Curve
From the Figure 5.9 and Figure 5.10 belowt there is a little cross between the different initial c.oncentrations for both commercial and
AC850-2-4. However, the equilibrium adSorption is achieved earlier for AC850-2-4 compared to Commercial. AC850-2-41 achieved the
equilibrium at around 28 hours; of adsorption while the CommellCial achieved equilibrium at around 46 hours of adsorption. AmOQllt of
phenol adsorbed increased when the initial concentration increased due to the increased ofdriving force coneentrations.
AdscIpticn Capacky AdsaptioQ Capacily
2$0 :ZSO
200 200
I &.~ -w..ot
1&,,. ~ ~150
C-- ,,~
J 100 ~ ), 100 ....--~ ~
50 so --~
0 0
0 10, 20 30 40 so ~0 10 :zo JO 40. ,a
11mc,t(h) TiDe,t(b)
I -'-1~1L -~ -.-30CbIaIb -N-4O()maIL --5OIqIL! I __ 100q1L--~ ......3OOrqj/L -.-4Ol8a/L --5OOq!L
Fig.S.9: Variation of Adsorption capacity with adsorption time at Fig.S.IO: Variation ofAdsofption capacity with adsorption time at
various initial phenol concentratiDn at 30-c (comm~ial various initial phenol concentration at 30"C (AC850-2-4)
activated carbon).
38
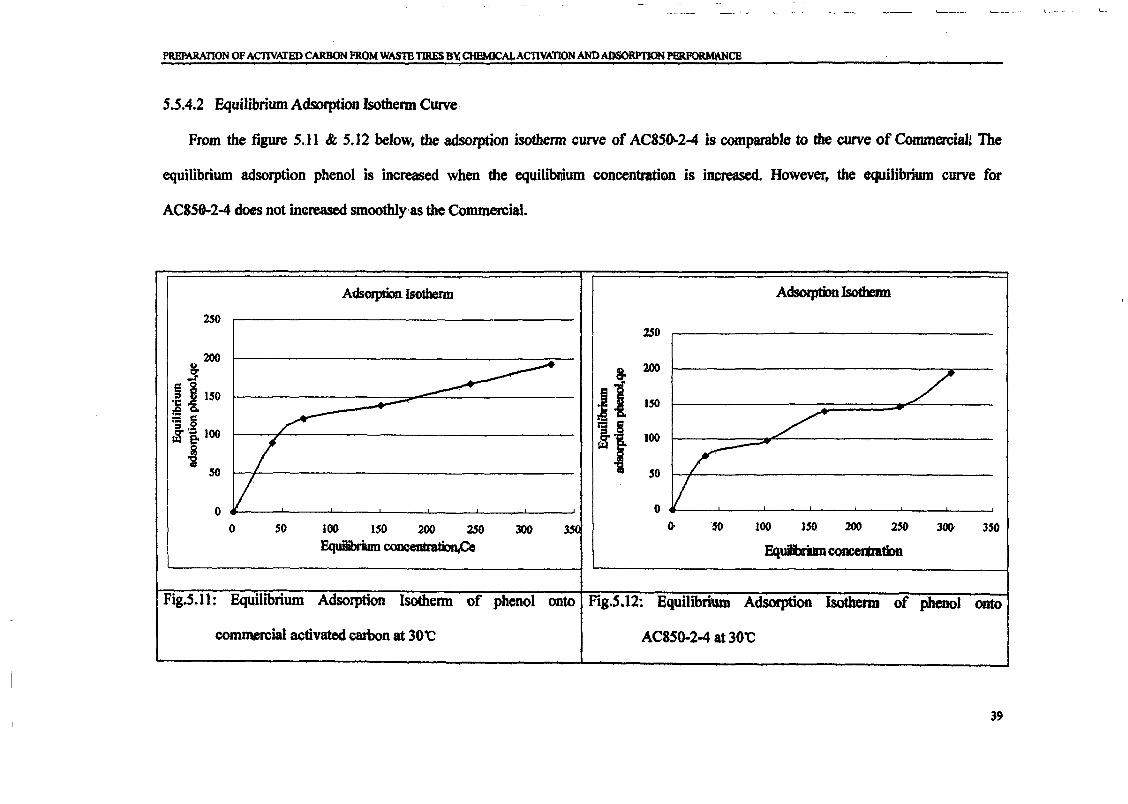
PREPARATION OF ACTIVATED CARBON FROMWASTB TIRES B'I;CHEMlCALACTlVATIONANDADSORPTIONP~CE
5.5.4.2 Equilibrium Adsorption Isotherm Curve
From the figure S..l1 & 5.12 below, the adsorption isotherm curve of AC8'~2-4 is comparable to the curve of Commercialt The
equilibrium adsorption phenol is increased when the equilibIlium concentratien is increased. Howevery the cquilibriwn curve for
AC8S'0-2-4 does not inereased smoothly-as the Commercial.
Adsorption Isotherm Adsorptim Isotbenn
2SO250
200v
~g. 200:$ /~ 0 Jl:s 1ISO .....- .'0
:= = ~ ~~tl" It .00
I ~so so
V V0 0
0 SO 100 ISO 200 250 300 3$( ()o SO 100 ISO. 200 2SO 300- 350
Equilibrium concentratim;Ce EquibrUn~
Fig.S.H: Equilibrium Adsorption lsothenn of phenol onto Fig.S.l2: Equilibrium Adsorption Isotherm of phenol onto
commercial activated catbon at 30'C AC8S0..2-4 at 30'C
39
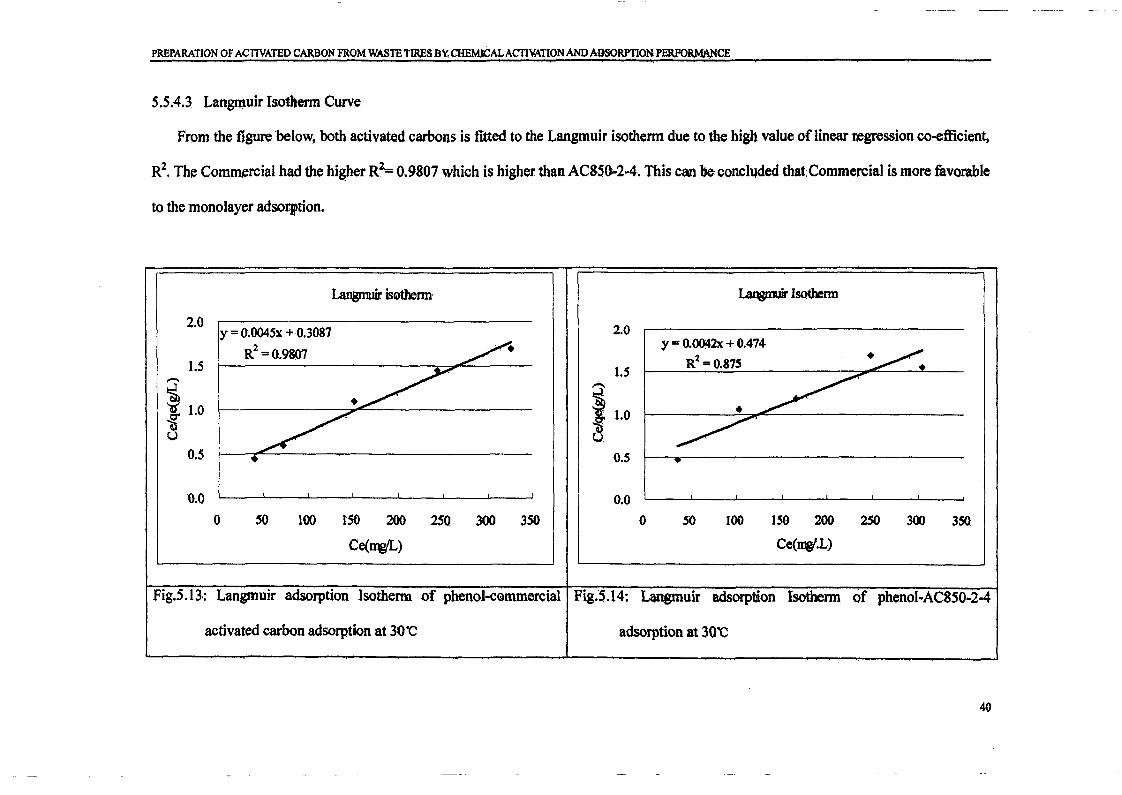
PREPARATION OF ACTIVATED CARBON FROM WASTE TIRES BY; CHEMJCALACTIVATION AND ADSORPTIONPERFO~CE
5.5.4.3 Langntuir Isotlienn Curve
From the figure below, both activated carbons is flitted to the Langmuir isotherm due to the high value of linear ~gression co-efficient,
R2• The Commercial had the higherR~ 0.9807 which is higher than AC8S0-2-4. This can be concllJded that:Commercial is more favorable
to the monolayer adsoqption.
Langmuir is0therm Langmuir IsQthenn
2.0y = 0.0045x +0.3087 2.0
R2
=O.98Q7 ~Y= o.0Q42x + 0.474
.~R2 =0.87SI.5
.~1.5.-.
~~ 1.0 j •~
1.01j a ~.u
0.5 • 0.5 •
0.0 0.0
0 SO 100 ISO 200 250 300 350 0 50 100 159 200 250 300 350
Ce(~) Ce(nv'.L)
Fig.5.l3.: Langmuir adsorption Isothenn of phenol-cemmercial Fig.S.14: Langmuir adsorption Isothenn of phenol-AC850-24
activated carbon adsorption at 30'C adsorption at 30'C
40
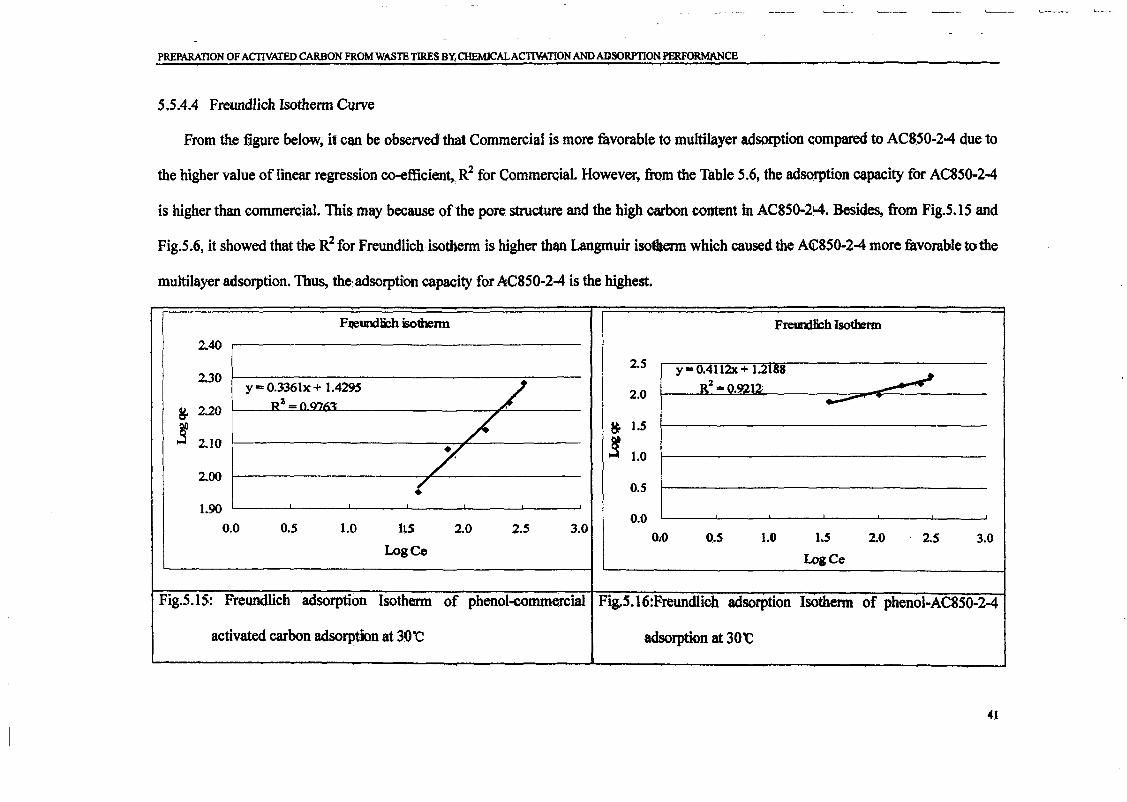
PREPARATION OF ACIlVATED CARBON FROM WASTE TIRES BY, CHEMICALACnVATION AND ADSORPTION PERFORMANCE
5.5.4.4 Freundlich lsothenn Curve
From the figure below, it can be observed that Commercial is more favorable to multilayer adsorption compared to AC850-2-4 due to
the higher value of linear regression co-efficient" R2 for Commercial. However, from the Table 5.6, the adsorption capacity for AC8SQ-2-4
is higher than commercial. This may because ofthe pore: structure and the high carbon content in AC8S0-2l.4. Besides, from Fig.5.15 and
Fig.5.6, it shOWed that the R2 for Freundlich· isotherm is higher dUUl Langmuir isotherm which caused the A€850-2-4 more favorable to the
multilayer adsorption. Thus, the:adsorption capacity for AC850-24 is the highest.
Fl/eundJi;h isotbenn Freun:Ui::h lsothmn
2.40
2.52.30
y=0.4112x+ 1.2188
~y = 0.3361x + 1.4295 / R2 ·O.9212:R 2 = n O'7k'1:
2.0 ---~ 2.20
~! go 1.52.10 !/' 1.0
2.00~ 0.5
1.900.0
0.0 0.5 1.0 hS 2.0 2.5 3.0OA> O.S 1.0 1.5 2.0 2.5 3.0
Logee Losee
Fig.5.IS: Freundlich adsorption Isotherm of phenol-eommercial Fig,.5.16:Freundlich adsorption Isotherm of phenol-AC850-2-4
activated carbon adsorption at 3Q"C adsorption at 30"C
41
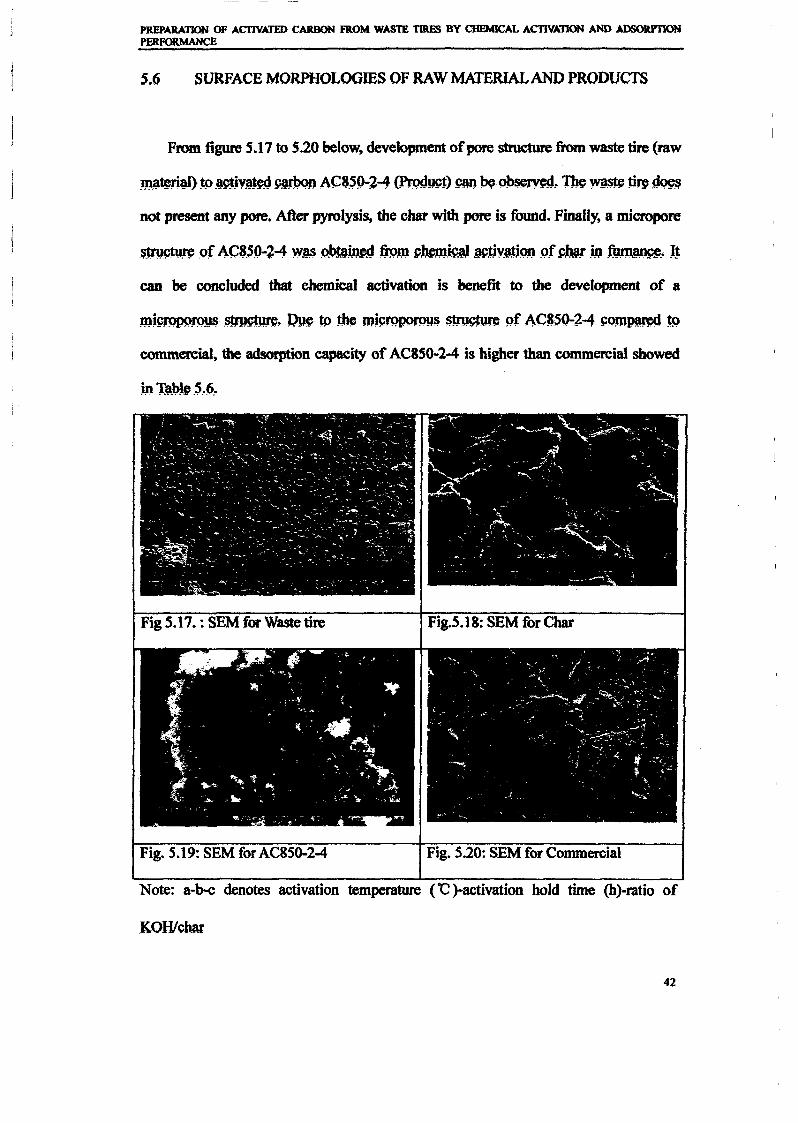
PREPARATION OF ACTIVATED CARBON FROM WASTE TIRES BY CHEMICAL ACfiVATION AND ADSORPTIONPERFORMANCE
5.6 SURFACE MORPHOLOOmS OF RAW MATERIAL AND PRODUCTS
From figure 5.17 to 5.20 below. development ofpore structure from waste tire (raw
m{l~rl3J) ~Q ~jy;}~W ~J) AC3.5P-2-4 (PrQdy~) C!mwM~~ ..~Wll~W ljn, g~$
not present any pore. After pyrolysis, the char with pore is found. Finally. a micropore
can be concluded that chemical activation is benefit to the development of a
mj~~WD~, ~. w~ mj~roP9roY~ ~~ Qf ACI$o-~-4 ~9m~ W
commercial. the adsorption capacity of AC850-2-4 is higher than commercial showed
m'llwle .5..§.•
Fig. 5.19: SEM for AC850-2-4 Fig. 5.20: SEM for Commercial
Note: a-b-c denotes activation temperature (-c )-activation hold time (h)-ratio of
KOWcha.r
42
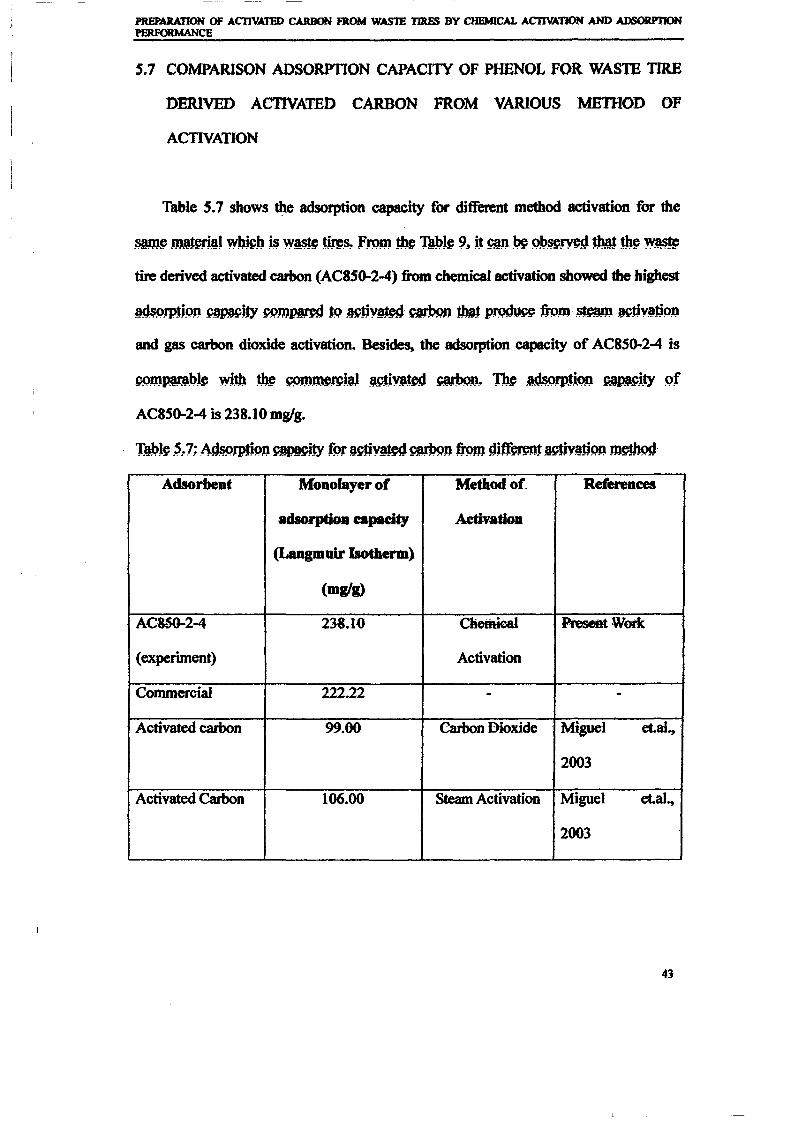
PREPAJlATJON OF AcnvMED CARBON FROM WASTE TIRES BY CHEMICAL ACTIVATION AND ADSORP'J'IONPERFORMANCE
5.7 COMPARISON ADSORPflON CAPACITY OF PHENOL FOR WASTE TIRE
DERIVED ACTIVATED CARBON FROM VARIOUS MEnlOD OF
ACTIVATION
Table S.7 shows the adsorption capacity for different method activation for the
.~l' m3~ri~l wbj~b ~w~~ from~ T@l~ 9, it~~ Qb$PrY~ ~ ~l'~
tire derived activated carbon (AC8So-2-4) from chemical activation showed the highest
Id.$9.rpD9J) ~p;wby ~m~ t9 .~Y.3~~~prody~ 119m-.~ ~P'Y~PJ)
and gas carbon dioxide activation. Besi~ the adsorption capacity of AC8So-2-4 is
~m~bJ~ with ~ ~~.rPiJl ~~ ~_. lb!' .3.d$9.rp~OO ~jD' Qf
AC8So-2-4 is 238.10 mglg.
r@J~.~~7; A~rpp'pJ)~ijy (Q"lgj~ ~J)trom ditr~1WDYIp.oo m~
Adsorbent MOBolayer of Method of. RefereBeeI
adsorptioR eapadty AetivatJoII
(LaBgmwr Isotherm)
(mglg)
AC~50-2-4 238.10 Chemieal Present Work
(experiment) Activation
Commercial 222.22 - -. Activated carbon 99.00 Carbon Dioxide Miguel eLal., .
2003
Activated Carbon 106.00 Steam Activation Miguel eLaI.,
- 2003
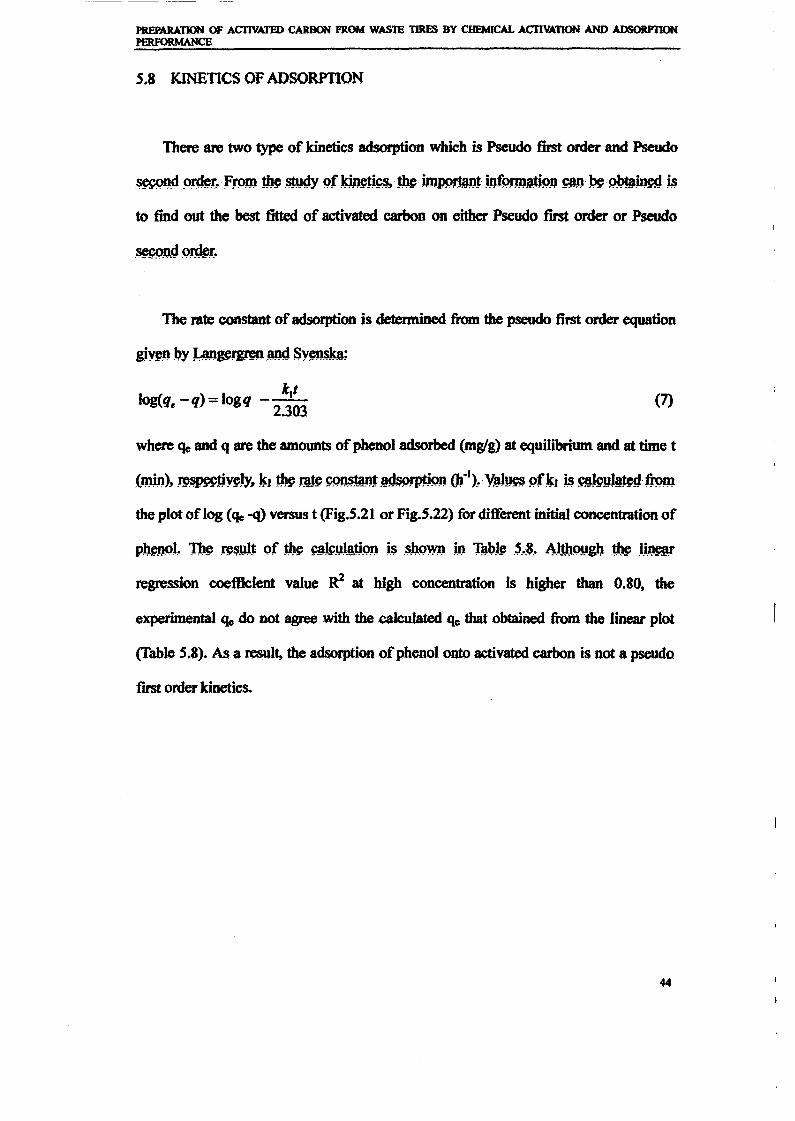
PREPARATION OF AcrIVATFD CARBON FROM WASlE TIRES BY CHEMICAL ACTIVATION AND ADSORP11ONPERFORMANCE
S.8 KINETICS OF ADSORPTION
There are two type of kinetics adsorption which is Pseudo first order and Pseudo
~mJ ()r!J~r.· from 1b~ .~ 9f lQneD~$,·1be·imoornml mfQrID3PQJ) ~.~9~m~ j.s
to find out the best fitted of activated carbon on either Pseudo first order or Pseudo
The rate constant of adsorption is determined from the pseudo first order equation
log(q -q) = logq _-!Le 2.303
(7)
where Qe and q are the amounts ofphenol adsorbed (mglg) at equilibrium and at time t
(~), ~.~y~Jy,~l tb~~~~l~rpP.9n (b.I)~Y~~9f~1 ~gjJ~yJD~trom
the plot oflog (<Ie -q) versus t (Fig.5.21 or Fig.5.22) for different initial concentration of
p~1)91. ~ ~~~ Qf !b~ ~!1l!l.tjm:a ;.~ .W;JWJ) mT3J>lt' .,.•$.. AI1I:lQpglt ~ .I~
regression coe:flicient value R2 at high concentration is higher than 0.80, the
experimental 'Ie do not agree with· the calculated qe that obtained from the linear plot
(Table 5.8). A$ a result, the adsorption ofpb.enol onto activated carbon is not a pseudo
first order kinetics.
44
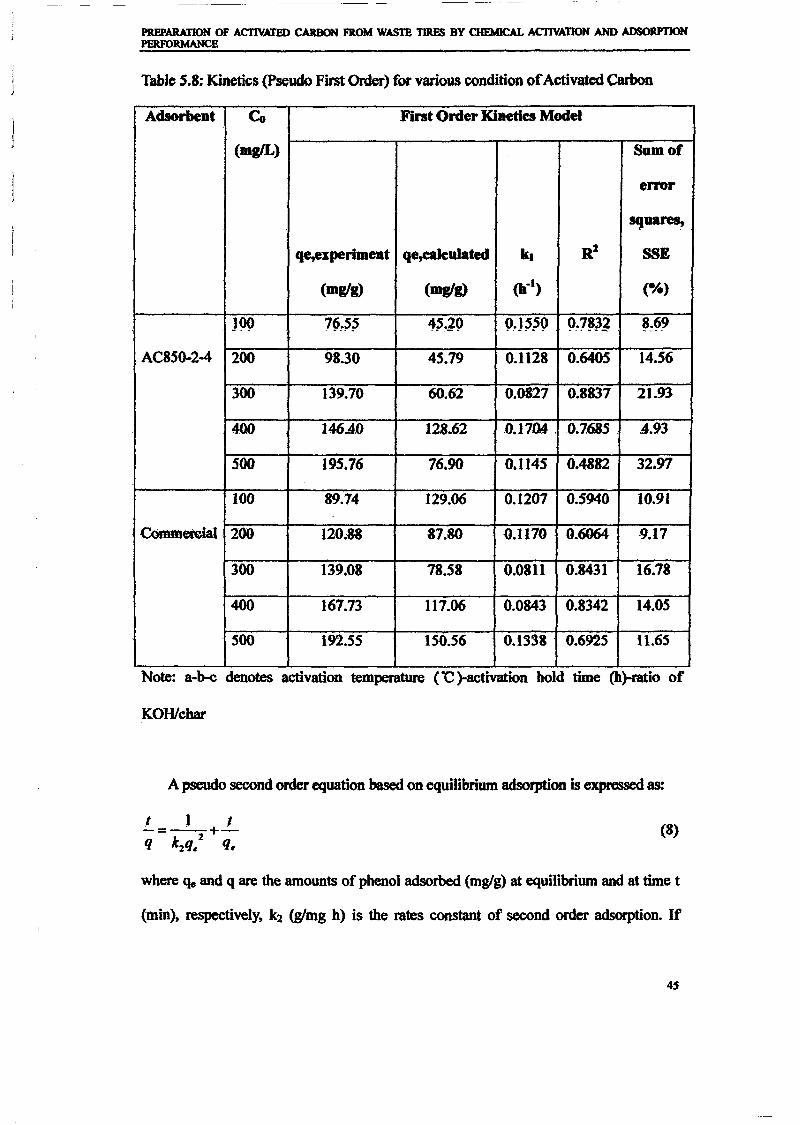
--_._---_._----
PREPARAllON OF ACTIVATED CARBON FROM WASTE TJRF.S BY CHEMICAL ACTIVATION AND ADSORPTIONPERFORMANCE
Table 5.8: Kinetics (pseudo First Order) for various condition ofActivated Carbon
AdsorbeDt Ce Fint Order KiBetics Model
(lDgIL) SUlDof
error
SCJuares, .
qe,experimeDt qe,ealeulated kl R2 SSE
(mglg) (lDglg) (la-I) (%)
J99 7{5~~~ 4'.~9 9.·J~'9 9.·7~}1 ~..()~
AC8So-2-4 200 98.30 45.79 0.1128 0.6405 14.56
300 139.70 60.62 0.0827 0.8837 21.93
AOO 146.4.0 12.8.62 .0.17Q4. . .0.1685 . 4.93
500 195.76 76.90 0.1145 0.4882 32.97
100 89.74 129.06 0.1207 0.5940 10.91
C~ 200 120.38 87.80 0.1170 0.6064 ·9.17
JOO 139.08 78.58 0.081l 0.8431 16.78
400 167.73 117.06 0.0843 0.8342 14.05
500 192.55 150.56 0.1338 . 0.6925 1l.65
Note: a-b-c denotes activation temperature ("C )-activation hold time (h)-ratio of
KOWcbar
A pseudo second order equation based on equilibrium adsorption is expressed as:
.t 1 J-=--+-q k2q/ q.
(8)
where 'Ie and q are the amounts of phenol adsorbed (mglg) at equilibrium and at time t
(min), respectively, k2 (gImg h) is the rates constant of second order adsorption. If
45
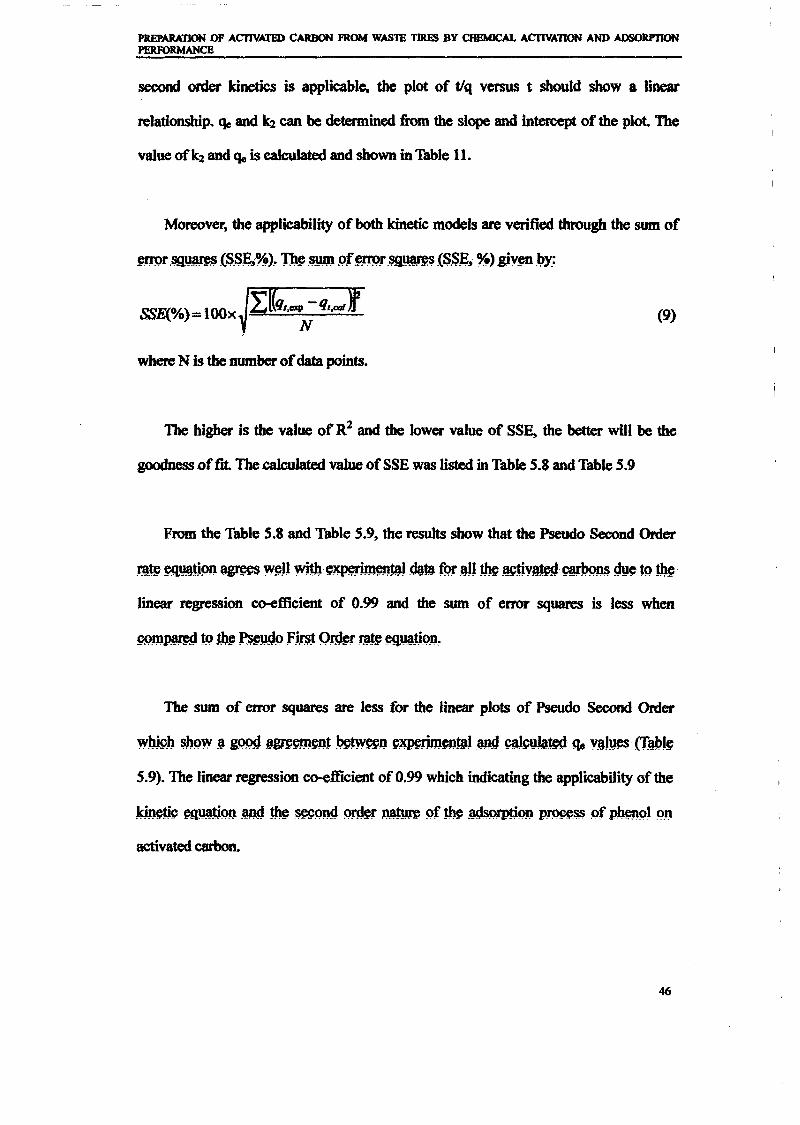
PREPARATION OF AC'fIVIJEI) CARBON FROM WASTE TIRES BY CHEMICAL ACTIVATION AND ADSORPTIONPERFORMANCE
second order kinetics is applicable, the plot of t1q versus t should show a linear
relationship. 1Jc and k2 can be determined from the slope and intercept of the plot The
value ofk2 and CIe is caJ.eulated and shown in Table 11.
Moreover, the 8P1'licability of both kinetic models are verified through the sum of
frCQr.~~(S.SE;~>'. n~ .SYm pf~r$Q~(S.SE, ~) gjy~ _~y_:
(9)
where N is the number ofdata points.
The higher is the value of R2 and the lower value of SS~ the better wDI be the
goodness offit The calculated value ofSSE was listed in Table 5.8 and Table 5.9
From the Table 5.8 and Table 5.9, the results show that the Pseudo Second Order
linear regression co-efficient of 0.99 and the sum of error squares is less when
The sum of error squares are less for the linear plots of Pseudo Second Order
5.9). The linear regression co-efficient of0.99 which indicating the applicability of the
activated carbon.
46
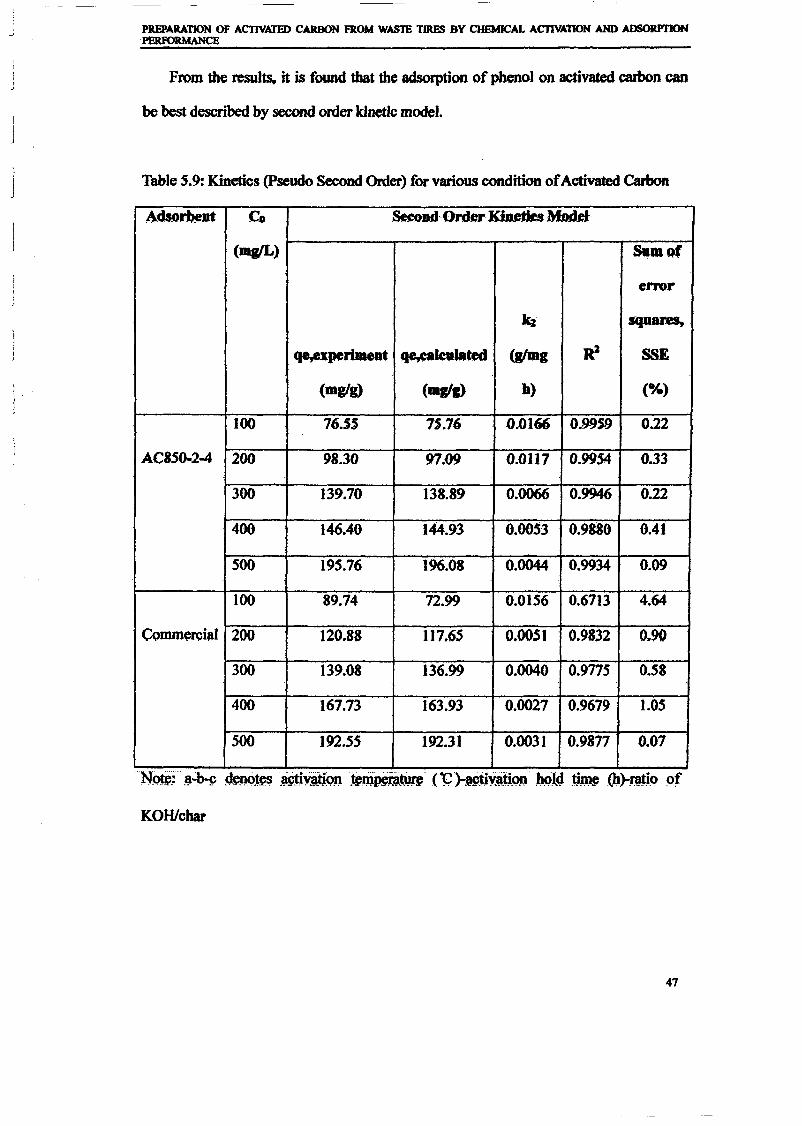
\
J
PREPARATION OF ACTIVATED CARBON FROM WASTE TIRFS BY CHEMICAL ACIlVATION AND ADSORPJ1ON·PERFORMANCE
From the results. it is found that the adsorption of phenol on activated carbon can
be best described by second order kinetic model.
Table 5.9: Kinetics (pseudo Second Order) for various condition ofActivated Carbon
Adsor~Jlt e. ~··OnJerKiaedesMmJd
(mg/L) SaID of
error
ka· squares,
q¥xperiDaea. qe,calewlated (gImg RZ SSE
(mglg) <_gig) h) (%)
100 76.SS 7S.76 0.0166 0.99$9 0.22
AC8SOw24 200 98.30 97.09 0.0117 0.9954 0.33
300 139.70 138.89 0.0066 0.9946 0.22
400 146.40 144.93 0.6OS3 0.9880 0.41
500 195.76 196.08 0.0044 0.9934 0.09
100 89.74 72.99 0.0156 0.6713 4.64
. Commcrci,.I 200 120.88 1I7.6S 0.0051 . 0.9832 0.90
300 139.08 136.99 0.0040 0.9775 0.58
400 167.73 163.93 0.0027 0.9679 1.05
500 ]92.55 ]92.31 0.0031 0.9811 0.07
... . - ..-.- - _ .. - .
KOH/char
47
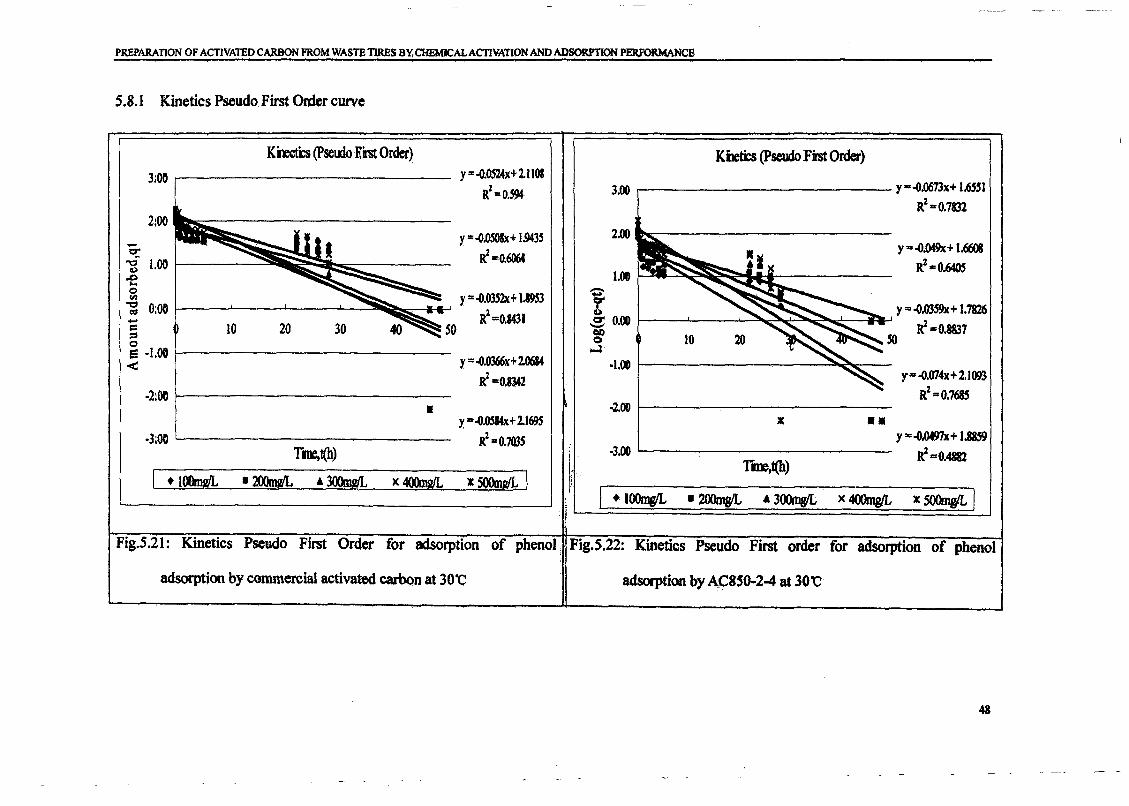
PREPARATION OF ACTIVATED CARBON FROM WASTE TIRES BY, CHEMJCAL ACTIVATION AND ADSOIU'TIONPER,FORMANCB
5.8.1 Kinetics Pseudo First Order curve
K~ (pseoooRirst Order) Kile&s (pseudo Fist Otder)3.00 Y=.o.0524x+11108
y" .().()673x+ 1.6551R2=O.~ 3.00
R2·O.7&322:00
y=.o.oS08x'" 1.9435 2.00- y =0 .().049x+1.66CMlt:t' i=0.6064-0 1.00 R2.. 0.640S~
1.00.0...0
y=.o.03S2x+ U953 ten-0 0:00 y -.o.03S9x+ 1.78261:'$
R2=0.8431Q)- ~ 0.00 i-0.8837= tlI)::;0 SO0 .oJe -1.00 y='().0J66x+ 20684 ·1.00<
y- .().074x+ 2.1093i =0.8342·2:00 R2-0.768S
-2.00• Y. =.o.OSl4x+ll69S II
-3:00 R2=0.703S Y.. .o.m97x+ 1.88S9r~t(h) I
-3;00 i=O.4882I ime,t(h)L,I tlOOnWL • 200mWL A 300tML )(4OOm1/L Z5QOmgIL I }r
I t 100rnWL • 200mgIL • 300mwt x 4OOmg/L ZSOOmglLI
Fig.5.21: Kinetics Pseudo First Order for 'adsorption of phenol, Fig.5.22: Kinetics Pseudo First order for adsorption of phenol
adsorption by commercial activated carbQn at 30'C adsorption by A,C8S0-2-4 at 30"C
48
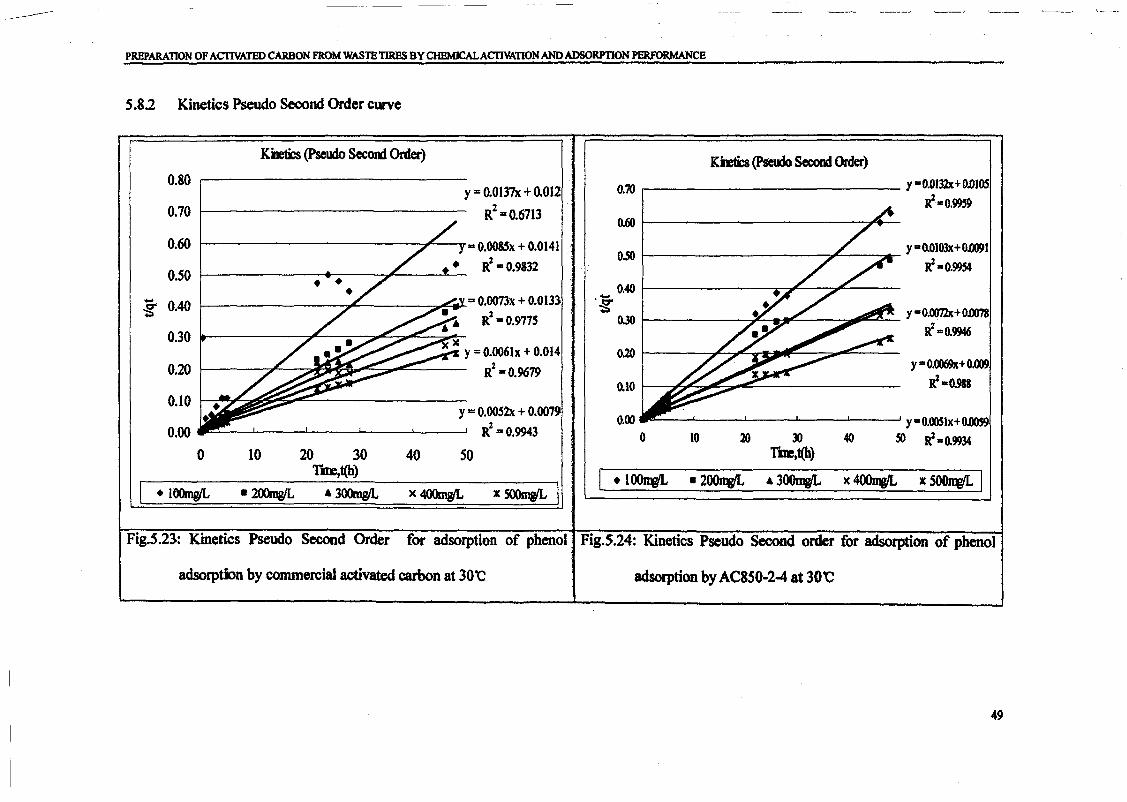
PREPARATION OF ACTIVATED CARBON FROM WASTE TIRES BY CHBMICALAcrIVATION AND ADSORPTION PERFORMANCE
5.8.2 Kinetics Pseudo Seoond Order curve
KiIe&s (Pseudo Secom Order) Kma (Psetdo Second Order)
y=0.0069x+ 0.009
i·G.918
~---'__--L__--'--__L--_---J Y=O.OOSlx+0.D0S9
40 SO i.o.9934
1--------------.,fC---.......,.l- y,,0.0103x+0.0091i-O.99S4
.-- '1-0.o132x+o.ol05
i-0.99S9
I-- ~~"---__:::;;;j~;...c...-Y"O.l1072x+O.0078i-o.9lJ46
• lOOJIv'L • 200Jt¥L & 300ttWL
0.70
0.60
0.50
0.40.-.gOJO
0.20
0.10
0.000 10 20
x SOOmgIL I
y =O.OI37x +0.012
R2 =O.6713
y "" 0.OO52x +0.0079
RZ =0.9943
40 SO
I------------_~_v= O.OO85x +0.0141
RZ =0.9832
I-- ~i<-----~~= 0.0073x +0.0133
RZ=0.9715
0.80
0.70
0.60
0.50
- 0.40.g
0.30
0.20
0.10
0.000 10 20 30
1'ine,t(h)
• lOOmwL .2OOmgIL & 3<lOmWL
Fig.5.23: Kinetics Pseudo Second Order for adsorption of phenol Fig.5.24: Kinetics Pseudo Second order for adsorption of phenol
adsorption by commercial activated carbon at 30-C adsorption by AC8S0-2-4 at 30t:
49
.'r
UNIVERSm SAINS M4LAYSIA
UNIVERSITI SAINS MAlAYSIASCHOOL OF CHEMICAL ENGINEERING
ENGINEERING CAMPUS
STUDY OF PHYSICAL AND CHEMICALCHARACTERISTICS OF CHAR PRODUCED
FROM WASTE TYRE
KAMARUL HASNAN BIN ABOULHAL.fMMatric No.: 73128
" April 2007 ,.4
•.""..---,-----------------..........- ,,\~~,,.,L..".;;........:...:.-_------------'!'O'iIoc:- =~~-:~-/,....~.......
IiI, I
ABSTRACT
Waste tyre was combusted for about 40 to 60 minutes until the combustion temperature
turns out to be constant, respectively in fluidized bed. Combusted waste tyre (Le. char)
was fed through varying raw material diameter from 250 to 500 micron and above with
feed rate at 0.8 and 2 kglh. Scanning electron microscopy (SEM) results will show the
surfaces in these carbons significant different Thermal gravimetric analyzer (TGA)
results showed moisture, volatile, fIxed carbon and ash content meanwhile elemental
analyzer (EA) mentioned carbon, hydrogen, nitrogen and sulfur percentage. This work
facilitated the preparation of char by effectively controlling pore structures for the
adsotption performance of the activated carbon on adsorbates of different molecular
forms.
Keyword: Char; Waste tyre; Physical and Chemical characteristics
I 'I
CHAPTERS
RESULTS AND DISCUSSION
This chapter presents the experimental results together with the discussion. For
convenience, the results have been grouped into two parts. The first part presents the
experimental data for the preparation of char from different parameters. The seoond part
gives results ofchar characterization characterized by SEM, TGA and EA.
S.lExperimental Data
The five attempted parameters are listed as follow:
o Parameter 1
Feed rate = 0.8 kg/h
Waste tyre size =250 to 355 micron
o Parameter 2
Feed rate = 0.8 kglh
Average waste tyre size = 425 micron
o Parameter 3
Feed rate =0.8 kglh
Waste tyre size =above 500 micron
18
o Parameter 4
Feed rate = 2.0 kgIh
Average waste tyee size =425 micron
o Parameter 5
Feed rate =2.0 kglh
Waste tyee size = above 500 micron
According to experimental procedures heater 1 is set at 450°C and heater 2 is set at 450
°C. Hot air temperature is set at 393 °C. The waste tyre is fed when the bed or sand
temperature is reaching 450 °C indicated by Indicator 1. Indicator 3 showed the
temperature ofwaste tyee combusted at.
19
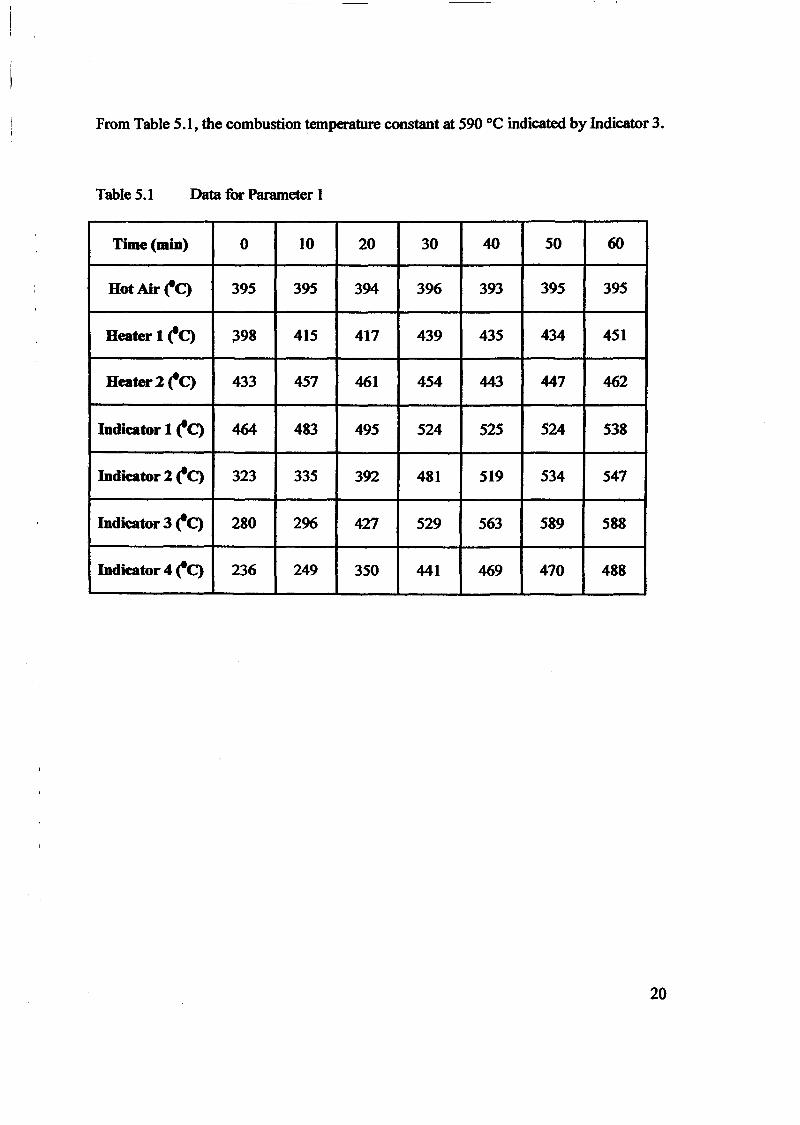
From Table 5.1, the combustion temperature constant at 590 DC indicated by Indicator 3.
Table 5.1 Data for Parameter 1
Time (miD) 0 10 20 30 40 50 60
HotAir~C) 395 395 394 396 393 395 395
Heaterl ~C) ~98 415 417 439 435 434 451
Heaterl~C) 433 457 461 454 443 447 462
Indkator 1 c.eC) 464 483 495 524 525 524 538
Indicator 1 c.eC) 323 335 392 481 519 534 547
Indicator 3 c.eC) 280 296 427 529 563 589 588
Indicator 4 c.eC) 236 249 350 441 469 470 488
20
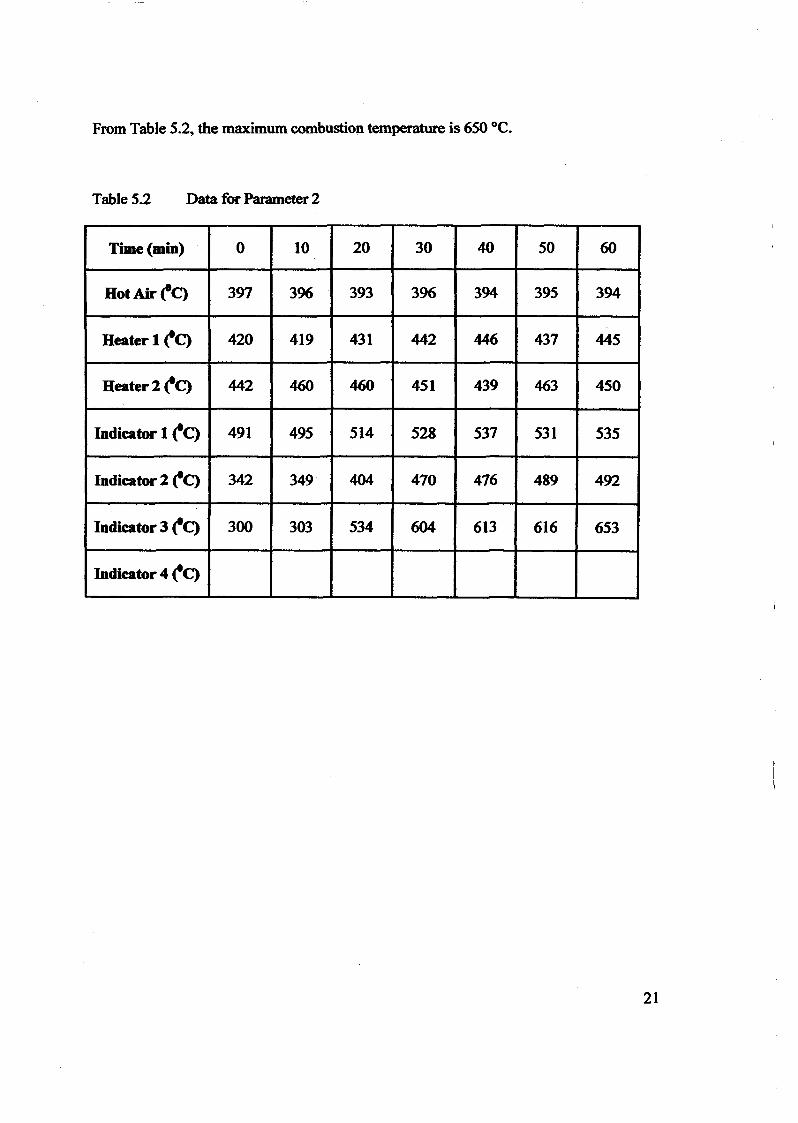
From Table 5.2, the maximum combustion temperature is 650 °c.
Table 5.2 Data for Parameter 2
Time (miD) 0 10 20 30 40 50 60
HotAir('C) 397 396 393 396 394 395 394
Heater 1 ('C) 420 419 431 442 446 437 445
Heater 2 ('C) 442 460 460 451 439 463 450
Indicator 1 ('C) 491 495 514 528 537 531 535
Indicator 2 ('C) 342 349 404 470 476 489 492
Indicator 3 ('C) 300 303 534 604 613 616 653
Indicator 4 ('C)
21
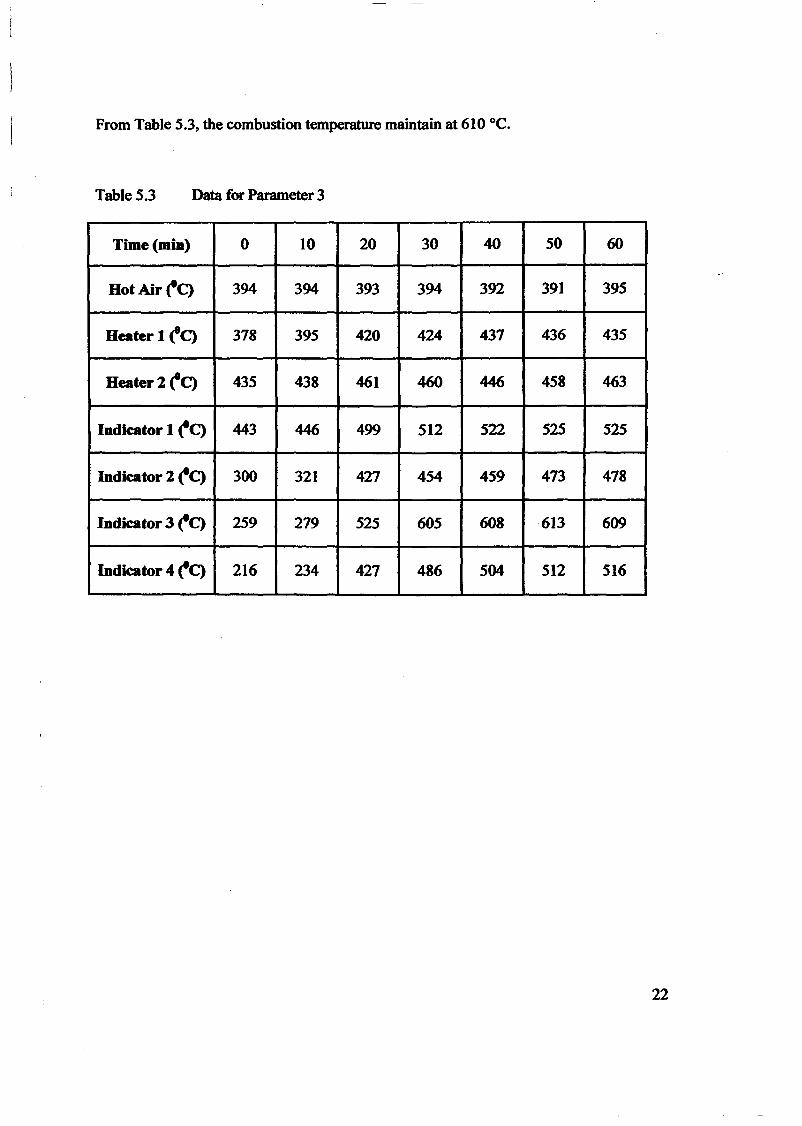
From Table 5.3, the combustion temperature maintain at 610°C.
Table 5.3 Data for Parameter 3
Time (min) 0 10 20 30 40 50 60
HotAir~C) 394 394 393 394 392 391 395
Heater 1 ('C) 378 395 420 424 437 436 435
Heater 2 ('C) 435 438 461 460 446 458 463
Indicator 1 ('C) 443 446 499 512 522 525 525
Indicator 2 ('C) 300 321 427 454 459 473 478
Indicator 3 ('C) 259 279 525 605 608 613 609
Indicator 4 ('C) 216 234 427 486 504 512 516
22
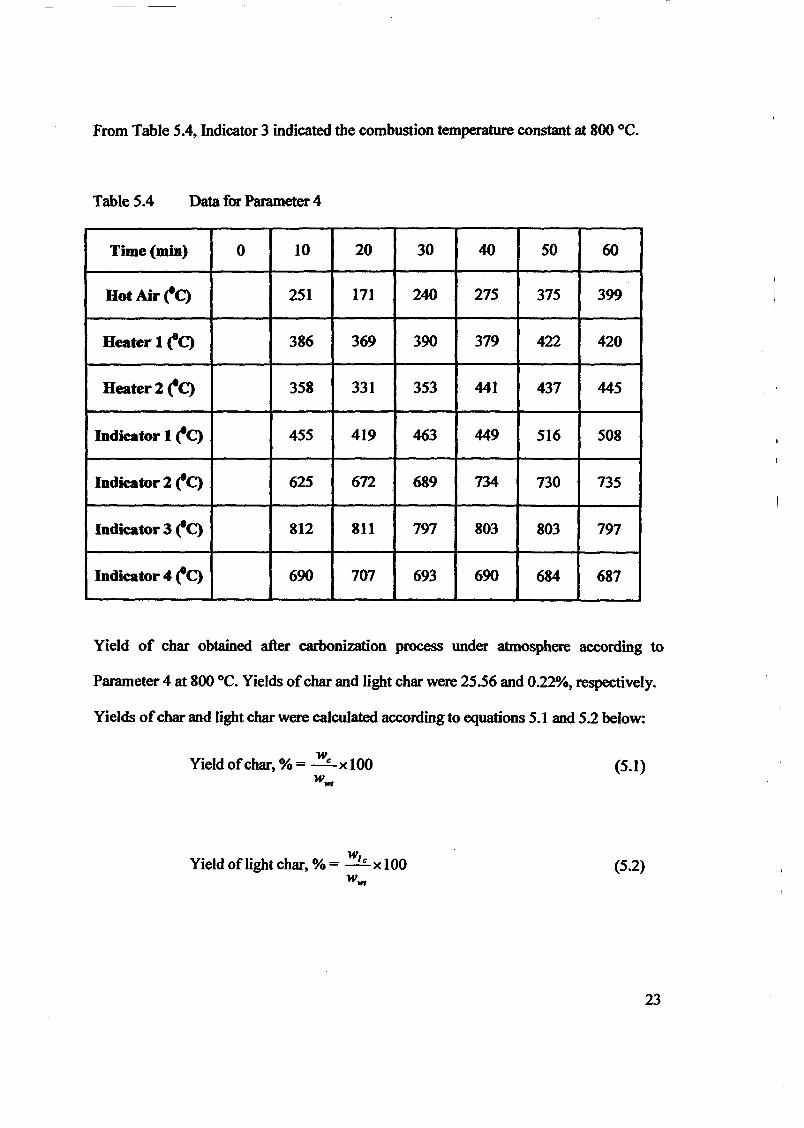
From Table 5.4, Indicator 3 indicated the combustion temperature constant at 800 °C.
Table 5.4 Data for Parameter 4
Time (min) 0 10 20 30 40 50 60
HotAir('C) 251 171 240 275 375 399
Heater 1 ('C) 386 369 390 379 422 420
Heater 2 ('C) 358 331 353 441 437 445
Indicator 1 ('C) 455 419 463 449 516 508
Indicator 2 ('C) 625 672 689 734 730 735
Indicator 3 ('C) 812 811 797 803 803 797
Indicator 4 ('C) 690 707 693 690 684 687
Yield of char obtained after carbonization process under atmosphere according to
Parameter 4 at 800 °C. Yields ofchar and light char were 25.56 and 0.220,/0, respectively.
Yields ofchar and light char were calculated according to equations 5.1 and 5.2 below:
Yield ofchar, % = We X 100Wwt
Yield oflight char, % = WI e X 100w""
(5.1)
(5.2)
23
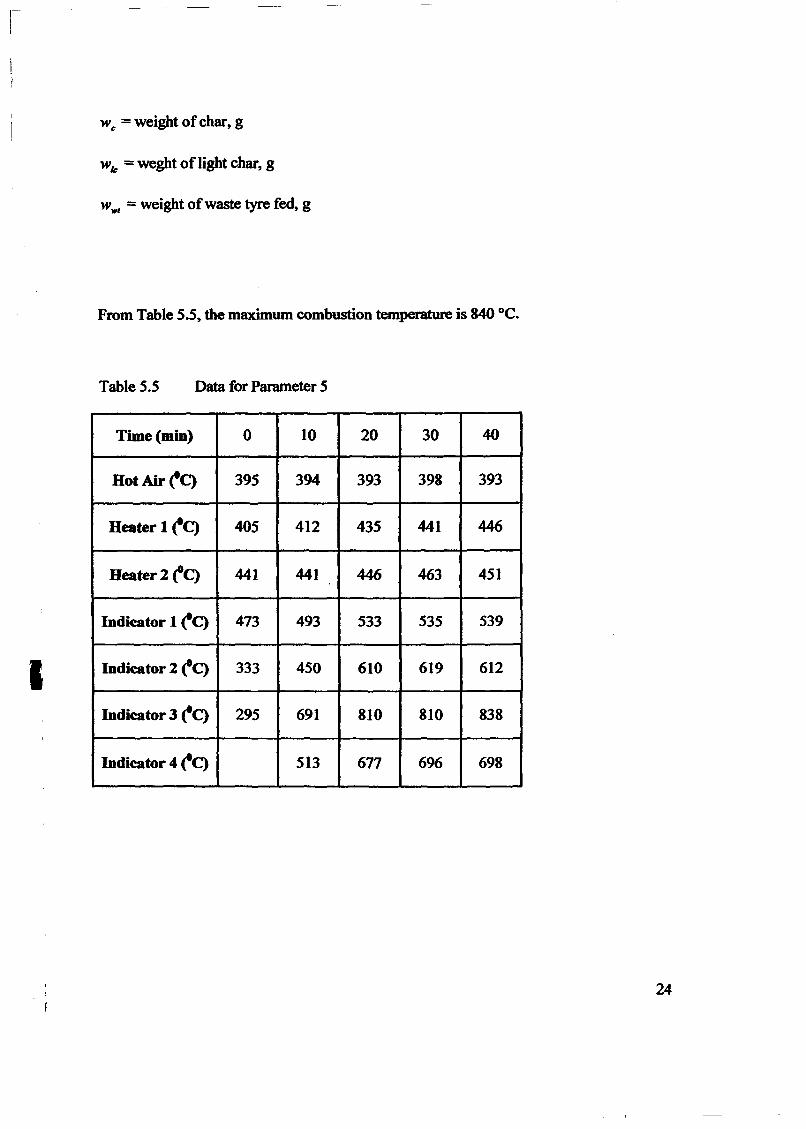
We = weight ofchar, g
W/c = weght oflight char, g
Wwr =weight ofwaste tyre fed, g
From Table 5.5, the maximum combustion temperature is 840 °c.
Table 5.5 Data for Parameter 5
I
Time (miD) 0 10 20 30 40
HotAir('C) 395 394 393 398 393
Heater 1 (lC) 405 412 435 441 446
Heater 2 ('C) 441 441 446 463 451
Indicator 1 ('C) 473 493 533 535 539
Indicator 2 ('C) 333 450 610 619 612
Indicator 3 ('C) 295 691 810 810 838
Indicator 4 ('C) 513 6n 696 698
24
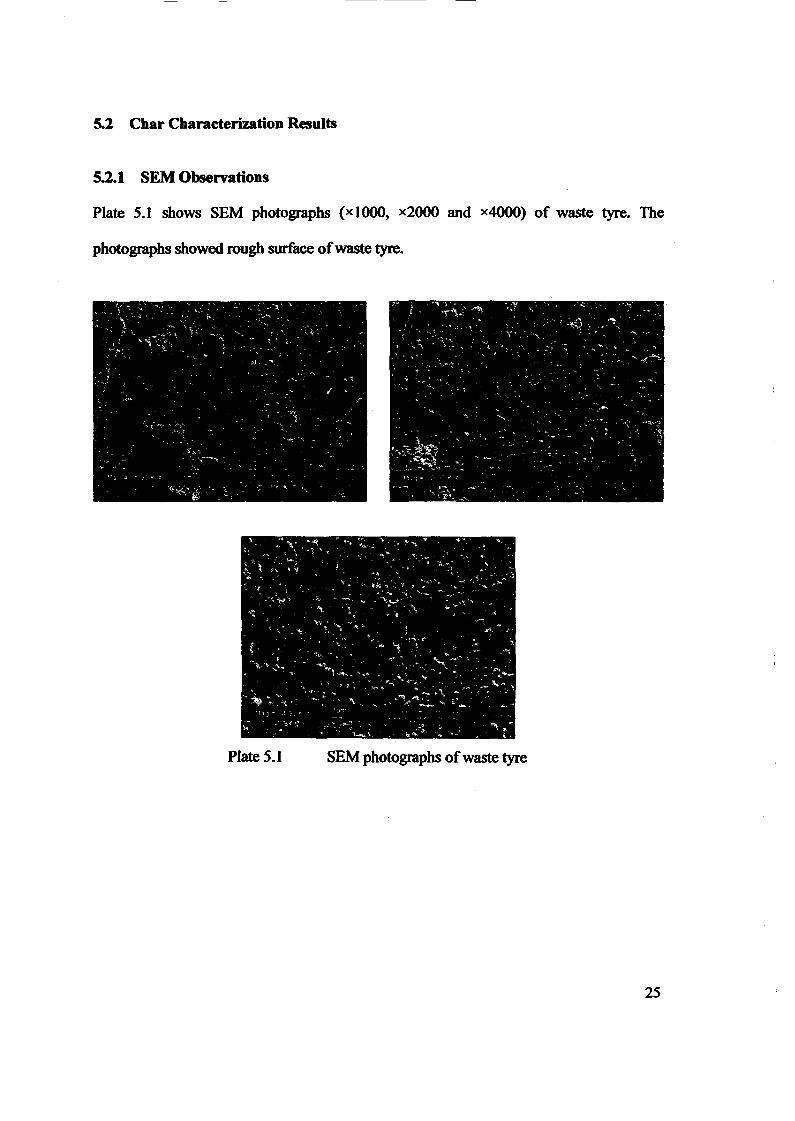
5.2 Char Characterization Results
5.2.1 SEM Observations
Plate 5.1 shows SEM photographs (xlOOO, x2000 and x4000) of waste tyre. The
photographs showed rough surface ofwaste tyre.
Plate 5.1 SEM photographs ofwaste tyre
25
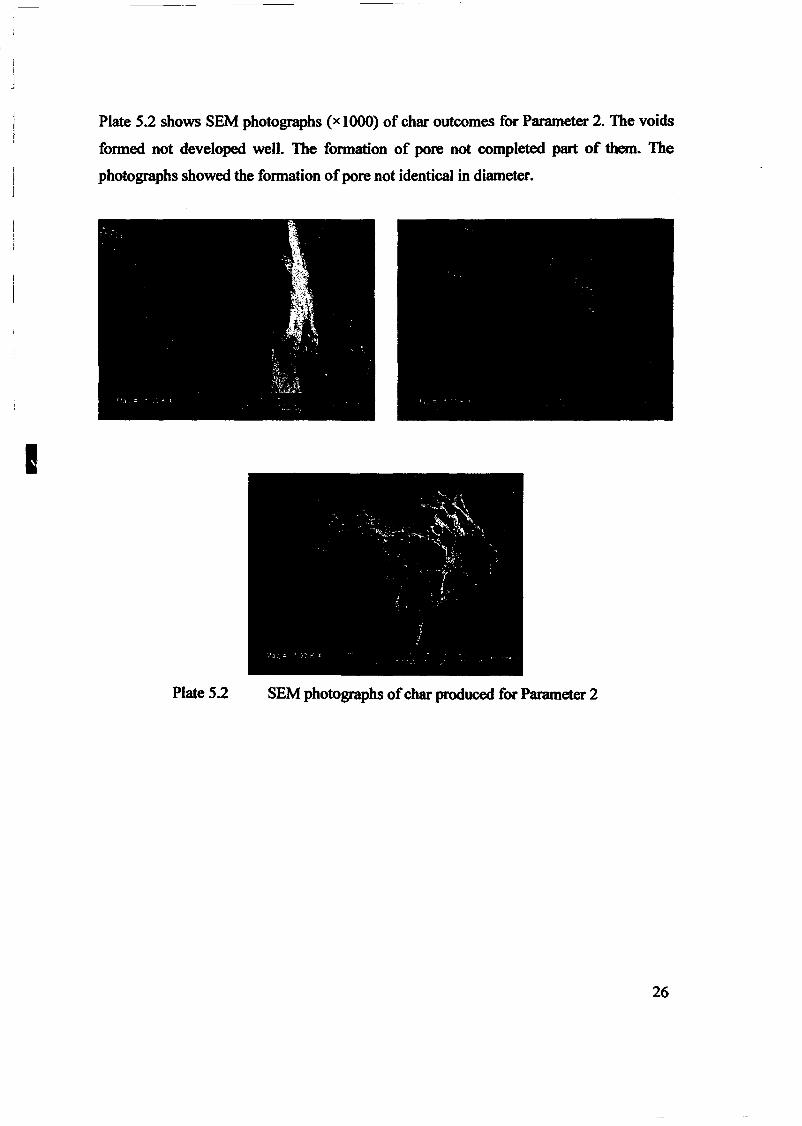
Plate 5.2 shows SEM photographs (x 1000) of char outcomes for Parameter 2. The voids
formed not developed well. The formation of pore not completed part of them. The
photographs showed the formation ofpore not identical in diameter.
I
Plate 5.2 SEM photographs ofchar produced for Parameter 2
26
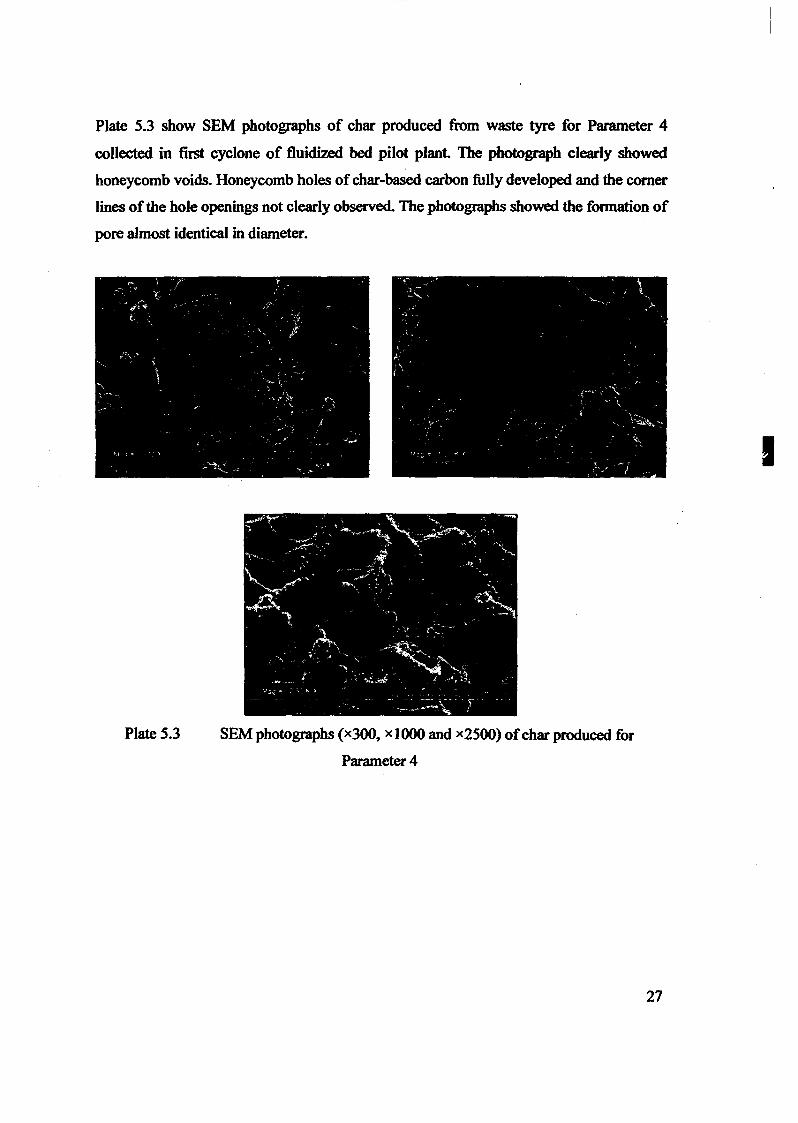
Plate 5.3 show SEM photographs of char produced from waste tyre for Parameter 4
collected in first cyclone of fluidized bed pilot plant. The photograph clearly showed
honeycomb voids. Honeycomb holes ofchar-based carbon fully developed and the comer
lines ofthe hole openings not clearly observed. The photographs showed the formation of
pore almost identical in diameter.
I
Plate 5.3 SEM photographs (x300, xl000 and x2500) ofchar produced for
Parameter 4
27
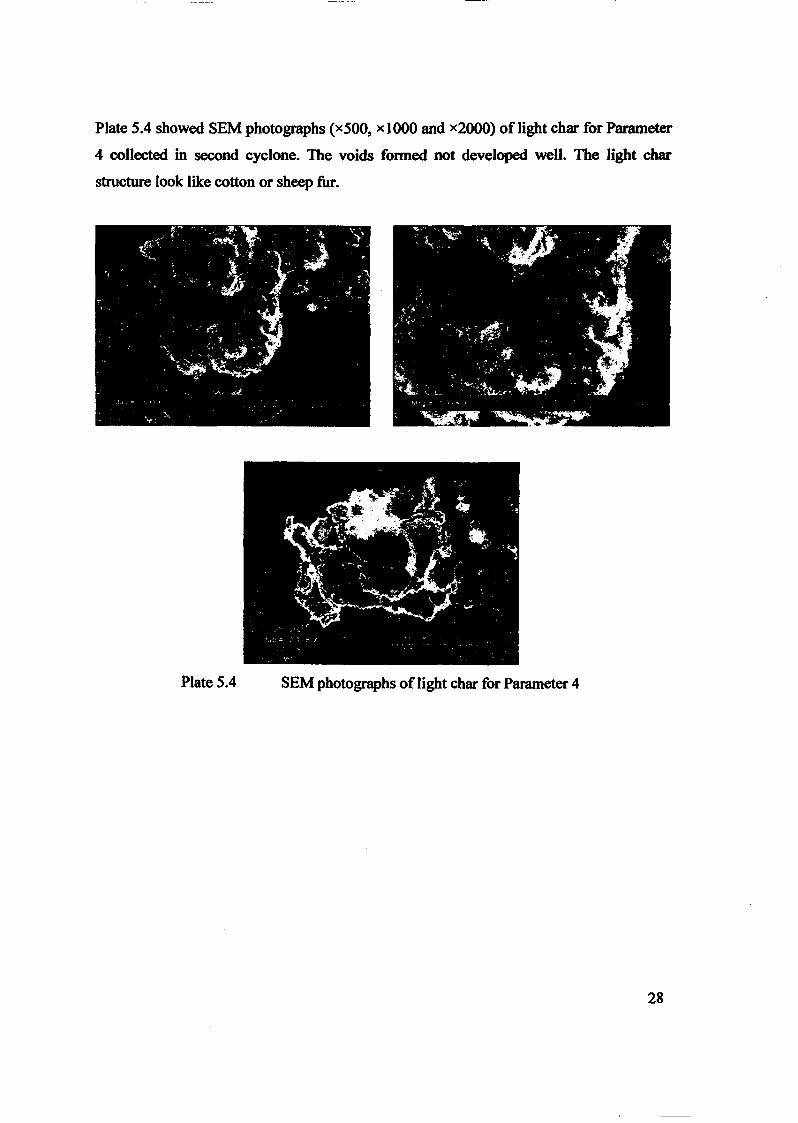
Plate 5.4 showed SEM photographs (x500, x1000 and x2000) oflight char for Parameter
4 collected in second cyclone. The voids fonned not developed well. The light char
structure look like cotton or sheep fur.
Plate 5.4 SEM photographs of light char for Parameter 4
28
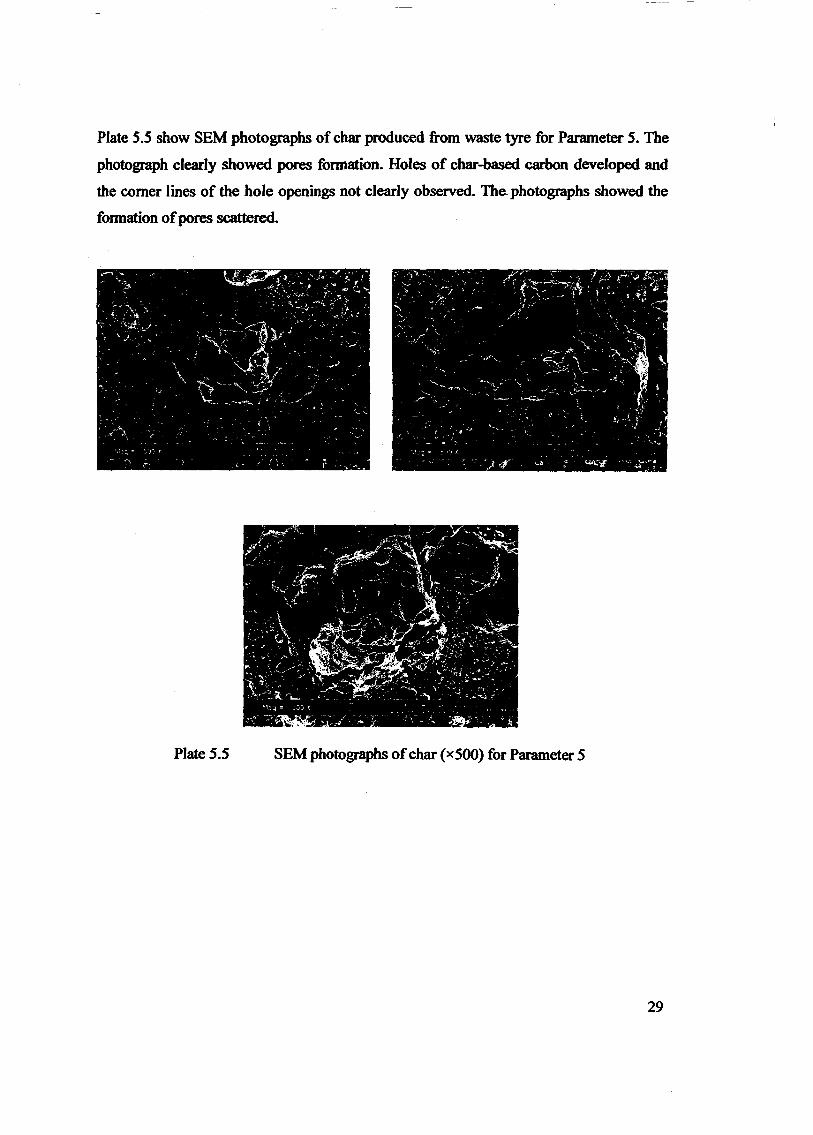
Plate 5.5 show SEM photographs of char produced from waste tyre for Parameter 5. The
photograph clearly showed pores formation. Holes of char-based carbon developed and
the comer lines of the hole openings not clearly observed. The.photographs showed the
fonnation ofpores scattered.
Plate 5.5 SEM photographs ofchar (x500) for Parameter 5
29
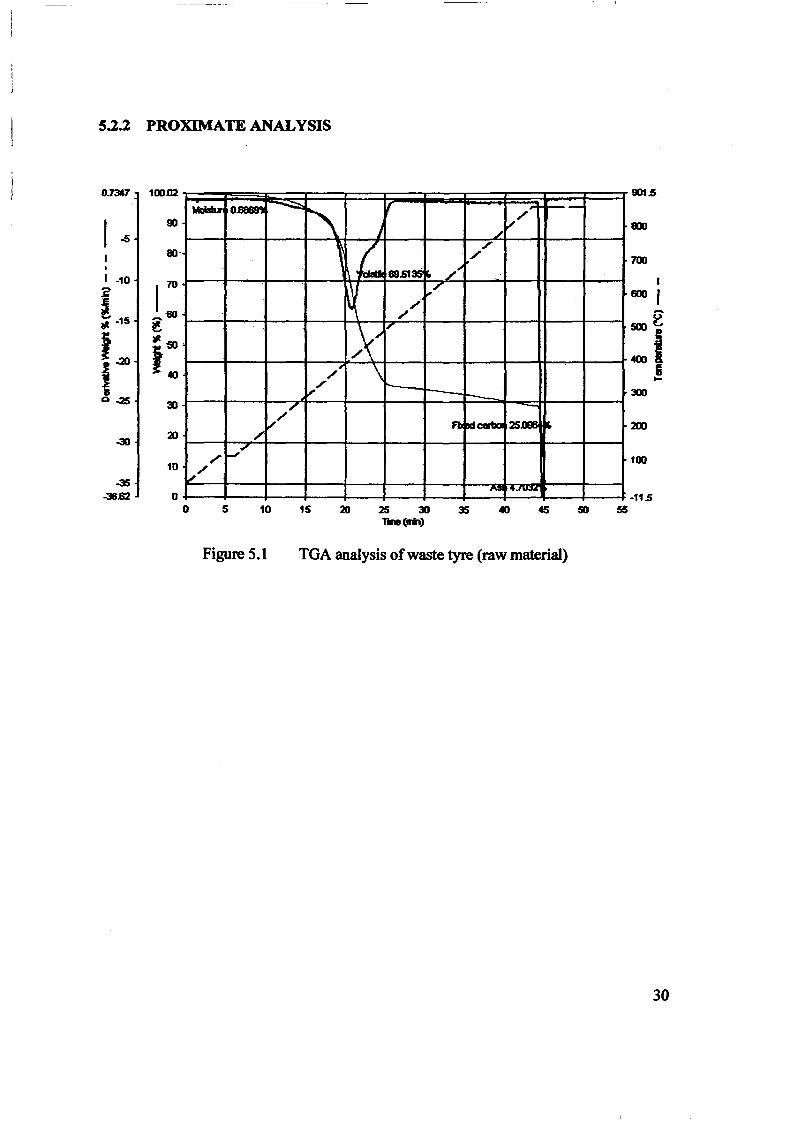
5.1.1 PROXIMATE ANALYSIS
0.7347 UlIUl2 901.5
20
90MlJIslu' 0Jl869'l -....:::
~If ",. -
J ~./
~ L/
./
89.5135 lit /'
~lor'
/
",,\)'/' \
V' t-...-I---
/~ -~ 25.D91l ~
,/
"~....
1//..... ~'9., ......
I -10 70
:i IliS ,..,60.#. - ~
j #.SO
i-20 140
~0-25
300
700
200
100
600
500~
-I....
-11.555403525 30
Dne(mh)15105
oo
10
110--5
-35-38..62
I.,
Figure 5.1 TGA analysis ofwaste tyre (raw material)
30
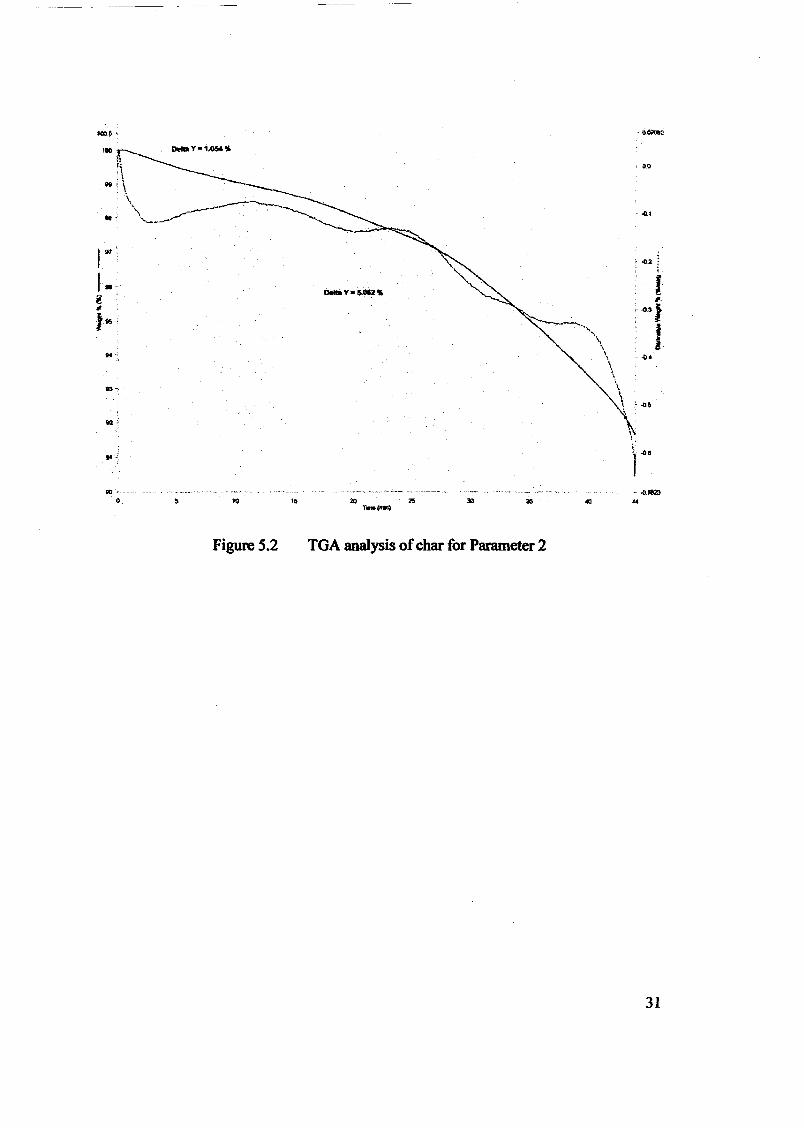
IO>S"
.DO DeIIIl Y -1A1501''
~\,\
~-)\
.. \, .. --------------It \.__~ .. .,--
I§I
I\Ill ~lII
JM..
15 2() 25
.0_
. 0.0
- -0.'
I,.-0.3;
J_. -0.4
Figure 5.2 TGA analysis ofchar for Parameter 2
31
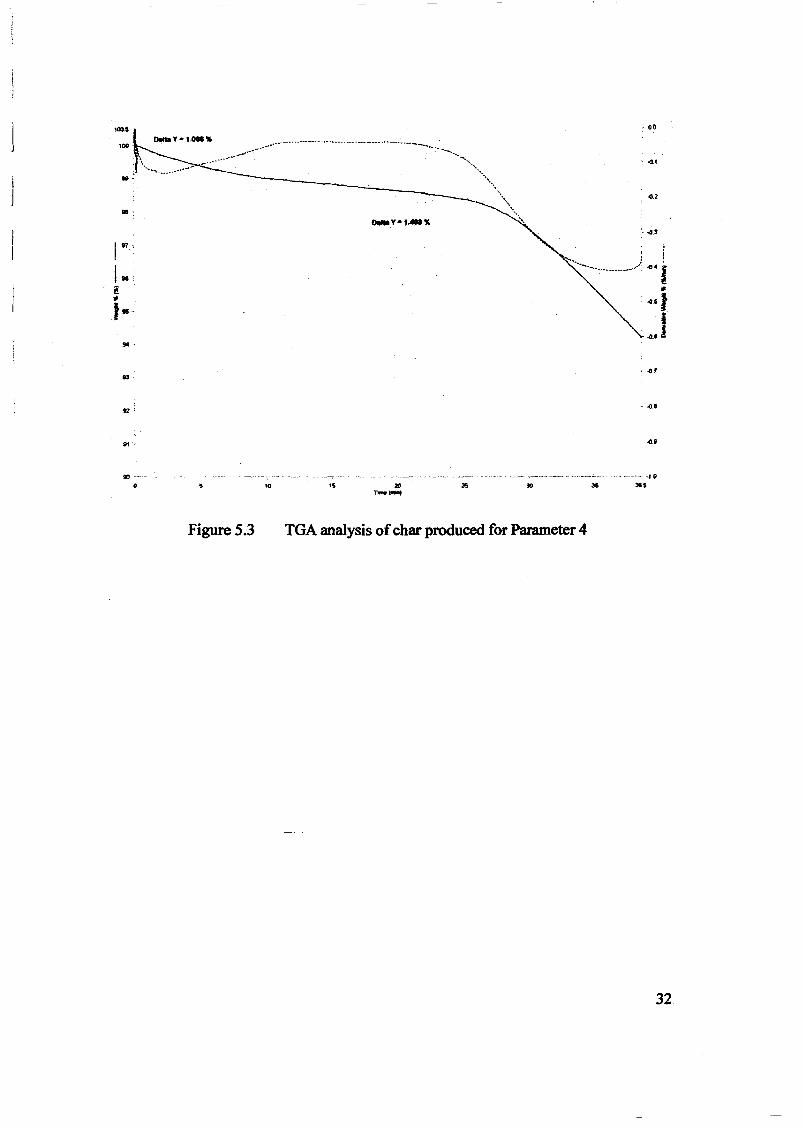
'0<1.5
101l
.. -
oe·
Ief,
I.l-I
J--
'0 .. ..
, 00
.0.2
- 4.3
;
~,~. l!--_.._._....._./- ..4.'"4.sii
-0.' A
.- 47
- 41.'
,····_-,,,;---10
36 30$
Figure 5.3 TGAanalysis ofchar produced for Parameter 4
32
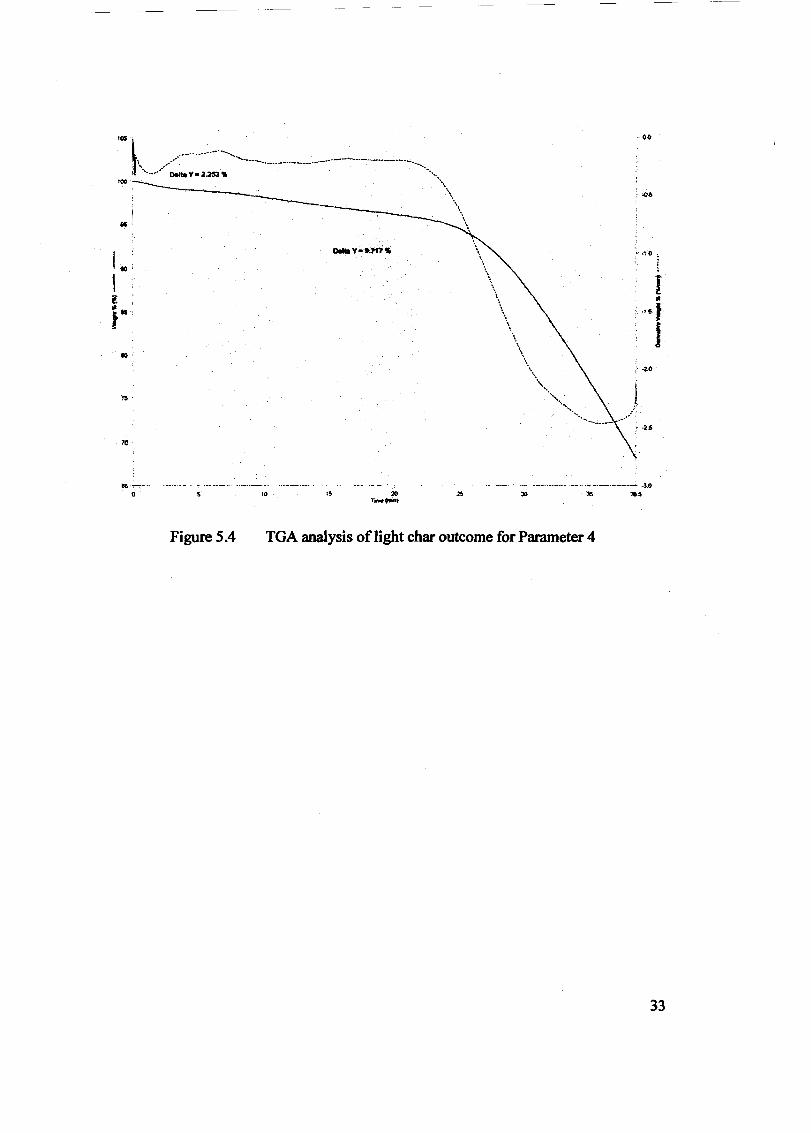
--------
0.0
III>
""1J
. "-_._~-~~--:-.- _.---"_.~..-~-_ ..--,,----_._--~--........;.. -3.0
~ ~ ~~to 15 20r .....o-t
1$'
... ~-o
'05 -
l\, /~/_:_.- - -'---.-..- ~-.- -..-.--..-.----.-.-' .f '-..0' _Y-U53'1o ".
~ ~\\ ... \
Figure 5.4 TGA analysis oflight char outcome for Parameter 4
33
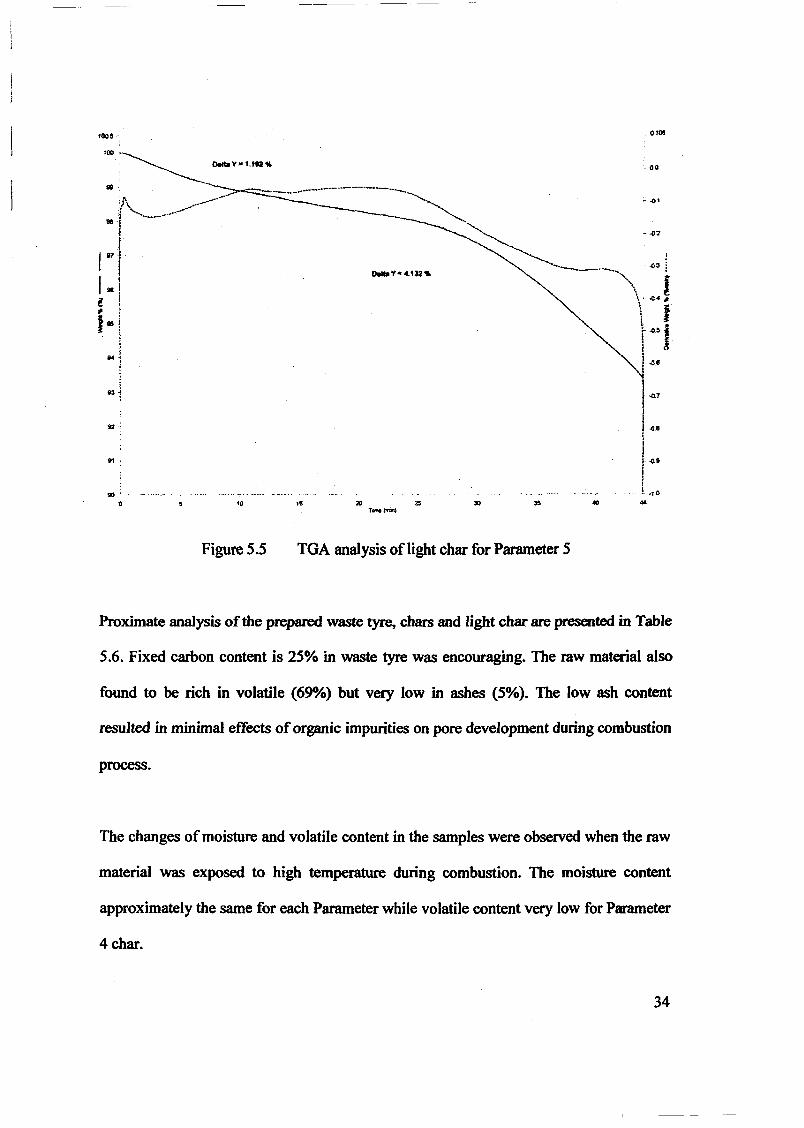
lOCSI
100
51'
1IO~-'-- , .. _..-_..•-.-
o 10 15 JO ...
O'OI!
1
47
! -08
i[ -0,5II!IL .1,0...
Figure 5.5 TGA analysis of light char for Parameter 5
Proximate analysis ofthe prepared waste tyre, chars and light char are presented in Table
5.6. Fixed carbon content is 25% in waste tyre was encouraging. The raw material also
found to be rich in volatile (690At) but very low in ashes (5%). The low ash content
resulted in minimal effects oforganic impurities on pore development during combustion
process.
The changes ofmoisture and volatile content in the samples were observed when the raw
material was exposed to high temperature during combustion. The moisture content
approximately the same for each Parameter while volatile content very low for Parameter
4 char.
34
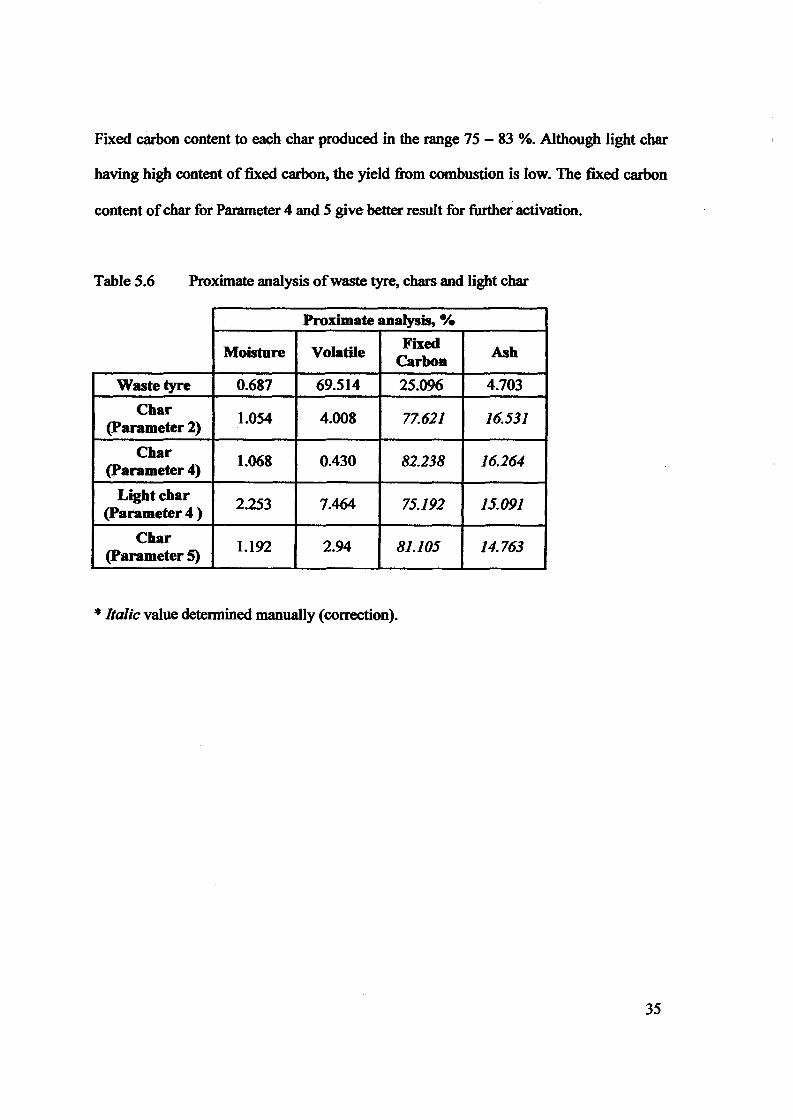
Fixed carbon content to each char produced in the range 75 - 83 %. Although light char
having high content of fixed carbon, the yield from combustion is low. The fixed carbon
content ofchar for Parameter 4 and 5 give better result for further activation.
Table 5.6 Proximate analysis ofwaste tyre, chars and light char
Proximate analysis, %
Moisture Volatile FixedAshCarbon
Wastetyre 0.687 69.514 25.096 4.703
Char1.054 4.008 77.621 16.531(parameter 2)
Char1.068 0.430 82.238 16.264(parameter 4)
Light char2.253 7.464 75.192 15.091(parameter 4 )
Char1.192 2.94 81.105 14.763(parameter 5)
* Italic value detennined manually (correction).
35
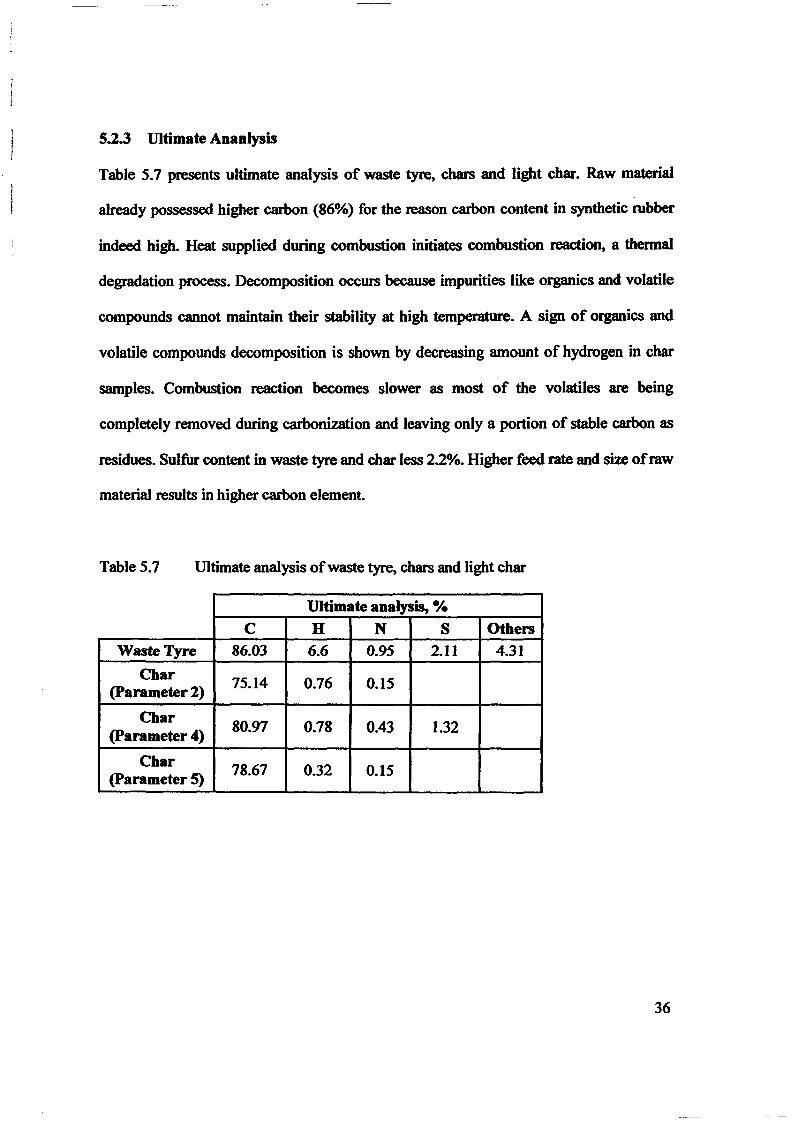
5.2.3 Ultimate Ananlysis
Table 5.7 presents ultimate analysis of waste lyre, chars and light char. Raw material
already possessed higher carbon (86%) for the reason carbon content in synthetic rubber
indeed high. Heat supplied during combustion initiates combustion reaction, a thennal
degradation process. Decomposition occurs because impurities like organics and volatile
compounds cannot maintain their stability at high temperature. A sign of organics and
volatile compounds decomposition is shown by decreasing amount of hydrogen in char
samples. Combustion reaction becomes slower as most of the volatiles are being
completely removed during carbonization and leaving only a portion of stable carbon as
residues. Sulfur content in waste lyre and char less 2.2%. Higher feed rate and size ofraw
material results in higher carbon element.
Table 5.7 Ultimate analysis ofwaste lyre, chars and light char
Ultimate analysis, %
C H N S OthersWasteTyre 86.03 6.6 0.95 2.11 4.31
Char75.14 0.76 0.15(parameter 2)
Char80.97 0.18 0.43 1.32(parameter 4)
Char78.67 0.32 0.15(parameter S)
36
5.3 Error During Characterization
The sample was heated up from 30°C to temperature of 850°C at 20 °C/min. The
sample supposed to be heated up to temperature of 110°C until complete dehydration
and followed by decomposition at 850 °C for 7 minutes to determine volatile matters.
The atmosphere then was changed to be oxidizing. The sample was cooled to 800 °C and
maintained at this temperature until the weight is remained unchanged for proximate
analysis.
5.4 Correction
1 g sample is weighted and put on crucible. Then, crucible containing sample put in
furnace that heated up to 750°C for one hour. After that, sample is weighted again to
determine ash content for proximate analysis.
37
PYROLYSIS OF WASTE TIRE: A KINETIC STUDY
By
CHEW SOON SIONG
Thesis submitted in partial fulfillment ofthe requirements
for the Bachelor's Degree ofChemical Engineering
April 2007
ABSTRACT
The use of waste tire as a source of raw materials for different applications is a
great solution considering that waste tire is presently disposed of by incineration or land
filling. The reuse ofwaste tire is beneficial in economy and environmental point ofview.
Isothermal thermogravimetric analysis (TGA) was used to study the effect of initial
sample weight and temperature on the pyrolysis of waste tire. The effect of heating rate
was studied with dynamic TGA Derivative thermogravimetric (DTG) was employed to
assist the studies. The sample weight was varied from 5 to 15 mg and it was found that no
other rate-a>ntrolling step exists other than chemical reaction. The heating rate was
varied from 5 to 20°C/min to study its effect on pyrolysis and to obtain the kinetic
parameters. Three regions exist in the DTG curves indicating that there are three
independent reactions occurring throughout the· pyrolysis. The pyrolysis rate is assumed
to be:first order and Arhenius equation is applied to obtain the activation energy and pre
exponential factor for all the regions. The temperature was varied from 600°C to 800°C
in the isothermal runs and the activation energy and pre-exponential factor obtained is
81.75 kl/mol and 51.05min-1 respectively.
Keywords: Pyrolysis; Waste tire; Thermogravimetric analysis; Activation energy
viii
i
j
IJ
J
Jj
CHAPTER 4
RESULTS & DISCUSSION
The data from the thermogravimetric analysis were analyzed and is attached in the
appendix. The influence of the three factors namely initial sample weight, heating rate and
temperature are studied and will be presented accordingly in this report. The influence of
heating rate can be studied from the non-isothermal data while the influence of initial
sample weight and temperature are to be studied from the isothermal data.
4.1 INFLUENCE OF INITIAL SAMPLE WEIGHT
By varying the initial sample weight, the weight loss rate of the samples can be
used to determine whether heat or mass transport affect the pyrolysis rate. Besides, the
range of operating conditions in which the reaction is the rate-controlling step can be
determined. In order to find the kinetic parameters, the reaction must not be governed by
mass or heat transport. Instead, the reaction kinetics must be the only rate-controlling step
for Arrhenius equation to hold true.
The initial sample weights were varied from 5 to 15mg to study its effect on the
pyrolysis. The weight percent, W obtained from TGA were converted to percent
conversion by this simple fonnula:
Percent Conversion = 100 - W (Eq. 4.1)
The plot ofpercent conversion ofwaste tire for the three initial sample weights is shown in
Figure 4.1. The data of the 5, 10 and 15mg ofsample weight is obtained from Run 4, 7 and
8 respectively.
14
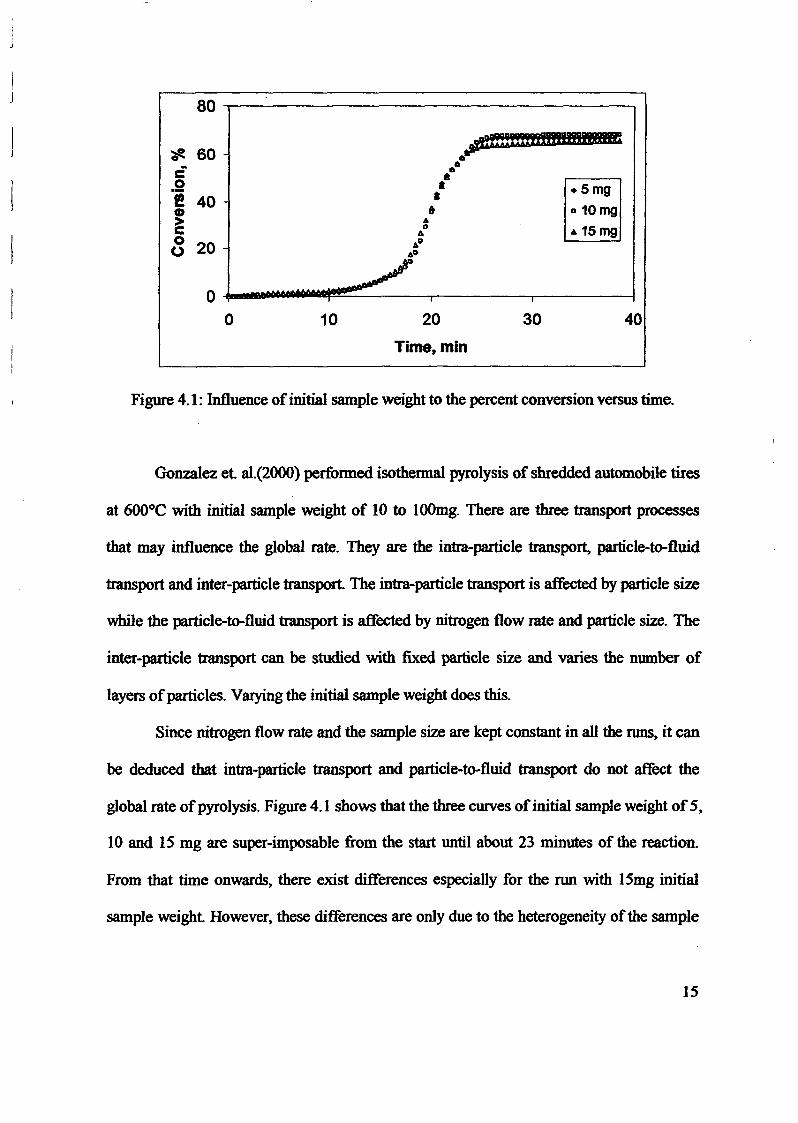
80
~ 60-c.2f! 40CD>C0 20(.)
00 10 20
Time, min
30
.5mg
a 10mg
.15mg
40
Figure 4.1: Influence ofinitial sample weight to the percent conversion versus time.
Gonzalez et al.(2oo0) performed isothermal pyrolysis of shredded automobile tires
at 600°C with initial sample weight of 10 to 10Omg. There are three transport processes
that may influence the global rate. They are the intra-particle transport, particle-to-fluid
transport and inter-particle transport The intra-particle transport is affected by particle size
while the particle-to-fluid transport is affected by nitrogen flow rate and particle size. The
inter-particle transport can be studied with fixed particle size and varies the number of
layers ofparticles. Varying the initial sample weight does this.
Since nitrogen flow rate and the sample size are kept constant in all the runs, it can
be deduced that intra-particle transport and particle-to-fluid transport do not affect the
global rate ofpyrolysis. Figure 4.1 shows that the three curves ofinitial sample weight of5,
10 and 15 mg are super-imposable from the start until about 23 minutes of the reaction.
From that time onwards, there exist differences especially for the run with 15mg initial
sample weight. However, these differences are only due to the heterogeneity of the sample
15
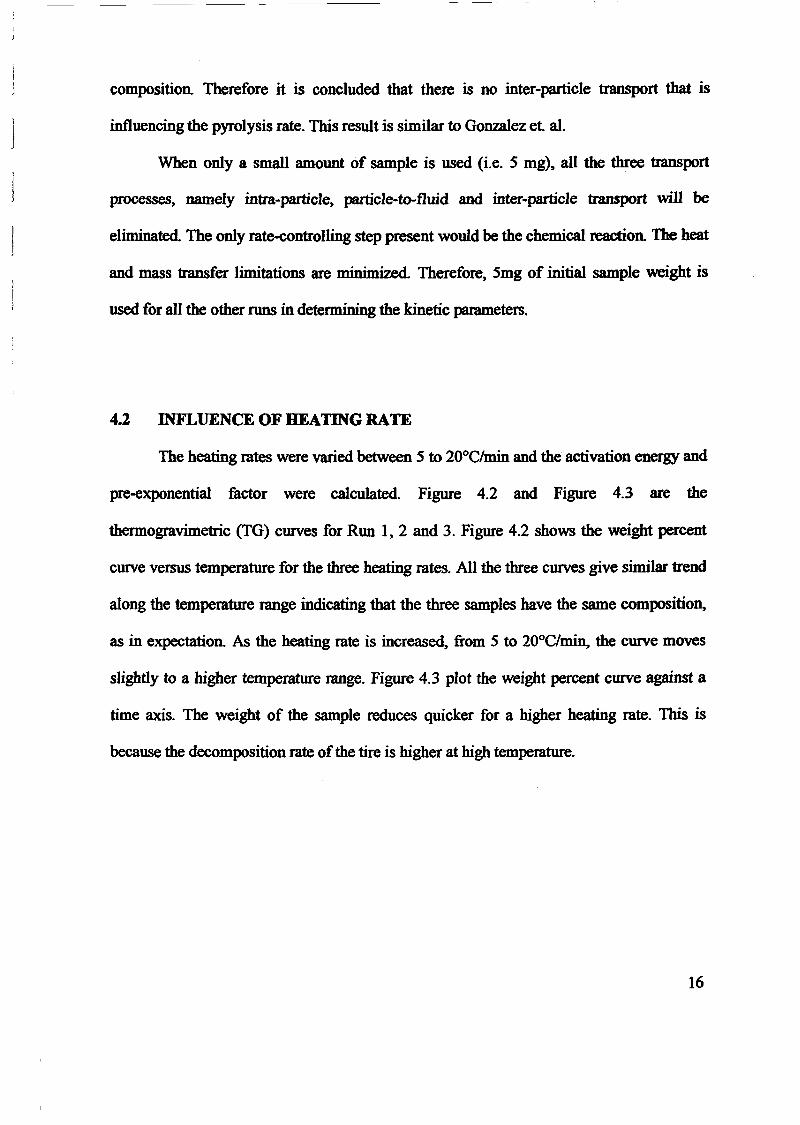
composition. Therefore it is concluded that there is no inter-particle transport that is
influencing the pyrolysis rate. This result is similar to Gonzalez el al.
When only a small amount of sample is used (Le. 5 mg), all the three transport
processes, namely intra-particle, particle-to-fluid and inter-particle transport will be
eliminated The only rate-controlling step present would be the chemical reaction. The heat
and mass transfer limitations are minimized. Therefore, 5mg of initial sample weight is
used for all the other runs in determining the kinetic parameters.
4.2 INFLUENCE OF HEATING RATE
The heating rates were varied between 5 to 20°C/min and the activation energy and
pre-exponential factor were calculated. Figure 4.2 and Figure 4.3 are the
thermogravimetric (TG) curves for Run 1,2 and 3. Figure 4.2 shows the weight percent
curve versus temperature for the three heating rates. All the three curves give similar trend
along the temperature range indicating that the three samples have the same composition,
as in expectation. As the heating rate is increased, from 5 to 20°C/min, the curve moves
slightly to a higher temperature range. Figure 4.3 plot the weight percent curve against a
time axis. The weight of the sample reduces quicker for a higher heating rate. This is
because the decomposition rate ofthe tire is higher at high temperature.
16
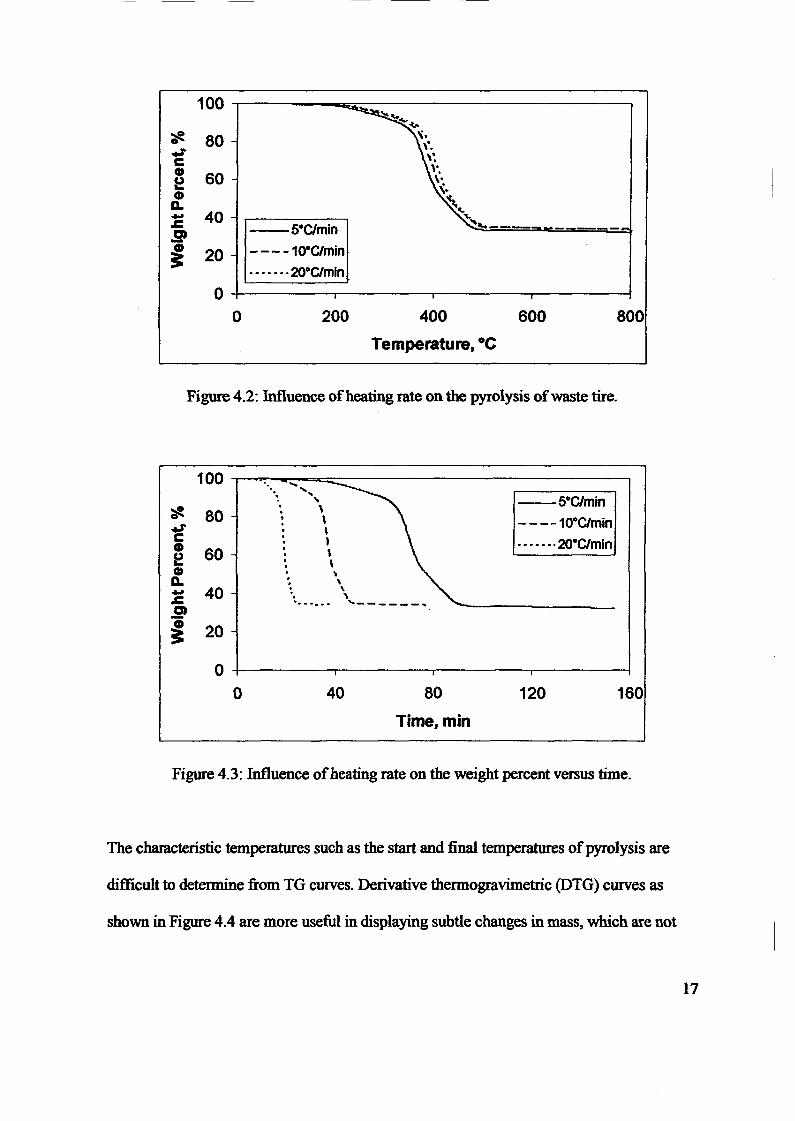
100
~ 80.zcCD 60eCD
Q.- 40.cD)
~ 20
00
_.--SOC/min
- - - -10"C/min.• --...20°C/min
200 400
Temperature, °c600 800
Figure 4.2: Influence ofheating rate on the pyrolysis ofwaste tire.
100 ..... ....., --5°C/min';je.
. \80 ~ \ - - - -10°C/min..z . ,
C 1 ·······20°C/minCD 60 ,e \CD . \Q. \- 40 . \
.c,
"'...-... ""------,D)
~ 20
00 40 80 120 160
Time, min
Figure 4.3: Influence ofheating rate on the weight percent versus time.
The characteristic temperatures such as the start and final temperatures ofpyrolysis are
difficult to determine from TG curves. Derivative thermogravimetric (DTG) curves as
shown in Figure 4.4 are more useful in displaying subtle changes in mass, which are not
17
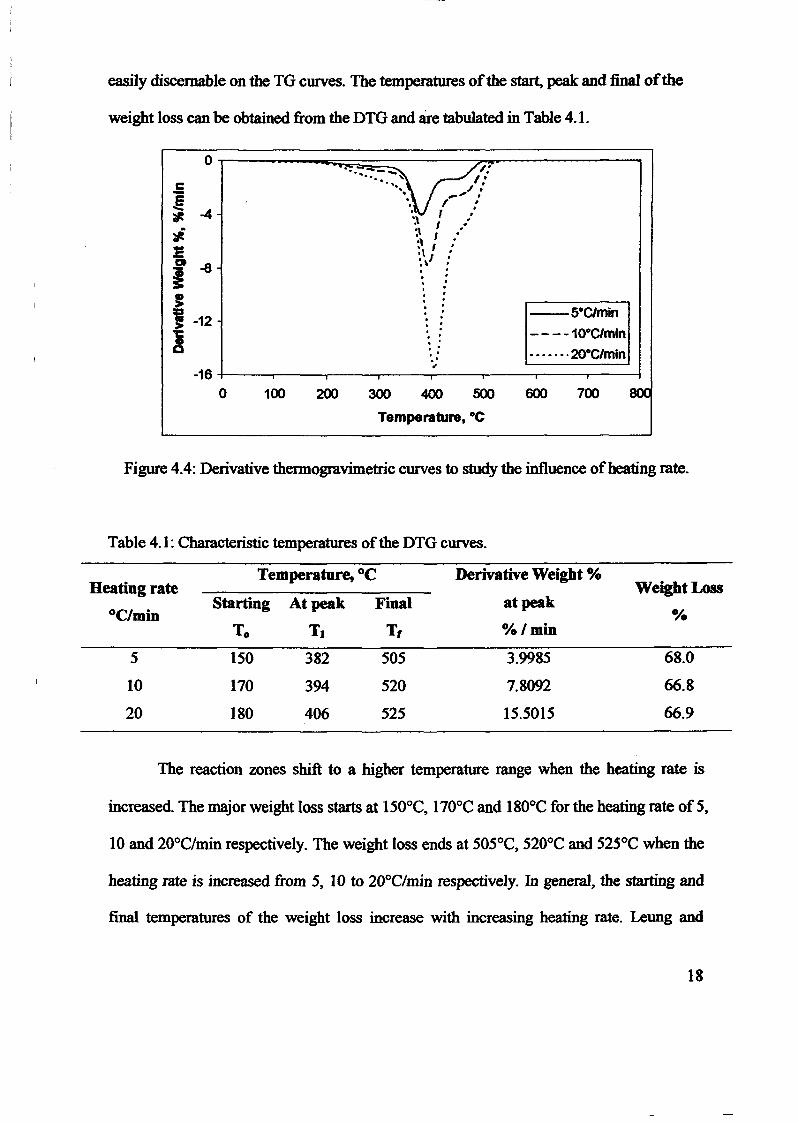
easily discemable on the TG curves. The temperatures ofthe start, peak and final ofthe
weight loss can be obtained from the DTG and are tabulated in Table 4.1.
0~....---~
....... 'Irti': /"e / :i ,.' ", "
-4 , ".,. "I ~
~ :\ .I ..\ .
:2: • I ..\ I .,
CIt~
:\I
., .. ,. ,
~.
,, ,--S·C/min:D ,
J -12 ,. .'C , - - - -10·C/mln.! ., '
·······20·c;/mln' '.'..-16
0 100 200 300 400 500 600 700
Temperature. ·C
Figure 4.4: Derivative thermogravimetric curves to study the influence ofheating rate.
Table 4.1: Characteristic temperatures ofthe DTG curves.
Heating rateTemperature, °c Derivative Weight %
Weight LossStarting At peak Final at peak
°C/min %T. Tl T, %/min
5 150 382 505 3.9985 68.0
10 170 394 520 7.8092 66.8
20 180 406 525 15.5015 66.9
The reaction zones shift to a higher temperature range when the heating rate is
increased. The major weight loss starts at 150°C, 170°C and 180°C for the heating rate of5,
10 and 20°C/min respectively. The weight loss ends at 505°C, 520°C and 525°C when the
heating rate is increased from 5, 10 to 20°C/min respectively. In general, the starting and
final temperatures of the weight loss increase with increasing heating rate. Leung and
18
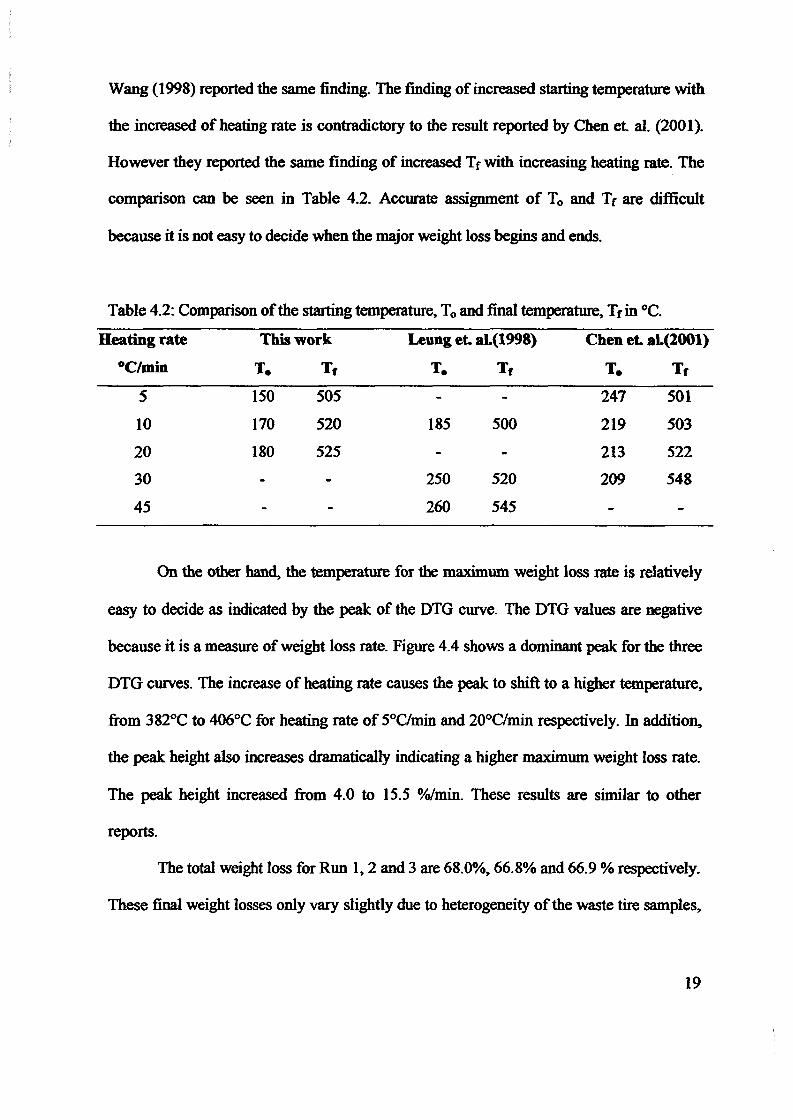
Wang (1998) reported the same finding. The rmding of increased starting temperature with
the increased of heating rate is contradictory to the result reported by Chen et. aI. (2001).
However they reported the same finding of increased Tr with increasing heating rate. The
comparison can be seen in Table 4.2. Accurate assignment of To and Tr are difficult
because it is not easy to decide when the major weight loss begins and ends.
Table 4.2: Comparison ofthe starting temperature, To and final temperature, Tr in °C.
Heating rate This work Leung et. aL(1998) Chen et. aL(2001)
°C/min To T, To T, T. T,
5 150 505 247 501
10 170 520 185 500 219 503
20 180 525 213 522
30 250 520 209 548
45 260 545
On the other hand, the temperature for the maximum weight loss rate is relatively
easy to decide as indicated by the peak of the DTG curve. The DTG values are negative
because it is a measure of weight loss rate. Figure 4.4 shows a dominant peak: for the three
DTG curves. The increase of heating rate causes the peak to shift to a higher temperature,
from 382°C to 406°C for heating rate of 5°C/min and 20°C/min respectively. In addition,
the peak height also increases dramatically indicating a higher maximum weight loss rate.
The peak height increased from 4.0 to 15.5 %/min. These results are similar to other
reports.
The total weight loss for Run 1,2 and 3 are 68.0%, 66.8% and 66.9 % respectively.
These final weight losses only vary slightly due to heterogeneity of the waste tire samples,
19
(i.e. the initial amount of samples used are not exactly 5mg). The remaining residue of
about 33% of initial weight is carbon black or char that would only decompose at a higher
temperature in the presence ofoxygen.
There is a smaller second peak especially for the low heating rate of5°C/min. This
second peak becomes less pronounce at high heating rate. Williams and Besler (1995),
Senneca et. al. (1999) and Gonzalez et. al. (2001) reported that at higher heating rate, the
second peak would become less pronounce and eventually become a single peak at a high
heating rate. On the contrary, Chen et. al. found that a second peak appears at high heating
rate in their studies of pyrolysis of scrap automotive tires of passenger car and truck.
However, they concluded that the smoothness of the both TG curves suggested that
degradations oftwo tires might be accounted for or approximated by one lumped reaction.
Figure 4.5 represents the typical DTG curves of the non-isothermal operation runs.
Three regions can be distinguis~ed over a temperature range of 200°C to 500°C. This
means that the volatiles in tires might be divisible into three non-interacting groups that
evolve by three independent parallel reactions. The reactions are assumed to be first order
reactions. The existence of these regions suggests that the waste tire sample contains
natural rubber (NR), polybutadiene rubber (PBR), styrene butadiene rubber (SBR) and
other constituents such as moisture, oil, plasticizers and additives. These constituents
would be decomposed at different rates and at different temperature regions when
subjected to pyrolysis.
20
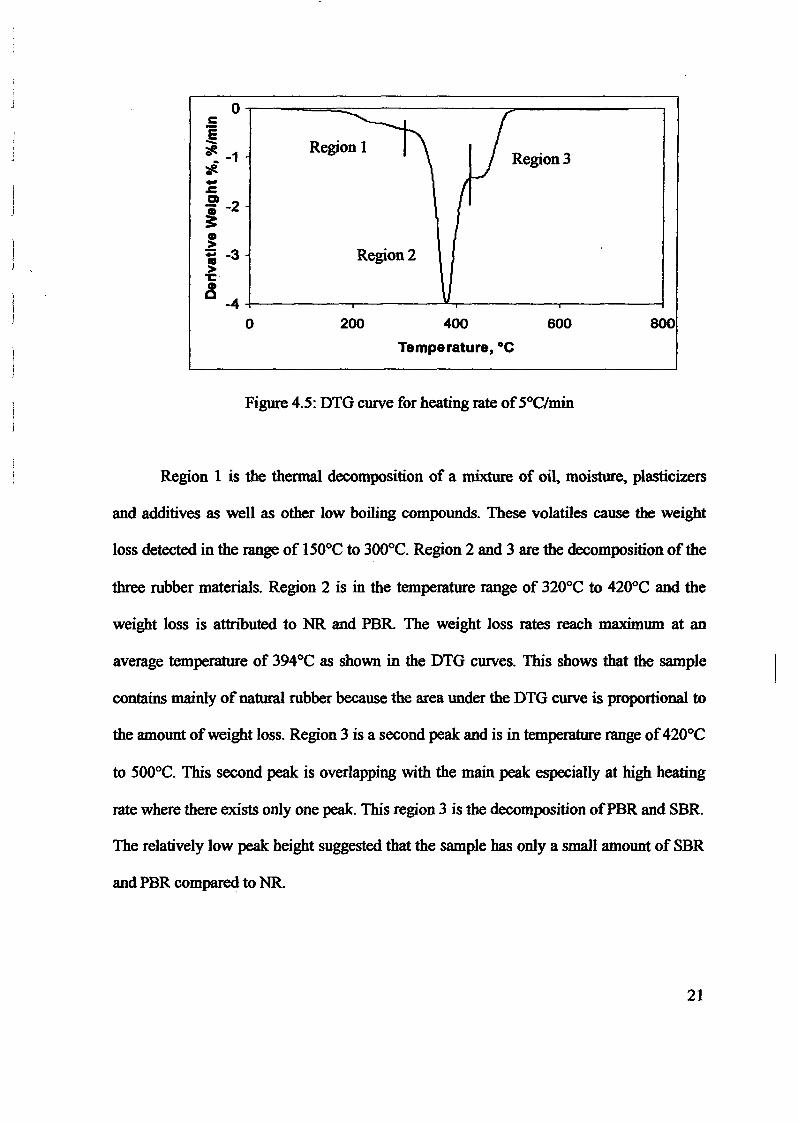
0...----==;;:;;;;:;::=---------;;"'---------,
800600
Region 3
Region 2
200 400
Temperature,OC
Region 1
c:@';F. -1'fi.....cOJ.. -2~
~J -3"I:
a-4+-- ---.- --'L.....--- --,- ~
o
Figure 4.5: DTG curve for heating rate of5°C/min
Region 1 is the thermal decomposition of a mixture of oil, moisture, plasticizers
and additives as well as other low boiling compounds. These volatiles cause the weight
loss detected in the range of 150°C to 300°C. Region 2 and 3 are the decomposition of the
three rubber materials. Region 2 is in the temperature range of 320°C to 420°C and the
weight loss is attributed to NR and PBR. The weight loss rates reach maximum at an
average temperature of 394°C as shown in the DTG curves. This shows that the sample
contains mainly of natural rubber because the area under the DTG curve is proportional to
the amount ofweight loss. Region 3 is a second peak: and is in temperature range of420°C
to 500°C. This second peak is overlapping with the main peak: especially at high heating
rate where there exists only one peak. This region 3 is the decomposition ofPBR and SBR.
The relatively low peak height suggested that the sample has only a small amount of SBR
and PBR compared to NR.
21
Williams and Besler found that NR largely decomposes at a lower temperature than
SBR and PBR. PBR shows a tendency to two-stage decompositio~ but the secondary
decomposition is much less prominent. Bhowmick et. al. (1987) have also shown that
thermal degradation ofNR in nitrogen at a heating rate of 10°C/min starts at about 330°C
and is complete by 485°C. Liu et. al. (1992) investigated the pyrolysis ofNR, BR and SBR
and found that the maximum weight loss rate ofNR occurs at a temperature of373°C, BR
In order to determine the kinetic parameters, the three regions are calculated
separately and are assumed to be first order reactions. The decomposition rate can be
expressed as:
dW =-k'W-W)dt \! I
where W = weight ofsample at time t (%)
Wr= weight of the residue at the end ofthe reaction (%)
k = rate constant (min-1)
The rate constant, k can be defined by Arrhenius equation as:
£k=k e RTo
where leo = pre-exponential factor (min-I)
Ea = activation energy (kJ/mol)
R = ideal gas constant = 8.314 x 10⁻³ kJ/molK
T = absolute temperature (K)
(Eq.4.2)
(Eq.4.3)
22
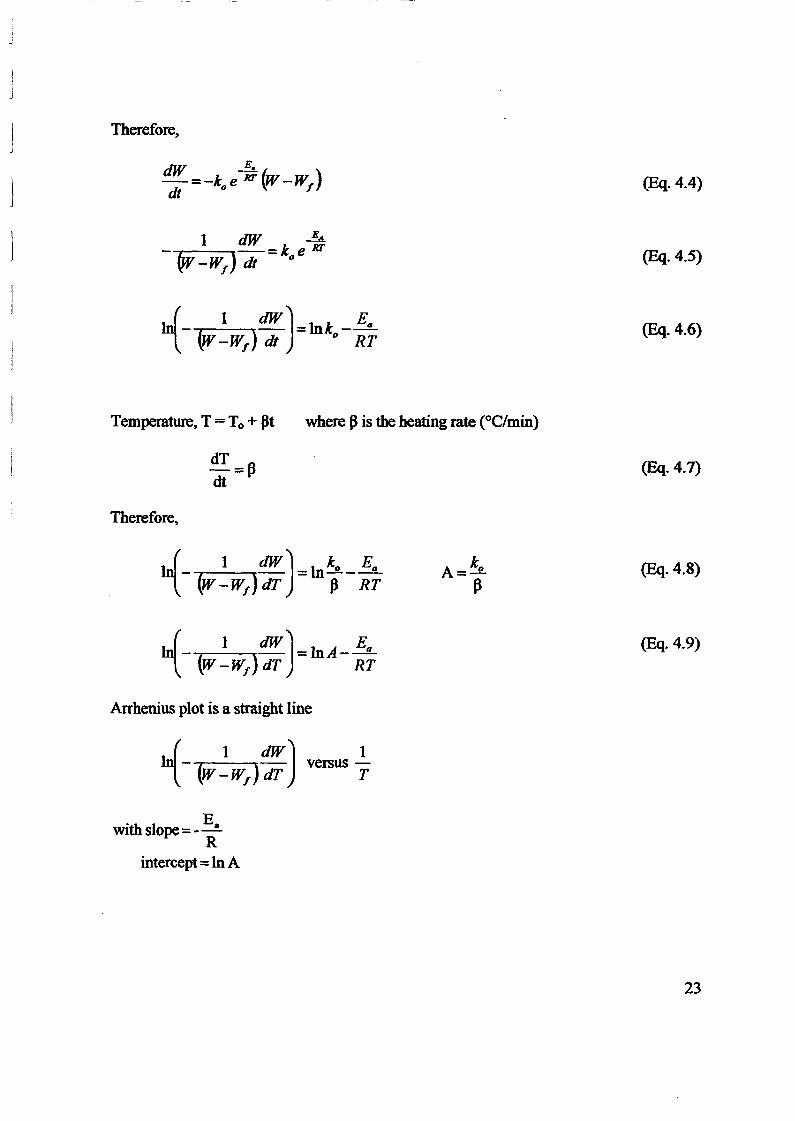
Therefore,
dW E.-=-1 e RT'W-W)dt 0 \' f
h,{_ 1 dW)-Ink _E..~ (W-Wf ) dt - 0 RT
Temperature, T = To + pt where pis the heating rate (OC/min)
(Eq.4.4)
(Eq.4.5)
(Eq.4.6)
dT = P (Eq.4.7)dt
Therefore,
1.,{_ 1 dW) -InA- E..ll\ (W -Wf
) dT - RT
Arrhenius plot is a straight line
(Eq.4.8)
(Eq.4.9)
1versus
T
°th I E.WI s ope=--R
intercept=In A
23
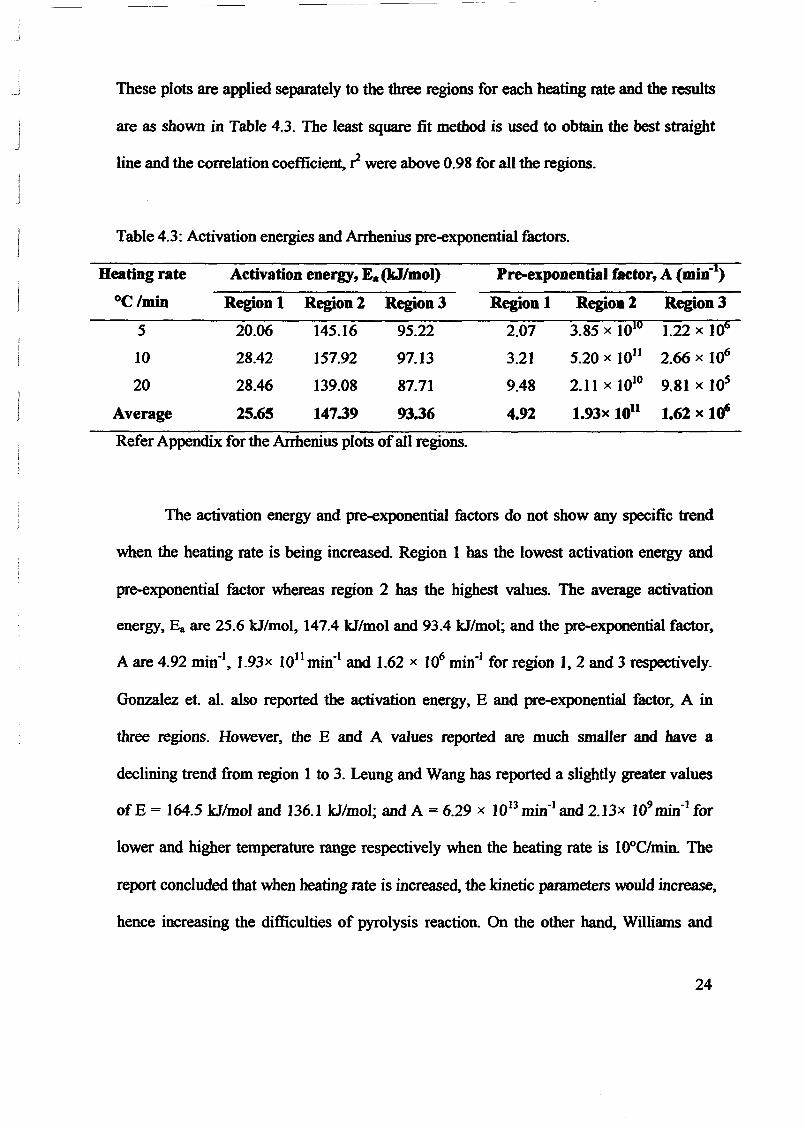
j
j
These plots are applied separately to the three regions for each heating rate and the results
are as shown in Table 4.3. The least square fit method is used to obtain the best straight
line and the correlation coefficient, ~ were above 0.98 for all the regions.
Table 4.3: Activation energies and Arrhenius pre-exponential factors.
Heating rate Activation energy, E.(kJ/mol) Pr~xponentialfactor, A (min-I)
°C Imin Region 1 Region 2 Region 3 Region 1 Regioa 2 Region 3
5 20.06 145.16 95.22 2.01 3.85 x 10¹⁰ 1.22 x 10⁶
10 28.42 151.92 91.13 3.21 5.20 x 10)) 2.66 x 10⁶
20 28.46 139.08 81.11 9.48 2.11 x 10¹⁰ 9.81 x lOS
Average 25.65 147.39 93.36 4.92 1.93x 10¹¹ 1.62 x 10'
Refer Appendix for the Arrhenius plots ofall regions.
The activation energy and pre-exponential factors do not show any specific trend
when the heating rate is being increased Region 1 has the lowest activation energy and
pre-exponential factor whereas region 2 has the highest values. The average activation
energy, Ea are 25.6 kJ/mol, 147.4 kJ/mol and 93.4 kJ/mol; and the pre-exponential factor,
A are 4.92 min-I, 1.93x 10¹¹ min-I and 1.62 x 10⁶ min-I for region 1,2 and 3 respectively.
Gonzalez et. al. also reported the activation energy, E and pre-exponential factor, A in
three regions. However, the E and A values reported are much smaller and have a
declining trend from region 1 to 3. Leung and Wang has reported a slightly greater values
ofE = 164.5 kJ/moJ and 136.1 kllmol; and A = 6.29 x 10¹³ min-I and 2.13x 10⁹ min-I for
lower and higher temperature range respectively when the heating rate is lOoe/min. The
report concluded that when heating rate is increased, the kinetic panuneters would increase,
hence increasing the difficulties of pyrolysis reaction. On the other hand, Williams and
24
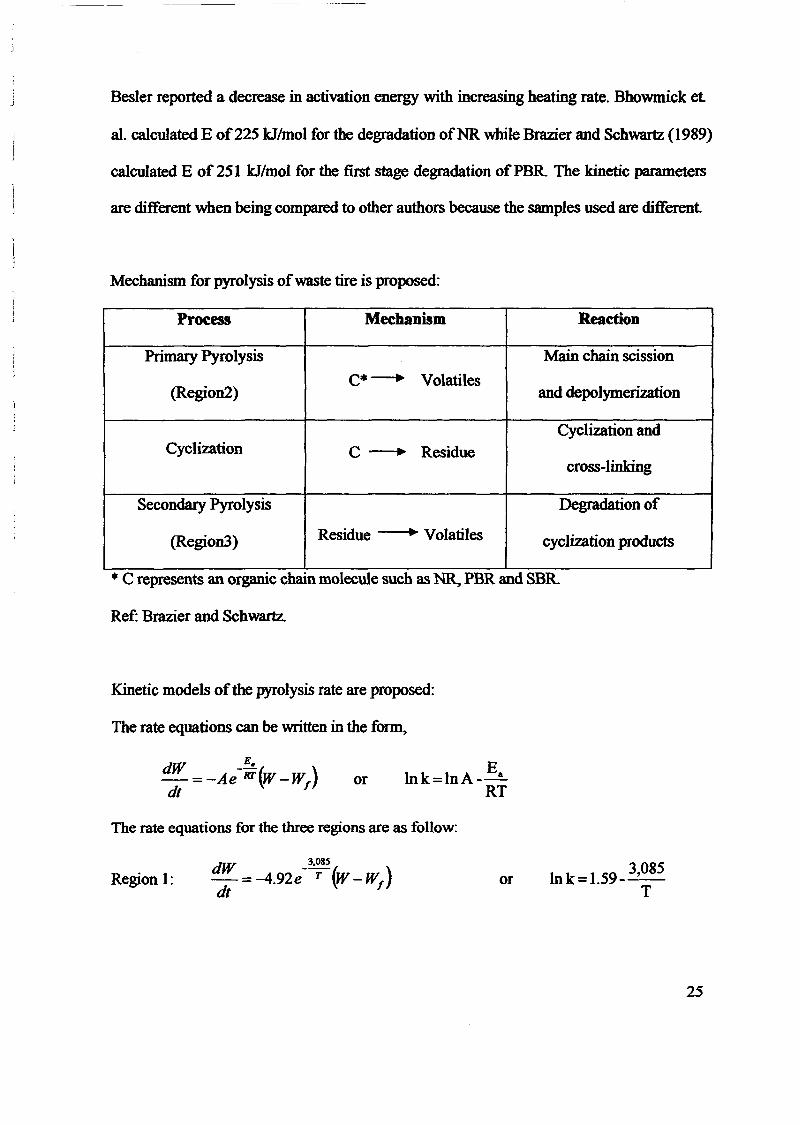
Besler reported a decrease in activation energy with increasing heating rate. Bhowmick et
at. calculated E of225 kJ/mol for the degradation ofNR while Brazier and Schwartz (1989)
calculated E of 251 kJ/mol for the first stage degradation ofPBR The kinetic parameters
are different when being compared to other authors because the samples used are different.
Mechanism for pyrolysis ofwaste tire is proposed:
Process Mechanism Reaction
Primary Pyrolysis Main chain scission
(Region2)C·-' Volatiles
and depolymerization
Cyclization andCyclization C-' Residue
cross-linking
Secondary Pyrolysis Degradation of
(RegionJ) Residue ----.. Volatiles cyclization products
• C represents an orgamc cham molecule such as NR, PBR and SBR
Ref: Brazier and Schwartz.
Kinetic models ofthe pyrolysis rate are proposed:
The rate equations can be written in the form,
or lnk=lnA- E.RT
The rate equations for the three regions are as follow:
Region 1: or In k = 1.59 _3,085T
25
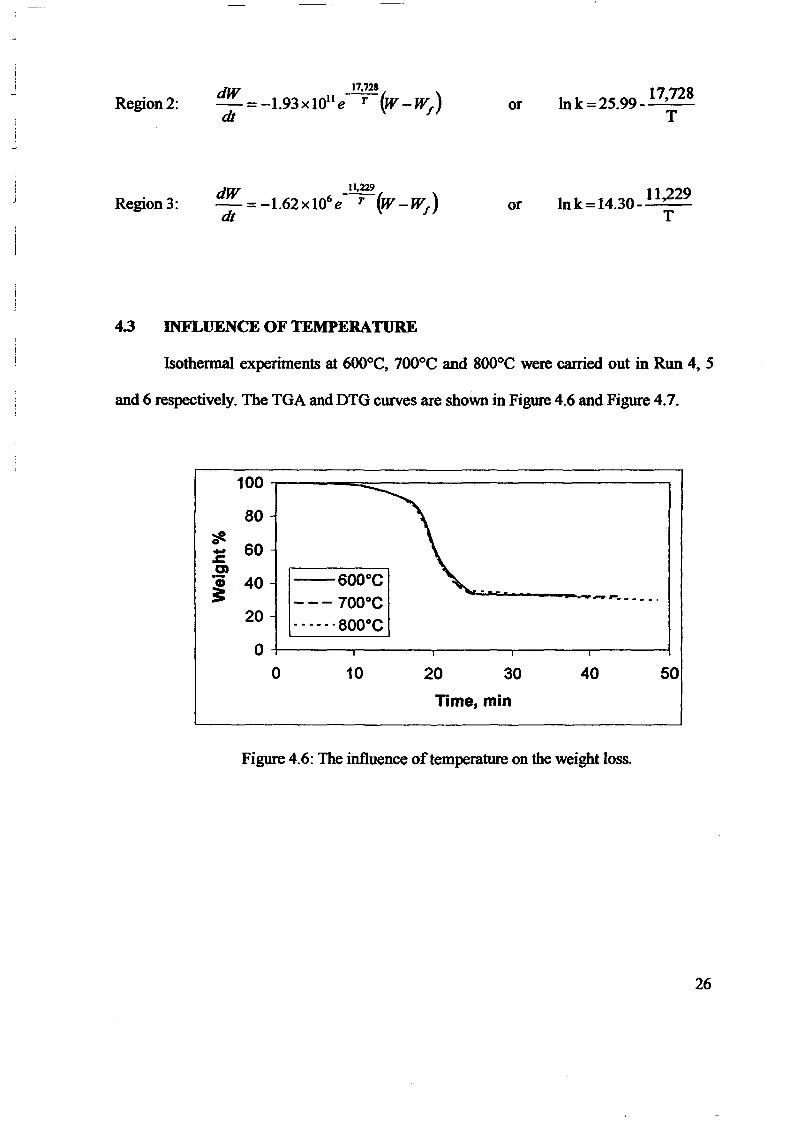
4.3 INFLUENCE OF TEMPERATURE
Isothermal experiments at 600°C, 700°C and 800°C were carried out in Run 4, 5
and 6 respectively. The TGA and DTG curves are shown in Figure 4.6 and Figure 4.7.
--~'--------.. -. -.
100
80";1-
60-.I:C)
~. 40 6000 e---700oe
20 ... -_. 8000 e0
0 10 20 30 40 50
Time, min
Figure 4.6: The influence oftemperature on the weight loss.
26
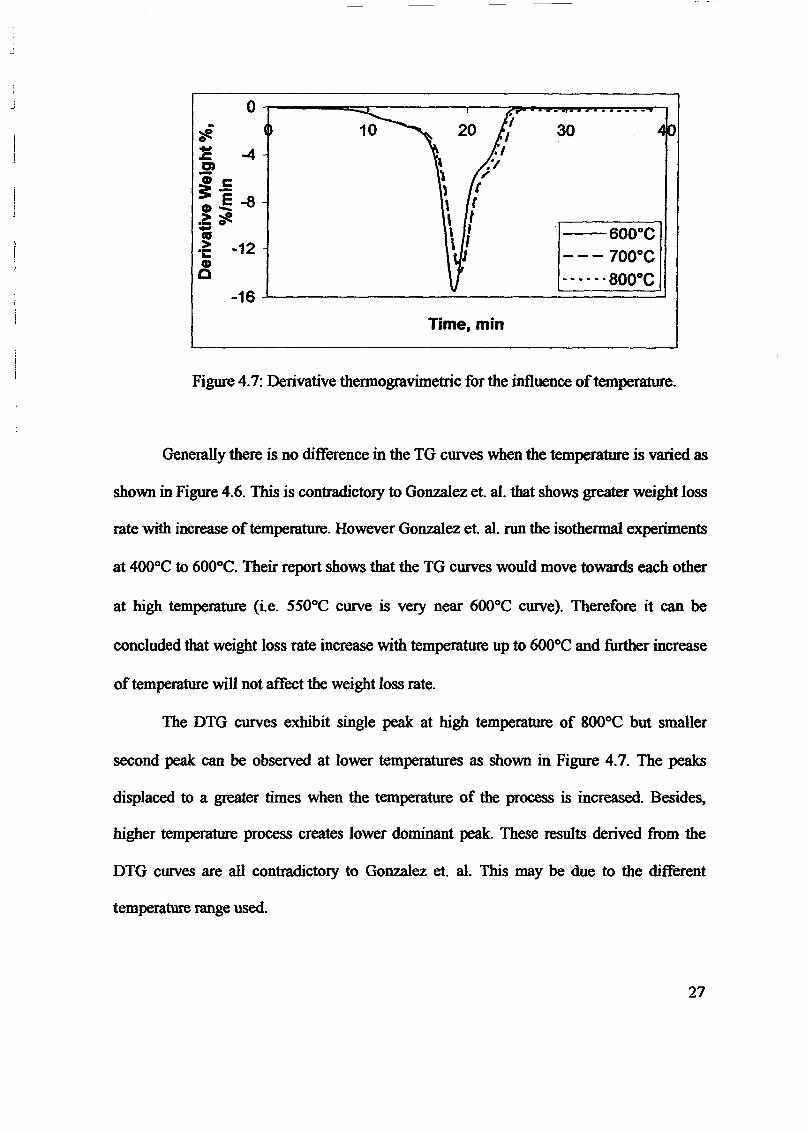
--600Ge--- 700Ge- - •. -. 800Ge
30 4P10o ,....---=:;;::::r------r---;.?I~...-."~I"':'-~- """'7'.~._=-=_~.'7'. ..--,
20 II:,
, :1\ /1 (, t
\ I. I\ ~
V-16 -l- ~:..._.__~~-========..J
J
Time, min
Figure 4.7: Derivative thermogravimetric for the influence oftemperature.
Generally there is no difference in the TG curves when the temperature is varied as
shown in Figure 4.6. This is contradictOIY to Gonzalez et. aI. that shows greater weight loss
rate with increase oftemperature. However Gonzalez et. aI. run the isothermal experiments
at 400°C to 600°C. Their report shows that the TG curves would move towards each other
at high temperature (i.e. 550°C curve is very near 600°C curve). Therefore it can be
concluded that weight loss rate increase with temperature up to 600°C and further increase
of temperature will not affect the weight loss rate.
The DTG curves exhibit single peak at high temperature of 800°C but smaller
second peak can be observed at lower temperatures as shown in Figure 4.7. The peaks
displaced to a greater times when the temperature of the process is increased. Besides,
higher temperature process creates lower dominant peak:. These results derived from the
DTG curves are all contradictory to Gonzalez et. aI. This may be due to the different
temperature range used.
27
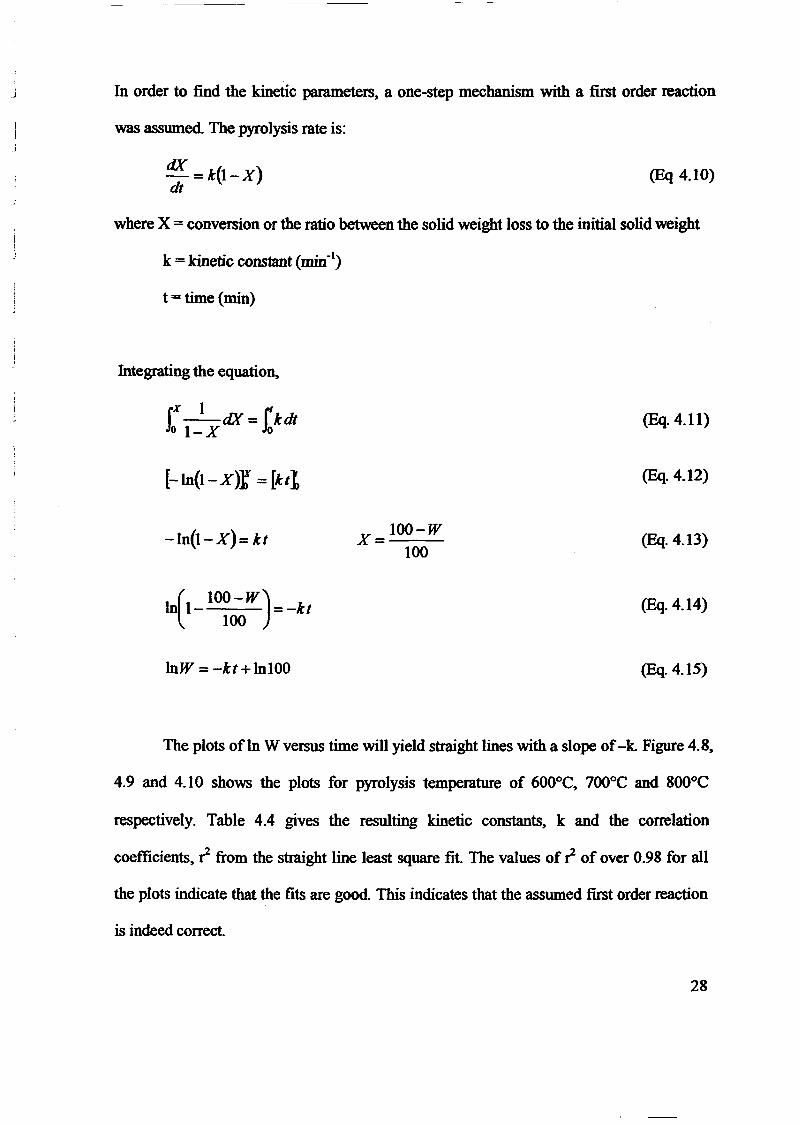
In order to find the kinetic parameters, a one-step mechanism with a fIrst order reaction
was assumed. The pyrolysis rate is:
dX-=k(I-X)dt
(Eq 4.10)
1I
j
where X = conversion or the ratio between the solid weight loss to the initial solid weight
k = kinetic constant (min-I)
t = time (min)
Integrating the equation,
L.t' I L'--dX= kdto I-X 0
[-In(I-x)f = [ktt
-In(I-X)=kt
n( l00-W)I 1- = -kt100
InW =-kt + Inl00
x = _100_-_W_100
(Eq.4.11)
(Eq.4.12)
(Eq.4.13)
(Eq.4.14)
(Eq.4.15)
The plots ofln W versus time will yield straight lines with a slope of-k. Figure 4.8,
4.9 and 4.10 shows the plots for pyrolysis temperature of 600°C, 700°C and 800°C
respectively. Table 4.4 gives the resulting kinetic constants, k and the correlation
coefficients, r from the straight line least square fit. The values of r of over 0.98 for all
the plots indicate that the fits are good. This indicates that the assumed fIrst order reaction
is indeed correct.
28
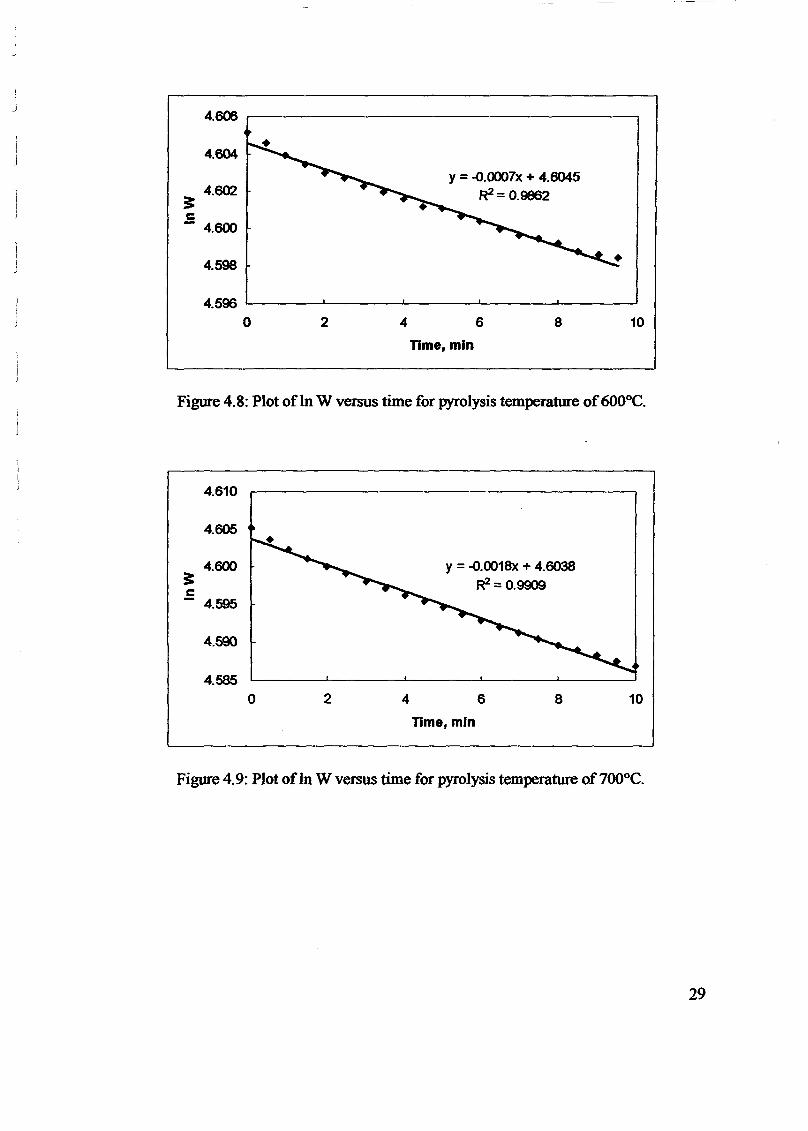
y =-o.OOO7x + 4.6045R2 = 0.9862
J4.606
4.604
4.602~c- 4.600
4.598
4.5960 2 4
TIme, min
6 8 10
Figure 4.8: Plot of In W versus time for pyrolysis temperature of600°C.
y =-o.OO18x + 4.6038W=O.9909
4.610
4.605
4.600~.5
4.595
4.590
4.5850 2 4
Time, min
6 8 10
Figure 4.9: Plot ofIn W versus time for pyrolysis temperature of700°C.
29
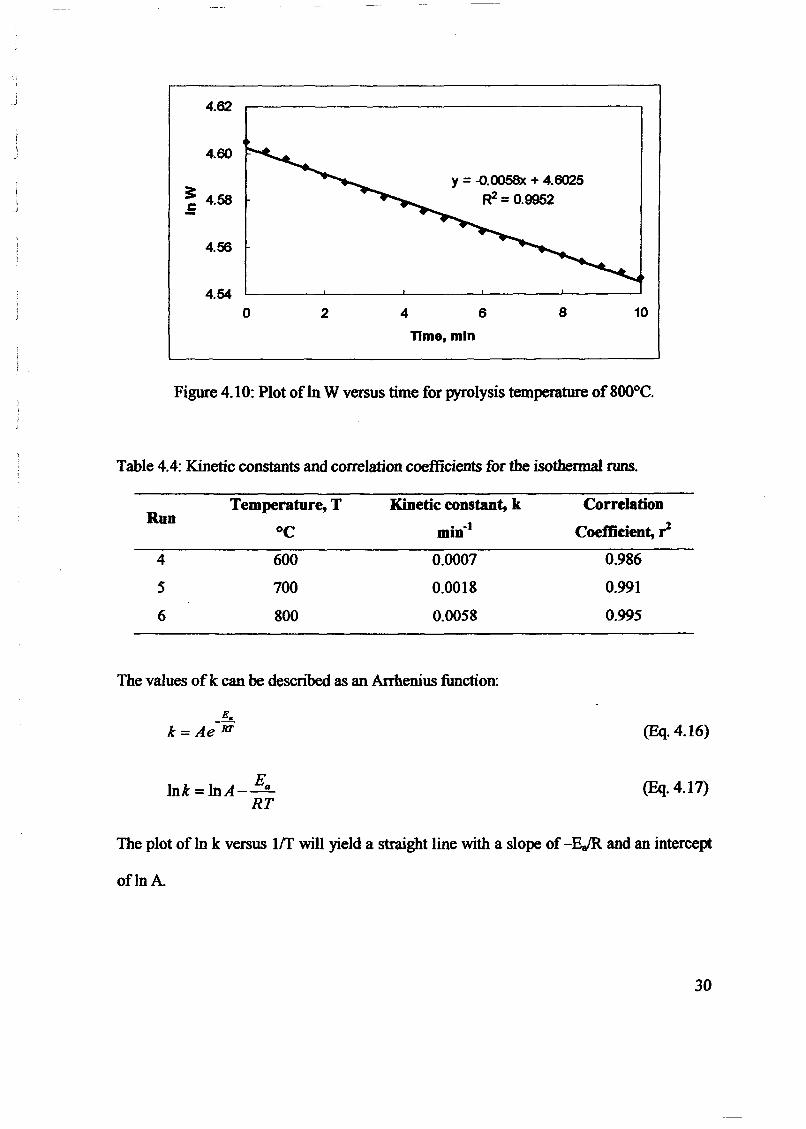
y =-o.OO58x + 4.6025~= 0.9952
j
IJ
4.62
4.60
~.5 4.58
4.56
4.540 2 4
Time. min
6 8 10
Figure 4.10: Plot of In W versus time for pyrolysis temperature of 8()()OC.
Table 4.4: Kinetic constants and correlation coefficients for the isothermal runs.
Temperature, T Kinetic constant, k CorrelationRun
min-l Coeffieient, .-z°C
4 600 0.0007 0.986
5 700 0.0018 0.991
6 800 0.0058 0.995
The values ofk can be described as an Arrhenius function:
_ E.
k= Ae RT
EInk=lnA--a
RT
(Eq.4.16)
(Eq.4.17)
The plot of In k versus Iff will yield a straight line with a slope of -EJR and an intercept
oflnA.
30
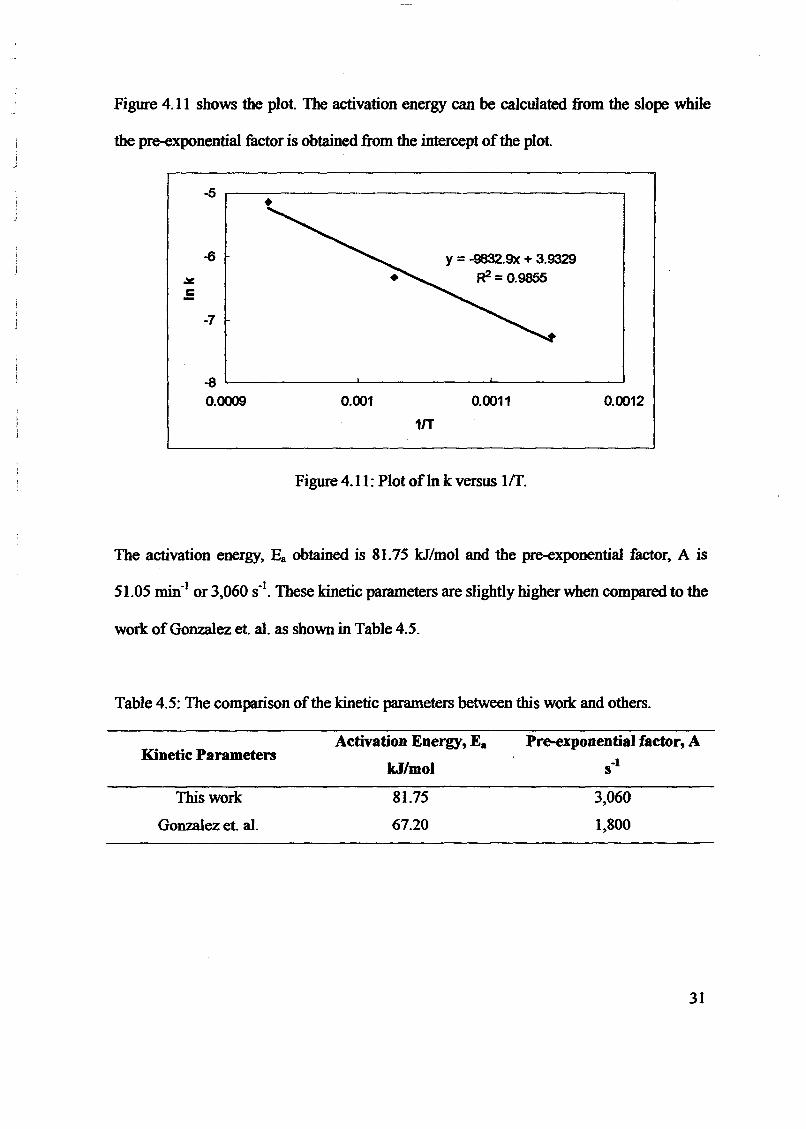
Figure 4.11 shows the plot. The activation energy can be calculated from the slope while
the pre-exponential factor is obtained from the intercept ofthe plot.
-5.-------------------------.•
-7
y =-9832.9x + 3.9329~= 0.9855
0.00120.00110.001-8'---------'--------'----------'0.0009
1JT
Figure 4.11: Plot ofln k versus Ilf.
The activation energy. Ea obtained is 81.75 kJ/mol and the pre-exponential factor. A is
51.05 min-I or 3.060 S-I. These kinetic parameters are slightly higher when compared to the
work ofGonzalez et. a1. as shown in Table 4.5.
Table 4.5: The comparison ofthe kinetic parameters between this woIk and others.
Kinetic ParametersActivation Energy, E.
kJ/mol
Pre-exponential factor, A-1
S
This work
Gonzalez et. at.
81.75
67.20
3.060
1.800
31
1
III
PREPARATION OF ACTIVATED CARBONFROM WASTE TIRES BY PYSIOCBEMICAL
ACTIVATION AND ADSORPTION PERFORMANCE
NADIA DINTI ISA
UNIVERSITI SAINS MALAYSIA2007
ABSTRACT
Accumulation ofwaste tires are increasing every year as the number of vehicles increases.
It has contributed to health and environment problems. Therefore, in this work it is
converted to activated carbon that is beneficial. High value of carbon content in char
produced from waste tires through pyrolisis in the fluidized bed pilot plant was activated
with KOH etching followed by carbon dioxide, C<h gasification (physiochemical
activation). Phenol is applied as the adsorbate to investigate the adsorption capacity.
Further study being conducted to determine total fixed carbon and compositions inside
waste tire, char and produced activated carbon. The best condition of activated carbon
obtained :from this work is at activation temperature 850°C, KOH to char ratio 5 and
activation time 2 hours where the adsorption capacity obtained is 200mglg which is higher
compared to other works.
Keywords: Waste~ Activated carbon, Physiochemical activation, Phenol, Adsorption.
IX
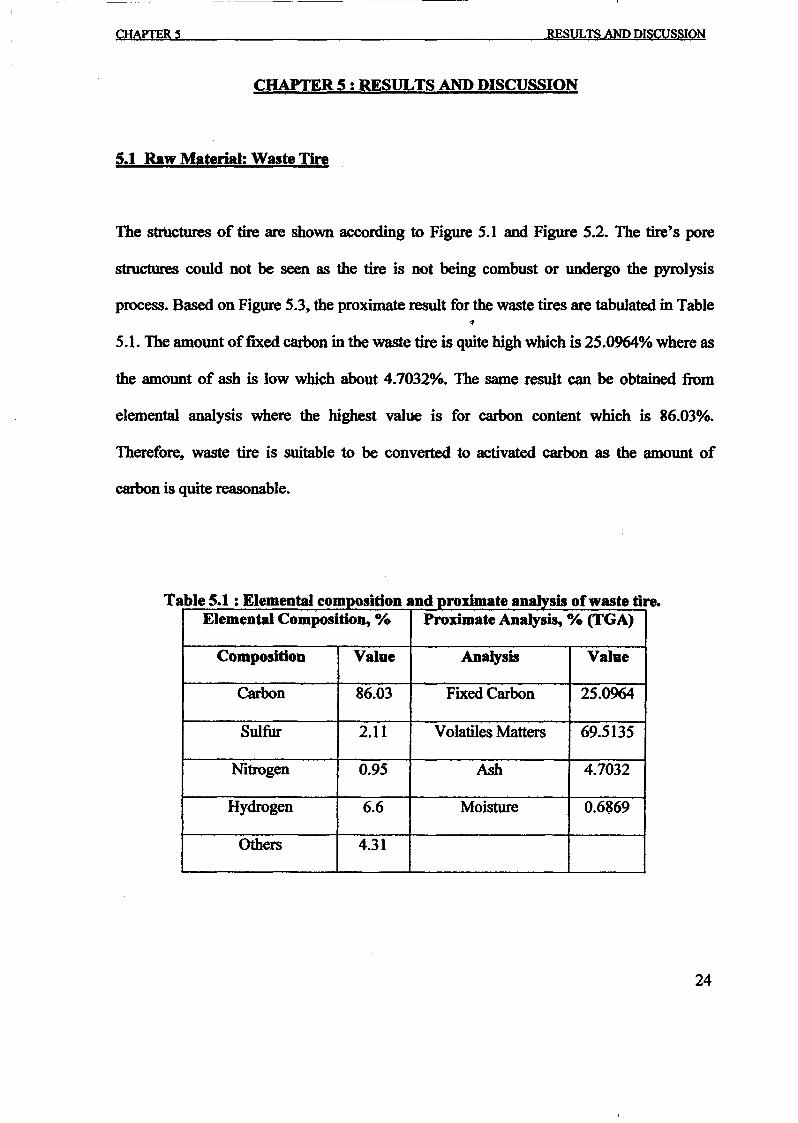
CHAPTERS RESULTS AND DISCUSSION
CHAPTER 5: RESULTS AND DISCUSSION
5.1 Raw Material: Waste Tire
The strUctures of tire are shown according to Figure 5.1 and Figure 5.2. The tire's pore
structures could not be seen as the tire is not being combust or undergo the pyrolysis
process. Based on Figure 5.3, the proximate result for the waste tires are tabulated in Table"
5.1. The amount of fixed carbon in the waste tire is quite high which is 25.0964% where as
the amount of ash is low which about 4.1032%. The same result can be obtained from
elemental analysis where the highest value is for carbon content which is 86.03%.
Therefore, waste tire is suitable to be converted to activated carbon as the amount of
carbon is quite reasonable.
reohie 5.1 : Elemental composition and proximate analysis ofwaste tiElemental Composition, % Proximate Analysis, % (TGA)
Composition Value Analysis Value
Carbon 86.03 Fixed Carbon 25.0964
Sulfur 2.11 Volatiles Matters 69.5135
Nitrogen 0.95 Ash 4.1032
Hydrogen 6.6 Moisture 0.6869
Others 4.31
Ta
24
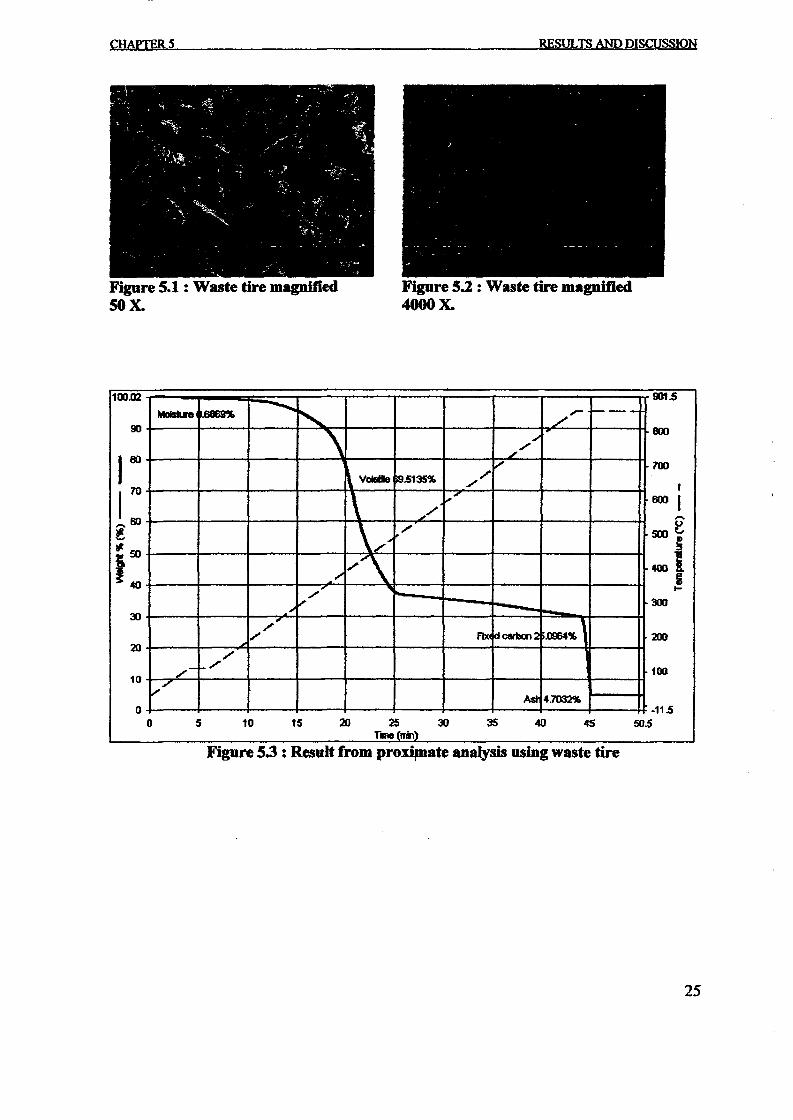
CHAPTERS
Figure 5.1 : Waste tire magnifiedSOx.
RESULTS AND DISCUSSION
Figure 5.2 : Waste tire magnified4000 X.
loo.Q2 901.5
MoistIn .6889'Yo--.....~ /-
1----
90
\BOO
/~
I&)
../V 700
\ VoIIl6e ~5135~ /'./ I
1
70
\ ",.' BOO IJ/ .....,...60
\~//' 500~!
it 50
4001~ /''\141) ," B./' ..... t-
.'".,. 300
30/'
,/' rOO dcarbtn2 .Q964~ 200
20/'
/-_/
10010 ,,"
Ast 4.70321(,0 ·11.5
0 5 10 15 20 25 30 35 40 45 505Tlne(mi'l)
Figure 5.3 : Result from proxipaate analysis using waste tire
25
CHAPTERS
5.2 Production of char using fluidized bed pUot plant
RESYUS AND DISCUSSION
The tempemture used to produce char is about 800De and the time for pyrolysis reaction is
about 30 minutes. After 30 minutes reaction of 500 gram waste tires, the yield of char is
about 26% and yield of light hydrocarbon is about 22%. Another 52% is collected as
water, oil and gaseous that released to the atmosphere. Therefore, the production of char
from this work is comparable with pyrolysis result using fluidized bed gasifier where the
yield of char is in the range of 24% to 37% [Leung and Wang, 2003] and using batch
tubular fixed bed reactor where the yield of char is 33% to 38% [Brady et aI., 1995]. The
percentage yield ofchar is calculated based on equation 1.
Yield ofchar =Weight ofchar produced x 100Weight oftire fed
(1)
According to Figure 5.4 (as indicated by white arrow), the structure ofchar from waste tire
is highly porous and the pores are distributed uniformly. The size of each pore is about
10.68 micron meter. The smaller the pore size, the higher the surface area and adsorption
can occur effectively.
Light hydrocarbon is collected from the second cyclone (Figure 4.2) and the pore
structures being tested. The structures of light hydrocarbon are fluffy and very light
(Figure 5.5). The probability of high pore structure is too low because the hydrocarbon
produced is nearly formed into ash. Therefore, it is not suitable to be further activated to
form activated carbon.
26
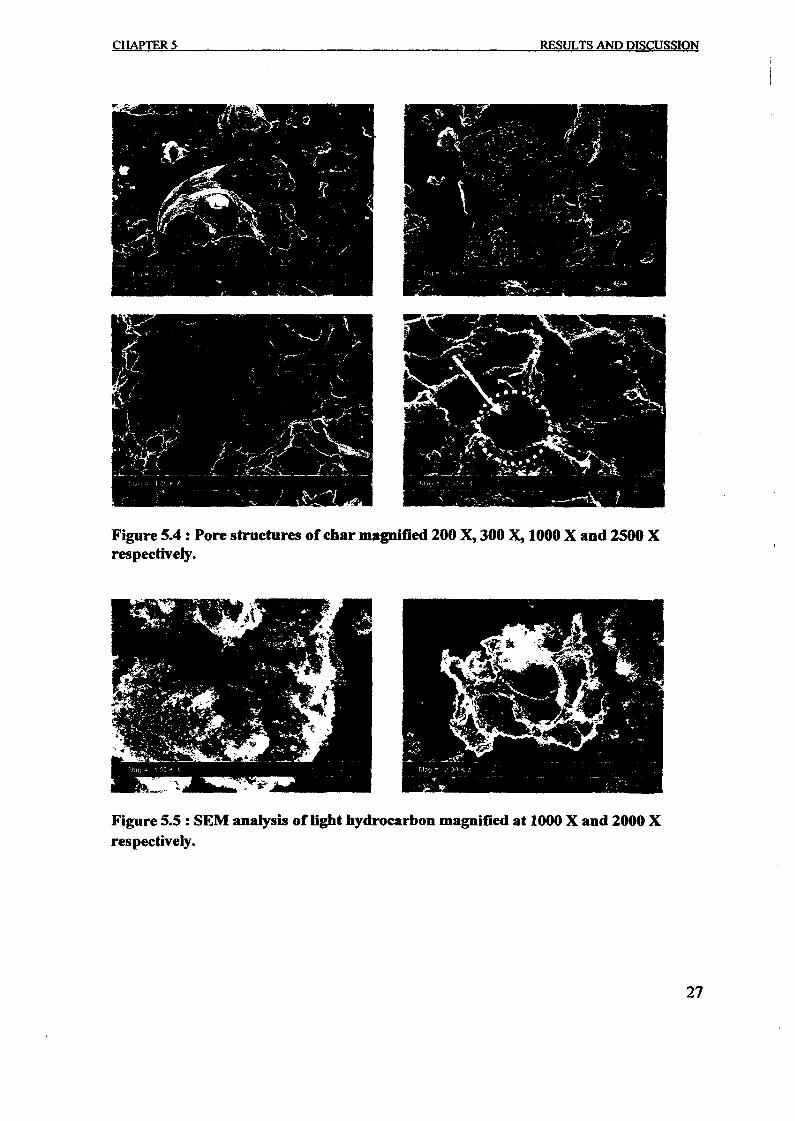
CHAPTER 5 RESULTS AND DISCUSSION
Figure 5.4 : Pore structures of char magnified 200 X, 300 X, 1000 X and 2500 Xrespectively.
Figure 5.5: SEM analysis of light hydrocarbon magnified at 1000 X and 2000 Xrespectively.
27
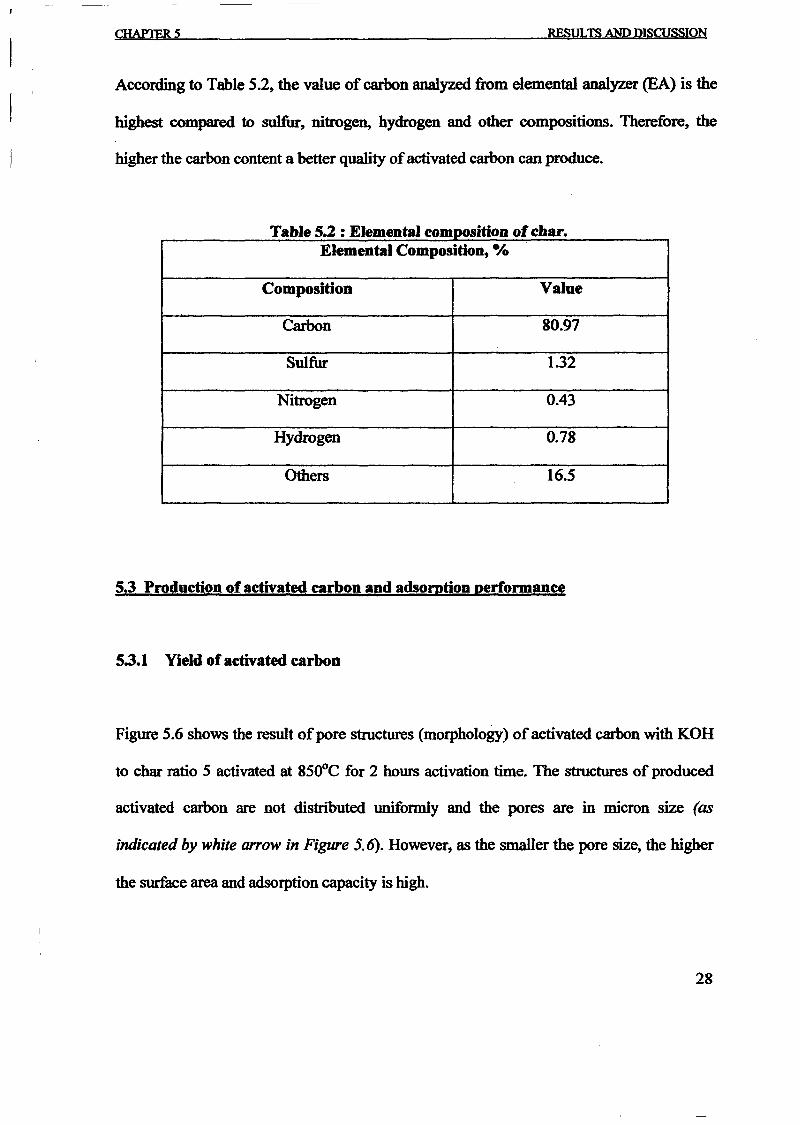
CHAPTERS RESULTS AND DISCUSSION
According to Table 5.2t the value of carbon analyzed from elemental analyzer (EA) is the
highest compared to sulfurt nitroge~ hydrogen and other compositions. Thereforet the
higher the carbon content a better quality ofactivated carbon can produce.
f h°titalT bl S.2 EIa e . emen comPOSJ on 0 car•.Elemental Composition, %
Composition Value
Carbon 80.97
Sulfur 1.32
Nitrogen 0.43
Hydrogen 0.78
Others 16.5
5.3 Production of activated carbon and adsorption performance
5.3.1 Yield of activated carbon
Figure 5.6 shows the result ofpore structures (morphology) ofactivated carbon with KOH
to char ratio 5 activated at 850°C for 2 hours activation time. The structures of produced
activated carbon are not distributed unifonnly and the pores are in micron size (as
indicated by white arrow in Figure 5.6). However, as the smaller the pore sizet the higher
the surface area and adsorption capacity is high.
28
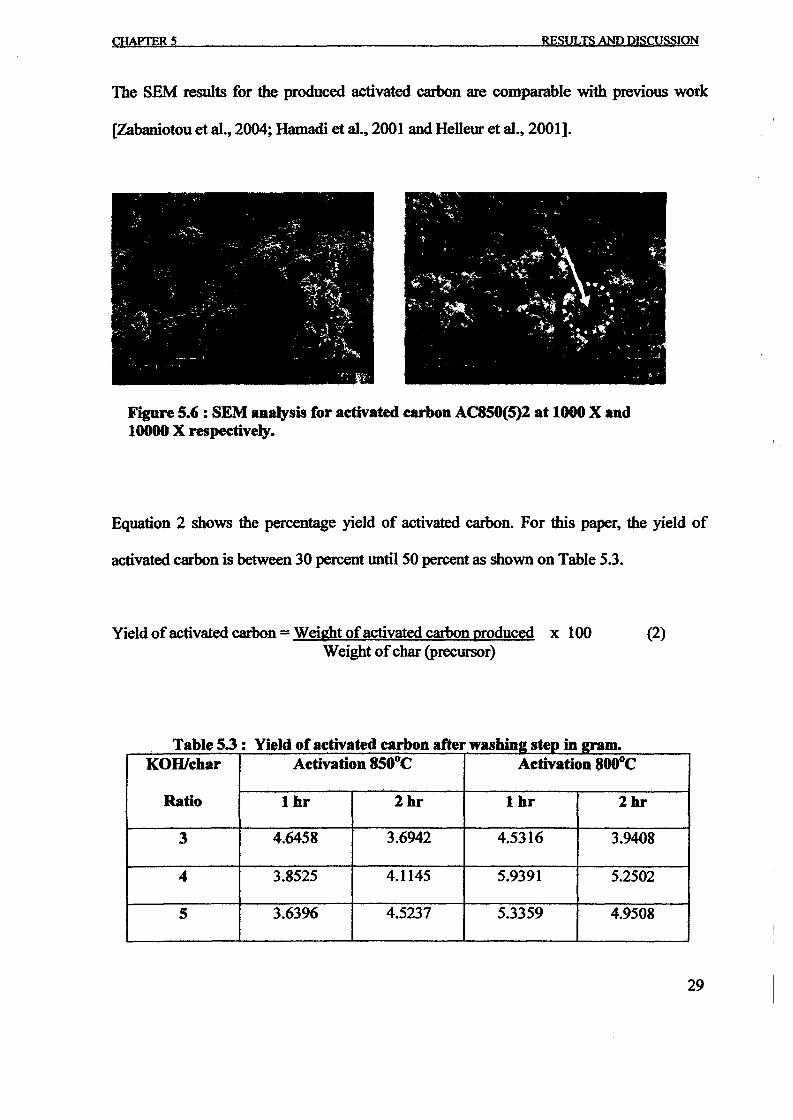
CHAPTERS RESULTS AND DISCUSSION
The SEM results for the produced activated carbon are comparable with previous work
[Zabaniotou et at., 2004; Hamadi et at., 2001 and Helleur et at., 2001].
Figure 5.6 : SEM analysis for activated carbon AC850(5)2 at 1000 X and10000 X respectively.
Equation 2 shows the percentage yield of activated carbon. For this paper, the yield of
activated carbon is between jO percent until 50 percent as shown on Table 5.3.
Yield ofactivated carbon =Weight ofactivated carbon produced x 100 (2)Weight ofchar (precursor)
T hI 5.3 Y· Id f tiv d bo It hiDa e . Ie o ae ate ear Da erwas le: step m 2nlm..KOHlehar AetivatioD 850°C Aetivation 800°C
Ratio 1 hr 2hr 1 hr 2hr
3 4.6458 3.6942 4.5316 3.9408
4 3.8525 4.1145 5.9391 5.2502
5 3.6396 4.5237 5.3359 4.9508
29
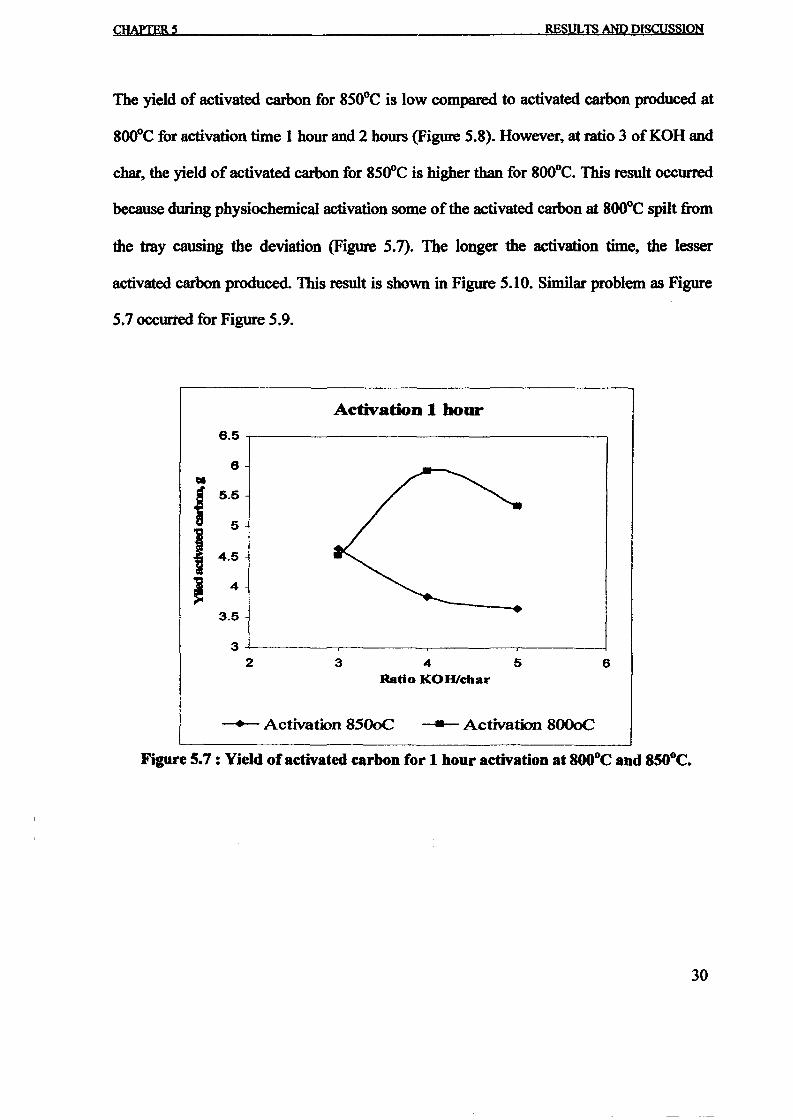
CHAPTERS RESULTS AND DISCUSSION
The yield of activated carbon for 850°C is low compared to activated carbon produced at
800°C for activation time 1 hour and 2 hours (Figure 5.8). However, at ratio 3 ofKOH and
char, the yield of activated carbon for 850°C is higher than for 800°C. This result occurred
because during physiochemical activation some ofthe activated carbon at 800°C spilt from
the tray causing the deviation (Figure 5.7). The longer the activation time, the lesser
activated carbon produced. This result is shown in Figure 5.10. Similar problem as Figure
5.7 occurred for Figure 5.9.
Activation 1 bour
6.5
6til
f 5.5
5
I 4.5
J 4
3.5
32 3 4 5 6
Ratio KOHlc:har
-+- Activation 8500C --- Activation 8000C
Figure 5.7 : Yield of activated carbon for 1 hour activation at 8000e and 850oe.
30
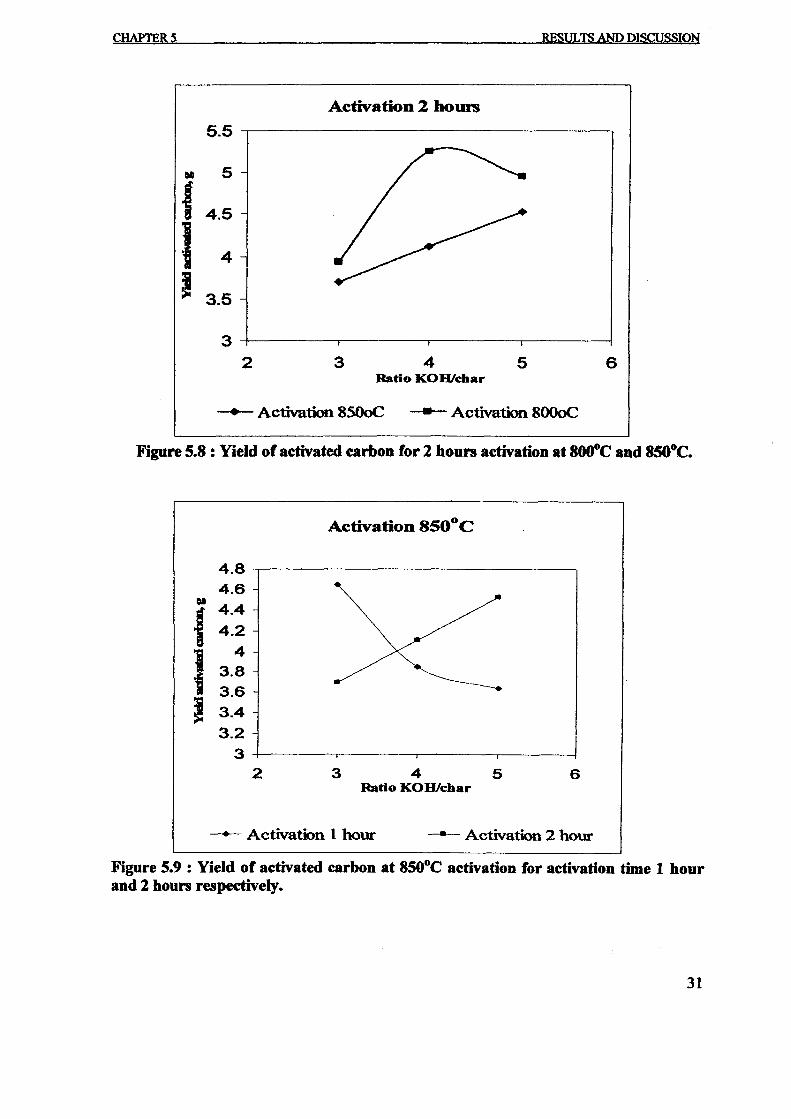
CHAPTER 5 RESULTS AND DISCUSSION
Activation 2 hours
5.5
lllI 5
f 4.5
I 4
I 3.5
32 3 4 5 6
Ratio KOHlehar
-+- Activation 8500C --- Activation 8000C
Figure 5.8 : Yield of activated carbon for 2 hours activation at 800°C and 850°C.
Activation 850°C
63 4 5Ratio KOHlehar
4.8 .--------------------,
4.6lllI
f4.4
4.2
I 3.:3.6
~ 3.43.2
3+------,-------,------r------j
2
- Activation 1 hour - Activation 2 hour
Figure 5.9 : Yield of activated carbon at 850°C activation for activation time 1 hourand 2 houn respectively.
31
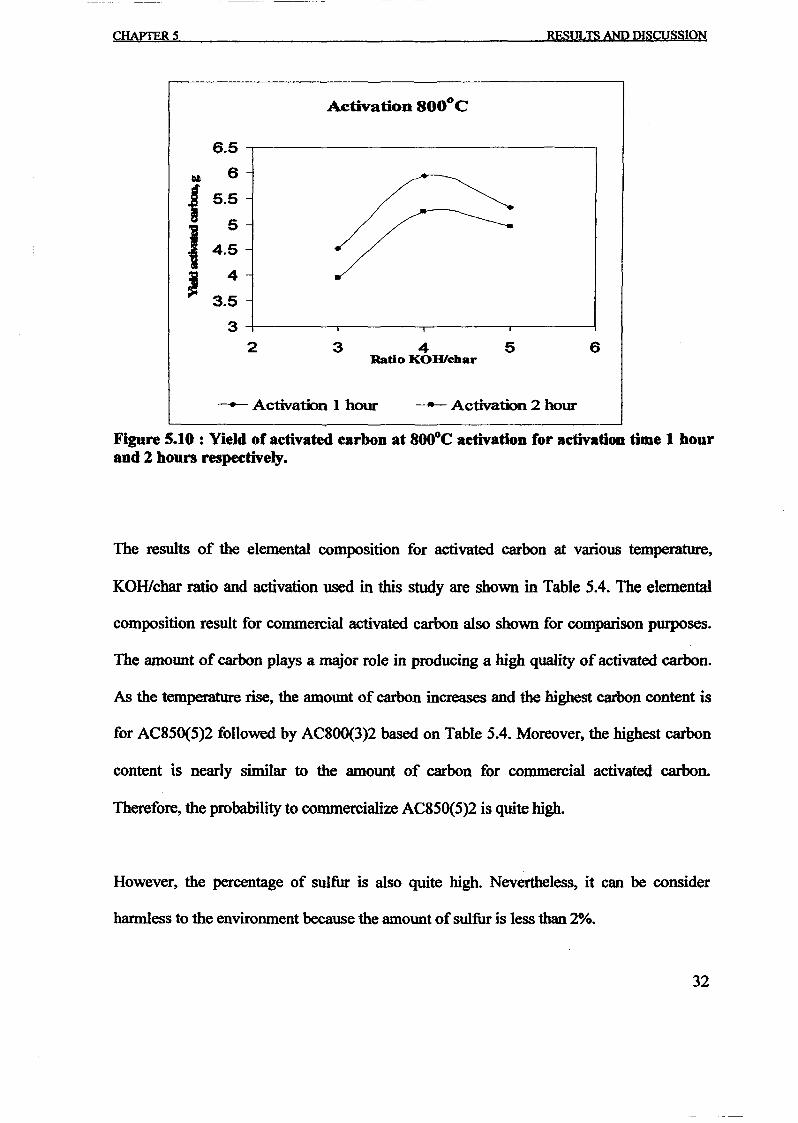
CHAPTERS RESULTS AND DISCUSSION
6.5 .....-------------------,
De 6f 5.5
I 4.:I 4
3.5
3-+-----..----....-----~-------i
2 345Ratio KOHlehar
6
- Activation 1 hour - Activation 2 hour
Figure S.lO : Yield of activated carbon at 800°C activation for activation time 1 hourand 2 hours respectively.
The results of the elemental composition for activated carbon at various temperature,
KOH/char ratio and activation used in this study are shown in Table 5.4. The elemental
composition result for commercial activated carbon also shown for comparison purposes.
The amount of carbon plays a major role in producing a high quality of activated carbon.
As the temperature rise, the amount of carbon increases and the highest carbon content is
for AC850(5)2 followed by AC800(3)2 based on Table 5.4. Moreover, the highest carbon
content is nearly similar to the amount of carbon for commercial activated carbon.
Therefore, the probability to commercialize AC850(5)2 is quite high.
However, the percentage of sulfur is also quite high. Nevertheless, it can be consider
harmless to the environment because the amount ofsulfur is less than 2%.
32
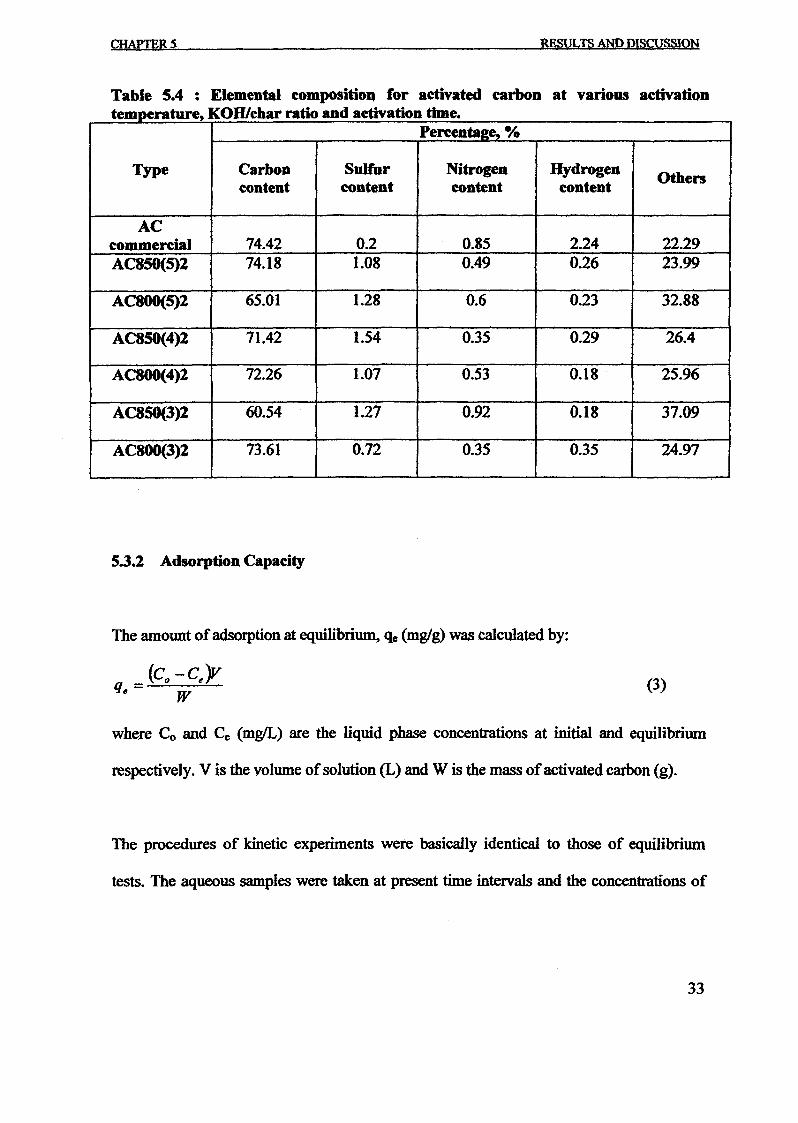
CHAPTERS MSULTS AND DISCUSSION
Table 5.4 : Elemental composition for activated carbon at various activatioDt ture KOID h ti d etiv tio timempera , carra Dan a a D eo
Percenta2e, %
Type Carbon Sulfur Nitrogen Hydrogen Otherscontent content content content
ACcommercial 74.42 0.2 0.85 2.24 22.29AC850(5)Z 74.18 1.08 0.49 0.26 23.99
AC8OO(5)2 65.01 1.28 0.6 0.23 32.88
AC850(4)2 71.42 1.54 0.35 0.29 26.4
AC800(4)2 72.26 1.07 0.53 0.18 25.96
AC85O(3)Z 60.54 1.27 0.92 0.18 37.09
AC800(3)2 73.61 0.72 0.35 0.35 24.97
5.3.2 AdsorptioD Capacity
The amount ofadsorption at equilibrium, qe (mglg) was calculated by:
(3)
where Co and Ce (mgIL) are the liquid phase concentrations at initial and equilibrium
respectively. V is the volume ofsolution (L) and W is the mass ofactivated eatbon (g).
The procedures of kinetic eXPeriments were basically identical to those of equilibrium
tests. The aqueous samples were taken at present time intervals and the concentrations of
33
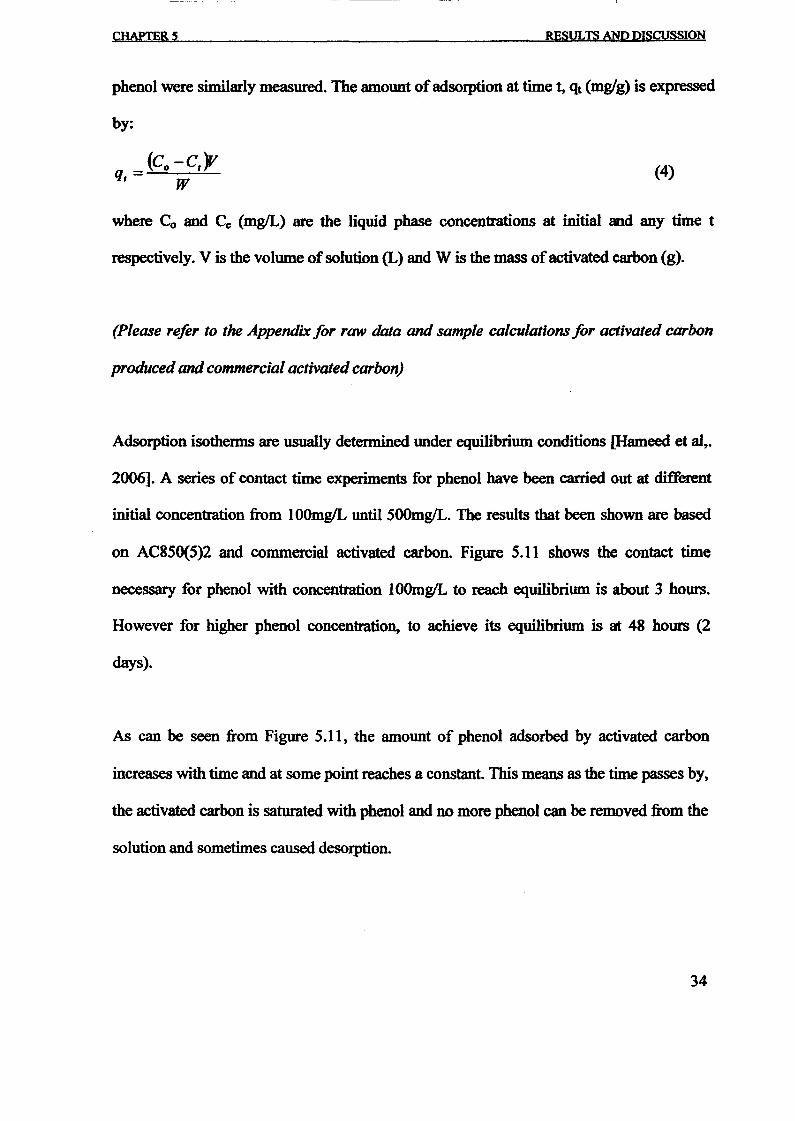
CHAPTERS RESULTS AND DISCUSSION
phenol were similarly measured. The amount ofadsorption at time t, qt (mglg) is expressed
by:
(4)
where Co and Ce (mg/L) are the liquid phase concentrations at initial and any time t
respectively. V is the volume ofsolution (L) and W is the mass ofaetivated carbon (g).
(please refir to the Appendix for raw data and sample calculations for activated carbon
produced and commercial activated carbon)
Adsorption isotherms are usually determined under equilibrium conditions [Hameed et al~.
2006]. A series of contact time experiments for phenol have been carried out at different
initial concentration from IOOmg/L until 500mgIL. The results that been shown are based
on AC850(5)2 and commercial activated carbon. Figure 5.11 shows the contact time
necessary for phenol with concentration l00mgIL to reach equilibrium is about 3 hours.
However for higher phenol concentratio~ to achieve its equilibrium is at 48 hours (2
days).
As can be seen from Figure 5.1 1, the amount of phenol adsorbed by activated carbon
increases with time and at some point reaches a constant. This means as the time passes by~
the activated carbon is saturated with phenol and no more phenol can be removed from the
solution and sometimes caused desorption.
34
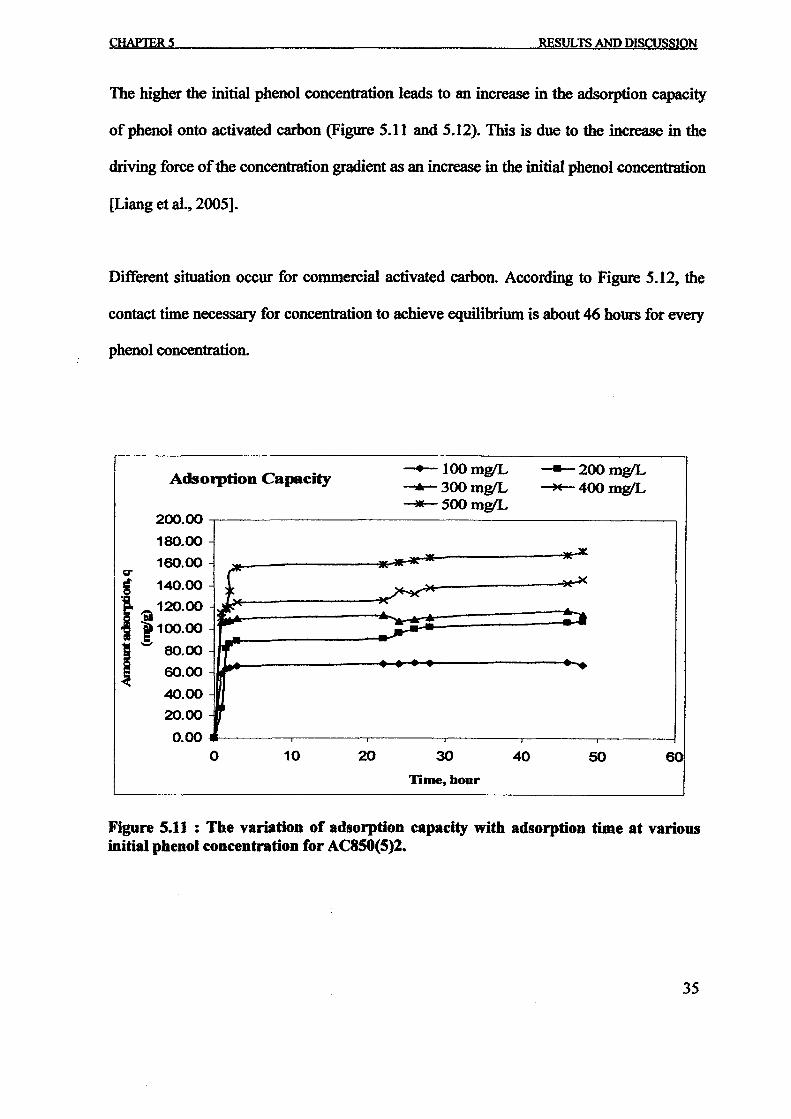
CHAPTERS RESULTS AND DISCUSSION
The higher the initial phenol concentration leads to an increase in the adsorption capacity
of phenol onto activated carbon (Figure 5.11 and 5.12). This is due to the increase in the
driving force ofthe concentration gradient as an increase in the initial phenol concentration
[Liang et al., 2005].
Different situation occur for commercial activated carbon. According to Figure 5.12, the
contact time necessary for concentration to achieve equilibrium is about 46 hours for every
phenol concentration.
- ~
,-.x
~......~~
~"""""-- -~-~
- ~...~.... ....
Adsotption Capacity
200.00
180.00
160.00r;;;r
g 140.00
, -a 120.00
~ 1100.00
1 '= 80.00
~ 60.00
40.00
20.00
0.00o 10 20
-+-lOOmgIL-.Ir- 300 mgIL--.- 500 mgIL
30
Time,bour
40
---200mgIL--*- 400 mgIL
50 60
Figure 5.11 : The variation of adsorption capacity with adsorption time at variousinitial phenol concentration for AC850(5)2.
35
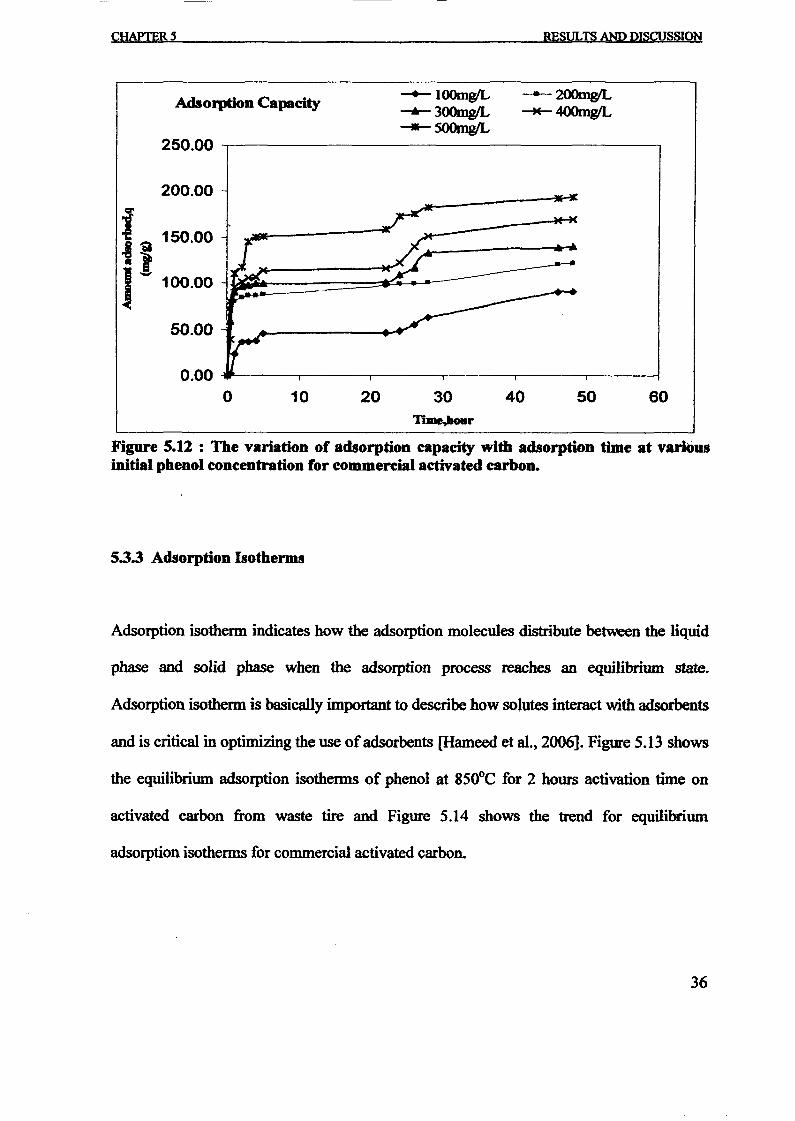
CHAPTER' RESULTS AND DISCUSSION
Adsorption Capacity -'-100mglL --200mg1L-.- 300JnwL -M-4OOmg/L---SOOmgIL
250.00
200.00
f 150.00,89
j~ 100.00
50.00
0.000 10 20 30 40 50 60
1bne,hour
Figure 5.12 : The variation of adsorption capacity with adsorption time at vari~usinitial phenol concentration for commercial activated carbon.
5.3.3 Adsorption Isotherms
Adsorption isotherm indicates how the adsorption molecules distribute between the liquid
phase and solid phase when the adsorption process reaches an equilibrium state.
Adsorption isotherm is basically important to describe how solutes interact with adsorbents
and is critical in optimizing the use ofadsorbents [Hameed et al.~ 2006]. Figure 5.13 shows
the equilibrium adsorption isotherms of phenol at 850°C for 2 hours activation time on
activated carbon from waste tire and Figure 5.14 shows the trend for equilibrium
adsorption isotherms for commercial activated carbon.
36
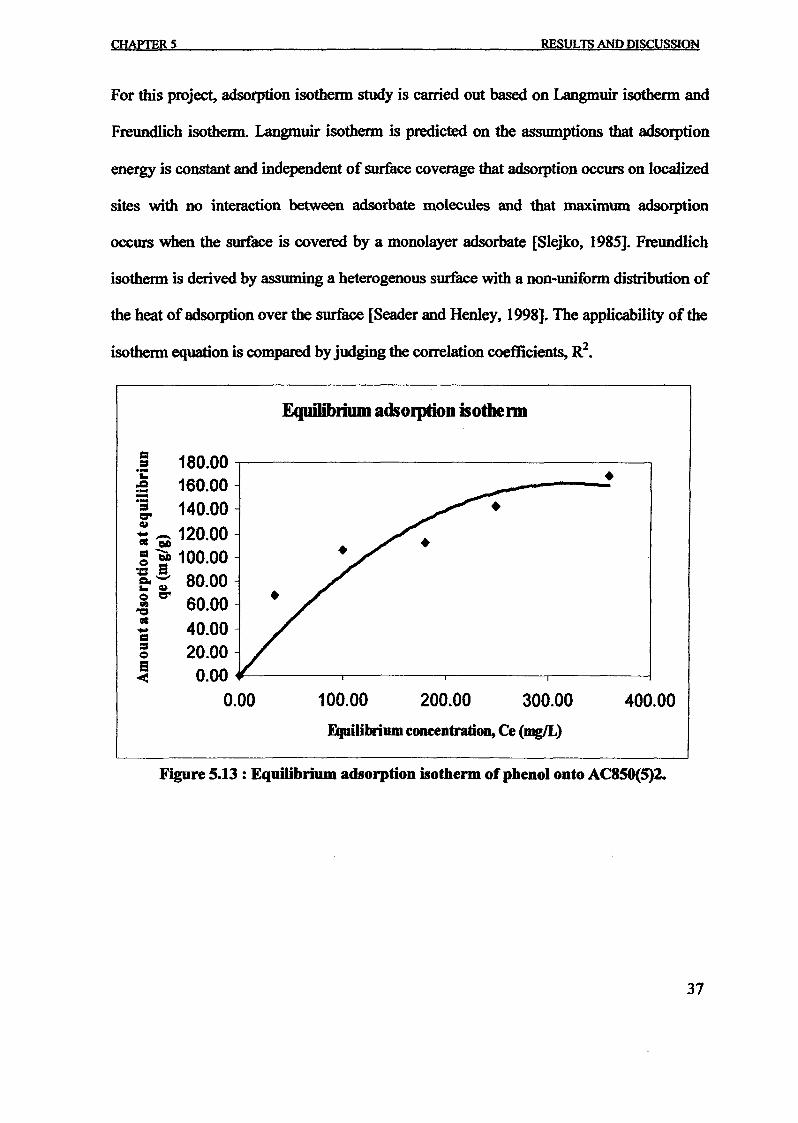
CHAPTERS RESULTS AND DISCUSSION
For this project, adsorption isothenn study is carried out based on Langmuir isothenn and
Freundlich isotherm. Langmuir isotherm is predicted on the assumptions that adsorption
energy is constant and independent of surface coverage that adsorption occurs on localized
sites with no interaction between adsorbate molecules and that maximum adsorption
occurs when the surface is covered by a monolayer adsorbate [Slejko, 1985]. Freundlich
isothenn is derived by assuming a heterogenous surface with a non-unifonn distribution of
the heat of adsorption over the surface [Seader and Henley, 1998]. The applicability of the
isotherm equation is compared by judging the correlation coefficients, R2•
Equilibrium adsotption isothenn
400.00
•
300.00200.00100.00
•
180.00 ,---------------------,160.00
1:1::J.-...e.-':' 140.00GI
.. ~ 120.00: ~e 100.00~eo ';' 80.00~ co 60.00as~ 40.00g 20.00~ 0.00 #------.--------,---------,,-------1
0.00
Equilibrium concentration, Ce (mg/L)
Figure 5.13 : Equilibrium adsorption isotherm ofphenol onto AC85O(5)2.
37
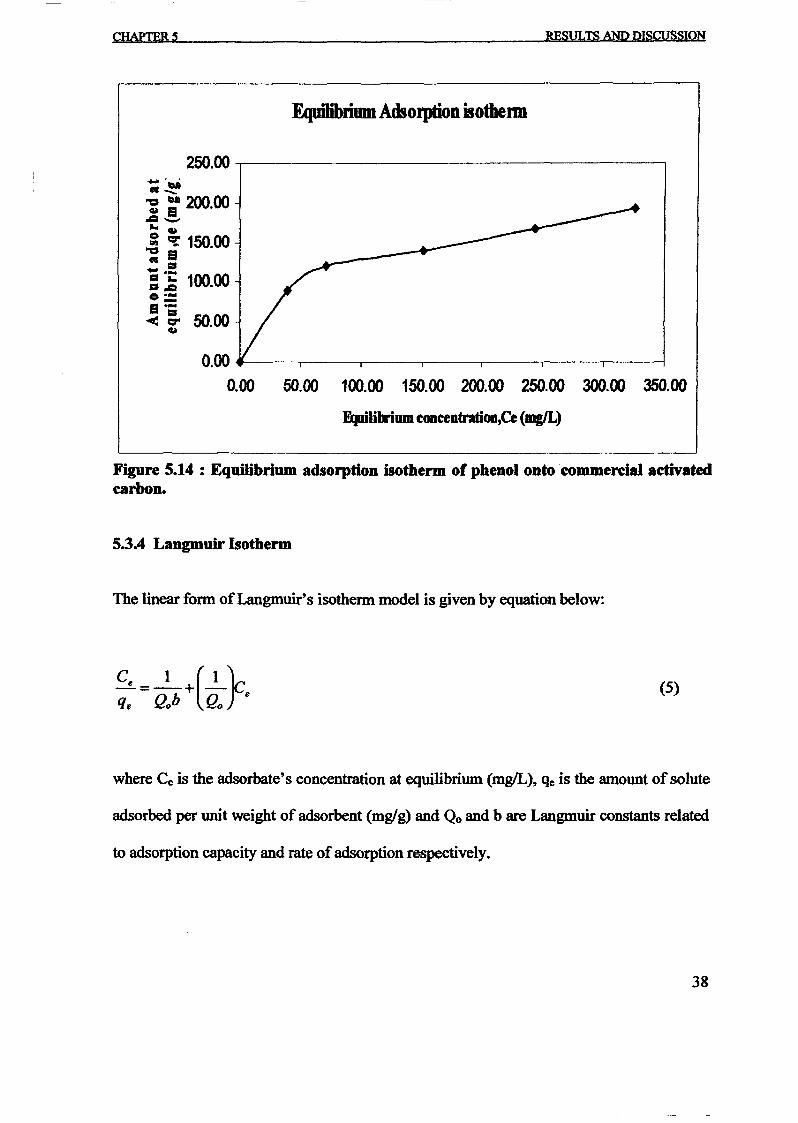
CHAPTER' RESULTS AND DISCUSSION
Equilibrium Adsorption isothenn
250.00 .,...---------------------,-' .CII~
~ S200.00~.. ~
.; ~ 150.00CII EI- .!!: ~ 100.000:a .-< :. 5000
~ .
0.00 ...---,------,-----,----.-----,------,-----1
0.00 50.00 100.00 150.00 200.00 250.00 300.00 350.00
FJ,dlilrium cODcentJ'atiOll,Ce (mgIL)
Figure 5.14 : Equilibrium adsorption isotherm of phenol onto commercial aetivatedcarbon.
5.3.4 Langmuir Isotherm
The linear form ofLangmuir's isotherm model is given by equation below:
(5)
where Ce is the adsorbate's concentration at equilibrium (mgIL), qc is the amount ofsolute
adsorbed per unit weight of adsorbent (mglg) and Qo and b are Langmuir constants related
to adsorption capacity and rate ofadsorption respectively.
38
_I
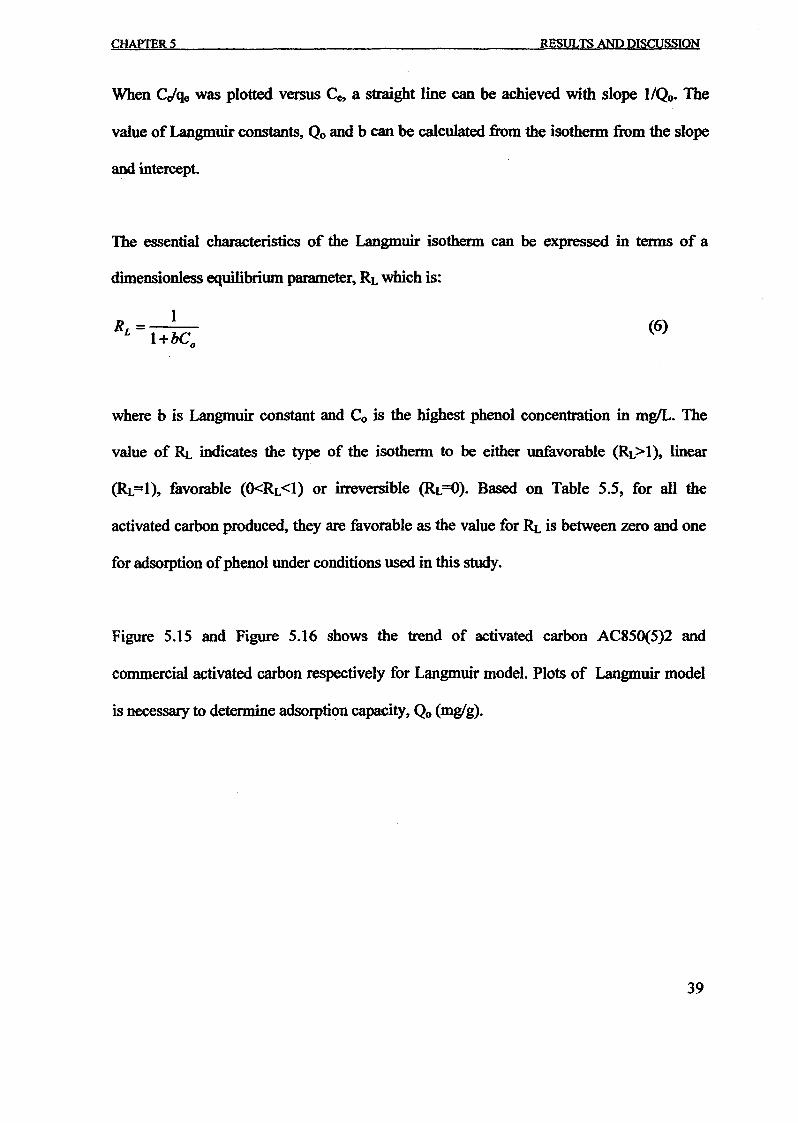
CHAPTERS RESULTS AND DISCUSSION
When CJqe was plotted versus Cc, a straight line can be achieved with slope I/Qo. The
value of Langmuir constants, Qo and b can be calculated from the isotherm from the slope
and intercept.
The essential characteristics of the Langmuir isotherm can be expressed in terms of a
dimensionless equilibrium parameter, RL which is:
R _ IL -l+bC
o
(6)
where b is Langmuir constant and Co is the highest phenol concentration in mg/L. The
value of Rr. indicates the type of the isotherm to be either unfavorable <RL>1), linear
<RL=1), favorable (O<RL<l) or irreversible (RL=O). Based on Table 5.5, for all the
activated carbon produced, they are favorable as the value for RL is between zero and one
for adsorption ofphenol under conditions used in this study.
Figure 5.15 and Figure 5.16 shows the trend of activated carbon AC850(5)2 and
commercial activated carbon respectively for Langmuir model. Plots of Langmuir model
is necessary to determine adsorption capacity, Qo (mglg).
39
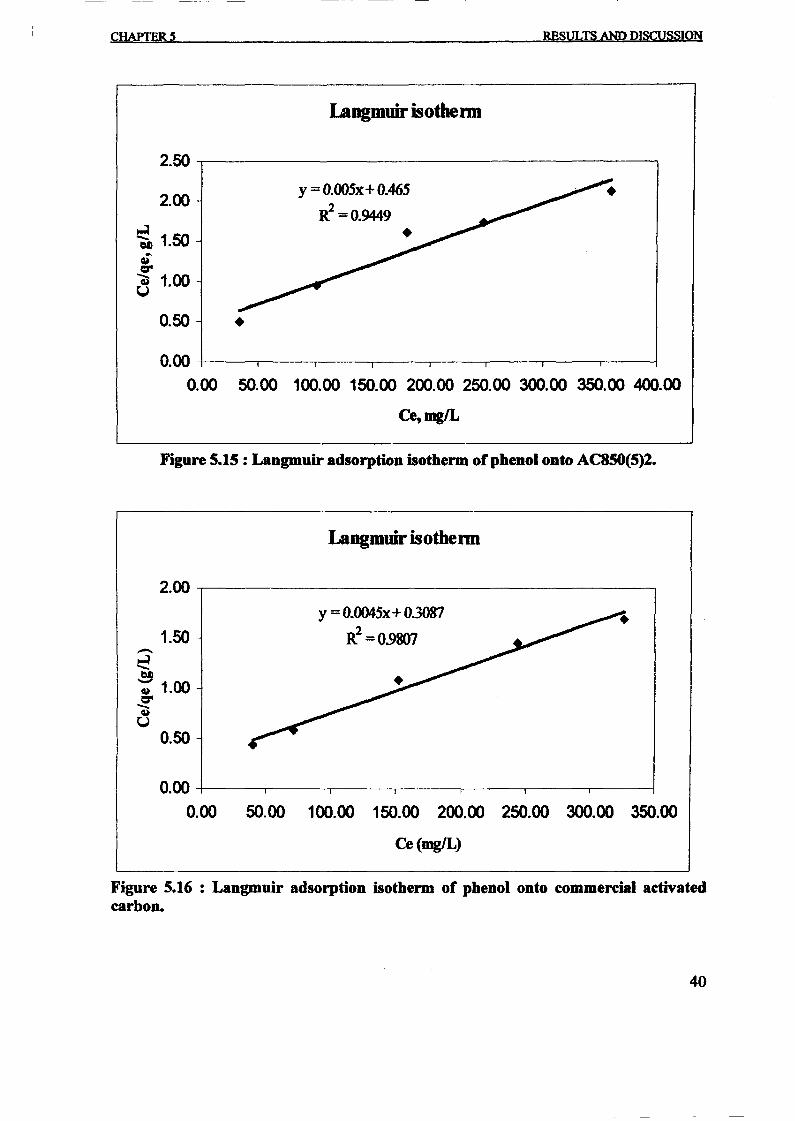
CHAPTERS
langmuir isothelUl
RESULTS AND DISCUSSION
2.50 -y--------------------------.,
2.00
0.50 •
y = 0.OO5x+ 0.465
~=O.9449
0.00 +-------,---,---.----.---------,---.----,..-----1
0.00 50.00 100.00 150.00 200.00 250.00 300.00 350.00 400.00
Ce,mglL
Figure 5.15 : Langmuir adsorption isotherm of phenol onto AC8SO(S)2.
Langmuir isothetm
2.00 -,--------------------------,
1.50-~~~ 1.00{U
0.50
y =0.0045x+ 0.3087
R2 =0.9807
0.00 +----,--------,-----r------,----.------r-------l
0.00 50.00 100.00 150.00 200.00 250.00 300.00 350.00
Ce(mgIL)
Figure 5.16 : Langmuir adsorption isotherm of phenol onto commereial activatedcarbon.
40
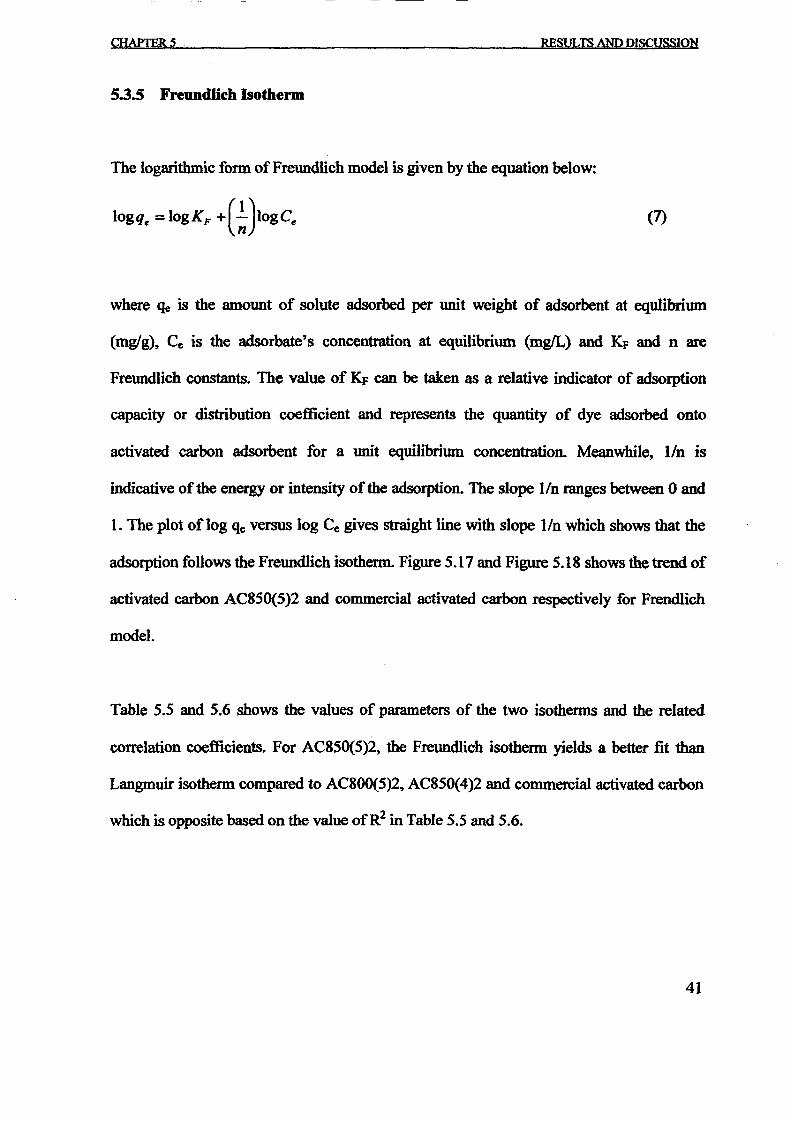
CHAPTERS
5.3.5 Freundlich Isotherm
RESULTS AND DISCUSSION
The logarithmic form ofFreundlich model is given by the equation below:
logqe = 10gKF +(~}OgCe (1)
where qe is the amount of solute adsorbed per unit weight of adsorbent at equlibriwn
(mglg)~ Ce is the adsorbate's concentration at equilibrium (mgIL) and ICF and n are
Freundlich constants. The value of KF can be taken as a relative indicator of adsorption
capacity or distribution coefficient and represents the quantity of dye adsorbed onto
activated carbon adsorbent for a unit equilibrium concentration. Meanwhile, lIn is
indicative of the energy or intensity of the adsorption. The slope lin ranges between 0 and
1. The plot of log qe versus log Ce gives straight line with slope lin which shows that the
adsorption follows the Freundlich isotherm. Figure 5.17 and Figure 5.18 shows the trend of
activated carbon AC850(5)2 and commercial activated carbon respectively for Frendlich
model.
Table 5.5 and 5.6 shows the values of parameters of the two isotherms and the related
correlation coefficients. For AC850(5)2, the Freundlich isotherm yields a better fit than
Langmuir isotherm compared to AC800(5)2, AC850(4)2 and commercial activated carbon
which is opposite based on the value ofR2 in Table 5.5 and 5.6.
41
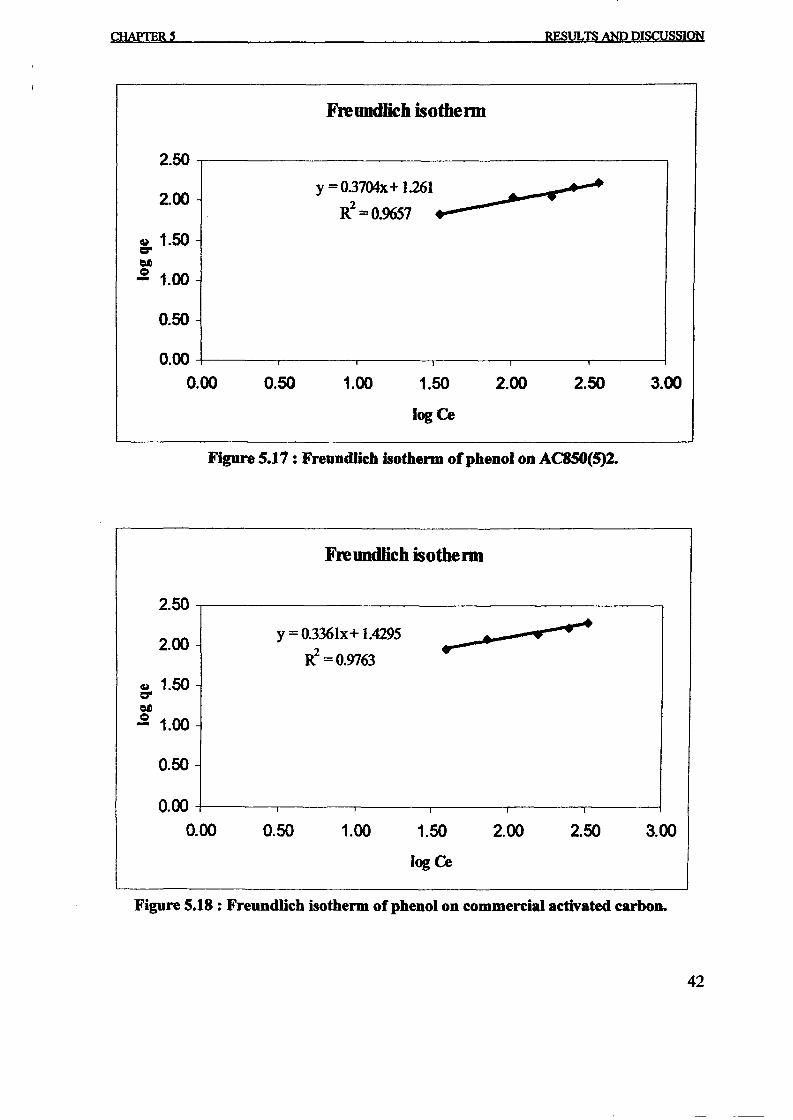
CHAPTERS RESULTS AND DIscuSIDON
Freundlich isotherm
y =0.3704x+ 1261
R2
==0.9657
2.50
2.00
~ 1.50="~C>
1.00-0.50
0.00
0.00 0.50 1.00 1.50
logCe
2.00 2.50 3.00
Figure 5.17: Freundlich isotherm orphenoJ on AC8SO(5)2.
Freundlich isotherm
2.50 -,----------------------,
2.00y =0.3361x+ 1.4295
R2 =0.9763• • '....
~ 1.50r:r~
,.g 1.00
0.50
3.002.502.001.50
logCe
1.000.50
0.00 +-------,---.------.-------,-----,------1
0.00
Figure S.18 : Freundlich isotherm or phenol on commercial activated carbon.
42
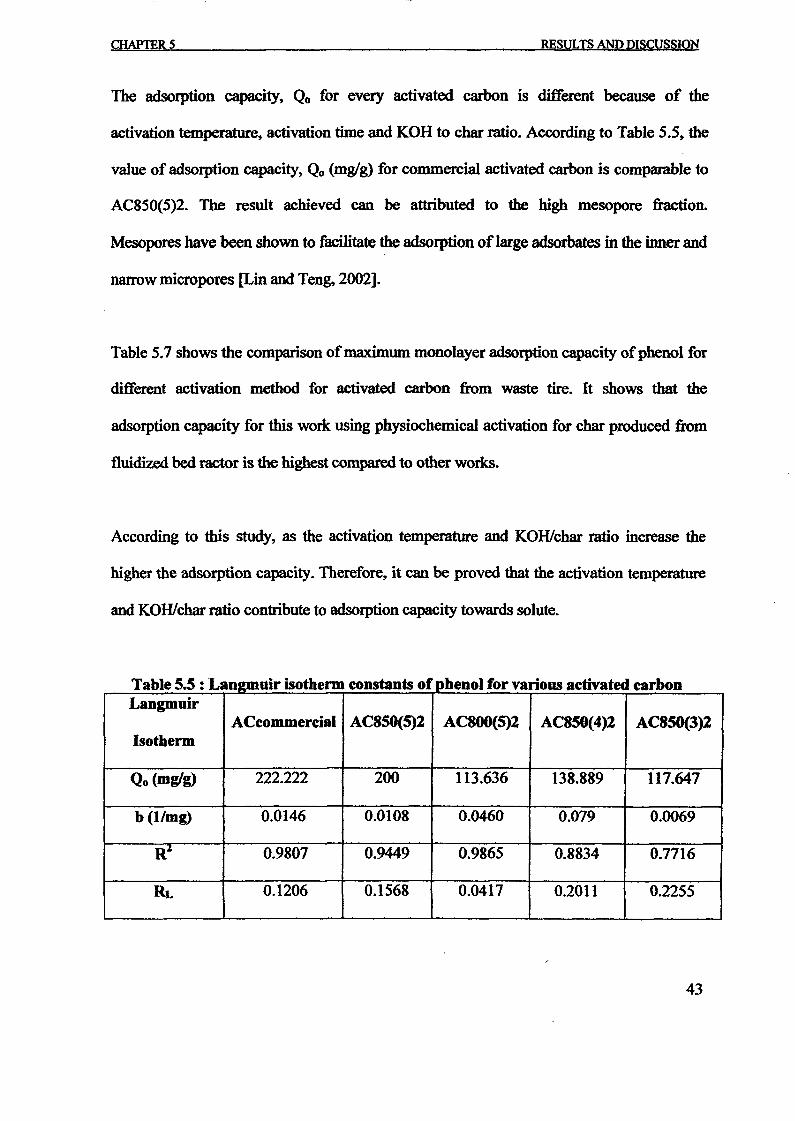
CHAPTERS RESULTS AND DISCUSSION
The adsorption capacity, Qo for every activated carbon is different because of the
activation temperature, activation time and KOH to char ratio. According to Table 5.5, the
value of adsorption capacity, Qo (mglg) for commercial activated carbon is comparable to
AC850(5)2. The result achieved can be attributed to the high mesopore fraction.
Mesopores have been shown to facilitate the adsorption oflarge adsorbates in the inner and
narrow micropores [Lin and Teng, 2002].
Table 5.7 shows the comparison ofmaximum monolayer adsorption capacity ofphenol for
different activation method for activated carbon from waste tire. It shows that the
adsorption capacity for this work using physiochemical activation for char produced from
fluidized bed metor is the highest compared to other works.
According to this study, as the activation temperature and KOHlchar ratio increase the
higher the adsorption capacity. Therefore, it can be proved that the activation temperature
and KOHlchar ratio contribute to adsorption capacity towards solute.
ctiv ted rbtants f h I Ii• . thT bl 5.5 La e . an2DlUlr ISO erm cons 0 Pi eno or vanous a a at on.Langmuir
ACcommercial AC8S0(5)2 AC800(5)2 AC850(4)2 AC85O(3)2Isotherm
Qo (mglg) 222.222 200 113.636 138.889 117.647
b (l/mg) 0.0146 0.0108 0.0460 0.079 0.0069
R~ 0.9807 0.9449 0.9865 0.8834 0.7716
RL 0.1206 0.1568 0.0417 0.2011 0.2255
43
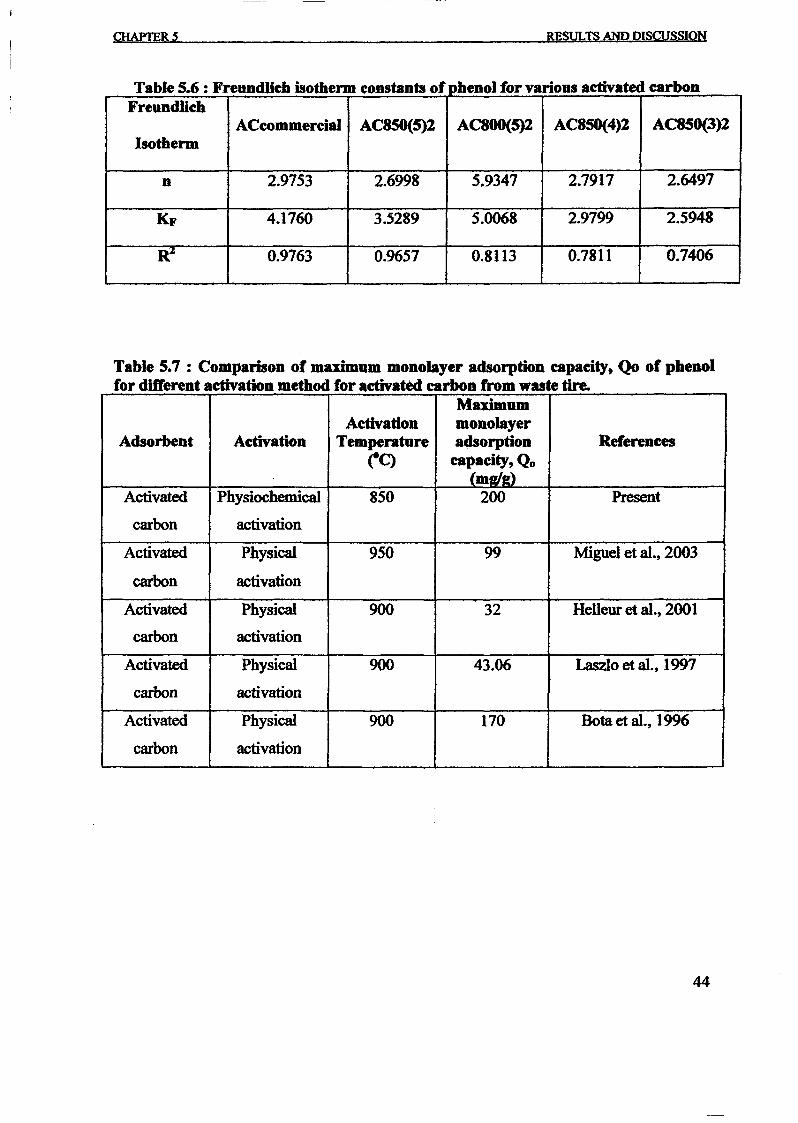
CHAPTER' RESULTS AND DISCUSSION
etiv ted carbof b IiitadUb· thT bl 56 Fa e • : reun c ISO erm eons nts 0 pJ eno orvanous a a nFreundlich
ACcommereial AC8S0(5)2 AC800(5)2 AC85O(4)2 AC850(3)2Isotberm
n 2.9753 2.699S 5.9347 2.7917 2.6497
KF 4.1760 3.5289 5.0068 2.9799 2.5948
R~ 0.9763 0.9657 0.8113 0.7811 0.7406
Table 5.7 : Comparison of maximum monolayer adsorption capacity, Qo of pbenolfor different activation method for activated carbon from waste tire.
MaximumActivation monolayer
Adsorbent Activation Temperature adsorption ReferencesrC) capaeity, Qo(m2l'd
Activated Physiochemical 850 200 Present
carbon activation
Activated Physical 950 99 Miguel et aI., 2003
carbon activation
Activated Physical 900 32 Helleur et aI., 2001
carbon activation
Activated Physical 900 43.06 Laszlo et aI., 1997
carbon activation
Activated Physical 900 170 Bota et al., 1996
carbon activation
44
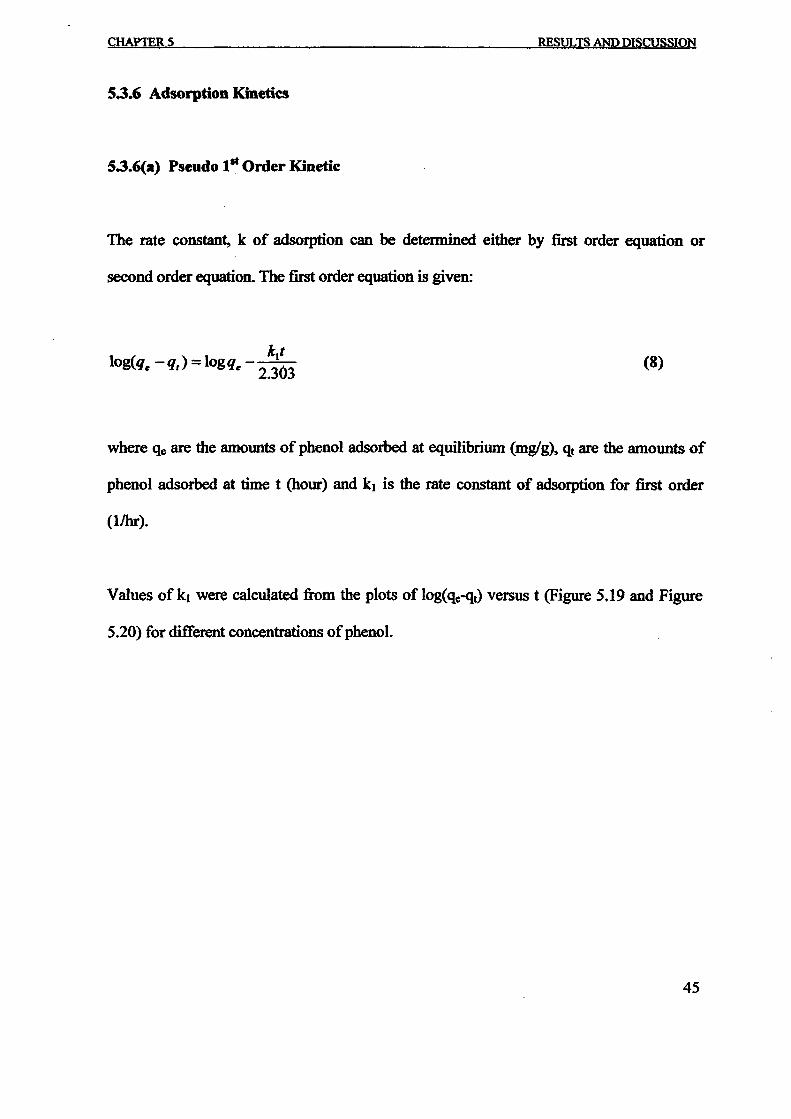
CHAPTERS
5.3.6 Adsorption Kinetics
5.3.6(a) Pseudo 1st Order Kinetic
RESULTS AND DISCUSSION
The rate constant, k of adsorption can be detennined either by first order equation or
second order equation. The first order equation is given:
ktlog(q. -q,) = logq. - 2.~03 (8)
where qe are the amounts of phenol adsorbed at equilibrium (mglg), qt are the amounts of
phenol adsorbed at time t (hour) and kl is the rate constant of adsorption for first order
(llhr).
Values of k l were calculated from the plots of log(qe-qt) versus t (Figure 5.19 and Figure
5.20) for different concentrations ofphenol.
45
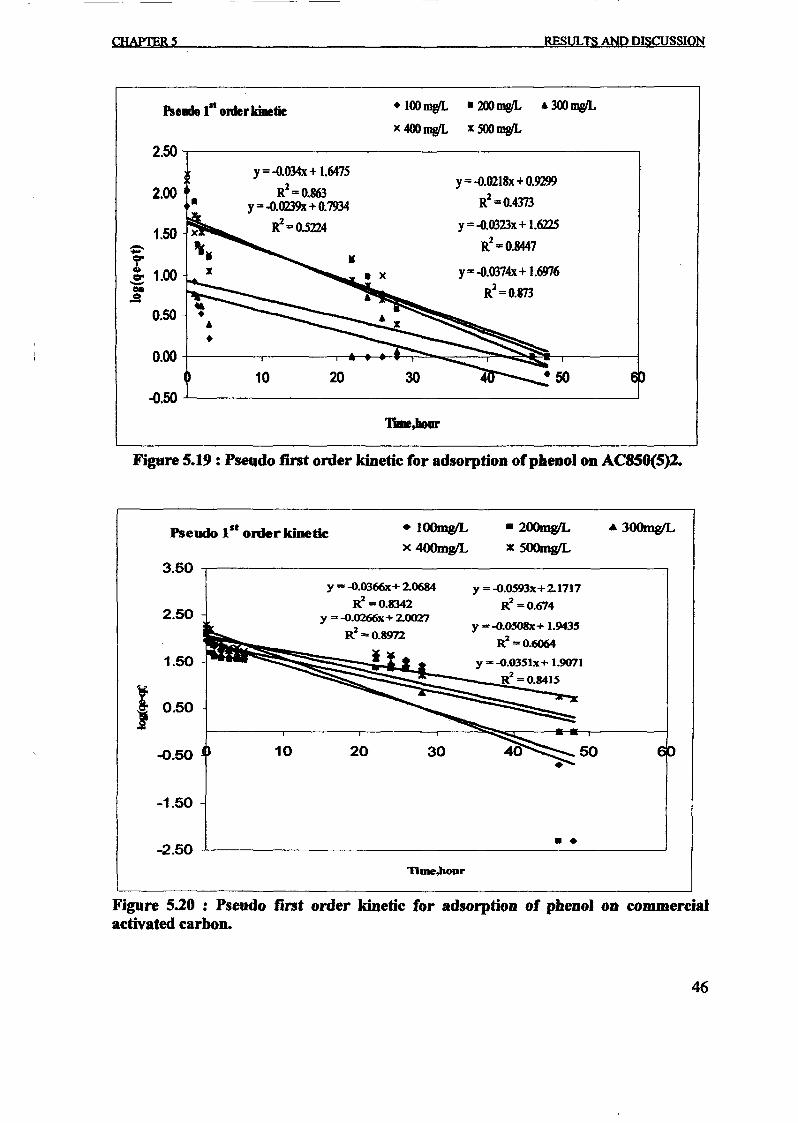
CHAPTERS RESULTS AND DISCUSSION
Pse.llt onlerkinetie .100mgIL • 200mgIL 4300mWL
x 400mgIL :r: SOOmgIL
2.50y =-o.034x + 1.6475
y= -o.0218x +0.92992.00 R2 =0.863• Y=-o.0239x +0.7934 R2 =o.4373
1.50 R2 =0.5224 y =-o.0323x + 1.6225
~ R2= 0.8447
e:r M• Y=-o.0374x +1.6976lI,)
1.00l:r- R2 =0.873011.s0.50
0.0010 20 30
-0.50
Time,llour
Figure 5.19 : Pseudo lint order kinetic for adsorption ofphenol OD ACBS0(5)2.
Pseudo 1st order kinetic • 1()()mg/L
x 400mgIL• 200tnWLx 500JnWL
.300mg1L
3.50 ....----------------------------,y = -O.0366x+ 20684
It =0.8342y =-o.0266x+20027
R2 =0.8972
2.50
1.50
1 0.50J
-0.50
-1.50
-2.50
10 20 30
nme.bour
y =-o.OS93x+21717
R2 =0.674
y = -o.OS08x+ 1.9435
R2 =0.6064
y = -o.03S1x+ 1.9071
R2 =0.8415
~.--50
• •
Figure 5.20 : Pseudo fint order kinetic for adsorption of phenol on commercialactivated carbon.
46
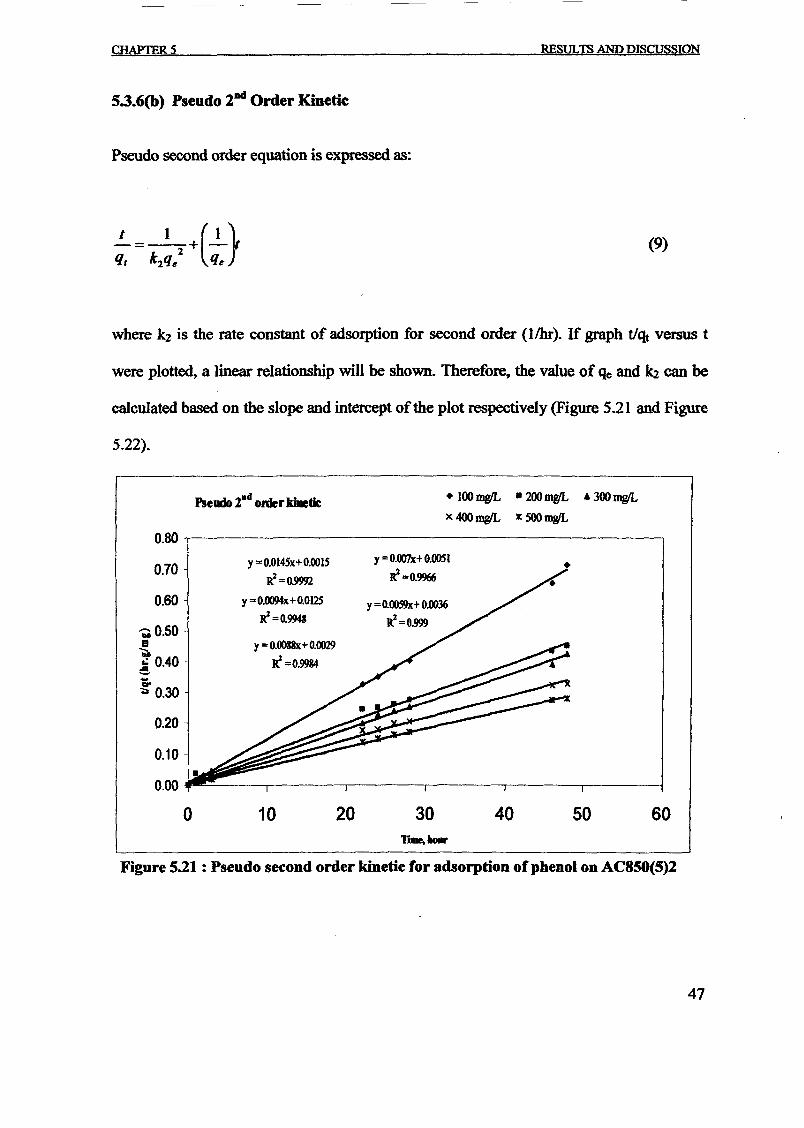
CHAPTERS
5.3.6(b) Pseudo 2ad Order Kinetic
Pseudo second order equation is expressed as:
RESULTS AND DISCUSSION
(9)
where k2 is the rate constant of adsorption for second order (l/hr). If graph tlqt versus t
were plotted, a linear relationship will be shown. Therefore, the value of qe and ~ can be
calculated based on the slope and intercept of the plot respectively (Figure 5.21 and Figure
5.22).
• 100 mwL • 200 mgIL " 300 rnWLx 400 mgIL x 500mWL
0.80
0.70
0.60
"MO.5Oa-.~0.40-CI"
<;a 0.30
020
0.10
0.00
0
y =0.0145x+0.OOI5
P!=0.9992
y = 0.0094x+ 0.0125
P!=0.9948
y= o.OO88x+ 0.0029
If=O.99M
10 20
y= 0.007x+ 0.0051
P!=0.9966
y =0.00S9x+ 0.0036
r=O.999
30 40 50 60
Figure 5.21 : Pseudo second order kinetic for adsorption of phenol on AC850(5)2
47
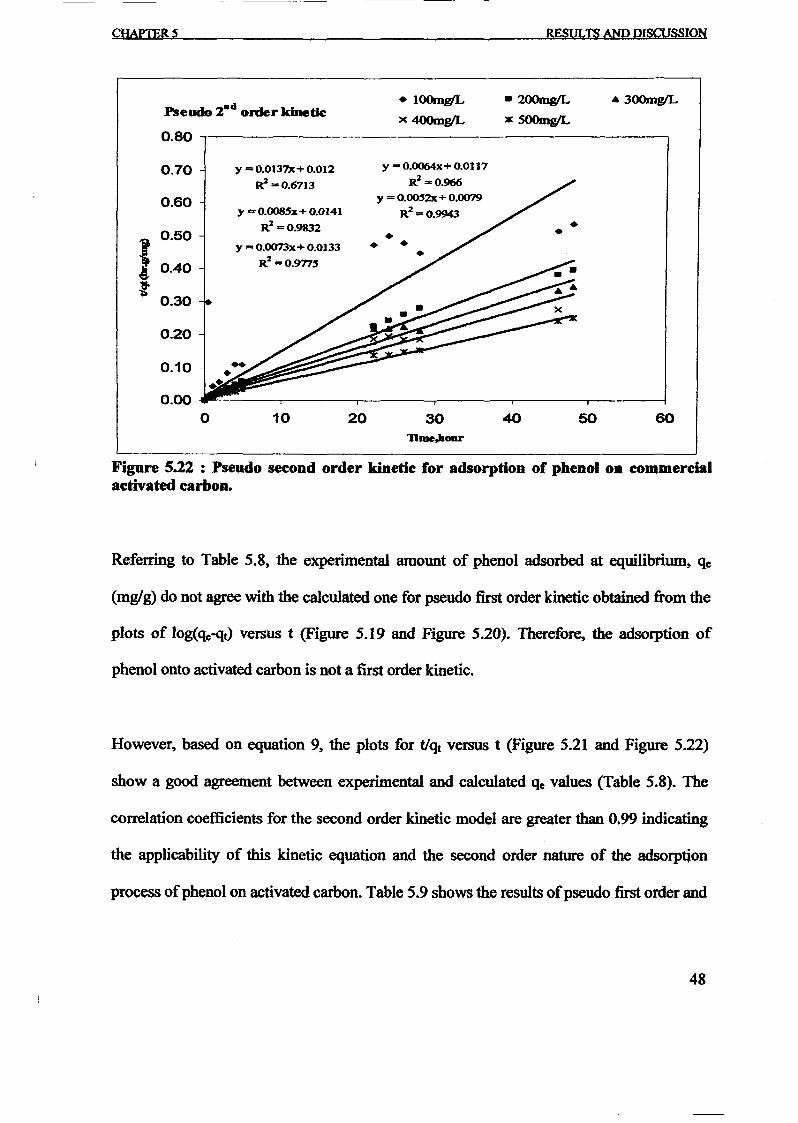
CHAPTERS RESULTS AND DISCUSSION
• lOOmglL
x 400mgIL
.2OOmgIL
:« 500mgIL
.300mg1L
0.80 ...,.--------------------------,
60504030
y = O.OO64x+ 0.0117
RZ =O.966y = O.OO52x + 0.0079
R Z = 0.9943
•• •
2010
y =O.OO85x+ 0.0141
RZ =0.9832
y = O.OO73x+ 0.0133
RZ =O.9T7S
y = 0.0137x+ 0.012
RZ =0.67130.70
0.00 __'-'----,------,-------,.------r----r-------lo
0.60
0.10
0.30
0.20
I 0.50
4 0.40
f
n.-,laoar
Figure 5.22 : Pseudo second order kinetic for adsorption of phenol oa commercialactivated carbon.
Referring to Table 5.8, the experimental amoWlt of phenol adsorbed at equilibrium, qe
(mglg) do not agree with the calculated one for pseudo first order kinetic obtained from the
plots of log(qc-qt) versus t (Figme 5.19 and Figme 5.20). Therefore, the adsorption of
phenol onto activated carbon is not a first order kinetic.
However, based on equation 9, the plots for t/qt versus t (Figure 5.21 and Figure 5.22)
show a good agreement between experimental and calculated qc values (Table 5.8). The
correlation coefficients for the second order kinetic model are greater than 0.99 indicating
the applicability of this kinetic equation and the second order nature of the adsorption
process ofphenol on activated carbon. Table 5.9 shows the results ofpseudo first order and
48
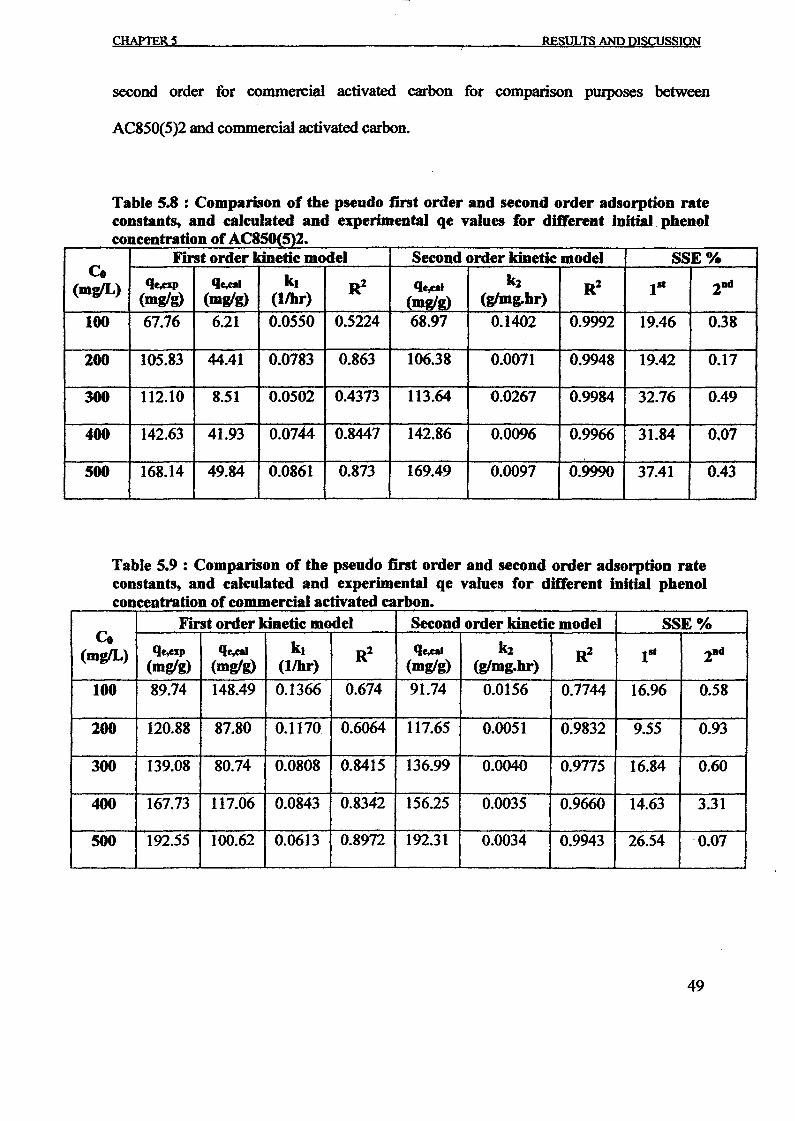
CHAPTERS RESULTS AND DISCUSSION
second order for commercial activated carbon for comparison purposes between
AC850(5)2 and commercial activated carbon.
Table 5.8 : Comparison of the pseudo f"U'St order and second order adsorption rateconstants, and calculated and experimental qe values for different initial phenolconcentration ofAC850(5)2.
First order kinetic model Second order kinetic model SSE %Co qepl k. k2(mgIL) qepp R2 qepl R2 lit 2nd
(mglg) (mgIg) (l/hr) (mglg) (g/mg.hr)
100 67.76 6.21 0.0550 0.5224 68.97 0.1402 0.9992 19.46 0.38
200 105.83 44.41 0.0783 0.863 106.38 0.0071 0.9948 19.42 0.17
300 112.10 8.51 0.0502 0.4373 113.64 0.0267 0.9984 32.76 0.49
400 142.63 41.93 0.0744 0.8447 142.86 0.0096 0.9966 31.84 0.07
500 168.14 49.84 0.0861 0.873 169.49 0.0097 0.9990 37.41 0.43
Table 5.9 : Comparison of the pseudo fint order and second order adsorption rateconstants, and calculated and experimental qe values for different initial phenolconcentration of commercial aet'ivated carbon.
First order kinetic model Second order kinetic model SSE %Co
k. k2(mgIL) qepp qepl R2 qe,eal R2 1st 2nd
(mglg) (mglg) (l/hr) (mg/g) (glmg.hr)
100 89.74 148.49 0.1366 0.674 91.74 0.0156 0.7744 16.96 0.58
200 120.88 87.80 0.J170 0.6064 117.65 0.0051 0.9832 9.55 0.93
300 139.08 80.74 0.0808 0.8415 136.99 0.0040 0.9775 16.84 0.60
400 167.73 117.06 0.0843 0.8342 156.25 0.0035 0.9660 14.63 3.31
500 192.55 100.62 0.0613 0.8972 192.31 0.0034 0.9943 26.54 ·0.07
49
RESULTS AND DISCUSSION
5.3.7 Test ofkineties models
In stead the value of correlation coefficient, R2 the applicability ofboth kinetic models can
be verified through the sum oferror squares (SSE %).
The SSE equation is given by:
(10)
where N is the number of data points. The best graph between the first and second order
will be determined according to the value of R2 and SSE. The higher the value of R2 and
the lower the value ofSSE %, it will result the best fit [Hameed et al., 2006].
Based on the pseudo second order kinetic model (Table 5.8), the activated carbon at 850°C
for 2 hour activation time, AC850(5)2 gave the value of correlation coefficients more than
0.99 and lower sum of error squares value, SSE%. Therefore, AC850(5)2 for pseudo
second order kinetic model produce the best fit compared to pseudo first order kinetic
model. Similar results have been achieved in the adsorption of methylene blue onto
bamboo based activated carbon [Hameed et al., 2006].
50
...
I. ., •,.• U.1f11
~
UNIVERSITI SAlHs MALAYSIA
UNIVERSITI SAINS MAlAVSIASCHOOL OF CHEMICAL ENGINEERiNG
ENGINEERING CAMPUS
AOSORPTIQNPIERFORMANCIE OF ACTIVATEDCARBON FROM WASTE TIRE
l KONGCHIA IENGMatricNo.: 73132 ,
.
"April 2007
~.,~ ••..
.. .... ~~
ABSTRACf
Adsorption is a very important process in many application of industrial and
activated carbon plays an important role in this application. Thus, many methods have been
used to produce.activated carbon. In this study, the performances of adsorption of activated
carbon in different parameter are being investigated. In this study, activated carbons were
produced from waste tires. Waste tire is used to produce a char in fixed bed. Chemical
activation is done by using Potassium hydroxide (KOH) and gas N2 with flow rate
lOOmlIminute at temperature of 760°C. The activation time were I hour, 1.5 hours, and 2
hours. KOH per char rations are varies from 3, 4 and 5~ The adsorption characteristics were
determined by using methylene blue and phenol and its performance and characteristic were
investigated. From the experiments that undergo, the adsorption capacity reaches its
optirni7Mion when activated carbon produced in the 760°C, KOHlcbar equal to 5 with the
activation time 15 hours used. The best condition to produce the activated carbon with high
potential inadsoIption had been found through this thesis.
Keywords: Waste tire, KOHactivation,pylorysis, activated carbon, fluidized bed, chemical
activation, adsorption, methylene blue, phenol
IX
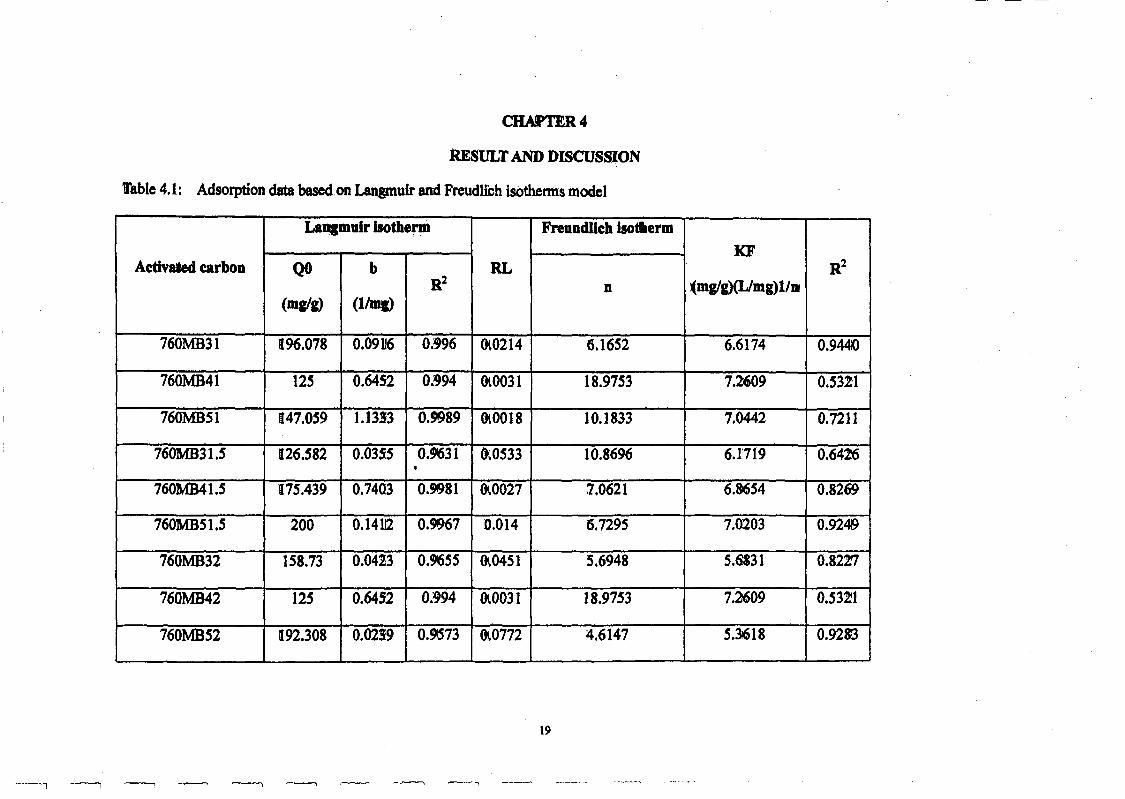
CHAPTER 4
RESULT AND DISCUSSION
Table 4.1: Adsorption data based on Langmuir and Freudlibh isothenns model
LaJlllllulr Isotherm Freundlich lsoaermKF
Adlv..ed carbon QO b RL R2
R2 n (mglg)(IJmg)l/D(mglg) (l/JIII)
760MB31 196.078 0.09U6 0.'96 0'.0214 6.1652 6.6174 0.9440
760MB41 125 0.6452 0.'94 0'.0031 18.9753 7.:M09 0.5321
760MBSI 147.059 1.1333 0.,e)89 &.0018 10.1833 7.0442 0.7211
76OMB31.5 126.582 0.0355 0.9631 ~OS33 10.8696 6.1719 0.6426,
760MB41.5 a7S.439 0.7403 0.,e)81 0'.0027 7.0621 6.8654 0.8269
760MBS1.S 200 O.l4U2 0.9967 0.014 6.7295 7.0203 0.9249
760MB32 158.73 0.04:23 0.965S 0'.0451 5.6948 5.6131 0.82%7
760MB42 125 0.6452 0.994 ()I.0031 18.9753 7.2609 0.5321
760MB52 m92.308 0.0239 0.9573 0'.0772 4.6147 5.31618 0.9283
19
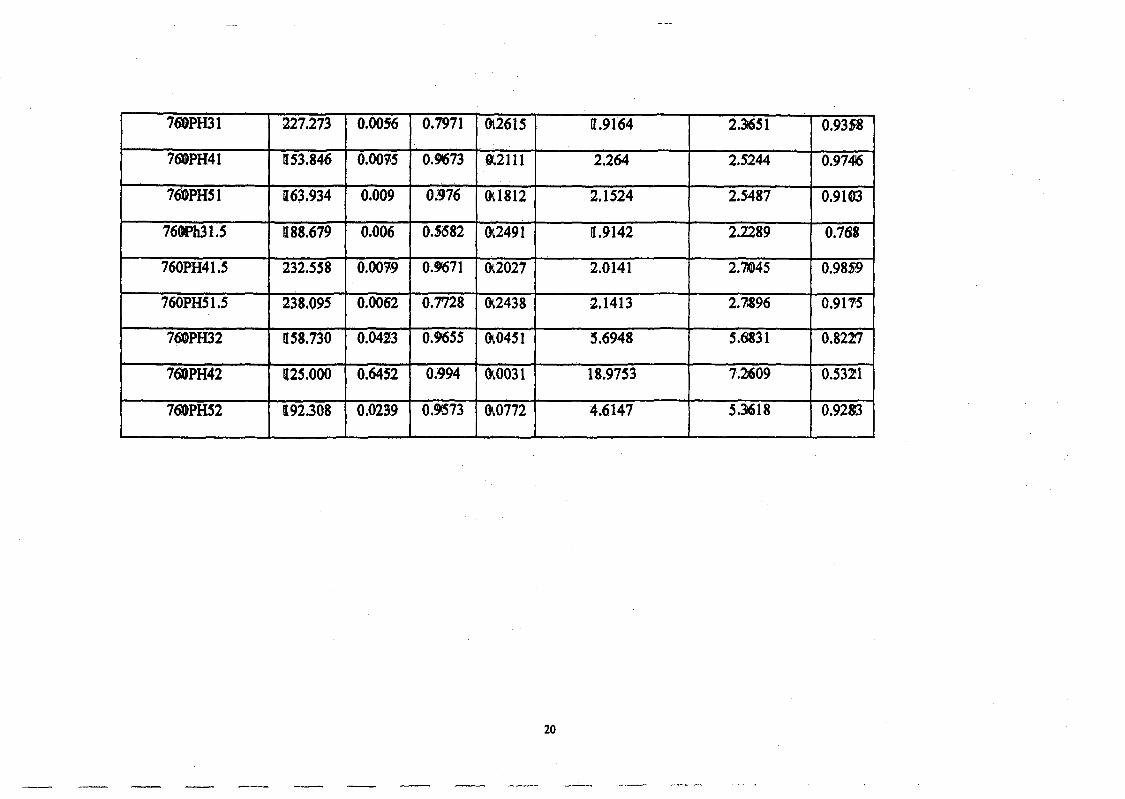
760PH31 227.273 0.0056 0.7971 tll2615 11.9164 2.31651 0.9358
760PH41 1153.846 0.00~5 0.9673 t.2111 2.264 2.5244 0.9746
760PH51 1163.934 0.009 0.976 0\1812 2.1524 2.5487 0.9103
76tWh31.S «88.679 0.006 0.$682 ~2491 n.9142 2.2289 0.768
760PH41.S 232.558 0.OO~9 0.9671 ~2027 2.0141 2.7045 0.9859
760PH51.S 238.095 0.0062 0.7728 ~2438 2.1413 2.7,196 0.911'5
760PH32 1158.730 0.0423 0.9655 Ql,0451 5.6948 5.6&31 0.8227
760PH42 1125.000 0.6452 0.994 ().0031 18.9753 7.2609 0.5321
76GPHS2 192.308 0.023.9 0.9573 ().0772 4.6147 5.3618 0.9213
20
j
j
J
J
J
j
1
j
j
4.1 Effect of agitation tbne and concentration of methylene blae and phenol on
adsorption
Adsorption will reach equilibrium after several hours. As a~ adsorption
isotherms can be determined under equihDrlum conditions. In this study, the adsorption
experiment of methylene blue and phenol were done for about 48 hOW'S continuously.
This is to make sure that full equihDrium was attained and increase the accuracy of the
adsorption process. The condition of the experiment were at 30 oC with ditJerent initial
concentration from lOOmgll to sOOmgll. Figure 4.1 shows the contact time necessary·for
phenol to reach equilibrium while Figure 4.2 shows the adsorptionequihbrium of
methylene blue with the ratio ofKOHlchar is Sand activation time is 1.5 hours.
Both Figures show an increase in time to reach the equilibrium. This means that the
amount ofthe adsorbed phenol and methylene blue onto activated carbon increases with
time until its adsorption limit when no more molecules of phenol and methylene blue
can be adsorbed. In this case, equilibrium time can be defined as the time required
attaining this state of equilibrium. Amount of methylene blue and phenol adsorbed at
the equilibrium time· reflects the maximum adsorption capacity of the adsorbent under
those operating conditions. As shown by the Figure 4.1 and Figure 4.2, the adsorption
capacity at equilibrium increases with an increase in the initial phenol and methylene
blue concentration from 100 to SOO mgll. This is due to increase in the driving force of
the concentration gradient, as an increase in the initial dye concentration. However, for
MB solutions with higher initial concentrations, longer equih"brium times were required.
21
J
J
J
j
J
1
I
Th~ it can be said that activated carbon prepared from waste tire is efficient in
adsorbing phenol and methylene·blue from aqueoussolution.1bree consecutive mass
transport steps are associated with the adsorption of solute from solution by porous
adsorbent. First, the adsorbate migrates through the solution, mostly known as film
diffusion. After tha~ solute will move from particle surface into interior site by pore
diffusion. The last step is adsorption of the adsorbate into the active sites at the interior
of the adsorbent particle. Long contact time is needed to complete the mass transport
and the adsorption process.
Figure 4.1 shows the contact time necessary for phenol with initial concentrations
of 100-300 mg/l to reach equilibrium is 6 hours. For phenol with high initial
concentration in the range of400-500 m&'l~ the time for it to reach the equilibriwn was
about 28 hours. As shown by the figure 1, the adsorption capacity at equilibrium
increases with an increase in the initial dye concentration from 100 to 500 mgll. Th~
activated carbon preP8J'edfrom waste tire is efficient in adsorbing phenol from aqueous
solution.
Fig. 2 shows the contact time necessary for methylene blue with initial
concentrations of 100-300 mg/l to reach equilibriwn is 6 hours. For phenOl with high
initial concentration rarely from 400-500 mgl\ the time for it to reach the equilibrium
was longer and 26 hours are needed to reach the equilibrium. So, activated carbon
prepared from waste tire is efficient in adsorbing phenol from aqueous solution.
22
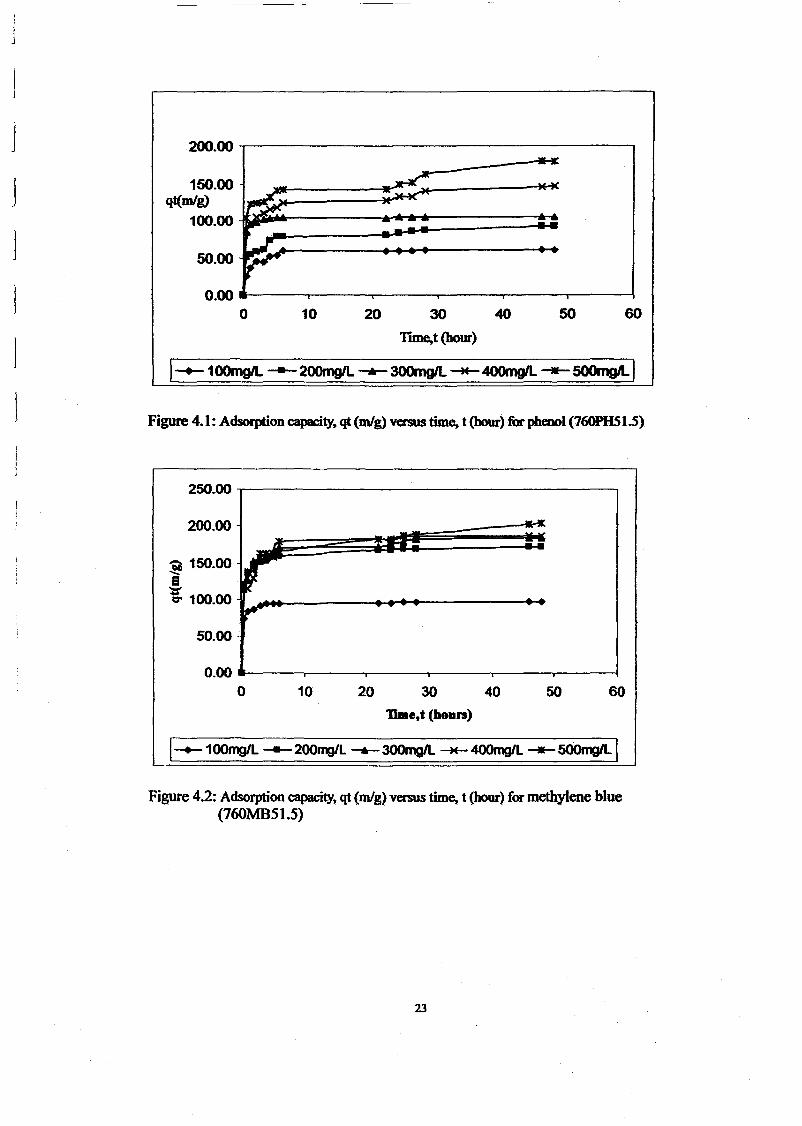
I.J
J
j
J
J
j
1
200.00 ,---------------------,
150.00qt(m1g)
100.00 D~k-------........~----~~
50.00 _ ...~-
0.00 ._----r----,------r------,---r-----;
o 10 20 30 40 50 60
Tune,t (hour)
1--+-100mg1L ---200rng/l-'-3OOmgIL.~400mgIL -.-500mg4.1
Figure 4.1: Adsorption capacity. qt (mig) VClSUS time, t (hour) for phenol (760PHS15)
250.00 ,---------------------,
200.00==",,jJ~~d
~ 150.00 r~
~0' 100.00 I .....~_----+~~----- ....,r
50.00
60504030
1lme,t (boun)
2010
0.00 -----.----.----,----~--~-----lo
I-+- 100rng1L ---200rDJIL -.- 300mgIL """'*- 400mgIL ---- 5OOmgIl1
Figure 4.2: Adsorption capacity, qt (mig) versus time, t (hour) for methylene blue(760MB51.5)
23
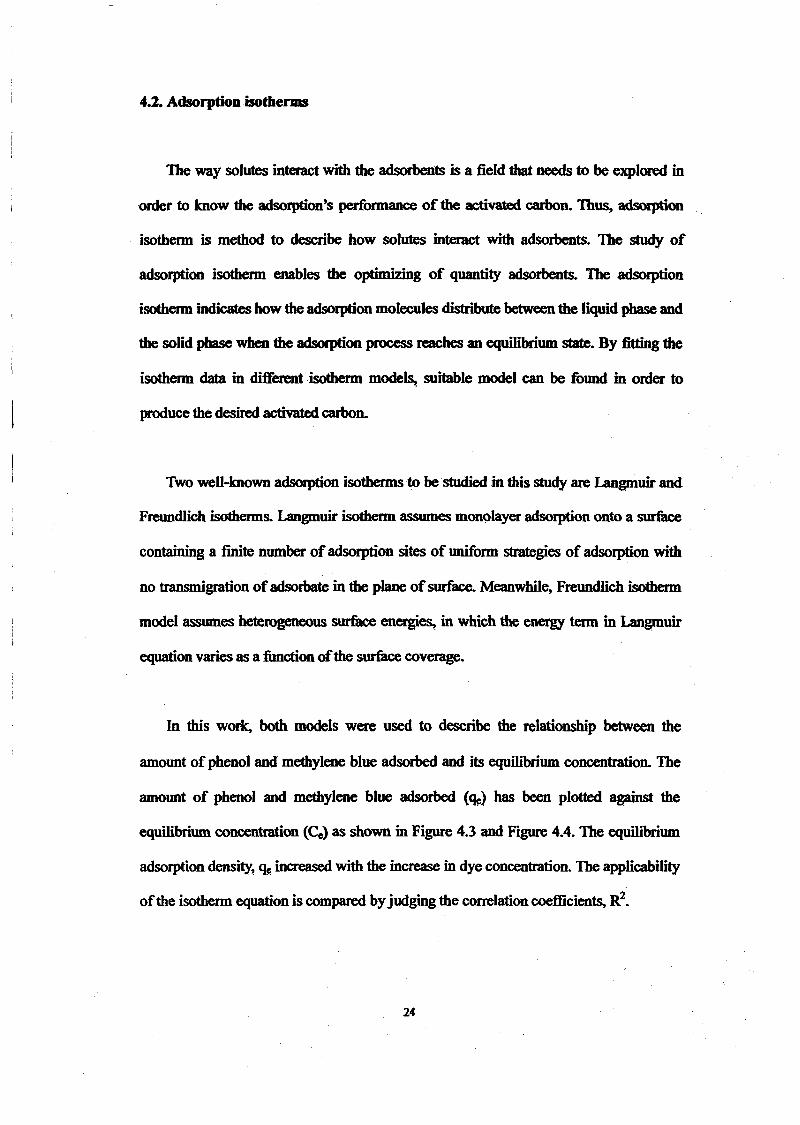
4.2. Adsorption isotherms
The way solutes interact with the adsorbents is a field that needs to be explored in
order to know the adsorption's performance of the activated carbon. Thus, adsorption
isotherm is method to describe how solutes interact with adsorbents. The study of
adsorption isotherm enables the optimizing of quantity adsorbents. The adsorption
isotherm indicates how the adsorption molecules distribute between the liquid phase and
the solid phase when the adsorption process reaches an equilibrium state. By fitting the
isotherm data in different isotherm mode~ suitable model can be found in order to
produce the desired activated carbon..
Two well-known adsorption isotherms to be studied in this study are Langmuir and
Freundlich isothenns. Langmuir isothenn assumes monolayer adsorption onto a surfuce
containing a finite number ofadsorption sites of uniform strategies of adsorption with
no transmigration ofadsorbate in the plane ofsurface. Meanwhile, Freundlich isotherm
model assumes heterogeneous surface energi~in which the enetgy term in Langmuir
equation varies as a function ofthe surface coverage.
In this work, both models were used to describe the relationship between the
amount of phenol and methylene blue adsorbed and its equilibrium concentration. The
amount of phenol and methylene blue adsorbed (<k) has been plotted against the
equilibrium concentration (Ce) as shown in Figure 4.3 and Figure 4.4. The equilibrium
adsorption density, 'k increased with the increase in dye concentration. The applicability
ofthe isotherm equation is compared byjudging the correlation coefficients, R2•
24
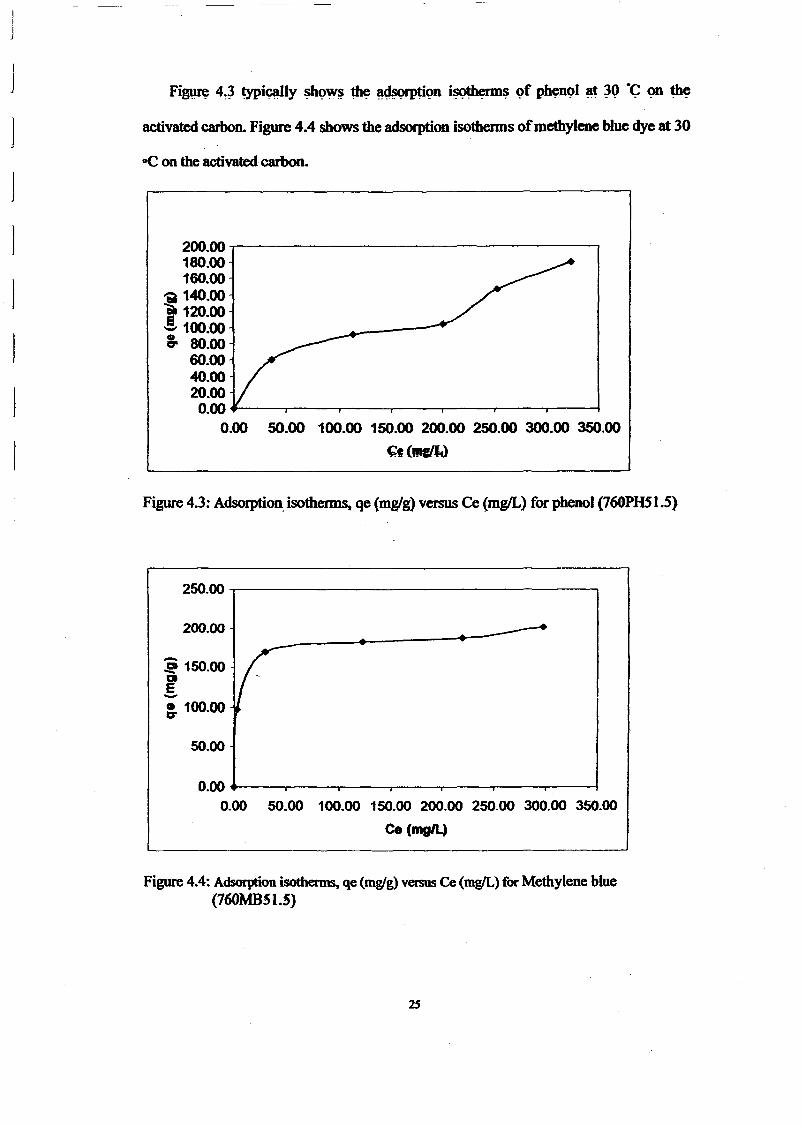
activated carbon. Figure 4.4 shows the adsorption isotherms ofmethylene blue dye at 30
oC on the activated carbon.
200.00 ...---------------------,180.00160.00
'M 140.00r 120.00- 100.0030 80.00
60.0040.0020.000.00 +-----.----.------,----.------,r------.-----;
0.00 50.00 100.00 150.00200.00 250.00 300.00 350.00
~, (1ftIIl,)
J
J
j
J
IIII
Figme 4.3: Adsorptionisoth~ qe (mglg) versus Ce (mgIL) for phenol (760PHSI.5)
250.00 ...---------------------,
200.00
~ 150.00oE-3- 100.00
50.00
0.00 +----r---.------.---.-----.----.---I
0.00 50.00 100.00 150.00 200.00 250.00 300.00 350.00
Ce (mgIl..)
Figure 4.4: Adsorption isoth~ qe (mw'g) versus Ce (mgIL) for Methylene blue(760MBS I.S)
2S
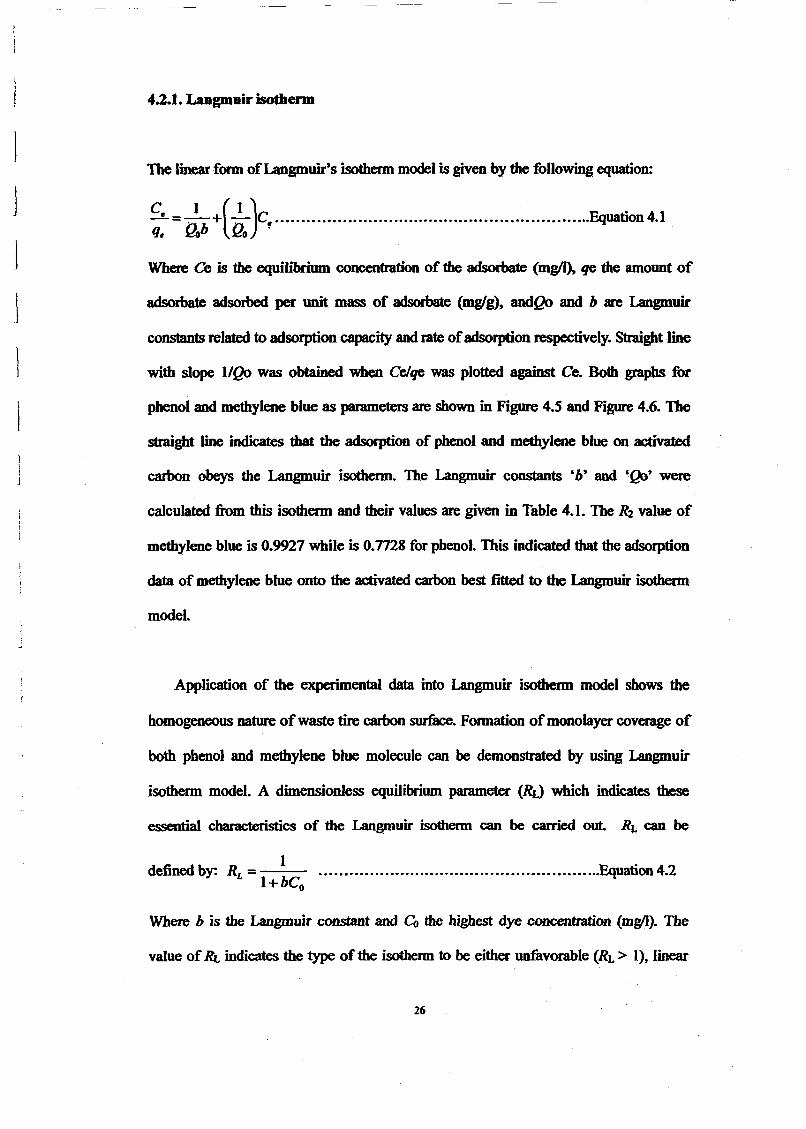
J
J
1
1
j
J
J
4.2.1. LaDgmuir isotherm
The linear form ofLangmuir's isothenn model is given by the following equation:
~: =~+(~}, &)uatioo 4.1 .
Where Ce is the equihOrium concentration of the adsorbate (mg/l), qe the amount of
adsorbate adsorbed per unit mass of adsorbate (mglg), andQo and b are Langmuir
constants related to adsorption capacity and rate ofadsorption respectively. Straight line
with slope IIQo was obtained when Celqe was plotted against Ceo Both graphs for
phenol and methylene blue as parameters are shown in Figure 4.5 and Figure 4.6.1be
straight line indicates that the adsorption of phenol and methylene blue on activated
carbon obeys the Langmuir isotherm. The Langmuir constants 'b' and 'Qo' were
calculated from this isotherm and their values are given in Table 4.1. The R2 value of
methylene blue is 0.9927 while is 0.7728 for phenol. This indicated that the adsorption
data of methylene blue onto the activated carbon best fitted to the Langmuir isotherm
model.
Application of the experimental data into Langmuir isotherm model shows the
homogeneous nature ofwaste tire carbon surface. Formation ofmonolayer coverage of
both phenol and methylene blue molecule can be demonstrated by using Langmuir
isotherm model. A dimensionless equilibrium parameter (RLl which indicates these
essential characteristics of the Langmuir isothenn can be carried out. RL can be
defined b~ RL = 1 Equation 4.2l+bCo
Where b is the Langmuir constant and Co the highest dye concentration (mgll). The
value ofRL indicates the type of the isotherm to be either unfavorable (RL > 1), linear
26
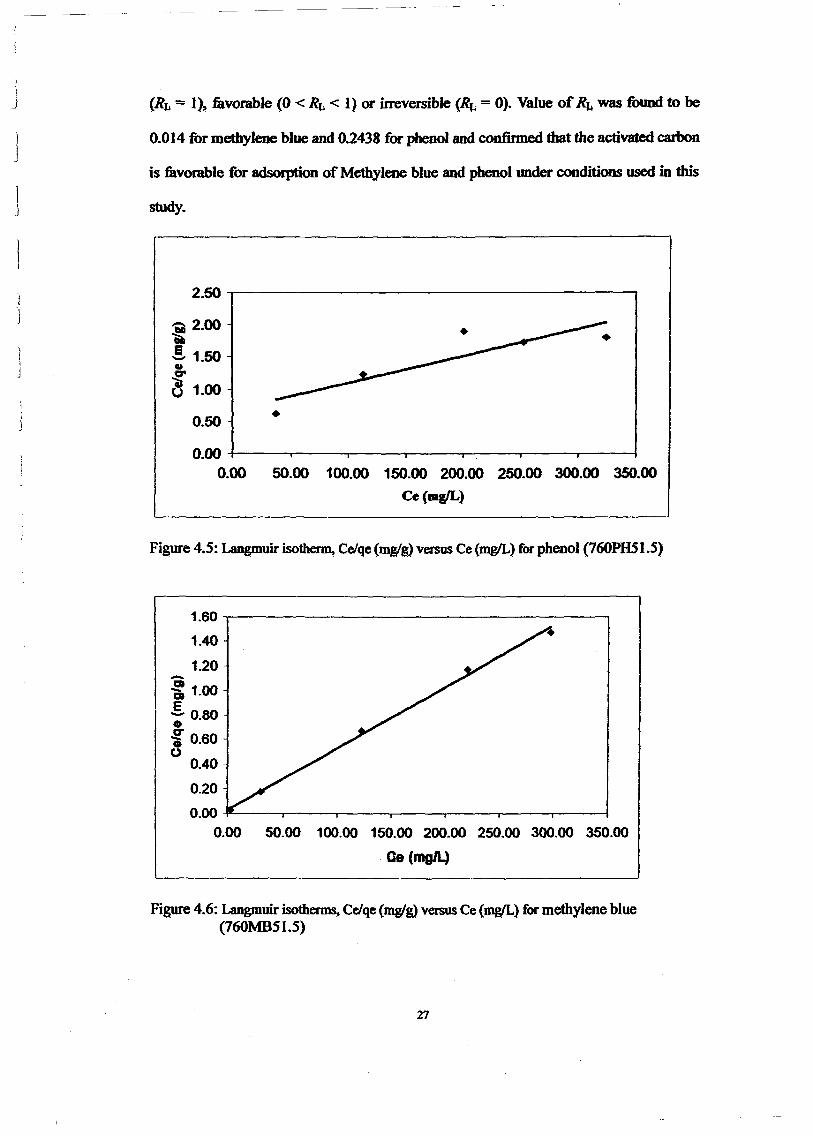
----- ---------
J
J
(Rr. = 1)~ favorable (0 < Rr. < I) or irreversible {Rr. = O}. Value ofRt. was found to be
0.014 for methylene blue and 0.2438 for phenol and confirmed that the activated carbon
is favorable for adsorption of Methylene blue and phenol under conditions used in this
1J study.
•
2.50 ,.----------------------.
'Ql 2.00lila- 1.50elf
~U 1.00
0.50
50.00 100.00 150.00 200.00 250.00 300.00 350.00
Ce(mgIL)
0.00 +----....-----.----.-----.---_--~----4
0.00
Figure 4.5: Langmuir isoth~Ce/qe (mg/g) versus Ce (mgIL) for phenol (760PH51.5)
50.00 100.00 150.00 200.00 250.00 300.00 350.00
Oe(mglL)
0.40
0.20
0.00 ~--.-------.-----.---~--~--......-------I
0.00
1.60 -,----------------------.
1.40
1.20-Qa. 1.00
.§.. 0.80•-[ 0.60o
Figure 4.6: Langmuir isotherms~CeJqe (mglg) versus Ce {mgfL} for methylene blue(760MB51.5)
27
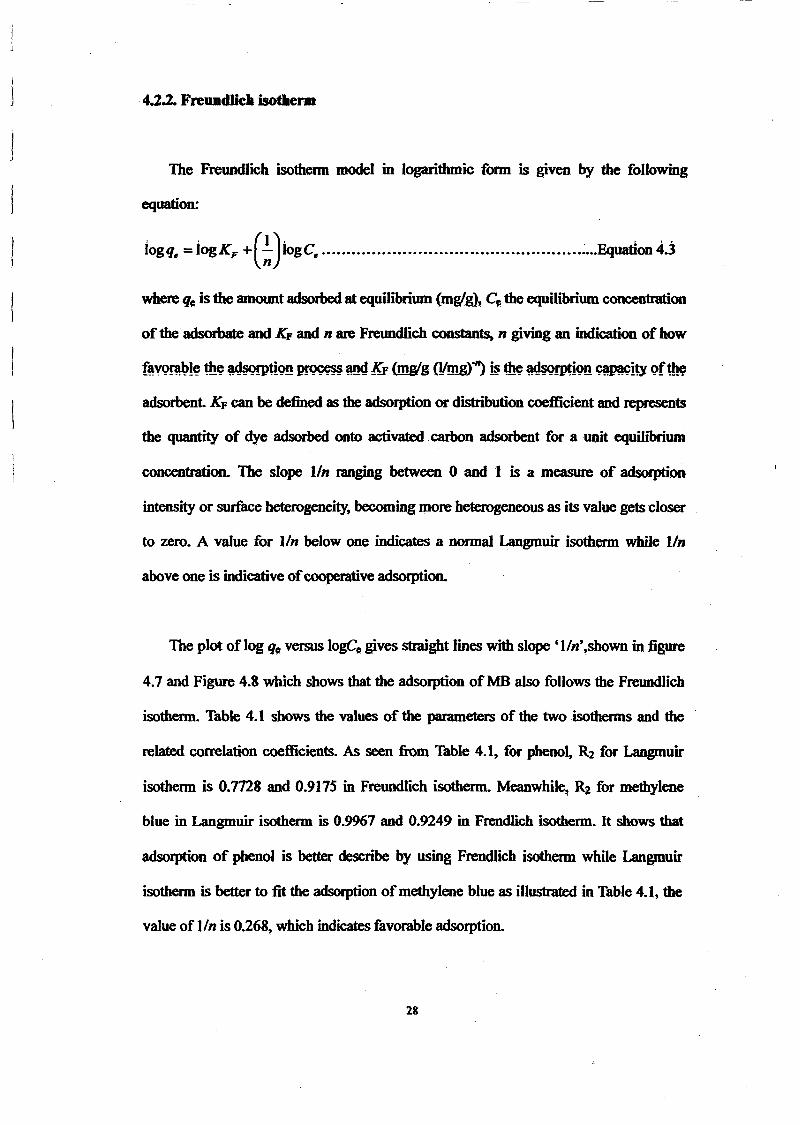
The Freundlich isothenn model in logarithmic form is given by the following
equation:
, . (I)' . ..logq. = logKp + n logC•.................•.................................. ~...Equation 4.3
where q~ is the amount adsorbed at equilibrium (mglg)~ C~ the equilibrium concentration
of the· adsorbate and Kp and n are Freundlich constants, n giving an indication of how
adsorbent. KF can be defined as the adsorption 01' distribution coefficient and represents
the quantity of dye adsorbed onto activated .carbon adsorbent for a unit equilibrium
concentration. The slope lin ranging between 0 and 1 is a measure of adsorption
intensity or surface heterogeneity~ becoming more heterogeneous as its value gets closer
to zero. A value for lIn below one indicates a normal Langmuir isotherm while lin
above one is indicative ofcooperative adsorption.
The plot of log qr; versus logCr; gives straight lines with slope 'l/n~~shown in figure
4.7 and Figure 4.8 which shows that the adsorption ofMB also follows the Freundlich
isothenn. Table 4.1 shows the values of the parameters of the two isotherms and the
related correlation coefficients. As seen from Table 4.1~ for phenol, R2 for Langmuir
isotherm is 0.7nS and 0.9175 in Freundlich isotherm. Meanwhile~ R~ for methylene
blue in Langmuir isotherm is 0.9967 and 0.9249 in Frendlich isotherm. It shows that
adsorption of phenol is better describe by using Frendlich isotherm while Langmuir
isotherm is better to fit the adsorption ofmethylene blue as illustrated in Table 4.1~ the
value of lin is 0.26S~ which indicates favorable adsorption.
2&
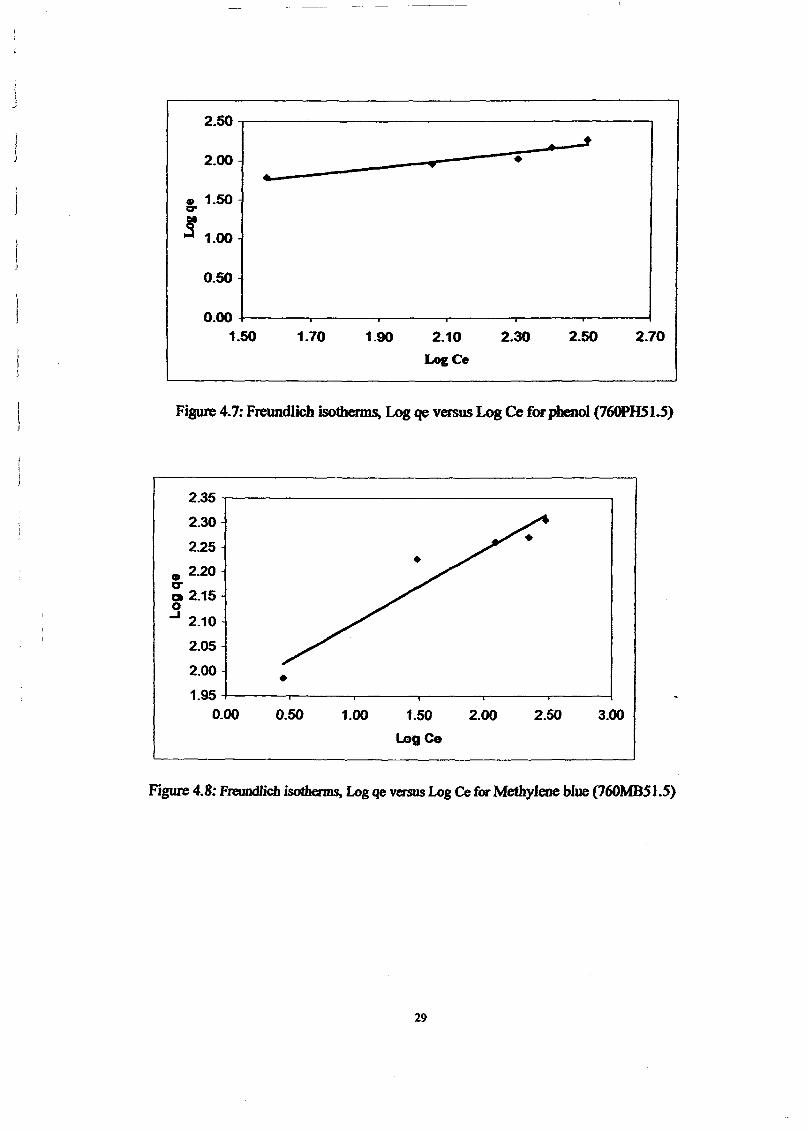
f\
)
2.50 -r---~-----------------,
2.00 .. • •.J
~ 1.50~
! 1.00
0.50
2.702.502.302.10
LogCe
1.901.700.00 +----.-----,----r-----.-----,------I
1.50
Figure 4.1: Freundlichiso~ Log qe versus Log Ce for phenol (16OPHS1.5)
3.002.501.00 1.50 2.00
LogCe
•0.50
2.35 ,----------------------,
2.30
2.25
• 2.200-Ct 2.15o.J 2.10
2.05
2.00
1.95 +----,-----r------.-------.----,-----10.00
Figure 4.8: Freundlich isotherms, Log qe versus Log Ce for Methylene blue (160MB5J.5)
29
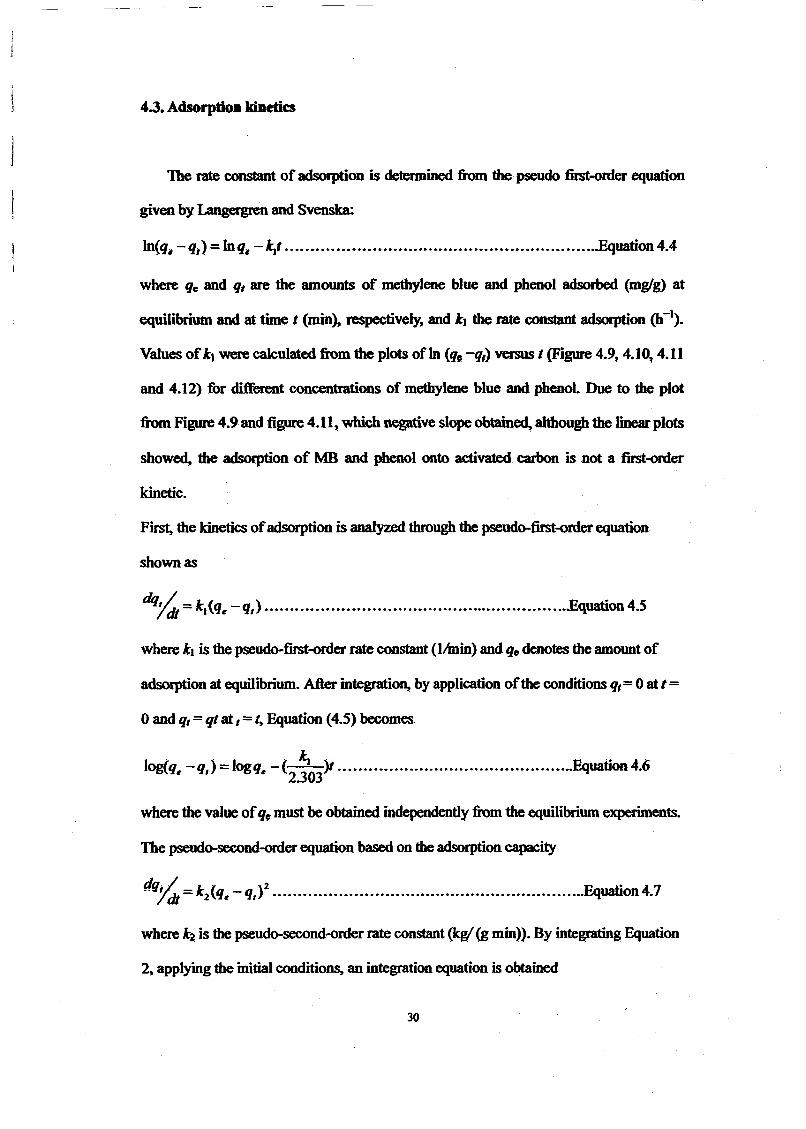
4.3. AdsorptioDkinetics
The rate constant of adsorption is determined from the pseudo first-order equation
given by Langergren and Svenska:
In{q. - q.) = In qjt - kat ...•.•.....•••••.••••..•.•........•.•.•....•.........•........Equation 4.4
where qe and qt are the amounts of methylene blue and phenol adsorbed (mglg) at
equilibrium and at time t (min), respectively, and 11the rate constant adsorption (h-I).
Values ofk. were calculated from the plots of In (q, -q,) versus 1 (Figure 4.9, 4.10, 4.11
and 4.12) for different concentrations of methylene blue and phenol Due to the plot
from Figure 4.9 and figure 4.11, which negative slope obtain~al1hough the linear plots
showed, the adsorption of MBand phenol onto activated carbon is not a first-order
kinetic.
First, the kinetics ofadsorption is analyzed through the pseudo-first-orderequation
shown as
dq~ = k.(q., -q,) .Equation 4.5
where 11 is thepseudo-first-order rate constant (llmin) and qe denotes the amount of
adsorption at equilibrium. After integration, by application ofthe conditions q,= 0 at t =
oand qt =ql at t = I, Equation (4.5) becomes
1· - I"" - 1•. - Eq -. ~.og(q., -q,) = ogq., -(--)/............................................... uation ...6
2.303
where the value ofq~ must be obtained independently from the equilibrium experiments.
The pseudo-second-order equation based on the adsorption capacity
fig; / - k ( )z Equati .. 7ldt - Z q., - q, ........•........•..•............................•....•...•... on .
where k~ is the pseudo-second-order rate constant (kw'(g min». By integrating Equation
2, applying the initial conditions, an integration equation is obtained
30
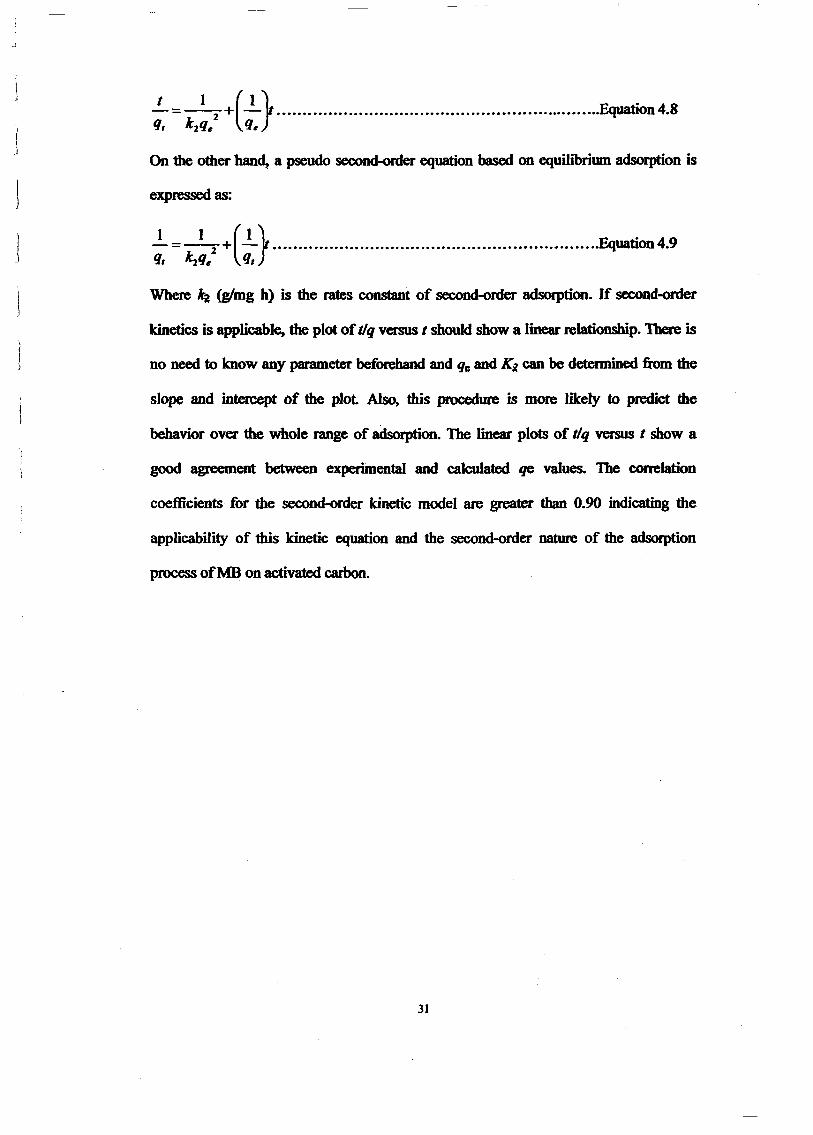
J
I
:. = t,:.' +( :. } Equation 4.8
On the other han~a pseudo second-order equation based on equilibrimn adsorption is
expressed as:
:. = ~.' +(;J .Equaticn 4.9
Where ~ (gImg h) is the rates constant of second-order adsorption. If second-order
kinetics is applicable, the plot ofdq versus t should show a linear relationship. There is
no need to know any parameter beforehand and qr; and Kz can be determined from the
slope and intercept of the plot. Also. this procedure is more likely to predict the
behavior over the whole range of adsorption. The linear plots of dq versus tshowa
good agreement between experimental and calculated qe values. The correlation
coefficients for the second-order kinetic model are greater than 0.90 indicating the
applicability of this .kinetic equation and the second-order nature of the adsorption
process ofMB on activated carbon.
31
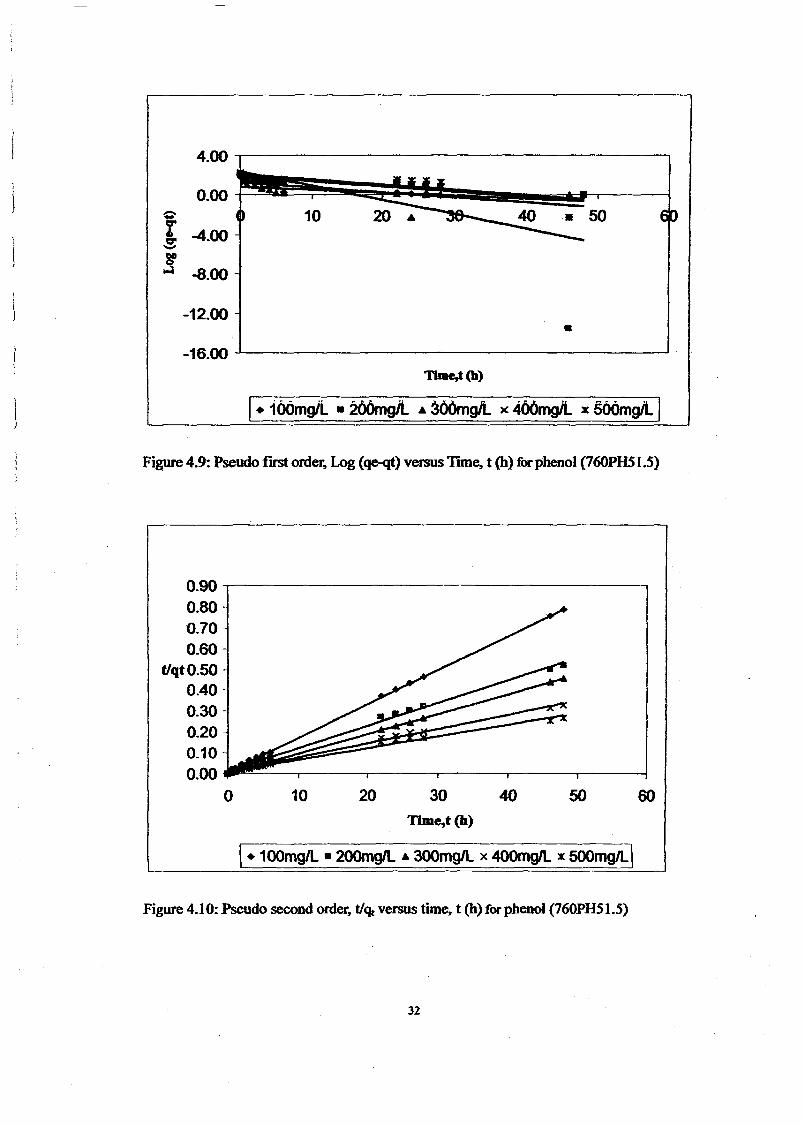
• 50
•
4.00
0.00~ 10 20 ..0",
-4.00.g&-~ -8.00
-12.00
-16.00TiJIle,t (b)
I. 100mgiL. 206mg/l .. 300mgiL x 400rngiL x 566mgiL I
Figure 4.9: Pseudo f"rrst order~ Log (qe-qt) versus Tune~ t (h) for phenol (760PH51.5)
10 20 30 40 50 60
T'une,t(h)
0.90 --r---------------------,
0.800.700.60
t1qtO.500.400.300.200.100.00
o
\.100mgIL • 200mgIL A 300mgIL x 400mgIL x 500mgILI
Figure 4.10: Pseudo second order, tlQt versus time, t (h) for phenol (760PH51.5)
32
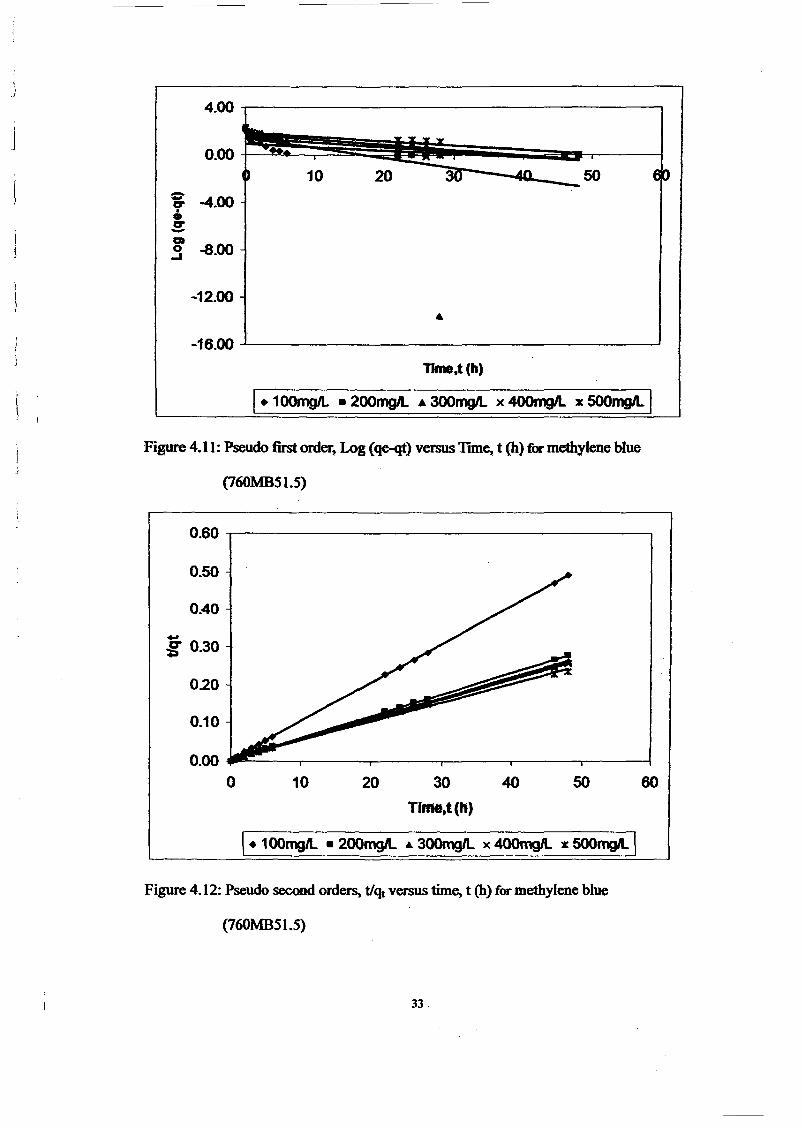
!,,J
4.00"
J0.00
-- -4.00
"•cr-CD-8.000
-'
-12.00
-16.00
jJ I
50
11me,t (h)
I. 100rngJl. • 200rng1l. • 300mgIL x 400mgJl :Ie SOOmgIL IFigure 4.11: Pseudo firstorder~ Log (qe-qt) versus Tun~ t (h) for methylene blue
(760MB51.5)
0.60 -,-----------------------,
10 20 30 40 50 60
Tlme,t(h)
0.10
020
0.50
0040
0.00 ..-'------r-------..----.------r-----.-----1
o
-go 0.30
\. 100mglL • 200mgIL "300mg1l x 400mgIL :Ie 500mgIL IFigure 4.12: Pseudo second orders, t/<Jt versus time, t (h) for methylene blue
(760MB51.5)
33
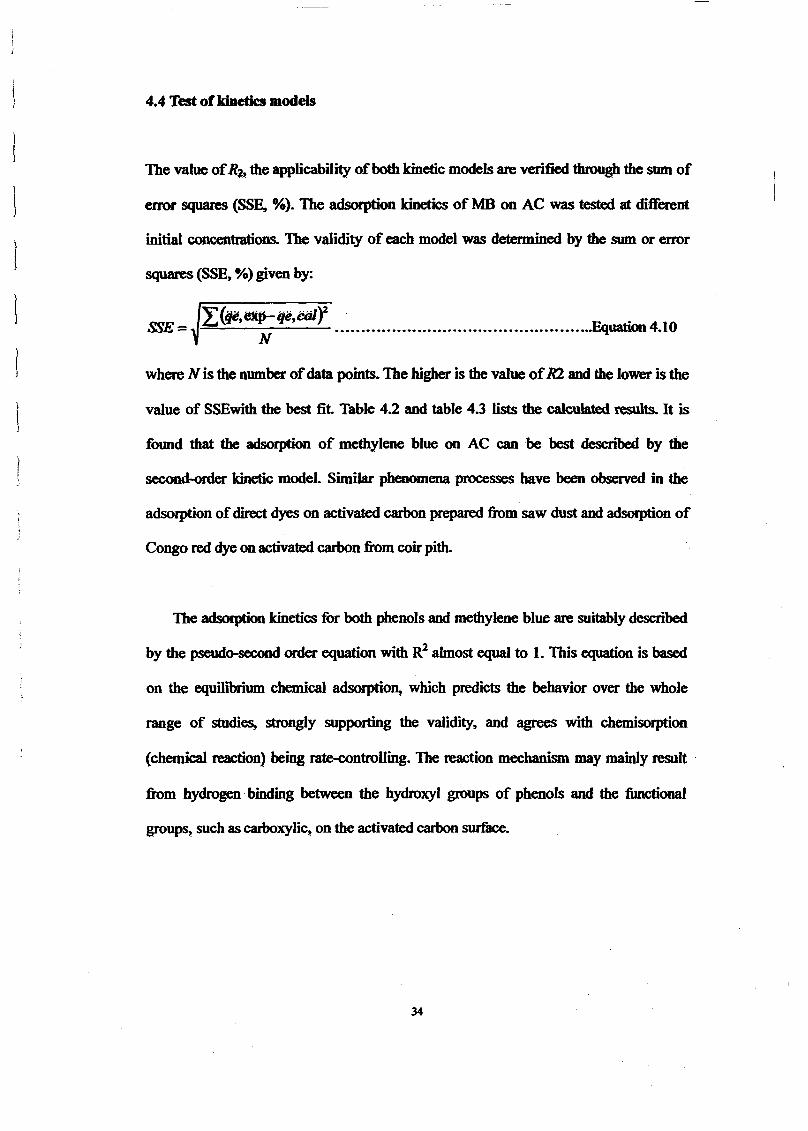
\
r
4.4 Test ofkiDetics Dlodels
The value ofRA the applicability ofboth kinetic models are verified through the sum of
error squares (SSE, %). The adsorption kinetics of MB on AC was tested at different
initial concentrations. The validity of each model was determined by the sum or error
squares (SSE, %) given by:
p~~.~ .SSE = N Equation4.10
where N is the number ofdata points. The higher is the value ofKl and the lower is the
value of SSEwith the best fit. Table 4.2 and table 4.3 lists the calculated results. It is
fOWld that the adsorption of methylene blue on AC can be best described by the
second-order kinetic model. Similar phenomena processes have been observed in the
adsorption ofdirect dyes on activated carbon prepared from saw dust and adsorption of
Congo red dye on activated carbon from coir pith.
The adsorption kinetics fOT both phenols and methylene blue are suitably described
by the pseudo-second order equation with R2 almost equal to 1. This equation is based
on the equilibrium chemical adsorpti~ which predicts the behavior over the whole
range of studies, strongly supporting the validity, and agrees with chemisorption
(chemical reaction) being rate-controlling. The reaction mechanism may mainly result·
from hydrogen binding between the hydroxyl groups of phenols and the functional
groups, such as carboxylic~on the activated carbon surfilce.
34
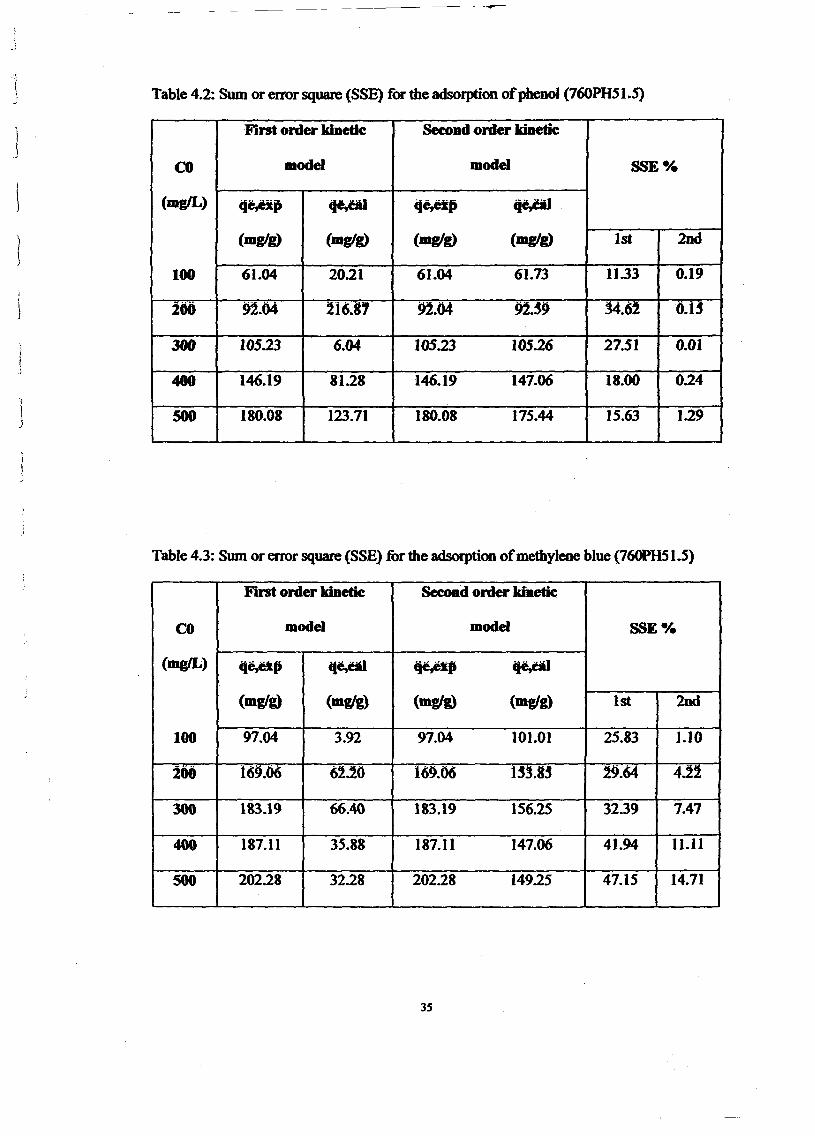
."
(1
1
\
1
J
J
Table 4.2: Sum or error square (SSE) for the adsorption ofphenol (760PH51.5)
First order kiDetic SecoRd order kiDetic
CO Dlodel Dlodel SSE %
(mgIL) qe,esp 4f,W qe,exp qe,aJ
(Dlglg) (mglg) (mgIg) (_gig) 1st 2nd
100 61.04 20.21 61.04 61.73 11.33 0.19
200 92.04 216.8' 92.04 92.~~ 34.62 0.13
300 105.23 6.04 105.23 105.26 27.51 0.01
400 146.19 81.28 146.19 147.06 18.00 0.24
500 180.08 123.71 180.08 175.44 15.63 1.29
Table 4.3: Sum or error square (SSE) for the adsorption ofmethylene blue (76OPHSI.5)
First order kiDetic SecoRd order kiDdie
CO model model SSE %
(mgIL) qt;dp qe,al q~p qe,eaJ
(mglg) (mglg) (mg/g) (mg/g) 1st 2nd
100 97.04 3.92 97.04 101.01 25.83 1.10
206 t69.M 6~~() 169.06 U3.8j ~~.64 4~~
300 183.19 66.40 183.19 156.25 32.39 7.41
400 187.11 35.88 187.11 147.06 41.94 11.11
SOO 202.28 32.28 202.28 14925 47.15 14.71
3S
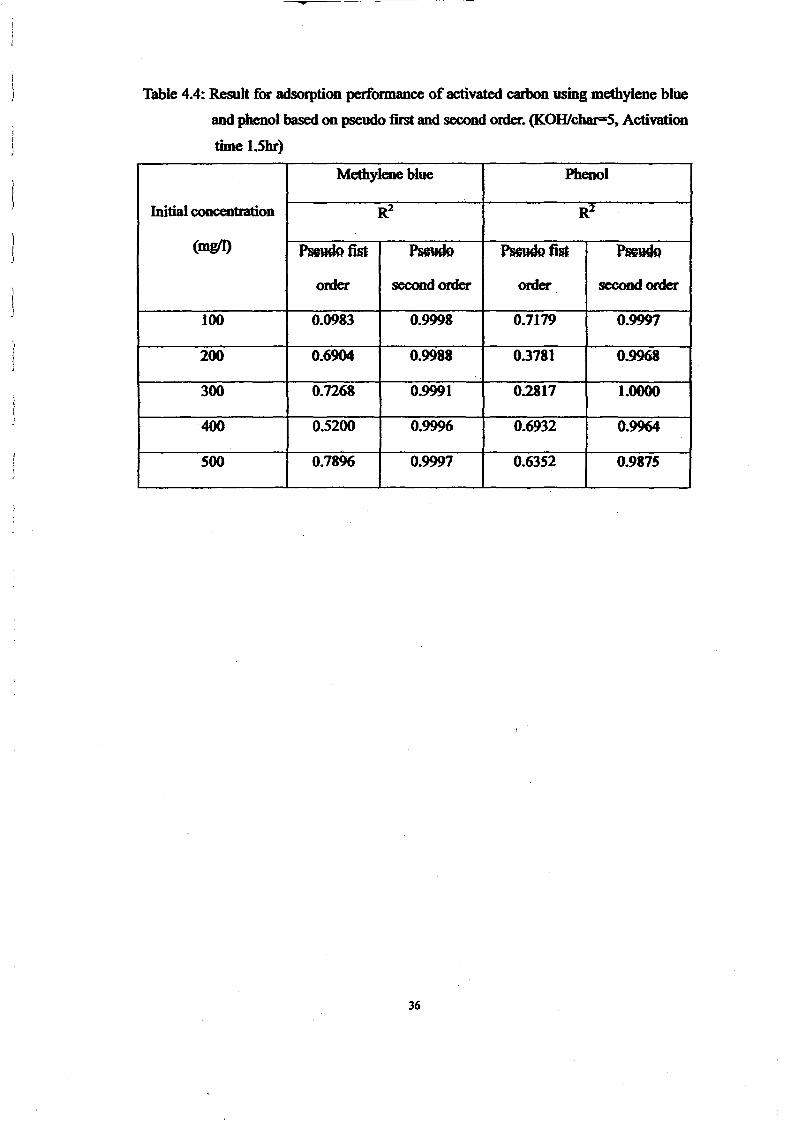
!i
)
..
Table 4.4: Result for adsorption performance ofactivated carbon using methylene blue
and phenolbased on pseudo first and second order. (KOHlchar=5. Activation
time 1.5br)
Methylene blue Phenol
Initial concentration R2 R2
(mgll) PsclMID fist PsllMID ·~·fist Ps;vOO
order second order order second onJer
100 0.0983 0.9998 0.7179 0.9997
200 0.6904 0.9988 0.3781 0.9968
300 0.7268 0.9991 0.2817 1.0000
400 0.5200 0.9996 0.6932 0.9964
SOO 0.7896 0.9997 0.63S2 0.987S
36