Embed Size (px)
Citation preview
Large-scale Measurements of WirelessNetwork Behavior
Sanjit [email protected]
John [email protected]
Edmund [email protected]
Raluca [email protected]
Apurv [email protected]
Cisco Meraki500 Terry Francois Blvd.San Francisco, CA 94158
ABSTRACTMeraki is a cloud-based network management system whichprovides centralized configuration, monitoring, and networktroubleshooting tools across hundreds of thousands of sitesworldwide. As part of its architecture, the Meraki systemhas built a database of time-series measurements of wirelesslink, client, and application behavior for monitoring and de-bugging purposes. This paper studies an anonymized subsetof measurements, containing data from approximately tenthousand radio access points, tens of thousands of links, and5.6 million clients from one-week periods in January 2014and January 2015 to provide a deeper understanding of real-world network behavior.
This paper observes the following phenomena: wirelessnetwork usage continues to grow quickly, driven most bygrowth in the number of devices connecting to each network.Intermediate link delivery rates are common indoors acrossa wide range of deployment environments. Typical accesspoints share spectrum with dozens of nearby networks, butthe presence of a network on a channel does not predictchannel utilization. Most access points see 2.4 GHz chan-nel utilization of 20% or more, with the top decile seeinggreater than 50%, and the majority of the channel use con-tains decodable 802.11 headers.
CCS Concepts•Networks → Wireless access points, base stations andinfrastructure; Network measurement;
Permission to make digital or hard copies of all or part of this work for personalor classroom use is granted without fee provided that copies are not made ordistributed for profit or commercial advantage and that copies bear this noticeand the full citation on the first page. Copyrights for components of this workowned by others than ACM must be honored. Abstracting with credit is per-mitted. To copy otherwise, or republish, to post on servers or to redistribute tolists, requires prior specific permission and/or a fee. Request permissions [email protected].
SIGCOMM ’15, August 17 - 21, 2015, London, United Kingdomc© 2015 ACM. ISBN 978-1-4503-3542-3/15/08. . . $15.00
DOI: http://dx.doi.org/10.1145/2785956.2787489
Keywords802.11, large-scale measurements, network usage data
1. INTRODUCTIONOver the past 20 years, wireless LANs based on 802.11
have become common in office and campus environments.Recent estimates suggest over 10 billion WiFi devices havebeen sold in total and that over 4.5 billion of those devicesare in use today [3]. These devices use the same underlyingstandards and frequency bands defined in the mid-1990s, re-sulting in an increasingly crowded wireless environment.
Several papers have studied wireless network behavior,from indoor and outdoor links, to campus-scale user behav-ior. These papers have helped improve our understandingof how real-world networks behave, resulting in improve-ments to simulators, debugging tools, and protocols. How-ever, there are few studies that analyze a large cohort of wire-less LAN networks or over a long period of time.
The Meraki system provides a unique perspective over awide range of networks due to its cloud-based managementarchitecture. Each Meraki access point is polled periodicallyby the Meraki system for a number of statistics about thestate of the wireless channels, associated clients, and appli-cation traffic statistics for each associated client. This infor-mation is written to a database, aggregated, and presented tonetwork administrators through a central web service.
Since its inception in 2006, this database has grown tocontain information from millions of network devices, in-cluding access points, switches, routers, and client devicessuch as laptops and smartphones.
This paper contributes a detailed look at network behav-ior, using an anonymized subset of the data contained inthe Meraki system. By filtering for devices based on theirtype of hardware platform and choosing a large set of de-vices, we are able to plot trends which are not influenced byfactors such as variations between chipsets, changes in cus-tomer type, or network policy. Specifically, we look at thethe following four sets of data:
153
Cisco Meraki MR16 Cisco Meraki MR18CPU Qualcomm Atheros AR7161 680MHz Qualcomm Atheros QCA9557 SoCMemory 64MB DDR 128MB DDR2Radio Qualcomm Atheros AR9223 (2.4 GHz),
AR9220 (5 GHz) PCI 2x2 802.11nchipset
On-chip Qualcomm Atheros QCA9557radio (2.4 GHz) with external power am-plifier, AR9592 5 GHz PCI 2x2, AR95921x1 PCI scanning radio
Transmit power 23 dBm (2.4 GHz), 24 dBm (5 GHz) 24 dBm (2.4 GHz), 24 dBm (5 GHz)Antenna Built-in 3dBi 2.4 GHz, 5dBi 5 GHz Built-in 3dBi 2.4 GHz, 5dBi 5 GHz
Table 1: Hardware platforms used to measure link delivery and channel utilization in Sections 4 and 5
1. For a set of 20,667 networks which serve over five mil-lion unique clients a week, we examine the wirelesscapabilities of the clients as well as the OSes and appli-cations the clients use. Our data also provides insightinto the traffic characteristics of various applications aswell as how clients have changed in the past year.
2. For a set of 10,000 Cisco Meraki MR16 802.11n accesspoints, we summarize the link delivery characteristicsof over 20,000 wireless link pairs measured by periodicbroadcasts sent by the access points.
3. Using the same set of access points, we examine theaverage channel utilization of the 2.4 GHz and 5 GHzbands over a period of six months.
4. With a set of 10,000 Cisco Meraki MR18 802.11n ac-cess points, which contain a third radio capable of cap-turing spectral data, we examine more detailed short-term channel measurements.
The remainder of the paper is organized as follows: Sec-tion 2 outlines the architecture of the Meraki system and de-tails about the hardware platforms used in the study. Section3 studies client and application usage and provides tablesdemonstrating changes in usage over several years. Section4 describes our method for measuring link-level statistics be-tween access points and studies the distribution of link de-livery rates. Section 5 looks specifically at wireless channelutilization at a fine-grain level. Section 6 describes somereal-world challenges faced by the Meraki system. Finally,Section 7 discusses related work, and Section 8 concludes.
2. SYSTEM ARCHITECTUREThe Meraki system consists of access points, switches,
and firewalls at customer sites, and a centrally hosted man-agement system, known as the backend system.
Each network in the Meraki system can contain a com-bination of these wireless and wired network devices thatall report data to the backend system in the same way. Thebackend system itself is distributed across several data cen-ters; for the purposes of this paper, we treat the backend sys-tem as a single data store.
Each piece of Meraki networking equipment maintainspersistent encrypted tunnels to two different backend data
centers. Using these connections, the backend periodicallyharvests statistics from each network device using protocols,built with Google Protocol Buffers [21] to minimize report-ing overhead.
A typical access point averages around 1 kilobit per sec-ond to report to the backend. These tunnels are used only forstatistics and configuration; client traffic is routed directly tothe local network or the Internet. In the event a device is un-able to reach the Meraki backend, normal client routing andaccounting continues. The backend polls for queued infor-mation when the connection is reestablished.
The Meraki backend system is designed to handle ma-chine upgrades, schema changes and new software revisionswithout affecting the measurement data. The system oper-ates using a pull mechanism, which helps regulate the flowof updates to the database during times of peak load.
2.1 Hardware platformsThe various Meraki hardware platforms contain a similar
system architecture and share a Linux codebase, but eachproduct family contains application-specific chipsets. Theyconsist of a general purpose CPU (single or multi-core) run-ning Linux and the Click Modular Router [14], coupled withmultiple 802.11 radios (for wireless access points), multi-ple Gigabit Ethernet interfaces (for security appliances) ora 24/48 port Gigabit or 10 Gigabit switch fabric (for edgeswitches). This paper focuses only on data from wirelessaccess points.
Each the platform is designed to forward traffic at line-ratewhile still being able to track client metadata and detailedapplication usage statistics about individual TCP flows. Thefast data path is handled either in hardware (for switchingplatforms) or in the device driver and in the Click modularrouter (for security appliances and wireless access points).Elements within the Click modular router on the fast pathhandle policy routing decisions, client firewall rules, andtrack application classification and usage for each MAC ad-dress. Other specific types of traffic are processed along theslow path, such as ARP, DHCP, DNS, multicast DNS, TCPSYN/FIN, packets containing HTTP headers, and packetscontaining SSL handshakes. Traffic along the slow path isfiltered in the driver or hardware and handled entirely bythe Click modular router to identify specific application traf-fic. Click contains elements to extract additional in-memory
154
metadata information from these traffic flows, such as host-names, operating system fingerprints, and application-levelusage data. This metadata is used to identify flows and up-date application usage data counters, similar to [17]. Thereare about 200 application identification rules that use themetadata to identify TCP flows and applications. The userand application analysis was done on a worldwide set of20,667 networks containing two Meraki access point mod-els, which are further described in Section 3.
The wireless measurements in Section 4 were taken onset of 10,000 identical Cisco Meraki MR16 access pointslocated in the US to simplify analysis. These access pointswere deployed in between 2010 and 2014 were in continuousoperation measurement period from January 2014 throughJanuary 2015. Similarly, in Section 5 we consider a set of10,000 identical Cisco Meraki MR18 access points, equip-ped with a dedicated scanning radio. All access points werelocated in the United States and followed the FCC Part 15regulatory limits. Table 1 describes the access point hard-ware used to create the data set.
2.2 Firmware revisionsDuring the measurement period, there were a total of 2
major firmware revisions applied to the access points. Therough dates of these upgrades are January and December2014. The lower layers of the driver and HAL were notchanged, as the updates included routine package securityupdates and added higher level features related to manage-ment and access control features.
2.3 Data collectionIn addition to per-client and flow traffic statistics, each ac-
cess point measures and records wireless channel statistics.The traffic statistics and additional measurements are peri-odically polled by the Meraki backend system and recordedin long term storage. For usage statistics such as byte coun-ters and application usage, local statistics are aggregated byMAC address in the backend (to account for roaming).
3. NETWORK USAGEIn this section, we take a look at the clients that connect
to our access points. In particular, we examine client radiocapabilities, the OSes and applications that are most com-monly used by clients, and how usage patterns have changedover the past year.
The data presented here were collected from 20,667 wire-less networks operated by 11,788 different administrative or-ganizations. All of these networks have at least two wirelessaccess points and have application traffic profiling enabled.All usage data was collected over the one-week period ofJanuary 15-22 in 2014 and 2015. We show the numbers for2015 and provide the percent increase (“% increase”) com-pared to 2014.
The sampled networks include both urban and rural de-ployments throughout the world. Table 2 describes the mixof networks in the data set organized by industry type.
To preserve anonymity, all of our data are presented onlyas an aggregate over all of these networks.
Industry # networksArchitecture/Engineering 127Construction 333Consulting 365Education 4,075Finance/Insurance 737Government/Public Sector 1,112Healthcare 1,382Hospitality 493Industrial/Manufacturing 1,220Legal 264Media/Advertising 427Non-Profit 640Real Estate 386Restaurants 296Retail 2,355Tech 983Telecom 442VAR/System Integrator 2,876Other 2,154Total 20,667
Table 2: Network deployment types for the applicationusage data set. There are a wide range of industrial ver-ticals and the networks are not dominated by one partic-ular industry.
3.1 Client devices and signal strengthOur access points collect information about the 802.11
capabilities advertised by every client that connects to thenetwork. Table 4 summarizes how these capabilities havechanged over one year.
In summary, we found that:
• 802.11ac clients became much more common over theyear: at the end of the sampling period 18% of clientswere 11ac-capable.
• A majority of clients now have 5 GHz capability, butnearly 40% of all clients remain 2.4 GHz only.
• Multi-stream clients, became more common, and nowabout 25% of clients support multiple spatial streams.
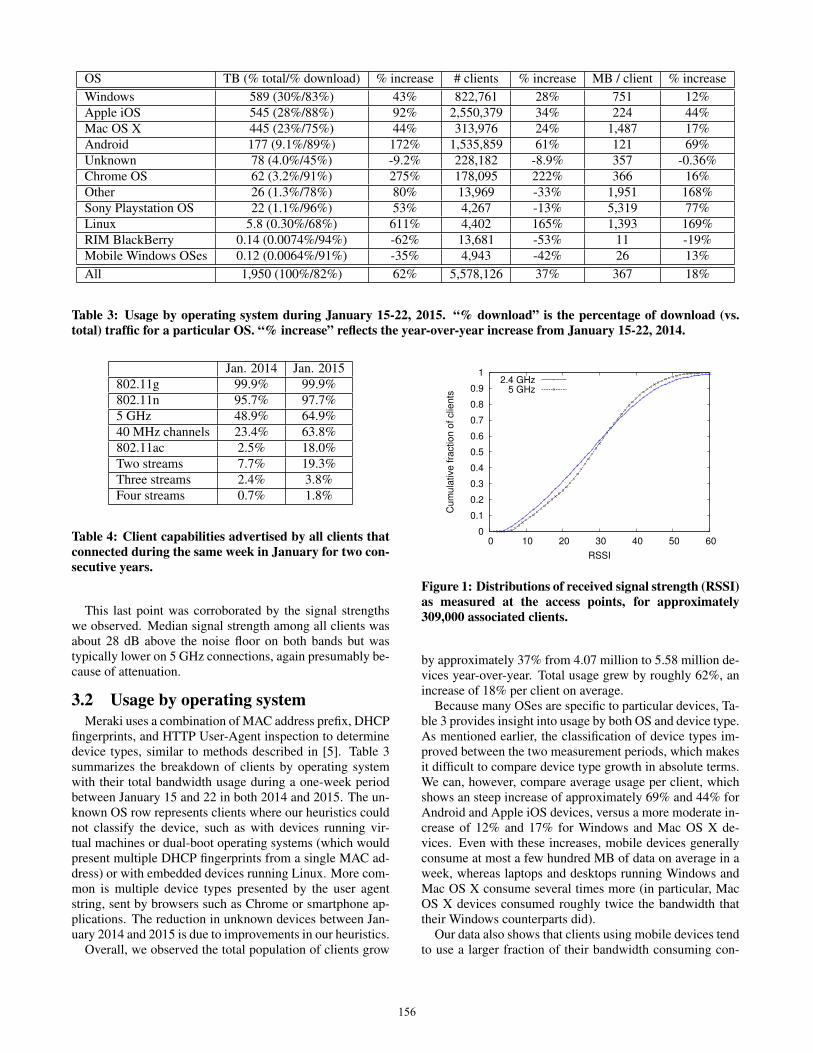
Another item of interest is the strength of clients’ connec-tions to the network. Our system does not keep a histori-cal record of client signal strength, but, through our central-ized infrastructure, we are able to collect a snapshot of RSSIacross all connected clients in real time. Figure 1 shows thedistribution of client signal strength among about 309,000clients that were connected one evening in January 2015.
At the time of the snapshot, about 249,000 (80%) of theseclients were connected on the 2.4 GHz band, and 60,000were connected at 5 GHz. This is interesting given the abovedata which show that about 65% of clients are 5 GHz capa-ble. The difference is presumably due to greater attenuationat 5 GHz, which makes it harder for clients to associate onthe higher band.
155
OS TB (% total/% download) % increase # clients % increase MB / client % increaseWindows 589 (30%/83%) 43% 822,761 28% 751 12%Apple iOS 545 (28%/88%) 92% 2,550,379 34% 224 44%Mac OS X 445 (23%/75%) 44% 313,976 24% 1,487 17%Android 177 (9.1%/89%) 172% 1,535,859 61% 121 69%Unknown 78 (4.0%/45%) -9.2% 228,182 -8.9% 357 -0.36%Chrome OS 62 (3.2%/91%) 275% 178,095 222% 366 16%Other 26 (1.3%/78%) 80% 13,969 -33% 1,951 168%Sony Playstation OS 22 (1.1%/96%) 53% 4,267 -13% 5,319 77%Linux 5.8 (0.30%/68%) 611% 4,402 165% 1,393 169%RIM BlackBerry 0.14 (0.0074%/94%) -62% 13,681 -53% 11 -19%Mobile Windows OSes 0.12 (0.0064%/91%) -35% 4,943 -42% 26 13%All 1,950 (100%/82%) 62% 5,578,126 37% 367 18%
Table 3: Usage by operating system during January 15-22, 2015. “% download” is the percentage of download (vs.total) traffic for a particular OS. “% increase” reflects the year-over-year increase from January 15-22, 2014.
Jan. 2014 Jan. 2015802.11g 99.9% 99.9%802.11n 95.7% 97.7%5 GHz 48.9% 64.9%40 MHz channels 23.4% 63.8%802.11ac 2.5% 18.0%Two streams 7.7% 19.3%Three streams 2.4% 3.8%Four streams 0.7% 1.8%
Table 4: Client capabilities advertised by all clients thatconnected during the same week in January for two con-secutive years.
This last point was corroborated by the signal strengthswe observed. Median signal strength among all clients wasabout 28 dB above the noise floor on both bands but wastypically lower on 5 GHz connections, again presumably be-cause of attenuation.
3.2 Usage by operating systemMeraki uses a combination of MAC address prefix, DHCP
fingerprints, and HTTP User-Agent inspection to determinedevice types, similar to methods described in [5]. Table 3summarizes the breakdown of clients by operating systemwith their total bandwidth usage during a one-week periodbetween January 15 and 22 in both 2014 and 2015. The un-known OS row represents clients where our heuristics couldnot classify the device, such as with devices running vir-tual machines or dual-boot operating systems (which wouldpresent multiple DHCP fingerprints from a single MAC ad-dress) or with embedded devices running Linux. More com-mon is multiple device types presented by the user agentstring, sent by browsers such as Chrome or smartphone ap-plications. The reduction in unknown devices between Jan-uary 2014 and 2015 is due to improvements in our heuristics.
Overall, we observed the total population of clients grow
0
0.1
0.2
0.3
0.4
0.5
0.6
0.7
0.8
0.9
1
0 10 20 30 40 50 60
Cu
mu
lative
fra
ctio
n o
f clie
nts
RSSI
2.4 GHz
5 GHz
Figure 1: Distributions of received signal strength (RSSI)as measured at the access points, for approximately309,000 associated clients.
by approximately 37% from 4.07 million to 5.58 million de-vices year-over-year. Total usage grew by roughly 62%, anincrease of 18% per client on average.
Because many OSes are specific to particular devices, Ta-ble 3 provides insight into usage by both OS and device type.As mentioned earlier, the classification of device types im-proved between the two measurement periods, which makesit difficult to compare device type growth in absolute terms.We can, however, compare average usage per client, whichshows an steep increase of approximately 69% and 44% forAndroid and Apple iOS devices, versus a more moderate in-crease of 12% and 17% for Windows and Mac OS X de-vices. Even with these increases, mobile devices generallyconsume at most a few hundred MB of data on average in aweek, whereas laptops and desktops running Windows andMac OS X consume several times more (in particular, MacOS X devices consumed roughly twice the bandwidth thattheir Windows counterparts did).
Our data also shows that clients using mobile devices tendto use a larger fraction of their bandwidth consuming con-
156
tent as compared to traditional desktops and laptops. Mobiledevices download roughly 9 times more than they upload(in contrast, Mac OS X devices download closer to 3 timesmore). While mobile platforms have lower average usage,the number of mobile devices greatly outnumber laptops anddesktops: we saw three times more Apple iOS devices thanWindows devices, making the total usage of Apple iOS com-parable to Windows, the most popular OS by usage.
Linux also registered extraordinary growth on our net-works, which we attribute to the small number of clients in2014, improved OS identification heuristics, and the increas-ing proliferation of Linux-based embedded devices. Finally,we observed significant per-client usage for Sony Playstationand Microsoft Xbox (not shown), most of which is down-stream. This usage is not surprising given that game con-soles are often used to stream media and play games that usenetwork connectivity for content or functionality.
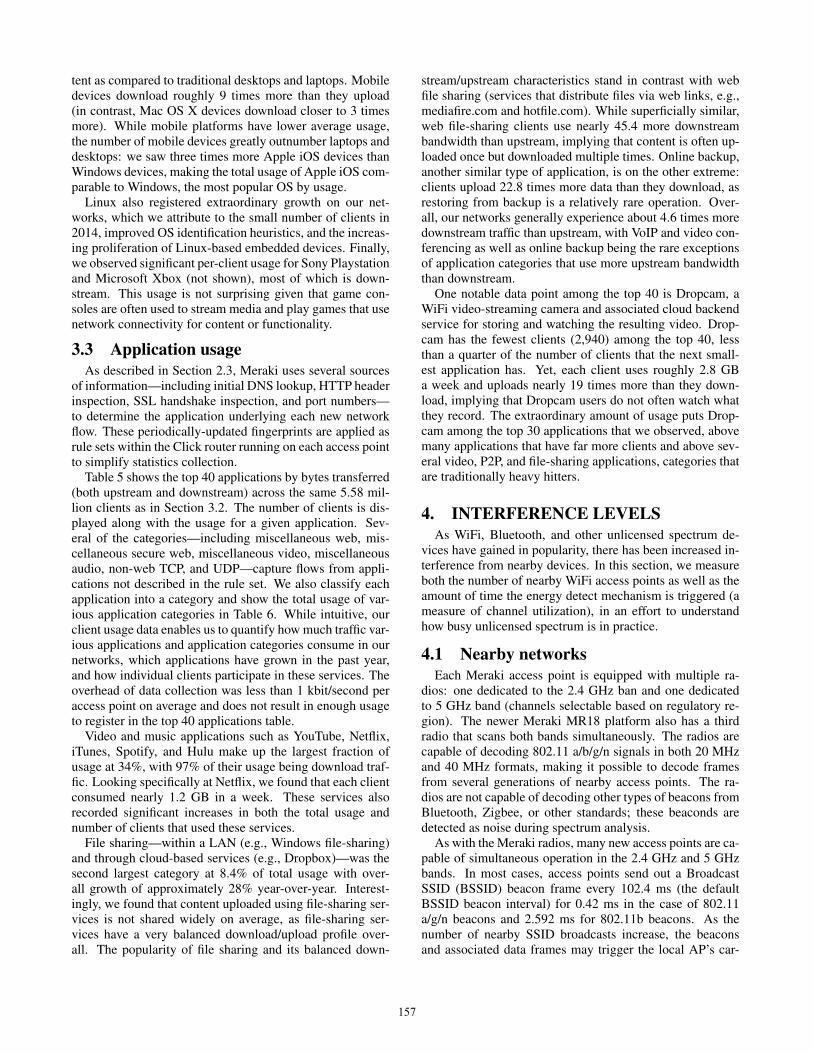
3.3 Application usageAs described in Section 2.3, Meraki uses several sources
of information—including initial DNS lookup, HTTP headerinspection, SSL handshake inspection, and port numbers—to determine the application underlying each new networkflow. These periodically-updated fingerprints are applied asrule sets within the Click router running on each access pointto simplify statistics collection.
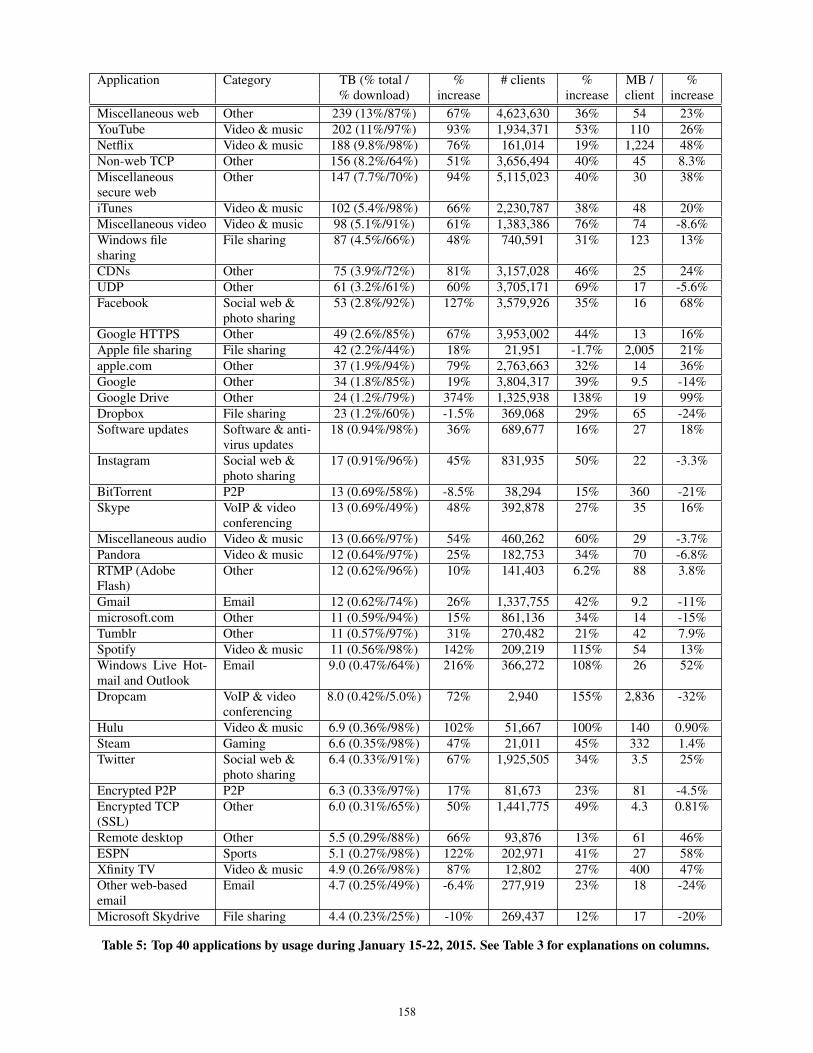
Table 5 shows the top 40 applications by bytes transferred(both upstream and downstream) across the same 5.58 mil-lion clients as in Section 3.2. The number of clients is dis-played along with the usage for a given application. Sev-eral of the categories—including miscellaneous web, mis-cellaneous secure web, miscellaneous video, miscellaneousaudio, non-web TCP, and UDP—capture flows from appli-cations not described in the rule set. We also classify eachapplication into a category and show the total usage of var-ious application categories in Table 6. While intuitive, ourclient usage data enables us to quantify how much traffic var-ious applications and application categories consume in ournetworks, which applications have grown in the past year,and how individual clients participate in these services. Theoverhead of data collection was less than 1 kbit/second peraccess point on average and does not result in enough usageto register in the top 40 applications table.
Video and music applications such as YouTube, Netflix,iTunes, Spotify, and Hulu make up the largest fraction ofusage at 34%, with 97% of their usage being download traf-fic. Looking specifically at Netflix, we found that each clientconsumed nearly 1.2 GB in a week. These services alsorecorded significant increases in both the total usage andnumber of clients that used these services.
File sharing—within a LAN (e.g., Windows file-sharing)and through cloud-based services (e.g., Dropbox)—was thesecond largest category at 8.4% of total usage with over-all growth of approximately 28% year-over-year. Interest-ingly, we found that content uploaded using file-sharing ser-vices is not shared widely on average, as file-sharing ser-vices have a very balanced download/upload profile over-all. The popularity of file sharing and its balanced down-
stream/upstream characteristics stand in contrast with webfile sharing (services that distribute files via web links, e.g.,mediafire.com and hotfile.com). While superficially similar,web file-sharing clients use nearly 45.4 more downstreambandwidth than upstream, implying that content is often up-loaded once but downloaded multiple times. Online backup,another similar type of application, is on the other extreme:clients upload 22.8 times more data than they download, asrestoring from backup is a relatively rare operation. Over-all, our networks generally experience about 4.6 times moredownstream traffic than upstream, with VoIP and video con-ferencing as well as online backup being the rare exceptionsof application categories that use more upstream bandwidththan downstream.
One notable data point among the top 40 is Dropcam, aWiFi video-streaming camera and associated cloud backendservice for storing and watching the resulting video. Drop-cam has the fewest clients (2,940) among the top 40, lessthan a quarter of the number of clients that the next small-est application has. Yet, each client uses roughly 2.8 GBa week and uploads nearly 19 times more than they down-load, implying that Dropcam users do not often watch whatthey record. The extraordinary amount of usage puts Drop-cam among the top 30 applications that we observed, abovemany applications that have far more clients and above sev-eral video, P2P, and file-sharing applications, categories thatare traditionally heavy hitters.
4. INTERFERENCE LEVELSAs WiFi, Bluetooth, and other unlicensed spectrum de-
vices have gained in popularity, there has been increased in-terference from nearby devices. In this section, we measureboth the number of nearby WiFi access points as well as theamount of time the energy detect mechanism is triggered (ameasure of channel utilization), in an effort to understandhow busy unlicensed spectrum is in practice.
4.1 Nearby networksEach Meraki access point is equipped with multiple ra-
dios: one dedicated to the 2.4 GHz ban and one dedicatedto 5 GHz band (channels selectable based on regulatory re-gion). The newer Meraki MR18 platform also has a thirdradio that scans both bands simultaneously. The radios arecapable of decoding 802.11 a/b/g/n signals in both 20 MHzand 40 MHz formats, making it possible to decode framesfrom several generations of nearby access points. The ra-dios are not capable of decoding other types of beacons fromBluetooth, Zigbee, or other standards; these beaconds aredetected as noise during spectrum analysis.
As with the Meraki radios, many new access points are ca-pable of simultaneous operation in the 2.4 GHz and 5 GHzbands. In most cases, access points send out a BroadcastSSID (BSSID) beacon frame every 102.4 ms (the defaultBSSID beacon interval) for 0.42 ms in the case of 802.11a/g/n beacons and 2.592 ms for 802.11b beacons. As thenumber of nearby SSID broadcasts increase, the beaconsand associated data frames may trigger the local AP’s car-
157
Application Category TB (% total / % # clients % MB / %% download) increase increase client increase
Miscellaneous web Other 239 (13%/87%) 67% 4,623,630 36% 54 23%YouTube Video & music 202 (11%/97%) 93% 1,934,371 53% 110 26%Netflix Video & music 188 (9.8%/98%) 76% 161,014 19% 1,224 48%Non-web TCP Other 156 (8.2%/64%) 51% 3,656,494 40% 45 8.3%Miscellaneoussecure web
Other 147 (7.7%/70%) 94% 5,115,023 40% 30 38%
iTunes Video & music 102 (5.4%/98%) 66% 2,230,787 38% 48 20%Miscellaneous video Video & music 98 (5.1%/91%) 61% 1,383,386 76% 74 -8.6%Windows filesharing
File sharing 87 (4.5%/66%) 48% 740,591 31% 123 13%
CDNs Other 75 (3.9%/72%) 81% 3,157,028 46% 25 24%UDP Other 61 (3.2%/61%) 60% 3,705,171 69% 17 -5.6%Facebook Social web &
photo sharing53 (2.8%/92%) 127% 3,579,926 35% 16 68%
Google HTTPS Other 49 (2.6%/85%) 67% 3,953,002 44% 13 16%Apple file sharing File sharing 42 (2.2%/44%) 18% 21,951 -1.7% 2,005 21%apple.com Other 37 (1.9%/94%) 79% 2,763,663 32% 14 36%Google Other 34 (1.8%/85%) 19% 3,804,317 39% 9.5 -14%Google Drive Other 24 (1.2%/79%) 374% 1,325,938 138% 19 99%Dropbox File sharing 23 (1.2%/60%) -1.5% 369,068 29% 65 -24%Software updates Software & anti-
virus updates18 (0.94%/98%) 36% 689,677 16% 27 18%
Instagram Social web &photo sharing
17 (0.91%/96%) 45% 831,935 50% 22 -3.3%
BitTorrent P2P 13 (0.69%/58%) -8.5% 38,294 15% 360 -21%Skype VoIP & video
conferencing13 (0.69%/49%) 48% 392,878 27% 35 16%
Miscellaneous audio Video & music 13 (0.66%/97%) 54% 460,262 60% 29 -3.7%Pandora Video & music 12 (0.64%/97%) 25% 182,753 34% 70 -6.8%RTMP (AdobeFlash)
Other 12 (0.62%/96%) 10% 141,403 6.2% 88 3.8%
Gmail Email 12 (0.62%/74%) 26% 1,337,755 42% 9.2 -11%microsoft.com Other 11 (0.59%/94%) 15% 861,136 34% 14 -15%Tumblr Other 11 (0.57%/97%) 31% 270,482 21% 42 7.9%Spotify Video & music 11 (0.56%/98%) 142% 209,219 115% 54 13%Windows Live Hot-mail and Outlook
Email 9.0 (0.47%/64%) 216% 366,272 108% 26 52%
Dropcam VoIP & videoconferencing
8.0 (0.42%/5.0%) 72% 2,940 155% 2,836 -32%
Hulu Video & music 6.9 (0.36%/98%) 102% 51,667 100% 140 0.90%Steam Gaming 6.6 (0.35%/98%) 47% 21,011 45% 332 1.4%Twitter Social web &
photo sharing6.4 (0.33%/91%) 67% 1,925,505 34% 3.5 25%
Encrypted P2P P2P 6.3 (0.33%/97%) 17% 81,673 23% 81 -4.5%Encrypted TCP(SSL)
Other 6.0 (0.31%/65%) 50% 1,441,775 49% 4.3 0.81%
Remote desktop Other 5.5 (0.29%/88%) 66% 93,876 13% 61 46%ESPN Sports 5.1 (0.27%/98%) 122% 202,971 41% 27 58%Xfinity TV Video & music 4.9 (0.26%/98%) 87% 12,802 27% 400 47%Other web-basedemail
Email 4.7 (0.25%/49%) -6.4% 277,919 23% 18 -24%
Microsoft Skydrive File sharing 4.4 (0.23%/25%) -10% 269,437 12% 17 -20%
Table 5: Top 40 applications by usage during January 15-22, 2015. See Table 3 for explanations on columns.
158
Category TB (% total/% download) % increase # clients % increase MB / client % increaseOther 901 (47%/77%) 65% 5,617,395 39% 168 19%Video & music 648 (34%/97%) 75% 5,047,976 49% 135 17%File sharing 160 (8.4%/58%) 28% 1,209,821 28% 138 0.12%Social web & photosharing
81 (4.2%/93%) 92% 4,691,155 39% 18 38%
Email 32 (1.7%/67%) 41% 2,632,542 38% 13 2.5%VoIP & videoconferencing
24 (1.3%/35%) 55% 483,222 22% 52 27%
Peer-to-peer (P2P) 20 (1.0%/70%) -1.3% 113,720 22% 184 -19%Software &anti-virus updates
20 (1.0%/98%) 28% 699,776 15% 29 11%
Gaming 11 (0.57%/96%) 49% 199,804 45% 57 2.8%Sports 5.3 (0.28%/98%) 117% 225,875 35% 24 60%News 4.2 (0.22%/95%) 76% 856,913 12% 5.2 57%Online backup 2.9 (0.15%/4.2%) 10% 7,576 26% 401 -13%Blogging 0.74 (0.039%/97%) -34% 487,085 -2.1% 1.6 -32%Web file sharing 0.32 (0.017%/98%) -27% 10,822 -22% 31 -6.6%
Table 6: Usage by application categories during January 15-22, 2015. See Table 3 for explanations on columns.
1 3 5 7 9 11 40 48 56 64 104 112 120 128 136 149 157 165
Channel
Nu
mb
er
of
ne
arb
y n
etw
ork
s
02
00
00
40
00
06
000
0
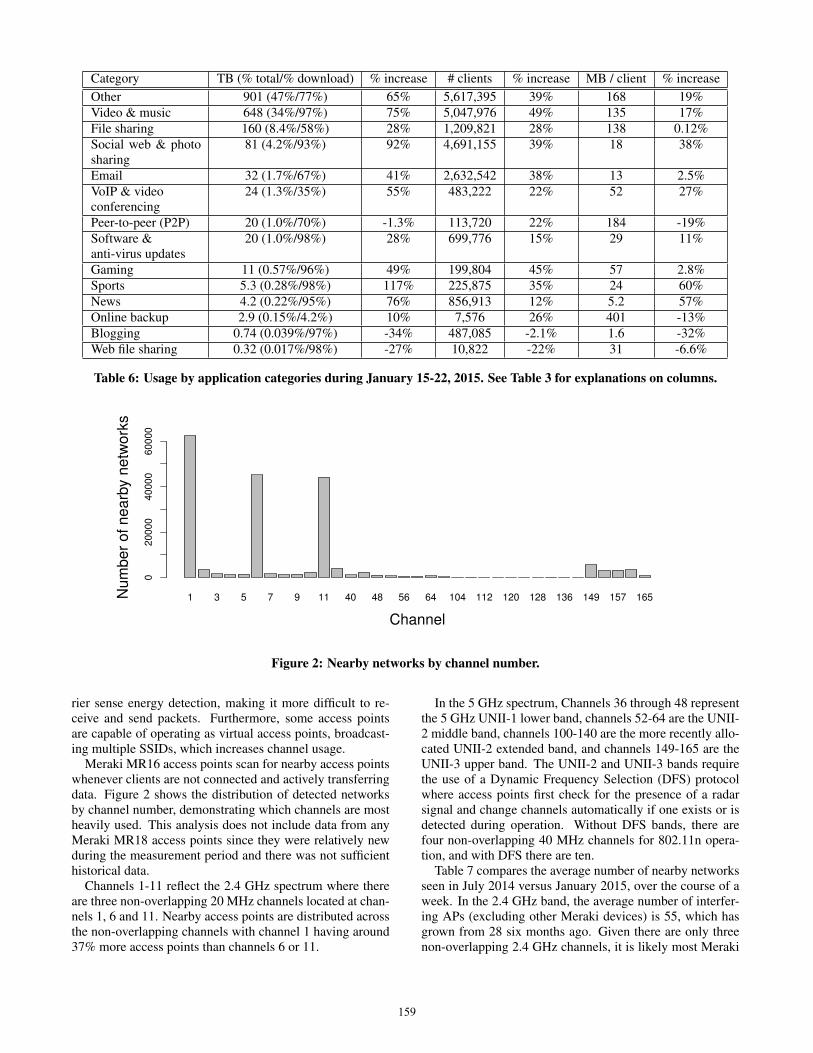
Figure 2: Nearby networks by channel number.
rier sense energy detection, making it more difficult to re-ceive and send packets. Furthermore, some access pointsare capable of operating as virtual access points, broadcast-ing multiple SSIDs, which increases channel usage.
Meraki MR16 access points scan for nearby access pointswhenever clients are not connected and actively transferringdata. Figure 2 shows the distribution of detected networksby channel number, demonstrating which channels are mostheavily used. This analysis does not include data from anyMeraki MR18 access points since they were relatively newduring the measurement period and there was not sufficienthistorical data.
Channels 1-11 reflect the 2.4 GHz spectrum where thereare three non-overlapping 20 MHz channels located at chan-nels 1, 6 and 11. Nearby access points are distributed acrossthe non-overlapping channels with channel 1 having around37% more access points than channels 6 or 11.
In the 5 GHz spectrum, Channels 36 through 48 representthe 5 GHz UNII-1 lower band, channels 52-64 are the UNII-2 middle band, channels 100-140 are the more recently allo-cated UNII-2 extended band, and channels 149-165 are theUNII-3 upper band. The UNII-2 and UNII-3 bands requirethe use of a Dynamic Frequency Selection (DFS) protocolwhere access points first check for the presence of a radarsignal and change channels automatically if one exists or isdetected during operation. Without DFS bands, there arefour non-overlapping 40 MHz channels for 802.11n opera-tion, and with DFS there are ten.
Table 7 compares the average number of nearby networksseen in July 2014 versus January 2015, over the course of aweek. In the 2.4 GHz band, the average number of interfer-ing APs (excluding other Meraki devices) is 55, which hasgrown from 28 six months ago. Given there are only threenon-overlapping 2.4 GHz channels, it is likely most Meraki
159
Networks Networksper AP
2.4 GHz (now) 527,087 55.472.4 GHz (six months ago) 230,628 28.605 GHz (now) 35,010 3.685 GHz (six months ago) 19,921 2.47
Table 7: Increase in the number of nearby networks oversix months. 9,502 Meraki access points are reporting inJanuary 2015, versus 8,062 access points six months ago.This excludes the SSIDs of nearby Meraki access points.
access point will experience some amount of interferencefrom nearby APs. In the 5 GHz band the average number ofnon-Meraki access points is 3.68, up from 2.47 six monthsago, which suggests it is possible to find a non-overlappingchannel, even with 40 MHz channels. We identified that ap-proximately 20% (102,344) of the current nearby networksin the 2.4 GHz band are personal mobile hotspots (Nova-tel, Pantech, Sierra Wireless, etc.), compared to 56,293 sixmonths ago. In the 5 GHz, only 1.7% of the nearby accessnetworks are mobile hotspots.
4.2 Impact on packet receptionIn order to build a table of link metrics for use with mesh
routing, each Meraki access point periodically broadcasts a60-byte packet at 1 megabit/sec on its 2.4 GHz radio and6 megabits/sec on its 5 GHz radio. These broadcast pack-ets are sent once every 15 seconds and are measured over asliding window of 300 seconds, and the measurements arerecorded by the Meraki backend system.
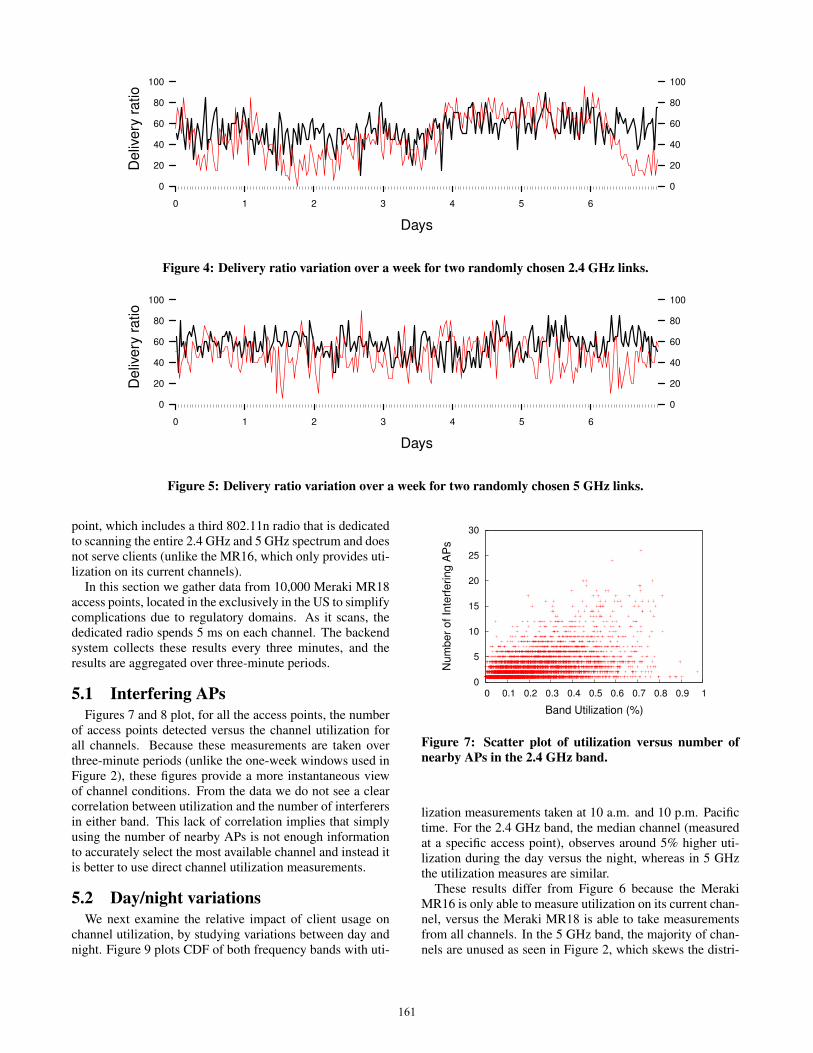
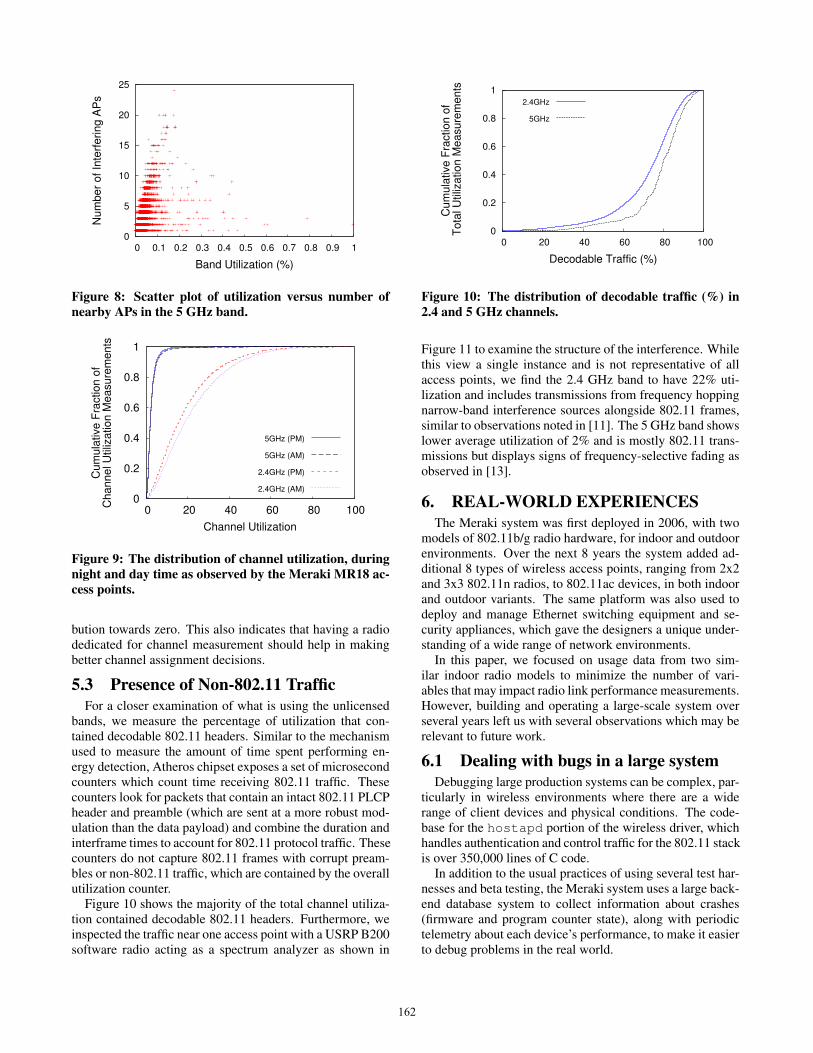
Figure 3 shows a distribution of link delivery ratios, for16,583 2.4 GHz links and 5,650 5 GHz links which werereported both six months ago and today. For 2.4 GHz band,the majority of links only receive a fraction of broadcasts,and the overall link delivery ratios have decreased over thepast six months. The intermediate links also show variationsin delivery rate over time, as demonstrated in Figure 4. Inthe 5 GHz bands, there are far fewer intermediate links, withover half of the links receiving all of the broadcasts. The5 GHz links also vary over time as illustrated in Figure 5 butthey are more consistent than the 2.4 GHz links.
The data suggests performance as a whole is degradingin the 2.4 GHz band, even for small 60-byte packets. Larger1,500-byte payloads and frame aggregates will be even moreadversely affected, which will have an affect of applicationperformance. Sub-frame error detection and correction tech-niques such as [16] may be necessary to make effective useof the 2.4 GHz band.
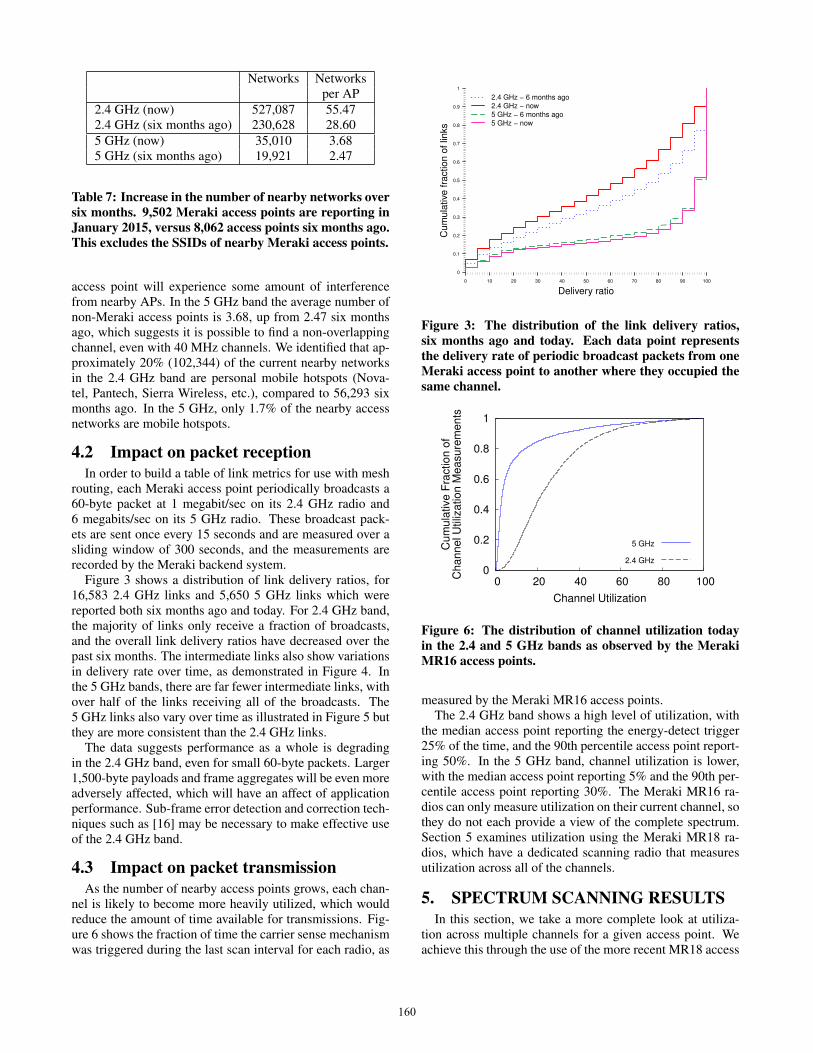
4.3 Impact on packet transmissionAs the number of nearby access points grows, each chan-
nel is likely to become more heavily utilized, which wouldreduce the amount of time available for transmissions. Fig-ure 6 shows the fraction of time the carrier sense mechanismwas triggered during the last scan interval for each radio, as
0 10 20 30 40 50 60 70 80 90 100
0
0.1
0.2
0.3
0.4
0.5
0.6
0.7
0.8
0.9
1
2.4 GHz − 6 months ago
2.4 GHz − now
5 GHz − 6 months ago
5 GHz − now
Delivery ratio
Cu
mu
lative
fra
ctio
n o
f lin
ks
Figure 3: The distribution of the link delivery ratios,six months ago and today. Each data point representsthe delivery rate of periodic broadcast packets from oneMeraki access point to another where they occupied thesame channel.
0
0.2
0.4
0.6
0.8
1
0 20 40 60 80 100
Cu
mu
lative
Fra
ctio
n o
f
Ch
an
ne
l U
tiliza
tio
n M
ea
su
rem
en
ts
Channel Utilization
5 GHz
2.4 GHz
Figure 6: The distribution of channel utilization todayin the 2.4 and 5 GHz bands as observed by the MerakiMR16 access points.
measured by the Meraki MR16 access points.The 2.4 GHz band shows a high level of utilization, with
the median access point reporting the energy-detect trigger25% of the time, and the 90th percentile access point report-ing 50%. In the 5 GHz band, channel utilization is lower,with the median access point reporting 5% and the 90th per-centile access point reporting 30%. The Meraki MR16 ra-dios can only measure utilization on their current channel, sothey do not each provide a view of the complete spectrum.Section 5 examines utilization using the Meraki MR18 ra-dios, which have a dedicated scanning radio that measuresutilization across all of the channels.
5. SPECTRUM SCANNING RESULTSIn this section, we take a more complete look at utiliza-
tion across multiple channels for a given access point. Weachieve this through the use of the more recent MR18 access
160
0 1 2 3 4 5 6
0
20
40
60
80
100
0
20
40
60
80
100
Days
Deliv
ery
ratio
Figure 4: Delivery ratio variation over a week for two randomly chosen 2.4 GHz links.
0 1 2 3 4 5 6
0
20
40
60
80
100
0
20
40
60
80
100
Days
Deliv
ery
ratio
Figure 5: Delivery ratio variation over a week for two randomly chosen 5 GHz links.
point, which includes a third 802.11n radio that is dedicatedto scanning the entire 2.4 GHz and 5 GHz spectrum and doesnot serve clients (unlike the MR16, which only provides uti-lization on its current channels).
In this section we gather data from 10,000 Meraki MR18access points, located in the exclusively in the US to simplifycomplications due to regulatory domains. As it scans, thededicated radio spends 5 ms on each channel. The backendsystem collects these results every three minutes, and theresults are aggregated over three-minute periods.
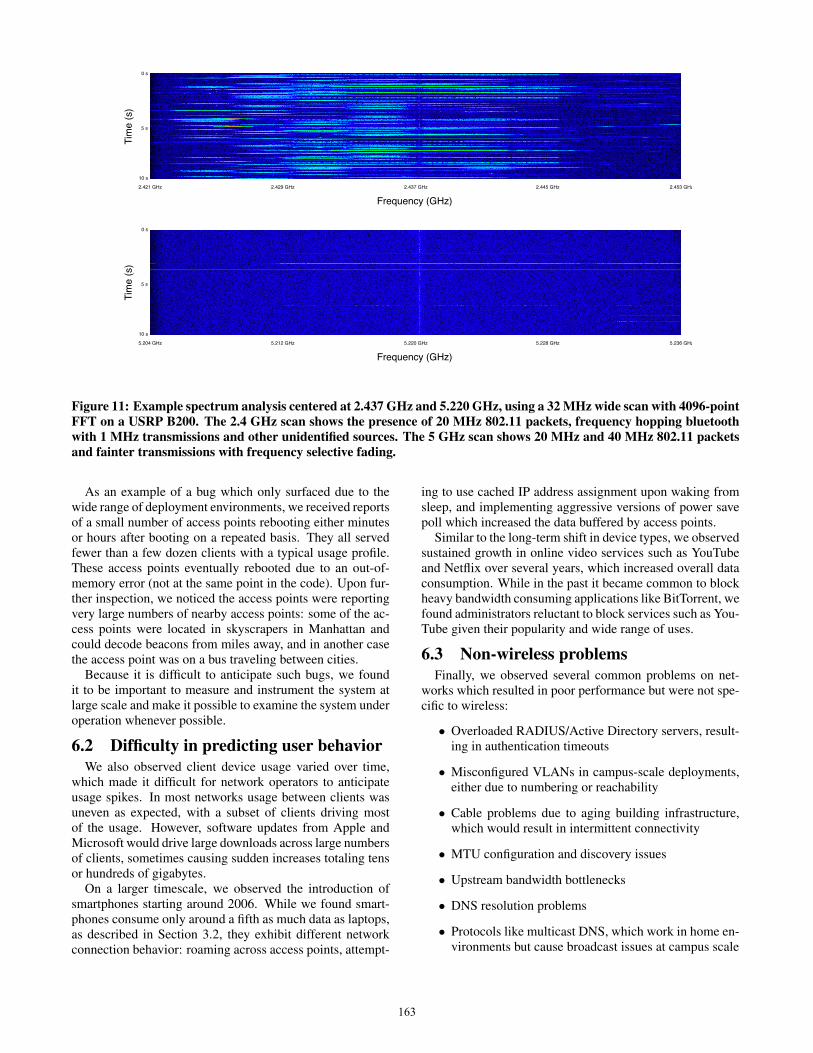
5.1 Interfering APsFigures 7 and 8 plot, for all the access points, the number
of access points detected versus the channel utilization forall channels. Because these measurements are taken overthree-minute periods (unlike the one-week windows used inFigure 2), these figures provide a more instantaneous viewof channel conditions. From the data we do not see a clearcorrelation between utilization and the number of interferersin either band. This lack of correlation implies that simplyusing the number of nearby APs is not enough informationto accurately select the most available channel and instead itis better to use direct channel utilization measurements.
5.2 Day/night variationsWe next examine the relative impact of client usage on
channel utilization, by studying variations between day andnight. Figure 9 plots CDF of both frequency bands with uti-
0
5
10
15
20
25
30
0 0.1 0.2 0.3 0.4 0.5 0.6 0.7 0.8 0.9 1
Nu
mb
er
of
Inte
rfe
rin
g A
Ps
Band Utilization (%)
Figure 7: Scatter plot of utilization versus number ofnearby APs in the 2.4 GHz band.
lization measurements taken at 10 a.m. and 10 p.m. Pacifictime. For the 2.4 GHz band, the median channel (measuredat a specific access point), observes around 5% higher uti-lization during the day versus the night, whereas in 5 GHzthe utilization measures are similar.
These results differ from Figure 6 because the MerakiMR16 is only able to measure utilization on its current chan-nel, versus the Meraki MR18 is able to take measurementsfrom all channels. In the 5 GHz band, the majority of chan-nels are unused as seen in Figure 2, which skews the distri-
161
0
5
10
15
20
25
0 0.1 0.2 0.3 0.4 0.5 0.6 0.7 0.8 0.9 1
Nu
mb
er
of
Inte
rfe
rin
g A
Ps
Band Utilization (%)
Figure 8: Scatter plot of utilization versus number ofnearby APs in the 5 GHz band.
0
0.2
0.4
0.6
0.8
1
0 20 40 60 80 100
Cu
mu
lative
Fra
ctio
n o
f
Ch
an
ne
l U
tiliza
tio
n M
ea
su
rem
en
ts
Channel Utilization
5GHz (PM)
5GHz (AM)
2.4GHz (PM)
2.4GHz (AM)
Figure 9: The distribution of channel utilization, duringnight and day time as observed by the Meraki MR18 ac-cess points.
bution towards zero. This also indicates that having a radiodedicated for channel measurement should help in makingbetter channel assignment decisions.
5.3 Presence of Non-802.11 TrafficFor a closer examination of what is using the unlicensed
bands, we measure the percentage of utilization that con-tained decodable 802.11 headers. Similar to the mechanismused to measure the amount of time spent performing en-ergy detection, Atheros chipset exposes a set of microsecondcounters which count time receiving 802.11 traffic. Thesecounters look for packets that contain an intact 802.11 PLCPheader and preamble (which are sent at a more robust mod-ulation than the data payload) and combine the duration andinterframe times to account for 802.11 protocol traffic. Thesecounters do not capture 802.11 frames with corrupt pream-bles or non-802.11 traffic, which are contained by the overallutilization counter.
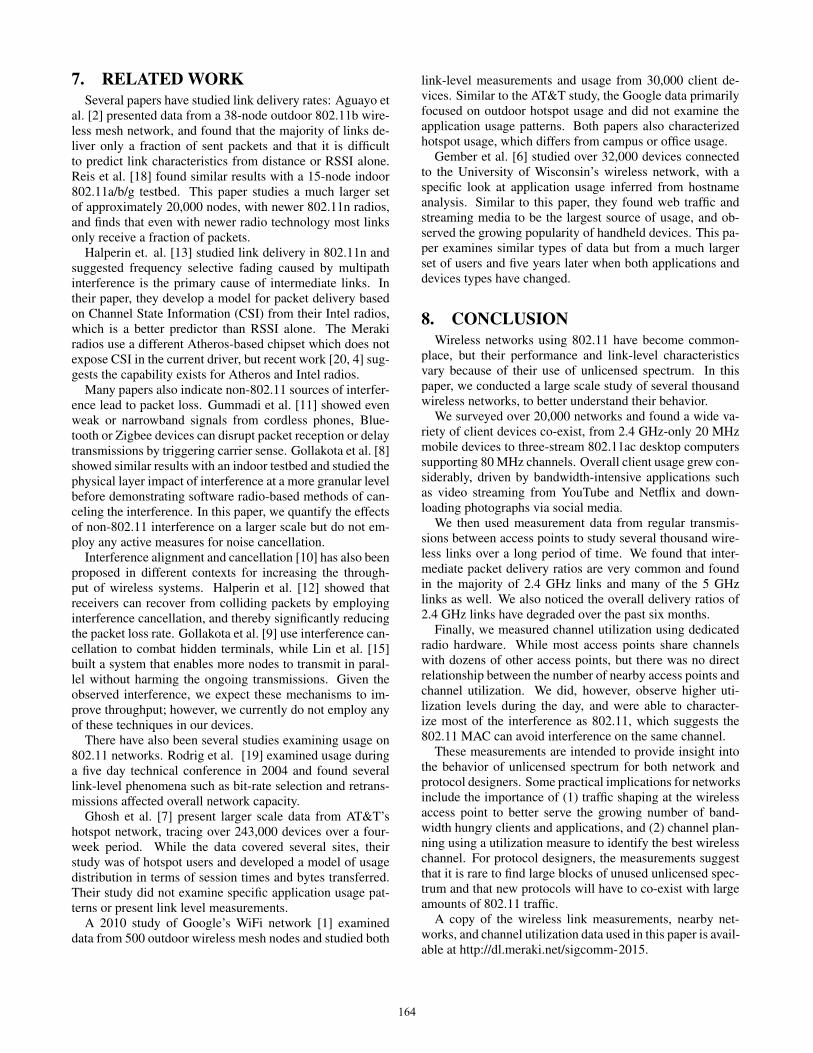
Figure 10 shows the majority of the total channel utiliza-tion contained decodable 802.11 headers. Furthermore, weinspected the traffic near one access point with a USRP B200software radio acting as a spectrum analyzer as shown in
0
0.2
0.4
0.6
0.8
1
0 20 40 60 80 100
Cu
mu
lative
Fra
ctio
n o
f
To
tal U
tiliza
tio
n M
ea
su
rem
en
ts
Decodable Traffic (%)
2.4GHz
5GHz
Figure 10: The distribution of decodable traffic (%) in2.4 and 5 GHz channels.
Figure 11 to examine the structure of the interference. Whilethis view a single instance and is not representative of allaccess points, we find the 2.4 GHz band to have 22% uti-lization and includes transmissions from frequency hoppingnarrow-band interference sources alongside 802.11 frames,similar to observations noted in [11]. The 5 GHz band showslower average utilization of 2% and is mostly 802.11 trans-missions but displays signs of frequency-selective fading asobserved in [13].
6. REAL-WORLD EXPERIENCESThe Meraki system was first deployed in 2006, with two
models of 802.11b/g radio hardware, for indoor and outdoorenvironments. Over the next 8 years the system added ad-ditional 8 types of wireless access points, ranging from 2x2and 3x3 802.11n radios, to 802.11ac devices, in both indoorand outdoor variants. The same platform was also used todeploy and manage Ethernet switching equipment and se-curity appliances, which gave the designers a unique under-standing of a wide range of network environments.
In this paper, we focused on usage data from two sim-ilar indoor radio models to minimize the number of vari-ables that may impact radio link performance measurements.However, building and operating a large-scale system overseveral years left us with several observations which may berelevant to future work.
6.1 Dealing with bugs in a large systemDebugging large production systems can be complex, par-
ticularly in wireless environments where there are a widerange of client devices and physical conditions. The code-base for the hostapd portion of the wireless driver, whichhandles authentication and control traffic for the 802.11 stackis over 350,000 lines of C code.
In addition to the usual practices of using several test har-nesses and beta testing, the Meraki system uses a large back-end database system to collect information about crashes(firmware and program counter state), along with periodictelemetry about each device’s performance, to make it easierto debug problems in the real world.
162
2.437 GHz 2.453 GHz2.421 GHz 2.429 GHz 2.445 GHz
Frequency (GHz)
Tim
e (s
)
0 s
5 s
10 s
5.220 GHz 5.236 GHz5.204 GHz 5.212 GHz 5.228 GHz
Frequency (GHz)
Tim
e (s
)
0 s
5 s
10 s
Figure 11: Example spectrum analysis centered at 2.437 GHz and 5.220 GHz, using a 32 MHz wide scan with 4096-pointFFT on a USRP B200. The 2.4 GHz scan shows the presence of 20 MHz 802.11 packets, frequency hopping bluetoothwith 1 MHz transmissions and other unidentified sources. The 5 GHz scan shows 20 MHz and 40 MHz 802.11 packetsand fainter transmissions with frequency selective fading.
As an example of a bug which only surfaced due to thewide range of deployment environments, we received reportsof a small number of access points rebooting either minutesor hours after booting on a repeated basis. They all servedfewer than a few dozen clients with a typical usage profile.These access points eventually rebooted due to an out-of-memory error (not at the same point in the code). Upon fur-ther inspection, we noticed the access points were reportingvery large numbers of nearby access points: some of the ac-cess points were located in skyscrapers in Manhattan andcould decode beacons from miles away, and in another casethe access point was on a bus traveling between cities.
Because it is difficult to anticipate such bugs, we foundit to be important to measure and instrument the system atlarge scale and make it possible to examine the system underoperation whenever possible.
6.2 Difficulty in predicting user behaviorWe also observed client device usage varied over time,
which made it difficult for network operators to anticipateusage spikes. In most networks usage between clients wasuneven as expected, with a subset of clients driving mostof the usage. However, software updates from Apple andMicrosoft would drive large downloads across large numbersof clients, sometimes causing sudden increases totaling tensor hundreds of gigabytes.
On a larger timescale, we observed the introduction ofsmartphones starting around 2006. While we found smart-phones consume only around a fifth as much data as laptops,as described in Section 3.2, they exhibit different networkconnection behavior: roaming across access points, attempt-
ing to use cached IP address assignment upon waking fromsleep, and implementing aggressive versions of power savepoll which increased the data buffered by access points.
Similar to the long-term shift in device types, we observedsustained growth in online video services such as YouTubeand Netflix over several years, which increased overall dataconsumption. While in the past it became common to blockheavy bandwidth consuming applications like BitTorrent, wefound administrators reluctant to block services such as You-Tube given their popularity and wide range of uses.
6.3 Non-wireless problemsFinally, we observed several common problems on net-
works which resulted in poor performance but were not spe-cific to wireless:
• Overloaded RADIUS/Active Directory servers, result-ing in authentication timeouts
• Misconfigured VLANs in campus-scale deployments,either due to numbering or reachability
• Cable problems due to aging building infrastructure,which would result in intermittent connectivity
• MTU configuration and discovery issues
• Upstream bandwidth bottlenecks
• DNS resolution problems
• Protocols like multicast DNS, which work in home en-vironments but cause broadcast issues at campus scale
163
7. RELATED WORKSeveral papers have studied link delivery rates: Aguayo et
al. [2] presented data from a 38-node outdoor 802.11b wire-less mesh network, and found that the majority of links de-liver only a fraction of sent packets and that it is difficultto predict link characteristics from distance or RSSI alone.Reis et al. [18] found similar results with a 15-node indoor802.11a/b/g testbed. This paper studies a much larger setof approximately 20,000 nodes, with newer 802.11n radios,and finds that even with newer radio technology most linksonly receive a fraction of packets.
Halperin et. al. [13] studied link delivery in 802.11n andsuggested frequency selective fading caused by multipathinterference is the primary cause of intermediate links. Intheir paper, they develop a model for packet delivery basedon Channel State Information (CSI) from their Intel radios,which is a better predictor than RSSI alone. The Merakiradios use a different Atheros-based chipset which does notexpose CSI in the current driver, but recent work [20, 4] sug-gests the capability exists for Atheros and Intel radios.
Many papers also indicate non-802.11 sources of interfer-ence lead to packet loss. Gummadi et al. [11] showed evenweak or narrowband signals from cordless phones, Blue-tooth or Zigbee devices can disrupt packet reception or delaytransmissions by triggering carrier sense. Gollakota et al. [8]showed similar results with an indoor testbed and studied thephysical layer impact of interference at a more granular levelbefore demonstrating software radio-based methods of can-celing the interference. In this paper, we quantify the effectsof non-802.11 interference on a larger scale but do not em-ploy any active measures for noise cancellation.
Interference alignment and cancellation [10] has also beenproposed in different contexts for increasing the through-put of wireless systems. Halperin et al. [12] showed thatreceivers can recover from colliding packets by employinginterference cancellation, and thereby significantly reducingthe packet loss rate. Gollakota et al. [9] use interference can-cellation to combat hidden terminals, while Lin et al. [15]built a system that enables more nodes to transmit in paral-lel without harming the ongoing transmissions. Given theobserved interference, we expect these mechanisms to im-prove throughput; however, we currently do not employ anyof these techniques in our devices.
There have also been several studies examining usage on802.11 networks. Rodrig et al. [19] examined usage duringa five day technical conference in 2004 and found severallink-level phenomena such as bit-rate selection and retrans-missions affected overall network capacity.
Ghosh et al. [7] present larger scale data from AT&T’shotspot network, tracing over 243,000 devices over a four-week period. While the data covered several sites, theirstudy was of hotspot users and developed a model of usagedistribution in terms of session times and bytes transferred.Their study did not examine specific application usage pat-terns or present link level measurements.
A 2010 study of Google’s WiFi network [1] examineddata from 500 outdoor wireless mesh nodes and studied both
link-level measurements and usage from 30,000 client de-vices. Similar to the AT&T study, the Google data primarilyfocused on outdoor hotspot usage and did not examine theapplication usage patterns. Both papers also characterizedhotspot usage, which differs from campus or office usage.
Gember et al. [6] studied over 32,000 devices connectedto the University of Wisconsin’s wireless network, with aspecific look at application usage inferred from hostnameanalysis. Similar to this paper, they found web traffic andstreaming media to be the largest source of usage, and ob-served the growing popularity of handheld devices. This pa-per examines similar types of data but from a much largerset of users and five years later when both applications anddevices types have changed.
8. CONCLUSIONWireless networks using 802.11 have become common-
place, but their performance and link-level characteristicsvary because of their use of unlicensed spectrum. In thispaper, we conducted a large scale study of several thousandwireless networks, to better understand their behavior.
We surveyed over 20,000 networks and found a wide va-riety of client devices co-exist, from 2.4 GHz-only 20 MHzmobile devices to three-stream 802.11ac desktop computerssupporting 80 MHz channels. Overall client usage grew con-siderably, driven by bandwidth-intensive applications suchas video streaming from YouTube and Netflix and down-loading photographs via social media.
We then used measurement data from regular transmis-sions between access points to study several thousand wire-less links over a long period of time. We found that inter-mediate packet delivery ratios are very common and foundin the majority of 2.4 GHz links and many of the 5 GHzlinks as well. We also noticed the overall delivery ratios of2.4 GHz links have degraded over the past six months.
Finally, we measured channel utilization using dedicatedradio hardware. While most access points share channelswith dozens of other access points, but there was no directrelationship between the number of nearby access points andchannel utilization. We did, however, observe higher uti-lization levels during the day, and were able to character-ize most of the interference as 802.11, which suggests the802.11 MAC can avoid interference on the same channel.
These measurements are intended to provide insight intothe behavior of unlicensed spectrum for both network andprotocol designers. Some practical implications for networksinclude the importance of (1) traffic shaping at the wirelessaccess point to better serve the growing number of band-width hungry clients and applications, and (2) channel plan-ning using a utilization measure to identify the best wirelesschannel. For protocol designers, the measurements suggestthat it is rare to find large blocks of unused unlicensed spec-trum and that new protocols will have to co-exist with largeamounts of 802.11 traffic.
A copy of the wireless link measurements, nearby net-works, and channel utilization data used in this paper is avail-able at http://dl.meraki.net/sigcomm-2015.
164
9. ACKNOWLEDGEMENTSWe thank our shepherd, Kyle Jamieson, and the anony-
mous reviewers for their suggestions and feedback. We alsothank the engineers who helped build and maintain the Mer-aki system over the past several years, which made the col-lection and analysis of this data possible.
10. REFERENCES[1] M. Afanasyev, T. Chen, G. M. Voelker, and A. C.
Snoeren. Usage patterns in an urban wifi network.Networking, IEEE/ACM Transactions on,18(5):1359–1372, 2010.
[2] D. Aguayo, J. Bicket, S. Biswas, G. Judd, andR. Morris. Link-level measurements from an 802.11 bmesh network. In ACM SIGCOMM ComputerCommunication Review, volume 34, pages 121–132.ACM, 2004.
[3] W. Alliance. Total wifi device shipments to surpass tenbillion this month, Jan. 2015.
[4] A. Bhartia, Y.-C. Chen, S. Rallapalli, and L. Qiu.Harnessing frequency diversity in wi-fi networks. InProceedings of the 17th Annual InternationalConference on Mobile Computing and Networking,MobiCom ’11, pages 253–264, 2011.
[5] J. Franklin, D. McCoy, P. Tabriz, V. Neagoe, J. V.Randwyk, and D. Sicker. Passive data link layer802.11 wireless device driver fingerprinting. In UsenixSecurity, 2006.
[6] A. Gember, A. Anand, and A. Akella. A comparativestudy of handheld and non-handheld traffic in campuswi-fi networks. In Passive and Active Measurement,pages 173–183. Springer, 2011.
[7] A. Ghosh, R. Jana, V. Ramaswami, J. Rowland, andN. Shankaranarayanan. Modeling and characterizationof large-scale wi-fi traffic in public hot-spots. InINFOCOM, 2011 Proceedings IEEE, pages2921–2929. IEEE, 2011.
[8] S. Gollakota, F. Adib, D. Katabi, and S. Seshan.Clearing the rf smog: making 802.11 n robust tocross-technology interference. In ACM SIGCOMMComputer Communication Review, volume 41, pages170–181. ACM, 2011.
[9] S. Gollakota and D. Katabi. Zigzag decoding:Combating hidden terminals in wireless networks. InProceedings of the ACM SIGCOMM 2008 Conferenceon Data Communication, SIGCOMM ’08, pages159–170, 2008.
[10] S. Gollakota, S. D. Perli, and D. Katabi. Interferencealignment and cancellation. In Proceedings of theACM SIGCOMM 2009 Conference on DataCommunication, SIGCOMM ’09, pages 159–170,2009.
[11] R. Gummadi, D. Wetherall, B. Greenstein, andS. Seshan. Understanding and mitigating the impact ofrf interference on 802.11 networks. ACM SIGCOMMComputer Communication Review, 37(4):385–396,2007.
[12] D. Halperin, T. Anderson, and D. Wetherall. Takingthe sting out of carrier sense: Interference cancellationfor wireless lans. In Proceedings of the 14th ACMInternational Conference on Mobile Computing andNetworking, MobiCom ’08, pages 339–350, 2008.
[13] D. Halperin, W. Hu, A. Sheth, and D. Wetherall.Predictable 802.11 packet delivery from wirelesschannel measurements. ACM SIGCOMM ComputerCommunication Review, 41(4):159–170, 2011.
[14] E. Kohler, R. Morris, B. Chen, J. Jannotti, and M. F.Kaashoek. The click modular router. ACMTransactions on Computer Systems (TOCS),18(3):263–297, 2000.
[15] K. C.-J. Lin, S. Gollakota, and D. Katabi. Randomaccess heterogeneous mimo networks. In Proceedingsof the ACM SIGCOMM 2011 Conference, SIGCOMM’11, pages 146–157, 2011.
[16] A. K. Miu, H. Balakrishnan, and C. E. Koksal.Improving Loss Resilience with Multi-Radio Diversityin Wireless Networks. In 11th ACM MOBICOMConference, Cologne, Germany, September 2005.
[17] J. Pang, B. Greenstein, R. Gummadi, S. Seshan, andD. Wetherall. 802.11 user fingerprinting. InProceedings of the 13th annual ACM internationalconference on Mobile computing and networking,pages 99–110. ACM, 2007.
[18] C. Reis, R. Mahajan, M. Rodrig, D. Wetherall, andJ. Zahorjan. Measurement-based models of deliveryand interference in static wireless networks. ACMSIGCOMM Computer Communication Review,36(4):51–62, 2006.
[19] M. Rodrig, C. Reis, R. Mahajan, D. Wetherall, andJ. Zahorjan. Measurement-based characterization of802.11 in a hotspot setting. In Proceedings of the 2005ACM SIGCOMM workshop on Experimentalapproaches to wireless network design and analysis,pages 5–10. ACM, 2005.
[20] S. Sen, B. Radunovic, J. Lee, and K.-H. Kim. Cspy:finding the best quality channel without probing. InProceedings of the 19th annual internationalconference on Mobile computing & networking, pages267–278. ACM, 2013.
[21] K. Varda. Protocol buffers: Google data interchangeformat, 2008.
165