Embed Size (px)
Citation preview
National Aeronautics and Space Administration
www.nasa.gov
NASA GSFC / USGS EROS
www.usgs.gov
LDCM/OLI Instrument Performance Overview
Philip W Dabney - NASA LDCM Instrument Scientist
James R Irons - NASA LDCM Project Scientist
Brian L Markham - NASA LDCM Calibration/Validation Scientist
James C Storey - USGS/SAIC LDCM Geospatial Imaging Scientist
….plus a cast of hundreds….
February 14, 2013
LDCM Science Team
Meeting

Landsat Data Continuity Mission Instrument Overview
Outline
Basic Band Requirements
Several Driving Requirements
Instrument Overviews:
– Operational Land Imager (OLI)
Top Level Performance Results:
– Geometric/Geodetic
– Spatial
– Radiometric
– Spectral
Conclusions
Future Work
2

Landsat Data Continuity Mission Instrument Overview
OLI & ETM+ Spectral Bands
3

Landsat Data Continuity Mission Instrument Overview
L7 ETM+ Bands LDCM OLI Band Requirements
GSD “color” min-max (nm) GSD “color” min-max (nm)
30 m Coastal/Aerosol 0.433 - 0.453 Band 1
Band 1 30 m Blue 0.450 - 0.515 30 m Blue 0.450 - 0.515 Band 2
Band 2 30 m Green 0.525 - 0.605 30 m Green 0.525 - 0.600 Band 3
Band 3 30 m Red 0.630 - 0.690 30 m Red 0.630 - 0.680 Band 4
Band 4 30 m Near-IR 0.775 - 0.900 30 m Near-IR 0.845 - 0.885 Band 5
Band 5 30 m SWIR-1 1.550 - 1.750 30 m SWIR-1 1.560 - 1.660 Band 6
Band 6 60 m LWIR 10.00 - 12.50 N/A
Band 7 30 m SWIR-2 2.090 - 2.350 30 m SWIR-2 2.100 - 2.300 Band 7
Band 8 15 m Pan 0.520 - 0.900 15 m Pan 0.500 - 0.680 Band 8
30 m Cirrus 1.360 - 1.390 Band 9
LDCM and ETM+ Spectral Bands
4

Landsat Data Continuity Mission Instrument Overview
Signal-to-Noise Ratios (SNR)
OLI and ETM+ Radiometric Performance
5
Ltypical SNR Lhigh SNR
Band ETM+
Performance
OLI
Requirements
ETM+
Performance
OLI
Requirements
Coastal/Aerosol N/A 130 N/A 290
Blue 40 130 140 360
Green 40 100 190 390
Red 30 90 140 340
NIR 35 90 250 460
SWIR 1 35 100 190 540
SWIR 2 30 100 140 510
Pan 16 80 90 230
Cirrus N/A 50 N/A N/A

Landsat Data Continuity Mission Instrument Overview
Several Driving Requirements
Nadir Swath Width >185 km; 15/30/100 m GSD; @ S/C altitude of 705 km
Wide spectral coverage (Deep Blue – NIR, SWIR, TIR)
Geo-registration & Accuracy
– Band-to-band: 4.5 meters or less
in the line and sample directions at the 90% confidence level
– Geodetic Accuracy: Absolute 65 m / Relative 25 m
– Geometric Accuracy: 12 m
Signal to Noise Ratio (SNR) & Dynamic Range (DNR)
Radiometric Accuracy
– Calibration stability
– Stray light (diffused scatter and ghosting)
Uniformity
– Spatial (Distortion/GSD, Edge Response)
– Spectral (PPU effects between spectra)
– Radiometric (Coherent noise, pixel-to-pixel stability & non-linearity, spectral
uniformity)
6

Landsat Data Continuity Mission Instrument Overview
Collects 400 scenes per day using
pushbroom design
Coincident with TIRS data collection
Covers a 185 km swath
Collects data for nine shortwave spectral
bands
Provides continuity with seven TM and
ETM+ shortwave spectral bands
Adds two new bands
Provides a 30 m spatial resolution
15 m panchromatic band
Collects calibration data
Internal cal lamps, shutter collects, solar
panel, lunar views, vicarious field
campaigns
Courtesy of BATC
Operational Land Imager (OLI)
7

Landsat Data Continuity Mission Instrument Overview
OLI is a fairly simple instrument (slide created and provided by Ed Knight of BATC.)
Pushbroom VIS/SWIR sensor
Four-mirror telescope with front
aperture stop
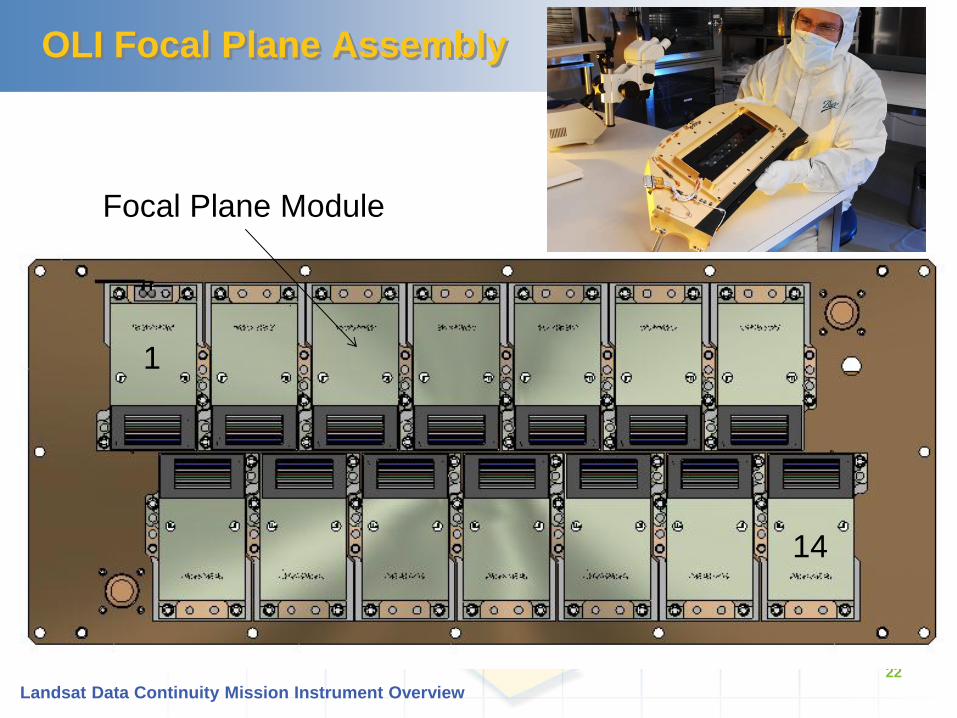
FPA consisting of 14 sensor chip
assemblies, passively cooled
On-board calibration with both lamps
and full aperture diffusers

Landsat Data Continuity Mission Instrument Overview
Top Level Performance Results
Geometric/Geodetic
Spatial
Radiometric
Spectral
9

Landsat Data Continuity Mission Instrument Overview
Geometric/Geodetic Performance
ETM+ Band-to-Band registration (B-to-B) was found to typically be <0.05 pixels
or better
– in line and scan direction (excluding band 6 - TIR)
ETM+ Geodetic Accuracy:
– Pre 4/2007 97% scenes better than 50 meters RMSE
– Post 4/2007 65% scenes better than 50 meters RMSE
The use of staggered focal plane modules and non-coincident spectral band
imaging increases the engineering difficulty of meeting the B-to-B and Geodetic
registration.
LDCM has been shown to meet its Geospatial/Geodetic requirements by
analysis using the pre-flight measurements and opto-mechanical models for
the Space Craft, OLI, and TIRS.
– Final verification will occur during IOC.
10

Landsat Data Continuity Mission Instrument Overview
Top Level Performance Results
Geometric/Geodetic
Spatial
Radiometric
Spectral
11
Landsat Data Continuity Mission Instrument Overview
12
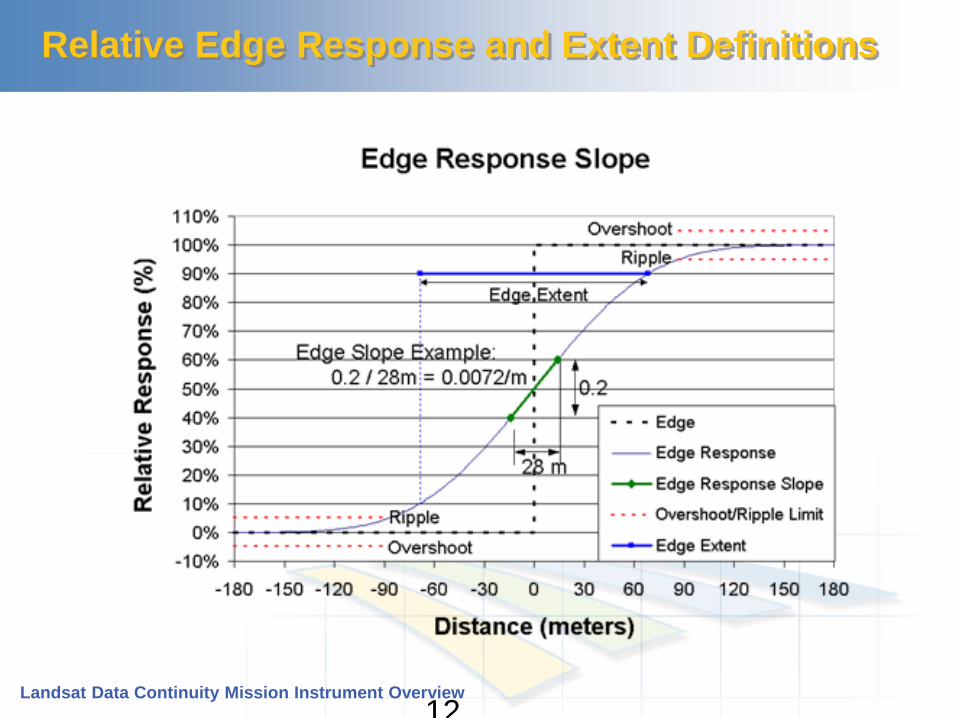
Relative Edge Response and Extent Definitions

Landsat Data Continuity Mission Instrument Overview
OLI Spatial Performance looks excellent
Spatial Performance
– Measured spatial response has:
Steep slope (exceeding reqts)
Low extended edge (good half
edge extent)
No ripple/overshoot
Geolocation
– Performance depends on both
instrument and spacecraft; final
measurements made during initial
on-orbit checkout
Min slope
reqt:
Low
extended
edge
Min slope
reqt:
Low
extended
edge

Landsat Data Continuity Mission Instrument Overview
Top Level Performance Results
Geometric/Geodetic
Spatial
Radiometric
Spectral
14

Landsat Data Continuity Mission Instrument Overview
OLI Radiometric Performance looks excellent (adapted from slide provided by Ed Knight/BATC)
SNR
– SNR significantly exceeds
requirements and heritage
Calibration
– Stability over 60 seconds
(2 standard scenes) is
excellent
<0.02% 2s
Stability over 16 days
(time between Solar
Diffuser Cals) is
excellent
– <0.54% 2s for all but
Cirrus Band which is
<1.19%
16 Day Stability
Change in Response,
Green band, w/ hot
cycle in middle

Landsat Data Continuity Mission Instrument Overview
OLI uses 4 large state-of the-art Silver coated mirrors in the telescope.
The mirrors project the
image onto the detector
arrays.
They are large so they will
provide:
a 15.1 deg. FOV.
15/30 meter resolution
enough light collect
for good sensitivity
They must be ultra-clean
and ultra-smooth to
reduce scattered light.
Landsat Data Continuity Mission Instrument Overview
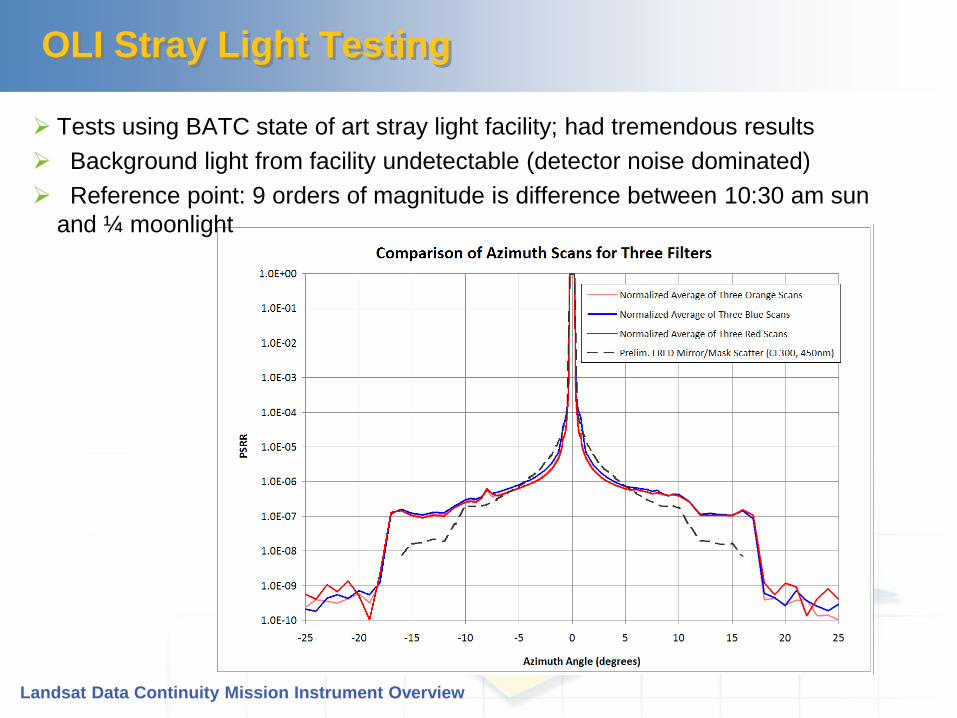
OLI Stray Light Testing
Tests using BATC state of art stray light facility; had tremendous results
Background light from facility undetectable (detector noise dominated)
Reference point: 9 orders of magnitude is difference between 10:30 am sun
and ¼ moonlight
Landsat Data Continuity Mission Instrument Overview
Pixel-to-Pixel Uniformity (PPU)
ETM+Relative detector-to-detector normalization, i.e., striping less than ±
0.1%
– This high degree of PPU is expected due to the low number of detectors and
the nature of a whiskbroom scanner with a narrow IFOV.
– Based on analyses of uniform scenes and internal calibration data estimate.
LDCM OLI & TIRS PPU requirement is approximately 0.5% depending on the
nature of the PPU artifact.
– In general this requirement has been shown to be met with very few outliers.
– Several factors contribute to this artifact and they have been measured
independently and “Summed” in the system level models.
Detector-to-detector gain and offset/dark current stability
Uncorrected non-linearity
Spectral uniformity
Coherent noise
Work is currently in progress using the NASA/USGS and RIT DIRSIG image
simulators to demonstrate the impacted of the estimated effects.
18

Landsat Data Continuity Mission Instrument Overview
Top Level Performance Results
Geometric/Geodetic
Spatial
Radiometric
Spectral
19
Landsat Data Continuity Mission Instrument Overview
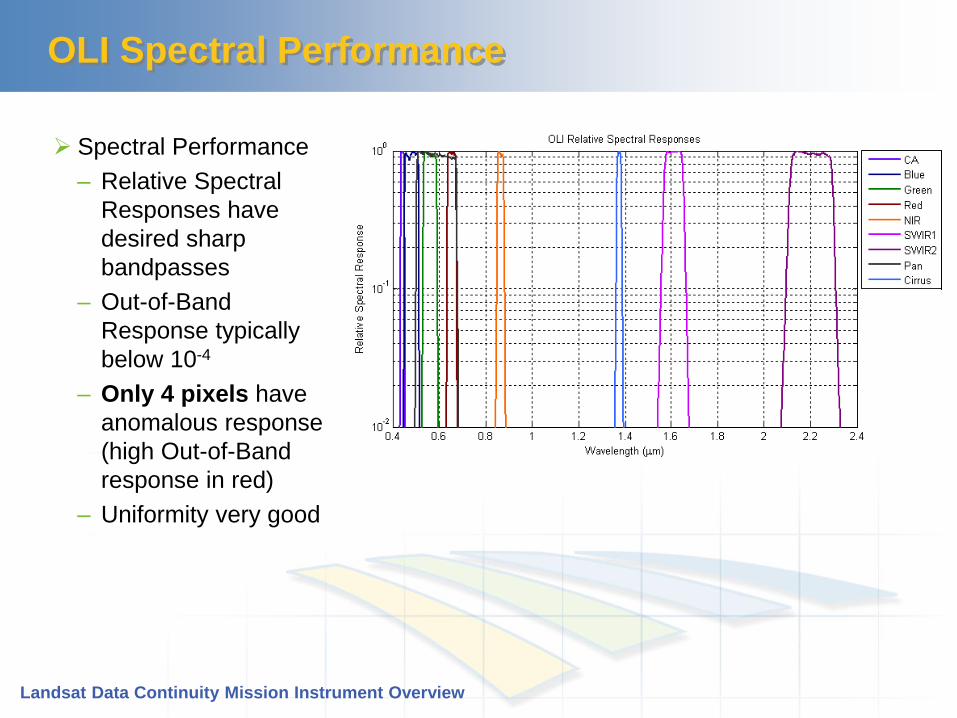
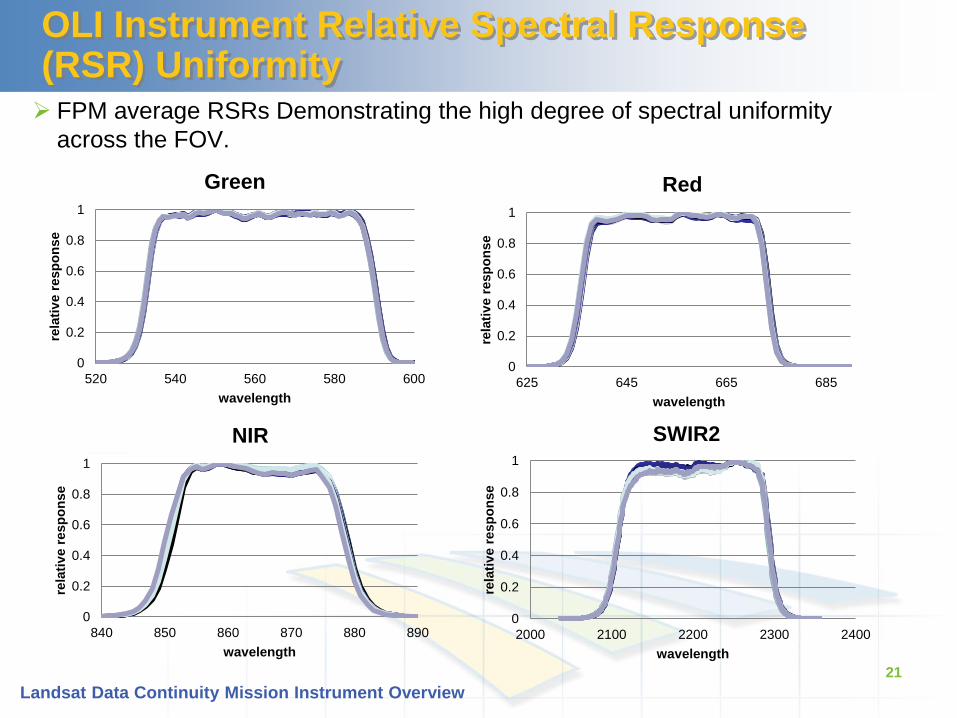
OLI Spectral Performance
Spectral Performance
– Relative Spectral
Responses have
desired sharp
bandpasses
– Out-of-Band
Response typically
below 10-4
– Only 4 pixels have
anomalous response
(high Out-of-Band
response in red)
– Uniformity very good
Landsat Data Continuity Mission Instrument Overview
OLI Instrument Relative Spectral Response (RSR) Uniformity FPM average RSRs Demonstrating the high degree of spectral uniformity
across the FOV.
21
0
0.2
0.4
0.6
0.8
1
520 540 560 580 600
rela
tiv
e r
esp
on
se
wavelength
Green
0
0.2
0.4
0.6
0.8
1
625 645 665 685
rela
tiv
e r
esp
on
se
wavelength
Red
0
0.2
0.4
0.6
0.8
1
840 850 860 870 880 890
rela
tiv
e r
esp
on
se
wavelength
NIR
0
0.2
0.4
0.6
0.8
1
2000 2100 2200 2300 2400
rela
tiv
e r
esp
on
se
wavelength
SWIR2
Landsat Data Continuity Mission Instrument Overview
OLI Focal Plane Assembly
22
Focal Plane Module
1
14

Landsat Data Continuity Mission Instrument Overview
Future Work
Continue Calibration/Validation and Linearity Special Study Data Analyses.
Develop/update Detailed Sensor Models based on Cal/Val measurements.
Additional simulations of impact of sensor model on image quality.
– Spectral shift induced errors between scene spectra and solar diffuser
spectra.
Explore ways that using detailed sensor model to improve image quality and
end-user products.
– Use detailed knowledge of RSR.
Initial on-orbit checkout and on-orbit validation.
23
Landsat Data Continuity Mission Instrument Overview
Conclusion
LDCM’s Instruments have demonstrated they will meet of exceed the
requirements for Landsat-8.
The OLI as-measured performance will provide a significant increase in
the quality of the medium resolution reflective Landsat data, especially
in the area of SNR.
Work remains in understanding the higher order artifacts and behaviors
and then to use this information to further refine the image data.
24 401

Landsat Data Continuity Mission Instrument Overview
Acknowledgements and Credits
The following persons contributed significant expertise, effort, and material
towards the preliminary results shown here. Many others unnamed here were
also instrumental in the success. Our apologies to anyone inadvertently left off
this list.
25
Kurt Thome – NASA TIRS Calibration Scientist
Julia Barsi – NASA/LPSO/SAIC
Brent Canova - Ball Aerospace & Technologies Corp.
Aaron Gerace - Rochester Institute of Technology
Ron Hayes - USGS
Edward Kaita – NASA/SAIC
Edward J. Knight - Ball Aerospace & Technologies Corp.
Geir Kvaran - Ball Aerospace & Technologies Corp.
Raviv Levy – NASA/LPSO/SAIC
Ron Morfitt - USGS
Jeff Pedelty – NASA LDCM/OLI
John Schott - Rochester Institute of Technology ….plus many others….