Embed Size (px)
Citation preview
1.221J/11.527J/ESD.201J Transportation Systems
Fall 2004
LECTURE 11 (and forward): TRAVELER TRANSPORTATION
DISPLAYS
SPEAKER: Joseph M. Sussman MIT
Traveler Transportation Outline
� Differences between Traveler and Freight Transportation
� A Brief History of Metropolitan Areas � Some Transportation History � Automobile Transportation � Urban Public Transportation � Intercity Traveler Transportation
� Air Transportation � Rail Transportation
� Mexico City � Intelligent Transportation Systems (ITS)
2
Differences between Traveler and FreightTransportation
� The Transportation Process � Safety and Security � Level-of-Service Variables � Groups � Motivation for Travel � Travel as Discretionary � Success in the Marketplace
CLASS DISCUSSION
3
Substitutability of Communications andTransportation
� Two opposing perspectives:� Communications will greatly reduce the need for
transportation because of the telecommuting option; people will not have to actually physically be at the office to make a contribution.
� On the other hand, while telecommuting may occur, the economic interactions that will occur as a result of enhanced communication may generate more travel than is saved by the telecommuting option.
4
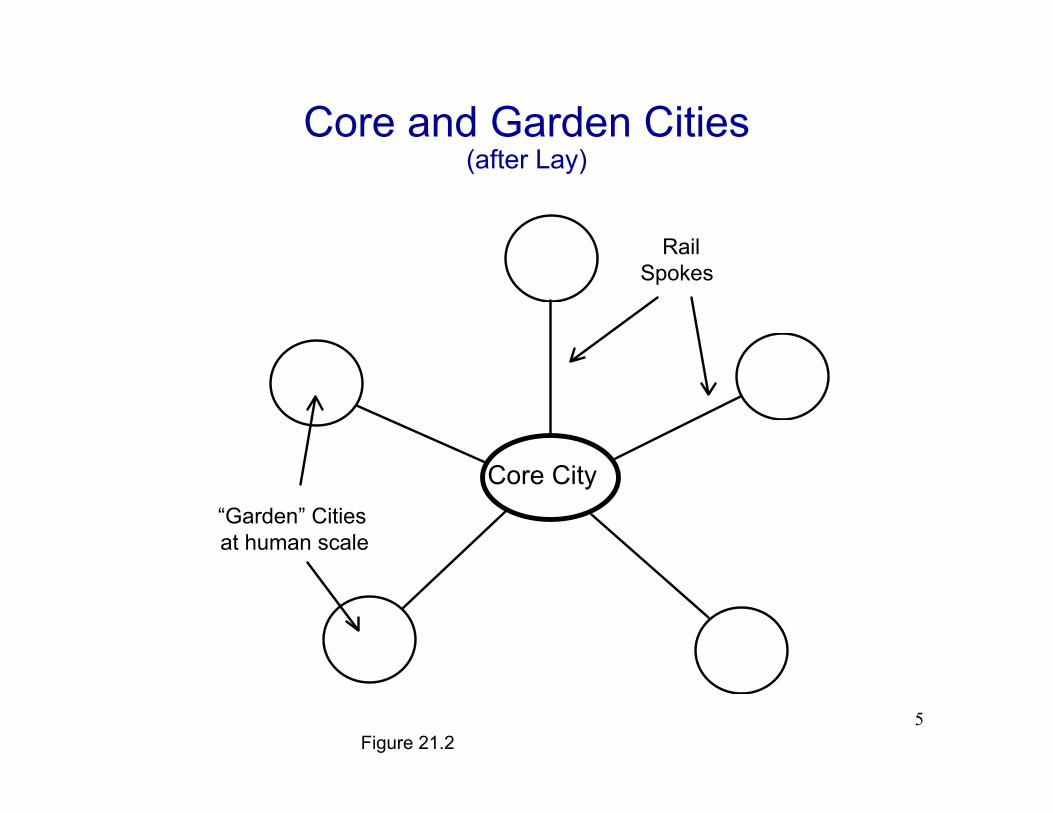
Core and Garden Cities (after Lay)
Rail Spokes
Core City “Garden” Cities at human scale
Figure 21.2 5
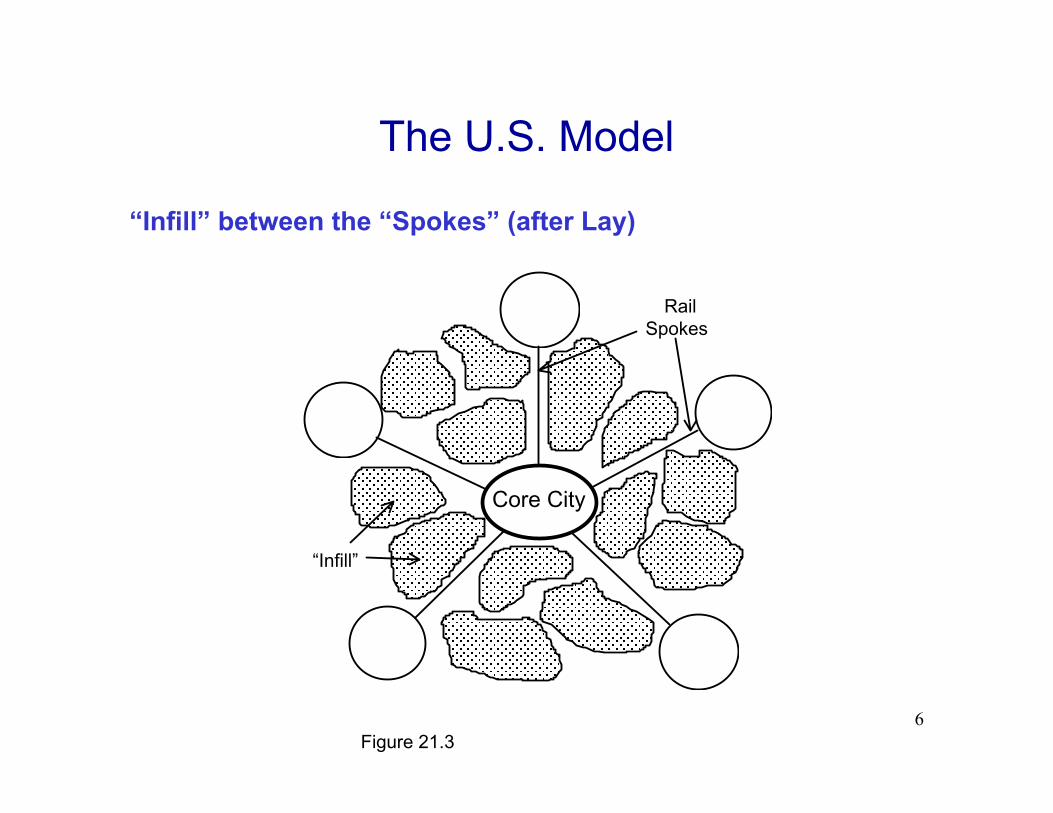
The U.S. Model
“Infill” between the “Spokes” (after Lay)
Rail Spokes
Core City
“Infill”
Figure 21.3 6
Other Urban Questions
� Suburbanization
� Mega-Cities � Ring-Roads � “Edge Cities”
7
Land Use and Public Transportation
� You cannot separate transportation policy from the way in which land is used: for residences, for shopping, for jobs. Land use and transportation are hand-in-glove.
� Low-density development patterns make providing public transportation services extremely difficult.
� Experts from the fields of urban policy, real estate development, regional economics, municipal finance, landscape ecology, transportation, urban air quality, public health and civil engineering are needed.
8
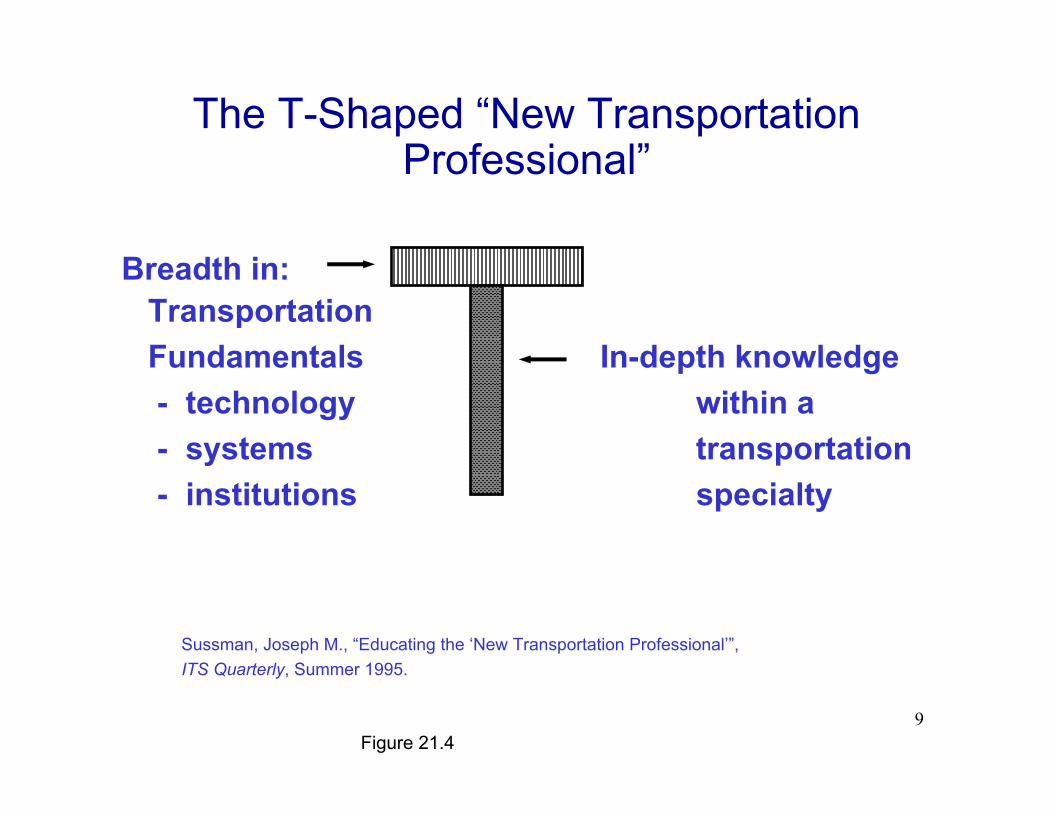
The T-Shaped “New TransportationProfessional”
Breadth in: Transportation Fundamentals In-depth knowledge - technology within a
- systems transportation - institutions specialty
Sussman, Joseph M., “Educating the ‘New Transportation Professional’”, ITS Quarterly, Summer 1995.
Figure 21.4 9
MOBILITY VS. ACCESSIBILITY
Mobility – The ability to move people and freight freely
Accessibility – The ability to reach attractive destinations
10
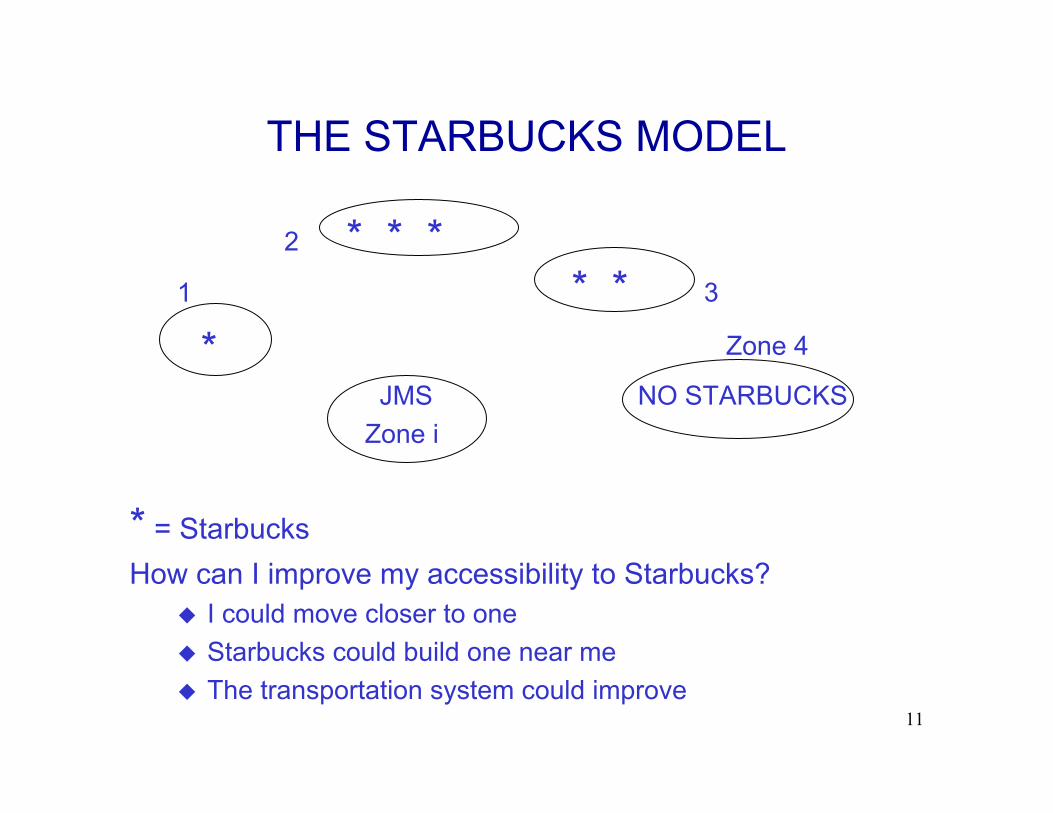
THE STARBUCKS MODEL
2 * * *1 * * 3
* Zone 4
JMS NO STARBUCKS Zone i
* = Starbucks How can I improve my accessibility to Starbucks?
� I could move closer to one � Starbucks could build one near me � The transportation system could improve
11
THE STARBUCKS MODEL(CONTINUED)
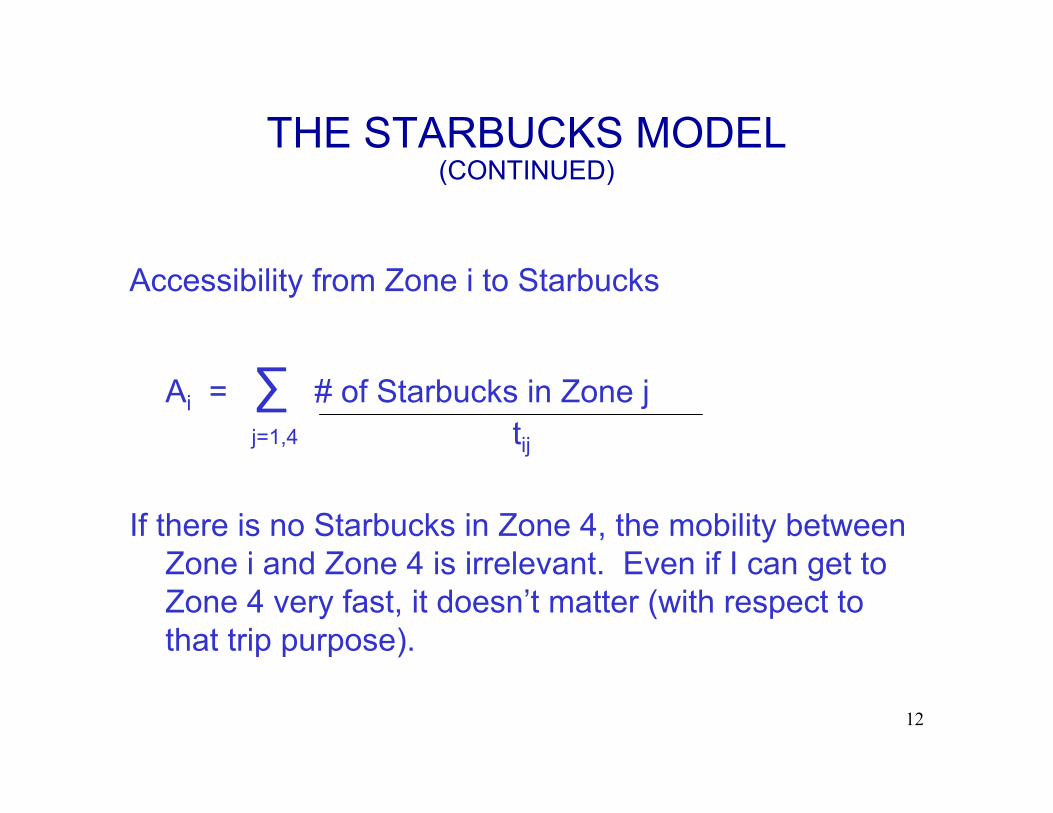
Accessibility from Zone i to Starbucks
Ai = ∑ # of Starbucks in Zone j j=1,4 tij
If there is no Starbucks in Zone 4, the mobility between Zone i and Zone 4 is irrelevant. Even if I can get to Zone 4 very fast, it doesn’t matter (with respect to that trip purpose).
12
Some Transportation History
Lay begins with carts, coaches and stage coaches, and the use of horses for transportation.
Lay, Max G., Ways of the World: A History of the World’s Roads and of the Vehicles that Used Them, Rutgers University Press, New Brunswick, NJ, 1992.
13
As Lay mentions, the cost of a round-trip from Paddington Station to another station in London in1800 by horse-drawn vehicle was about 1% of theannual wage of a typical worker, where thecomparable trip today would be about .02% of theannual wage of that same worker.
System safety was several orders of magnitudepoorer in antiquity than they are now. 40,000 peoplea year die on U.S. highways. But if one looks at the safety of transportation systems in these moreprimitive times, they were several orders ofmagnitude less safe than today.
14
SAFETY OF HIGH SPEED RAIL
STUDY OF JR EAST
� There has never been a fatality on the Japanese HSR system, which began operations in 1964.
� JR East is arguably the safest railroad in the world.
� They want to stay that way!
15
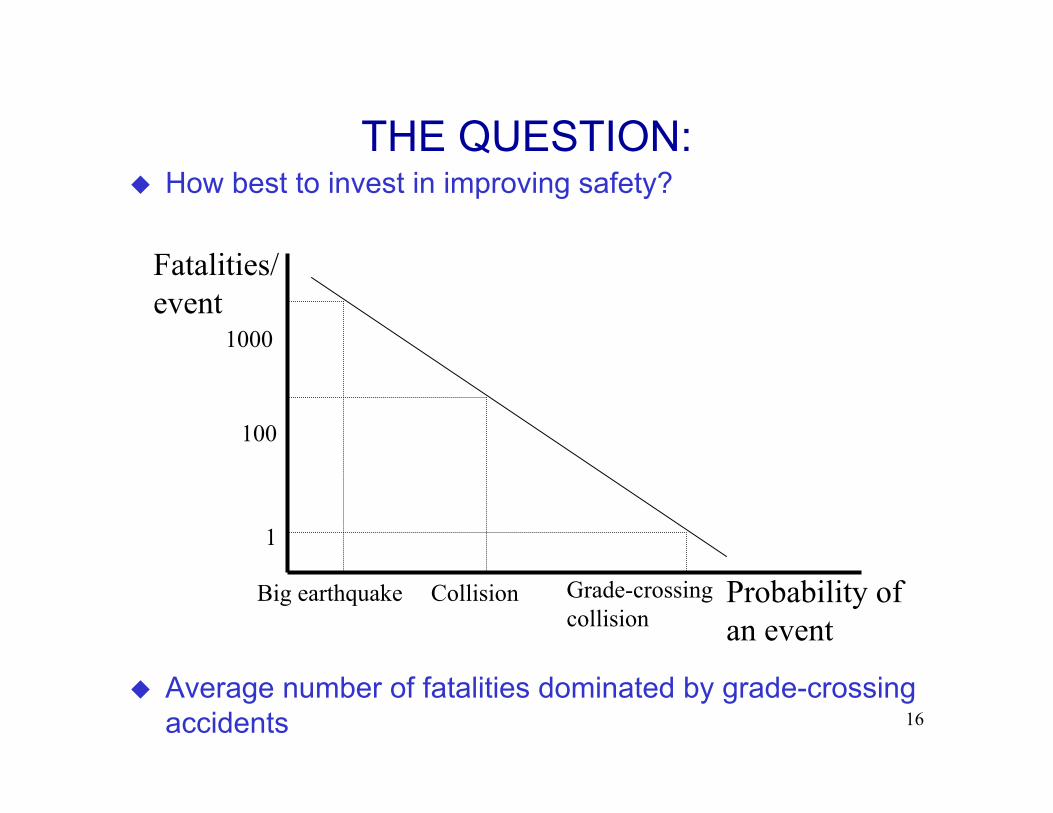
THE QUESTION:� How best to invest in improving safety?
1
100
1000
Fatalities/ event
Big earthquake Collision Grade-crossing Probability ofcollision an event
� Average number of fatalities dominated by grade-crossing accidents 16
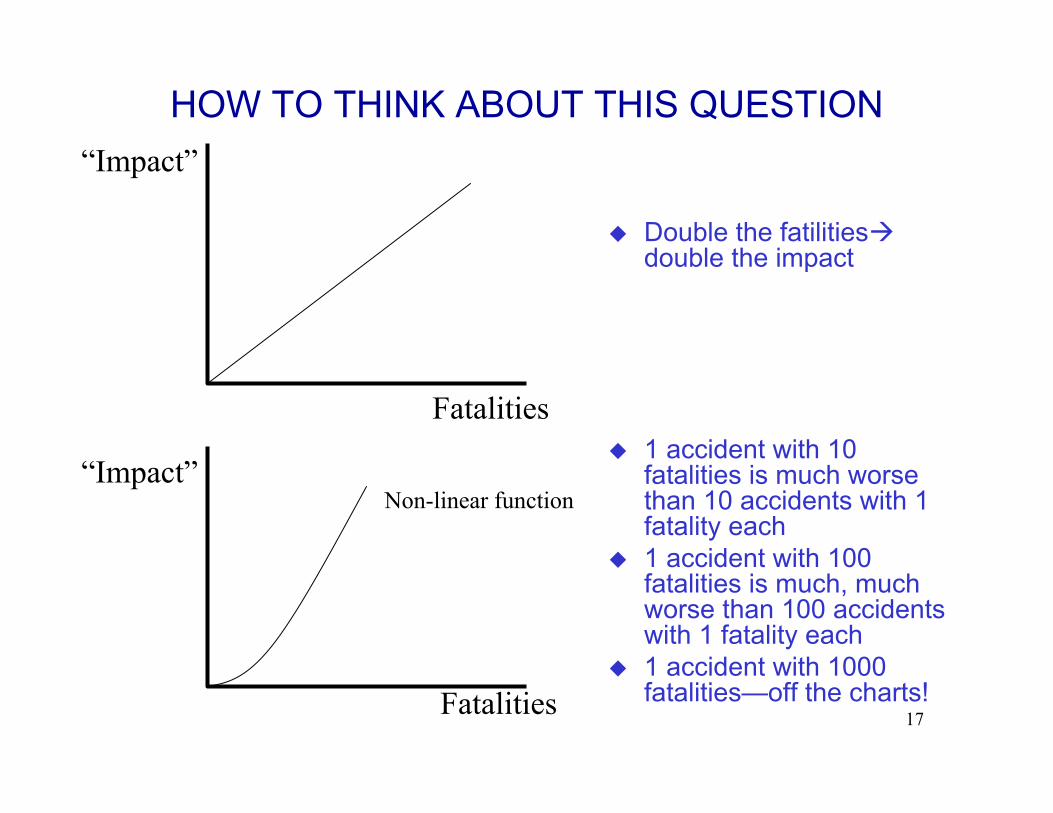
HOW TO THINK ABOUT THIS QUESTION
“Impact”
� Double the fatilitiesÆ double the impact
Fatalities � 1 accident with 10
“Impact” fatalities is much worse Non-linear function than 10 accidents with 1
fatality each � 1 accident with 100
fatalities is much, much worse than 100 accidents with 1 fatality each
� 1 accident with 1000 Fatalities fatalities—off the charts!
17
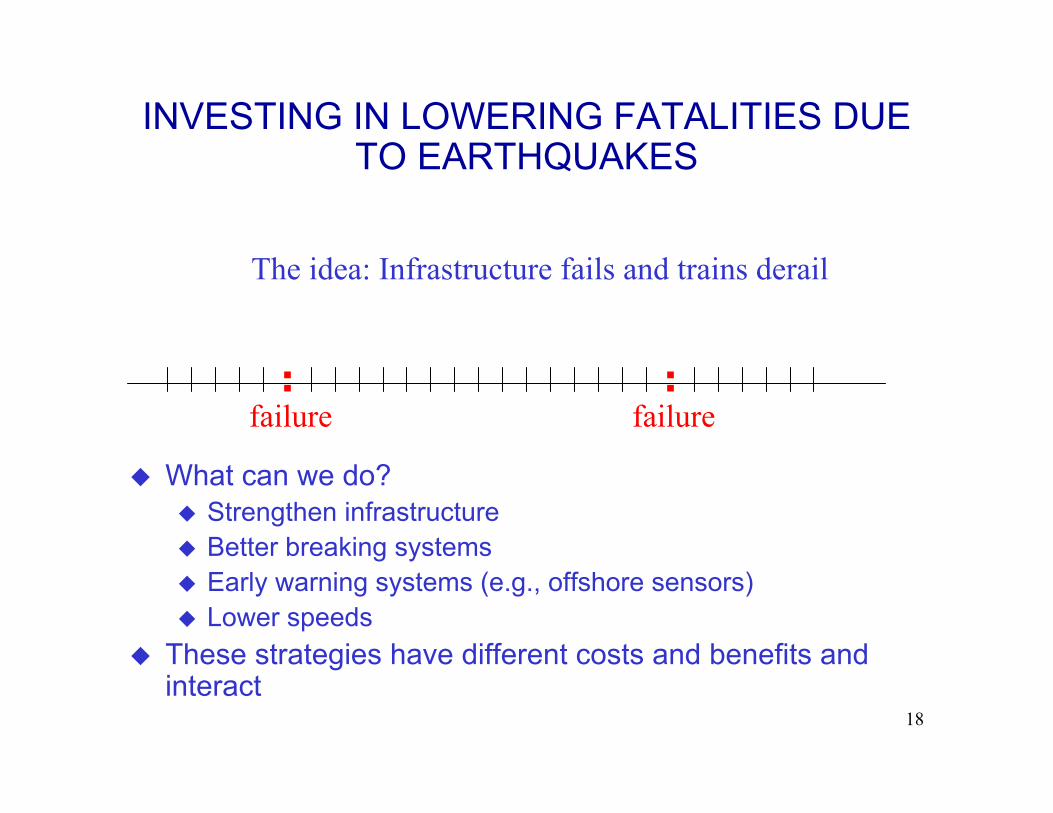
INVESTING IN LOWERING FATALITIES DUE TO EARTHQUAKES
The idea: Infrastructure fails and trains derail
failure failure
� What can we do? � Strengthen infrastructure � Better breaking systems � Early warning systems (e.g., offshore sensors) � Lower speeds
� These strategies have different costs and benefits andinteract
18
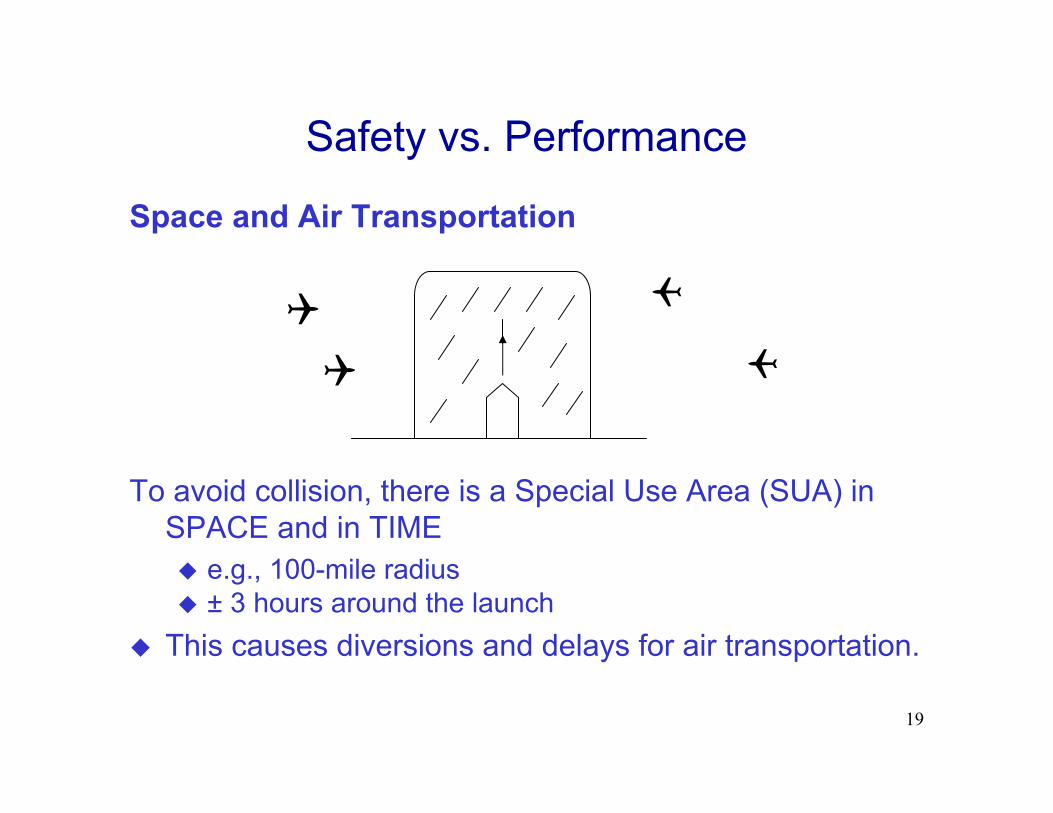
Safety vs. Performance
Space and Air Transportation
4
4
4
4 To avoid collision, there is a Special Use Area (SUA) in
SPACE and in TIME � e.g., 100-mile radius � ± 3 hours around the launch
� This causes diversions and delays for air transportation.
19
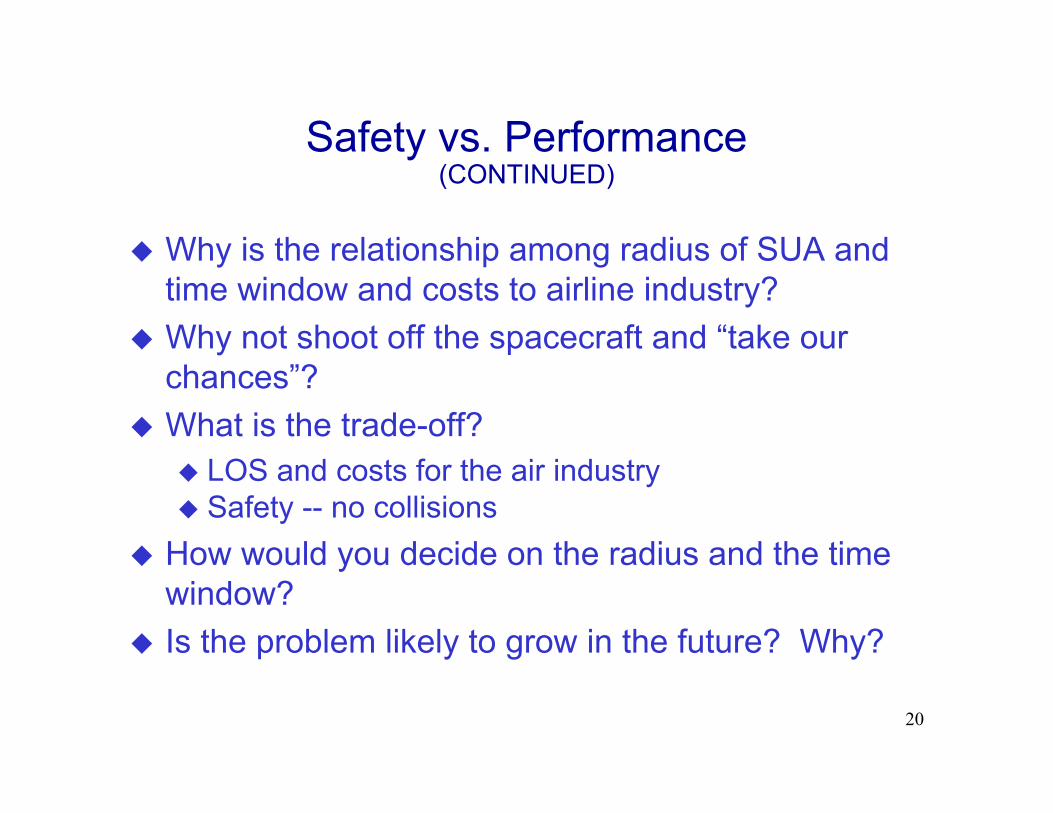
Safety vs. Performance(CONTINUED)
� Why is the relationship among radius of SUA and time window and costs to airline industry?
� Why not shoot off the spacecraft and “take our chances”?
� What is the trade-off? � LOS and costs for the air industry � Safety -- no collisions
� How would you decide on the radius and the time window?
� Is the problem likely to grow in the future? Why?
20
What Enabled Transportation toAdvance?
� Technological Developments
� Automobile Dominance � The Gas Tax � Construction Jobs
21
Environmental Concerns
� Emissions - Air Quality - Clean Air Acts � Emissions - Global Climate Change � Land Use - Sprawl � Fragile Ecosystems (Endangered Species Act)� Others
22
Traveler LOS
We first discuss the dominant traveler mode, automobiles, and then generalize to LOS variables for travelers.
23
Why People Like Cars
� We like the flexibility � The automobile network is universal � It often (but not always) is the fastest mode,
depending on levels of congestion, time of day andthe available alternatives
� Privacy� Automobiles suggest that you are at a higher level of
society � People simply enjoy the sensation of driving
24
Land Use Patterns
� Given the way our land-use patterns havedeveloped, particularly in the United States, cars arevirtually a necessity. There are areas where takingat least part of your trip without an automobile isvirtually impossible.
� Land-use densities are so low that publictransportation is not viable. The automobile is fundamental and a necessity of life, not a luxury,depending upon land-use choices that societymakes.
25
A Final Set of Reasons We Love Cars
� It is very often a good transportation buy. It is a goodvalue for your transportation dollar.
� You get this high-quality transportation service whichis a good buy, because somebody else is paying a lotof the costs for the infrastructure and cleaning up theenvironment.
� This choice is economically rational. Highwaytransportation may well be cheap, or at least cheaprelative to the level-of-service that is being provided toyou, because of the way in which the costs of thehighway infrastructure are paid for.
26
Traveler LOS Considerations
� Average Trip Time � Reliability of Trip Time
� “Value-of-Time” � Aggregating Small Time Savings over Many
People
27
Other LOS Variables
� Cost � Service Frequency � Waiting Time � Comfort � Safety and Security � “Intangibles”
LOS variables determine mode choice. The importance of LOS will vary among people and by trip purpose.
28
Modal Options
� Private automobile � Taxi � Bus � Train � Boat � Various intermodal combinations � Bicycle � Walking
In an urban context one can subdivide auto into single occupancy, carpools, van pools, etc.
For intercity, one adds airlines, train, bus, as well as private auto.
29
Hierarchical Decision-Making
� Long-Range Choices: employment -- where am I going to work; residence-- where am I going to live relative to where I work.
� Medium-Range Choices: automobile ownership andmode choice to work.
� Short-Range Choices: people decide about routechoice on a particular day; non-work travel -judgments about travel to shopping and other ad hocactivities other than the traditional journey to work.
30
� The fundamental insight is that people do not make a single instantaneous judgment about trip-making and mode choice; rather one has to model transportation demand by thinking hierarchically about how long-, medium- and short-range decisions lead to decisions about individual trips.
31
URBAN PUBLIC TRANSPORTATION
32
LOS Variables for Urban Travelers
Let us review our level-of-service variables for travelers.
�Travel time �Reliability �Cost �Waiting time �Comfort �Safety �Security
are all examples of level-of-service variables that are relevant to any traveler transportation mode.
33
How Public Transportation Measures Up
� Comfort in a crowded rush-hour subway car is not high
� One has to wait for service depending on the service frequency of the mode one is considering
� Travel time may be greater or less than that of an automobile, depending on the circumstances
� How about self-image?
CLASS DISCUSSION
34
Some Other LOS Variables
� Security � Availability of service � Safety � Accessibility to service
35
Types of Urban Public TransportationService
� Conventional Bus � Para-Transit � Demand-Responsive Service
� Rail Systems � Subways � Commuter Rail � Intermodal Services
36
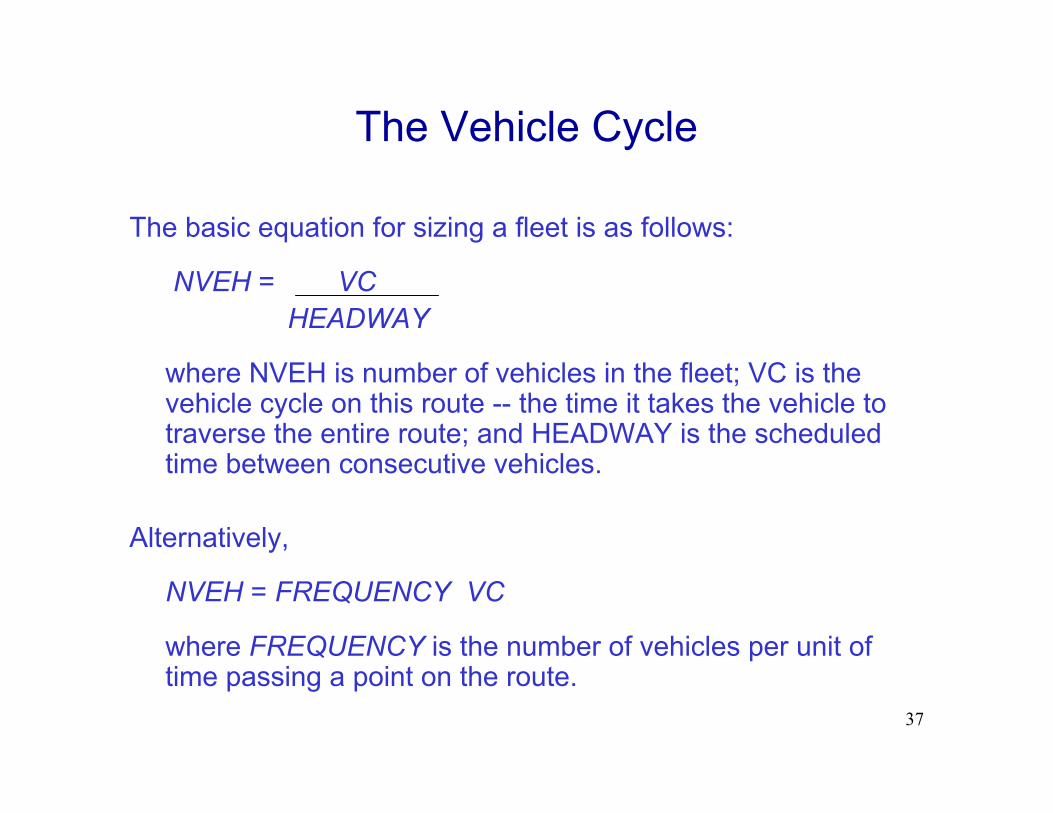
The Vehicle Cycle
The basic equation for sizing a fleet is as follows:
NVEH = VCHEADWAY
where NVEH is number of vehicles in the fleet; VC is the vehicle cycle on this route -- the time it takes the vehicle to traverse the entire route; and HEADWAY is the scheduled time between consecutive vehicles.
Alternatively,
NVEH = FREQUENCY VC
where FREQUENCY is the number of vehicles per unit oftime passing a point on the route.
37
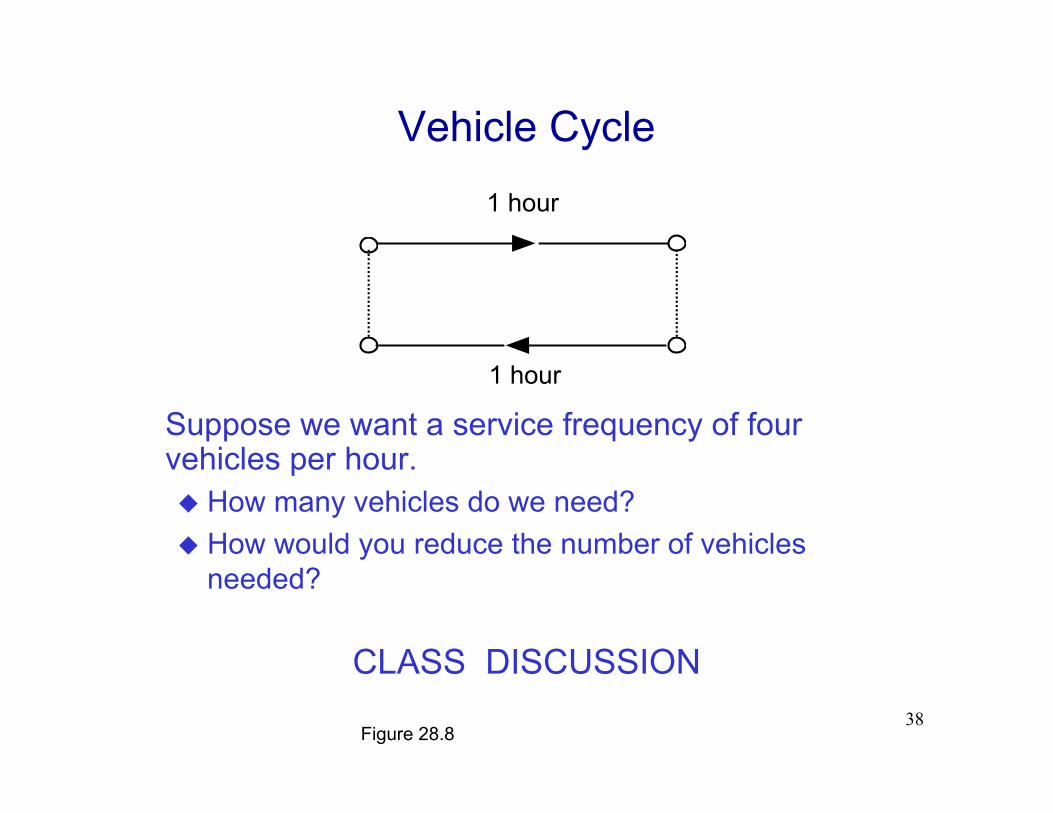
Vehicle Cycle
1 hour
1 hour
Suppose we want a service frequency of fourvehicles per hour. � How many vehicles do we need? � How would you reduce the number of vehicles
needed?
CLASS DISCUSSION
Figure 28.8 38
ITS -- Public Transportation Applications
� The ITS concept, described in Chapter 24, can be applied to public transportation. These applications, known collectively as Advanced Public Transportation Systems (APTS), include such technologies as automatic vehicle location and automatic passenger counters, which can provide the basis for more efficient fleet management systems, both in fixed rail and bus systems.
39
Traveler Information through ITS
Intermodal Transfers
There are operating strategies that would allow transit systems to operate more effectively. These strategies are information-driven and ITS technologies can be a boon to the transit industry both in improving operations and service and in providing timely information to travelers. The latter in and of itself could be an important market initiative for the public transportation industry.
40
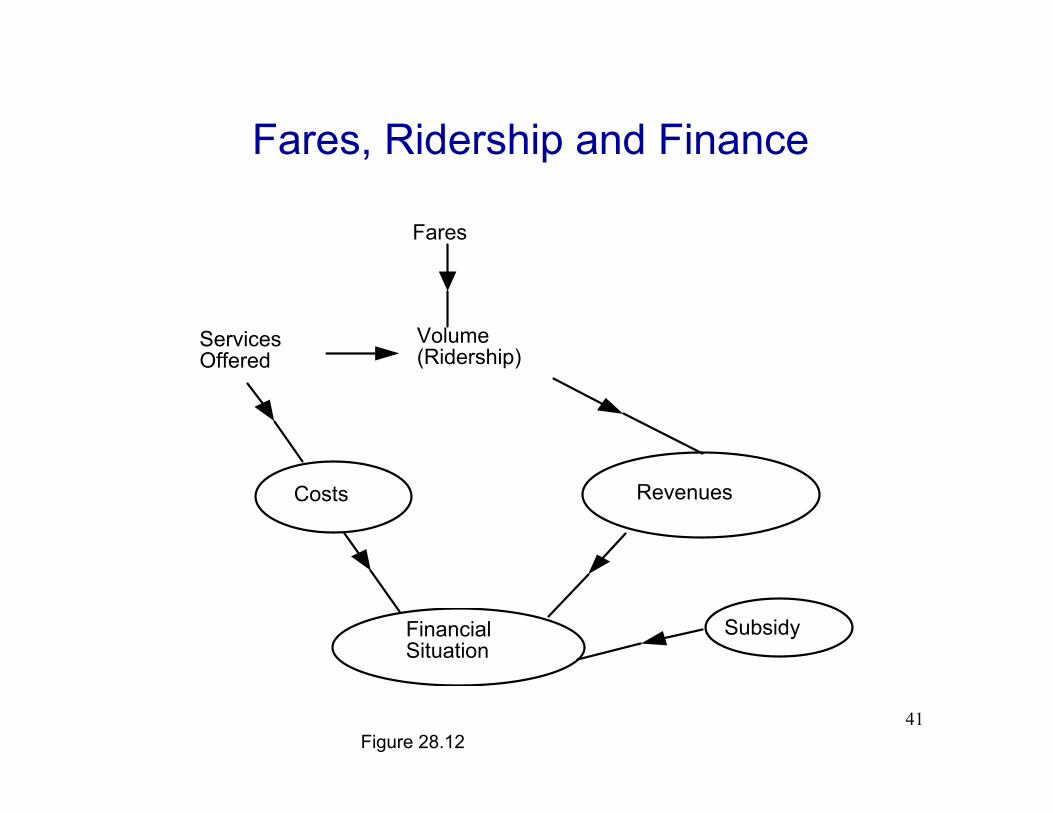
Fares, Ridership and Finance
Fares
VolumeServices (Ridership)Offered
Costs Revenues
Financial Subsidy Situation
Figure 28.12 41
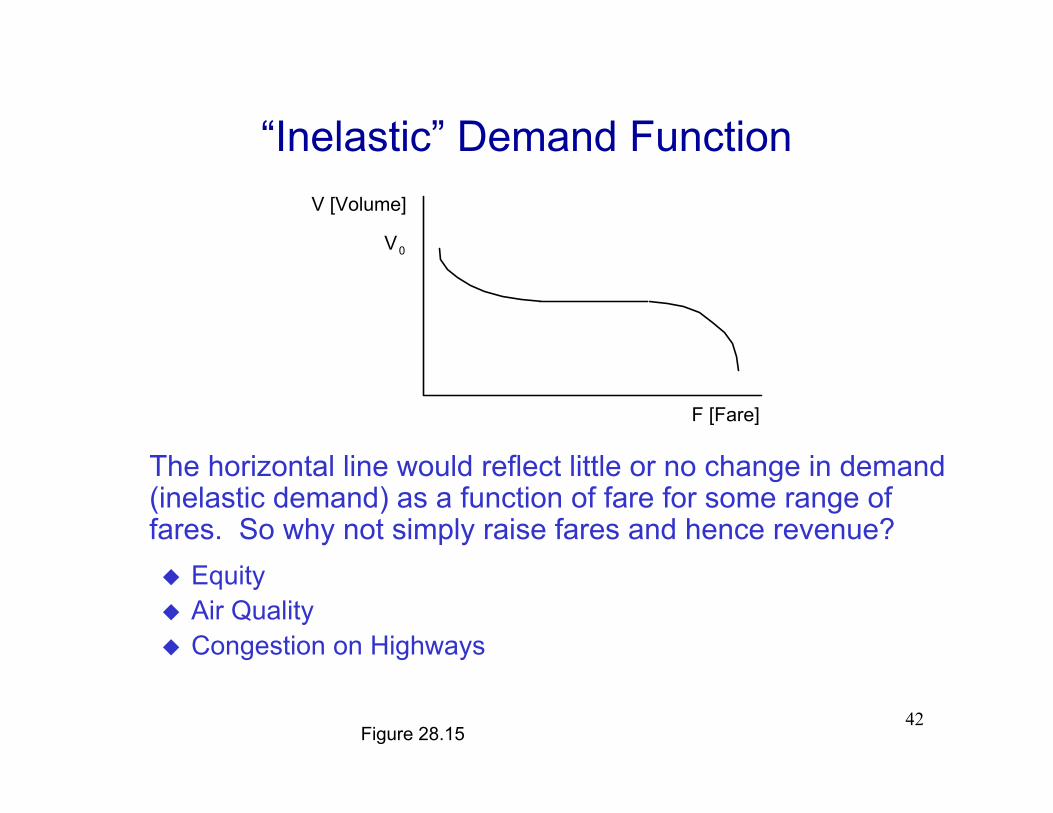
“Inelastic” Demand Function
V [Volume]
V0
F [Fare]
The horizontal line would reflect little or no change in demand(inelastic demand) as a function of fare for some range offares. So why not simply raise fares and hence revenue? � Equity � Air Quality � Congestion on Highways
Figure 28.15 42
INTERCITY TRAVELER TRANSPORTATION:
AIR
43
Reasons for Air Industry FinancialProblems
� Competition is the critical element. There are those that would argue that the industry has more capacity than itneeds for the demands it serves.
� Earnings in the airline industry are very sensitive to the ratioof filled seats to total seats. Once a seat flies empty, therevenue from that seat is gone forever. And airlines, recognizing that fact, have gone through some destructive pricing battles.
� The airline industry finds it difficult to quickly adjust its fleetsize and hence its capacity. The time between orderingnew aircraft from the manufacturer and delivery to the airline can be several years.
A Trend: Strategic Alliances 44
Air Traveler Transportation and the 30“Key Points”
� Stochasticity � Peaking in Demand� Selecting Capacity� Network Behavior
Other Key Points?
45
Land-Side Issues
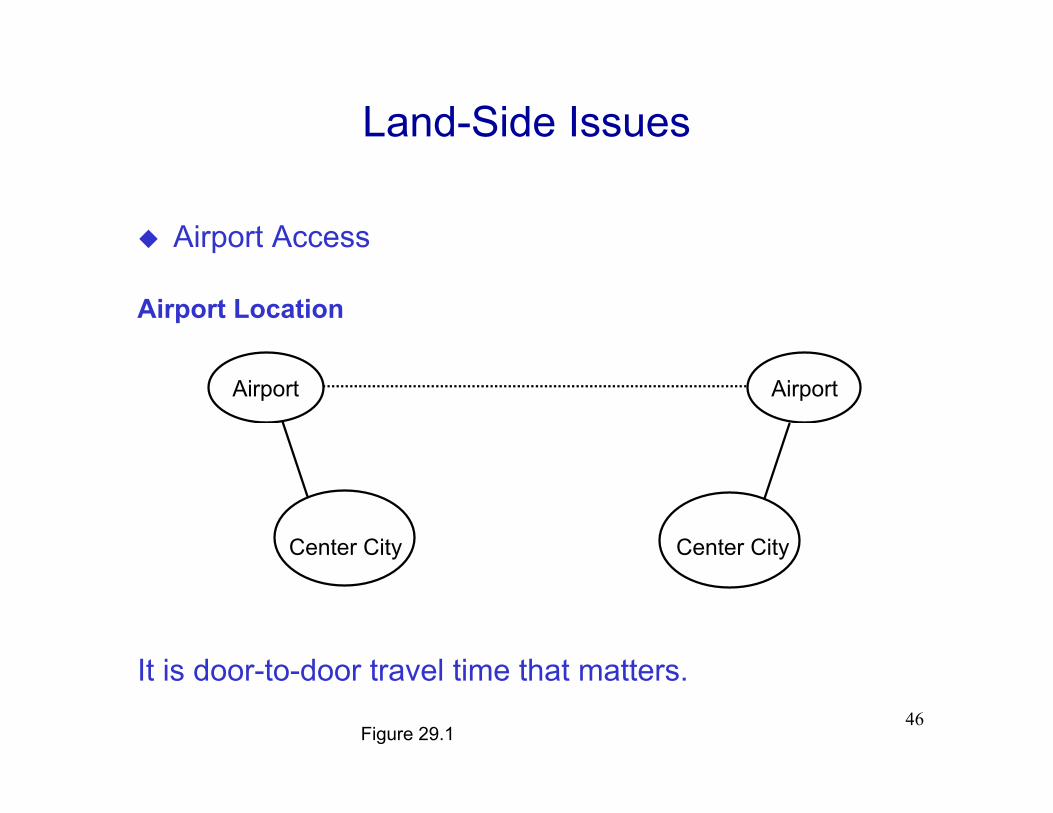
� Airport Access
Airport Location
Airport Airport
Center CityCenter City
It is door-to-door travel time that matters.
Figure 29.1 46
Aircraft Technology
� Aircraft Size � Short Take-Off and Landing Aircraft� Hypersonic Flight � The “Space Plane” � Engine and Materials Technology
47
Air Transportation as an Example ofSubsidies
� Subsidies� Between long-distance and short-distance
passengers. Cost functions look different for long-distance and short-distance passengers, so there may be cross-subsidies.
� Between business and non-business travelers. Business travelers require flexibility to make plans on very short notice and change their plans very quickly. The airline industry charges them a premium for this service.
� Among various origin-destination pairs. Customers on the non-competitive routes subsidize those on competitive routes.
48
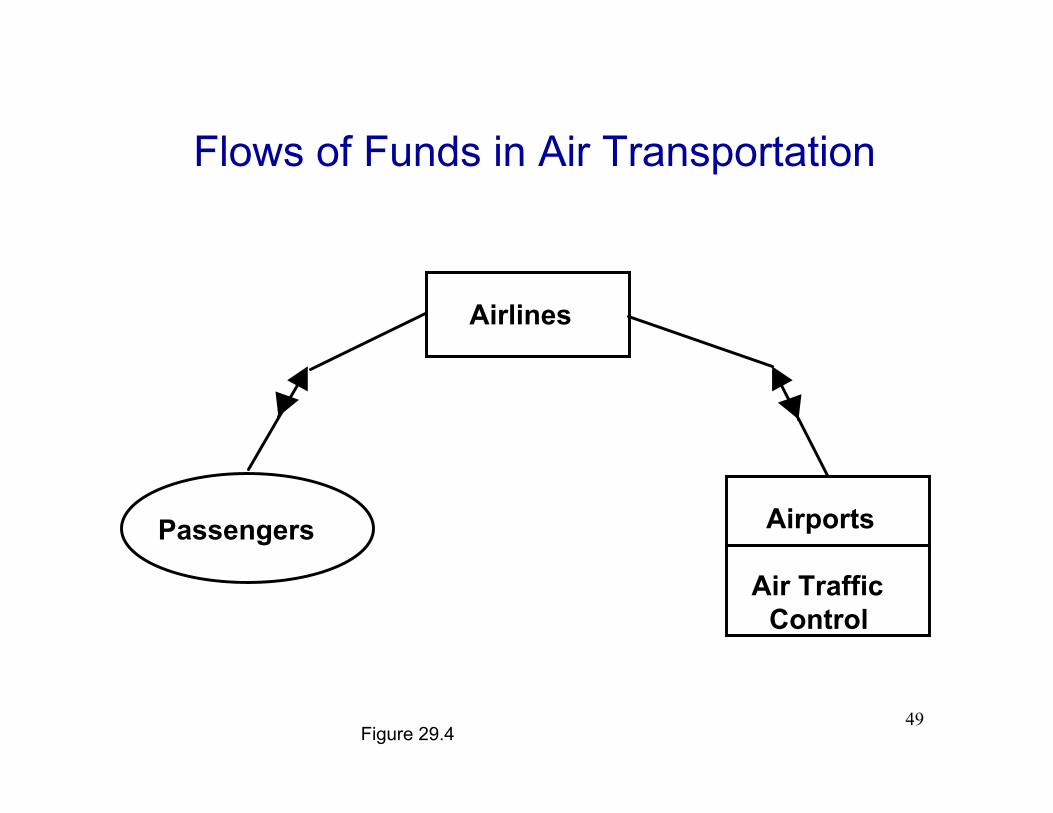
Flows of Funds in Air Transportation
Airlines
Airports
Air Traffic Control
Passengers
Figure 29.4 49
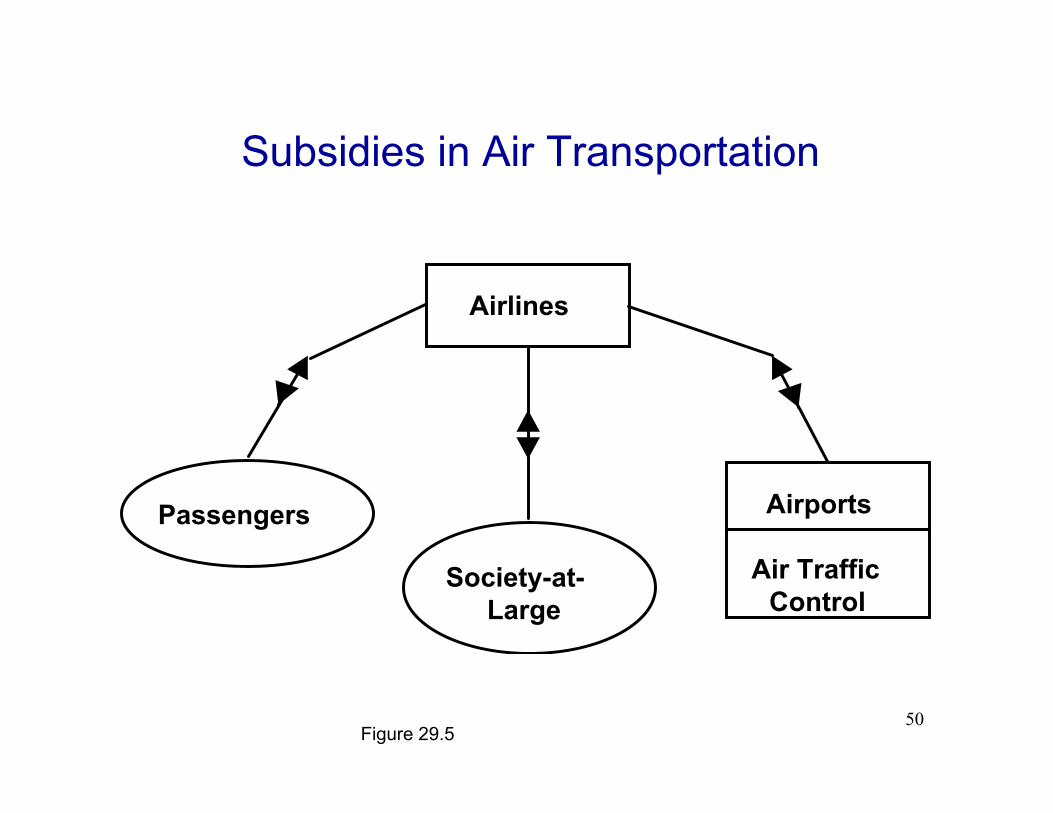
Subsidies in Air Transportation
Airlines
AirportsPassengers
Society-at- Air Traffic Large Control
Figure 29.5 50
� Does Society-at-Large Benefit Enough to Warrant the Subsidy to Air Transportation?
CLASS DISCUSSION
51
INTERCITY RAIL TRANSPORTATION
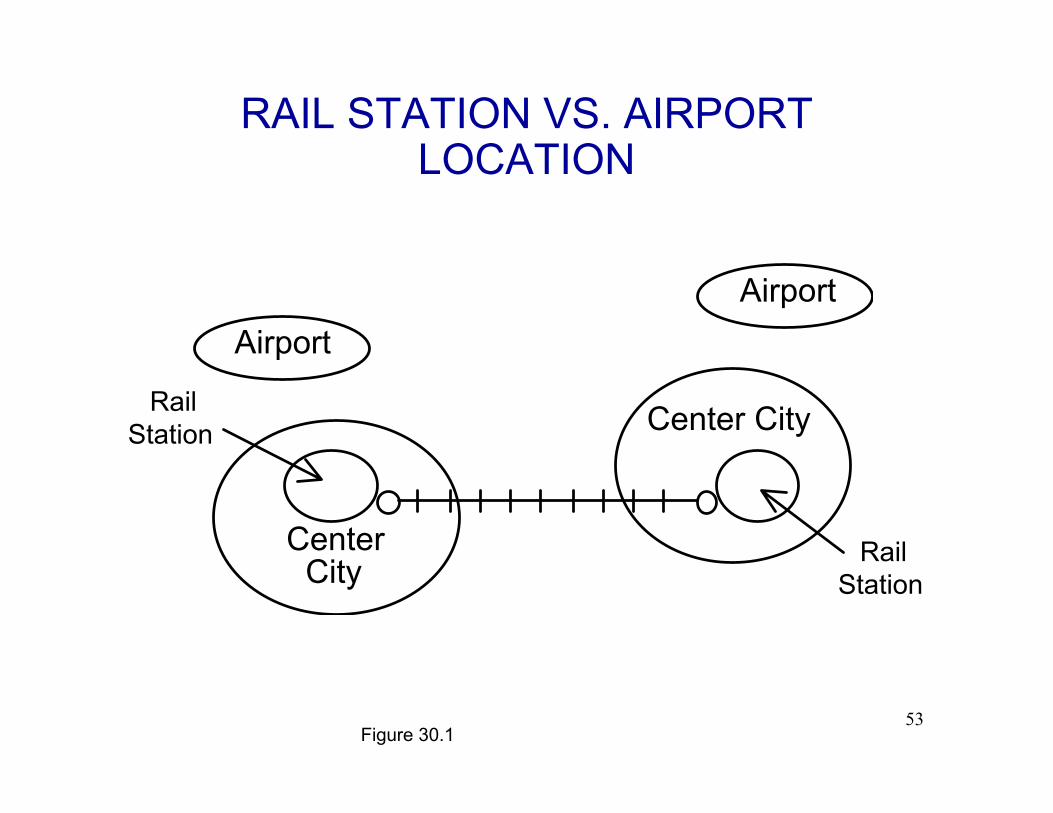
RAIL STATION VS. AIRPORT LOCATION
AirportAirport
RailStation Center City
Center RailCity Station
Figure 30.1 53
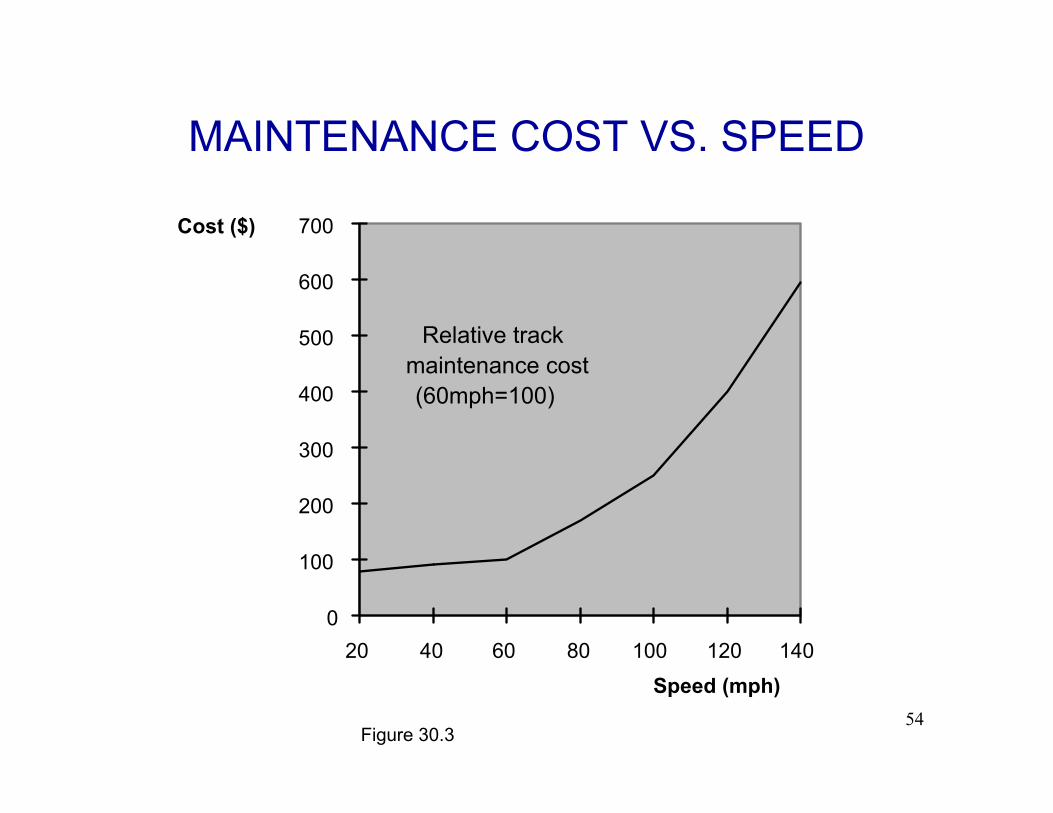
MAINTENANCE COST VS. SPEED
Cost ($) 700
600
500
400
300
200
100
0
20 40 60 80 100 120 140
Relative track maintenance cost (60mph=100)
Speed (mph)
Figure 30.3 54
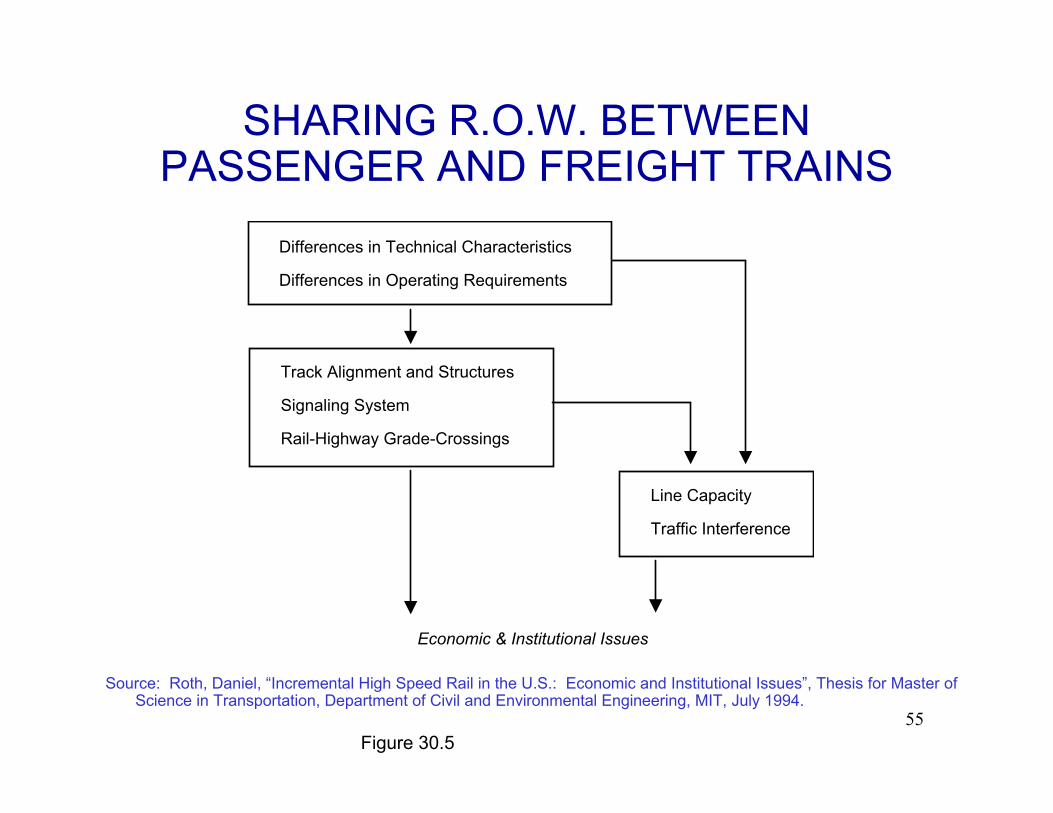
SHARING R.O.W. BETWEEN PASSENGER AND FREIGHT TRAINS
Differences in Technical Characteristics
Differences in Operating Requirements
Track Alignment and Structures
Signaling System
Rail-Highway Grade-Crossings
Line Capacity
Traffic Interference
Economic & Institutional Issues
Source: Roth, Daniel, “Incremental High Speed Rail in the U.S.: Economic and Institutional Issues”, Thesis for Master of Science in Transportation, Department of Civil and Environmental Engineering, MIT, July 1994.
Figure 30.5 55
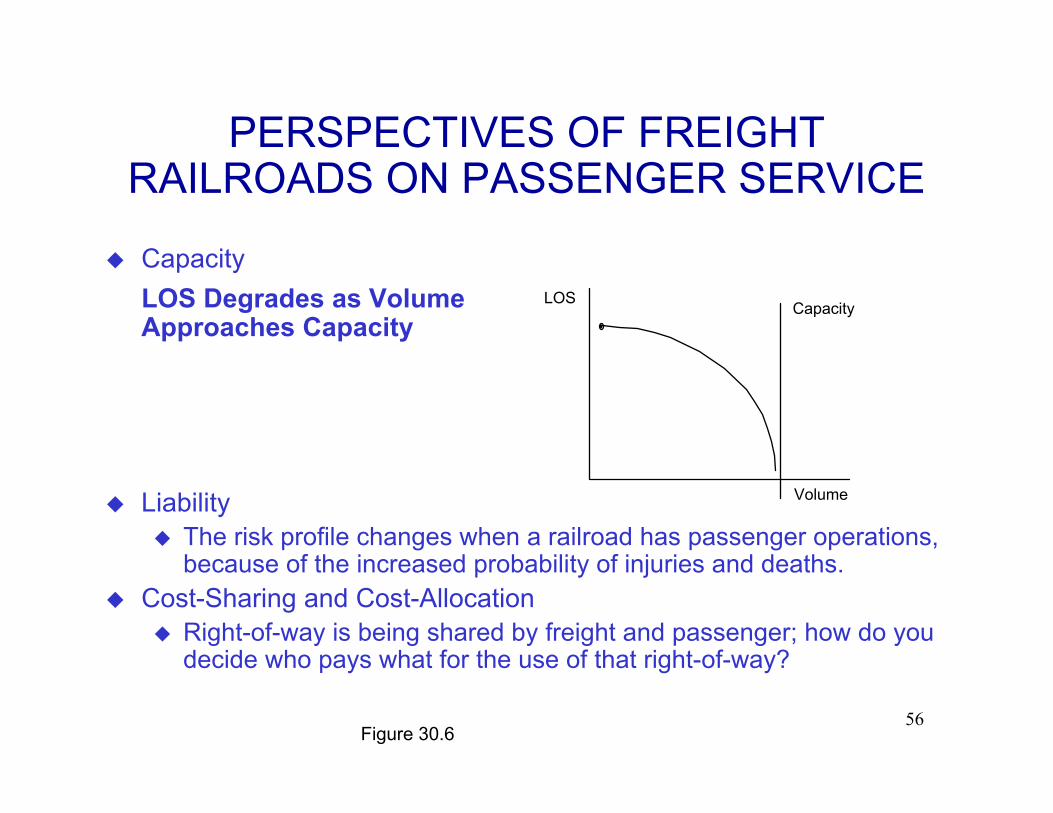
PERSPECTIVES OF FREIGHT RAILROADS ON PASSENGER SERVICE
� Capacity LOS Degrades as Volume LOS
CapacityApproaches Capacity
Volume � Liability
� The risk profile changes when a railroad has passenger operations, because of the increased probability of injuries and deaths.
� Cost-Sharing and Cost-Allocation � Right-of-way is being shared by freight and passenger; how do you
decide who pays what for the use of that right-of-way?
Figure 30.6 56
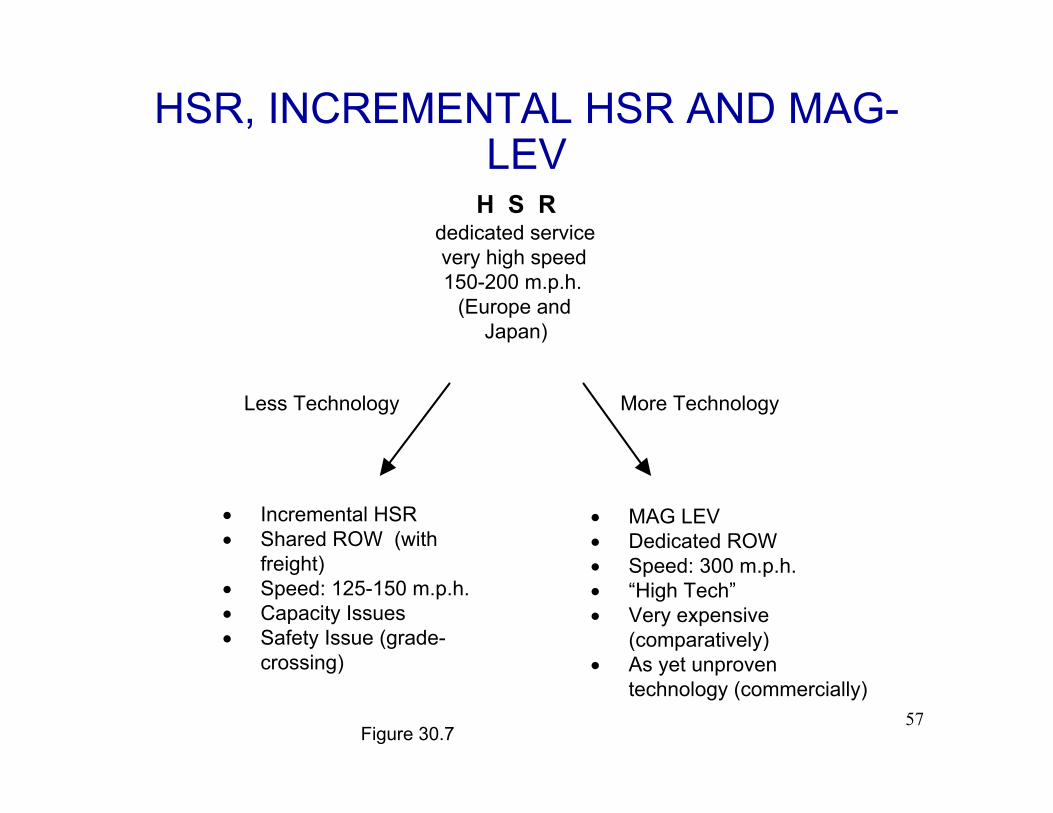
HSR, INCREMENTAL HSR AND MAGLEV
H S Rdedicated service very high speed 150-200 m.p.h.
(Europe and Japan)
Less Technology More Technology
• Incremental HSR • MAG LEV • Shared ROW (with • Dedicated ROW
• ••
freight) Speed: 125-150 m.p.h.
Capacity Issues Safety Issue (gradecrossing)
• ••
•
Speed: 300 m.p.h. “High Tech” Very expensive
(comparatively) As yet unproven technology (commercially)
57 Figure 30.7
SOME AMTRAK BUSINESS MODELS
� Ownership � Infrastructure Company
� Operating Companies
� Rail/Air Intermodal � Regionally-Scaled Systems
58
SOME AMTRAK-RELATEDPUBLIC POLICY ISSUES
� Environment � Congestion � Urban Form � Who benefits and who pays
� TRUST FUND � Modal Diversity � Equity
59
MEXICO CITY -- A MEGACITY IN THE DEVELOPING WORLD
Molina and Molina, Air Quality in the Mexico Megacity
60
MEXICO CITY
� Population ~ around 20 million
� Spans three political jurisdictions (Federal District (DF), State of Mexico (EM), Hidalgo)
� Spread-out land use patterns � The economic engine of Mexico � Extraordinary air quality issues � Extraordinary congestion � One of the largest metros in the world � Informal transportation (colectivos) important � With some wealth, growth in automobile ownership
61
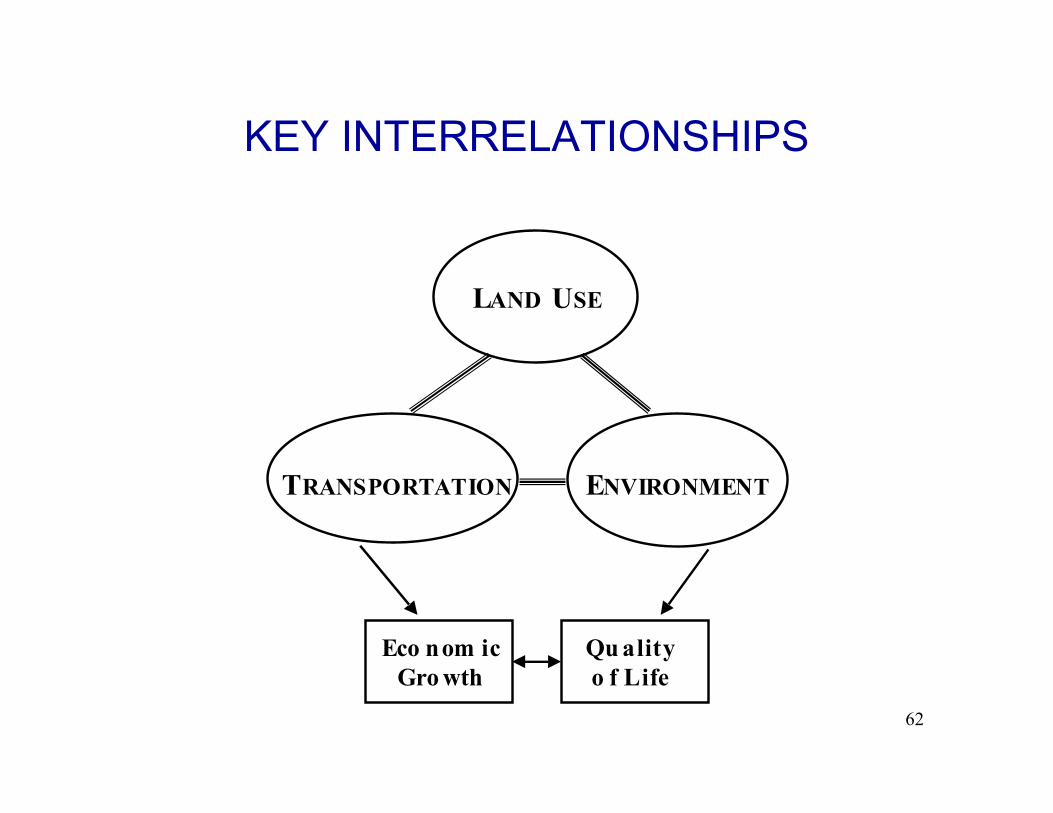
KEY INTERRELATIONSHIPS
L USE
T E
AND
RANSPORTATION NVIRONMENT
Eco n om ic Qu ality Gro wth o f Life
62
POLICY AREAS: TRANSPORTATION
� Fleet composition and operations/inspection and maintenance � Trucks � Buses � Colectivos � Taxis � Private cars
� Fuels -- blend, price � Fleet composition -- age, technology
63
POLICY AREAS: TRANSPORTATION(CONTINUED)
� Public transportation � Bus � Metro � Colectivo � Intermodalism
64
POLICY AREAS: TRANSPORTATION(CONTINUED)
� Infrastructure/technology � Truck bypass � Metro expansion � Dedicated bus lanes � Intelligent transportation systems (ITS) pricing
65
POLICY AREAS: TRANSPORTATION(CONTINUED)
� Regional perspective on land use � Transit-oriented development � Redensification � Institutions � Linkages between DF and EM � Transportation and environmental planning
66
Transportation Options
� Gas tax tied to conformity and funds for roads and public transportation � reduce private car use � forces integration of transport investments � maintains roads and promotes public transit
� Higher registration fees for older vehicles � fleet turnover
� Limit vehicle types through permits � improve fleet fuel efficiency � reduce SUV growth
67
Transportation Options
� Integrate Fare System (SmartCard) � increase ridership on public transport � reduce commuting time
� Coupling better transit access with higher auto parking costs and restrictions on congested areas � reduced congestion by promoting modal shifts
� Improve security on public transit � mode shift to public transit
68
Transportation Options
� Integration of metro bus routes � increase ridership on public transport � reduce commuting time
� Coupling urban-development and metro stations � power passenger-km-traveled on “dirty” modes � Improved metro ridership
� Metro expansion (including to EM) � increased ridership
69
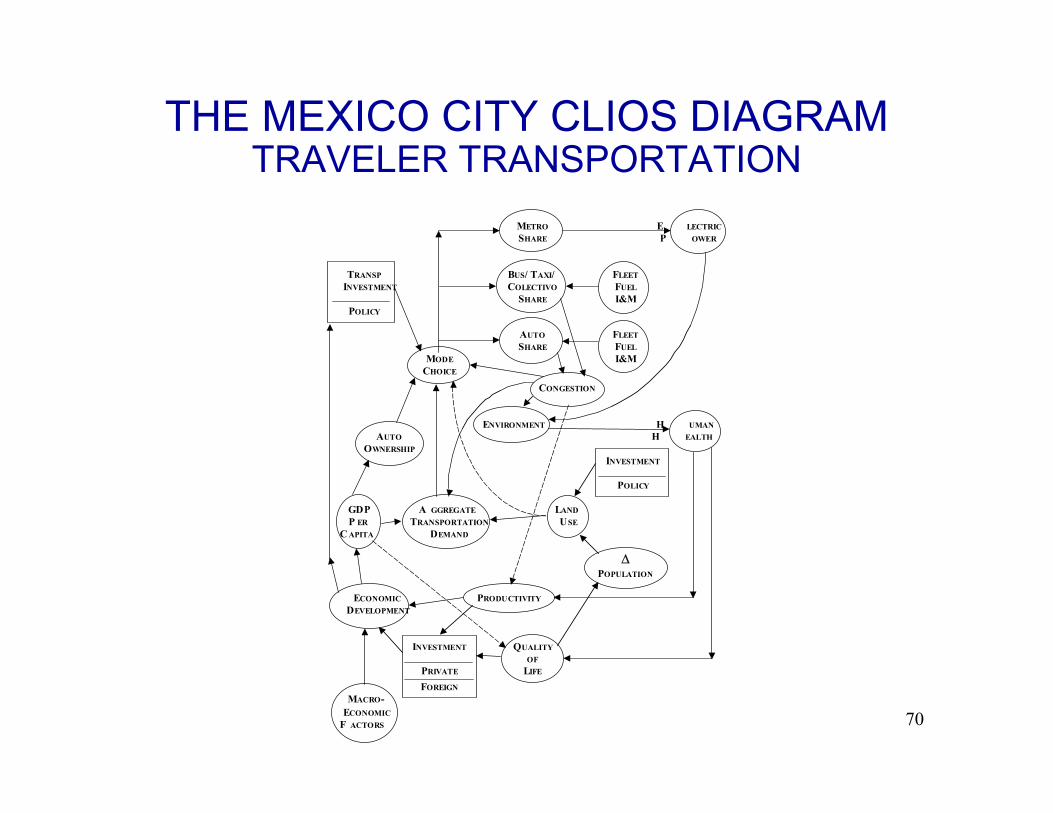
THE MEXICO CITY CLIOS DIAGRAMTRAVELER TRANSPORTATION
M E S P
T BUS/ T / FI C F
SP
A FS F
MC
C
E H A H
OI
P
A LAND P ER T U SE
C D
∆ P
E PD
I QOF
P LF
M E
F
ETRO LECTRIC HARE OWER
RANSP AXI LEET NVESTMENT OLECTIVO UEL
HARE I&M OLICY
UTO LEET HARE UEL
ODE I&M HOICE
ONGESTION
NVIRONMENT UMAN UTO EALTH
WNERSHIP NVESTMENT
OLICY
GDP GGREGATE RANSPORTATION
APITA EMAND
OPULATION
CONOMIC RODU CTIVITY EVELOPMENT
NVESTMENT UALITY
RIVATE IFE
OREIGN ACRO
CONOMICACTORS 70
Intelligent Transportation Systems (ITS)
71
Definition of ITS
� Intelligent Transportation Systems (ITS) apply well-established technologies of communications, control, electronics and computer hardware and software to the surface transportation system.
72
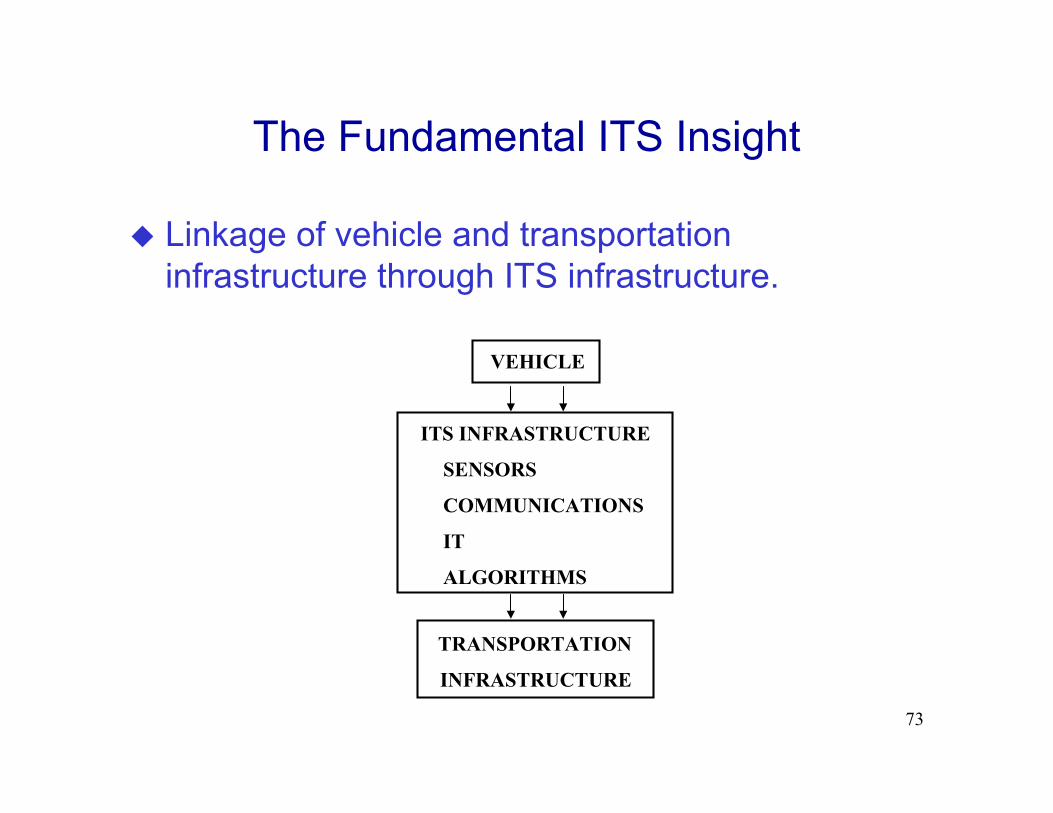
The Fundamental ITS Insight
� Linkage of vehicle and transportation infrastructure through ITS infrastructure.
VEHICLE
ITS INFRASTRUCTURE
SENSORS
COMMUNICATIONS
IT
ALGORITHMS
TRANSPORTATION
INFRASTRUCTURE
73
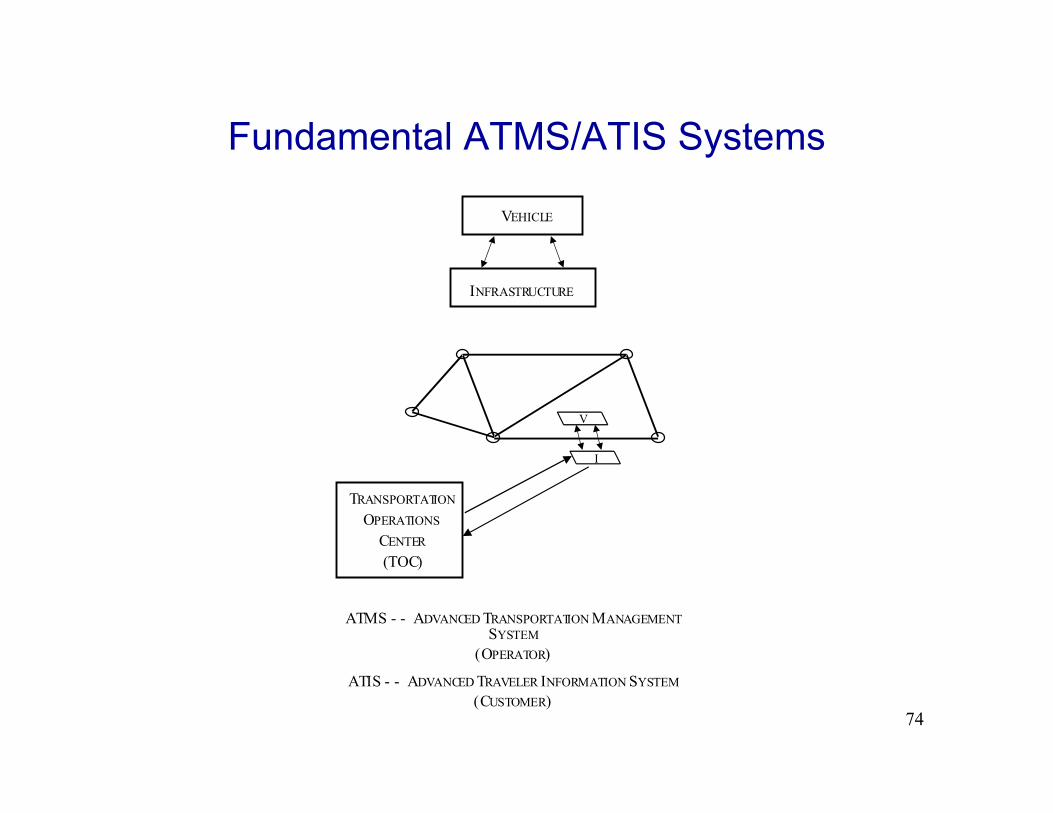
Fundamental ATMS/ATIS Systems
V
I
V
I
TO
C
EHICLE
NFRASTRUCTURE
RANSPORTATION
PERATIONS
ENTER
(TOC)
ATMS - - ADVANCED TRANSPORTATION MANAGEMENT SYSTEM
(OPERATOR)
ATIS - - ADVANCED TRAVELER INFORMATION SYSTEM (CUSTOMER)
74
The ITS-4 Technologies
� The ability to sense the presence and identity of vehicles or shipments in real-time on the infrastructure throughroadside devices or Global Positioning Systems (GPS);
� The ability to communicate (i.e., transmit) large amounts of information cheaper and more reliably;
� The ability to process large amounts of information through advanced information technology; and
� The ability to use this information properly and in real-time in order to achieve better transportation networkoperations. We use algorithms and mathematical methods to develop strategies for network control andoptimization.
75
Some Functions
� Manage and monitor the network traffic flows � Provide information on the state of the network
� Fleet management (vehicle location) � Trucks � Buses
� Monitoring vehicle condition and status � Trucks � Buses
� Autonomous systems � Vehicle status � Intelligent cruise control � Obstacle detection
76
Introduction
� ITS combines high technology and improvements in information systems, communication, sensors, and advanced mathematical methods with the conventional world of surface transportation infrastructure.
� In addition to technological and systems issues, there are a variety of institutional issues that must be carefully addressed.
� Substantial leadership will be required to implement ITS as an integrator of transportation, communications and intermodalism on a regional scale.
77
The Vision for ITS in the U.S.
� A national system that operates consistently and efficiently across the U.S. to promote the safe, orderlyand expeditious movement of people and freight. Here, recognition of the need to think intermodally and aboutthe needs for both personal and freight mobility wasexplicit.
� An efficient public transportation system that interacts smoothly with improved highway operations. The concept that ITS had to do more than simply improve single occupancy vehicle level-of-service on highways iscaptured here.
� A vigorous U.S. ITS industry supplying both domesticand international needs.
78
Advanced Transportation ManagementSystems (ATMS)
� ATMS will integrate management of various roadway functions. It will predict traffic congestion and providealternative routing instructions to vehicles over regionalareas to improve the efficiency of the highway networkand maintain priorities for high-occupancy vehicles.
� Real-time data will be collected, utilized, and disseminated by ATMS systems and will further alert transit operators of alternative routes to improve transit operations.
� Dynamic traffic control systems will respond in real-timeto changing conditions across different jurisdictions (for example, by routing drivers around accidents).
79
Incident Management
� We are interested in reducing non-recurringcongestion; that is, incident- or accident-based congestion rather than rush hour congestion.
� One can identify and locate those incidents andremove them quickly, and reduce congestion-baseddelay substantially.
� With the technology on the network to measurevelocities in real-time everywhere in the network, onecan think about being able to identify and locateincidents by various velocity signatures.
80
Electronic Toll and Traffic Management (ETTM)
� The basic idea here is that one can detect and identify individual vehicles with road-side readers
� These readers can debit an account by sensing thetransponder carried on your windshield; you pay yourtoll electronically rather than having to stop and pay.
� That, in and of itself, reduces congestion.� Enables congestion pricing.
81
Advanced Traveler Information Systems(ATIS)
� ATIS will provide data to travelers in their vehicles, in their homes or at their places of work.
� Information will include: location of incidents, weather problems, road conditions, optimal routings, lanerestrictions and in-vehicle signing.
� Information can be provided both to drivers and totransit users and even to people before a trip to helpthem decide what mode they should use.
� “May-Day” calls for help from a disabled vehicle areincluded here as well.
82
Advanced Vehicle Control Systems(AVCS)
� In the near term, intelligent cruise control, which automatically adjusts the speed of the vehicle to that ofthe vehicle immediately ahead, is an example of AVCS.
� More generally, collision warning systems would alert the driver to a possible imminent collision, say, with a roadside obstacle.
� In more advanced systems, the vehicle wouldautomatically brake or steer away from a collision.
� These systems are autonomous to the vehicle and canprovide substantial benefits by improving safety andreducing accident-induced congestion.
83
Automated Highway Systems (AHS)
“Hands-off, feet-off, brain-off” driving.
Does this make sense?
What are the barriers to deployment?
“The Devil and the Governor of Massachusetts”
84
Commercial Vehicle Operations (CVO)
� In CVO, the private operators of trucks, vans and taxisare using ITS technologies to improve the productivityof their fleets and the efficiency of their operations.
� Such concepts as weigh-in-motion (WIM), preclearance of trucks across state boundaries, automatic vehicle location for fleet management, on-board safety monitoring devices, are included here.
85
Advanced Public Transportation Systems(APTS)
� APTS can use ITS technologies to greatlyenhance the accessibility to information forusers of public transportation.
� Also, ITS can improve fare collecting,scheduling of public transportation vehicles,intramodal and intermodal connections, and the utilization of bus fleets.
86
Advanced Rural Transportation Systems(ARTS)
� How ITS technologies can be applied onrelatively low-density roads is a challenge that isbeing undertaken by many rural states.
� Safety rather than congestion is the mainmotivation for ARTS. Single vehicle run-off-the-road accidents are a target here.
� “May-Day” devices are of particular interest inthis environment.
87
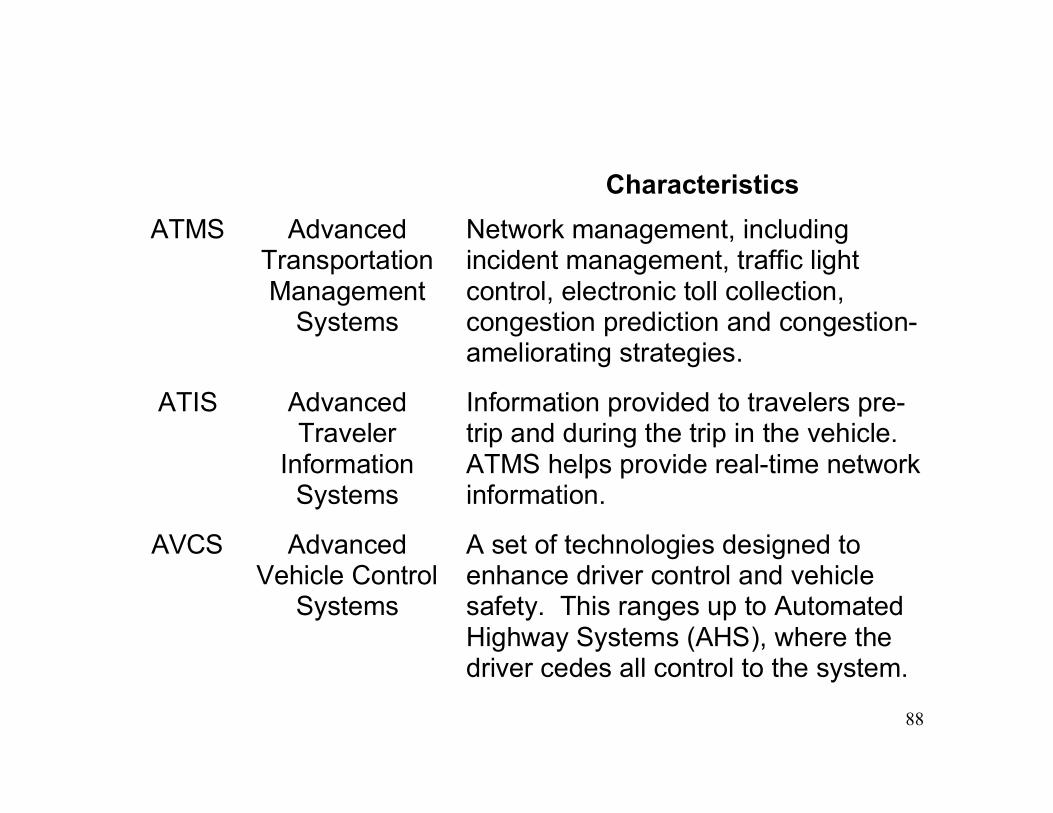
ATMS Advanced Transportation Management
Systems
ATIS Advanced Traveler
Information Systems
AVCS Advanced Vehicle Control
Systems
Characteristics Network management, including incident management, traffic light control, electronic toll collection, congestion prediction and congestion-ameliorating strategies.
Information provided to travelers pretrip and during the trip in the vehicle. ATMS helps provide real-time network information.
A set of technologies designed to enhance driver control and vehicle safety. This ranges up to Automated Highway Systems (AHS), where the driver cedes all control to the system.
88
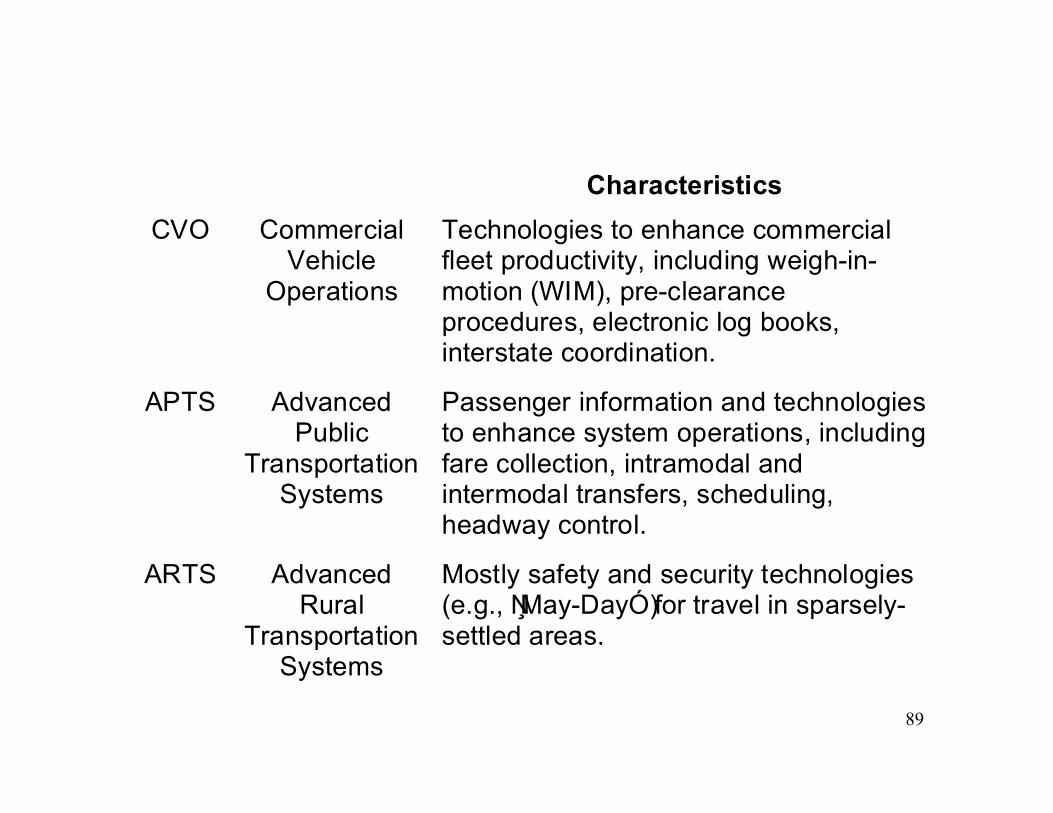
CVO Commercial Vehicle
Operations
APTS Advanced Public
Transportation Systems
ARTS Advanced Rural
Transportation Systems
Characteristics Technologies to enhance commercial fleet productivity, including weigh-in-motion (WIM), pre-clearance procedures, electronic log books, interstate coordination.
Passenger information and technologies to enhance system operations, including fare collection, intramodal and intermodal transfers, scheduling, headway control.
Mostly safety and security technologies (e.g., ŅMay-DayÓ) for travel in sparsely-settled areas.
89
Institutional Issues
� Public-Private Partnerships
� Organizational Change � Transportation Education � Legal Liability � Political Strength of Traditional Construction
Industry � Intellectual Property
90
Transportation and Change
� Changes resulting from the Interstate in the U.S.� The intercity trucking industry was formed and a
financial blow was dealt to the railroad industry, as itlost substantial market share in high-value freight. This led, in turn, to a fundamental redefinition of the relationship between the public and private sectors inthe freight industry in 1980, through substantialderegulation.
� The Interstate led to an unprecedented and unequaledmobility between and into U.S. cities and gave rise tothe regional transportation concept, with wholly newmethods of planning being required for region-wideanalysis and design.
91
Transportation and Change(continued)
� The Interstate System included the development ofcircumferential belts around major cities, leading todevelopment patterns quite at variance with the ability ofpublic transportation to service it and, as described byauthors such as Joel Garreau, the development of “edgecities”, a fundamentally new kind of urban structure.
� The Interstate led to a fueling of the post-war economicexpansion and a period of unprecedented prosperity inthe U.S.
� A “stop the highway” backlash in urban areas resultedfrom the Interstate, and a political polarization betweenthe build vs. no-build factions became a fact of politicallife in U.S. transportation.
92
Transportation and Change(continued)
� Changes resulting from ITS � The reinvention of logistics through supply chain
management, linking inventory management andtransportation in wholly new ways;
� Dramatic moves into surface transportation byorganizations not traditionally involved, such as thenational labs and aerospace companies in the U.S.;
� Changes to academia, with new alliances and newacademic programs beginning to be formed, and facultyparticipating in transportation education and researchwho have never been part of that process before; and
� Building of new relationships among public-sectoragencies to enable regional and corridor-level systemdeployment.
93
Regional Deployment -A Strategic Vision
� The strategic vision for ITS, then, is as the integrator of transportation, communications and intermodalism on a regional scale.
94

WRAP-UP
SO WHERE HAVE WE BEEN IN 1.221?
� Concepts � CLIOS � 30 Key Points
� Freight Transportation � Total Logistics Costs (TLC) � LOS for freight modes � Operating issues
� Traveler Transportation � Automobiles � Urban Form and Transportation � Urban Public Transportation � Megacities � Intercity Traveler Transportation--Air, Amtrak � ITS
96
SOME EMPHASIZED POINTS (WE CAN'T DO EVERYTHING IN 21 HOURS!)
� The Triplet of Technology/Systems/Institutions
� Level-of-Service (LOS)--freight and travelers--the importance of the customer
� The Cost/LOS trade-off � Supply/Demand/Equilibrium
� The Vehicle-cycle � Transportation as a component of a larger social-
political-economic system--a force for good and otherwise
97
TRANSITIONS IN THE WORLD OF TRANSPORTATION:
A SYSTEMS VIEW
Joseph M. SussmanTransportation Quarterly
Vol. 56, No. 1, Winter 2002 Eno Transportation Foundation
Washington, DC, 2002
98
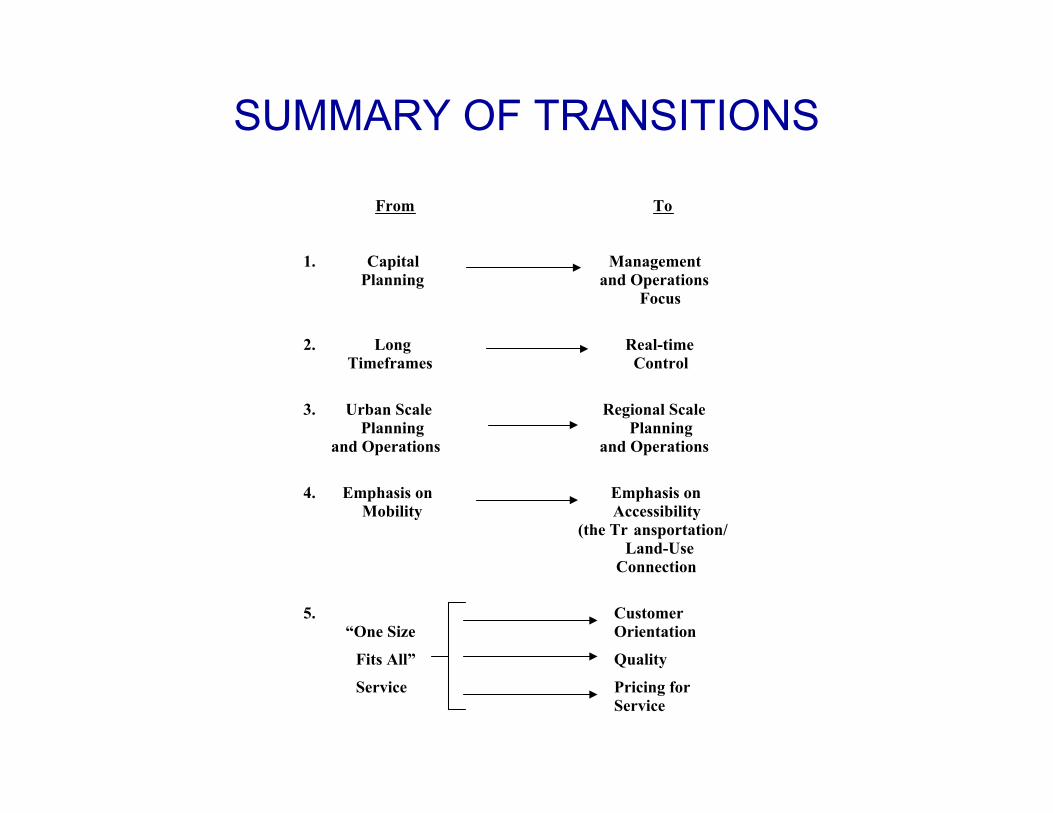
SUMMARY OF TRANSITIONS
From
1. Capital Planning
2. Long Timeframes
3. Urban Scale Planning
and Operations
To
Management and Operations
Focus
Real-time Control
Regional Scale Planning
and Operations
4. Emphasis on Emphasis on Mobility Accessibility
(the Tr ansportation/ Land-Use
Connection
5. Customer “One Size Orientation
Fits All” Quality
Service Pricing for Service
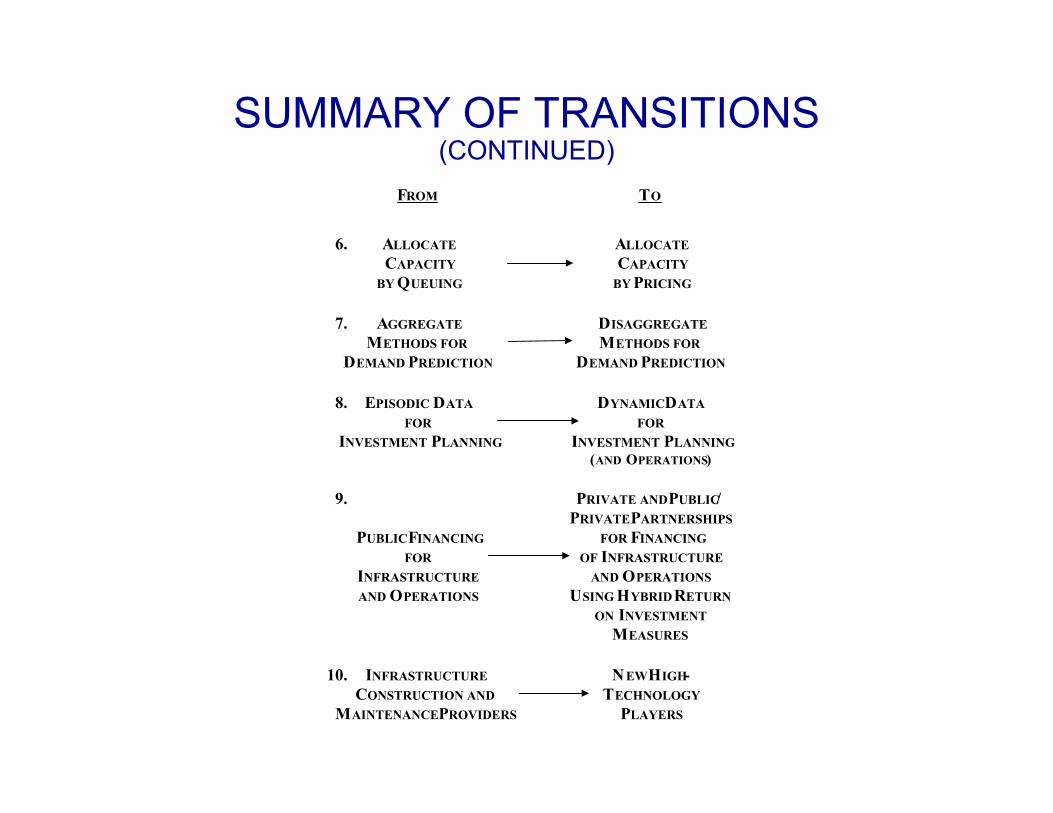
SUMMARY OF TRANSITIONS(CONTINUED)
FROM TO
6. ALLOCATE ALLOCATE CAPACITY CAPACITY
BY QUEUING BY PRICING
7. AGGREGATE DISAGGREGATE
METHODS FOR METHODS FOR DEMAND PREDICTION DEMAND PREDICTION
8. EPISODIC DATA DYNAMICDATA
FOR FOR INVESTMENT PLANNING INVESTMENT PLANNING
(AND OPERATIONS)
9. PRIVATE ANDPUBLIC/ PRIVATEPARTNERSHIPS
PUBLICFINANCING FOR FINANCING FOR OF INFRASTRUCTURE
INFRASTRUCTURE AND OPERATIONS AND OPERATIONS USING HYBRID RETURN
ON INVESTMENT MEASURES
10. INFRASTRUCTURE N EWHIGHCONSTRUCTION AND TECHNOLOGY
MAINTENANCEPROVIDERS PLAYERS
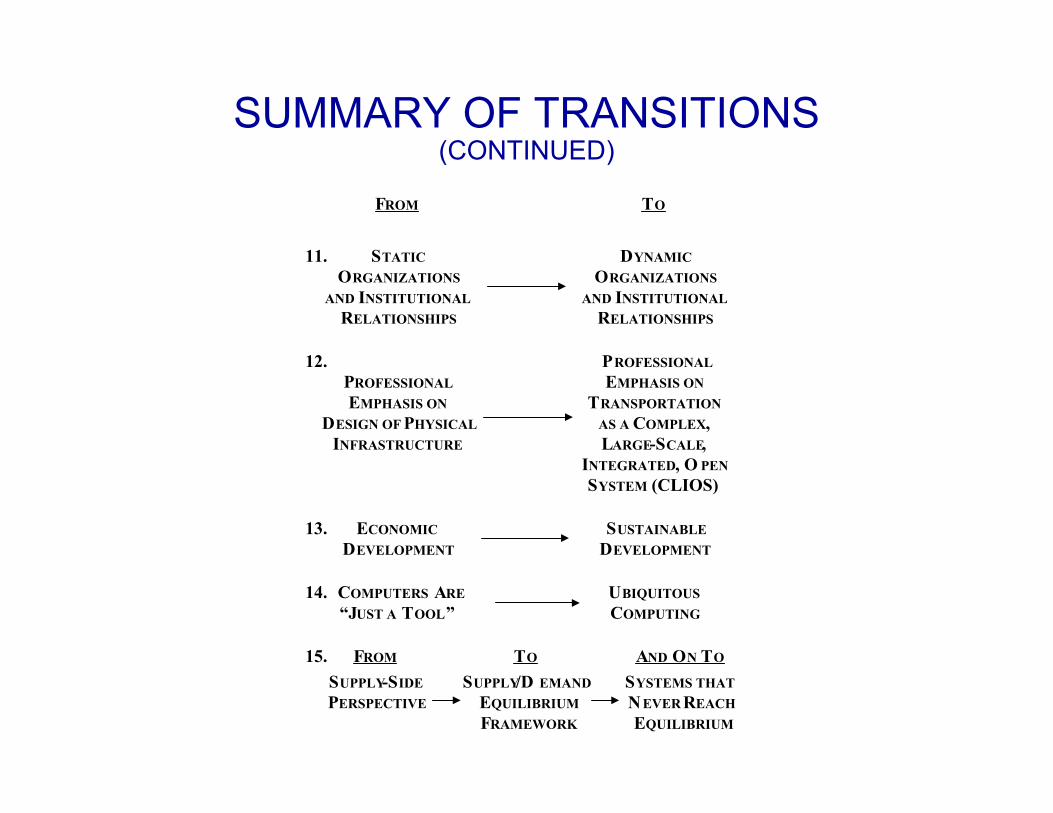
SUMMARY OF TRANSITIONS(CONTINUED)
FROM TO
11. STATIC DYNAMIC ORGANIZATIONS ORGANIZATIONS
AND INSTITUTIONAL AND INSTITUTIONAL RELATIONSHIPS RELATIONSHIPS
12. PROFESSIONAL PROFESSIONAL EMPHASIS ON EMPHASIS ON TRANSPORTATION
DESIGN OF PHYSICAL AS A COMPLEX, INFRASTRUCTURE LARGE-SCALE,
INTEGRATED, O PEN SYSTEM (CLIOS)
13. ECONOMIC SUSTAINABLE DEVELOPMENT DEVELOPMENT
14. COMPUTERS ARE UBIQUITOUS “JUST A TOOL” COMPUTING
15. FROM TO AND ON TO
SUPPLY-SIDE SUPPLY/D EMAND SYSTEMS THAT PERSPECTIVE EQUILIBRIUM N EVER REACH
FRAMEWORK EQUILIBRIUM
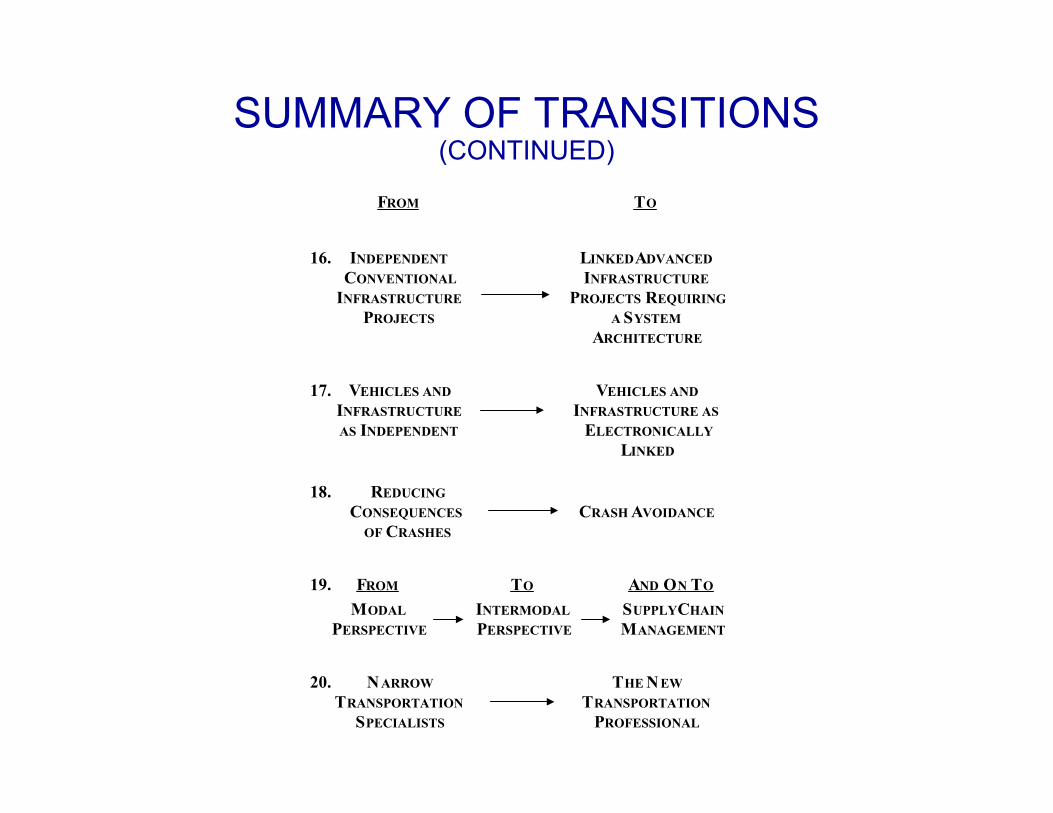
SUMMARY OF TRANSITIONS(CONTINUED)
FROM TO
16. INDEPENDENT LINKEDADVANCED CONVENTIONAL INFRASTRUCTURE
INFRASTRUCTURE PROJECTS REQUIRING PROJECTS A SYSTEM
ARCHITECTURE
17. VEHICLES AND VEHICLES AND INFRASTRUCTURE INFRASTRUCTURE AS AS INDEPENDENT ELECTRONICALLY
LINKED
18. REDUCING CONSEQUENCES CRASH AVOIDANCE
OF CRASHES
19. FROM TO AND ON TO
MODAL INTERMODAL SUPPLYCHAIN PERSPECTIVE PERSPECTIVE MANAGEMENT
20. N ARROW THE N EW TRANSPORTATION TRANSPORTATION
SPECIALISTS PROFESSIONAL