Embed Size (px)
Citation preview
1
L’energia nucleare venti anni dopo:Prospettive, opportunità, rischi
Giuseppe NardulliUniversità di Bari & Comitato per l’Unità della Sinistra

2
Comunicato della Casa della Sinistra - Bari
Il processo di unificazione della Sinistra è stato avviato in Puglia alcuni mesi fa ed ha toccato alcune tappe significative.Occorre ora fare un passo in avanti, decidere insieme le azioni future e passare ad una fase più propositiva, che consenta sia una maggiore partecipazione attiva, sia un maggiore approfondimento dei temi sui quali costruire l’unità.

3
Proponiamo una conferenza programmatica pugliese, aperta ai partiti, alle associazioni ed ai singoli aderenti alla Sinistra preparata da
Assemblea Regionale Pugliese per l’Unità della Sinistra
il giorno 3 dicembre 2007, ore 17presso la Regione Puglia (sala riunioni)
Extramurale Capruzzi 212
http://casasinistra.blogspot.com/
4
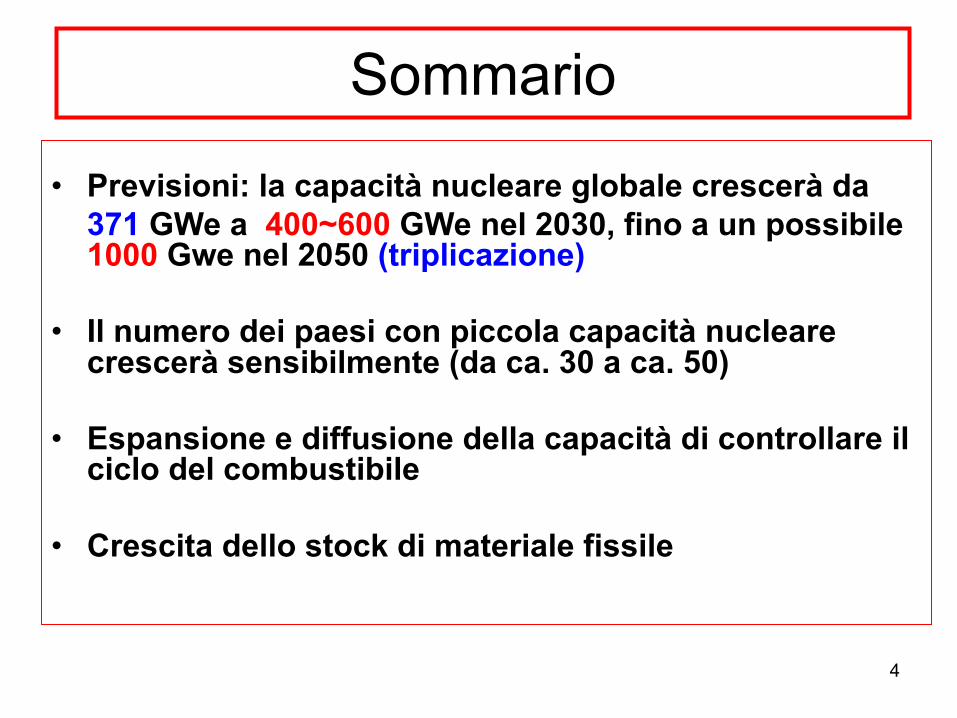
Sommario
• Previsioni: la capacità nucleare globale crescerà da 371 GWe a 400~600 GWe nel 2030, fino a un possibile 1000 Gwe nel 2050 (triplicazione)
• Il numero dei paesi con piccola capacità nucleare crescerà sensibilmente (da ca. 30 a ca. 50)
• Espansione e diffusione della capacità di controllare il ciclo del combustibile
• Crescita dello stock di materiale fissile

5
Ragioni economiche21/11/07: 99,29$
6
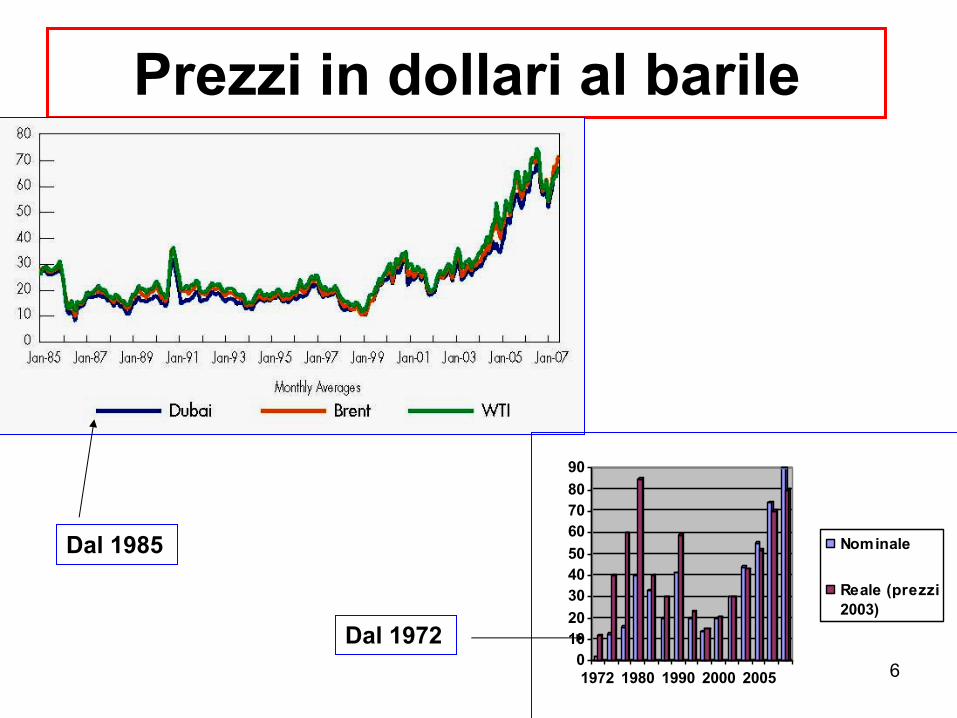
Prezzi in dollari al barile
Dal 1985
0102030405060708090
1972 1980 1990 2000 2005
Nominale
Reale (prezzi2003)
Dal 1972
7
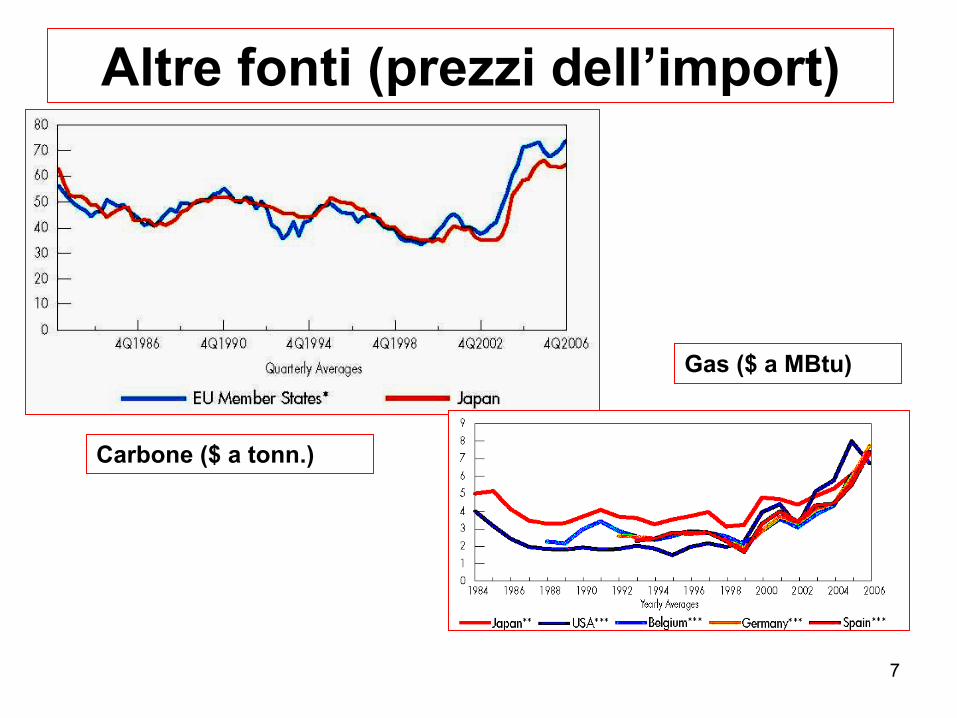
Altre fonti (prezzi dell’import)
Carbone ($ a tonn.)
Gas ($ a MBtu)
8
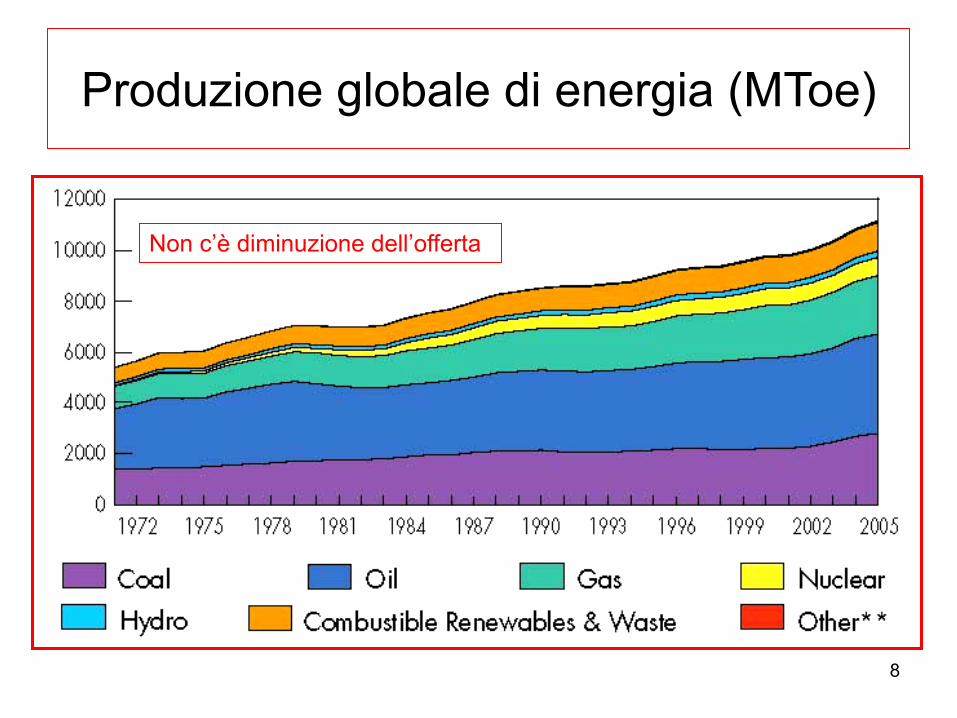
Produzione globale di energia (MToe)
Non c’è diminuzione dell’offerta
9
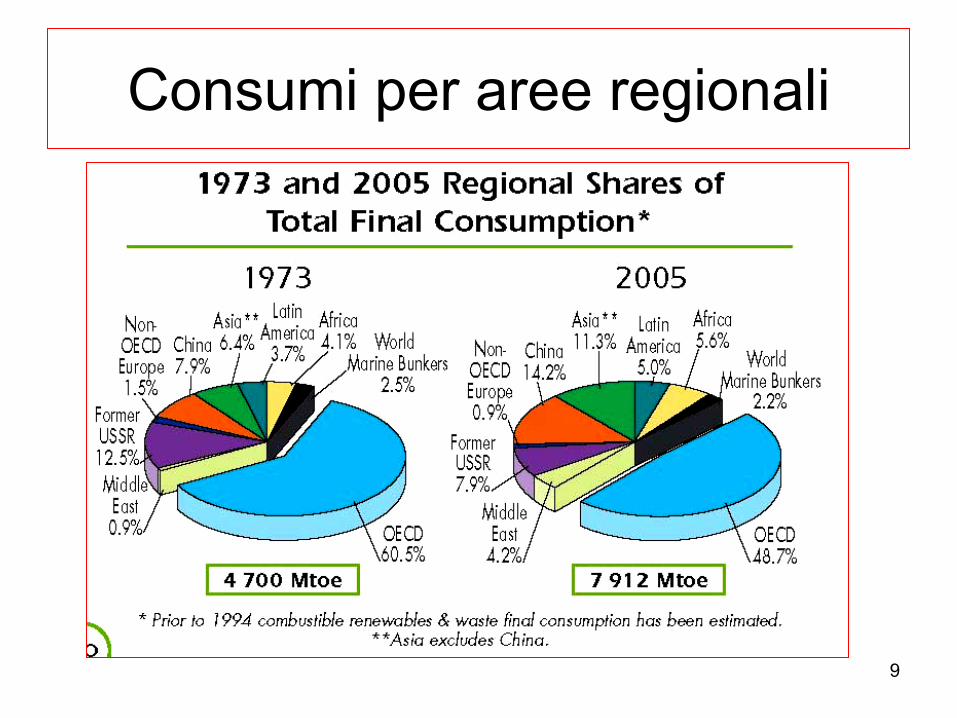
Consumi per aree regionali
10
Competitività del nucleare1. Costi di gestione
Il costo medio del kWh in USA era nel 2005 di 5 cent$, quello del nucleare oggi è 1.7 cent, con margini del 200%
2. Crescita dei costi del carbone, per ridurre gas serra (USA)
11
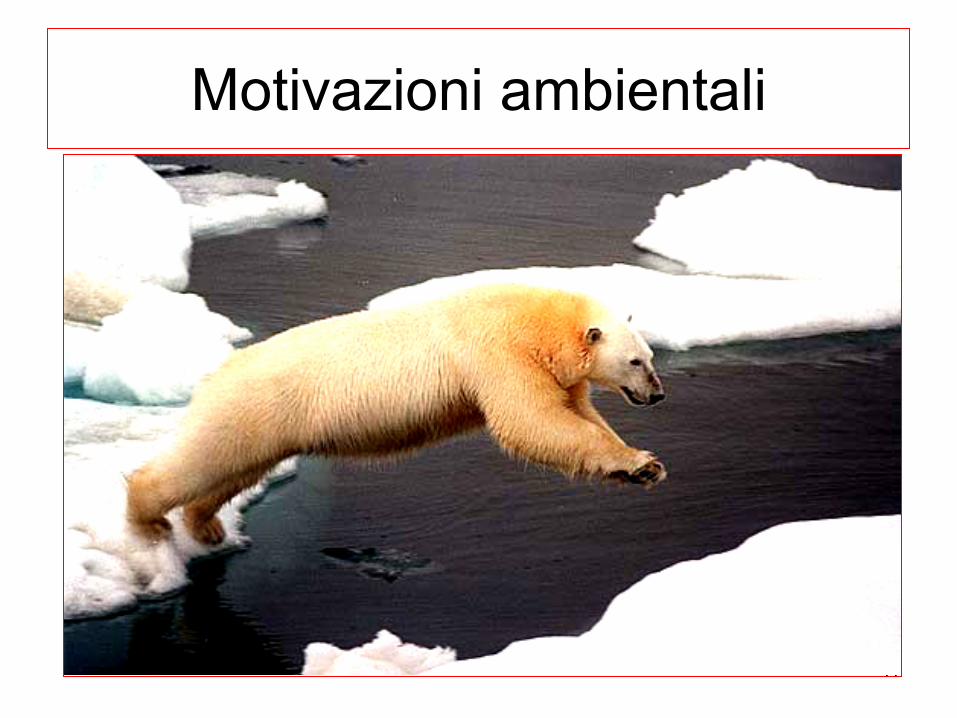
Motivazioni ambientali

12
Motivazioni ambientali

13
Emissioni di gas serrasecondo le fonti (serie temporali)
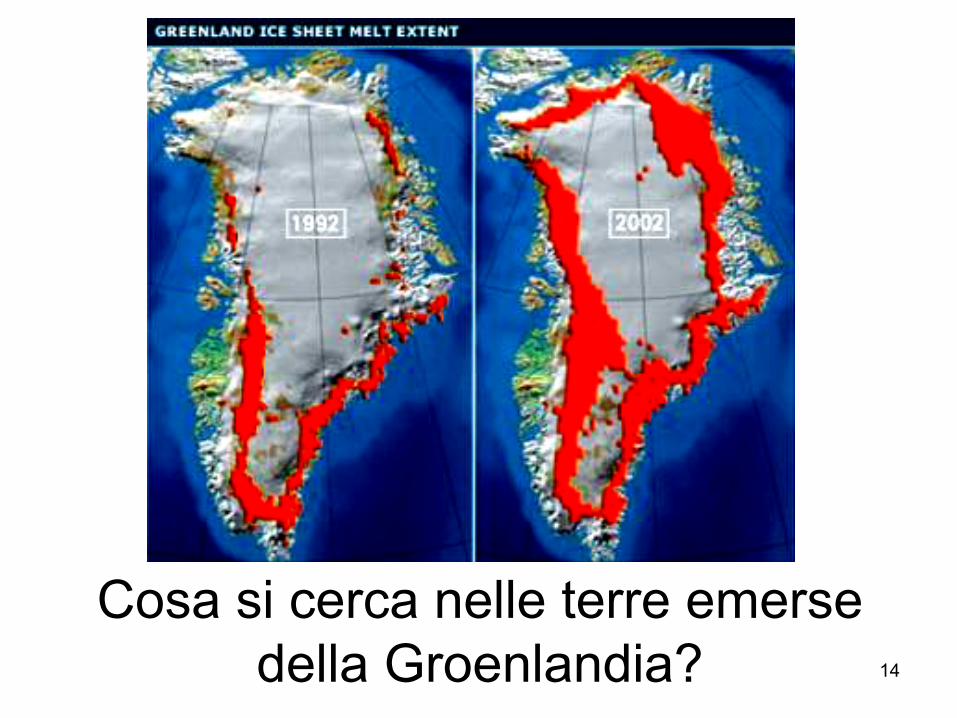
14
Cosa si cerca nelle terre emerse della Groenlandia?

15
Revival: miglioramento della tecnologia e non solo
1. Sicurezza2. Efficienza3. Tempi più rapidi
di costruzione4. Divisioni nel fronte
ambientalista5. Minore ostilità
opinione pubblica6. Crescita dei consumi
globali di elettricità
16
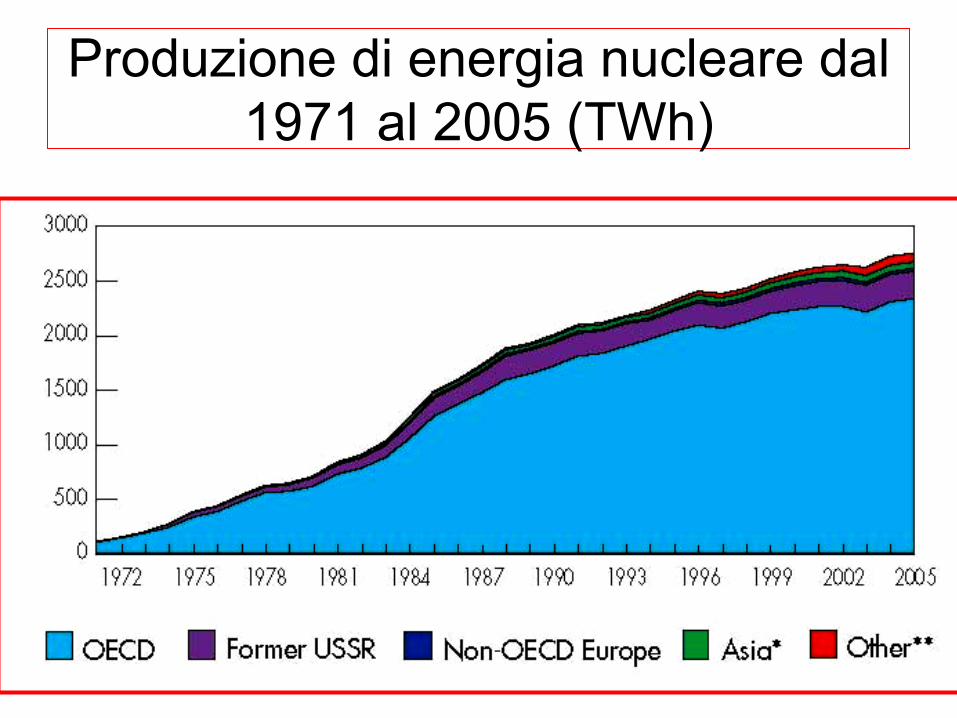
Produzione di energia nucleare dal 1971 al 2005 (TWh)

17
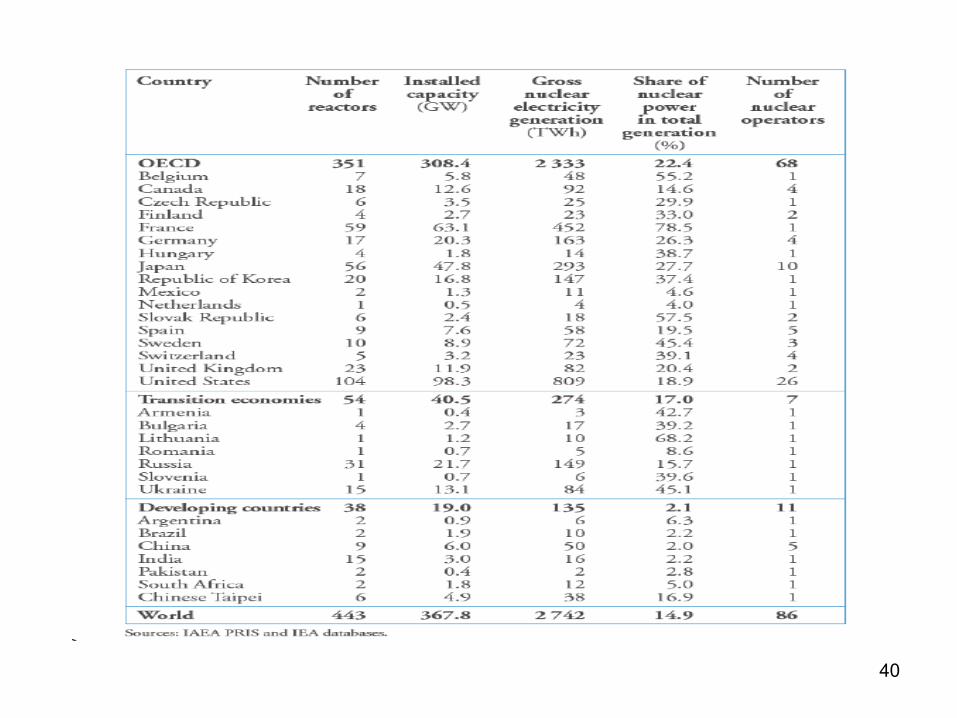
Situazione attuale
• Alla fine del 2006, 435 impianti in funzione in 31 paesi, con una capacità netta di ca. 370 GW(e)
•• ~80% di questa capacità in paesi OECD
(Organizzazione per Cooperazione Economica e lo Sviluppo)
• 6 unità (4 GW) in via di chiusura• Ca. 30 unità (24 GW) in costruzione,, 13 in Asia• Nucleare fornisce il ~15% dell’elettricità globaleSource: International Atomic Energy Agency, “Energy, Electricity and Nuclear Power
Estimates up to 2030,” 2007 edition.(2007)
18
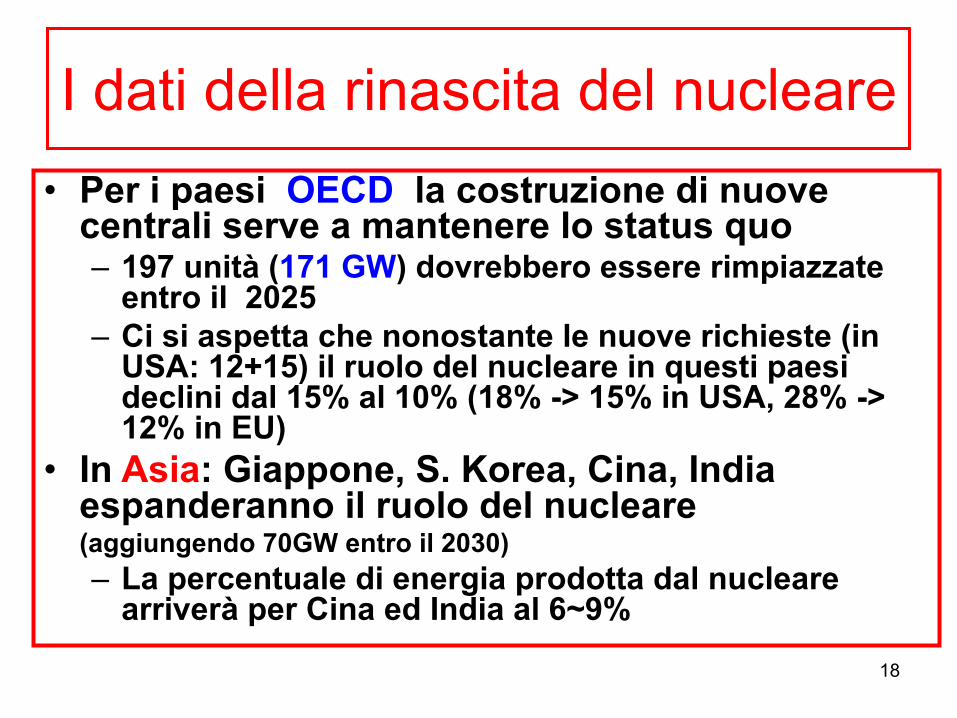
I dati della rinascita del nucleare• Per i paesi OECD la costruzione di nuove
centrali serve a mantenere lo status quo– 197 unità (171 GW) dovrebbero essere rimpiazzate
entro il 2025– Ci si aspetta che nonostante le nuove richieste (in
USA: 12+15) il ruolo del nucleare in questi paesi declini dal 15% al 10% (18% -> 15% in USA, 28% -> 12% in EU)
• In Asia: Giappone, S. Korea, Cina, India espanderanno il ruolo del nucleare (aggiungendo 70GW entro il 2030)– La percentuale di energia prodotta dal nucleare
arriverà per Cina ed India al 6~9%

19
Proiezione al 2030
2030 Estimate (GWe) 2005
(Actual,GWe) Reference
Case
High
Growth
Case
OECD/IEA 368 416 519
IAEA 362 414 679
IEEJ 385 499 568
20
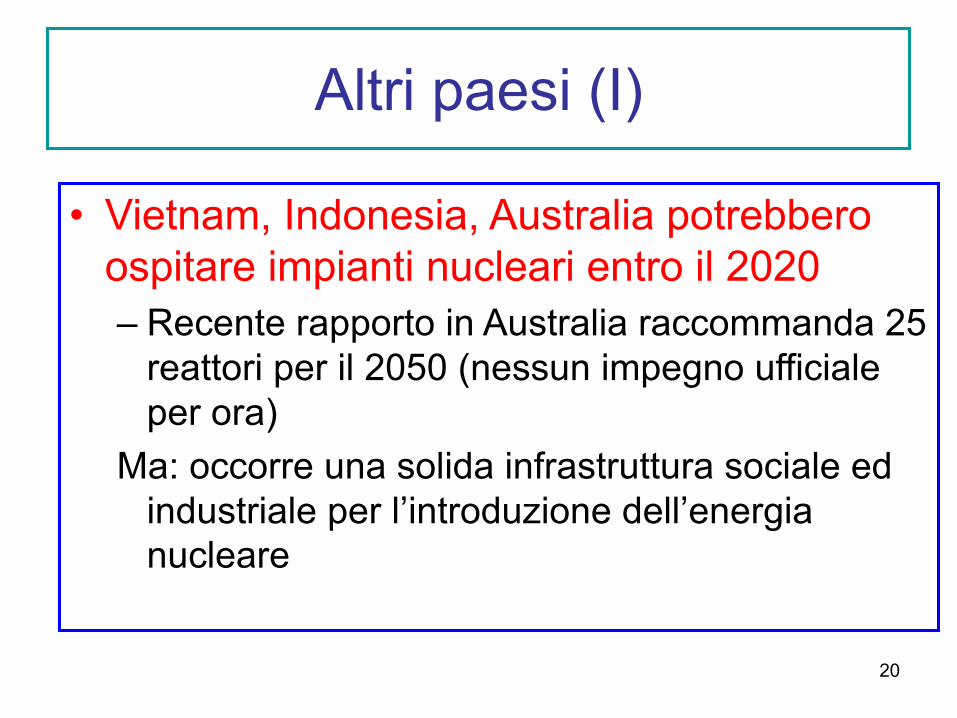
Altri paesi (I)
• Vietnam, Indonesia, Australia potrebbero ospitare impianti nucleari entro il 2020– Recente rapporto in Australia raccommanda 25
reattori per il 2050 (nessun impegno ufficiale per ora)
Ma: occorre una solida infrastruttura sociale ed industriale per l’introduzione dell’energia nucleare
21
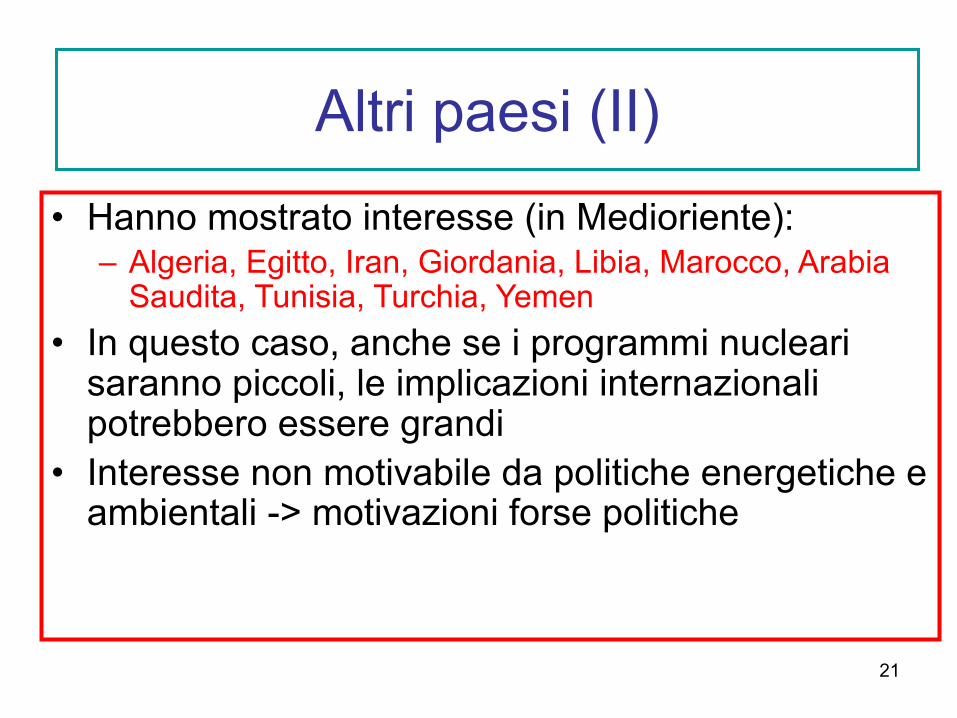
• Hanno mostrato interesse (in Medioriente):– Algeria, Egitto, Iran, Giordania, Libia, Marocco, Arabia
Saudita, Tunisia, Turchia, Yemen• In questo caso, anche se i programmi nucleari
saranno piccoli, le implicazioni internazionali potrebbero essere grandi
• Interesse non motivabile da politiche energetiche e ambientali -> motivazioni forse politiche
Altri paesi (II)
22
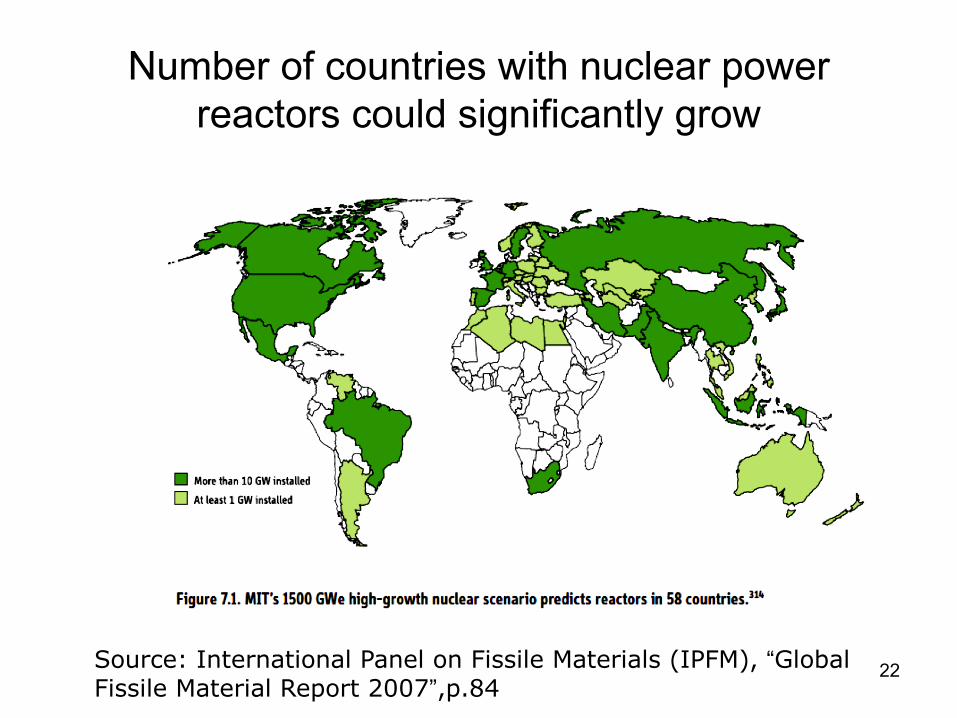
Number of countries with nuclear power reactors could significantly grow
Source: International Panel on Fissile Materials (IPFM), “Global Fissile Material Report 2007”,p.84
23
Rischi
• Proliferazione (Uso militare) • Sia a monte (arricchimento) sia a valle (management
delle scorie) • Ruolo accresciuto della AIEA-Vienna che sovrintende
al rispetto del Trattato di Non Proliferazione Nucleare
24
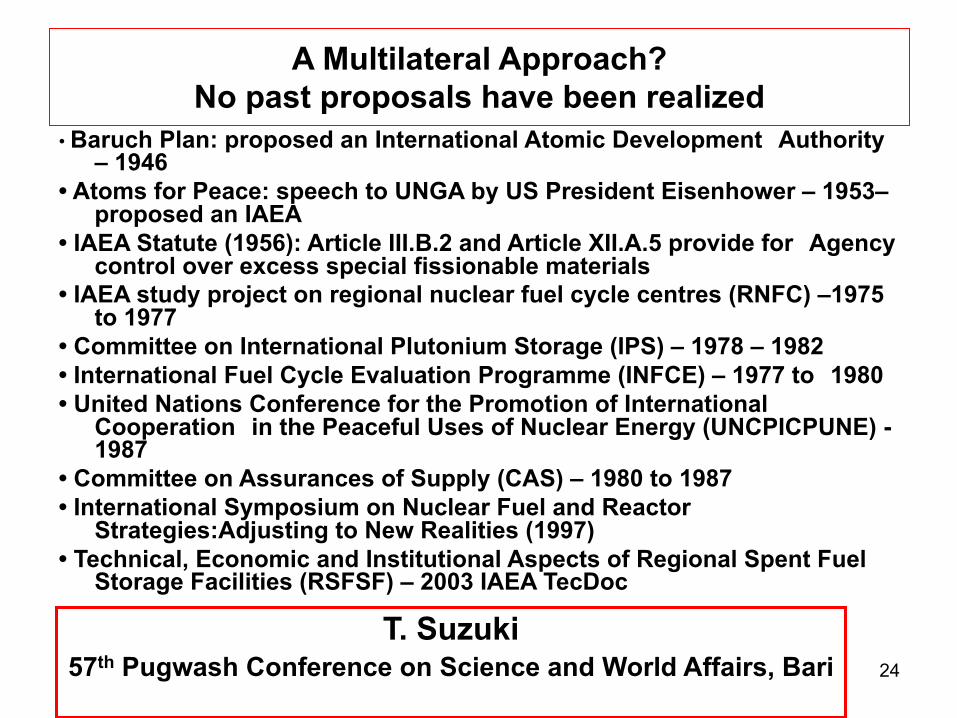
A Multilateral Approach?No past proposals have been realized
• Baruch Plan: proposed an International Atomic Development Authority – 1946
• Atoms for Peace: speech to UNGA by US President Eisenhower – 1953–proposed an IAEA
• IAEA Statute (1956): Article III.B.2 and Article XII.A.5 provide for Agency control over excess special fissionable materials
• IAEA study project on regional nuclear fuel cycle centres (RNFC) –1975 to 1977
• Committee on International Plutonium Storage (IPS) – 1978 – 1982• International Fuel Cycle Evaluation Programme (INFCE) – 1977 to 1980• United Nations Conference for the Promotion of International
Cooperation in the Peaceful Uses of Nuclear Energy (UNCPICPUNE) -1987
• Committee on Assurances of Supply (CAS) – 1980 to 1987• International Symposium on Nuclear Fuel and Reactor
Strategies:Adjusting to New Realities (1997)• Technical, Economic and Institutional Aspects of Regional Spent Fuel
Storage Facilities (RSFSF) – 2003 IAEA TecDoc
T. Suzuki57th Pugwash Conference on Science and World Affairs, Bari
25
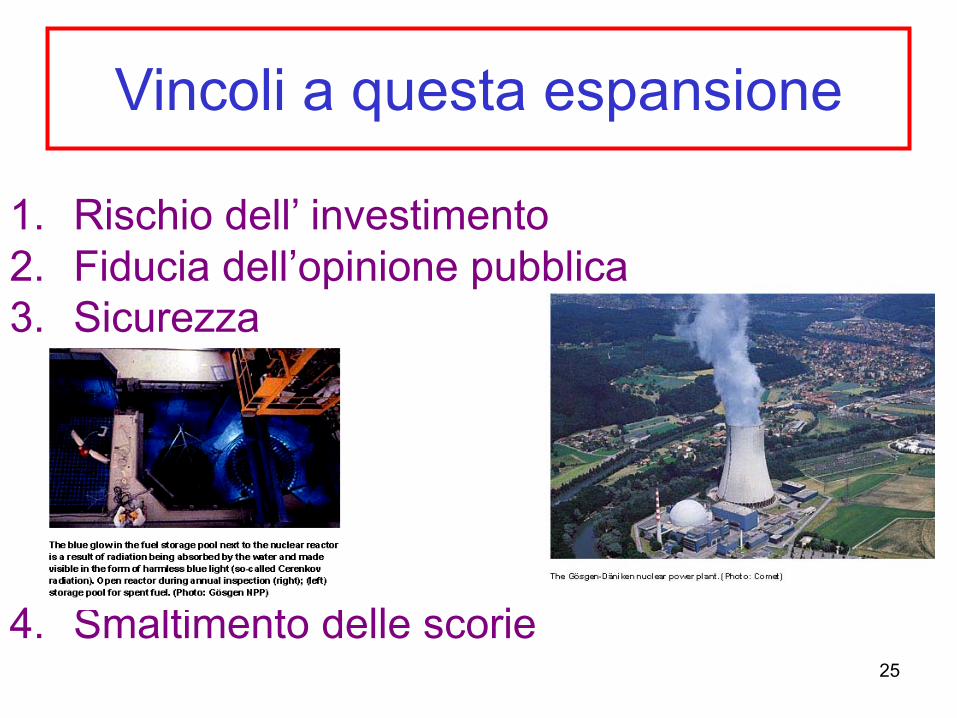
Vincoli a questa espansione
1. Rischio dell’ investimento2. Fiducia dell’opinione pubblica3. Sicurezza
4. Smaltimento delle scorie

26
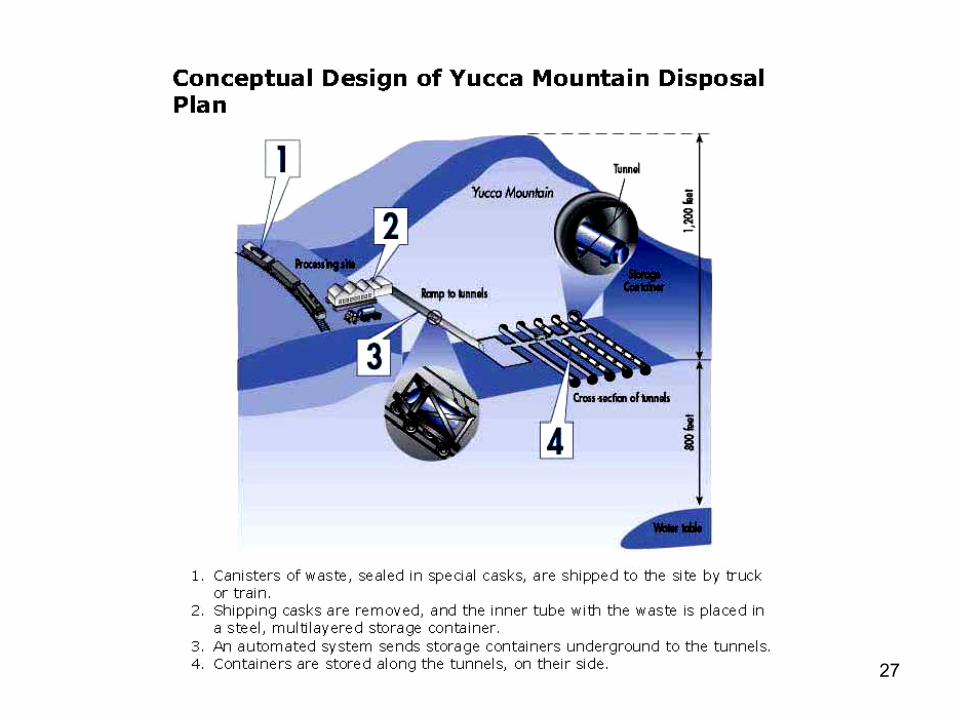
Management delle scorie e del combustibile “spento”
Necessaria capacità di stoccaggio del combustibilespento per evitare il riprocessamento
27

28
Il caso Italia• Gli ostacoli per l’Italia sono difficilmente superabili
per ora: alti costi e rischi d’investimento • Lavorare in un’ottica di integrazione europea e
non di autarchia energetica• Occorre puntare su risparmio e fonti rinnovabili,
in particolare solare/fotovoltaico • Utile rilanciare la ricerca su nucleare e fonti
rinnovabili (in assenza di know how si perdono le occasioni)

29
BACKGROUND SLIDES
30
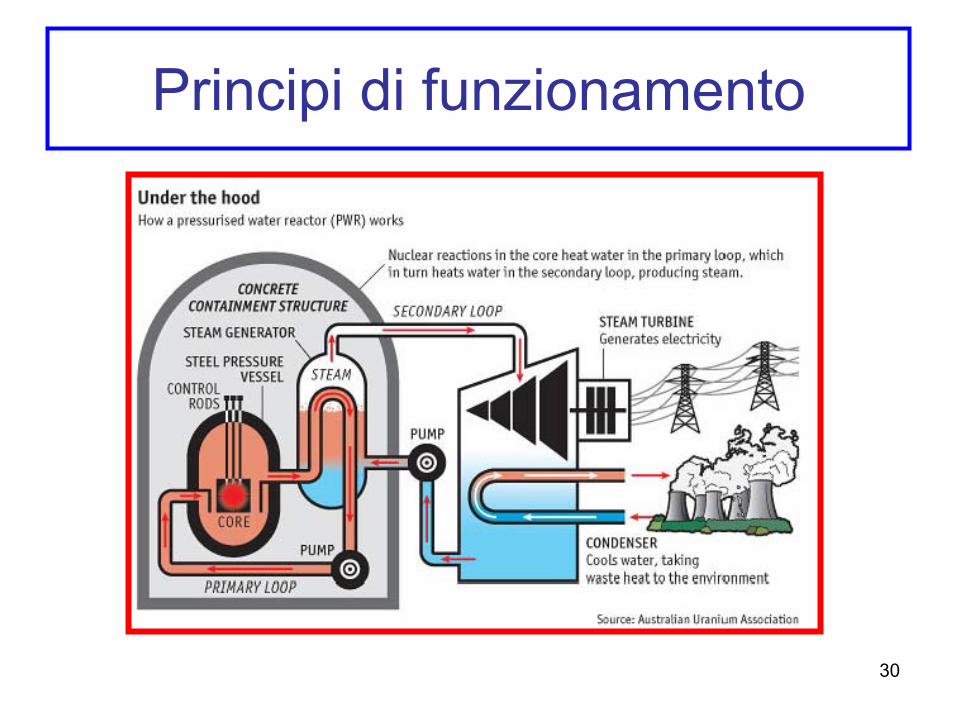
Principi di funzionamento
31
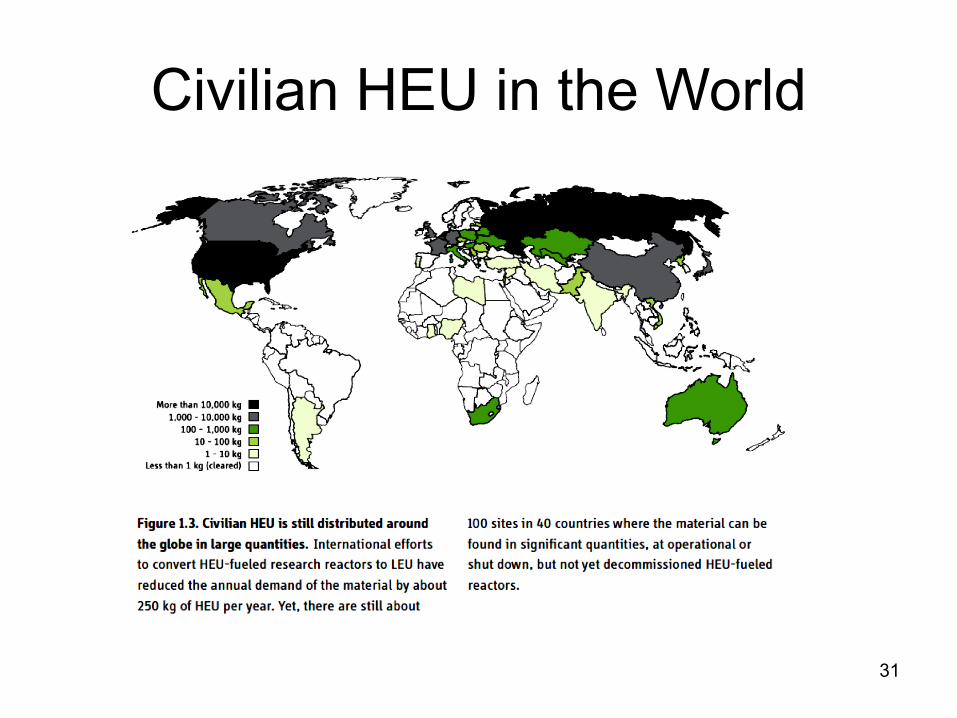
Civilian HEU in the World

32
A monte:Global HEU Stockpile (2006)
Source: IPFM (2007), p.10
33
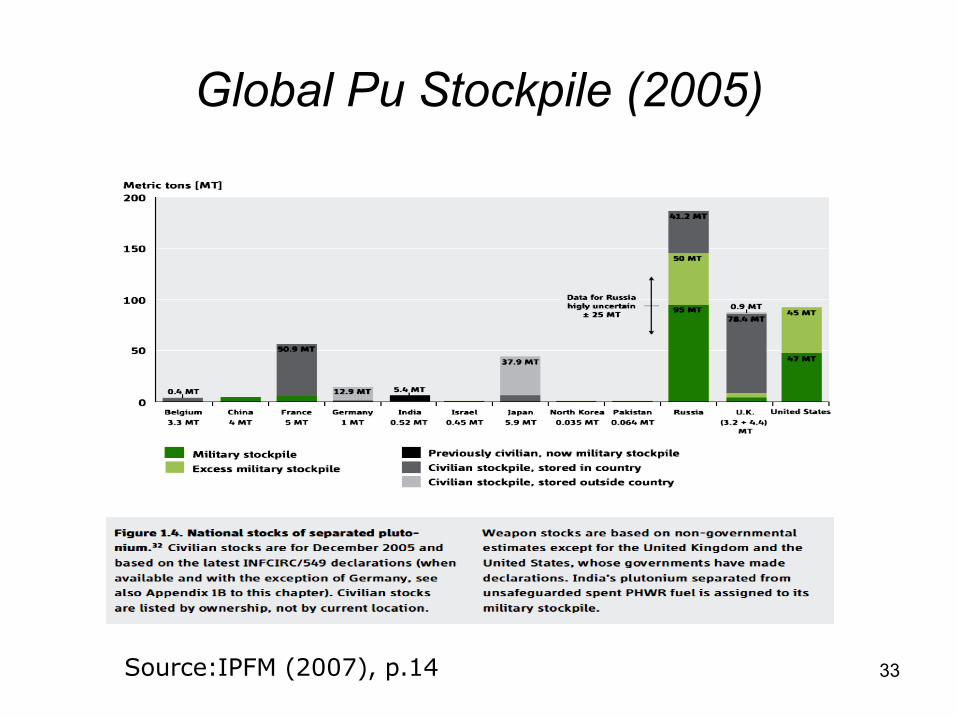
Global Pu Stockpile (2005)
Source:IPFM (2007), p.14

34
Motivazioni ambientali
35
Climate change : the physical science basis (IPCC - WG1 – AR4 – 2007)
• + 20 % CO2 forcing from 1995 to 2005• Warming is unequivocal :
– Global scale : air, ocean, snow and ice meting, sea level rise
– Regional scale : artic T and ice, heavy precipitations, droughts, intensity of tropical cyclones
• Most of the observed warming of the last 50 years is very likely due to the observed increases in GHG

36
Climate change : the physical science basis (IPCC - WG1 – AR4 – 2007) (2)
• Projections of future climate change - Next two decades : + 0,2 °C /decade- 2100 :
high scenario : best estimate 4.0 °C [2,4 – 6,4 °C]low scenario : best estimate 1,8 °C [1,1 -2,9 °C]
- Impacts : sea level rise, sea ice decrease, heat waves, heavy precipitations, intensity of tropical cyclones, changes in precipitation
37
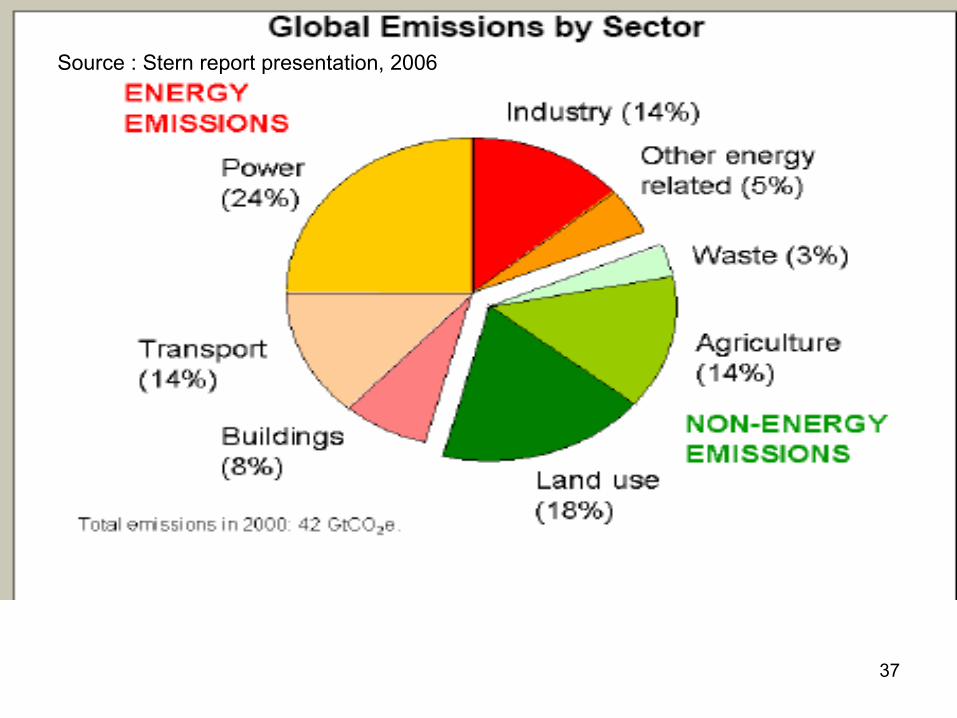
Source : Stern report presentation, 2006

38
IEA scenario Reference scenarioenergy related CO2 emissions

39
• energy system (mainly fossil fuels) is the major contributor
• Industrialised countries are responsible for the main part presently, developing countries in the next decades
• Present situation : – Global GHG emissions have increased by
20% (mainly in developing countries) since 1990 (the Kyoto Protocol reference year),
– with a rise of + 2.9% since 2000 in the countries committed to the Kyoto Protocol,
– and a general uncontrolled increase in the transport sector (+25% between 1990 and 2004 in the rich countries committed to the Kyoto Protocol).
40
41
Nuclear Renaissance and Managing Civilian Nuclear Fuel Cycle: Need for New
Approaches
October 23, Bari, Italy 2007The 57th Pugwash Conference on Science and World
Affairs
Tatsujiro SuzukiVisiting Professor, Univ. of Tokyo, Associate Vice President
Central Research Institute of Electric Power Industry(CRIEPI)[email protected]
42
Renewable energies as a sustainable component of the
solution to climate change
• X Conferenza Internazionale USPID (Unione Scienziati Per Il Disarmo) Castiglionecello ,
• Livorno Settembre 2007
• Venance Journeé• CNRS
43
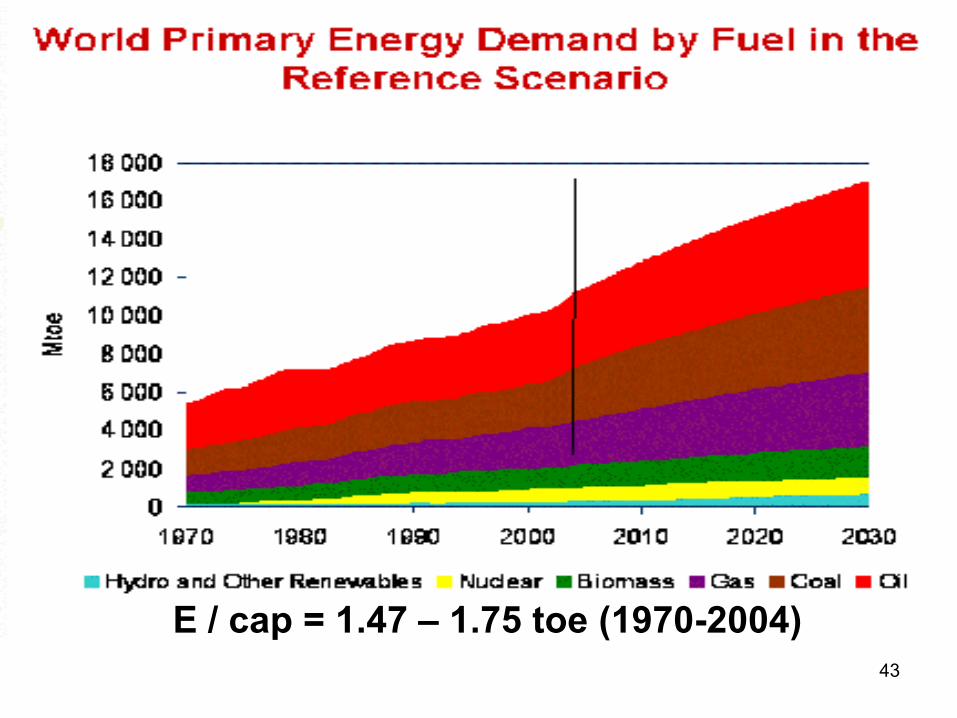
E / cap = 1.47 – 1.75 toe (1970-2004)
44
IEA World alternative policy scenario
• Analyses impacts of new environment and energey-security policies worldwide – OECD policies currently under consideration
• Example of EU policies : – Power generation : RNE directive met and extension to
2020, combined heat and power directive– Transport sector : tightening of coluntary agreements
with car manufacturers, biofuels targets met– Emission trading scheme for power generation and
industry– Non Oecd : same and includes more rapid decline in energy
intensity
45
46
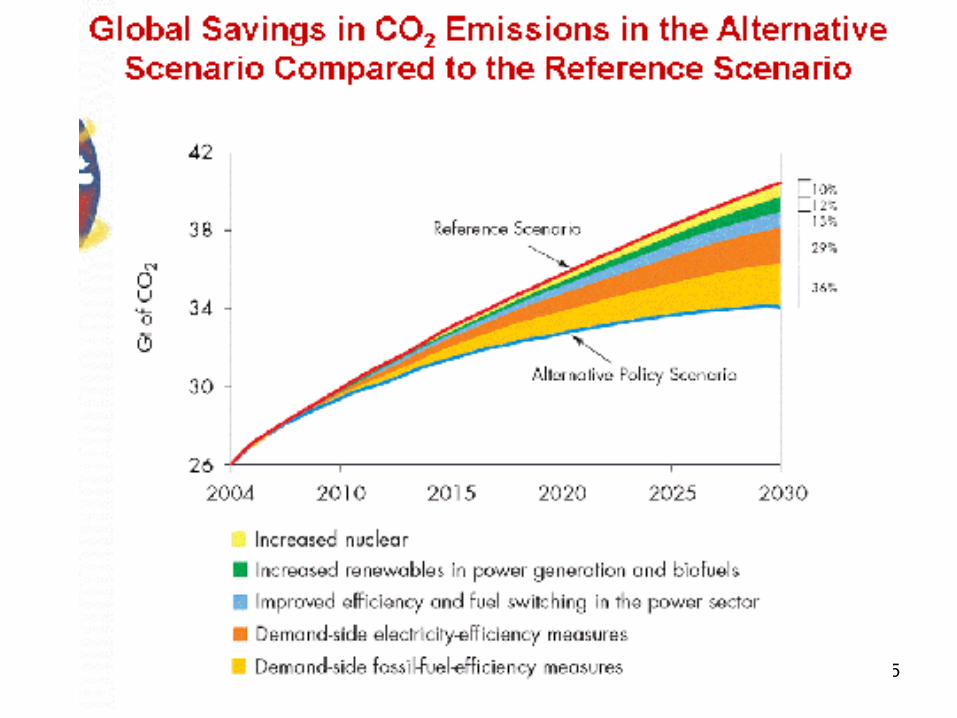
• According to IEA World energy outlook (2005), present policies will lead to an increase of 52 % of global energy related CO2 emissions between 2003 and 2030.
• Which represent 13 GtCO2 over the 2003 level at a growth rate of 1,6 % per annum.
• Alternative Policy Scenario : energy demand is 10 % lower in 2030 compared to 2004. CO2 emissions could be reduced by 16 % in 2030 (emission growth could be reduced by 2) : Share of renewable in the primary energy mix would then rise to 16 % compared to the 14 % in the reference scenario.
• Energy efficiency :most important potential for emission reductions
47
• Energy efficiency – savings is critical• Limit 2°C can be reached with strong and
combined policies : – energy efficiency improvement – non CO2 emitting energies : renewable
energies or nuclear– and cleaner fossil fuels (??)
48
What are RNEs ?
- Photonic energy : from the Sun - Mechanical energies :
* wind energy* hydraulic energy* tide energy* ocean energy
- Thermal energy : * geothermal
- Combustion energy : * biomass (from photosynthesis)
49
The issue of RNEs is complex :
• many different technologies, each technology is unique
• different sources (wind, sun, hydro, biomass)• at different stages of development• different locations• different needs (heat, fuels, electricity) which
may need a specific energy source • data problems.

50
Comparison of RNEs with conventional energies (1)
• RNEs are energy fluxes : not constant over time (sun, wind), needs storage
• RNEs cannot be transported in their original form (most of them, apart from biomass, have to be used where they are produced)
• RNEs belong to everybody• no risk of RNEs resource depletion, but
competing access to resource : ex alimentation/energy, irrigation/electricity, etc
51
Comparison of RNEs with conventional energies (2)
• RNEs regional distributions are not concentrated, every region in the world can have access to some RNEs to meet part of its energy needs.
• smaller production units : this is often considered a disadvantage, but this can be compensated by the possibility of cogeneration (CHP).
• RNEs are also well suited for small off-grid applications, good for remote areas.
• decentralised : distributed energy systems, address the need for energy security, economic prosperity (particularly in poor regions), and environmental protection
52
3 types of technologies (1)
• 1) Well established technologies(hydropower, biomass and geothermal)– Proportion in world energy production is stable, or
declining (biomass in DCs), are used for base load power, permanent
– Geothermal : power generation, space heating or cooling
– large hydro : 16 % of world electricity, scope for expansion is limited in ICs, in DCs considerable potential exists, but limited by social, financial and environmental constraints.

53
3 types of technologies (2)• 2) Second generation RNEs : (wind, solar hot
water, solar photovoltaics and advanced bioenergy) are starting from a much lower base, but are increasing rapidly. Result of RD programs which started in the 70s.
• 3) Third generation : concentrated solar power, ocean energy, advanced geothermal, advanced biomass and biorefinery technologies : still under development, great potentialities.

54
2004 Fuel shares of world total primary energy supply (IEA, 2007)
Due to high share of biomass in total RNEs, Asia, Africa and Asia are main RNEs users
(residential sector, cooking and heating). For hydro or new RNEs, ICs are main users.
55
Current status of RNEs• 13,1 % of 11 059 Mtoe world total primary
energy supply (2004)• More mature technologies : hydropower,
geothermal, and bio-resources have mainly contributed up to now
• New resources (wind) are becoming competitive

56
2004 energy shares in electricity production (IEA, 2007)
57
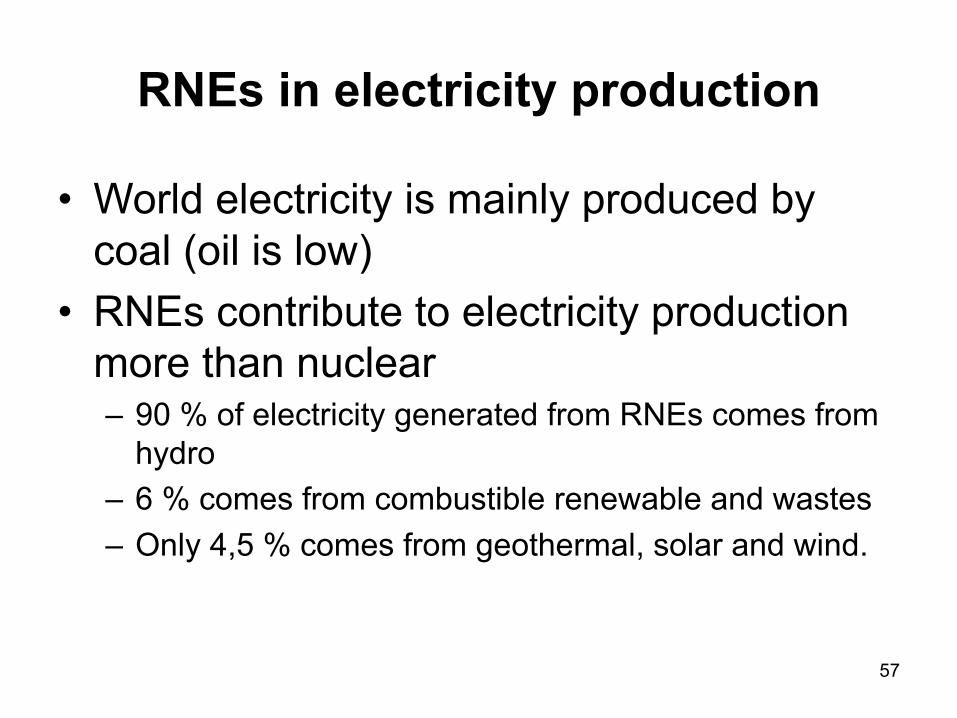
RNEs in electricity production
• World electricity is mainly produced by coal (oil is low)
• RNEs contribute to electricity production more than nuclear– 90 % of electricity generated from RNEs comes from
hydro– 6 % comes from combustible renewable and wastes– Only 4,5 % comes from geothermal, solar and wind.
58
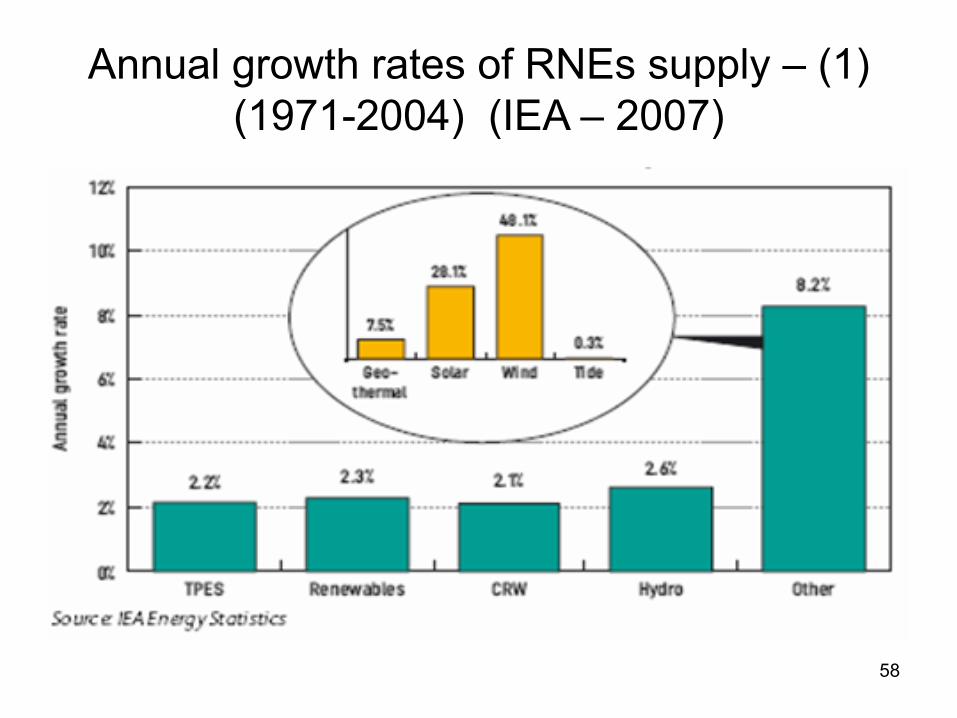
Annual growth rates of RNEs supply – (1) (1971-2004) (IEA – 2007)
59
Annual growth rates of RNEs supply (2)
• Growth rate of RNEs has not exceeded the growth rate of energy demand
• Still small fraction of total energy use• Growth of wind and solar is concentrated in very few
countries– wind : Denmark, Germany, Spain, US– solar photovoltaic: Japan, Germany, US
• Electricity production from solar photovoltaic systems as well as grid connected wind turbines : + about 30 % /y
• A few countries have adopted ambitious targets.
60
Drivers of RNEs increase :
• Resource availability : Space (biomass) and duration (wind)
• Status of conversion technologies• Costs
61
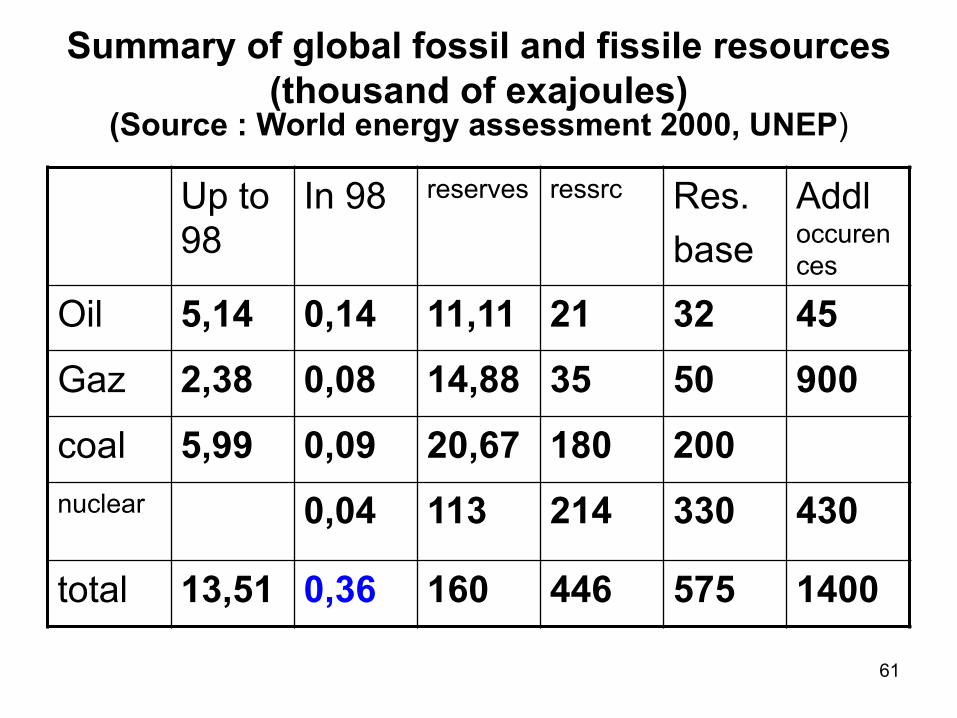
Summary of global fossil and fissile resources (thousand of exajoules)
(Source : World energy assessment 2000, UNEP)
Up to 98
In 98 reserves ressrc Res.base
Addl occurences
Oil 5,14 0,14 11,11 21 32 45Gaz 2,38 0,08 14,88 35 50 900coal 5,99 0,09 20,67 180 200nuclear 0,04 113 214 330 430
total 13,51 0,36 160 446 575 1400
62
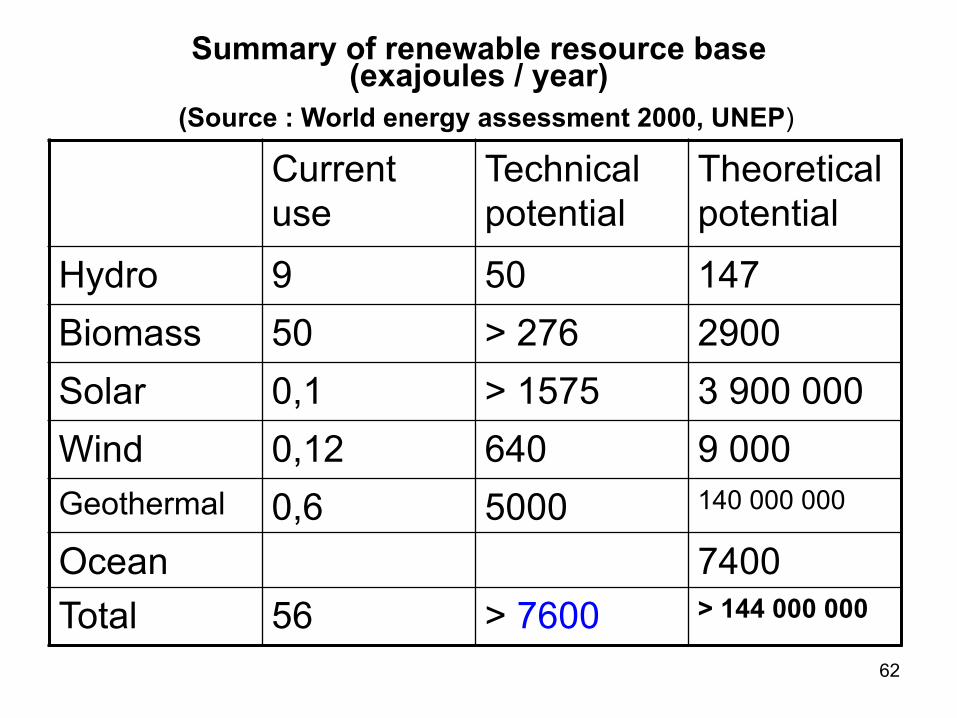
Summary of renewable resource base(exajoules / year)
(Source : World energy assessment 2000, UNEP)
Current use
Technical potential
Theoretical potential
Hydro 9 50 147Biomass 50 > 276 2900Solar 0,1 > 1575 3 900 000Wind 0,12 640 9 000Geothermal 0,6 5000 140 000 000
Ocean 7400Total 56 > 7600 > 144 000 000
63
• RNEs : resources are 3 orders of magnitude larger than current global energy use, although these potentials do not take into account all limitations, for ex. the adequacy of presence of resource and need)
• RNEs use will depend upon conversion technologies and market
64
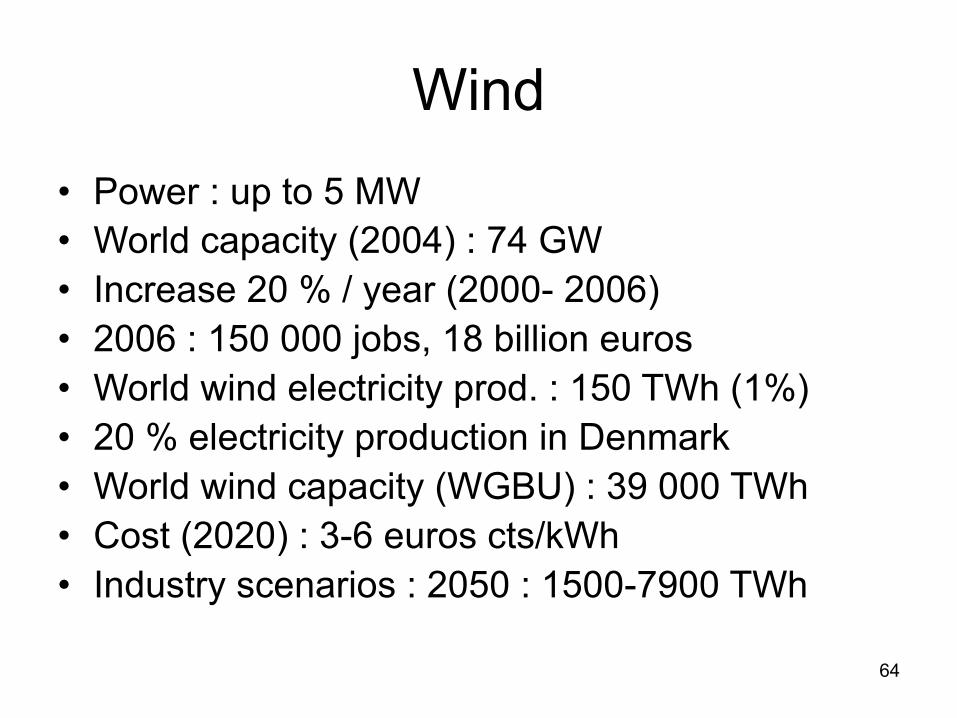
Wind• Power : up to 5 MW • World capacity (2004) : 74 GW• Increase 20 % / year (2000- 2006) • 2006 : 150 000 jobs, 18 billion euros• World wind electricity prod. : 150 TWh (1%)• 20 % electricity production in Denmark• World wind capacity (WGBU) : 39 000 TWh• Cost (2020) : 3-6 euros cts/kWh• Industry scenarios : 2050 : 1500-7900 TWh
65
Biofuels• Ethanol – Biodesel• Feedstocks : grain, vegetable crops – converted into
liquid fuels• Strong government policies and rising price of oil• Can use the existing distribution network• RD priority : more efficient conversion technologies• Could replace significant share of oil : 37 % of US oil in
25 years, 75 % if fuel efficiency was increased. • EU : 20-25 % (sustainability)• Sugar cane alone could replace 10 % of gasoline world
wide• Big potential for production in tropical countries.
66
Biofuels – second generation• Feedstoks : cellulose rich organic materials : wood, tall
grasses, crop residues, • much more abundant, less interference with food
economy, less strain on land and water resources• Need advanced conversion processes• Could reach 1000 EJ in 2050
67
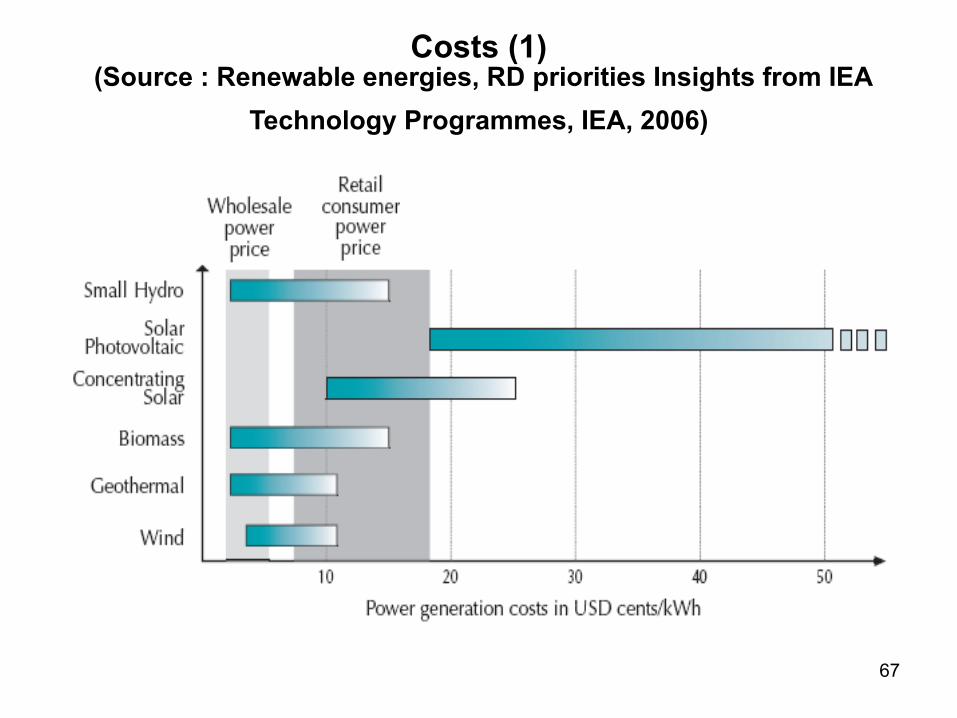
Costs (1)(Source : Renewable energies, RD priorities Insights from IEA
Technology Programmes, IEA, 2006)

68
Costs (2)• Main problem to advancing RNEs is said to be cost • Except for large hydropower and combustible
renewable and waste plants, the average costs of renewable electricity are not competitive with wholesale electricity prices
• However, depending on the technology, application and sites, costs are competitive with grid electricity or commercial heat production.
• Under best conditions, optimised system design, location and resource availability, electricity from biomass, small hydro, wind and geothermal can produce electricity at costs 0,002 - 0,05 US$/kWh
69
Costs (3) Energy market distorsions impede the
development of RNEs
• Price structure does not reflect the full cost of producing energy to society : external costs are not taken into account (impact on health, local and global environmental damage)
• The competitive position of RNEs would improve substantially if a market price were attached to CO2 and other gas emissions.
• The added values of RNEs for diversification, reduced portfolio risks, job creation, industrial competitiveness not accounted for

70
Costs (4)• Conventional energies are heavily subsidised in
many countries. • World Bank has estimated that annual fossil
subsidies in the OECD and 20 largest countries outside the OECD amount to US$ 58 billion
• The UNDP 2000 WEA estimates that global subsidies to fossil fuels and nuclear energy in mid 1990s reached around US$ 250-300 billion annually
• Difficulty of getting the numbers • Many indirect or cross sectors subsidies.
71
Learning curves (1)• Provide means for assessing potential future
cost reductions• Defines the unit cost of a given technology as a
function of the total installed capacity : cost of electricity generated through RNEs sources are a function of the cumulative installed capacity
• Progress ratio X : the price is reduced to x % of the previous price after a doubling of its cumulative sales.
• Industry costs declines 10-20 % for each cumulative doubling of solar photovoltaic, wind generators, …
72
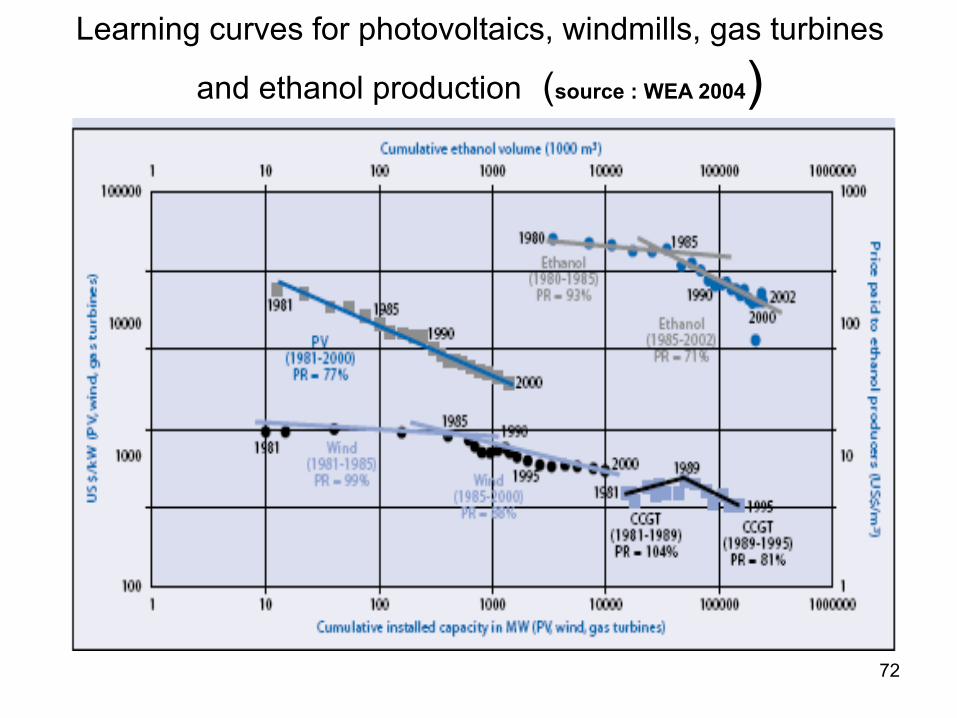
Learning curves for photovoltaics, windmills, gas turbines
and ethanol production (source : WEA 2004)
73
Learning curves (2)• Many RNEs technologies have matured during the last
decades, and achieved major costs reductions, attracting large industrial companies and financial institutions.
• Geothermal heat and electricity production, small hydropower, low temperature solar heat production, biomass, and solar electricity in remote areas.
• Biomass can be economically produced with minimal or even positive environmental impact through perennial crops.
• Solar thermal heat and hot water are competitive in some countries.
• Wind power in coastal and other windy regions in the short term (Denmark)
74
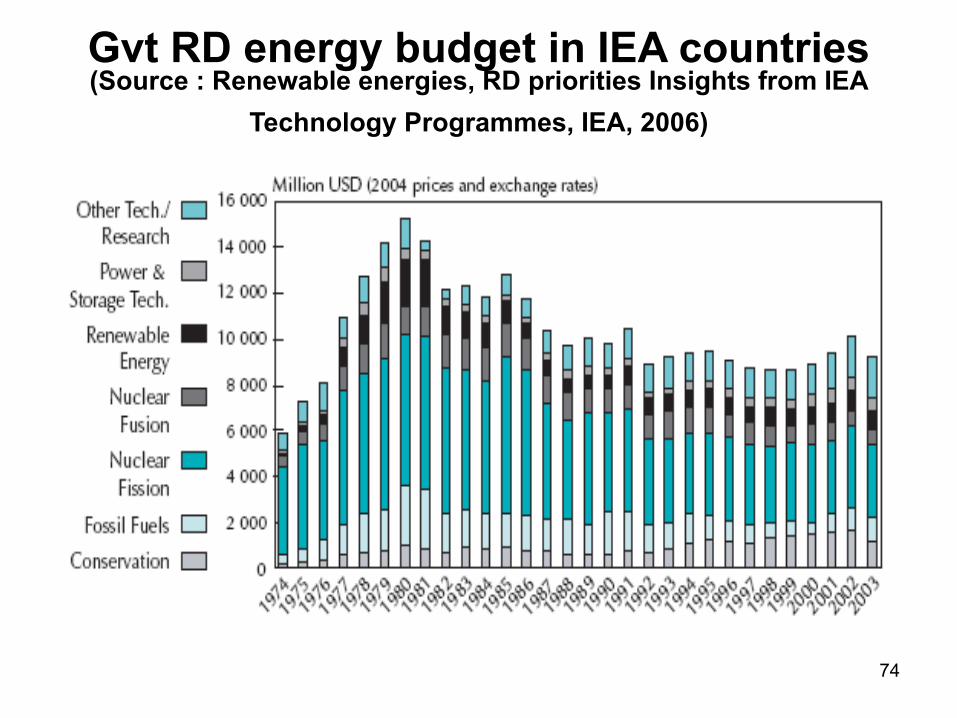
Gvt RD energy budget in IEA countries (Source : Renewable energies, RD priorities Insights from IEA
Technology Programmes, IEA, 2006)
75
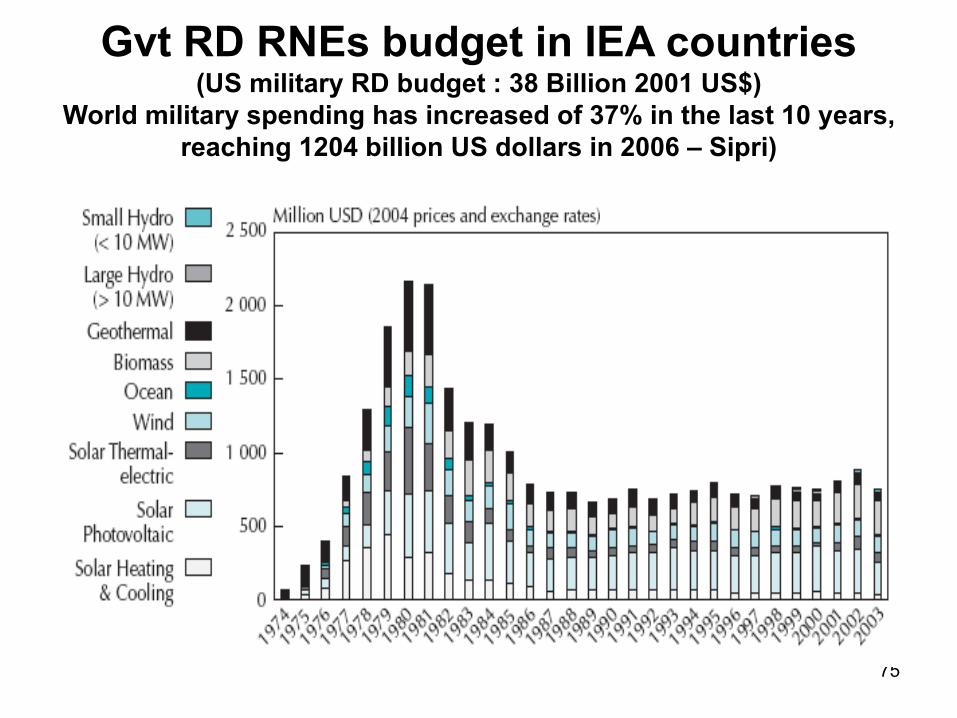
Gvt RD RNEs budget in IEA countries(US military RD budget : 38 Billion 2001 US$)
World military spending has increased of 37% in the last 10 years, reaching 1204 billion US dollars in 2006 – Sipri)
76
RD budgets (in IEA countries) (1)• RNEs RD budget increased sharply after the oil shocks
and decreased substantially after the counter oil shock• RNEs technologies are 7,7% of total government energy
RD funding from 1987 to 2002.• “The sharp decrease of public funding for RNEs RD
funding is inconsistent with presumed political intentions in many IEA countries to increase the share of RNEs in TPES” (IEA, 2004)
• RNEs RD spending in the private sector is not public domain, then difficult to assess the impact of private spending on RNEs markets (private sector invests mainly in large hydro)
77
RD budgets (in IEA countries) (2)
• Limited resources are allocated to address the problem of reliability.
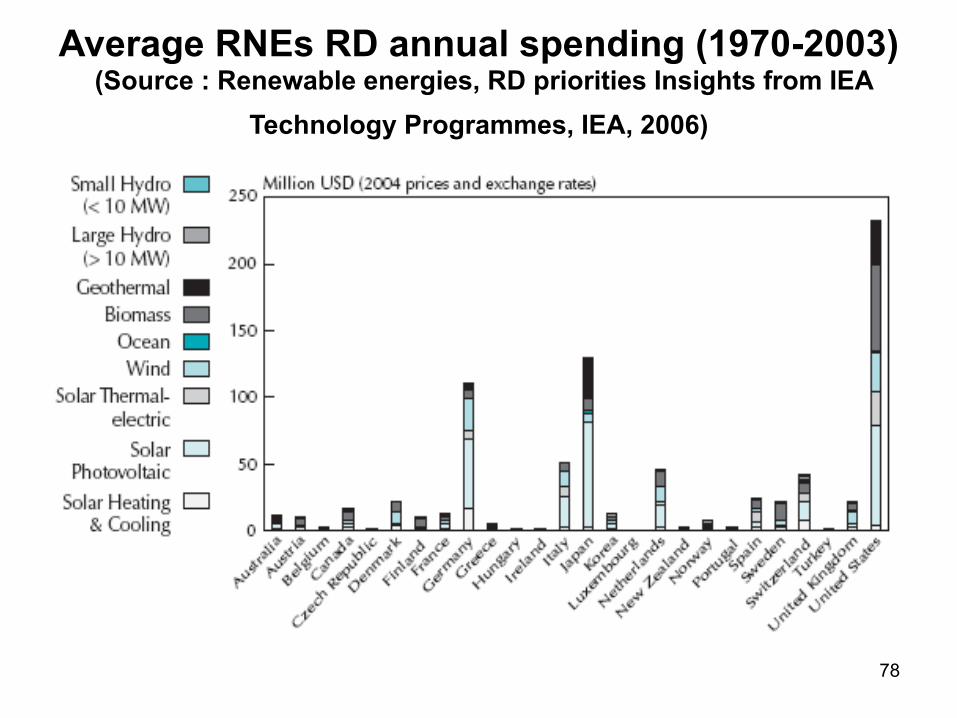
• Only a handfull of countries have invested in RNEs and have achieved substantial cost reductions as a result of their market experience, indicating the success of government intervention
• Germany, Japan and US account for 70 % of RD budget in IEA countries
78
Average RNEs RD annual spending (1970-2003)(Source : Renewable energies, RD priorities Insights from IEA
Technology Programmes, IEA, 2006)
79
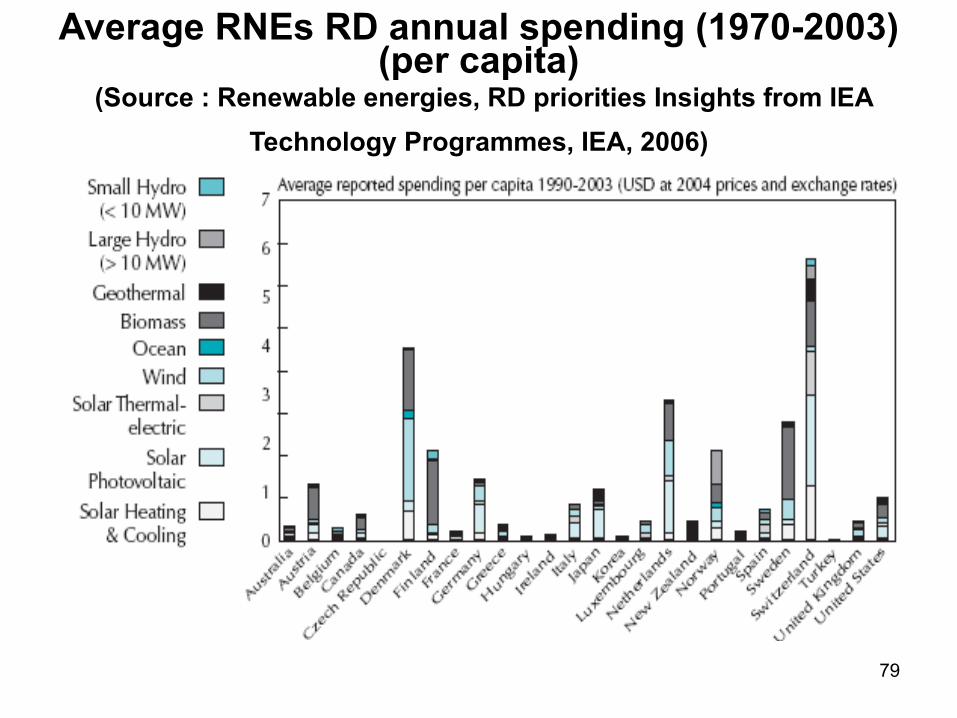
Average RNEs RD annual spending (1970-2003)(per capita)
(Source : Renewable energies, RD priorities Insights from IEA Technology Programmes, IEA, 2006)
80
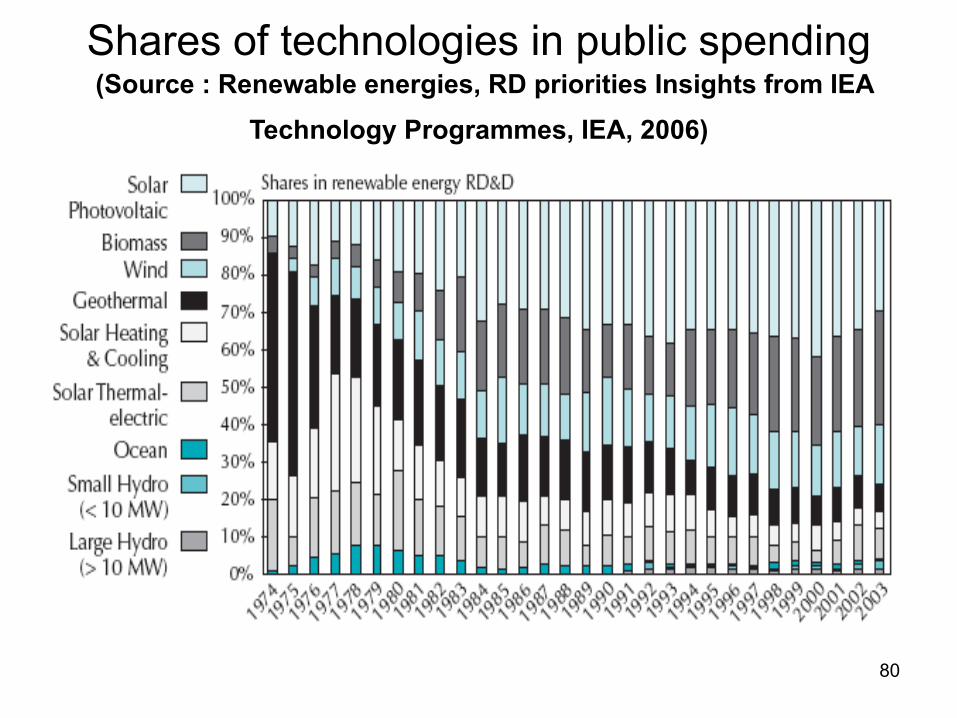
Shares of technologies in public spending(Source : Renewable energies, RD priorities Insights from IEA
Technology Programmes, IEA, 2006)

81
• 86 % of installed wind capacity in only 4 IEA countries
• 84 % of installed capacity of Photovoltaic in only 3 countries
• All are leaders in RD&D spending

82
RNEs have a great potential for
• 1) improved energy security : abundant supplies, diverse and indigenous, no resource exhaustion constraints
• 2) greatly reduced GHG emissions when used in place of fossil fuels.
• 3) diversity of energy supply : improved options to meet specific needs
• 4) address problems of economic development, use in rural areas, employment opportunities, in industrialised as well as in developing countries.
• 5) address problems of local environmental pollution
83
Rapid expansion of RNEs will require
• Greatly enhanced RD budgets• Decrease of the relative costs of RNEs in their early
stages of development and commercialisation.
• Actions to stimulate the markets• Tax credits, and “green incentives”• Take into account full costs of conventional energies
• Realistic but ambitious targets