Embed Size (px)
Citation preview

Life Tables for Sri Lanka and Districts,
2000 - 2002
H.R. GunasekeraDepartment of Census and Statistics
Life Tables for Sri Lanka and Districts,
2000 - 2002

Preface
Life table is an important analytical tool in understanding the mortality situation of a
population. It answers many questions that cannot answer with simple measures of rates
and ratios. Implications from life table measures have immense practical importance in
many disciplines such as health, education, insurance and acturial sciences.
This report presents life tables for Sri Lanka as well as for the districts with some analysis.
Data needed for computations are drawn from the last Census of Population and Housing
conducted in 2001 and the registered births and deaths for the period 2000 to 2002. But
due to non availability of realistic bench mark data on age distribution for each district in
Northern Province, life tables have produced for Northern Province as a whole and not by
its districts.
This study was planned and the report has been prepared by Mr. H.R. Gunasekera, Director
of the Department of Census and Statistics.
I earnestly hope that the information presented in this report on life tables for Sri Lanka and
its districts would promote active efforts in improving the understanding of the mortality
situation of Sri Lanka.
D.B.P.S. Vidyaratne Director General
Department of Census and Statistics
15/12, Maitland Crescent,
Colombo 07.
25 August 2008

Acknowledgement
The contribution made by the following officers of the Census Division of the Department of
Census and Statistics are acknowledged with deep gratitude.
- Mr. V.T. Anuruddha, Statistical Assistant for carrying out computations and
producing computer graphics.
- Mrs. K.D.L. Nilanthi, Data entry Operator/ Coding Clerk for word processing the
report.

Contents Page Preface Acknowledgement Abstract 1
1. Introduction 3
2. Data Sources and Limitations 4
3. Methodology
3.1 Age‐Sex Distribution 6
3.2 Age Specific Death Rates and Probabilities of Dying 7
3.2.1 Estimation of Separation Factors 8
3.3 Smoothing of Age‐Specific Probabilities of Dying and Construction
of Life Tables 9
4. Some Analysis of Life Tables
4.1 Level and Trends in Life Expectancy at Birth 10
4.2 Comparisons of Life Expectancy at Birth with Other Countries 12
4.3 Life Expectancy at Older Ages 15
4.4 Projected Life Expectancies at Birth 16
4.5 Variation of Life Expectancy at Birth by Districts 17
5. Life Tables for Sri Lanka and Districts
Table 7 : Complete life tables for Sri Lanka, 2000‐2002 24
Table 8 : Abridged life tables for Sri Lanka, 2000‐2002 25
Table 9 : Life tables for districts, 2000‐2002 26
References 47
Appendices
A. Figure A : Observed and fitted nqx by age and sex‐Sri Lanka and
districts, 2000‐2002 49
B. Table A : Distribution of population and deaths by age and sex‐
Sri Lanka and districts 70
C. Table A : U.N. Age‐sex accuracy index of age reporting by district,
1981 and 2001 81

Tables, Charts and Maps Table Page
1. Life expectancy at birth, Sri Lanka by sex, 1921‐2001 10
2. Life expectancy at birth by region, 2000‐2005 12
3. Life expectancy at birth by country 14
4. Life expectancy at age 60 years by sex, 1921‐2001 15
5. Projected life expectancy at birth, 2006‐2026 16
6. Life expectancy at birth by district and sex, 1980‐1982 and 2000‐2002 17
Figure
1. Life expectancy at birth, Sri Lanka by sex, 1921‐2001 11
2. Life expectancy at birth by region, 2000‐2005 13
3. Life expectancy at birth by selected Asian countries 13
4. Female advantage in life expectancy at birth, 2000‐2005 15
5A. Change in life expectancy at birth for females by district,
1980‐1982 to 2000‐2002 20
5B. Change in life expectancy at birth for males by district,
1980‐1982 to 2000‐2002 20
Map
1. Life expectancy at birth by districts, 2000‐2002 18

Abstract
This report presents complete and abridged life tables for Sri Lanka for the period 2000‐
2002. This period is selected since it centers the year of the last Population Census
conducted in 2001. It also gives abridged life tables for districts. But due to the non
availability of realistic age distribution for each district in Northern Province, life tables have
computed for the Northern Province as a whole and not by its districts. Calculation of life
table was done using the software package Mortpak‐lite developed by United Nations.
Life expectancy at birth for Sri Lanka which is interpreted as the average length of life of a
person is 68.8 years for males and 77.2 years for females. These figures exceed substantially
with corresponding figures for less developed countries as well as for South‐Central Asia
region. The levels more resemble with that of Europe rather than Asia. The female
advantage in life expectancy at birth for Sri Lanka is 8.4 years which is unusually high for a
developing country. Precise explanations of this significant gender difference need further
research because of the apparent complex interplay of biological, social, behavioural and
health conditions. The life expectancy at age 60 years has risen over time and a female aged
60 in 2001 is expected to live further 22 years. However the pace of increase is low for
males. Higher level of survival chances at old ages coupled with the fertility declines will
result increasing population of the elderly, commonly known as population ageing. It is
expected that the level of life expectancy at birth will reach 71.1 years for males and 80.8
years for females in 2016.
Examination of district variation reveals that the life expectancy at birth is highest for
Hambantota district followed by Moneragala district. This is true for both males and
females. Interestingly, these two districts are considered as more remote and less urbanized
areas in Sri Lanka. One salient feature in the district pattern of mortality is the very low
value of male life expectancy for Northern Province (59.9 years). This could most probably
due to the deaths occur as a result of civil war prevailing in Northern Province. Colombo
district too records low level of life expectancy at birth for both males and females. This is
mainly due to the higher occurrence of deaths in Colombo as a result of the presence of
strong network of hospitals and health facilities run by both government and private
sectors.

3
1. Introduction
Life table is simply an elegant and convenient way of analysing age‐specific death
rates. The technique is now used in several other areas, where it is often called
“survival analysis”. Life tables answer many questions that can not answer with
simple measures of rates and ratios. For example it provides solution to questions
like “Out of 1000 persons who were 40 years old in 2001, how many are likely to live
to age 70?” or “Immediately after birth in 2001, how many years could a child expect
to live” or “Among young men and women entering the labour force at ages 20‐24,
what proportion can be expected to be alive at age 60 (time of retirement)?” Of
those who do begin to collect pension at age 60 how many can be expected to
survive for 10 more years? Questions of this nature have immense practical
importance in many disciplines, such as education, health, insurance and actuarial
science. Life tables provide summary measures of the level of mortality independent
of the age composition which can therefore be used for comparing the mortality
levels of different populations.
Sri Lanka has a long history in preparing life tables. The first one was published in
1888. Life tables have been usually prepared for Census years since 1901, taking 3
year periods around each of the Census years. The exceptions were 1931 and 1953.
The last published official life table for Sri Lanka is for the period 1980 ‐1982.
This report presents the abridged and complete life tables for Sri Lanka as well as
abridged life tables for the districts. It is organized into several sections following this
introduction. Section 2 describes the data sources of the construction of the life
tables with limitations and section 3 explains the methodology. Some analysis of life
tables and district patterns of mortality are discussed in section 4. Section 5 presents
the life tables for Sri Lanka and for the districts.

4
2. Data Sources and Limitations
The basic inputs for construction of life tables are age‐specific mortality rates. The
data required to obtain such rates are,
i) the distribution of population by age and sex
ii) the distribution of deaths by age and sex
for Sri Lanka and for each of the districts.
The age‐sex distribution is obtained from the Census of Population and Housing
2001. The deaths registered by age and sex are taken from the Civil Registration
System for a three year period, rather than a single year, in order to eliminate
irregularities and annual fluctuations. The period 2000‐2002 is selected since it
centres the year of the last population Census, 2001.
Obviously, the accuracy of the age‐specific mortality rates is affected by the
accuracy of the age‐sex distribution of population and deaths. Errors in age‐sex
distribution of population can arise due to coverage and content errors. As the
Census 2001 could not be conducted island wide, age‐sex distribution for Sri Lanka
and certain regions/districts needs to be estimated. The procedure is outlined in
section 3.1 below.
A common form of content error is the misreporting of age‐sex data. The quality of
such data has been found to be very high. Compared to some of the countries in
SAARC region as well as some other developing Asian countries, Sri Lanka records
the highest accurate age‐sex data (Gunasekera, 2005). Most of the districts show
high accuracies in age sex data. However 6 districts viz. Hambantota, Ampara,
Moneragala, Polonnaruwa, Puttalam and Matale should receive additional measures
to achieve greater accuracy in future. U.N. Age‐sex accuracy index for districts are
shown in Table A in Appendix C.
Unfortunately no recent reliable evidence is available to assess the completeness of
deaths registration in Sri Lanka. However, a survey carried out in 1982 reported that

5
the completeness of the death registration in the country is 94 percent.
(Department of Census and Statistics, 1984)
3. Methodology
Life tables can be classified in two ways according to the length of the age interval in
which data are presented. A complete life table contains data for every single year of
age. An abridged life table, on the other hand, typically contains data by 5‐year age
intervals. In this study both abridged and complete life tables are constructed, but
the latter is limited to Sri Lanka only.
The basic input to the construction of the life table is the set of age specific mortality
rates from which all other columns are derived. The notation used here for different
columns of the life table is given below.
x : exact age
(x, x + n) : age group with initial age x with the length of interval n
nmx : age‐specific death rate for age interval (x, x + n)
nqx : probability of an individual age x dying before the end of the age
interval (x, x + n)
lx : number of survivors at age x in a life table with radix (starting
population) of 100,000 persons
ndx : number of deaths in age interval ( x, x + n)
nLx : number of person‐years lived in age interval (x, x + n)
nSx : the proportion of the life table population in age group (x, x + n) who are
alive n years later.
Tx : number of person‐years lived at ages x and older.
ex : expectation of life at age x
nax : average number of years lived in the age interval (x, x + n) by those
dying during that age interval

6
age‐specific death rates are defined as;
nmx =
Two commonly used software packages available for computation of life tables are
PAS, and Mortpak‐Lite developed by U.S. Census Bureau and United Nations
respectively. Considering the efficiency of smoothing procedures and the wide
usage, Mortpak‐Lite is selected to construct the life tables.
3.1 Age‐Sex Distribution
Census of Population 2001 was able to carry out successfully in 18 districts of Sri
Lanka; among the districts in North and East only Ampara in Eastern province was
covered completely. Substantial proportion of the rest of the two districts in Eastern
province i.e. Trincomalee and Batticaloa, have been enumerated. On the other hand,
out of the five districts in Northern province, Jaffna, Mullaitivu and Killinochchi could
not be enumerated at all. Hence the age distribution for the districts in Northern and
Eastern province, invariably, have to be estimated using simple demographic
techniques. Due to the severity of coverage of the districts in Northern province, it is
decided to estimate age distribution only for the Northern province as a whole and
not by districts.
Calculation of age distribution for Northern province is done as follows.
(a) Using the population estimates for Northern districts from Registrar Generals
Department, total for the province is obtained.
(b) Enumerated population in Northern province is tabulated by age and sex;
total population is distributed by age groups using the estimated age
composition.
number of deaths in the age group ( x, x + n)
population of the age group at mid period

7
(c) Overall sex ratio obtained from step (b) is used to estimate the total males
and females; age distribution for each sex is obtained by decomposing the
total figure by age specific sex ratios.
Same procedure is applied to estimate the age distribution by sex for Batticaloa and
Trincomalee districts in Eastern province. These estimated age distributions are
added to the corresponding values of the 18 districts to obtain the total age
distribution for Sri Lanka, as at Census date i.e. 17 July 2001.
The age distribution at mid 2001 is estimated in two stages. Firstly, the total
population enumerated at the Census taken on 17 July 2001 is brought back to mid
year by applying the growth rate for that year. Then, assuming the age composition
remains unchanged during that 17 day period (i.e. 1 July –17 July), mid year age
distribution is derived by distributing the total population according to the
proportions by age groups obtained from the Census. Age distribution by sex is
derived using the sex ratios. This procedure is applied to obtain mid year age
distribution for Sri Lanka as well as for districts.
3.2 Age Specific Death Rates and Probabilities of Dying
The age specific death rates are obtained by dividing the average number of deaths
for the 3 year period 2000‐2002 by the population corresponding to each age group
as at mid 2001.
Probabilities of dying (nqx) is calculated from age specific death rates (nmx) using the
following formula.
nqx =
For derivation of the formula see C.L. Chiang(1968).
nax values defined as the average number of years lived in the age interval (x, x+n) by
those dying during that age interval are usually referred as separation factors.
n. nmx
1+(n‐nax)nmx with the notation given under section 3.

8
Generally, the separation factors for ages 5 years and over are approximately half of
the age interval. Separation factors for ages under 1 year and from 1 to 4 years are
smaller than half of the age interval. This is due to the fact that mortality is high
during the first year of life and declines rapidly up to the fifth year. Hence, the
number of deaths is greater at the beginning of the age intervals (0‐1) and (1‐4) than
at the end, and the time lived by those dying during an age interval is less than half
of the age interval.
3.2.1 Estimation of Separation Factors
Separation factors for ages under 1 year and 1‐4 years can be estimated by making
use of detailed information on deceased infants/children. Infant deaths should be
obtained by single days of age during the first week of life, by weeks of age during
the first month of life and by months thereafter. On the other hand child deaths
need to be available only by years. Separation factors, then, are a weighted average
of the fraction of the year lived by those dying, weighted by number of
infants/children dying at each age.
So,
1a0 =
where Di ‐ the number of infants dying within age i
ti ‐ time lived from birth until the infant dies, expressed as a fraction of
a year
D ‐ total number of infant deaths during the first year of life
Similarly
4a1 =
The description for Di , ti and D are the same as for 1a0 except the term infants is
replaced by children. The separation factors for other age groups (5 and above) are
obtained from the Mortpak‐Lite package.
Σ Diti
D
1,........6 days i = 1,2,3 weeks
1,.......11 months
Σ Diti
D i = 1,....4 years

9
3.3 Smoothing of Age‐Specific Probabilities of Dying and Construction of Life
Tables
Age‐specific mortality rates of males and females for Sri Lanka and districts have
been converted to age‐specific probabilities of dying using LIFTB routine of Mortpak ‐
Lite. In the case of Sri Lanka, 1q0 and 4q1 are obtained using the separation factors
computed as described in 3.2.1 for both males and females. The age pattern of
nqx values for Sri Lanka and for each of the districts are shown in Figure A in
Appendix A. The nqx values are to a very large extent free of gross irregularities and
show quite a smooth pattern with age. It is very low at younger ages and gradually
increases thereafter and sharply rises at the older ages. The pattern for males in
Northern Province is an exception. The nqx values started to increase around age 10,
further rise till around 20 years, reach a plateau till 25 years then gradually decline
till 35 years and again reach the normal pattern. This deviation from normal pattern
is very slightly seen for females too. This could most probably due to the deaths
occur as a result of civil war prevailing in Northern Province. This abnormal pattern
for males is only very marginally seen in Trincomalee and Batticaloa districts in
Eastern Province. Minor deviations are found at the older ages. Kurunegala,
Anuradhapura, Polonnaruwa and Trincomalee are examples as seen in Figure A in
Appendix A.
Because of the minor irregularities at advance ages it was decided to smooth the age
specific probabilities of dying. The smoothing was carried out using the UNABR
routine of Mortpak‐Lite which graduates a set of age specific probabilities of dying,
nqx , for the standard set of five year age groups into a set of single year probabilities
of dying. The graduation is carried and using the eight‐parameter formula for the age
curve of mortality known as Heligman and Pollard model ( Heligman and Pollard,
1980);
1qx = A ( x+B )
c + De‐E( lnx‐lnF )
2 + GHx
1+GHx
where 1qx = probability of a person age x dying before age ( x+1 )

10
A, B,……….H : parameters estimated by least‐square criteria
The least square fitting criteria produces a smoothed set of nqx values and single
year 1qx values which aggregate to the smoothed nqx values. The fitted values of nqx
for Sri Lanka and districts together with the observed values are shown in Figure A in
Appendix A. These smoothed nqx values are taken as inputs for LIFTB routine of
Mortpak‐Lite to produce abridged life tables for Sri Lanka and districts. Complete life
tables for Sri Lanka are also obtained.
4. Some Analysis of Life Tables
Life expectancy at a given age is a very important measure derived from life tables. It
can be interpreted as the average number of years a person expected to live subject
to the prevalence of mortality conditions of a specified period throughout the life
span. Hence, the life expectancy at birth is the average length of life of a person.
Similarly, the life expectancy at age x is the average number of remaining years a
persons who survive to age x has to live.
4.1 Levels and Trends in Life Expectancy at Birth
Table 1 shows the life expectancy at birth for Sri Lanka by sex for different years.
Male Female
1920‐1922 32.7 30.7 ‐2.01945‐1947 46.8 44.7 0.6 0.6 ‐2.11952 57.6 55.5 1.8 1.8 ‐2.11962‐1964 63.3 63.7 0.5 0.7 0.41970‐1972 64.0 66.9 0.1 0.4 2.91980‐1982 67.7 72.1 0.4 0.5 4.42000‐2002 68.8 77.2 0.1 0.3 8.4
Source : Data for years prior to 2000‐2002 are from Department of Census and Statistics (1991)
Average increase in years per annum
Table 1 : Life expectancy at birth, Sri Lanka by sex, 1921‐2001
FemaleMaleYearDifference
Male‐Female
11
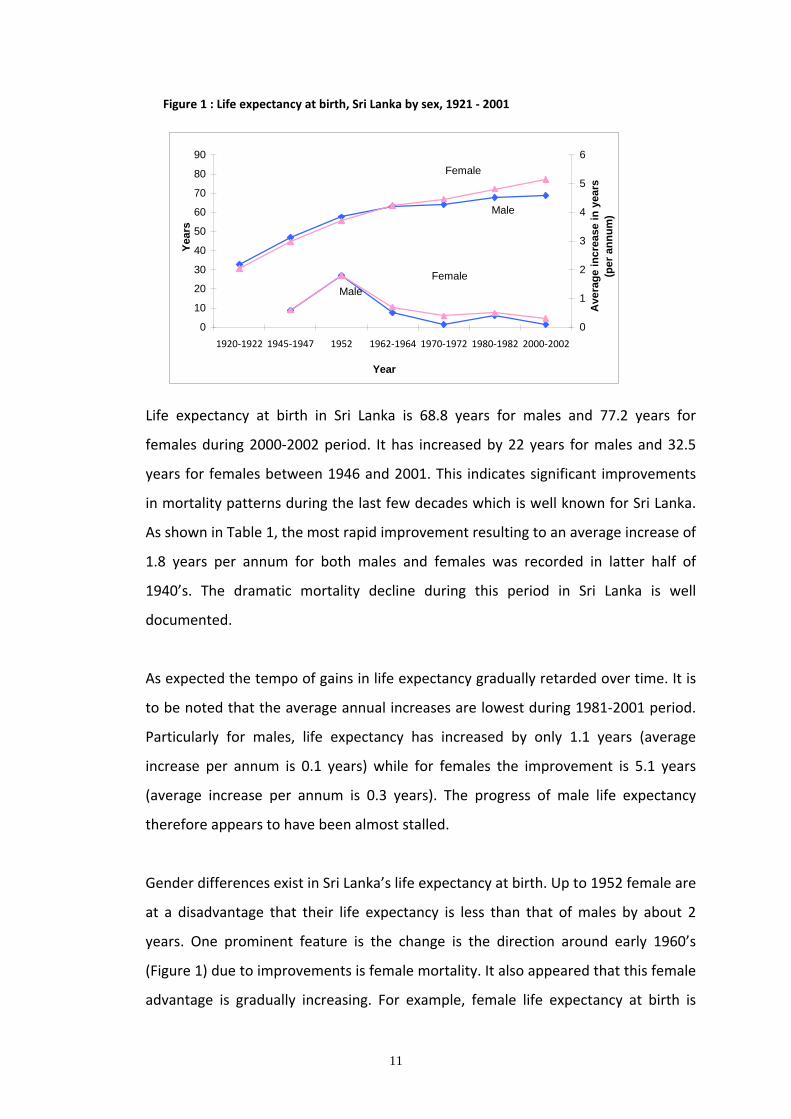
Figure 1 : Life expectancy at birth, Sri Lanka by sex, 1921 ‐ 2001
0
10
20
30
40
50
60
70
80
90
1920‐1922 1945‐1947 1952 1962‐1964 1970‐1972 1980‐1982 2000‐2002
Year
Year
s
0
1
2
3
4
5
6
Ave
rage
incr
ease
in y
ears
(p
er a
nnum
)
Female
Male
FemaleMale
Life expectancy at birth in Sri Lanka is 68.8 years for males and 77.2 years for
females during 2000‐2002 period. It has increased by 22 years for males and 32.5
years for females between 1946 and 2001. This indicates significant improvements
in mortality patterns during the last few decades which is well known for Sri Lanka.
As shown in Table 1, the most rapid improvement resulting to an average increase of
1.8 years per annum for both males and females was recorded in latter half of
1940’s. The dramatic mortality decline during this period in Sri Lanka is well
documented.
As expected the tempo of gains in life expectancy gradually retarded over time. It is
to be noted that the average annual increases are lowest during 1981‐2001 period.
Particularly for males, life expectancy has increased by only 1.1 years (average
increase per annum is 0.1 years) while for females the improvement is 5.1 years
(average increase per annum is 0.3 years). The progress of male life expectancy
therefore appears to have been almost stalled.
Gender differences exist in Sri Lanka’s life expectancy at birth. Up to 1952 female are
at a disadvantage that their life expectancy is less than that of males by about 2
years. One prominent feature is the change is the direction around early 1960’s
(Figure 1) due to improvements is female mortality. It also appeared that this female
advantage is gradually increasing. For example, female life expectancy at birth is

12
higher than that of males by 2.9 years in 1971, 4.4 years in 1981 and the female
advantage has risen to unprecedented 8.4 years in 2001.
4.2 Comparisons of Life Expectancy at Birth with Other Countries
Life expectancy at birth for the world and for different regions are shown in Table 2
and Figure 2. Sri Lanka’s figures for both males (68.8 years) and females (77.2 years)
exceed substantially with corresponding figures for less developed counties as well
as for South‐Central Asia region. Comparison with regions shows that the levels
more resemble with that of Europe rather than Asia.
Table 2 : Life expectatancy at birth by region, 2000‐2005
Region Male FemaleDifference
Female ‐ Male
World 63.9 68.3 4.4
More Developed Countries 71.9 79.3 7.4
Less Developed Countries 62.5 65.9 3.4
Africa 50.3 52.8 2.5
Northern America 74.9 80.3 5.4
South America 68.1 75.2 7.1
Asia 65.8 69.4 3.6Eastern Asia 71.3 75.2 3.9South‐Central Asia 61.5 64.1 2.6South‐Eastern Asia 66.0 71.0 5.0Western Asia 66.1 70.6 4.5
Europe 69.6 78.0 8.4
Oceania 71.6 77.3 5.7
Source : World Population Prospects, 2006 Revision
Note : More Developed countries comprise of all nations in Europe, North America plus Japan, Australia and New Zealand. The remaining nations of the world are considered to be Less Developed countries (United Nations)

13
Figure 2 : Life expectancy at birth by region 2000‐2005
MDC : More Developed CountriesLDC : Less Developed Countries
0102030405060708090
World MDC LDC Europe Asia SriLanka
Region
Years
Male Female
Life expectancies at birth by different selected countries are shown in Table 3 and
Figure 3. Among the countries in SAARC region Sri Lanka has the highest female life
expectancy at birth (77.2 years). Maldives recorded the highest values for males
(70.1 years). While other Asian countries such as Philippines, Thailand and Indonesia
have levels below Sri Lanka. Japan, Republic of Korea and Singapore enjoy higher
longevity for both males and females. One salient feature is relatively higher value of
female life expectancy and only three countries in Asia viz Japan, Republic of Korea
and Singapore are ahead of Sri Lanka.
Figure 3 : Life expectancy at birth by selected Asian countries
0.0 10.0 20.0 30.0 40.0 50.0 60.0 70.0 80.0 90.0
India
Maldives
Nepal
Sri Lanka
Philippines
Indonesia
Japan
Republic of Korea
Country
Life expectancy at birth (years)Male Female

14
Table 3 : Life expectancy at birth by country
Country Year Male FemaleDifference
Female ‐ Male
Sri Lanka 2000‐2002 68.8 77.2 8.4
Afganistan** 2001 43.0 43.0 0.0Bangladesh 2000‐2005 61.8 63.4 1.6Bhutan 2000‐2005 61.5 63.9 2.4India 2000‐2005 61.7 64.7 3.0Maldives** 2002 70.1 71.2 1.1Nepal 2001 60.1 60.7 0.6Pakistan* 2001 64.5 66.1 1.6
Japan* 2001 78.1 84.9 6.8Republic of Korea* 2001 72.8 80.0 7.2China** 2000 69.6 73.3 3.7Malaysia** 2001 70.0 73.9 3.9Singapore* 2001 76.4 80.3 3.9Philippines 2000‐2005 68.1 72.4 4.3Thailand 2000‐2005 66.0 73.7 7.7Indonesia 2000‐2005 64.6 68.6 4.0
France ** 2001 75.5 82.9 7.4Germany** 2002 75.9 81.5 5.6Poland* 2000 69.7 77.9 8.2Russian Federation 2004 58.9 72.3 13.4Czech Republic* 2001 72.1 78.5 6.4South Africa** 2001 51.8 56.7 4.9
U.S.A.* 2001 74.4 79.8 5.4Brazil 2002 67.3 74.9 7.6
source : United Nations World Mortality Report 2005 and * Demographic Yearbook 2002 ** Demographic Yearbook 2003
With a handful of national exceptions, life expectancy at birth worldwide is higher
for females than for their male counterparts. The average gap between the sexes is
7.4 years in more developed countries and 3.4 years is less developed countries
(Table 2 and Figure 4). The female advantage is small in less developed countries
due at least in part to high levels of maternal mortality. In some nations however the
gap has widened with time and expected to see further widening in future.

15
Figure 4 : Female advantage in life expectancy at birth, 2000‐2005
4.47.4
3.43.6
8.48.4
3.01.6
7.27.7
8.213.4
0.0 2.0 4.0 6.0 8.0 10.0 12.0 14.0 16.0
World MDCLDCAsia
EuropeSri Lanka
IndiaPakistan
Republic of KoreaThailand
PolandRussian Fed.
Region / Country
Difference (Female-Male) in years
The female advantage in life expectancy at birth for Sir Lanka is 8.4 years which is
unusually high for a developing county. This is even higher than the average gap that
exists for more developed countries and exactly coincides with that of Europe. The
gender gap exists in Sri Lanka is second to only few countries in the world such as
Russian Federation (difference of 13.4 years). Precise explanations of the significant
gender differences in life expectancy at birth need further research because of the
apparent complex interplay of biological, social, behavioural and health conditions.
4.3 Life Expectancy at Older Ages
As infant and child mortality reach lower levels, improvements in average life
expectancy are achieved primarily by declines in mortality among older segments of
the population. An emerging feature in Sri Lanka is the extended length of life
available at older ages.
Year Male Female
1920‐1922 11.5 10.61945‐1947 14.3 14.51952 16.0 14.91962‐1964 16.6 17.01970‐1972 16.6 17.81980‐1982 18.0 20.02000‐2002 17.7 21.6Source : See Table 1
Table 4 : Life expectancy at age 60 years by sex, 1921‐2001

16
As shown in Table 4, the life expectancy at age 60 years has risen over the time. In
the 1920’s a female reaching the age 60 could expect to live around 11 more years.
On the other hand, female aged 60 in 2001 is expected live further 22 years. The
pace of increase is low for males. The additional years beyond aged 60 for males
seem to have stabilized around 18 years during the last 2 decades.
Higher level of survival chances at old ages coupled with the fertility declines will
result increasing population of the elderly, commonly known as population ageing.
The population above age 60 years is 9.2 percent in 2001 and Sri Lanka is among
fastest ageing countries in Asia. This proportion is projected to reach 22.0 percent by
2030 (United Nations 2006)
4.4 Projected Life Expectancies at Birth
Life expectancy at birth can be projected using the past estimates. A logistic function
can be fitted since this function approximates the expected changes in life
expectancy. It increases rather slowly when mortality is very high, accelerates at
middle levels and increases again rather slowly at low levels of mortality. The logistic
function has a similar pattern. The procedure uses logits and the least squares
technique based on observed values of life expectancies. The results are presented
in Table 5.
Table 5 : Projected life expectancy at birth, 2006-2026
Year Male Female
2006 69.9 78.72011 70.5 79.82016 71.1 80.82021 71.7 81.72026 72.3 82.5
Under the logistic model, the most likely level to reach in 2016 is about 71 years for
males and 81 years for females.

17
4.5 Variation of Life Expectancy at Birth by Districts Life expectancies at birth of males and females by districts for the period 2000‐2002
are given in Table 6 together with the values for 1980‐1982 for comparison.
Table 6 : Life expectancy at birth by district and sex, 1980‐1982 and 2000‐2002
District1980‐1982 2000‐2002 1980‐1982 2000‐2002
Colombo 60.1 61.9 1.8 66.0 71.9 5.9Gampaha 71.6 71.5 ‐0.1 76.2 80.4 4.2Kalutara 71.0 72.7 1.7 74.5 80.2 5.7Kandy 62.7 67.3 4.6 67.9 75.0 7.1Matale 68.2 70.7 2.5 71.9 77.5 5.6Nuwara Eliya 68.0 70.8 2.8 69.1 74.7 5.6Galle 69.3 70.5 1.2 73.5 78.4 4.9Matara 70.2 73.5 3.3 75.5 80.4 4.9Hambantota 73.2 76.9 3.7 76.8 82.3 5.5Batticaloa 65.9 66.8 0.9 68.8 73.8 5.0Ampara 69.9 70.3 0.4 72.9 75.9 3.0Trincomalee 69.7 68.5 ‐1.2 72.6 74.2 1.6Kurunegala 68.4 68.9 0.5 73.6 78.0 4.4Puttalam 68.7 69.1 0.4 73.9 78.9 5.0Anuradhapura 69.8 66.5 ‐3.3 73.5 76.1 2.6Polonnaruwa 72.0 69.6 ‐2.4 77.8 77.6 ‐0.2Badulla 65.7 68.9 3.2 68.7 75.4 6.7Monaragala 74.7 75.2 0.5 75.5 80.5 5.0Ratnapura 68.4 72.0 3.6 70.4 78.4 8.0Kegalle 70.1 72.5 2.4 74.6 80.0 5.4Northern Province 70.2* 59.9 ‐10.3 73.9* 73.8 ‐0.1
Sri Lanka 67.7 68.8 1.1 72.1 77.2 5.1
* Average of districts in Northern Province
Male Female Absolute change
Absolute change
The district pattern for the period 2000‐2002 is illustrated in Map 1.

18
Male Female
Less than 6565 - 69.9 Less than 7570 - 74.9 75-79.975 and over 80 and over
Map 1 : Life expectancy at birth by districts, 2000-2002
Northern
Colombo
Gampaha
Kalutara
Kandy
Polonnaruwa
Matale
Nuwara Eliya
GalleMatara
Hambantota
Moneragala
Ampara
Tricomalee
Kurunegala
Puttalam
Anuradhapura
Badulla
Ratnapura
Kegalle
Batticaloa
Northern
Colombo
Gampaha
Kalutara
Kandy
Matale
Nuwara Eliya
GalleMatara
Kegalle
Hambantota
Moneragala
Ampara
Anuradhapura Tricomalee
Kurunegala
PuttalamPolonnaruwa
Badulla
Ratnapura
Batticaloa

19
Female life expectancy at birth for all districts are above 70 years. In fact, 11 districts
have values between 75 and 80 years. This intermediate pattern is surrounded by
relatively high mortality (life expectancy at birth below 75 years) areas and few
districts with low mortality (life expectancy at birth 80 years and over). High
mortality areas stretch from eastern coast (Batticaloa and Trincomalee) to Northern
Province. Colombo in Western coast and Nuwara Eliya in hill country are the two
other relatively high a mortality districts. Low mortality area runs along Western and
Southern coastal districts (except Colombo and Galle) and extends upwards to
Moneragala. Kegalle also belongs to this group. In fact the highest life expectancy at
birth for females (82.3 years) is reported from Hambantota district followed by
Moneragala (80.5 years). Interestingly, these two districts are considered as more
remote and less urbanized areas in Sri Lanka.
Life expectancy at birth for males is always lower than females across all the
districts. As shown in Table 6 and Map 1, it is lowest for Northern Province (59.9
years). Colombo district too has a low value (61.9 years). Most of the dry zone
districts such as Anuradhapura, Polonnaruwa, Trincomalee, Batticaloa and Puttalam
fall into the range of 65‐69.9 years while some districts along the Western and
Southern coastal belt and in hills belong to the category of 70‐74.9 years. As in the
case of females, Hambantota has the highest male life expectancy at birth (76.9
years) followed by Moneragla (75.2 years).
A salient feature in the district pattern of mortality is the very low level of life
expectancy in Colombo district for both males and females. One major contributory
factor for this is the higher occurrence of deaths is Colombo due to the presence of
strong network of hospitals and health facilities run by both government and private
sectors. Another possible cause for higher mortality is the existence of extreme
poverty in slum areas of the capital city. In contrast to Colombo, some of the most
disadvantaged districts such as Hambantota and Moneragala have reached the
highest levels in life expectancy.

20
The changes in life expectancy in each district is shown in Table 6, Figure 5A and
Figure 5B.
Figure 5A : Change in life expectancy at birth for females by district, 1980‐1982 to 2000‐2002
-1.0 0.0 1.0 2.0 3.0 4.0 5.0 6.0 7.0 8.0
ColomboGampahaKalutara
KandyMatale
Nuw ara EliyaGalle
MataraHambantota
BatticaloaAmpara
TrincomaleeKurunegala
PuttalamAnuradhapuraPolonnaruw a
BadullaMonaragalaRatnapura
KegalleNorthern Province
District
Change in life expectancy
Figure 5B : Change in life expectancy at birth for males by district, 1980‐1982 to 2000‐2002
-11.0 -9.0 -7.0 -5.0 -3.0 -1.0 1.0 3.0 5.0 7.0
ColomboGampahaKalutara
KandyMatale
Nuw ara EliyaGalle
MataraHambantota
BatticaloaAmpara
TrincomaleeKurunegala
PuttalamAnuradhapuraPolonnaruw a
BadullaMonaragalaRatnapura
KegalleNorthern Province
District
Change in life expectancy
Improvements in life expectancy for females is highest for Ratnapura district (8.0
years) followed by Kandy (7.1 years) and Badulla (6.7 years). Other districts that

21
show gains higher than the national increase of 5.1 years are Colombo (5.9 years),
Kalutara (5.7 years), Matale and Nuwara Eliya (5.6 years), Hambantota (5.5 years)
and Kegalle (5.4 years). The smaller gains have been in Trincomalee (1.6 years) and
Ampara (3.0 years), both in eastern province and in Anuradhapura (2.6 years). Very
marginal deterioration in life expectancies for females is visible for Polonnaruwa (0.2
years) and Northern Province (0.2 years).
As expected, gains in male life expectancy is lower than females in all districts which
experience improvements. Increase in life expectancy for males is highest for Kandy
district (4.6 years) followed by Hambantota (3.7 years) and Ratnapura (3.6 years).
Marginal increases of less than one year recorded for Batticaloa, Ampara,
Kurunegala and Moneragla districts. One prominent feature in Figure 5B is very large
decline of 10.3 years in the life expectancy of males in Northern Province during the
two decades prior to 2001. As discussed in section 3.3 most probable reason for
such unexpected decrease is the civil war prevailing in Northern Province. Such a
pattern, although to a lesser extent, is also seen for Trincomalee district. Surprisingly
a decrease in life expectancy of males in the magnitude of 2‐3 years is reported for
Anuradhapura and Polonnaruwa districts. Identification of exact causes behind such
declines is beyond the scope of this report and further research is needed for that
purpose.

5. Life tables for Sri Lanka and Districts

Table 7 : Complete life tables for Sri Lanka, 2000 ‐ 2002
Male
Age nmx nqx lx ex Age nmx nqx lx ex Age nmx nqx lx ex
0 0.01480 0.01465 100000 68.8 31 0.00320 0.00320 94125 41.1 62 0.02276 0.02251 72450 16.31 0.00123 0.00123 98535 68.8 32 0.00321 0.00321 93824 40.2 63 0.02461 0.02432 70819 15.72 0.00073 0.00073 98414 67.9 33 0.00325 0.00324 93523 39.3 64 0.02661 0.02626 69097 15.13 0.00056 0.00056 98342 66.9 34 0.00330 0.00330 93220 38.5 65 0.02877 0.02837 67283 14.54 0.00048 0.00048 98287 66.0 35 0.00339 0.00338 92912 37.6 66 0.03111 0.03063 65374 13.95 0.00045 0.00045 98240 65.0 36 0.00350 0.00349 92598 36.7 67 0.03363 0.03307 63372 13.36 0.00043 0.00043 98196 64.0 37 0.00365 0.00364 92275 35.8 68 0.03634 0.03570 61276 12.77 0.00042 0.00042 98154 63.1 38 0.00383 0.00382 91939 35.0 69 0.03928 0.03852 59089 12.28 0.00043 0.00043 98112 62.1 39 0.00404 0.00403 91588 34.1 70 0.04245 0.04156 56812 11.69 0.00044 0.00044 98070 61.1 40 0.00429 0.00428 91219 33.2 71 0.04586 0.04483 54451 11.1
10 0.00046 0.00046 98027 60.2 41 0.00457 0.00456 90829 32.4 72 0.04954 0.04835 52010 10.611 0.00048 0.00048 97982 59.2 42 0.00489 0.00487 90415 31.5 73 0.05352 0.05212 49495 10.112 0.00052 0.00052 97935 58.2 43 0.00524 0.00523 89974 30.7 74 0.05780 0.05617 46916 9.713 0.00057 0.00057 97884 57.2 44 0.00563 0.00562 89504 29.8 75 0.06241 0.06052 44280 9.214 0.00066 0.00066 97828 56.3 45 0.00607 0.00605 89001 29.0 76 0.06738 0.06518 41600 8.815 0.00078 0.00078 97764 55.3 46 0.00654 0.00652 88463 28.2 77 0.07272 0.07017 38889 8.316 0.00095 0.00095 97688 54.3 47 0.00706 0.00703 87886 27.3 78 0.07848 0.07552 36160 7.917 0.00118 0.00118 97595 53.4 48 0.00762 0.00759 87268 26.5 79 0.08467 0.08123 33429 7.518 0.00144 0.00144 97480 52.5 49 0.00823 0.00820 86606 25.7 80 0.09133 0.08734 30714 7.219 0.00174 0.00173 97340 51.5 50 0.00890 0.00886 85896 24.9 81 0.09848 0.09386 28031 6.820 0.00204 0.00204 97171 50.6 51 0.00962 0.00957 85135 24.2 82 0.10616 0.10081 25400 6.421 0.00233 0.00233 96973 49.7 52 0.01040 0.01034 84320 23.4 83 0.11440 0.10821 22840 6.122 0.00259 0.00259 96747 48.8 53 0.01124 0.01118 83448 22.6 84 0.12325 0.11609 20368 5.823 0.00281 0.00280 96497 48.0 54 0.01216 0.01209 82515 21.9 85 0.13272 0.12446 18004 5.524 0.00298 0.00297 96226 47.1 55 0.01315 0.01307 81518 21.1 86 0.14287 0.13335 15763 5.225 0.00310 0.00309 95940 46.2 56 0.01423 0.01413 80452 20.4 87 0.15374 0.14276 13661 4.926 0.00317 0.00316 95644 45.4 57 0.01539 0.01527 79316 19.7 88 0.16536 0.15273 11711 4.727 0.00321 0.00320 95341 44.5 58 0.01664 0.01650 78105 19.0 89 0.17777 0.16326 9922 4.428 0.00322 0.00321 95036 43.7 59 0.01800 0.01784 76816 18.3 90 0.19101 0.17436 8302 4.229 0.00321 0.00321 94731 42.8 60 0.01946 0.01928 75446 17.6 91 0.20513 0.18605 6855 3.930 0.00320 0.00320 94427 41.9 61 0.02105 0.02083 73991 17.0 92 0.22017 0.19833 5579 3.7
Female
Age nmx nqx lx ex Age nmx nqx lx ex Age nmx nqx lx ex
0 0.01165 0.01156 100000 77.2 31 0.00090 0.00090 96882 48.2 62 0.01046 0.01040 87995 19.81 0.00098 0.00098 98844 77.1 32 0.00091 0.00091 96794 47.2 63 0.01160 0.01154 87080 19.02 0.00069 0.00069 98747 76.0 33 0.00092 0.00092 96706 46.2 64 0.01288 0.01280 86075 18.23 0.00056 0.00056 98678 75.1 34 0.00094 0.00094 96617 45.3 65 0.01429 0.01419 84974 17.54 0.00049 0.00049 98623 74.1 35 0.00097 0.00097 96526 44.3 66 0.01586 0.01574 83768 16.75 0.00043 0.00043 98575 73.3 36 0.00101 0.00101 96433 43.4 67 0.01760 0.01745 82450 16.06 0.00040 0.00040 98532 72.2 37 0.00105 0.00105 96336 42.4 68 0.01954 0.01935 81011 15.37 0.00037 0.00037 98493 71.2 38 0.00111 0.00111 96234 41.5 69 0.02168 0.02145 79444 14.58 0.00035 0.00035 98456 70.2 39 0.00118 0.00118 96127 40.5 70 0.02406 0.02378 77739 13.99 0.00034 0.00034 98422 69.3 40 0.00126 0.00126 96014 39.5 71 0.02670 0.02635 75891 13.2
10 0.00034 0.00034 98389 68.4 41 0.00136 0.00136 95893 38.6 72 0.02962 0.02919 73892 12.511 0.00036 0.00036 98355 67.3 42 0.00147 0.00147 95763 37.6 73 0.03286 0.03233 71735 11.912 0.00039 0.00039 98320 66.3 43 0.00159 0.00159 95622 36.7 74 0.03645 0.03580 69416 11.313 0.00043 0.00043 98282 65.4 44 0.00174 0.00173 95470 35.8 75 0.04042 0.03962 66931 10.714 0.00049 0.00049 98240 64.4 45 0.00190 0.00190 95304 34.8 76 0.04482 0.04384 64279 10.115 0.00055 0.00055 98192 63.5 46 0.00208 0.00208 95124 33.9 77 0.04968 0.04848 61461 9.516 0.00062 0.00062 98138 62.4 47 0.00228 0.00228 94926 33.0 78 0.05506 0.05359 58482 9.017 0.00069 0.00069 98077 61.5 48 0.00251 0.00251 94710 32.0 79 0.06100 0.05920 55348 8.518 0.00075 0.00075 98009 60.5 49 0.00277 0.00277 94472 31.1 80 0.06757 0.06536 52071 8.019 0.00081 0.00081 97935 59.6 50 0.00306 0.00305 94211 30.2 81 0.07481 0.07211 48668 7.520 0.00085 0.00085 97856 58.6 51 0.00338 0.00337 93923 29.3 82 0.08280 0.07951 45158 7.021 0.00089 0.00089 97773 57.7 52 0.00373 0.00373 93607 28.4 83 0.09160 0.08759 41568 6.622 0.00091 0.00091 97686 56.7 53 0.00413 0.00412 93258 27.5 84 0.10129 0.09641 37927 6.223 0.00093 0.00093 97597 55.8 54 0.00457 0.00456 92873 26.6 85 0.11194 0.10601 34270 5.824 0.00093 0.00093 97507 54.8 55 0.00507 0.00505 92449 25.7 86 0.12365 0.11645 30637 5.425 0.00093 0.00093 97416 53.9 56 0.00561 0.00560 91982 24.8 87 0.13648 0.12776 27070 5.026 0.00093 0.00093 97325 52.9 57 0.00622 0.00621 91467 24.0 88 0.15055 0.14001 23611 4.727 0.00092 0.00092 97235 52.0 58 0.00690 0.00688 90900 23.1 89 0.16593 0.15322 20306 4.428 0.00091 0.00091 97146 51.0 59 0.00766 0.00763 90274 22.3 90 0.18274 0.16744 17194 4.129 0.00091 0.00091 97057 50.1 60 0.00849 0.00846 89586 21.5 91 0.20106 0.18269 14315 3.830 0.00090 0.00090 96969 49.1 61 0.00942 0.00938 88828 20.6 92 0.22099 0.19900 11700 3.5
24

Table 8 : Abridged life tables for Sri Lanka, 2000 ‐ 2002
Male
Age nmx nqx lx ndx nLx nSx Tx ex
0 0.01485 0.01465 100000 1465 98700 0.98436 (1) 6882161 68.81 0.00075 0.00300 98535 296 393479 0.99693 (2) 6783461 68.85 0.00043 0.00216 98239 212 490666 0.99758 6389982 65.010 0.00054 0.00268 98027 263 489479 0.99602 5899315 60.215 0.00122 0.00607 97764 593 487530 0.99075 5409836 55.320 0.00255 0.01266 97171 1230 483019 0.98544 4922306 50.725 0.00318 0.01578 95941 1514 475985 0.98403 4439287 46.330 0.00323 0.01604 94427 1515 468384 0.98309 3963302 42.035 0.00368 0.01823 92912 1694 460462 0.97908 3494918 37.640 0.00492 0.02432 91219 2218 450827 0.97083 3034456 33.345 0.00709 0.03489 89000 3105 437678 0.95765 2583629 29.050 0.01045 0.05097 85895 4378 419143 0.93810 2145950 25.055 0.01544 0.07449 81517 6072 393197 0.90985 1726807 21.260 0.02282 0.10820 75445 8163 357752 0.86983 1333610 17.765 0.03365 0.15562 67282 10470 311185 0.81441 975858 14.570 0.04945 0.22059 56811 12532 253433 0.74010 664674 11.775 0.07233 0.30638 44279 13566 187565 0.64513 411241 9.380 0.10503 0.41382 30713 12710 121004 0.45902 (3) 223675 7.385 0.17606 ... 18003 18003 102258 ... 102671 5.7
Female
Age nmx nqx lx ndx nLx nSx Tx ex
0 0.01168 0.01156 100000 1156 98989 0.98752 (1) 7715049 77.21 0.00068 0.00273 98844 270 394772 0.99725 (2) 7616060 77.15 0.00038 0.00189 98574 186 492405 0.99806 7221288 73.310 0.00040 0.00200 98388 197 491447 0.99741 6728883 68.415 0.00069 0.00342 98191 336 490172 0.99598 6237436 63.520 0.00090 0.00450 97855 440 488202 0.99540 5747264 58.725 0.00092 0.00459 97415 447 485957 0.99544 5259062 54.030 0.00092 0.00457 96968 443 483744 0.99514 4773105 49.235 0.00106 0.00531 96525 513 481392 0.99378 4289361 44.440 0.00148 0.00739 96012 710 478399 0.99077 3807969 39.745 0.00231 0.01148 95303 1094 473985 0.98525 3329570 34.950 0.00377 0.01869 94208 1761 466994 0.97572 2855585 30.355 0.00628 0.03097 92448 2863 455657 0.95969 2388591 25.860 0.01055 0.05148 89585 4612 437289 0.93319 1932934 21.665 0.01773 0.08514 84973 7235 408073 0.89033 1495645 17.670 0.02975 0.13904 77738 10809 363320 0.82326 1087572 14.075 0.04968 0.22201 66930 14859 299108 0.72406 724252 10.880 0.08219 0.34185 52070 17800 216572 0.49059 (3) 425144 8.285 0.16489 ... 34270 34270 207839 ... 208572 6.1
(1) Value given is for survivorship of 5 cohorts of birth to age group 0‐4 = 5L0/500000(2) Value given is for 5S0=5L5/5L0(3) Value given is 5S80+=T85/T80
25

Table 9 : Life tables for districts, 2000 ‐ 2002
Colombo District ‐ Male
Age nmx nqx lx ndx nLx nSx Tx ex
0 0.03563 0.03457 100000 3457 97034 0.96304 (1) 6192477 61.91 0.00179 0.00713 96543 688 384485 0.99281 (2) 6095444 63.15 0.00102 0.00508 95855 487 478056 0.99444 5710959 59.610 0.00121 0.00604 95368 576 475398 0.99285 5232903 54.915 0.00176 0.00877 94792 831 471997 0.98964 4757505 50.220 0.00242 0.01204 93960 1131 467107 0.98619 4285508 45.625 0.00318 0.01580 92829 1467 460657 0.98124 3818400 41.130 0.00448 0.02218 91362 2026 452016 0.97361 3357743 36.835 0.00632 0.03113 89336 2781 440088 0.96300 2905727 32.540 0.00891 0.04362 86555 3776 423806 0.94824 2465638 28.545 0.01256 0.06096 82779 5046 401870 0.92786 2041833 24.750 0.01768 0.08482 77733 6593 372878 0.89998 1639962 21.155 0.02487 0.11732 71140 8346 335585 0.86236 1267084 17.860 0.03492 0.16093 62794 10105 289393 0.81249 931499 14.865 0.04890 0.21823 52688 11498 235130 0.74806 642106 12.270 0.06824 0.29140 41190 12003 175892 0.66759 406976 9.975 0.09478 0.38130 29187 11129 117424 0.57180 231084 7.980 0.13074 0.48611 18058 8778 67143 0.40926 (3) 113660 6.385 0.19950 ... 9280 9280 46517 ... 46517 5.0
Colombo District ‐ Female
Age nmx nqx lx ndx nLx nSx Tx ex
0 0.02621 0.02562 100000 2562 97763 0.97225 (1) 7192443 71.91 0.00142 0.00566 97438 551 388364 0.99431 (2) 7094680 72.85 0.00089 0.00443 96887 429 483359 0.99579 6706317 69.210 0.00080 0.00399 96457 385 481324 0.99554 6222957 64.515 0.00103 0.00513 96072 493 479175 0.99427 5741633 59.820 0.00126 0.00627 95580 599 476429 0.99356 5262458 55.125 0.00132 0.00657 94980 624 473360 0.99311 4786028 50.430 0.00148 0.00735 94356 694 470100 0.99168 4312668 45.735 0.00192 0.00957 93663 896 466187 0.98853 3842568 41.040 0.00277 0.01377 92766 1277 460838 0.98303 3376381 36.445 0.00419 0.02075 91489 1898 453019 0.97410 2915542 31.950 0.00649 0.03196 89591 2863 441284 0.95991 2462524 27.555 0.01016 0.04963 86727 4304 423595 0.93772 2021239 23.360 0.01601 0.07715 82423 6359 397212 0.90353 1597645 19.465 0.02527 0.11922 76064 9068 358894 0.85210 1200432 15.870 0.03983 0.18183 66996 12182 305813 0.77738 841538 12.675 0.06253 0.27122 54814 14867 237734 0.67482 535725 9.880 0.09736 0.39100 39947 15619 160428 0.46164 (3) 297991 7.585 0.17685 ... 24328 24328 137563 ... 137563 5.7
(1) Value given is for survivorship of 5 cohorts of birth to age group 0‐4 = 5L0/500000(2) Value given is for 5S0=5L5/5L0(3) Value given is 5S80+=T85/T80
26

Gampaha District ‐ Male
Age nmx nqx lx ndx nLx nSx Tx ex
0 0.02301 0.02255 100000 2255 97987 0.97573 (1) 7153273 71.51 0.00117 0.00467 97745 456 389878 0.99608 (2) 7055286 72.25 0.00040 0.00202 97289 197 485951 0.99804 6665408 68.510 0.00038 0.00189 97092 184 485001 0.99777 6179457 63.615 0.00055 0.00277 96909 268 483919 0.99645 5694456 58.820 0.00090 0.00448 96640 433 482202 0.99430 5210536 53.925 0.00142 0.00710 96207 683 479452 0.99115 4728334 49.130 0.00217 0.01080 95524 1032 475210 0.98679 4248882 44.535 0.00320 0.01588 94492 1501 468935 0.98087 3773672 39.940 0.00460 0.02273 92992 2114 459967 0.97289 3304737 35.545 0.00650 0.03199 90878 2907 447499 0.96206 2844770 31.350 0.00912 0.04463 87971 3926 430520 0.94717 2397272 27.355 0.01281 0.06215 84045 5223 407775 0.92632 1966752 23.460 0.01814 0.08693 78821 6852 377731 0.89663 1558977 19.865 0.02603 0.12250 71969 8816 338686 0.85389 1181247 16.470 0.03799 0.17396 63153 10986 289202 0.79241 842560 13.375 0.05642 0.24784 52167 12929 229166 0.70546 553359 10.680 0.08510 0.35063 39238 13758 161668 0.50132 (3) 324193 8.385 0.15678 ... 25480 25480 162526 ... 162526 6.4
Gampaha District ‐ Female
Age nmx nqx lx ndx nLx nSx Tx ex
0 0.00418 0.00416 100000 416 99610 0.99524 (1) 8036025 80.41 0.00033 0.00132 99584 131 398010 0.99888 (2) 7936415 79.75 0.00016 0.00080 99453 80 497064 0.99910 7538406 75.810 0.00020 0.00101 99373 100 496614 0.99892 7041342 70.915 0.00024 0.00118 99273 117 496078 0.99872 6544728 65.920 0.00028 0.00139 99155 138 495443 0.99847 6048650 61.025 0.00034 0.00169 99018 167 494686 0.99808 5553207 56.130 0.00044 0.00219 98850 216 493737 0.99742 5058521 51.235 0.00061 0.00305 98634 301 492463 0.99626 4564784 46.340 0.00092 0.00458 98333 450 490621 0.99417 4072321 41.445 0.00147 0.00735 97883 719 487761 0.99040 3581700 36.650 0.00248 0.01234 97163 1199 483080 0.98362 3093939 31.855 0.00431 0.02132 95964 2046 475166 0.97143 2610859 27.260 0.00761 0.03742 93918 3514 461591 0.94975 2135694 22.765 0.01359 0.06590 90404 5958 438398 0.91191 1674103 18.570 0.02433 0.11517 84446 9726 399779 0.84793 1235704 14.675 0.04344 0.19707 74721 14725 338985 0.74615 835926 11.280 0.07684 0.32394 59995 19435 252935 0.49102 (3) 496941 8.385 0.16623 ... 40560 40560 244005 ... 244005 6.0
(1) Value given is for survivorship of 5 cohorts of birth to age group 0‐4 = 5L0/500000(2) Value given is for 5S0=5L5/5L0(3) Value given is 5S80+=T85/T80
27

Kalutara District ‐ Male
Age nmx nqx lx ndx nLx nSx Tx ex
0 0.00482 0.00480 100000 480 99547 0.99451 (1) 7274741 72.71 0.00040 0.00159 99520 158 397706 0.99848 (2) 7175194 72.15 0.00025 0.00125 99362 124 496498 0.99854 6777488 68.210 0.00034 0.00168 99238 167 495771 0.99766 6280990 63.315 0.00067 0.00336 99071 333 494610 0.99538 5785219 58.420 0.00120 0.00599 98738 591 492327 0.99267 5290609 53.625 0.00174 0.00865 98147 849 488718 0.99009 4798282 48.930 0.00225 0.01119 97298 1089 483874 0.98737 4309564 44.335 0.00286 0.01422 96209 1368 477765 0.98367 3825690 39.840 0.00379 0.01880 94841 1783 469962 0.97778 3347926 35.345 0.00532 0.02625 93058 2443 459521 0.96824 2877964 30.950 0.00779 0.03826 90615 3467 444924 0.95303 2418443 26.755 0.01176 0.05720 87148 4985 424025 0.92940 1973519 22.660 0.01799 0.08631 82163 7092 394087 0.89361 1549494 18.965 0.02770 0.12994 75072 9755 352162 0.84094 1155406 15.470 0.04265 0.19338 65317 12631 296146 0.76622 803244 12.375 0.06543 0.28180 52686 14847 226912 0.66591 507098 9.680 0.09961 0.39777 37839 15051 151103 0.46070 (3) 280186 7.485 0.17654 ... 22788 22788 129083 ... 129083 5.7
Kalutara District ‐ Female
Age nmx nqx lx ndx nLx nSx Tx ex
0 0.00377 0.00376 100000 376 99647 0.99587 (1) 8019120 80.21 0.00021 0.00084 99624 84 398288 0.99909 (2) 7919473 79.55 0.00018 0.00088 99540 88 497483 0.99908 7521184 75.610 0.00019 0.00096 99453 95 497025 0.99883 7023702 70.615 0.00030 0.00148 99357 147 496443 0.99819 6526677 65.720 0.00043 0.00215 99210 213 495542 0.99761 6030234 60.825 0.00052 0.00259 98997 256 494359 0.99727 5534691 55.930 0.00058 0.00288 98740 284 493007 0.99691 5040332 51.035 0.00068 0.00337 98456 332 491482 0.99613 4547326 46.240 0.00090 0.00451 98124 443 489581 0.99442 4055844 41.345 0.00139 0.00693 97682 677 486849 0.99096 3566263 36.550 0.00234 0.01165 97005 1130 482450 0.98440 3079414 31.755 0.00413 0.02047 95875 1963 474923 0.97229 2596964 27.160 0.00744 0.03660 93912 3437 461763 0.95040 2122041 22.665 0.01351 0.06554 90475 5930 438858 0.91169 1660278 18.470 0.02455 0.11617 84545 9822 400104 0.84566 1221420 14.475 0.04439 0.20101 74724 15020 338351 0.74005 821316 11.080 0.07938 0.33293 59703 19877 250397 0.48154 (3) 482965 8.185 0.17125 ... 39826 39826 232567 ... 232567 5.8
(1) Value given is for survivorship of 5 cohorts of birth to age group 0‐4 = 5L0/500000(2) Value given is for 5S0=5L5/5L0(3) Value given is 5S80+=T85/T80
28

Kandy District ‐ Male
Age nmx nqx lx ndx nLx nSx Tx ex
0 0.02430 0.02379 100000 2379 97885 0.97499 (1) 6728232 67.31 0.00093 0.00371 97621 362 389608 0.99599 (2) 6630348 67.95 0.00062 0.00310 97259 302 485540 0.99678 6240740 64.210 0.00067 0.00335 96957 325 483975 0.99590 5755199 59.415 0.00106 0.00529 96633 511 481991 0.99285 5271225 54.520 0.00184 0.00917 96121 881 478545 0.98950 4789234 49.825 0.00234 0.01161 95240 1106 473521 0.98745 4310689 45.330 0.00274 0.01361 94134 1281 467578 0.98445 3837168 40.835 0.00362 0.01797 92853 1669 460305 0.97845 3369590 36.340 0.00522 0.02580 91184 2353 450387 0.96855 2909284 31.945 0.00774 0.03800 88832 3376 436223 0.95356 2458898 27.750 0.01154 0.05618 85456 4801 415964 0.93148 2022674 23.755 0.01723 0.08277 80655 6676 387461 0.89949 1606710 19.960 0.02570 0.12106 73979 8956 348516 0.85400 1219249 16.565 0.03824 0.17505 65024 11382 297632 0.79102 870734 13.470 0.05670 0.24886 53641 13349 235431 0.70709 573102 10.775 0.08360 0.34540 40292 13917 166470 0.60149 337671 8.480 0.12220 0.46390 26375 12235 100130 0.41513 (3) 171201 6.585 0.19895 ... 14140 14140 71071 ... 71071 5.0
Kandy District ‐ Female
Age nmx nqx lx ndx nLx nSx Tx ex
0 0.01932 0.01899 100000 1899 98304 0.97976 (1) 7503912 75.01 0.00084 0.00336 98101 330 391578 0.99674 (2) 7405608 75.55 0.00047 0.00235 97771 230 488282 0.99762 7014030 71.710 0.00048 0.00241 97542 235 487120 0.99703 6525747 66.915 0.00076 0.00377 97307 367 485673 0.99553 6038627 62.120 0.00103 0.00512 96940 496 483500 0.99452 5552954 57.325 0.00115 0.00575 96443 555 480852 0.99402 5069454 52.630 0.00125 0.00624 95889 598 477979 0.99325 4588602 47.935 0.00149 0.00743 95290 708 474751 0.99140 4110623 43.140 0.00202 0.01006 94582 951 470669 0.98772 3635872 38.445 0.00302 0.01499 93631 1404 464887 0.98113 3165203 33.850 0.00476 0.02352 92227 2169 456114 0.97001 2700316 29.355 0.00767 0.03768 90058 3393 442436 0.95180 2244202 24.960 0.01249 0.06068 86665 5259 421111 0.92258 1801766 20.865 0.02039 0.09730 81406 7921 388507 0.87677 1380654 17.070 0.03324 0.15408 73485 11323 340631 0.80739 992147 13.575 0.05395 0.23867 62163 14836 275021 0.70797 651516 10.580 0.08679 0.35707 47326 16899 194708 0.48284 (3) 376495 8.085 0.16738 ... 30427 30427 181787 ... 181787 6.0
(1) Value given is for survivorship of 5 cohorts of birth to age group 0‐4 = 5L0/500000(2) Value given is for 5S0=5L5/5L0(3) Value given is 5S80+=T85/T80
29

Matale District ‐ Male
Age nmx nqx lx ndx nLx nSx Tx ex
0 0.01068 0.01058 100000 1058 99019 0.98848 (1) 7072743 70.71 0.00058 0.00232 98942 230 395222 0.99772 (2) 6973724 70.55 0.00036 0.00182 98712 180 493113 0.99809 6578502 66.610 0.00040 0.00201 98533 198 492169 0.99738 6085389 61.815 0.00072 0.00360 98335 354 490880 0.99487 5593220 56.920 0.00139 0.00692 97981 678 488360 0.99124 5102341 52.125 0.00213 0.01059 97303 1030 484080 0.98783 4613981 47.430 0.00276 0.01369 96272 1318 478187 0.98479 4129901 42.935 0.00339 0.01683 94954 1598 470916 0.98104 3651714 38.540 0.00434 0.02147 93356 2004 461987 0.97495 3180798 34.145 0.00595 0.02933 91352 2679 450414 0.96468 2718812 29.850 0.00866 0.04244 88673 3763 434504 0.94794 2268398 25.655 0.01307 0.06341 84909 5384 411882 0.92170 1833894 21.660 0.02007 0.09579 79525 7618 379633 0.88193 1422012 17.965 0.03099 0.14427 71907 10374 334810 0.82361 1042380 14.570 0.04783 0.21433 61533 13188 275754 0.74166 707570 11.575 0.07348 0.31084 48345 15028 204516 0.63341 431816 8.980 0.11188 0.43500 33317 14493 129542 0.43008 (3) 227300 6.885 0.19256 ... 18824 18824 97758 ... 97758 5.2
Matale District ‐ Female
Age nmx nqx lx ndx nLx nSx Tx ex
0 0.00776 0.00770 100000 770 99286 0.99123 (1) 7750992 77.51 0.00060 0.00239 99230 237 396330 0.99780 (2) 7651705 77.15 0.00035 0.00177 98993 175 494526 0.99787 7255375 73.310 0.00050 0.00249 98818 246 493473 0.99717 6760849 68.415 0.00066 0.00328 98572 323 492075 0.99650 6267376 63.620 0.00074 0.00367 98248 361 490351 0.99624 5775301 58.825 0.00077 0.00384 97888 376 488507 0.99605 5284950 54.030 0.00082 0.00410 97512 400 486578 0.99560 4796443 49.235 0.00096 0.00481 97112 467 484435 0.99448 4309866 44.440 0.00129 0.00643 96645 621 481760 0.99212 3825430 39.645 0.00194 0.00968 96023 930 477965 0.98757 3343670 34.850 0.00319 0.01581 95094 1503 472025 0.97917 2865706 30.155 0.00546 0.02697 93591 2524 462192 0.96408 2393681 25.660 0.00957 0.04684 91066 4266 445589 0.93753 1931489 21.265 0.01693 0.08149 86801 7073 417753 0.89205 1485900 17.170 0.02998 0.14012 79727 11171 372658 0.81726 1068147 13.475 0.05281 0.23459 68556 16083 304558 0.70272 695489 10.180 0.09190 0.37484 52473 19669 214019 0.45254 (3) 390931 7.585 0.18543 ... 32804 32804 176912 ... 176912 5.4
(1) Value given is for survivorship of 5 cohorts of birth to age group 0‐4 = 5L0/500000(2) Value given is for 5S0=5L5/5L0(3) Value given is 5S80+=T85/T80
30

Nuwara Eliya District ‐ Male
Age nmx nqx lx ndx nLx nSx Tx ex
0 0.01601 0.01578 100000 1578 98561 0.98307 (1) 7075207 70.81 0.00076 0.00302 98422 297 392976 0.99726 (2) 6976647 70.95 0.00035 0.00177 98125 174 490190 0.99816 6583670 67.110 0.00038 0.00191 97951 187 489288 0.99723 6093481 62.215 0.00081 0.00402 97764 393 487934 0.99482 5604193 57.320 0.00125 0.00622 97371 606 485407 0.99340 5116260 52.525 0.00137 0.00684 96765 662 482201 0.99278 4630853 47.930 0.00156 0.00776 96103 746 478719 0.99101 4148652 43.235 0.00213 0.01058 95358 1009 474416 0.98694 3669934 38.540 0.00324 0.01607 94349 1516 468220 0.97974 3195518 33.945 0.00511 0.02523 92833 2342 458732 0.96804 2727298 29.450 0.00813 0.03988 90490 3609 444069 0.94955 2268566 25.155 0.01295 0.06286 86882 5461 421667 0.92083 1824497 21.060 0.02062 0.09835 81420 8008 388286 0.87709 1402830 17.265 0.03275 0.15191 73413 11152 340560 0.81240 1014544 13.870 0.05175 0.22998 62261 14319 276671 0.72099 673984 10.875 0.08120 0.33784 47942 16197 199477 0.60080 397313 8.380 0.12588 0.47524 31745 15087 119847 0.39421 (3) 197836 6.285 0.21360 ... 16659 16659 77990 ... 77990 4.7
Nuwara Eliya District ‐ Female
Age nmx nqx lx ndx nLx nSx Tx ex
0 0.01260 0.01246 100000 1246 98863 0.98634 (1) 7467321 74.71 0.00072 0.00288 98754 284 394306 0.99754 (2) 7368458 74.65 0.00032 0.00160 98470 158 491954 0.99833 6974152 70.810 0.00035 0.00174 98312 171 491133 0.99739 6482198 65.915 0.00076 0.00380 98141 373 489849 0.99562 5991065 61.020 0.00094 0.00467 97768 457 487705 0.99560 5501216 56.325 0.00082 0.00408 97311 397 485558 0.99589 5013512 51.530 0.00087 0.00432 96914 419 483560 0.99493 4527954 46.735 0.00122 0.00608 96496 587 481109 0.99233 4044395 41.940 0.00193 0.00962 95909 923 477418 0.98762 3563286 37.245 0.00316 0.01567 94986 1488 471508 0.97974 3085868 32.550 0.00521 0.02572 93498 2405 461954 0.96676 2614359 28.055 0.00860 0.04216 91093 3840 446600 0.94567 2152405 23.660 0.01421 0.06879 87253 6002 422335 0.91188 1705806 19.665 0.02344 0.11111 81251 9028 385118 0.85909 1283471 15.870 0.03852 0.17646 72223 12744 330851 0.77976 898353 12.475 0.06289 0.27277 59478 16224 257983 0.66808 567503 9.580 0.10154 0.40460 43254 17501 172352 0.44316 (3) 309520 7.285 0.18775 ... 25754 25754 137167 ... 137167 5.3
(1) Value given is for survivorship of 5 cohorts of birth to age group 0‐4 = 5L0/500000(2) Value given is for 5S0=5L5/5L0(3) Value given is 5S80+=T85/T80
31

Galle District ‐ Male
Age nmx nqx lx ndx nLx nSx Tx ex
0 0.01514 0.01493 100000 1493 98635 0.98399 (1) 7047802 70.51 0.00071 0.00283 98507 279 393361 0.99720 (2) 6949167 70.55 0.00043 0.00213 98228 209 490618 0.99754 6555806 66.710 0.00056 0.00280 98019 274 489409 0.99641 6065188 61.915 0.00096 0.00477 97745 466 487651 0.99394 5575779 57.020 0.00150 0.00745 97278 725 484696 0.99110 5088128 52.325 0.00209 0.01040 96554 1004 480381 0.98800 4603432 47.730 0.00276 0.01369 95549 1308 474617 0.98434 4123051 43.235 0.00360 0.01784 94241 1681 467185 0.97941 3648434 38.740 0.00480 0.02373 92560 2196 457566 0.97218 3181248 34.445 0.00661 0.03254 90364 2940 444837 0.96128 2723683 30.150 0.00938 0.04588 87423 4011 427614 0.94483 2278846 26.155 0.01362 0.06596 83412 5502 404022 0.92027 1851232 22.260 0.02006 0.09574 77910 7459 371809 0.88428 1447210 18.665 0.02979 0.13902 70451 9794 328782 0.83282 1075401 15.370 0.04435 0.20020 60657 12144 273815 0.76168 746620 12.375 0.06593 0.28345 48514 13751 208558 0.66802 472805 9.780 0.09750 0.39078 34762 13584 139321 0.47276 (3) 264247 7.685 0.16952 ... 21178 21178 124926 ... 124926 5.9
Galle District ‐ Female
Age nmx nqx lx ndx nLx nSx Tx ex
0 0.01194 0.01181 100000 1181 98920 0.98739 (1) 7835089 78.41 0.00051 0.00204 98819 202 394773 0.99795 (2) 7736169 78.35 0.00033 0.00164 98617 162 492683 0.99825 7341396 74.410 0.00037 0.00187 98456 184 491818 0.99797 6848713 69.615 0.00045 0.00226 98272 222 490820 0.99752 6356895 64.720 0.00054 0.00271 98049 266 489603 0.99703 5866076 59.825 0.00065 0.00324 97784 317 488151 0.99643 5376473 55.030 0.00079 0.00394 97467 384 486408 0.99558 4888322 50.235 0.00100 0.00497 97083 483 484260 0.99426 4401914 45.340 0.00133 0.00665 96600 642 481482 0.99204 3917653 40.645 0.00192 0.00954 95958 915 477650 0.98814 3436172 35.850 0.00296 0.01469 95043 1396 471984 0.98114 2958522 31.155 0.00485 0.02396 93646 2244 463082 0.96852 2486538 26.660 0.00829 0.04069 91403 3719 448505 0.94588 2023456 22.165 0.01459 0.07058 87683 6189 424233 0.90595 1574951 18.070 0.02604 0.12281 81495 10008 384334 0.83790 1150718 14.175 0.04667 0.21022 71486 15028 322034 0.72925 766384 10.780 0.08310 0.34565 56459 19515 234845 0.47149 (3) 444350 7.985 0.17634 ... 36944 36944 209505 ... 209505 5.7
(1) Value given is for survivorship of 5 cohorts of birth to age group 0‐4 = 5L0/500000(2) Value given is for 5S0=5L5/5L0(3) Value given is 5S80+=T85/T80
32

Matara District ‐ Male
Age nmx nqx lx ndx nLx nSx Tx ex
0 0.01246 0.01232 100000 1232 98864 0.98709 (1) 7347166 73.51 0.00042 0.00166 98768 164 394681 0.99840 (2) 7248302 73.45 0.00021 0.00107 98604 106 492756 0.99862 6853621 69.510 0.00034 0.00169 98499 166 492077 0.99741 6360865 64.615 0.00080 0.00397 98332 390 490800 0.99451 5868788 59.720 0.00142 0.00706 97942 691 488107 0.99155 5377988 54.925 0.00196 0.00974 97250 947 483982 0.98918 4889880 50.330 0.00238 0.01185 96303 1141 478744 0.98709 4405898 45.835 0.00283 0.01407 95162 1339 472562 0.98439 3927154 41.340 0.00351 0.01742 93823 1634 465188 0.97997 3454592 36.845 0.00468 0.02315 92188 2134 455871 0.97243 2989404 32.450 0.00667 0.03283 90054 2956 443304 0.95994 2533533 28.155 0.00995 0.04862 87098 4235 425544 0.93993 2090229 24.060 0.01524 0.07357 82863 6096 399980 0.90882 1664685 20.165 0.02363 0.11191 76767 8591 363511 0.86189 1264705 16.570 0.03678 0.16904 68176 11524 313306 0.79356 901194 13.275 0.05716 0.25086 56651 14212 248627 0.69913 587888 10.480 0.08826 0.36148 42440 15341 173823 0.48764 (3) 339261 8.085 0.16380 ... 27099 27099 165438 ... 165438 6.1
Matara District ‐ Female
Age nmx nqx lx ndx nLx nSx Tx ex
0 0.00932 0.00924 100000 924 99148 0.99028 (1) 8035853 80.41 0.00032 0.00126 99076 125 395993 0.99866 (2) 7936706 80.15 0.00023 0.00113 98951 112 494476 0.99862 7540713 76.210 0.00033 0.00163 98839 161 493794 0.99786 7046236 71.315 0.00057 0.00284 98678 280 492738 0.99668 6552442 66.420 0.00074 0.00370 98398 364 491103 0.99616 6059704 61.625 0.00078 0.00390 98034 382 489217 0.99611 5568601 56.830 0.00078 0.00389 97652 380 487313 0.99601 5079384 52.035 0.00084 0.00418 97272 407 485367 0.99537 4592071 47.240 0.00105 0.00523 96865 507 483121 0.99372 4106704 42.445 0.00153 0.00761 96359 733 480087 0.99033 3623583 37.650 0.00246 0.01221 95625 1168 475445 0.98402 3143495 32.955 0.00415 0.02057 94458 1943 467848 0.97276 2668051 28.260 0.00718 0.03533 92515 3269 455105 0.95311 2200203 23.865 0.01253 0.06089 89246 5434 433765 0.91953 1745098 19.670 0.02189 0.10417 83812 8731 398859 0.86381 1311333 15.675 0.03812 0.17495 75081 13135 344539 0.77590 912474 12.280 0.06588 0.28429 61946 17611 267328 0.52930 (3) 567934 9.285 0.14749 ... 44335 44335 300607 ... 300607 6.8
(1) Value given is for survivorship of 5 cohorts of birth to age group 0‐4 = 5L0/500000(2) Value given is for 5S0=5L5/5L0(3) Value given is 5S80+=T85/T80
33

Hambantota District ‐ Male
Age nmx nqx lx ndx nLx nSx Tx ex
0 0.00395 0.00394 100000 394 99627 0.99531 (1) 7689159 76.91 0.00042 0.00168 99606 167 398029 0.99839 (2) 7589532 76.25 0.00027 0.00136 99439 135 496855 0.99857 7191503 72.310 0.00030 0.00151 99303 150 496142 0.99775 6694648 67.415 0.00069 0.00342 99153 339 495027 0.99492 6198506 62.520 0.00139 0.00692 98814 684 492510 0.99155 5703479 57.725 0.00196 0.00975 98131 957 488349 0.98954 5210969 53.130 0.00220 0.01093 97174 1062 483243 0.98885 4722620 48.635 0.00228 0.01136 96112 1092 477854 0.98819 4239377 44.140 0.00251 0.01246 95020 1184 472211 0.98621 3761523 39.645 0.00313 0.01553 93836 1457 465700 0.98160 3289313 35.150 0.00444 0.02196 92379 2029 457132 0.97280 2823612 30.655 0.00681 0.03354 90350 3030 444697 0.95757 2366480 26.260 0.01088 0.05307 87320 4634 425827 0.93247 1921783 22.065 0.01765 0.08475 82686 7008 397069 0.89251 1495956 18.170 0.02873 0.13456 75678 10183 354386 0.83107 1098887 14.575 0.04669 0.20996 65495 13751 294520 0.74126 744501 11.480 0.07534 0.31789 51743 16449 218317 0.51483 (3) 449981 8.785 0.15235 ... 35295 35295 231664 ... 231664 6.6
Hambantota District ‐ Female
Age nmx nqx lx ndx nLx nSx Tx ex
0 0.00303 0.00302 100000 302 99716 0.99620 (1) 8231429 82.31 0.00041 0.00164 99698 164 398386 0.99863 (2) 8131713 81.65 0.00020 0.00101 99534 101 497421 0.99904 7733326 77.710 0.00018 0.00090 99434 89 496946 0.99889 7235905 72.815 0.00028 0.00141 99344 140 496396 0.99827 6738959 67.820 0.00041 0.00203 99204 201 495538 0.99782 6242563 62.925 0.00045 0.00227 99003 225 494460 0.99769 5747025 58.030 0.00047 0.00235 98778 232 493319 0.99753 5252565 53.235 0.00053 0.00266 98546 262 492099 0.99693 4759247 48.340 0.00073 0.00362 98284 356 490587 0.99546 4267148 43.445 0.00115 0.00571 97928 559 488357 0.99249 3776561 38.650 0.00195 0.00972 97369 946 484692 0.98698 3288204 33.855 0.00344 0.01705 96423 1644 478383 0.97703 2803512 29.160 0.00612 0.03018 94779 2860 467395 0.95937 2325129 24.565 0.01093 0.05334 91918 4903 448407 0.92857 1857734 20.270 0.01953 0.09343 87015 8130 416378 0.87626 1409327 16.275 0.03472 0.16060 78885 12669 364855 0.79162 992948 12.680 0.06123 0.26706 66216 17684 288828 0.54015 (3) 628094 9.585 0.14305 ... 48533 48533 339266 ... 339266 7.0
(1) Value given is for survivorship of 5 cohorts of birth to age group 0‐4 = 5L0/500000(2) Value given is for 5S0=5L5/5L0(3) Value given is 5S80+=T85/T80
34
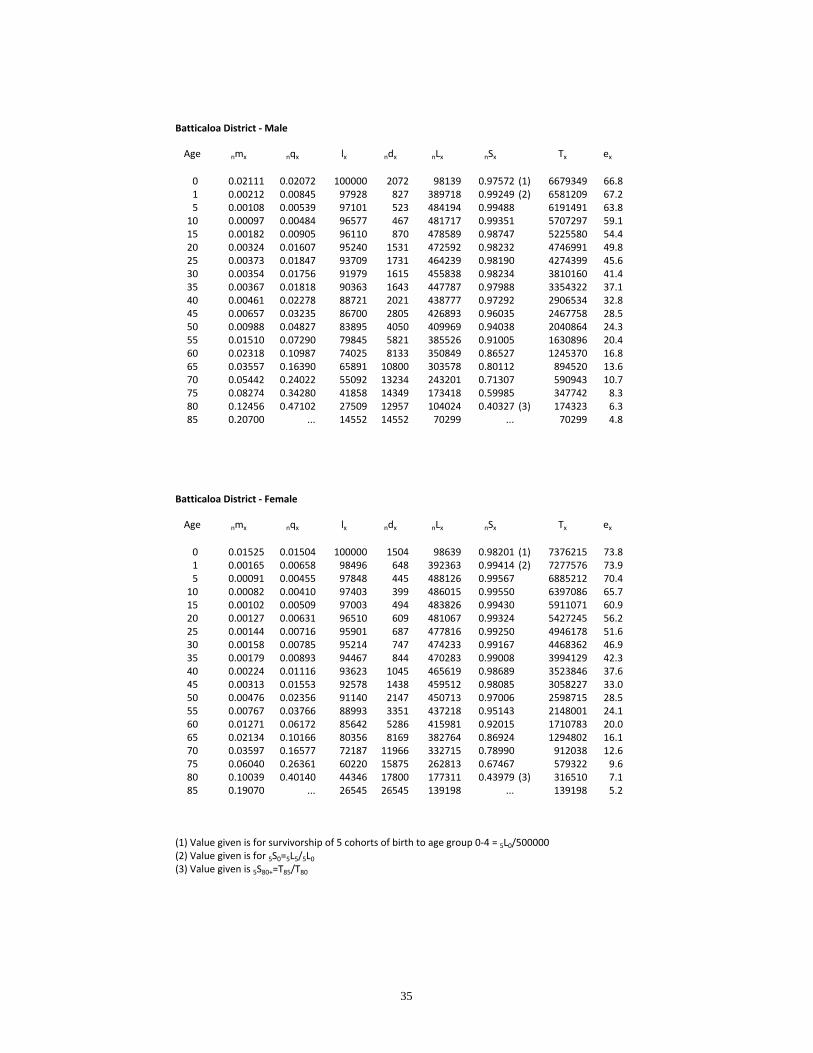
Batticaloa District ‐ Male
Age nmx nqx lx ndx nLx nSx Tx ex
0 0.02111 0.02072 100000 2072 98139 0.97572 (1) 6679349 66.81 0.00212 0.00845 97928 827 389718 0.99249 (2) 6581209 67.25 0.00108 0.00539 97101 523 484194 0.99488 6191491 63.810 0.00097 0.00484 96577 467 481717 0.99351 5707297 59.115 0.00182 0.00905 96110 870 478589 0.98747 5225580 54.420 0.00324 0.01607 95240 1531 472592 0.98232 4746991 49.825 0.00373 0.01847 93709 1731 464239 0.98190 4274399 45.630 0.00354 0.01756 91979 1615 455838 0.98234 3810160 41.435 0.00367 0.01818 90363 1643 447787 0.97988 3354322 37.140 0.00461 0.02278 88721 2021 438777 0.97292 2906534 32.845 0.00657 0.03235 86700 2805 426893 0.96035 2467758 28.550 0.00988 0.04827 83895 4050 409969 0.94038 2040864 24.355 0.01510 0.07290 79845 5821 385526 0.91005 1630896 20.460 0.02318 0.10987 74025 8133 350849 0.86527 1245370 16.865 0.03557 0.16390 65891 10800 303578 0.80112 894520 13.670 0.05442 0.24022 55092 13234 243201 0.71307 590943 10.775 0.08274 0.34280 41858 14349 173418 0.59985 347742 8.380 0.12456 0.47102 27509 12957 104024 0.40327 (3) 174323 6.385 0.20700 ... 14552 14552 70299 ... 70299 4.8
Batticaloa District ‐ Female
Age nmx nqx lx ndx nLx nSx Tx ex
0 0.01525 0.01504 100000 1504 98639 0.98201 (1) 7376215 73.81 0.00165 0.00658 98496 648 392363 0.99414 (2) 7277576 73.95 0.00091 0.00455 97848 445 488126 0.99567 6885212 70.410 0.00082 0.00410 97403 399 486015 0.99550 6397086 65.715 0.00102 0.00509 97003 494 483826 0.99430 5911071 60.920 0.00127 0.00631 96510 609 481067 0.99324 5427245 56.225 0.00144 0.00716 95901 687 477816 0.99250 4946178 51.630 0.00158 0.00785 95214 747 474233 0.99167 4468362 46.935 0.00179 0.00893 94467 844 470283 0.99008 3994129 42.340 0.00224 0.01116 93623 1045 465619 0.98689 3523846 37.645 0.00313 0.01553 92578 1438 459512 0.98085 3058227 33.050 0.00476 0.02356 91140 2147 450713 0.97006 2598715 28.555 0.00767 0.03766 88993 3351 437218 0.95143 2148001 24.160 0.01271 0.06172 85642 5286 415981 0.92015 1710783 20.065 0.02134 0.10166 80356 8169 382764 0.86924 1294802 16.170 0.03597 0.16577 72187 11966 332715 0.78990 912038 12.675 0.06040 0.26361 60220 15875 262813 0.67467 579322 9.680 0.10039 0.40140 44346 17800 177311 0.43979 (3) 316510 7.185 0.19070 ... 26545 26545 139198 ... 139198 5.2
(1) Value given is for survivorship of 5 cohorts of birth to age group 0‐4 = 5L0/500000(2) Value given is for 5S0=5L5/5L0(3) Value given is 5S80+=T85/T80
35

Ampara District ‐ Male
Age nmx nqx lx ndx nLx nSx Tx ex
0 0.00784 0.00778 100000 778 99272 0.99043 (1) 7028504 70.31 0.00101 0.00402 99222 399 395942 0.99649 (2) 6929231 69.85 0.00052 0.00259 98823 256 493476 0.99746 6533289 66.110 0.00050 0.00248 98567 244 492225 0.99661 6039813 61.315 0.00096 0.00480 98323 472 490556 0.99332 5547588 56.420 0.00174 0.00864 97851 845 487277 0.99022 5057032 51.725 0.00213 0.01059 97005 1027 482510 0.98909 4569755 47.130 0.00225 0.01120 95978 1075 477243 0.98807 4087245 42.635 0.00261 0.01296 94903 1230 471551 0.98500 3610002 38.040 0.00355 0.01760 93673 1649 464478 0.97842 3138451 33.545 0.00535 0.02640 92025 2429 454457 0.96687 2673973 29.150 0.00839 0.04113 89595 3685 439399 0.94810 2219516 24.855 0.01332 0.06461 85910 5551 416593 0.91865 1780116 20.760 0.02123 0.10109 80359 8124 382702 0.87363 1363523 17.065 0.03376 0.15625 72236 11287 334340 0.80702 980821 13.670 0.05346 0.23665 60949 14424 269820 0.71303 646481 10.675 0.08402 0.34744 46525 16165 192390 0.59002 376661 8.180 0.13044 0.48770 30361 14807 113514 0.38399 (3) 184271 6.185 0.21982 ... 15554 15554 70757 ... 70757 4.5
Ampara District ‐ Female
Age nmx nqx lx ndx nLx nSx Tx ex
0 0.00521 0.00518 100000 518 99516 0.99284 (1) 7589083 75.91 0.00104 0.00415 99482 413 396902 0.99674 (2) 7489567 75.35 0.00044 0.00220 99069 218 494801 0.99792 7092664 71.610 0.00039 0.00196 98851 194 493772 0.99771 6597864 66.715 0.00054 0.00272 98657 268 492642 0.99704 6104092 61.920 0.00063 0.00313 98389 308 491184 0.99687 5611450 57.025 0.00062 0.00310 98081 304 489648 0.99686 5120266 52.230 0.00065 0.00325 97777 318 488110 0.99637 4630618 47.435 0.00083 0.00416 97459 405 486339 0.99488 4142508 42.540 0.00127 0.00635 97054 616 483848 0.99172 3656169 37.745 0.00214 0.01067 96438 1029 479843 0.98575 3172321 32.950 0.00376 0.01864 95409 1778 473005 0.97491 2692478 28.255 0.00669 0.03296 93630 3086 461137 0.95565 2219473 23.760 0.01196 0.05821 90544 5271 440688 0.92212 1758337 19.465 0.02137 0.10182 85274 8683 406366 0.86539 1317649 15.570 0.03801 0.17451 76591 13366 351665 0.77410 911283 11.975 0.06701 0.28850 63225 18240 272224 0.63974 559618 8.980 0.11618 0.44979 44985 20234 174152 0.39403 (3) 287394 6.485 0.21857 ... 24751 24751 113242 ... 113242 4.6
(1) Value given is for survivorship of 5 cohorts of birth to age group 0‐4 = 5L0/500000(2) Value given is for 5S0=5L5/5L0(3) Value given is 5S80+=T85/T80
36

Tricomalee District ‐ Male
Age nmx nqx lx ndx nLx nSx Tx ex
0 0.00422 0.00420 100000 420 99603 0.99416 (1) 6852855 68.51 0.00090 0.00359 99580 357 397476 0.99671 (2) 6753252 67.85 0.00054 0.00269 99223 267 495445 0.99717 6355776 64.110 0.00059 0.00297 98956 294 494043 0.99530 5860330 59.215 0.00150 0.00750 98662 740 491721 0.98825 5366287 54.420 0.00330 0.01640 97922 1606 485941 0.98049 4874566 49.825 0.00438 0.02169 96316 2089 476461 0.97802 4388626 45.630 0.00439 0.02171 94227 2046 465991 0.97866 3912165 41.535 0.00428 0.02118 92181 1952 456047 0.97776 3446174 37.440 0.00485 0.02396 90229 2162 445904 0.97255 2990127 33.145 0.00648 0.03191 88067 2810 433664 0.96149 2544223 28.950 0.00950 0.04645 85257 3960 416964 0.94285 2110559 24.855 0.01442 0.06974 81296 5670 393136 0.91397 1693595 20.860 0.02212 0.10511 75627 7949 359314 0.87096 1300459 17.265 0.03398 0.15711 67678 10633 312948 0.80904 941145 13.970 0.05203 0.23092 57045 13173 253187 0.72358 628197 11.075 0.07920 0.33074 43872 14510 183202 0.61286 375010 8.580 0.11941 0.45661 29362 13407 112277 0.41464 (3) 191808 6.585 0.20061 ... 15955 15955 79531 ... 79531 5.0
Trincomalee District ‐ Female
Age nmx nqx lx ndx nLx nSx Tx ex
0 0.00281 0.00280 100000 280 99736 0.99532 (1) 7422991 74.21 0.00097 0.00387 99720 386 397923 0.99656 (2) 7323255 73.45 0.00058 0.00291 99334 289 495948 0.99714 6925332 69.710 0.00056 0.00281 99045 278 494529 0.99695 6429385 64.915 0.00068 0.00339 98767 335 493023 0.99625 5934855 60.120 0.00083 0.00412 98432 406 491175 0.99551 5441832 55.325 0.00097 0.00486 98026 476 488972 0.99474 4950657 50.530 0.00115 0.00571 97550 557 486398 0.99371 4461685 45.735 0.00140 0.00699 96993 678 483337 0.99197 3975287 41.040 0.00187 0.00931 96315 897 479456 0.98873 3491950 36.345 0.00276 0.01369 95418 1306 474053 0.98261 3012494 31.650 0.00444 0.02196 94112 2067 465811 0.97113 2538441 27.055 0.00761 0.03740 92045 3442 452366 0.94995 2072630 22.560 0.01354 0.06566 88603 5818 429723 0.91179 1620264 18.365 0.02450 0.11597 82785 9601 391815 0.84561 1190541 14.470 0.04453 0.20158 73185 14753 331321 0.73831 798726 10.975 0.08031 0.33622 58432 19646 244617 0.58661 467404 8.080 0.13627 0.50415 38786 19554 143496 0.35591 (3) 222787 5.785 0.24255 ... 19232 19232 79292 ... 79292 4.1
(1) Value given is for survivorship of 5 cohorts of birth to age group 0‐4 = 5L0/500000(2) Value given is for 5S0=5L5/5L0(3) Value given is 5S80+=T85/T80
37

Kurunegala District ‐ Male
Age nmx nqx lx ndx nLx nSx Tx ex
0 0.01566 0.01544 100000 1544 98590 0.98383 (1) 6893270 68.91 0.00053 0.00211 98456 208 393327 0.99770 (2) 6794680 69.05 0.00037 0.00185 98248 182 490787 0.99797 6401353 65.210 0.00044 0.00222 98066 218 489788 0.99703 5910566 60.315 0.00083 0.00416 97849 407 488333 0.99414 5420778 55.420 0.00158 0.00785 97442 765 485473 0.98977 4932445 50.625 0.00257 0.01278 96677 1236 480508 0.98449 4446972 46.030 0.00370 0.01833 95441 1749 473056 0.97874 3966464 41.635 0.00492 0.02430 93692 2277 462997 0.97244 3493408 37.340 0.00630 0.03105 91415 2838 450235 0.96491 3030411 33.145 0.00807 0.03959 88577 3507 434437 0.95479 2580175 29.150 0.01060 0.05168 85070 4396 414797 0.93989 2145738 25.255 0.01449 0.07002 80674 5649 389863 0.91690 1730941 21.560 0.02070 0.09863 75025 7400 357464 0.88112 1341078 17.965 0.03071 0.14303 67625 9672 314969 0.82644 983614 14.570 0.04679 0.21015 57953 12179 260303 0.74604 668645 11.575 0.07233 0.30686 45774 14046 194196 0.63512 408342 8.980 0.11217 0.43606 31728 13835 123338 0.42405 (3) 214146 6.785 0.19704 ... 17893 17893 90808 ... 90808 5.1
Kurunegala District ‐ Female
Age nmx nqx lx ndx nLx nSx Tx ex
0 0.01123 0.01112 100000 1112 98981 0.98834 (1) 7800294 78.01 0.00037 0.00148 98888 146 395187 0.99855 (2) 7701314 77.95 0.00021 0.00105 98742 104 493449 0.99867 7306127 74.010 0.00032 0.00161 98638 159 492793 0.99805 6812678 69.115 0.00049 0.00243 98479 239 491831 0.99719 6319885 64.220 0.00064 0.00318 98240 312 490447 0.99650 5828053 59.325 0.00076 0.00381 97927 373 488729 0.99590 5337606 54.530 0.00088 0.00440 97554 429 486725 0.99524 4848877 49.735 0.00104 0.00517 97125 502 484410 0.99424 4362152 44.940 0.00130 0.00647 96623 625 481621 0.99245 3877742 40.145 0.00178 0.00888 95998 852 477987 0.98904 3396121 35.450 0.00273 0.01354 95145 1288 472750 0.98248 2918135 30.755 0.00454 0.02248 93857 2110 464466 0.96995 2445385 26.160 0.00804 0.03946 91747 3620 450510 0.94642 1980919 21.665 0.01470 0.07110 88127 6266 426373 0.90332 1530409 17.470 0.02728 0.12835 81861 10507 385152 0.82768 1104036 13.575 0.05072 0.22658 71354 16167 318784 0.70523 718883 10.180 0.09326 0.37990 55187 20965 224816 0.43810 (3) 400099 7.285 0.19523 ... 34221 34221 175283 ... 175283 5.1
(1) Value given is for survivorship of 5 cohorts of birth to age group 0‐4 = 5L0/500000(2) Value given is for 5S0=5L5/5L0(3) Value given is 5S80+=T85/T80
38

Puttalam District ‐ Male
Age nmx nqx lx ndx nLx nSx Tx ex
0 0.00795 0.00789 100000 789 99262 0.99128 (1) 6905721 69.11 0.00049 0.00197 99211 195 396379 0.99816 (2) 6806459 68.65 0.00028 0.00141 99015 140 494727 0.99822 6410080 64.710 0.00043 0.00216 98876 213 493845 0.99740 5915353 59.815 0.00066 0.00328 98662 323 492561 0.99591 5421508 55.020 0.00102 0.00507 98339 498 490547 0.99342 4928947 50.125 0.00169 0.00843 97841 825 487319 0.98890 4438400 45.430 0.00289 0.01437 97016 1394 481912 0.98035 3951081 40.735 0.00515 0.02542 95623 2431 472444 0.97039 3469169 36.340 0.00683 0.03362 93191 3133 458457 0.96104 2996725 32.245 0.00917 0.04488 90058 4042 440593 0.94848 2538268 28.250 0.01214 0.05899 86016 5074 417892 0.93151 2097675 24.455 0.01656 0.07966 80942 6448 389270 0.90521 1679783 20.860 0.02375 0.11236 74494 8370 352373 0.86789 1290512 17.365 0.03374 0.15602 66124 10317 305821 0.80732 938139 14.270 0.05277 0.23346 55808 13029 246895 0.74203 632319 11.375 0.06697 0.28680 42779 12269 183204 0.66308 385424 9.080 0.10237 0.40759 30510 12436 121480 0.39927 (3) 202219 6.685 0.22386 ... 18074 18074 80739 ... 80739 4.5
Puttalam District ‐ Female
Age nmx nqx lx ndx nLx nSx Tx ex
0 0.00752 0.00747 100000 747 99307 0.99156 (1) 7892535 78.91 0.00055 0.00218 99253 216 396474 0.99811 (2) 7793227 78.55 0.00028 0.00138 99037 137 494841 0.99875 7396754 74.710 0.00022 0.00111 98900 110 494225 0.99851 6901912 69.815 0.00040 0.00199 98790 197 493487 0.99786 6407687 64.920 0.00043 0.00217 98594 214 492430 0.99800 5914200 60.025 0.00038 0.00188 98380 185 491445 0.99777 5421770 55.130 0.00055 0.00274 98195 269 490346 0.99657 4930325 50.235 0.00085 0.00426 97926 417 488664 0.99457 4439979 45.340 0.00137 0.00682 97508 665 486011 0.99122 3951315 40.545 0.00223 0.01110 96843 1075 481746 0.98566 3465304 35.850 0.00367 0.01818 95768 1741 474838 0.97649 2983558 31.255 0.00605 0.02983 94027 2805 463676 0.96146 2508720 26.760 0.01000 0.04888 91223 4459 445806 0.93709 2045044 22.465 0.01653 0.07959 86764 6906 417759 0.89827 1599237 18.470 0.02726 0.12808 79858 10228 375261 0.83818 1181479 14.875 0.04475 0.20213 69630 14074 314536 0.74947 806218 11.680 0.07289 0.30928 55556 17182 235734 0.52055 (3) 491682 8.985 0.14993 ... 38373 38373 255947 ... 255947 6.7
(1) Value given is for survivorship of 5 cohorts of birth to age group 0‐4 = 5L0/500000(2) Value given is for 5S0=5L5/5L0(3) Value given is 5S80+=T85/T80
39

Anuradhapura District ‐ Male
Age nmx nqx lx ndx nLx nSx Tx ex
0 0.02153 0.02112 100000 2112 98106 0.97746 (1) 6646284 66.51 0.00099 0.00394 97888 386 390622 0.99633 (2) 6548178 66.95 0.00047 0.00236 97502 230 486936 0.99742 6157556 63.210 0.00056 0.00280 97272 272 485680 0.99626 5670619 58.315 0.00104 0.00520 97000 504 483864 0.99286 5184939 53.520 0.00188 0.00934 96495 901 480409 0.98830 4701075 48.725 0.00284 0.01412 95594 1350 474789 0.98348 4220666 44.230 0.00383 0.01896 94244 1787 466945 0.97844 3745877 39.735 0.00493 0.02435 92458 2251 456878 0.97227 3278932 35.540 0.00641 0.03157 90206 2848 444208 0.96342 2822054 31.345 0.00866 0.04240 87358 3704 427960 0.94989 2377846 27.250 0.01217 0.05914 83654 4947 406513 0.92906 1949887 23.355 0.01766 0.08476 78707 6671 377675 0.89761 1543373 19.660 0.02615 0.12304 72036 8863 339005 0.85143 1165699 16.265 0.03908 0.17856 63173 11280 288639 0.78596 826694 13.170 0.05856 0.25601 51892 13285 226860 0.69736 538055 10.475 0.08750 0.35853 38607 13842 158202 0.58510 311195 8.180 0.12968 0.48468 24766 12003 92564 0.39498 (3) 152993 6.285 0.21119 ... 12762 12762 60429 ... 60429 4.7
Anuradhapura District ‐ Female
Age nmx nqx lx ndx nLx nSx Tx ex
0 0.01780 0.01752 100000 1752 98428 0.98125 (1) 7608088 76.11 0.00081 0.00323 98248 317 392197 0.99690 (2) 7509660 76.45 0.00045 0.00225 97931 220 489102 0.99776 7117463 72.710 0.00045 0.00223 97710 218 488007 0.99731 6628361 67.815 0.00067 0.00334 97492 326 486692 0.99615 6140354 63.020 0.00086 0.00429 97167 417 484819 0.99553 5653662 58.225 0.00092 0.00458 96750 443 482651 0.99535 5168843 53.430 0.00095 0.00476 96307 458 480406 0.99491 4686192 48.735 0.00111 0.00555 95848 532 477963 0.99356 4205787 43.940 0.00152 0.00758 95316 722 474885 0.99061 3727824 39.145 0.00234 0.01162 94594 1099 470427 0.98508 3252939 34.450 0.00382 0.01893 93495 1770 463407 0.97533 2782512 29.855 0.00641 0.03159 91725 2898 451974 0.95864 2319104 25.360 0.01089 0.05310 88827 4717 433281 0.93065 1867130 21.065 0.01854 0.08888 84111 7476 403231 0.88482 1433849 17.070 0.03153 0.14681 76635 11251 356786 0.81251 1030617 13.475 0.05335 0.23654 65384 15466 289891 0.70540 673832 10.380 0.08932 0.36591 49918 18266 204490 0.46739 (3) 383940 7.785 0.17639 ... 31653 31653 179450 ... 179450 5.7
(1) Value given is for survivorship of 5 cohorts of birth to age group 0‐4 = 5L0/500000(2) Value given is for 5S0=5L5/5L0(3) Value given is 5S80+=T85/T80
40

Polonnaruwa District ‐ Male
Age nmx nqx lx ndx nLx nSx Tx ex
0 0.01419 0.01401 100000 1401 98715 0.98484 (1) 6959776 69.61 0.00074 0.00294 98599 290 393703 0.99740 (2) 6861061 69.65 0.00033 0.00166 98309 163 491138 0.99817 6467358 65.810 0.00040 0.00200 98146 196 490239 0.99701 5976220 60.915 0.00092 0.00457 97950 448 488771 0.99324 5485981 56.020 0.00185 0.00919 97502 896 485466 0.98867 4997210 51.325 0.00267 0.01327 96606 1282 479965 0.98534 4511744 46.730 0.00320 0.01589 95324 1515 472927 0.98291 4031779 42.335 0.00372 0.01842 93809 1728 464845 0.97960 3558852 37.940 0.00462 0.02283 92081 2102 455361 0.97349 3094007 33.645 0.00629 0.03098 89979 2788 443288 0.96270 2638646 29.350 0.00916 0.04482 87192 3908 426754 0.94506 2195358 25.255 0.01381 0.06686 83284 5568 403307 0.91762 1768604 21.260 0.02112 0.10058 77715 7817 370082 0.87645 1365297 17.665 0.03243 0.15050 69899 10520 324360 0.81677 995216 14.270 0.04973 0.22186 59379 13174 264927 0.73379 670856 11.375 0.07584 0.31909 46205 14744 194402 0.62536 405929 8.880 0.11461 0.44287 31462 13933 121571 0.42527 (3) 211527 6.785 0.19485 ... 17528 17528 89956 ... 89956 5.1
Polonnaruwa District ‐ Female
Age nmx nqx lx ndx nLx nSx Tx ex
0 0.01170 0.01158 100000 1158 98940 0.98778 (1) 7762041 77.61 0.00042 0.00169 98842 167 394951 0.99813 (2) 7663101 77.55 0.00033 0.00165 98675 163 492968 0.99821 7268150 73.710 0.00039 0.00193 98512 190 492085 0.99761 6775182 68.815 0.00061 0.00303 98322 298 490907 0.99654 6283097 63.920 0.00076 0.00381 98024 373 489207 0.99609 5792190 59.125 0.00079 0.00395 97651 386 487293 0.99602 5302983 54.330 0.00081 0.00405 97265 394 485355 0.99565 4815690 49.535 0.00096 0.00478 96871 463 483244 0.99441 4330335 44.740 0.00133 0.00662 96408 638 480544 0.99175 3847091 39.945 0.00206 0.01026 95770 983 476580 0.98677 3366547 35.250 0.00339 0.01683 94787 1595 470276 0.97798 2889967 30.555 0.00573 0.02829 93192 2636 459920 0.96279 2419691 26.060 0.00981 0.04796 90555 4343 442807 0.93700 1959771 21.665 0.01686 0.08112 86212 6994 414910 0.89416 1516964 17.670 0.02896 0.13564 79219 10745 370997 0.82544 1102054 13.975 0.04955 0.22158 68474 15172 306234 0.72169 731057 10.780 0.08392 0.34798 53301 18548 221005 0.47977 (3) 424823 8.085 0.17051 ... 34753 34753 203818 ... 203818 5.9
(1) Value given is for survivorship of 5 cohorts of birth to age group 0‐4 = 5L0/500000(2) Value given is for 5S0=5L5/5L0(3) Value given is 5S80+=T85/T80
41

Badulla District ‐ Male
Age nmx nqx lx ndx nLx nSx Tx ex
0 0.02631 0.02571 100000 2571 97728 0.97343 (1) 6889612 68.91 0.00077 0.00309 97429 301 388986 0.99686 (2) 6791884 69.75 0.00037 0.00186 97128 181 485188 0.99793 6402898 65.910 0.00046 0.00229 96947 222 484181 0.99664 5917710 61.015 0.00099 0.00495 96725 479 482557 0.99337 5433528 56.220 0.00166 0.00826 96246 795 479357 0.99084 4950972 51.425 0.00198 0.00985 95451 940 474964 0.98951 4471615 46.830 0.00226 0.01125 94511 1063 469980 0.98730 3996651 42.335 0.00293 0.01454 93448 1359 464011 0.98261 3526671 37.740 0.00421 0.02083 92089 1918 455942 0.97442 3062660 33.345 0.00632 0.03115 90171 2809 444281 0.96149 2606719 28.950 0.00963 0.04708 87362 4113 427170 0.94182 2162438 24.855 0.01471 0.07108 83249 5917 402315 0.91252 1735268 20.860 0.02245 0.10657 77332 8241 367119 0.86973 1332953 17.265 0.03418 0.15797 69091 10914 319293 0.80888 965834 14.070 0.05184 0.23014 58176 13389 258271 0.72566 646541 11.175 0.07815 0.32701 44788 14646 187415 0.61835 388270 8.780 0.11672 0.44878 30142 13527 115889 0.42302 (3) 200855 6.785 0.19554 ... 16615 16615 84966 ... 84966 5.1
Badulla District ‐ Female
Age nmx nqx lx ndx nLx nSx Tx ex
0 0.02058 0.02021 100000 2021 98203 0.97867 (1) 7543991 75.41 0.00080 0.00319 97979 313 391132 0.99699 (2) 7445789 76.05 0.00039 0.00193 97666 188 487861 0.99798 7054657 72.210 0.00042 0.00212 97478 207 486873 0.99706 6566796 67.415 0.00081 0.00405 97271 394 485444 0.99529 6079923 62.520 0.00103 0.00514 96877 498 483159 0.99497 5594479 57.725 0.00096 0.00481 96379 464 480727 0.99532 5111320 53.030 0.00093 0.00465 95916 446 478478 0.99496 4630593 48.335 0.00113 0.00564 95470 538 476066 0.99321 4152115 43.540 0.00166 0.00825 94931 783 472834 0.98955 3676049 38.745 0.00264 0.01311 94148 1234 467895 0.98311 3203215 34.050 0.00433 0.02142 92914 1990 459990 0.97227 2735319 29.455 0.00717 0.03525 90924 3205 447234 0.95439 2275329 25.060 0.01191 0.05795 87719 5083 426834 0.92535 1828095 20.865 0.01978 0.09455 82635 7813 394969 0.87922 1401261 17.070 0.03277 0.15210 74822 11380 347263 0.80841 1006292 13.475 0.05400 0.23894 63442 15159 280730 0.70586 659028 10.480 0.08811 0.36162 48283 17460 198157 0.47619 (3) 378298 7.885 0.17110 ... 30823 30823 180141 ... 180141 5.8
(1) Value given is for survivorship of 5 cohorts of birth to age group 0‐4 = 5L0/500000(2) Value given is for 5S0=5L5/5L0(3) Value given is 5S80+=T85/T80
42

Moneragala District ‐ Male
Age nmx nqx lx ndx nLx nSx Tx ex
0 0.00249 0.00248 100000 248 99764 0.99657 (1) 7522450 75.21 0.00052 0.00208 99752 207 398519 0.99819 (2) 7422686 74.45 0.00027 0.00137 99545 136 497382 0.99816 7024166 70.610 0.00046 0.00232 99408 231 496464 0.99698 6526785 65.715 0.00081 0.00404 99178 401 494963 0.99503 6030321 60.820 0.00118 0.00590 98777 583 492505 0.99319 5535357 56.025 0.00155 0.00772 98194 758 489150 0.99136 5042853 51.430 0.00192 0.00958 97436 933 484925 0.98936 4553703 46.735 0.00237 0.01179 96503 1138 479768 0.98677 4068778 42.240 0.00300 0.01488 95365 1419 473421 0.98290 3589010 37.645 0.00398 0.01971 93946 1852 465326 0.97666 3115589 33.250 0.00561 0.02767 92094 2548 454464 0.96628 2650264 28.855 0.00835 0.04095 89546 3667 439140 0.94899 2195800 24.560 0.01299 0.06306 85879 5416 416741 0.92046 1756660 20.565 0.02083 0.09932 80463 7992 383591 0.87437 1339919 16.770 0.03398 0.15725 72472 11396 335399 0.80261 956327 13.275 0.05577 0.24579 61076 15012 269194 0.69748 620928 10.280 0.09125 0.37193 46064 17133 187757 0.46620 (3) 351734 7.685 0.17644 ... 28931 28931 163977 ... 163977 5.7
Moneragala District ‐ Female
Age nmx nqx lx ndx nLx nSx Tx ex
0 0.00288 0.00287 100000 287 99730 0.99634 (1) 8053217 80.51 0.00042 0.00166 99713 166 398441 0.99851 (2) 7953488 79.85 0.00025 0.00123 99547 122 497431 0.99874 7555046 75.910 0.00026 0.00129 99425 128 496805 0.99820 7057615 71.015 0.00050 0.00251 99297 249 495910 0.99700 6560810 66.120 0.00067 0.00334 99048 331 494422 0.99679 6064900 61.225 0.00059 0.00297 98717 293 492834 0.99726 5570479 56.430 0.00051 0.00257 98424 253 491484 0.99733 5077644 51.635 0.00058 0.00289 98171 284 490173 0.99654 4586161 46.740 0.00084 0.00421 97887 412 488479 0.99458 4095988 41.845 0.00139 0.00693 97475 676 485830 0.99082 3607510 37.050 0.00240 0.01194 96799 1156 481368 0.98402 3121679 32.255 0.00422 0.02089 95643 1998 473677 0.97197 2640311 27.660 0.00746 0.03670 93645 3437 460401 0.95085 2166634 23.165 0.01324 0.06426 90209 5797 437774 0.91452 1706233 18.970 0.02346 0.11125 84412 9391 400352 0.85388 1268459 15.075 0.04136 0.18847 75021 14139 341852 0.75817 868107 11.680 0.07223 0.30747 60882 18719 259180 0.50750 (3) 526255 8.685 0.15787 ... 42163 42163 267075 ... 267075 6.3
(1) Value given is for survivorship of 5 cohorts of birth to age group 0‐4 = 5L0/500000(2) Value given is for 5S0=5L5/5L0(3) Value given is 5S80+=T85/T80
43

Ratnapura District ‐ Male
Age nmx nqx lx ndx nLx nSx Tx ex
0 0.01685 0.01660 100000 1660 98490 0.98263 (1) 7203878 72.01 0.00057 0.00226 98340 222 392827 0.99791 (2) 7105389 72.35 0.00024 0.00122 98118 120 490289 0.99847 6712561 68.410 0.00037 0.00185 97998 181 489537 0.99709 6222272 63.515 0.00091 0.00453 97817 443 488112 0.99370 5732735 58.620 0.00163 0.00810 97374 789 485038 0.99042 5244623 53.925 0.00219 0.01089 96585 1052 480391 0.98811 4759585 49.330 0.00258 0.01281 95533 1224 474679 0.98624 4279193 44.835 0.00299 0.01483 94309 1399 468145 0.98362 3804515 40.340 0.00368 0.01826 92911 1697 460478 0.97892 3336369 35.945 0.00496 0.02449 91214 2234 450772 0.97063 2875891 31.550 0.00716 0.03520 88980 3132 437533 0.95679 2425119 27.355 0.01080 0.05268 85848 4522 418629 0.93470 1987586 23.260 0.01666 0.08016 81326 6519 391293 0.90058 1568957 19.365 0.02592 0.12210 74807 9134 352390 0.84948 1177663 15.770 0.04038 0.18408 65673 12089 299349 0.77586 825273 12.675 0.06271 0.27180 53584 14564 232253 0.67557 525924 9.880 0.09662 0.38851 39020 15160 156903 0.46572 (3) 293671 7.585 0.17446 ... 23860 23860 136768 ... 136768 5.7
Ratnapura District ‐ Female
Age nmx nqx lx ndx nLx nSx Tx ex
0 0.01403 0.01385 100000 1385 98742 0.98541 (1) 7835603 78.41 0.00050 0.00201 98615 198 393965 0.99806 (2) 7736861 78.55 0.00027 0.00135 98417 133 491752 0.99866 7342896 74.610 0.00027 0.00133 98284 131 491093 0.99823 6851144 69.715 0.00048 0.00242 98153 238 490221 0.99697 6360052 64.820 0.00072 0.00359 97916 352 488734 0.99619 5869831 59.925 0.00078 0.00391 97564 381 486873 0.99610 5381096 55.230 0.00078 0.00390 97183 379 484974 0.99593 4894223 50.435 0.00087 0.00436 96804 422 482999 0.99498 4409249 45.540 0.00118 0.00590 96382 569 480573 0.99264 3926250 40.745 0.00184 0.00918 95813 880 477037 0.98810 3445677 36.050 0.00306 0.01521 94933 1444 471361 0.98000 2968640 31.355 0.00522 0.02579 93489 2411 461933 0.96597 2497279 26.760 0.00897 0.04395 91078 4003 446215 0.94214 2035346 22.365 0.01545 0.07460 87075 6496 420398 0.90249 1589131 18.370 0.02657 0.12510 80580 10081 379405 0.83861 1168733 14.575 0.04546 0.20518 70499 14465 318172 0.74128 789328 11.280 0.07705 0.32431 56034 18172 235853 0.49942 (3) 471157 8.485 0.16091 ... 37862 37862 235303 ... 235303 6.2
(1) Value given is for survivorship of 5 cohorts of birth to age group 0‐4 = 5L0/500000(2) Value given is for 5S0=5L5/5L0(3) Value given is 5S80+=T85/T80
44

Kegalle District ‐ Male
Age nmx nqx lx ndx nLx nSx Tx ex
0 0.01006 0.00997 100000 997 99074 0.98938 (1) 7246093 72.51 0.00042 0.00169 99003 167 395614 0.99836 (2) 7147019 72.25 0.00025 0.00123 98836 122 493875 0.99857 6751405 68.310 0.00033 0.00163 98714 161 493168 0.99784 6257530 63.415 0.00059 0.00297 98553 293 492103 0.99603 5764362 58.520 0.00102 0.00509 98261 500 490152 0.99361 5272258 53.725 0.00156 0.00778 97760 761 487021 0.99066 4782107 48.930 0.00221 0.01101 97000 1068 482470 0.98710 4295086 44.335 0.00301 0.01494 95932 1433 476247 0.98264 3812616 39.740 0.00405 0.02004 94499 1894 467982 0.97660 3336369 35.345 0.00552 0.02723 92605 2522 457032 0.96780 2868387 31.050 0.00774 0.03799 90083 3422 442313 0.95429 2411355 26.855 0.01125 0.05480 86661 4749 422096 0.93303 1969042 22.760 0.01693 0.08142 81912 6669 393827 0.89941 1546946 18.965 0.02623 0.12346 75243 9289 354212 0.84703 1153119 15.370 0.04140 0.18833 65953 12421 300030 0.76826 798907 12.175 0.06598 0.28412 53532 15210 230501 0.65687 498877 9.380 0.10517 0.41551 38323 15923 151409 0.43583 (3) 268376 7.085 0.19150 ... 22399 22399 116968 ... 116968 5.2
Kegalle District ‐ Female
Age nmx nqx lx ndx nLx nSx Tx ex
0 0.00627 0.00623 100000 623 99420 0.99314 (1) 7997527 80.01 0.00036 0.00145 99377 144 397150 0.99875 (2) 7898107 79.55 0.00017 0.00086 99233 85 495951 0.99917 7500958 75.610 0.00016 0.00080 99148 79 495540 0.99903 7005006 70.715 0.00024 0.00121 99068 120 495061 0.99853 6509467 65.720 0.00035 0.00174 98948 172 494332 0.99805 6014406 60.825 0.00043 0.00213 98776 210 493370 0.99771 5520074 55.930 0.00049 0.00246 98566 242 492240 0.99731 5026704 51.035 0.00060 0.00298 98323 293 490915 0.99654 4534465 46.140 0.00082 0.00407 98030 399 489216 0.99493 4043550 41.245 0.00127 0.00634 97631 619 486734 0.99167 3554334 36.450 0.00217 0.01082 97012 1050 482679 0.98536 3067600 31.655 0.00391 0.01938 95963 1860 475612 0.97346 2584921 26.960 0.00719 0.03539 94103 3330 462990 0.95147 2109309 22.465 0.01334 0.06473 90773 5876 440523 0.91182 1646318 18.170 0.02473 0.11703 84897 9935 401679 0.84301 1205796 14.275 0.04562 0.20606 74961 15447 338620 0.73170 804117 10.780 0.08304 0.34571 59515 20575 247769 0.46773 (3) 465496 7.885 0.17885 ... 38940 38940 217727 ... 217727 5.6
(1) Value given is for survivorship of 5 cohorts of birth to age group 0‐4 = 5L0/500000(2) Value given is for 5S0=5L5/5L0(3) Value given is 5S80+=T85/T80
45

Northern Province ‐ Male
Age nmx nqx lx ndx nLx nSx Tx ex
0 0.00849 0.00842 100000 842 99214 0.98990 (1) 5992274 59.91 0.00095 0.00381 99158 378 395736 0.99645 (2) 5893060 59.45 0.00057 0.00286 98780 283 493195 0.99703 5497324 55.710 0.00062 0.00309 98498 304 491728 0.98983 5004129 50.815 0.00484 0.02400 98193 2357 486728 0.94462 4512402 46.020 0.01881 0.09024 95837 8648 459773 0.90019 4025674 42.025 0.01993 0.09462 87188 8250 413882 0.92759 3565901 40.930 0.00996 0.04842 78939 3822 383914 0.96603 3152019 39.935 0.00474 0.02338 75116 1756 370873 0.97853 2768105 36.940 0.00437 0.02163 73360 1587 362909 0.97465 2397232 32.745 0.00621 0.03058 71773 2195 353710 0.96203 2034323 28.350 0.00957 0.04682 69579 3258 340279 0.94154 1680613 24.255 0.01492 0.07210 66321 4782 320387 0.91030 1340334 20.260 0.02328 0.11032 61539 6789 291648 0.86378 1019947 16.665 0.03623 0.16670 54750 9127 251919 0.79657 728299 13.370 0.05614 0.24695 45623 11267 200672 0.70384 476380 10.475 0.08640 0.35520 34357 12203 141241 0.58465 275708 8.080 0.13147 0.49005 22153 10856 82576 0.38590 (3) 134467 6.185 0.21771 ... 11297 11297 51890 ... 51890 4.6
Northern Province ‐ Female
Age nmx nqx lx ndx nLx nSx Tx ex
0 0.00795 0.00789 100000 789 99269 0.99048 (1) 7377892 73.81 0.00088 0.00353 99211 350 395972 0.99704 (2) 7278623 73.45 0.00043 0.00214 98861 212 493775 0.99763 6882651 69.610 0.00052 0.00260 98649 256 492605 0.99402 6388876 64.815 0.00224 0.01115 98393 1097 489660 0.98463 5896271 59.920 0.00364 0.01802 97296 1753 482133 0.98400 5406611 55.625 0.00258 0.01279 95542 1222 474418 0.99023 4924478 51.530 0.00146 0.00727 94320 686 469783 0.99349 4450060 47.235 0.00126 0.00628 93635 588 466723 0.99279 3980276 42.540 0.00173 0.00863 93047 803 463356 0.98905 3513554 37.845 0.00278 0.01383 92244 1276 458282 0.98207 3050198 33.150 0.00462 0.02286 90968 2080 450064 0.97024 2591916 28.555 0.00774 0.03801 88888 3379 436669 0.95058 2141852 24.160 0.01299 0.06305 85510 5391 415087 0.91845 1705183 19.965 0.02178 0.10366 80118 8305 381236 0.86721 1290096 16.170 0.03642 0.16768 71813 12042 330612 0.78862 908860 12.775 0.06051 0.26395 59772 15777 260727 0.67589 578248 9.780 0.09939 0.39812 43995 17515 176223 0.44500 (3) 317521 7.285 0.18740 ... 26480 26480 141298 ... 141298 5.3
(1) Value given is for survivorship of 5 cohorts of birth to age group 0‐4 = 5L0/500000(2) Value given is for 5S0=5L5/5L0(3) Value given is 5S80+=T85/T80
46

47
References
Chiang, C.L. (1968), Introduction to Stochastic Processes in Biostatistics, New York; John
Wiley & Sons, Inc.
Gunasekera, H.R. (2005), Preliminary Evaluation of Age‐Sex Data of Census of Population
and Housing – 2001, Colombo: Department of Census and Statistics.
Department of Census and Statistics (1984), Report on a Survey to Estimate Birth and Death
Registration of Sri Lanka – 1980, Colombo.
(1991), Sri Lanka National and District Life Tables: 1980‐1982 ,Colombo;
Department of Census and Statistics.
United Nations, (2005), Demographic Yearbook 2002, New York; United Nations.
(2006,a), World Mortality Report 2005, New York; United Nations.
(2006,b), World Population Prospects, the 2004 Revision, New York; United
Nations.
(2007,a), Demographic Yearbook 2003, New York; United Nations.
(2007,b), World Population Prospects, the 2006 Revision, New York; United
Nations.
Heligman, L., Pollard, I.H., The Age Pattern of Mortality, The Journal of the Institute of
Actuaries, Vol. 107, Part Ι, No. 434 (June).

Appendix A
Figure A : Observed and fitted nqx by age and sex ‐ Sri Lanka and districts, 2000 ‐ 2002
0.0
0.1
0.2
0.3
0.4
0.5
0 5 10 15 20 25 30 35 40 45 50 55 60 65 70 75 80
nqx
Sri Lanka - Male
49
Age
Observed Fitted
0.0
0.1
0.2
0.3
0.4
0 5 10 15 20 25 30 35 40 45 50 55 60 65 70 75 80
nqx
Age
Sri Lanka - Female
Observed Fitted
49

0.0
0.1
0.2
0.3
0.4
0.5
0 5 10 15 20 25 30 35 40 45 50 55 60 65 70 75 80
nqx
Age
Colombo District - Male
Observed Fitted
50
0.0
0.1
0.2
0.3
0.4
0.5
0 5 10 15 20 25 30 35 40 45 50 55 60 65 70 75 80
nqx
Age
Colombo District - Female
Observed Fitted
50

0.0
0.1
0.2
0.3
0.4
0.5
0 5 10 15 20 25 30 35 40 45 50 55 60 65 70 75 80
nqx
Age
Gampaha District - Male
Observed Fitted
51
0.0
0.1
0.2
0.3
0.4
0 5 10 15 20 25 30 35 40 45 50 55 60 65 70 75 80
nqx
Age
Gampaha District - Female
Observed Fitted
51

0.0
0.1
0.2
0.3
0.4
0.5
0 5 10 15 20 25 30 35 40 45 50 55 60 65 70 75 80
nqx
Age
Kalutara District - Male
Observed Fitted
52
0.0
0.1
0.2
0.3
0.4
0 5 10 15 20 25 30 35 40 45 50 55 60 65 70 75 80
nqx
Age
Kalutara District - Female
Observed Fitted
52

0.0
0.1
0.2
0.3
0.4
0.5
0 5 10 15 20 25 30 35 40 45 50 55 60 65 70 75 80
nqx
Age
Kandy District - Male
Observed Fitted
53
0.0
0.1
0.2
0.3
0.4
0.5
0 5 10 15 20 25 30 35 40 45 50 55 60 65 70 75 80
nqx
Age
Kandy District - Female
Observed Fitted
53

0.0
0.1
0.2
0.3
0.4
0.5
0 5 10 15 20 25 30 35 40 45 50 55 60 65 70 75 80
nqx
Age
Matale District - Male
Observed Fitted
54
0.0
0.1
0.2
0.3
0.4
0.5
0 5 10 15 20 25 30 35 40 45 50 55 60 65 70 75 80
nqx
Age
Matale District - Female
Observed Fitted
54

0.0
0.1
0.2
0.3
0.4
0.5
0 5 10 15 20 25 30 35 40 45 50 55 60 65 70 75 80
nqx
Age
Nuwara Eliya District - Male
Observed Fitted
55
0.0
0.1
0.2
0.3
0.4
0.5
0 5 10 15 20 25 30 35 40 45 50 55 60 65 70 75 80
nqx
Age
Nuwara Eliya District - Female
Observed Fitted
55

0.0
0.1
0.2
0.3
0.4
0.5
0 5 10 15 20 25 30 35 40 45 50 55 60 65 70 75 80
nqx
Age
Galle District - Male
Observed Fitted
56
0.0
0.1
0.2
0.3
0.4
0.5
0 5 10 15 20 25 30 35 40 45 50 55 60 65 70 75 80
nqx
Age
Galle District - Female
Observed Fitted
56

0.0
0.1
0.2
0.3
0.4
0.5
0 5 10 15 20 25 30 35 40 45 50 55 60 65 70 75 80
nqx
Age
Matara District - Male
Observed Fitted
57
0.0
0.1
0.2
0.3
0.4
0 5 10 15 20 25 30 35 40 45 50 55 60 65 70 75 80
nqx
Age
Matara District - Female
Observed Fitted
57

0.0
0.1
0.2
0.3
0.4
0 5 10 15 20 25 30 35 40 45 50 55 60 65 70 75 80
nqx
Age
Hambantota District - Male
Observed Fitted
58
0.0
0.1
0.2
0.3
0.4
0 5 10 15 20 25 30 35 40 45 50 55 60 65 70 75 80
nqx
Age
Hambantota District - Female
Observed Fitted
58

0.0
0.1
0.2
0.3
0.4
0.5
0 5 10 15 20 25 30 35 40 45 50 55 60 65 70 75 80
nqx
Age
Batticaloa District - Male
Observed Fitted
59
0.0
0.1
0.2
0.3
0.4
0.5
0 5 10 15 20 25 30 35 40 45 50 55 60 65 70 75 80
nqx
Age
Batticaloa District - Female
Observed Fitted
59

0.0
0.1
0.2
0.3
0.4
0.5
0 5 10 15 20 25 30 35 40 45 50 55 60 65 70 75 80
nqx
Age
Ampara District - Male
Observed Fitted
60
0.0
0.1
0.2
0.3
0.4
0.5
0 5 10 15 20 25 30 35 40 45 50 55 60 65 70 75 80
nqx
Age
Ampara District - Female
Observed Fitted
60

0.0
0.1
0.2
0.3
0.4
0.5
0 5 10 15 20 25 30 35 40 45 50 55 60 65 70 75 80
nqx
Age
Trincomalee District - Male
Observed Fitted
61
0.0
0.1
0.2
0.3
0.4
0.5
0 5 10 15 20 25 30 35 40 45 50 55 60 65 70 75 80
nqx
Age
Trincomalee District - Female
Observed Fitted
61

0.0
0.1
0.2
0.3
0.4
0.5
0 5 10 15 20 25 30 35 40 45 50 55 60 65 70 75 80
nqx
Age
Kurunegala District - Male
Observed Fitted
62
0.0
0.1
0.2
0.3
0.4
0 5 10 15 20 25 30 35 40 45 50 55 60 65 70 75 80
nqx
Age
Kurunegala District - Female
Observed Fitted
62

0.0
0.1
0.2
0.3
0.4
0.5
0 5 10 15 20 25 30 35 40 45 50 55 60 65 70 75 80
nqx
Age
Anuradhapura District - Male
Observed Fitted
63
0.0
0.1
0.2
0.3
0.4
0 5 10 15 20 25 30 35 40 45 50 55 60 65 70 75 80
nqx
Age
Anuradhapura District - Female
Observed Fitted
63

0.0
0.1
0.2
0.3
0.4
0.5
0 5 10 15 20 25 30 35 40 45 50 55 60 65 70 75 80
nqx
Age
Polonnaruwa District - Male
Observed Fitted
64
0.0
0.1
0.2
0.3
0.4
0 5 10 15 20 25 30 35 40 45 50 55 60 65 70 75 80
nqx
Age
Polonnaruwa District - Female
Observed Fitted
64

0.0
0.1
0.2
0.3
0.4
0.5
0 5 10 15 20 25 30 35 40 45 50 55 60 65 70 75 80
nqx
Age
Badulla District - Male
Observed Fitted
65
0.0
0.1
0.2
0.3
0.4
0 5 10 15 20 25 30 35 40 45 50 55 60 65 70 75 80
nqx
Age
Badulla District - Female
Observed Fitted
65

0.0
0.1
0.2
0.3
0.4
0 5 10 15 20 25 30 35 40 45 50 55 60 65 70 75 80
nqx
Age
Moneragala District - Male
Observed Fitted
66
0.0
0.1
0.2
0.3
0.4
0 5 10 15 20 25 30 35 40 45 50 55 60 65 70 75 80
nqx
Age
Moneragala District - Female
Observed Fitted
66

0.0
0.1
0.2
0.3
0.4
0.5
0 5 10 15 20 25 30 35 40 45 50 55 60 65 70 75 80
nqx
Age
Ratnapura District - Male
Observed Fitted
67
0.0
0.1
0.2
0.3
0.4
0 5 10 15 20 25 30 35 40 45 50 55 60 65 70 75 80
nqx
Age
Ratnapura District - Female
Observed Fitted
67

0.0
0.1
0.2
0.3
0.4
0.5
0 5 10 15 20 25 30 35 40 45 50 55 60 65 70 75 80
nqx
Age
Kegalle District - Male
Observed Fitted
68
0.0
0.1
0.2
0.3
0.4
0 5 10 15 20 25 30 35 40 45 50 55 60 65 70 75 80
nqx
Age
Kegalle District - Female
Observed Fitted
68

0.0
0.1
0.2
0.3
0.4
0.5
0 5 10 15 20 25 30 35 40 45 50 55 60 65 70 75 80
nqx
Age
Northern Province - Male
Observed Fitted
69
0.0
0.1
0.2
0.3
0.4
0.5
0 5 10 15 20 25 30 35 40 45 50 55 60 65 70 75 80
nqx
Age
Northern Province - Female
Observed Fitted
69

Appendix B
Sri Lanka
Age group
Male Female 2000 2001 2002 nmx
2000‐022000 2001 2002 nmx
2000‐02
Under 01 170480 165160 2635 2576 2377 0.01483 2024 1943 1812 0.0116601 ‐ 04 665931 639478 535 493 457 0.00074 476 426 399 0.0006805 ‐ 09 862602 832380 465 397 342 0.00046 392 322 287 0.0004010 ‐ 14 878066 843973 427 428 430 0.00049 326 289 302 0.0003615 ‐ 19 934856 908166 1406 1070 977 0.00123 917 635 639 0.0008020 ‐ 24 891559 887522 2947 2325 1852 0.00266 878 676 746 0.0008625 ‐ 29 732406 755996 2711 2178 1765 0.00303 730 599 632 0.0008730 ‐ 34 701736 722323 2552 2167 1931 0.00316 790 649 579 0.0009335 ‐ 39 685759 701334 2901 2794 2506 0.00399 913 765 753 0.0011540 ‐ 44 639445 643480 3471 3467 3263 0.00532 1034 951 934 0.0015145 ‐ 49 557348 568448 4219 3962 4002 0.00729 1400 1353 1270 0.0023650 ‐ 54 494869 504449 5143 5277 5325 0.01060 1930 1932 2002 0.0038855 ‐ 59 351772 374052 5177 5161 5093 0.01462 2179 2151 2105 0.0057360 ‐ 64 260915 274710 5744 5729 5660 0.02189 2751 2813 2691 0.0100265 ‐ 69 202891 231897 6666 6515 6619 0.03253 4098 4018 3881 0.0172470 ‐ 74 152282 171782 7899 7705 7646 0.05089 5399 5314 5436 0.0313475 ‐ 79 94866 109921 6486 6466 6725 0.06914 5152 5300 5494 0.0483580 ‐ 84 51753 59117 5560 5809 5970 0.11168 5250 5385 5462 0.09077
85 and over 29258 34567 6043 6127 6302 0.21044 6574 6691 7197 0.19733
All ages 9358794 9428755 72987 70646 69242 0.00758 43213 42212 42621 0.00453
Colombo District
Age group
Male Female 2000 2001 2002nmx
2000‐022000 2001 2002
nmx
2000‐02
Under 01 17559 16987 553 608 591 0.03326 494 430 411 0.0262001 ‐ 04 67691 64216 99 97 79 0.00136 96 83 90 0.0014005 ‐ 09 82011 77842 83 80 67 0.00094 81 84 56 0.0009510 ‐ 14 80134 75693 69 82 93 0.00101 57 59 53 0.0007415 ‐ 19 104308 94507 214 169 133 0.00165 120 102 91 0.0011020 ‐ 24 135543 115968 342 283 278 0.00222 151 146 119 0.0012025 ‐ 29 112676 100153 297 359 285 0.00279 147 123 137 0.0013630 ‐ 34 100092 90776 403 415 377 0.00398 156 121 114 0.0014335 ‐ 39 89379 86011 603 553 513 0.00622 227 160 158 0.0021240 ‐ 44 80893 78897 728 721 689 0.00881 248 201 185 0.0026745 ‐ 49 69402 68638 897 814 896 0.01252 281 312 266 0.0041750 ‐ 54 64743 63797 1139 1239 1199 0.01841 464 441 478 0.0072355 ‐ 59 47111 49361 1114 1096 1123 0.02358 467 463 467 0.0094460 ‐ 64 33832 36012 1178 1181 1190 0.03497 510 550 557 0.0149765 ‐ 69 25317 29226 1198 1170 1217 0.04720 739 736 717 0.0250170 ‐ 74 18704 22749 1267 1256 1327 0.06859 960 965 943 0.0420275 ‐ 79 11868 15300 1035 978 1051 0.08603 923 942 964 0.0616380 ‐ 84 6363 8463 783 801 923 0.13138 821 867 895 0.10174
85 and over 3437 4930 720 782 824 0.22549 989 990 1076 0.20649All ages 1151063 1099526 12722 12684 12855 0.01108 7931 7775 7777 0.00712
Table A : Distribution of population and deaths by age and sex, Sri Lanka and districts 2000‐2002
Mid 2001 Male Female
Mid 2001Population Deaths
Male Female
Population Deaths
70

Gampaha District
Age group
Male Female 2000 2001 2002nmx
2000‐022000 2001 2002
nmx
2000‐02
Under 01 17501 16974 77 79 85 0.00457 67 63 54 0.0035901 ‐ 04 66810 64289 15 13 13 0.00021 22 19 10 0.0002605 ‐ 09 80729 77345 7 20 14 0.00017 13 11 10 0.0001410 ‐ 14 78531 73948 13 24 22 0.00025 21 7 13 0.0001915 ‐ 19 95155 98811 58 56 59 0.00061 23 22 23 0.0002320 ‐ 24 109796 118988 83 101 81 0.00080 31 31 40 0.0002925 ‐ 29 89595 95529 131 116 115 0.00135 30 28 35 0.0003230 ‐ 34 82601 86353 181 166 152 0.00201 37 44 24 0.0004135 ‐ 39 76724 79720 245 288 295 0.00360 51 55 45 0.0006340 ‐ 44 69592 72402 385 386 371 0.00547 64 74 66 0.0009445 ‐ 49 60323 62902 470 439 452 0.00753 101 104 106 0.0016550 ‐ 54 54179 57617 535 577 575 0.01037 142 138 149 0.0024855 ‐ 59 38666 43370 517 514 540 0.01355 184 180 162 0.0040460 ‐ 64 28498 31757 502 530 544 0.01842 244 230 224 0.0073465 ‐ 69 21509 27220 651 635 622 0.02957 370 380 355 0.0135270 ‐ 74 16979 21788 811 802 787 0.04712 564 552 577 0.0258975 ‐ 79 10903 14499 683 717 716 0.06466 608 600 619 0.0420080 ‐ 84 5962 7690 620 654 623 0.10600 608 636 663 0.08270
85 and over 3346 4463 669 644 621 0.19277 713 738 756 0.16491All ages 1007399 1055665 6653 6761 6687 0.00665 3893 3912 3931 0.00371
Kalutara District
Age group
Male Female 2000 2001 2002nmx
2000‐022000 2001 2002
nmx
2000‐02
Under 01 9322 9008 60 43 32 0.00483 38 31 33 0.0037701 ‐ 04 35730 34431 13 14 16 0.00039 11 5 5 0.0002005 ‐ 09 43359 41858 12 12 13 0.00028 10 9 7 0.0002210 ‐ 14 44852 42846 12 12 15 0.00029 6 7 9 0.0001615 ‐ 19 49533 47586 33 40 43 0.00079 18 13 20 0.0003620 ‐ 24 50888 49453 58 71 69 0.00130 25 18 23 0.0004425 ‐ 29 41488 42838 61 60 75 0.00157 25 11 25 0.0004730 ‐ 34 39770 41166 91 73 90 0.00214 26 18 24 0.0005635 ‐ 39 38448 39435 101 119 107 0.00283 30 28 34 0.0007940 ‐ 44 34927 36059 151 168 148 0.00447 26 31 36 0.0008645 ‐ 49 31161 33065 180 179 173 0.00568 52 56 52 0.0016050 ‐ 54 29557 31429 271 222 215 0.00798 85 64 66 0.0022955 ‐ 59 22992 25026 240 250 254 0.01079 115 81 103 0.0040060 ‐ 64 17432 19179 311 322 303 0.01790 144 130 125 0.0069365 ‐ 69 13703 16338 387 378 361 0.02737 225 207 211 0.0131070 ‐ 74 10709 12764 478 446 452 0.04286 337 287 344 0.0253175 ‐ 79 7046 8590 457 460 451 0.06472 394 367 394 0.0448280 ‐ 84 4001 4894 394 399 415 0.10072 379 437 418 0.08398
85 and over 2300 2928 462 513 482 0.21130 517 539 598 0.18818All ages 527218 538893 3772 3781 3714 0.00712 2463 2339 2527 0.00453
Mid 2001Deaths
Male Female
Population Mid 2001
Deaths
Population
Male Female
71

Kandy District
Age group
Male Female 2000 2001 2002nmx
2000‐022000 2001 2002
nmx
2000‐02
Under 01 11687 11438 319 269 263 0.02430 213 254 196 0.0193201 ‐ 04 43581 42643 37 42 40 0.00092 31 34 43 0.0008405 ‐ 09 57252 56094 50 38 26 0.00066 31 20 26 0.0004610 ‐ 14 60355 59066 42 39 33 0.00063 25 34 27 0.0004915 ‐ 19 62880 62224 85 62 54 0.00107 64 39 38 0.0007620 ‐ 24 55557 59331 121 94 96 0.00187 68 59 48 0.0009825 ‐ 29 43133 48640 129 90 72 0.00225 68 63 56 0.0012730 ‐ 34 43838 48900 157 104 121 0.00290 81 46 53 0.0012335 ‐ 39 45578 49166 170 179 134 0.00353 79 63 66 0.0014040 ‐ 44 43236 45307 221 240 214 0.00520 104 78 104 0.0021045 ‐ 49 38404 40853 308 292 298 0.00779 132 132 106 0.0030150 ‐ 54 34939 37250 442 407 395 0.01188 214 200 179 0.0053255 ‐ 59 25582 28226 435 455 449 0.01743 217 217 198 0.0074860 ‐ 64 20003 20985 541 513 495 0.02580 269 244 254 0.0122065 ‐ 69 14646 17102 529 520 573 0.03694 332 326 322 0.0191270 ‐ 74 10924 12546 700 639 636 0.06023 441 393 447 0.0340375 ‐ 79 6629 8331 533 494 578 0.08071 388 401 468 0.0502980 ‐ 84 3504 4216 400 430 417 0.11872 435 430 383 0.09867
85 and over 2034 2531 422 415 447 0.21042 504 487 562 0.20466All ages 623762 654849 5641 5322 5341 0.00871 3696 3520 3576 0.00549
Matale District
Age group
Male Female 2000 2001 2002nmx
2000‐022000 2001 2002
nmx
2000‐02
Under 01 4120 4128 56 35 40 0.01068 35 33 28 0.0077501 ‐ 04 15754 15015 12 8 7 0.00057 9 12 7 0.0006005 ‐ 09 20255 19702 7 7 9 0.00039 11 7 3 0.0003610 ‐ 14 21527 20558 11 8 6 0.00037 11 15 5 0.0004915 ‐ 19 22575 22162 14 12 21 0.00071 20 16 11 0.0007220 ‐ 24 18994 19172 38 37 18 0.00163 19 8 12 0.0006825 ‐ 29 15556 16647 36 20 31 0.00186 16 12 10 0.0007830 ‐ 34 16047 16847 61 41 40 0.00293 15 15 13 0.0008335 ‐ 39 16846 17001 60 64 46 0.00338 19 18 16 0.0010640 ‐ 44 15924 15502 77 72 67 0.00452 21 15 17 0.0011645 ‐ 49 13879 13927 75 77 81 0.00562 28 29 26 0.0020150 ‐ 54 11798 11758 110 98 116 0.00915 41 24 49 0.0032355 ‐ 59 8063 8703 107 117 85 0.01277 45 51 47 0.0055260 ‐ 64 6225 6514 127 133 126 0.02072 60 64 68 0.0098265 ‐ 69 4657 5380 151 165 124 0.03157 90 100 81 0.0167370 ‐ 74 3651 3921 187 169 170 0.04793 107 126 122 0.0300975 ‐ 79 2262 2326 152 161 143 0.06720 107 122 113 0.0490180 ‐ 84 1199 1197 126 168 117 0.11426 112 123 120 0.09858
85 and over 609 669 126 151 141 0.22824 136 137 147 0.20927All ages 219941 221129 1533 1543 1388 0.00677 902 927 895 0.00411
Mid 2001 Male Female
Population DeathsMid 2001 Male Female
Population Deaths
72

Nuwara Eliya District
Age group
Male Female 2000 2001 2002nmx
2000‐022000 2001 2002
nmx
2000‐02
Under 01 7059 6901 110 136 92 0.01601 89 79 93 0.0126101 ‐ 04 26410 25056 20 19 21 0.00076 17 23 15 0.0007205 ‐ 09 34062 33117 16 11 8 0.00035 15 9 9 0.0003310 ‐ 14 35874 34237 16 12 13 0.00039 12 11 9 0.0003215 ‐ 19 35163 34565 23 32 29 0.00080 34 26 29 0.0008720 ‐ 24 30598 31529 34 47 34 0.00124 25 34 24 0.0008925 ‐ 29 24724 26572 35 38 31 0.00142 25 16 20 0.0007530 ‐ 34 24702 25895 46 34 32 0.00150 35 28 25 0.0011235 ‐ 39 25332 26665 57 57 57 0.00225 36 40 38 0.0014340 ‐ 44 24161 24347 63 65 85 0.00294 42 51 42 0.0018545 ‐ 49 20834 21661 103 109 95 0.00490 64 55 59 0.0027250 ‐ 54 19892 20571 167 161 172 0.00840 107 94 104 0.0049655 ‐ 59 14892 15653 206 194 213 0.01370 125 124 135 0.0081860 ‐ 64 10241 10039 226 215 232 0.02187 132 175 135 0.0146465 ‐ 69 7124 7511 278 246 267 0.03706 187 191 175 0.0245070 ‐ 74 4434 4547 228 264 229 0.05413 210 211 182 0.0442075 ‐ 79 2576 2651 215 169 194 0.07492 150 160 177 0.0611180 ‐ 84 1244 1312 121 123 173 0.11174 120 138 132 0.09909
85 and over 622 676 143 117 145 0.21704 135 148 158 0.21746All ages 349944 353505 2107 2049 2122 0.00598 1560 1613 1561 0.00446
Galle District
Age group
Male Female 2000 2001 2002nmx
2000‐022000 2001 2002
nmx
2000‐02
Under 01 8456 8220 118 141 126 0.01514 102 110 83 0.0119201 ‐ 04 35393 33430 27 26 23 0.00071 19 21 12 0.0005105 ‐ 09 45840 43617 23 17 19 0.00044 14 9 22 0.0003410 ‐ 14 48489 46048 24 28 26 0.00054 11 19 16 0.0003315 ‐ 19 47841 47260 54 37 50 0.00098 31 24 29 0.0005920 ‐ 24 40952 42073 69 68 57 0.00159 34 26 20 0.0006425 ‐ 29 33304 36762 80 64 58 0.00201 20 23 16 0.0005430 ‐ 34 32970 37013 96 90 73 0.00261 28 34 29 0.0008135 ‐ 39 32510 35818 122 138 104 0.00372 39 27 35 0.0009540 ‐ 44 31221 33618 140 129 175 0.00474 42 40 50 0.0013145 ‐ 49 27138 29913 218 184 172 0.00704 80 66 75 0.0024750 ‐ 54 24993 28017 231 232 280 0.00992 97 105 97 0.0035755 ‐ 59 19696 23010 272 272 241 0.01330 88 98 112 0.0043060 ‐ 64 15621 18296 308 298 314 0.01965 135 114 170 0.0076565 ‐ 69 13066 16196 361 369 402 0.02885 257 232 230 0.0148270 ‐ 74 10802 12589 478 477 467 0.04388 366 327 355 0.0277275 ‐ 79 6948 8690 399 437 454 0.06189 374 385 408 0.0447680 ‐ 84 3899 4720 429 432 426 0.11003 455 416 435 0.09216
85 and over 2495 3123 476 540 567 0.21162 571 648 713 0.20621All ages 481634 508413 3925 3979 4034 0.00826 2763 2724 2907 0.00550
Population DeathsMid 2001 Male Female
Population DeathsMid 2001 Male Female
73

Matara District
Age group
Male Female 2000 2001 2002nmx
2000‐022000 2001 2002
nmx
2000‐02
Under 01 6899 6543 117 76 65 0.01247 92 40 51 0.0093201 ‐ 04 26652 25457 10 12 10 0.00041 9 7 8 0.0003105 ‐ 09 35975 34357 11 7 6 0.00022 9 7 8 0.0002310 ‐ 14 38726 37077 12 15 9 0.00031 10 8 15 0.0003015 ‐ 19 37527 37307 45 33 21 0.00088 31 25 23 0.0007020 ‐ 24 29989 31550 49 43 45 0.00153 33 18 18 0.0007325 ‐ 29 24540 27440 60 35 41 0.00183 29 13 16 0.0006930 ‐ 34 23609 27409 55 51 47 0.00216 24 28 22 0.0009135 ‐ 39 23906 27511 77 63 66 0.00289 25 26 13 0.0007640 ‐ 44 24533 26936 89 101 92 0.00383 39 20 30 0.0011145 ‐ 49 21384 24321 109 112 113 0.00519 52 56 31 0.0018950 ‐ 54 19230 21627 112 148 131 0.00676 50 69 44 0.0025055 ‐ 59 14689 16918 138 134 136 0.00926 67 68 57 0.0037860 ‐ 64 10947 12372 192 148 162 0.01526 94 84 86 0.0071165 ‐ 69 10527 12126 224 232 248 0.02232 142 142 111 0.0108970 ‐ 74 8634 9682 329 324 317 0.03741 243 219 200 0.0228375 ‐ 79 5586 6589 297 305 304 0.05406 243 249 249 0.0374980 ‐ 84 3392 3884 327 339 335 0.09847 324 282 315 0.07904
85 and over 2306 2815 455 492 455 0.20252 546 530 561 0.19396All ages 369051 391921 2708 2670 2603 0.00721 2062 1891 1858 0.00494
Hambantota District
Age group
Male Female 2000 2001 2002nmx
2000‐022000 2001 2002
nmx
2000‐02
Under 01 4802 4619 16 24 18 0.00396 10 16 15 0.0030301 ‐ 04 18823 17994 5 12 7 0.00043 8 9 4 0.0003905 ‐ 09 26759 25926 3 9 9 0.00026 9 8 6 0.0003110 ‐ 14 28482 27692 7 12 8 0.00032 7 2 4 0.0001415 ‐ 19 27377 26603 21 20 16 0.00069 20 11 9 0.0004920 ‐ 24 21173 20603 36 31 15 0.00128 11 6 8 0.0003925 ‐ 29 18068 18648 51 31 32 0.00210 11 9 4 0.0004330 ‐ 34 17803 19148 52 32 44 0.00242 7 8 8 0.0004235 ‐ 39 18344 19169 40 42 38 0.00218 14 17 9 0.0006840 ‐ 44 18683 18669 43 45 42 0.00230 18 17 17 0.0009145 ‐ 49 17059 17211 53 59 57 0.00328 23 13 21 0.0011050 ‐ 54 13383 13191 68 71 66 0.00508 20 21 27 0.0017455 ‐ 59 8393 8535 49 63 55 0.00667 32 27 26 0.0032860 ‐ 64 6345 6481 57 61 64 0.00961 49 50 34 0.0067965 ‐ 69 6224 6908 110 120 119 0.01864 68 70 73 0.0101370 ‐ 74 4913 5303 127 159 168 0.03073 104 88 107 0.0188675 ‐ 79 3270 3300 128 162 157 0.04557 90 120 131 0.0345580 ‐ 84 1958 1901 127 165 149 0.07508 145 135 122 0.07049
85 and over 1280 1258 238 222 229 0.17969 220 240 214 0.17886All ages 263139 263159 1231 1340 1293 0.00489 866 867 839 0.00326
Mid 2001 Male Female
Population DeathsMid 2001 Male Female
Population Deaths
74

Batticaloa District
Age group
Male Female 2000 2001 2002nmx
2000‐022000 2001 2002
nmx
2000‐02
Under 01 5636 5443 127 122 107 0.02111 75 87 87 0.0152501 ‐ 04 21030 20090 54 41 38 0.00209 43 35 20 0.0016405 ‐ 09 26279 25783 45 21 25 0.00114 22 25 24 0.0009310 ‐ 14 25836 25155 20 28 25 0.00093 31 15 13 0.0008015 ‐ 19 26272 26494 60 42 38 0.00179 33 31 21 0.0010620 ‐ 24 24405 25316 117 94 52 0.00361 38 34 26 0.0013025 ‐ 29 19173 20813 72 71 51 0.00339 31 31 19 0.0013030 ‐ 34 17789 19180 77 67 48 0.00360 40 31 29 0.0017235 ‐ 39 15997 17671 74 63 48 0.00388 46 36 19 0.0019240 ‐ 44 14377 15274 76 72 59 0.00480 34 29 32 0.0021045 ‐ 49 11918 12542 87 69 73 0.00638 40 43 31 0.0030350 ‐ 54 9988 9958 97 80 87 0.00881 57 48 42 0.0049255 ‐ 59 6739 6785 106 105 104 0.01558 54 53 45 0.0075260 ‐ 64 5041 5376 130 145 101 0.02480 83 70 66 0.0135865 ‐ 69 3785 3977 154 150 135 0.03857 93 85 70 0.0208770 ‐ 74 2656 2816 142 163 147 0.05685 108 98 114 0.0380075 ‐ 79 1519 1468 127 113 115 0.07768 70 88 80 0.0538180 ‐ 84 761 795 91 99 79 0.11827 84 95 78 0.10818
85 and over 304 369 73 50 68 0.21053 74 64 65 0.18428All ages 239505 245305 1729 1595 1400 0.00658 1056 998 881 0.00399
Ampara District
Age group
Male Female 2000 2001 2002nmx
2000‐022000 2001 2002
nmx
2000‐02
Under 01 6509 6138 54 50 50 0.00784 35 30 32 0.0052101 ‐ 04 25111 24288 22 32 22 0.00100 35 22 19 0.0010305 ‐ 09 33317 32249 20 21 12 0.00054 21 11 13 0.0004710 ‐ 14 31625 30739 16 12 17 0.00047 10 7 17 0.0003615 ‐ 19 34403 32265 42 27 35 0.00102 25 22 23 0.0007120 ‐ 24 27777 28040 49 43 42 0.00162 18 16 12 0.0005325 ‐ 29 22776 24532 61 58 40 0.00233 20 19 16 0.0007330 ‐ 34 22488 23238 56 52 38 0.00218 19 12 10 0.0006035 ‐ 39 21548 21882 65 57 39 0.00251 27 14 18 0.0009140 ‐ 44 18965 18282 77 76 66 0.00385 26 19 26 0.0013145 ‐ 49 14948 14834 97 70 88 0.00569 44 27 19 0.0020250 ‐ 54 12740 12059 113 91 90 0.00769 54 43 47 0.0039855 ‐ 59 9141 8676 121 121 125 0.01335 46 50 61 0.0059960 ‐ 64 6521 6074 129 134 146 0.02086 73 77 69 0.0120265 ‐ 69 4977 4485 186 141 165 0.03295 112 93 92 0.0220770 ‐ 74 3162 3173 202 156 216 0.06040 135 135 119 0.0409775 ‐ 79 1616 1631 129 136 148 0.08540 115 118 105 0.0692880 ‐ 84 872 890 102 88 128 0.12156 91 104 94 0.10787
85 and over 438 450 107 100 98 0.23288 111 112 114 0.24889All ages 298934 293925 1648 1465 1565 0.00522 1017 931 906 0.00324
Population DeathsMid 2001 Male Female
Population DeathsMid 2001 Male Female
75

Trincomalee District
Age group
Male Female 2000 2001 2002nmx
2000‐022000 2001 2002
nmx
2000‐02
Under 01 4270 3911 21 14 20 0.00422 15 8 10 0.0028101 ‐ 04 16604 15625 15 16 15 0.00090 19 11 14 0.0009605 ‐ 09 20684 19628 18 8 8 0.00053 18 10 9 0.0006110 ‐ 14 17975 17441 16 8 8 0.00061 13 5 8 0.0005215 ‐ 19 19365 17576 32 31 19 0.00139 14 14 11 0.0007420 ‐ 24 18368 16592 83 104 49 0.00430 20 10 17 0.0009625 ‐ 29 14477 13667 56 73 38 0.00387 13 10 10 0.0008030 ‐ 34 12549 11842 58 65 45 0.00446 21 13 14 0.0013535 ‐ 39 12358 11186 59 60 39 0.00429 13 18 15 0.0013440 ‐ 44 10293 9047 45 78 42 0.00534 20 20 14 0.0019945 ‐ 49 8413 7366 34 70 55 0.00630 29 22 22 0.0032650 ‐ 54 7002 6204 77 65 49 0.00914 24 26 23 0.0038755 ‐ 59 4960 4420 77 63 70 0.01411 34 29 35 0.0074760 ‐ 64 3477 3020 61 81 92 0.02243 39 41 40 0.0132565 ‐ 69 2491 2242 80 97 77 0.03412 55 64 67 0.0276570 ‐ 74 1659 1426 81 94 79 0.05124 83 73 73 0.0533075 ‐ 79 906 837 85 69 74 0.08389 66 56 59 0.0716880 ‐ 84 517 484 53 62 65 0.11605 45 52 39 0.09298
85 and over 216 249 53 49 57 0.24537 55 47 42 0.19277All ages 176584 162763 1004 1107 901 0.00569 596 529 522 0.00337
Kurunegala District
Age group
Male Female 2000 2001 2002nmx
2000‐022000 2001 2002
nmx
2000‐02
Under 01 12518 12012 250 174 164 0.01566 150 131 124 0.0112401 ‐ 04 47612 46024 29 21 24 0.00053 11 19 20 0.0003705 ‐ 09 63025 61132 23 32 17 0.00038 16 12 11 0.0002110 ‐ 14 68066 64245 32 33 21 0.00043 20 24 14 0.0003015 ‐ 19 73494 70247 76 60 51 0.00084 57 40 38 0.0006420 ‐ 24 61364 61623 109 110 97 0.00171 37 35 42 0.0006225 ‐ 29 52512 56212 142 110 119 0.00236 43 32 37 0.0006630 ‐ 34 52938 56207 234 153 200 0.00370 73 52 47 0.0010135 ‐ 39 54793 56654 322 246 268 0.00509 51 49 74 0.0010240 ‐ 44 53970 54427 343 317 378 0.00641 77 67 74 0.0013445 ‐ 49 48388 50390 433 342 357 0.00779 92 87 87 0.0017750 ‐ 54 41034 43049 456 457 475 0.01128 112 138 140 0.0030255 ‐ 59 27281 29965 351 387 368 0.01353 122 105 123 0.0039060 ‐ 64 20721 22734 470 433 420 0.02128 189 200 189 0.0084965 ‐ 69 16374 20016 516 501 503 0.03096 343 274 310 0.0154470 ‐ 74 13260 15069 741 648 648 0.05121 435 444 471 0.0298675 ‐ 79 8653 9376 553 579 561 0.06518 400 460 434 0.0459780 ‐ 84 4622 5054 519 545 553 0.11662 480 477 498 0.09596
85 and over 2537 2582 557 565 542 0.21876 513 549 609 0.21572All ages 723162 737018 6156 5713 5766 0.00813 3221 3195 3342 0.00441
Population DeathsMid 2001 Male Female
Population DeathsMid 2001 Male Female
76

Puttalam District
Age group
Male Female 2000 2001 2002nmx
2000‐022000 2001 2002
nmx
2000‐02
Under 01 7041 6917 59 60 48 0.00795 67 43 45 0.0075201 ‐ 04 28388 27479 17 11 13 0.00049 17 16 13 0.0005505 ‐ 09 35466 35020 15 9 5 0.00028 14 8 9 0.0002910 ‐ 14 34701 33553 15 14 17 0.00043 7 7 8 0.0002115 ‐ 19 38136 37550 26 25 23 0.00066 13 15 16 0.0004020 ‐ 24 35422 34718 38 28 42 0.00102 15 16 14 0.0004325 ‐ 29 28363 28358 67 36 40 0.00169 12 12 9 0.0003930 ‐ 34 25937 25824 74 88 62 0.00289 13 17 16 0.0005835 ‐ 39 25070 24778 125 139 123 0.00515 21 20 27 0.0009340 ‐ 44 22241 22105 159 161 135 0.00683 33 36 24 0.0014045 ‐ 49 19621 20894 169 175 195 0.00917 53 53 42 0.0023550 ‐ 54 17625 18463 180 232 229 0.01214 51 54 83 0.0034155 ‐ 59 11410 12709 202 185 179 0.01656 60 87 53 0.0052760 ‐ 64 8041 9032 191 201 180 0.02375 80 95 68 0.0089765 ‐ 69 5899 7502 192 210 194 0.03373 108 129 148 0.0170670 ‐ 74 4188 5796 237 208 217 0.05277 161 182 168 0.0293375 ‐ 79 2658 3642 184 175 176 0.06697 155 159 167 0.0439380 ‐ 84 1436 1857 147 141 154 0.10237 151 142 203 0.08885
85 and over 735 946 128 139 148 0.18776 173 151 179 0.17759All ages 352378 357143 2225 2237 2180 0.00628 1204 1242 1292 0.00349
Anuradhapura District
Age group
Male Female 2000 2001 2002nmx
2000‐022000 2001 2002
nmx
2000‐02
Under 01 7337 7249 143 185 146 0.02153 107 147 133 0.0178001 ‐ 04 27743 26237 31 26 25 0.00097 19 25 20 0.0008005 ‐ 09 37170 35630 23 21 14 0.00051 20 16 14 0.0004810 ‐ 14 37920 36476 24 19 14 0.00050 19 11 14 0.0004115 ‐ 19 38902 36512 59 37 32 0.00111 50 20 16 0.0007920 ‐ 24 36108 35588 107 67 45 0.00202 42 23 20 0.0007925 ‐ 29 31718 31156 128 68 66 0.00274 34 25 25 0.0009030 ‐ 34 29774 28436 128 102 81 0.00349 34 35 19 0.0010235 ‐ 39 29374 27476 188 141 126 0.00517 40 27 29 0.0011640 ‐ 44 27491 25641 198 182 156 0.00651 36 38 32 0.0013745 ‐ 49 23158 22103 221 198 183 0.00868 61 54 54 0.0025350 ‐ 54 18490 17149 241 228 252 0.01298 57 77 69 0.0039755 ‐ 59 11099 10768 215 197 198 0.01829 62 78 56 0.0060460 ‐ 64 8285 8205 192 237 184 0.02462 95 93 70 0.0104865 ‐ 69 6351 6939 264 237 259 0.03984 143 163 121 0.0204670 ‐ 74 4531 4700 298 309 240 0.06224 155 174 169 0.0353275 ‐ 79 2586 2602 179 233 200 0.07889 110 130 119 0.0461280 ‐ 84 1430 1341 188 185 184 0.13007 129 121 132 0.09471
85 and over 831 757 181 179 205 0.22623 164 183 173 0.22853All ages 380298 364965 3008 2851 2610 0.00742 1377 1440 1285 0.00375
Mid 2001 Male Female
Population DeathsMid 2001 Male Female
Population Deaths
77

Polonnaruwa District
Age group
Male Female 2000 2001 2002nmx
2000‐022000 2001 2002
nmx
2000‐02
Under 01 3380 3332 35 46 63 0.01420 19 42 55 0.0117001 ‐ 04 12557 11987 12 8 8 0.00072 6 6 4 0.0004205 ‐ 09 17461 16919 7 8 7 0.00040 8 4 6 0.0003510 ‐ 14 18233 17311 8 3 6 0.00033 6 7 4 0.0003515 ‐ 19 19275 17660 25 20 20 0.00114 23 12 13 0.0009120 ‐ 24 17929 15986 38 35 25 0.00184 11 12 6 0.0006325 ‐ 29 15917 14506 56 36 33 0.00264 14 14 13 0.0009730 ‐ 34 15250 13566 59 37 33 0.00282 13 16 5 0.0008135 ‐ 39 15008 13224 66 57 53 0.00393 14 18 7 0.0009840 ‐ 44 13513 11779 79 82 61 0.00548 9 18 15 0.0011945 ‐ 49 11660 10227 75 76 66 0.00617 23 25 21 0.0022550 ‐ 54 9403 8138 99 97 88 0.01010 31 27 25 0.0034455 ‐ 59 6193 5508 98 81 86 0.01421 25 28 37 0.0054560 ‐ 64 4408 3822 87 84 93 0.01996 36 48 41 0.0109965 ‐ 69 3105 3197 87 91 105 0.03027 58 48 50 0.0162770 ‐ 74 2140 1921 128 126 114 0.05748 66 45 69 0.0312375 ‐ 79 1261 1091 84 77 97 0.06820 49 41 58 0.0449180 ‐ 84 628 568 66 68 78 0.11306 48 40 60 0.08627
85 and over 371 364 79 84 93 0.22911 87 69 74 0.21154All ages 187692 171106 1188 1116 1129 0.00610 546 520 563 0.00317
Badulla District
Age group
Male Female 2000 2001 2002nmx
2000‐022000 2001 2002
nmx
2000‐02
Under 01 7488 7287 195 218 179 0.02631 157 170 123 0.0205801 ‐ 04 29850 28776 28 25 17 0.00077 28 20 21 0.0008005 ‐ 09 39296 37972 13 16 15 0.00038 23 12 10 0.0004010 ‐ 14 41032 39592 21 9 23 0.00044 13 16 18 0.0004015 ‐ 19 39072 38187 45 29 44 0.00100 38 30 34 0.0008920 ‐ 24 31420 32708 63 57 50 0.00181 33 22 38 0.0009525 ‐ 29 27030 30253 60 43 38 0.00174 40 37 22 0.0010930 ‐ 34 28921 30803 91 67 61 0.00252 31 28 17 0.0008135 ‐ 39 29889 30177 96 108 81 0.00318 56 45 41 0.0015640 ‐ 44 27437 27325 106 117 115 0.00412 47 52 47 0.0017945 ‐ 49 22443 22654 136 132 142 0.00610 42 48 65 0.0023050 ‐ 54 18847 19620 143 172 198 0.00907 84 91 95 0.0045955 ‐ 59 14479 15376 227 248 216 0.01589 106 116 95 0.0068960 ‐ 64 10808 11114 262 220 222 0.02174 109 139 127 0.0112565 ‐ 69 8324 8925 304 282 264 0.03400 180 177 177 0.0199470 ‐ 74 5454 5523 269 312 301 0.05391 183 191 202 0.0347675 ‐ 79 3022 3150 231 204 248 0.07545 163 170 163 0.0523880 ‐ 84 1596 1719 170 182 215 0.11842 156 182 142 0.09308
85 and over 1017 1075 210 193 224 0.20551 220 208 219 0.20093All ages 387425 392236 2670 2634 2653 0.00685 1709 1754 1656 0.00435
Mid 2001 Male Female
Population DeathsMid 2001 Male Female
Population Deaths
78

Moneragala District
Age group
Male Female 2000 2001 2002nmx
2000‐022000 2001 2002
nmx
2000‐02
Under 01 3629 3473 10 10 7 0.00248 15 8 6 0.0028801 ‐ 04 15275 14675 8 9 6 0.00052 8 5 4 0.0004105 ‐ 09 22541 21589 8 2 9 0.00027 6 6 5 0.0002810 ‐ 14 22608 22698 10 16 12 0.00058 5 3 8 0.0002215 ‐ 19 21465 21072 17 16 10 0.00065 16 17 10 0.0006620 ‐ 24 17026 17304 31 18 20 0.00135 12 12 8 0.0006425 ‐ 29 14475 15357 42 22 16 0.00187 5 6 14 0.0005230 ‐ 34 14947 14800 37 30 21 0.00194 10 11 10 0.0006835 ‐ 39 15368 14766 39 35 38 0.00241 5 10 8 0.0005440 ‐ 44 14162 12916 42 41 26 0.00254 16 19 9 0.0011645 ‐ 49 12095 10673 63 48 46 0.00430 16 16 22 0.0016950 ‐ 54 9406 8092 55 59 55 0.00595 13 18 15 0.0018555 ‐ 59 6388 5592 60 49 51 0.00830 18 24 24 0.0039360 ‐ 64 4502 3805 74 60 53 0.01377 26 38 16 0.0071065 ‐ 69 3637 3205 75 62 78 0.01980 50 52 48 0.0156070 ‐ 74 2458 2199 86 85 94 0.03580 53 60 65 0.0268375 ‐ 79 1462 1186 86 82 62 0.05267 61 43 42 0.0413280 ‐ 84 821 701 66 100 66 0.09379 54 48 44 0.06990
85 and over 464 376 83 92 93 0.19181 82 74 81 0.21011All ages 202729 194479 892 836 763 0.00409 471 470 439 0.00237
Ratnapura District
Age group
Male Female 2000 2001 2002nmx
2000‐022000 2001 2002
nmx
2000‐02
Under 01 8248 8057 149 127 142 0.01685 115 103 122 0.0140301 ‐ 04 33878 32546 18 18 21 0.00056 14 14 20 0.0004905 ‐ 09 46749 46026 18 9 10 0.00026 12 15 15 0.0003010 ‐ 14 51191 51325 16 19 16 0.00033 12 12 13 0.0002315 ‐ 19 51323 51078 64 52 54 0.00111 32 35 28 0.0006320 ‐ 24 45826 45088 82 74 70 0.00164 31 27 30 0.0006425 ‐ 29 38396 37728 85 84 62 0.00201 34 27 28 0.0008030 ‐ 34 37877 37196 90 96 103 0.00253 31 28 30 0.0008135 ‐ 39 36481 35934 89 112 119 0.00293 28 27 36 0.0008340 ‐ 44 35092 33963 133 150 129 0.00390 51 45 39 0.0013245 ‐ 49 31599 30221 166 194 166 0.00554 56 56 53 0.0018250 ‐ 54 28457 27841 197 216 244 0.00770 82 107 100 0.0034555 ‐ 59 20957 20791 188 235 218 0.01021 105 107 86 0.0047660 ‐ 64 15207 14508 204 256 226 0.01506 124 127 113 0.0083465 ‐ 69 12450 12550 321 316 319 0.02562 194 170 189 0.0146670 ‐ 74 8950 8300 394 370 344 0.04123 234 265 215 0.0286775 ‐ 79 5568 5367 323 303 369 0.05963 231 224 257 0.0441680 ‐ 84 2933 2724 304 325 326 0.10842 209 241 240 0.08443
85 and over 1622 1563 309 328 335 0.19975 291 276 329 0.19130All ages 512804 502806 3150 3284 3273 0.00631 1886 1906 1943 0.00380
Population DeathsMid 2001 Male Female
Population DeathsMid 2001 Male Female
79

Kegalle District
Age group
Male Female 2000 2001 2002nmx
2000‐022000 2001 2002
nmx
2000‐02
Under 01 6758 6704 79 74 51 0.01006 56 25 44 0.0062601 ‐ 04 25993 25254 12 8 14 0.00042 7 5 16 0.0003605 ‐ 09 33033 32467 10 5 9 0.00024 6 7 5 0.0001810 ‐ 14 34948 34836 12 8 15 0.00034 1 3 10 0.0001415 ‐ 19 36029 36303 21 19 21 0.00056 15 10 10 0.0003320 ‐ 24 31698 32887 36 38 30 0.00110 13 5 11 0.0003025 ‐ 29 26128 28453 39 37 40 0.00149 16 12 8 0.0004230 ‐ 34 26989 29627 68 66 50 0.00226 22 11 14 0.0005435 ‐ 39 28183 29590 105 88 72 0.00312 21 19 18 0.0006440 ‐ 44 27690 28709 122 113 93 0.00394 17 20 24 0.0007045 ‐ 49 25609 26681 147 152 117 0.00543 46 31 39 0.0014650 ‐ 54 23470 25034 190 192 175 0.00793 47 60 71 0.0023655 ‐ 59 17102 18898 232 173 161 0.01105 79 64 67 0.0037060 ‐ 64 13375 14096 233 206 223 0.01652 106 104 89 0.0070965 ‐ 69 10063 11855 288 276 263 0.02743 143 171 132 0.0125770 ‐ 74 8097 8828 357 325 350 0.04248 221 235 274 0.0275375 ‐ 79 5084 5798 336 318 310 0.06314 271 250 234 0.0434680 ‐ 84 2884 3133 316 285 313 0.10576 262 264 268 0.08458
85 and over 1514 1795 362 309 350 0.22457 356 366 378 0.20446All ages 384647 400948 2965 2692 2657 0.00720 1705 1662 1712 0.00422
Northern Province
Age group
Male Female 2000 2001 2002nmx
2000‐022000 2001 2002
nmx
2000‐02
Under 01 10253 9812 87 85 88 0.00849 73 93 67 0.0079501 ‐ 04 45010 43932 51 35 38 0.00091 47 35 34 0.0008605 ‐ 09 61289 58061 53 44 40 0.00075 33 32 19 0.0004810 ‐ 14 56930 53410 31 27 31 0.00053 29 17 24 0.0004515 ‐ 19 54748 52183 392 251 204 0.00519 240 111 146 0.0031820 ‐ 24 50718 52990 1,364 882 637 0.01895 211 118 210 0.0034025 ‐ 29 38362 41734 1,023 727 482 0.01939 97 76 112 0.0023030 ‐ 34 34858 38107 438 338 213 0.00947 74 53 56 0.0016035 ‐ 39 34640 37513 198 185 140 0.00502 71 48 47 0.0014940 ‐ 44 31067 32298 194 151 120 0.00499 64 61 51 0.0018045 ‐ 49 27934 27398 178 171 177 0.00630 85 68 73 0.0027450 ‐ 54 25715 23617 220 233 234 0.00891 98 87 99 0.0040255 ‐ 59 15961 15791 222 222 221 0.01391 128 101 116 0.0073560 ‐ 64 11400 11310 269 271 290 0.02430 154 140 150 0.0130965 ‐ 69 8676 9016 310 317 324 0.03654 209 208 202 0.0228570 ‐ 74 5989 6159 359 373 343 0.05961 233 244 220 0.0378375 ‐ 79 3451 3510 270 294 317 0.08490 184 215 253 0.0615480 ‐ 84 1736 1582 211 218 231 0.12673 142 155 181 0.10051
85 and over 786 658 190 163 178 0.22519 117 135 149 0.20365All ages 519523 519081 6060 4987 4308 0.00986 2289 1997 2209 0.00417
Population DeathsMid 2001 Male Female
Population DeathsMid 2001 Male Female
80

Appendix C
1981 2001
Colombo 19.2 21.4Gampaha 17.1 20.0Kalutara 16.3 13.2Kandy 25.4 17.3Matale 25.2 20.0Nuwara Eliya 31.7 18.8Galle 18.8 15.0Matara 18.1 17.5Hambantota 26.2 22.1Ampara 24.9 21.5Kurunegala 21.9 19.4Puttalam 20.6 20.3Anuradhapura 29.5 17.4Polonnaruwa 41.3 20.7Badulla 24.7 17.8Monaragala 31.1 21.0Ratnapura 24.3 15.4Kegalle 24.1 17.8
Total 17.5 13.6
Table A : U.N. Age‐sex accuracy index of age reporting by district, 1981 and 2001
DistrictU.N. Age‐sex accuracy index
Source : Preliminary Evaluation of Age‐Sex Data of Census and Population and Housing‐2001
81