Embed Size (px)
Citation preview

C. David (Dave) WarrenField Technical Manager
Transportation Materials Research
Oak Ridge National LaboratoryP.O. Box 2009, M/S 8050
Oak Ridge, Tennessee 37831-8050Phone: 865-574-9693
Fax: 865-574-0740Email: [email protected]
Lightweighting Composites and
Lower Cost Carbon Fiber
March 2013

2 Managed by UT-Battellefor the U.S. Department of Energy Presentation_name
ORNL’s missionDeliver scientific discoveries and technical breakthroughs that will accelerate the development and deployment of solutions in clean energy and global security, and in doing so create economic opportunity for the nation
2 Managed by UT-Battellefor the U.S. Department of Energy
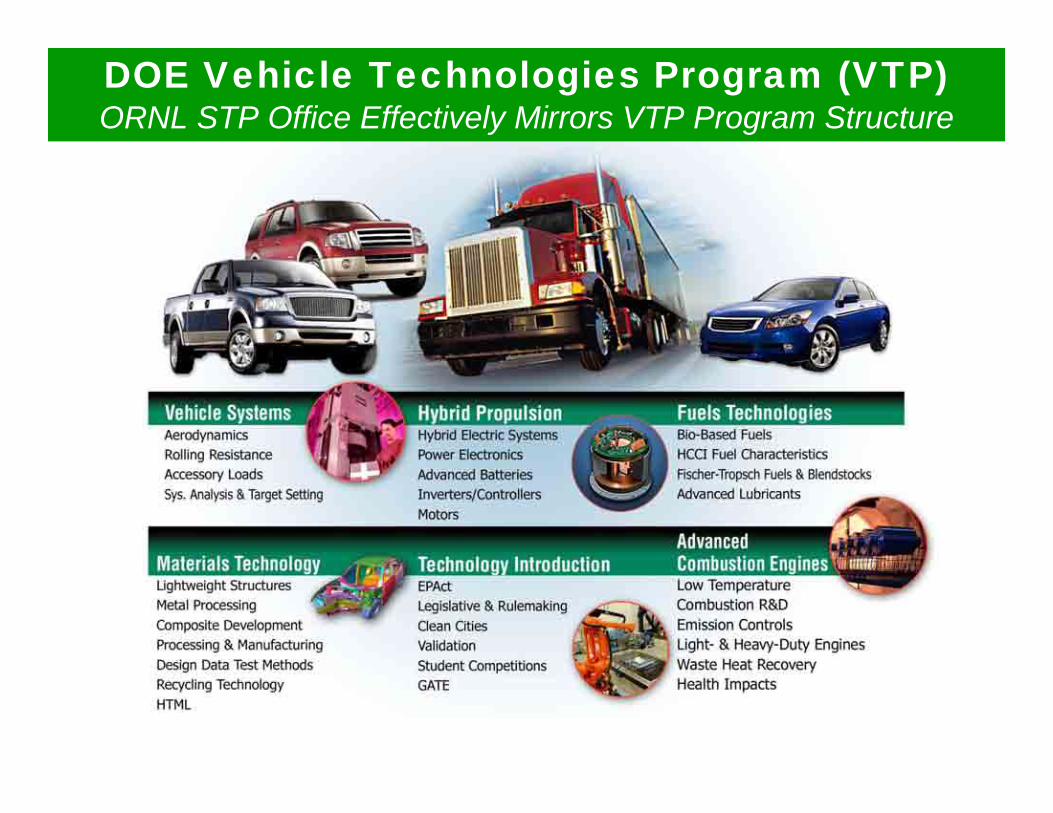
DOE Vehicle Technologies Program (VTP)ORNL STP Office Effectively Mirrors VTP Program Structure

4 Managed by UT-Battellefor the U.S. Department of Energy Presentation_name
DOE Low‐cost carbon fiber initiativeDOE Low‐cost carbon fiber initiative
ORNL’s Composites and Carbon Fiber Timeline
1960s 1980s 2020s
CentrifugeProgram
Technology transfer Federal Work-for-Other
Begin CF advancedconversion R&D
Begin DOE Lightweight Material Program & ACC collaboration
Begin alternative precursor R&D
Carbon Fiber Technology Facility
1990s 2000s 2010s
Composite Joining
Industry calls for scale-up facility at ORNL workshop
5 Managed by UT-Battellefor the U.S. Department of Energy Presentation_name
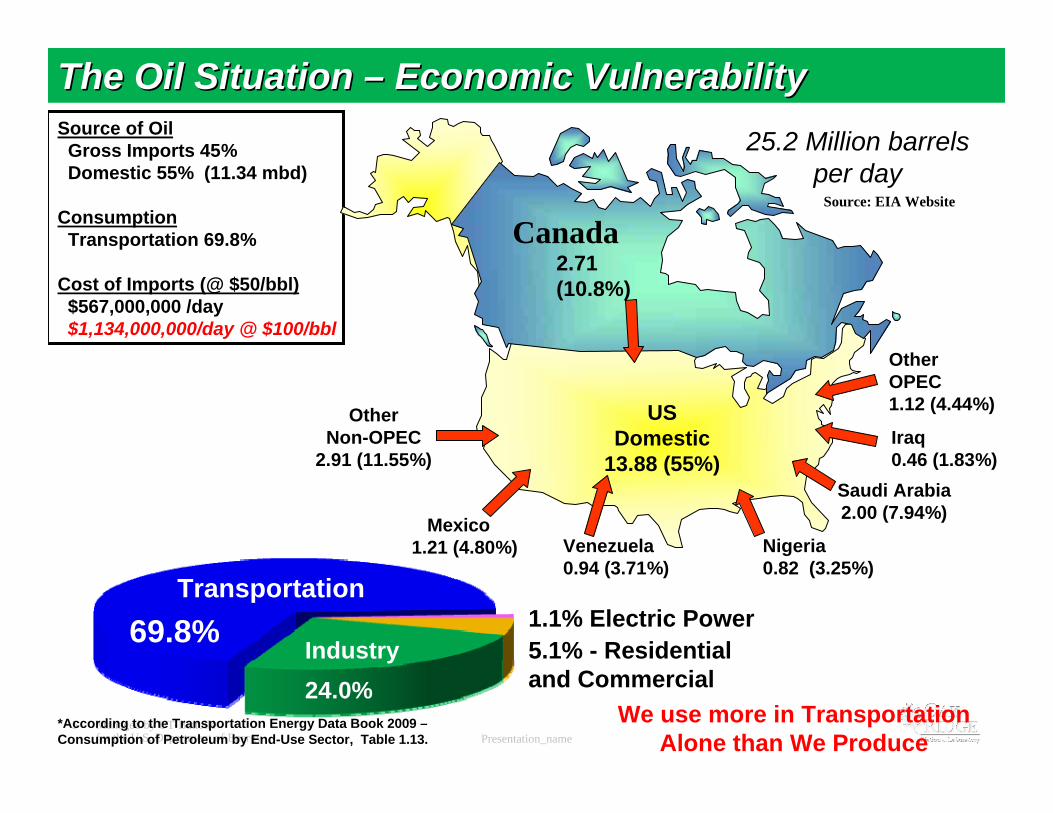
25.2 Million barrels per day
Source of OilGross Imports 45%Domestic 55% (11.34 mbd)
ConsumptionTransportation 69.8%
Cost of Imports (@ $50/bbl)$567,000,000 /day$1,134,000,000/day @ $100/bbl
2.71 (10.8%)
US Domestic
13.88 (55%)
Venezuela 0.94 (3.71%)
Mexico 1.21 (4.80%)
Other OPEC1.12 (4.44%)
Iraq0.46 (1.83%)
Nigeria0.82 (3.25%)
Other Non-OPEC
2.91 (11.55%)Saudi Arabia 2.00 (7.94%)
CanadaSource: EIA Website
Transportation69.8% Industry
24.0%
1.1% Electric Power5.1% - Residential and Commercial
*According to the Transportation Energy Data Book 2009 –Consumption of Petroleum by End-Use Sector, Table 1.13.
The Oil Situation The Oil Situation –– Economic VulnerabilityEconomic Vulnerability
We use more in Transportation Alone than We Produce

U.S. ProductionRail
Off Highway
Water
Air
Medium and heavy trucks
Light trucks
Cars and Motorcycles
+Biomass, liquefied coal, etc.
Conventional Sources
Oil Dependency Oil Dependency –– Transportation OnlyTransportation Only
Cars, Light Trucks and Heavy Trucks Account for the majority
Mill
ion
Bar
rels
per
Day
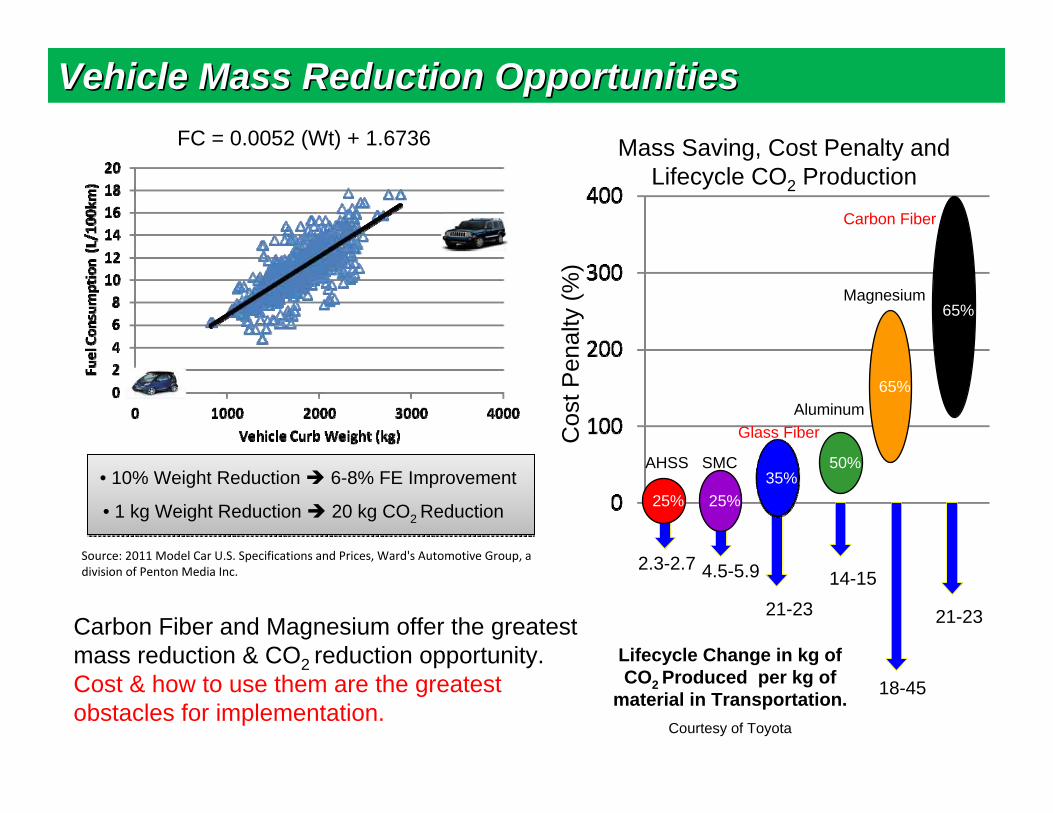
• 10% Weight Reduction 6-8% FE Improvement
• 1 kg Weight Reduction 20 kg CO2 Reduction
Source: 2011 Model Car U.S. Specifications and Prices, Ward's Automotive Group, a division of Penton Media Inc.
FC = 0.0052 (Wt) + 1.6736 Mass Saving, Cost Penalty and Lifecycle CO2 Production
Cos
t Pen
alty
(%)
AHSS
Glass Fiber
SMC
Magnesium
Aluminum
Carbon Fiber
25% 25%35%
50%
65%
65%
2.3-2.7 4.5-5.9
21-2314-15
18-45
21-23
Lifecycle Change in kg of CO2 Produced per kg of
material in Transportation.Courtesy of Toyota
Vehicle Mass Reduction OpportunitiesVehicle Mass Reduction Opportunities
Carbon Fiber and Magnesium offer the greatest mass reduction & CO2 reduction opportunity.Cost & how to use them are the greatest obstacles for implementation.

8 Managed by UT-Battellefor the U.S. Department of Energy Presentation_name
Structural Materials
Wt. Reduction Potential
Three Most Significant Technical Technology Barriers to Widespread Implementation Major Market Barriers
Aluminum 30-60%Joining dissimilar
materials and 7000 series.
Modeling tools and methods for joining and design.
Better casting and manufacturing methods. None
Magnesium 30-70%Cost effective,
environmentally friendly Mg production.
Corrosion in automotive environment and galvanic.
Alloy design - ductility for crash and
manufacturability.
Chinese rare earth dependence. Domestic
sources.
Carbon Fiber Composites 50-70% The cost of carbon fiber
too high.
Design methods, predictive tools and crash models for
structural applications.
High volume manufacturing and non-epoxy resin
compatibility.
Japanese market dominance. Worldwide
capacity too small.
CF Barrier: Price is too HighVehicle Materials Goal: Reduce the Cost of Carbon Fiber
Cost (DOE) and Price (OEM) Goal: $5 - $7 Per PoundProperty Goals: Minimum 250KSI Strength, 25 MSI Modulus, >1% Strain
(Some debate on what properties are required)
From March 2011 DOE Lightweighting Materials Workshop
Materials with 50+% Mass Reduction PotentialMaterials with 50+% Mass Reduction Potential
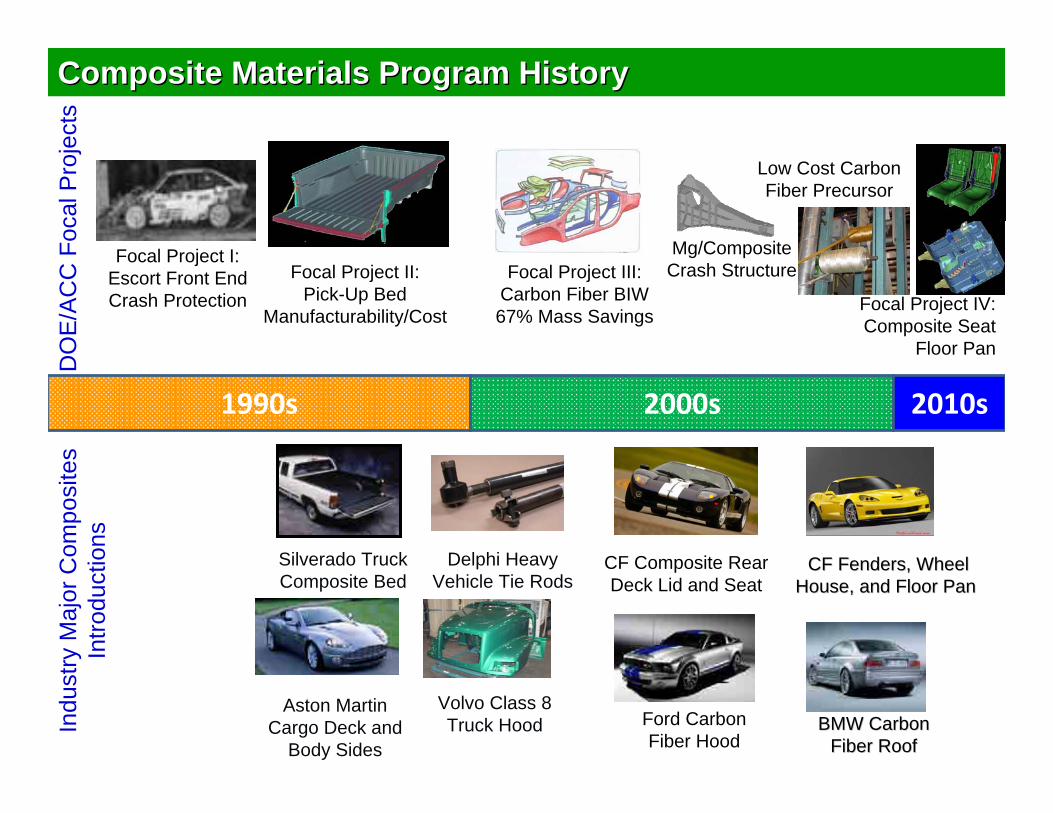
Focal Project I:Escort Front EndCrash Protection
Focal Project II:Pick-Up Bed
Manufacturability/Cost
Focal Project III:Carbon Fiber BIW67% Mass Savings
Focal Project IV:Composite Seat
Floor Pan
Low Cost Carbon Fiber Precursor
Mg/Composite Crash Structure
Composite Materials Program HistoryComposite Materials Program History
1990s 2000s 2010s
Ford Carbon Fiber Hood
CF Composite Rear Deck Lid and Seat
CF Fenders, Wheel CF Fenders, Wheel House, and Floor PanHouse, and Floor Pan
BMW Carbon BMW Carbon Fiber RoofFiber Roof
Silverado Truck Composite Bed
Delphi Heavy Vehicle Tie Rods
Aston Martin Cargo Deck and
Body Sides
DO
E/A
CC
Foc
al P
roje
cts
Volvo Class 8 Truck HoodIn
dust
ry M
ajor
Com
posi
tes
Intro
duct
ions
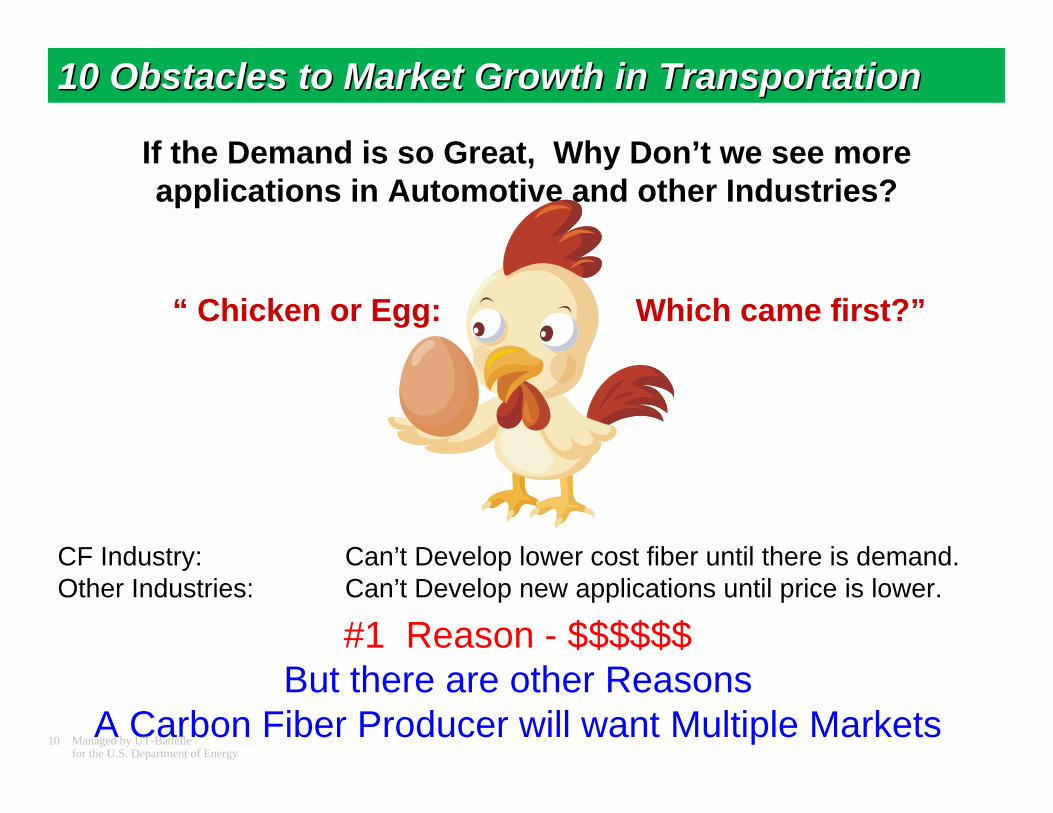
If the Demand is so Great, Why Don’t we see more applications in Automotive and other Industries?
#1 Reason - $$$$$$But there are other Reasons
A Carbon Fiber Producer will want Multiple Markets
“ Chicken or Egg: Which came first?”
CF Industry: Can’t Develop lower cost fiber until there is demand.Other Industries: Can’t Develop new applications until price is lower.
10 Managed by UT-Battellefor the U.S. Department of Energy
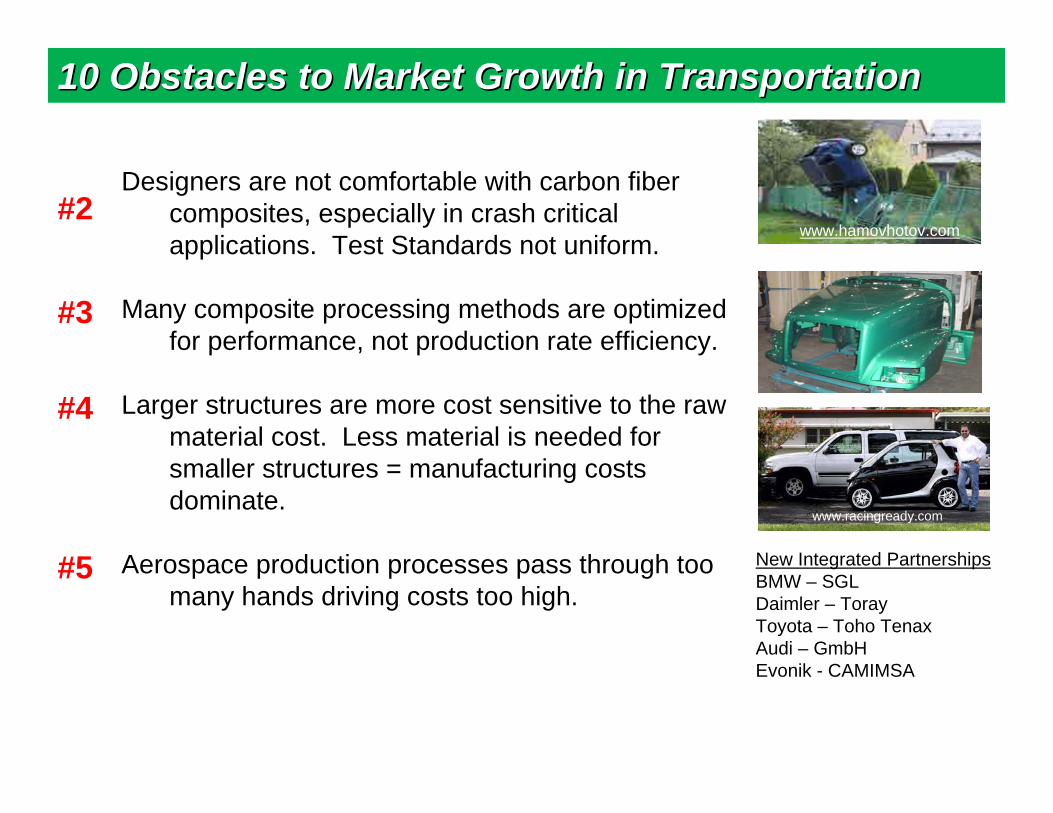
10 Obstacles to Market Growth in Transportation10 Obstacles to Market Growth in Transportation
10 Obstacles to Market Growth in Transportation10 Obstacles to Market Growth in Transportation
Designers are not comfortable with carbon fiber composites, especially in crash critical applications. Test Standards not uniform.
Many composite processing methods are optimized for performance, not production rate efficiency.
Larger structures are more cost sensitive to the raw material cost. Less material is needed for smaller structures = manufacturing costs dominate.
Aerospace production processes pass through too many hands driving costs too high.
#5
#4
#3
#2
New Integrated PartnershipsBMW – SGLDaimler – TorayToyota – Toho TenaxAudi – GmbHEvonik - CAMIMSA
www.racingready.com
www.hamovhotov.com
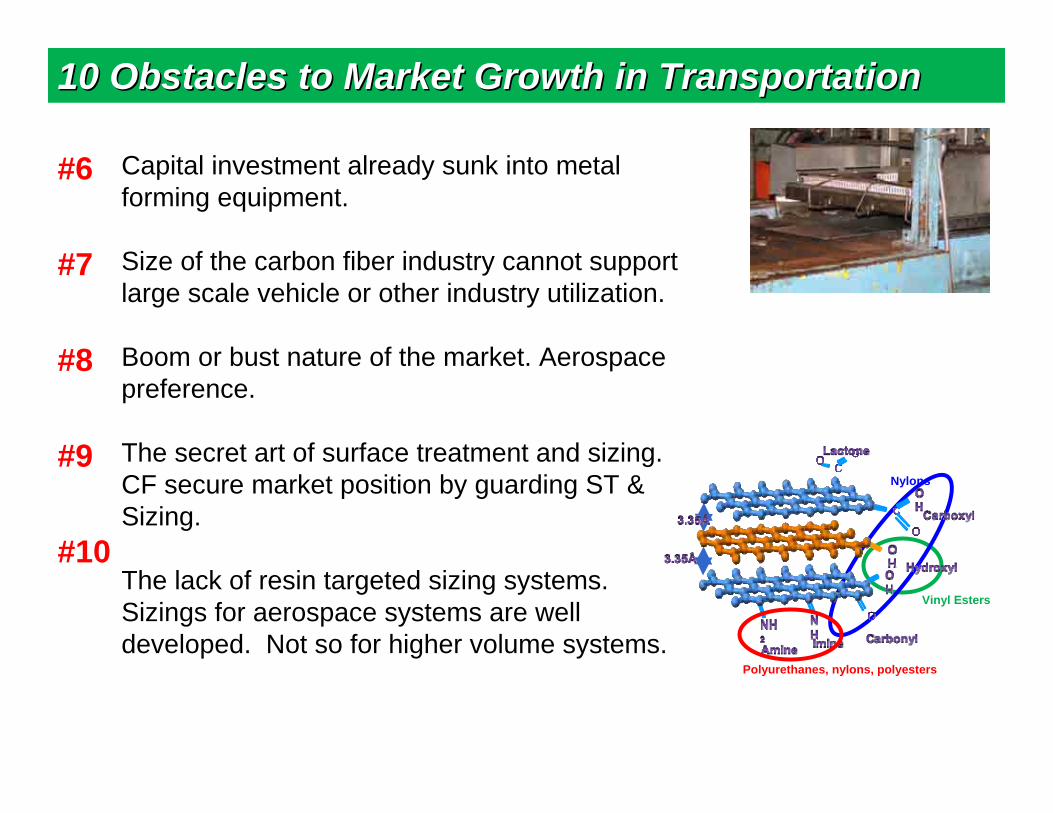
10 Obstacles to Market Growth in Transportation10 Obstacles to Market Growth in Transportation
Capital investment already sunk into metal forming equipment.
Size of the carbon fiber industry cannot support large scale vehicle or other industry utilization.
Boom or bust nature of the market. Aerospace preference.
The secret art of surface treatment and sizing. CF secure market position by guarding ST & Sizing.
The lack of resin targeted sizing systems. Sizings for aerospace systems are well developed. Not so for higher volume systems.
Polyurethanes, nylons, polyesters
Nylons
Vinyl Esters
#10
#9
#8
#7
#6

13 Managed by UT-Battellefor the U.S. Department of Energy Presentation_name
Carbon Fibers can be divided into 4 Broad Cost/Performance Categories:
High Performance >750 KSI Cost is not Limiting(Aerospace) > 35 MSI Performance Driven
Moderate Grade 500 – 750 KSI Cost and Performance(Industrial) 25 – 35 MSI Balance
High Volume Grade 250 – 500 KSI Cost Sensitive(Not currently made) < 25 MSI Performance Enabling
Non Structural Usually Low Cost - Chemical & Electrical Properties
Making Carbon FiberMaking Carbon Fiber
Precursors Stabilization& Oxidation
Carbonization/Graphitization
SurfaceTreatment
Spooling &Packaging
Diagram from Harper International
Pitch, PAN or Rayon 200-300C, 80-120 MinPrecise Stretching
1200-1800C5-10 Min
HandleabilityResin Compatibility
CF_Ani1_PAN-noMusic_sm.wmv CF_Ani2_ConventionalConversion-noMusic_sm.wmv
Precursors Stabilization& Oxidation
Carbonization/Graphitization
ST/Sizing Spooling &Packaging
Diagram from Harper International
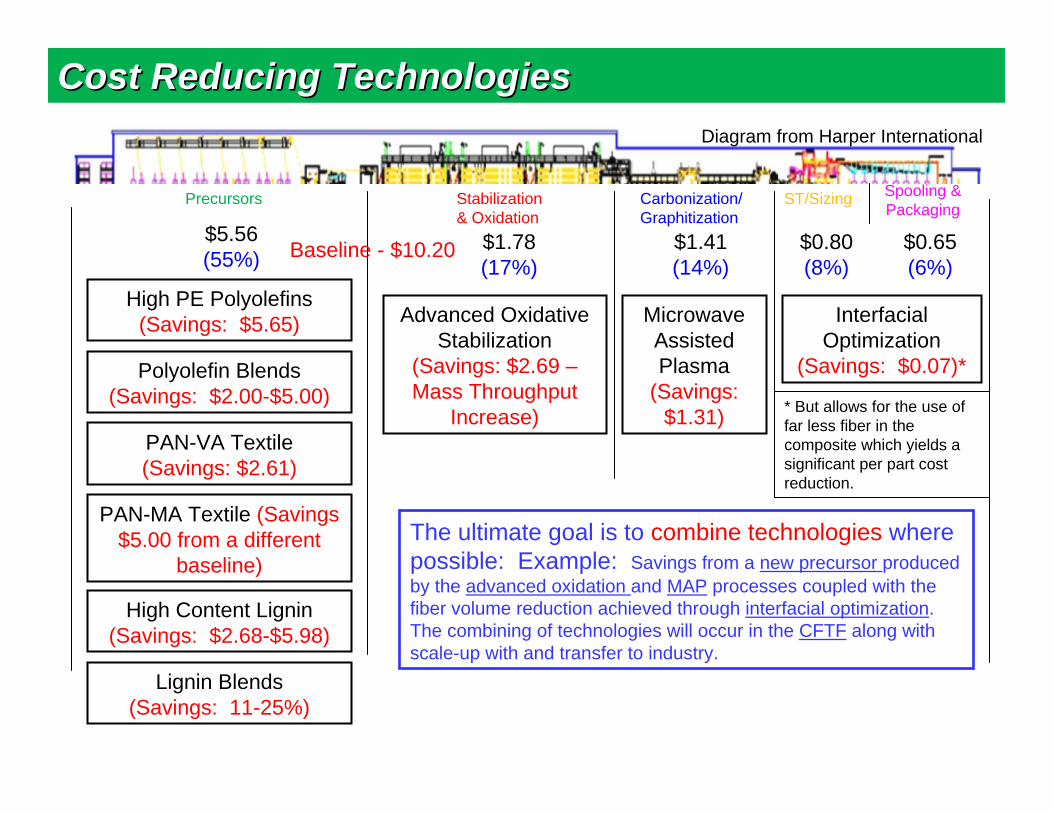
Baseline - $10.20$5.56(55%)
$1.78(17%)
$1.41(14%)
$0.80(8%)
$0.65(6%)
High PE Polyolefins(Savings: $5.65)
PAN-VA Textile (Savings: $2.61)
PAN-MA Textile (Savings $5.00 from a different
baseline)
High Content Lignin (Savings: $2.68-$5.98)
Advanced OxidativeStabilization
(Savings: $2.69 –Mass Throughput
Increase)
InterfacialOptimization
(Savings: $0.07)* Polyolefin Blends(Savings: $2.00-$5.00)
Lignin Blends(Savings: 11-25%)
Microwave Assisted Plasma
(Savings: $1.31) * But allows for the use of
far less fiber in the composite which yields a significant per part cost reduction.
The ultimate goal is to combine technologies where possible: Example: Savings from a new precursor produced by the advanced oxidation and MAP processes coupled with the fiber volume reduction achieved through interfacial optimization. The combining of technologies will occur in the CFTF along with scale-up with and transfer to industry.
Cost Reducing TechnologiesCost Reducing Technologies
15 Managed by UT-Battellefor the U.S. Department of Energy Presentation_name
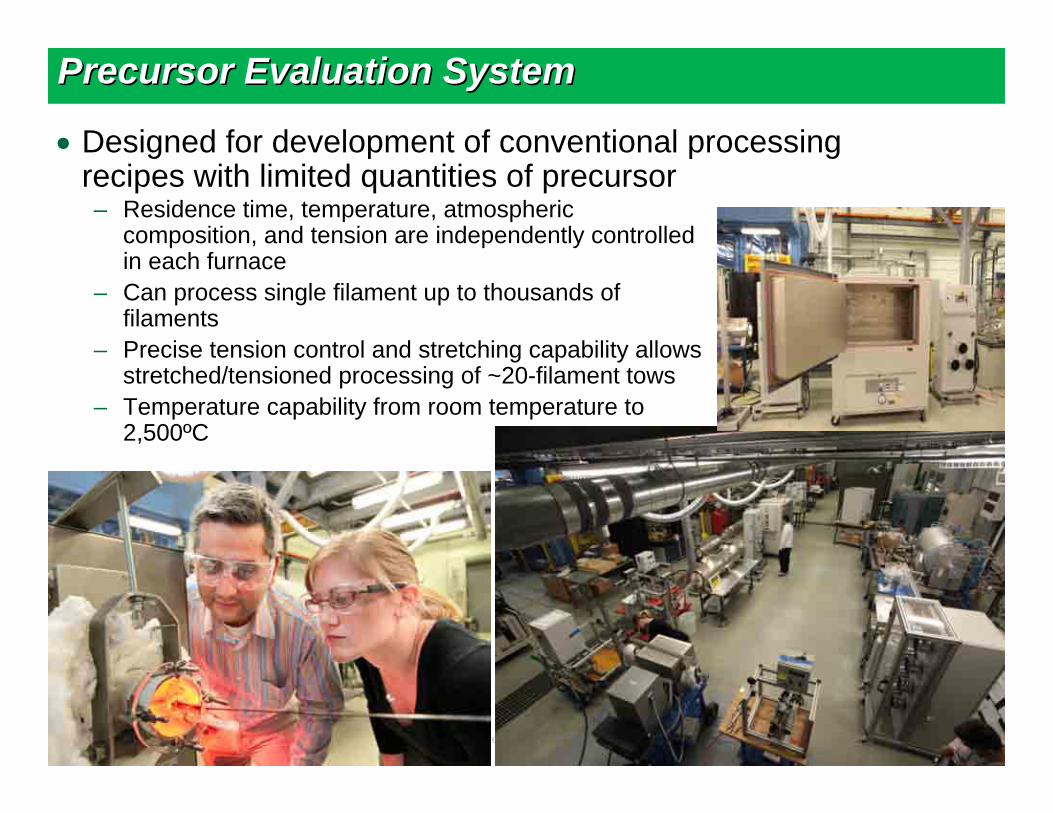
Designed for development of conventional processing recipes with limited quantities of precursor
Precursor Evaluation SystemPrecursor Evaluation System
– Residence time, temperature, atmospheric composition, and tension are independently controlled in each furnace
– Can process single filament up to thousands of filaments
– Precise tension control and stretching capability allows stretched/tensioned processing of ~20-filament tows
– Temperature capability from room temperature to 2,500ºC
16 Managed by UT-Battellefor the U.S. Department of Energy Presentation_name
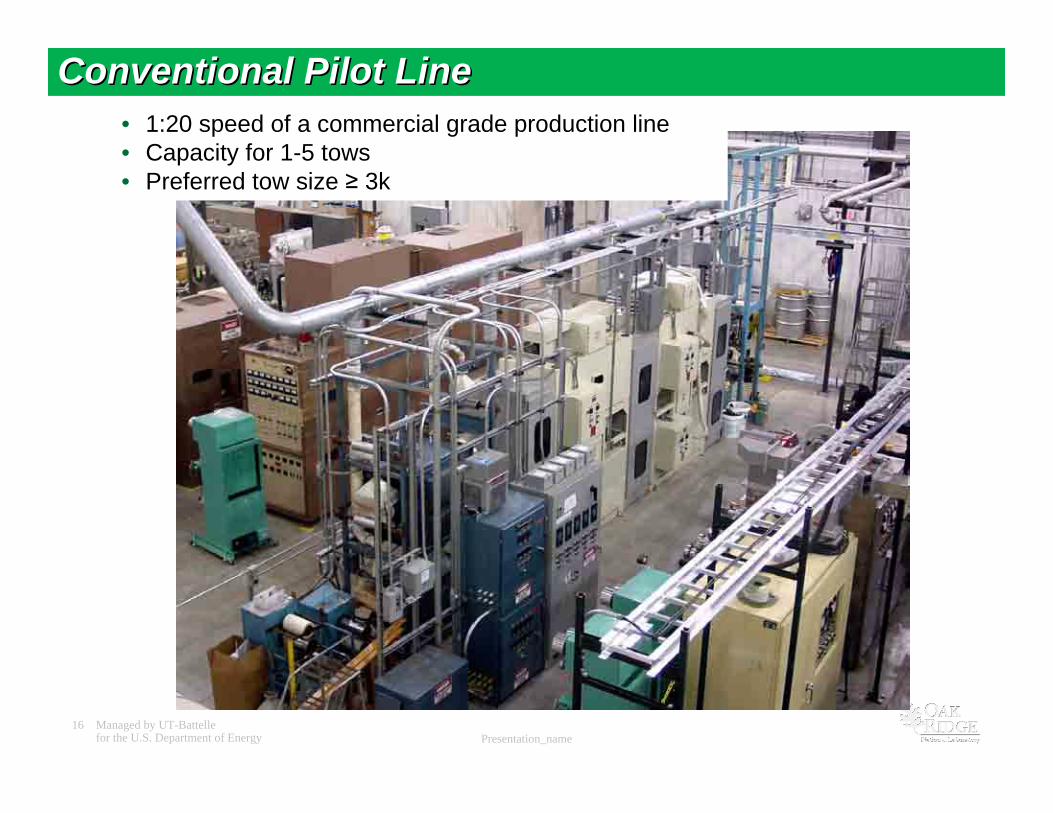
Conventional Pilot LineConventional Pilot Line• 1:20 speed of a commercial grade production line• Capacity for 1-5 tows• Preferred tow size ≥ 3k
17 Managed by UT-Battellefor the U.S. Department of Energy Presentation_name
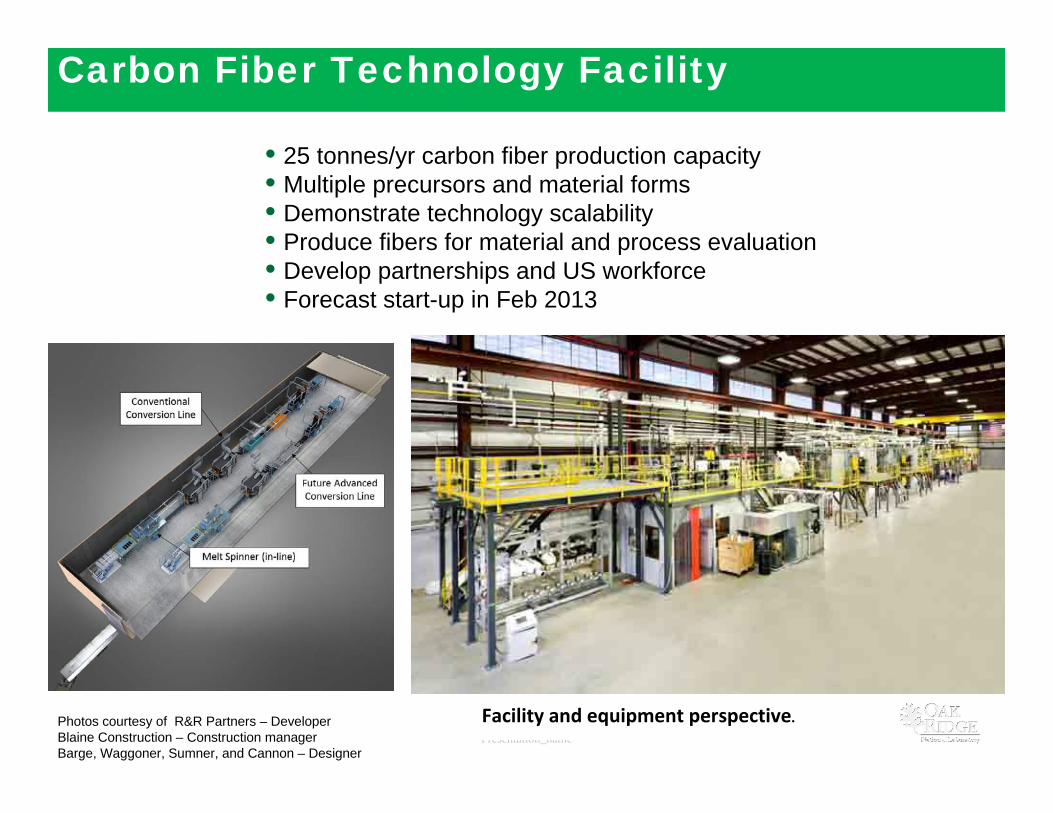
Carbon Fiber Technology Facility
Facility and equipment perspective.
• 25 tonnes/yr carbon fiber production capacity• Multiple precursors and material forms• Demonstrate technology scalability• Produce fibers for material and process evaluation • Develop partnerships and US workforce• Forecast start-up in Feb 2013
Photos courtesy of R&R Partners – DeveloperBlaine Construction – Construction managerBarge, Waggoner, Sumner, and Cannon – Designer

18 Managed by UT-Battellefor the U.S. Department of Energy Presentation_name
ORNL has Fostered the the Development of the OnlyIndustry Consortium Focused on Low-Cost Carbon Fiber
19 Managed by UT-Battellefor the U.S. Department of Energy Presentation_name
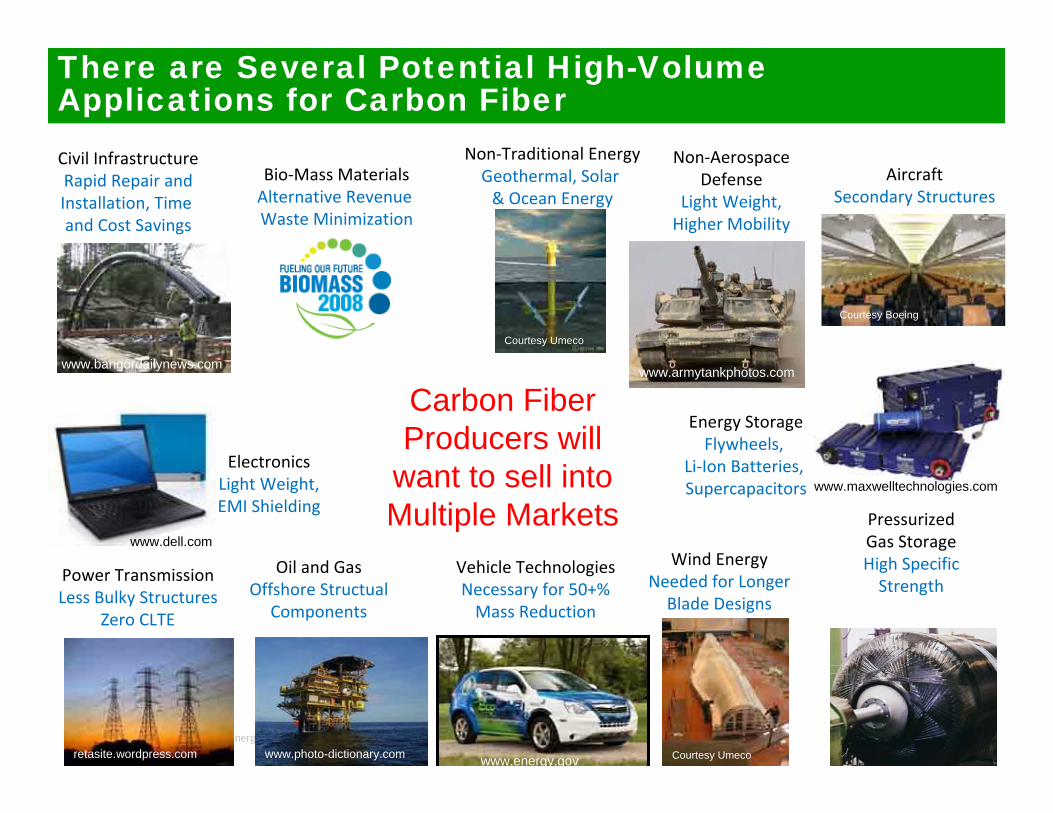
PressurizedGas StorageHigh SpecificStrength
Wind EnergyNeeded for LongerBlade Designs
Vehicle TechnologiesNecessary for 50+%Mass Reduction
Oil and GasOffshore Structual
Components
Power TransmissionLess Bulky Structures
Zero CLTE
Civil InfrastructureRapid Repair andInstallation, Time and Cost Savings
Bio‐Mass MaterialsAlternative Revenue Waste Minimization
Non‐AerospaceDefense
Light Weight,Higher Mobility
ElectronicsLight Weight,EMI Shielding
AircraftSecondary Structures
Non‐Traditional EnergyGeothermal, Solar & Ocean Energy
Energy StorageFlywheels,
Li‐Ion Batteries, Supercapacitors
Courtesy Umeco
Courtesy Umeco
There are Several Potential High-Volume Applications for Carbon Fiber
www.bangordailynews.com www.armytankphotos.com
www.maxwelltechnologies.com
www.energy.gov
www.dell.com
retasite.wordpress.com www.photo-dictionary.com
Courtesy Boeing
Carbon Fiber Producers will
want to sell into Multiple Markets

20 Managed by UT-Battellefor the U.S. Department of Energy Presentation_name
Thank you for your attention.
Questions?