Embed Size (px)
Citation preview
Title Lingual kinematics in a Cantonese speaker with dysarthria
Author(s) Wong, Chee-kei, Sally; 王芷琪
Citation
Issued Date 2009
URL http://hdl.handle.net/10722/173687
Rights Creative Commons: Attribution 3.0 Hong Kong License
1
Lingual Kinematics in a Cantonese Speaker with
Dysarthria: A Pilot Study
Wong Chee Kei, Sally
A dissertation submitted in partial fulfilment of the requirements for the Bachelor of Science
(Speech and Hearing Sciences), The University of Hong Kong, June 30, 2009
2
Lingual Kinematics in a Cantonese Speaker with Dysarthria: A Pilot Study
Wong Chee Kei, Sally
Abstract
The present study investigated the deviant lingual kinematic characteristics of a male
participant with dysarthria post stroke, in comparison with a non-neurological impaired-age
matched individual. Perceptual analysis revealed frequent substitution of /t/ for lingual
targets. Electromagnetic articulography (AG 500) was used to view, track and record the
lingual movement during single word production containing the lingual consonants (/t/, /th/,
/k/, /kh/, /ts/, /tsh/, /s/) at word initial position. Four kinematic parameters, duration,
displacement, velocity and acceleration, were obtained and analysed. The results showed that
there was longer lingual movement duration and displacement in the production of dysarthric
speaker. Reduction of velocity and acceleration were also observed. Additional information
showed that the displacement of the error phonemes were similar to those for /t/, possibly
accounting for the perceptual results. The impairment observed in the kinematic parameters
provided objective measurement in understanding the articulatory disturbances exhibited by
dysarthric individuals.
3
Dysarthria is “a collective name for a group of related speech disorders that are due to
disturbance in muscular control of the speech mechanism resulting from impairment of any
of the basic motor processes involved in the execution of speech” (Darley, Aronson, &
Brown, 1975, pp.2). Due to impairment of the central or peripheral nervous system,
abnormalities in the strength, range, speed, steadiness, tone, or accuracy of movement
responsible for the control of respiratory, phonatory, resonatory, articulatory and prosodic
aspects of speech production are noted (Darley et al., 1975). Among the five functional
speech aspects, approximately 98% of dysarthric individuals have an articulatory dysfunction,
caused by impaired tongue function (Duffy, & Folger, 1996; Khedr, Abdel-Fadeila, El-Khilli,
& Ibrahima, 2005; Stangel, Stapf, & Marx, 1999; Umapathi, et al., 2000). According to
Theodoros, Murdoch & Chenery (1994), the main deviant articulatory characteristics
observed in dysarthic speech were phoneme prolongation, simplification and substitution.
Apart from this, reduced speech production rate was also common in dysarthric individuals
(Darley et al., 1975). Increased duration of tongue movement as well as reduced velocity and
acceleration/deceleration have been reported in kinematic studies, resulting in overshooting
(i.e. more tongue-palatal contact than that required for normal perceptual production) and/or
undershoorting (i.e. less complete tongue-palatal contact than that expected for normal
perceptual production) (McAuliffe, Ward, Murdoch, 2005).
Spastic dysarthria, accounting for 8.2% of all dysarthrias, is caused by damage in the
upper motor neurons (UMN) (Duffy, 2005). The main function of the UMN system is to
regulate postures, reflexes and tone. With the damage to the UMN, muscle weakness,
spasticity, and reduced range and speed of articulatory movement will result, contributing to
strained voice quality, articulatory imprecision and reduced prosodic change.
Research has shown that 29 to 60% of poststroke speakers experience dysarthria
(Duffy, 1995; Wimbury, McMaster, & Brigga, 1990). Impaired tongue function has been
4
evidenced by using a rubber bulb pressure transducer. For example, by Thompson, Murdoch,
and Stokes (1995) who found that reduced lingual strength and rate of repetitive lingual
movement were noted in stroke patients with upper motor neuron type dysarthria. Although
the presence of tongue dysfunction has been demonstrated by using nonspeech examination,
further study, using kinematic assessment, is necessary to investigate the physiological basis
of dysarthric speech.
Due to past technical limitations, it was difficult to view and trace articulatory
movements. In the past, cineradiography (Kent, Netsell & Bauer, 1975; Kent, Netsell, 1975)
and x-ray microbeam system (Hirose, Kiritani & Sawashima, 1982) were used to track the
movement of articulators. However, these techniques involve radiation exposure. Another
method used to determine palatal-lingual contact is electropalatography (EPG). While EPG
measures temporal lingual movements during speech, the exact tongue-to-palate placement
can only be inferred (Kelly, Main, Manley, & McLean, 2000). Additionally, its use is limited
by the fact that an individual artificial palate must be constructed for each patient, which is
both costly and time-consuming (Thompson-Ward & Murdoch, 1998). Due to
methodological difficulties in the past, only a limited number of studies have been done on
investigating disturbance in oral motor structures exhibited by acquired dysarthric individuals.
A safe alternative to x-ray based techniques, Electromagnetic Articulography (EMA)
is an objective measurement using electromagnetic fields to track articulatory movements
during speech (Schonle et al., 1987). As perceptual ratings and acoustic analyses of speech
deficits can not provide valid data on kinematic measurements (e.g. duration, displacement,
velocity and acceleration) of articulatory disorders (Zyski & Weisiger, 1987), EMA can be
used to detect and record the movement of various articulators including jaw, lips, tongue and
velum, over time and along the mid-sigittal plane. Large amounts of data regarding the
nature of articulatory dysfunction can be collected, with minimal interference to speech by
5
the sensors (Schonle et al., 1987). This information is beneficial for the diagnostic evaluation
of patients with speech motor impairments, particular in identifying disturbances in accuracy
and speed of articulatory movement (Schonle et al., 1987).
As EMA is a newly developed technology, only a limited number of studies have
been administered. In the study of Goozee, Murdoch, Theodoros, & Stokes (2000), the
accuracy and speed of tongue movements of a dysarthric individual posttraumatic brain
injury (TBI) were investigated using EMA. Words and sentences embedded with the lingual
phonemes (/t/, /s/, and /k/) were used. By comparing the kinematic profile with a normal
subject, deceleration difficulty was noted, leading to a reduction in the accuracy of tongue
movement and placement and, finally, consonant imprecision. Kuruvilla, Murdoch and
Goozee (2007) used EMA to investigate articulatory kinematic differences between normal
and dysarthric individuals following TBI, in a group of participants with severe TBI (n = 10),
mild TBI (n = 6) and a control group (n = 14). In the study, syllables and sentences
embedded with /t/ and /k/ were used. Significant differences between speakers with severe
TBI and the control group were observed only for the maximum acceleration in the release
phase of the /t/ sentence productions. This may be due to the increased articulatory effort and
speech motor control required in sentence production tasks.
Apart from the EMA studies investigating dysarthric subjects post TBI, two recent
studies were done on investigating the lingual movement of dysarthric patients following
stroke. In the study of Chen, Murdoch and Goozee (2008a), tongue kinematic investigation
was administered in three groups of participants (10 poststroke dysarthric speakers, nine
poststroke non-dysarthric speakers and 19 non-neurologically impaired individuals). Tongue-
tip and tongue-back sentences were used. When comparing the three groups, an increase
movement duration and a reduction in the speed and acceleration/deceleration of lingual
movement was demonstrated in the dysarthric subjects. Reduction in lingual strength and
6
muscle fatigue may be the possible causes for this phenomenon (Chen et. al, 2008a).
Research was also done on investigating lingual kinematics during tongue-tip and tongue-
back sentence production in dysarthric speakers at six and 12 months following stroke (Chen,
Murdoch and Goozee, 2008b). Significant differences were found between the two groups in
various kinematic variables, particularly in longer movement duration. Chen et al. (2008b)
suggested that muscle weakness may reduce the rate of lingual movement, leading to more
traveling time required. However, since limited phonemes have been explored using EMA,
further investigation on different phonemes will be necessary.
The present study aimed to investigate the articulatory kinematics of consonant
production in a dysarthric individual poststroke. There were three main purposes that this
research study was carried out. Firstly, since most previous studies of dysarthria using EMA
have employed subjects following TBI, more data on the articulatory profile of stroke
patients could be obtained after this research was done. Secondly, as tongue is considered to
be the most important articulator in speech production (Smith, 1992), the articulatory
dynamics of tongue during target consonant production (i.e. /t/, /k/, /s/, /ts/, /tsh/, /th/, /kh/) in
dysarthric patient would be investigated. For dysarthric subjects, the voiced plosives (/p/, /k/
and /t/) and fricative (/s/) were mainly used in previous EMA studies (Goozee et. al., 2000;
Jaeger Hertrich, Stattrop, Schonle, & Ackermann, 2000; Bartle, Goozee, Murdoch, &
Kuruvilla, 2006; Kuruvilla et. al., 2007). In the production of affricates and aspirated
phonemes, more coordination between different speech sub-systems is necessary. This will
place a higher demand for dysarthric individuals in production. In order to develop a holistic
kinematic profile of dysarthric patients, investigation on affricates and aspirated phonemes
will be included in the present study. Thirdly, a high occurrence of articulatory errors was
noted in the speech of dysarthric individuals (Theodoros et al., 1994). However, no current
EMA research was done on investigating the phonological errors. Hence, exploration on this

7
area is essential so as to increase the understanding of the physiological underpinnings of
dysarthria.
Based on the results of nonspeech physiological assessment of dysarthric speaker
poststroke (Thompson et. al, 1995) and previous EMA research (Chen et. al, 2008a; Chen et.
al, 2008b; Goozee et. al, 2000; Kuruvilla et. al, 2007), it was hypothesized that abnormal
lingual kinematics including longer duration, and increased/decreased displacement, velocity
as well as acceleration would be observed in the dysarthric individual in the study, when
comparing with the aged-matched control.
Method
Participants
One male individual (DP) with spastic dysarthria and co-existing transcortical mixed
aphasia, aged 49 years, participated in the study. DP was two years post-onset of left-
hemisphere stroke. The diagnosis of dysarthria was determined by an experienced speech-
language pathologist who was unconnected to the study, based on a formal speech and
language assessment.
One non-neurologically impaired female individual (CP), aged 48 years, participated
in the study to serve as the age-matched control. CP had no history of neurological and/or
speech and language disorders. Both DP and CP were native Cantonese speakers. As no
gender differences have been reported in previous kinematic studies, it is therefore feasible to
use a female participant for the control.
Perceptual assessment
A speech sample comprising target syllables embedded in carrier phrase was collected.
The dysarthric participant was instructed to produce sentences at usual rate and volume. The
results were then analyzed and transcribed by an experienced speech pathologist. A
dysarthria rating scale, with seven sections (pitch, loudness, voice quality, resonance,
8
respiration, prosody and articulation) modified from Duffy (2005) and Darley, Aronson and
Brown (1969a, 1969b), was adopted in the form of a visual analog scale. Comments on these
seven areas were also given. Additionally, duration of vowel prolongation, alternating motion
rates (AMR) and sequential motion rates (SMR) were measured. Phonetic transcription of
error phonemes was made, based on the speech sample. The transcription was used to
compare the perceptual and the kinematic data of the tongue so as to identify the underlying
physiological cause of phonological errors.
EMA assessment
Principles. The AG-500 system (Carstens Medizinelectronik, Lenglern, Germany),
which has proven to be appropriate for speech movement acquisition (Yunusova, Green, &
Mefferd, 2009) was used to view, track and record the movement of the articulators during
speech production. This device can not only measure three dimensional planes, namely X
axis (anterior-posterior plane), Y axis (transversal plane) and Z axis (longitudinal plane), but
also two angular coordinates. The system consists of six transmitter coils which are arranged
in the EMA cube in a defined layout. Each transmitter generates magnetic field at
frequencies between 7.5 to 13.75 kHz to induce AC currents in up to 12 receiver coils
(sensors) that are placed on the articulators. By computing the six current amplitudes in each
receiver coils, the distance between each sensor and each transmitter can be measured at a
sampling rate of 200 Hz. With the aid of this information, the displacement, speed and
acceleration of articulators can be calculated.
Instrument preparation. According to the standard procedures for EMA, the system
was turned on two hours before doing the assessment, for preparation. This ensured that a
stable operative temperature could be attained. When the temperature was stabilized,
calibration was administered. The reason for doing calibration is to define the relationship
between voltage and distance for each transmitter coil and each sensor. Each sensor was
9
calibrated according to the calibration instructions in the AG-500 manual. Repeating the
calibration was necessary if the calibration data (six items) were not within the expected
range. The calibration process took 45 minutes. After the calibration, the sensors were
coated with latex (Plasty-late), with 15-minutes for drying before attaching them to the
participants.
Measurement procedure. During the EMA assessment, the participants were
positioned in a straight-back chair within the electrically shielded laboratory room containing
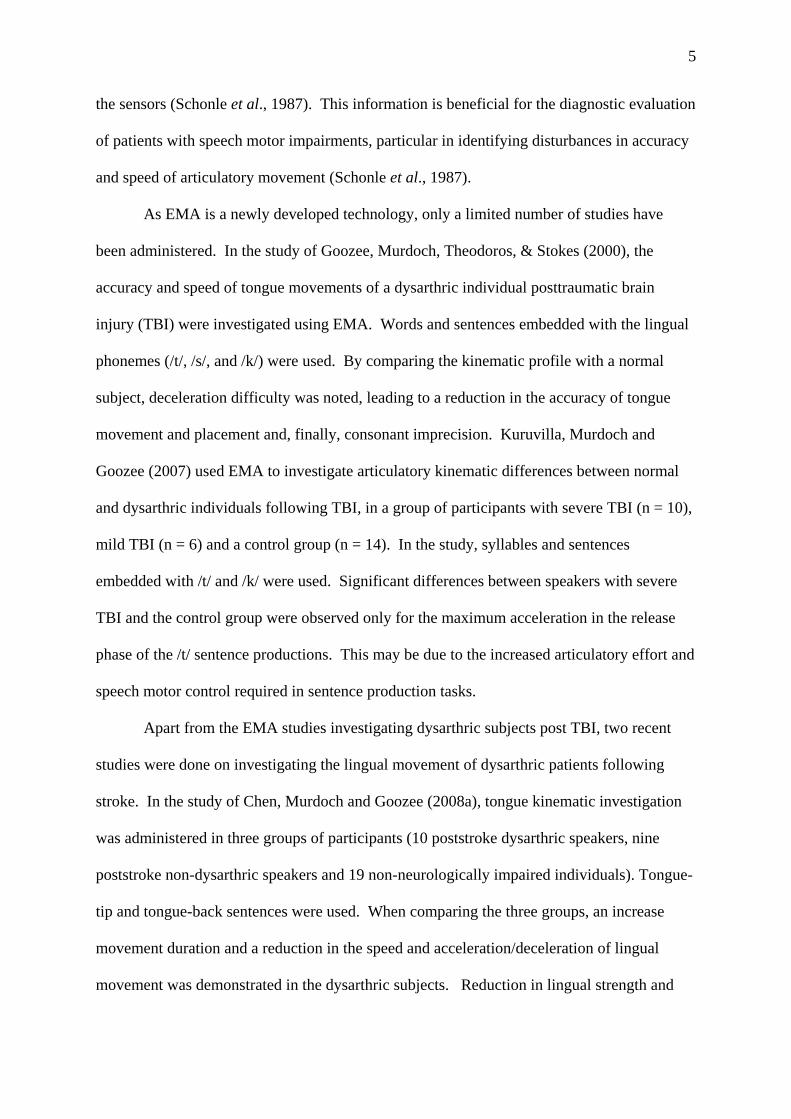
the AG 500. Five sensors were used in the collecting data (Figure 1). Two were placed on
the midline of the tongue at one cm and two cm from the tongue tip to trace the movement of
anterior and middle part of the tongue respectively. The remaining three, acting as the
reference sensors, were placed on the nasal bridge, on the gingiva above the front teeth and
the back of the ear, respectively. Before the actual examination was administered, 15
minutes were given to the participants to adapt to the sensors. During this time, the subjects
were asked to practice the words from the assessment protocol. The test began when the
participants reported to speak comfortably with the sensors in place. During the recording,
the participants were asked to repeat the words embedded with the target phonemes in
random order, ten times, at habitual rate and loudness level. A microphone was placed about
10 cm from the mouth to record acoustic signals.

10
Figure 1. Five sensors attached on (1) the tongue one cm from tongue tip, (2) two cm from
tongue tip, (3) nasal bridge, (4) gingiva above the front teeth, and (5) the back of the ear
Speech material. In the protocol, seven single-syllable real words of CV construction
at high level tone were included. The target consonants were in the word-initial position.
They consisted of unaspirated alveolar stop /t/ (打 /ta1/), aspirated alveolar stop /th/ (他 /tha1/),
unaspirated velar stop /k/ (家 /ka1/), aspirated velar stop /kh/ (卡 / kha/), unaspirated alveolar
affricate /ts/ (渣 /tsa1/), aspirated alveolar affricate /tsh/ (叉 /tsha/) and alveolar fricative /s/
(沙 /sa1/). Each target consonant was preceded by a low vowel /a/, which facilitated the
lingual movement to and from the palate (Goozee et. al, 2000).
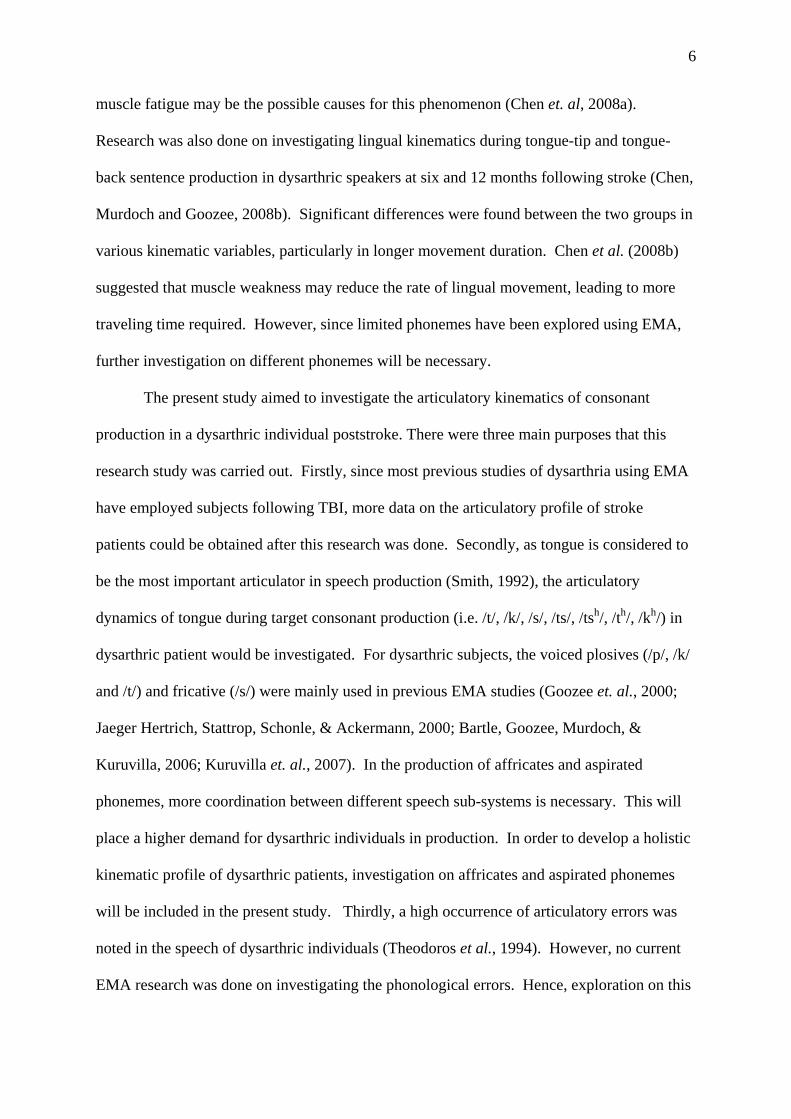
Data analysis. A custom-written script in the Matlab© program (version 7.4.0, The
Mathworks, Inc. 2007) was used to analyze the kinematic data recorded. Prior to data
analysis, a moving average filter with window size of 10 samples to the signal was applied.
To identify different parts of the single word production, kinematic profile was used. An
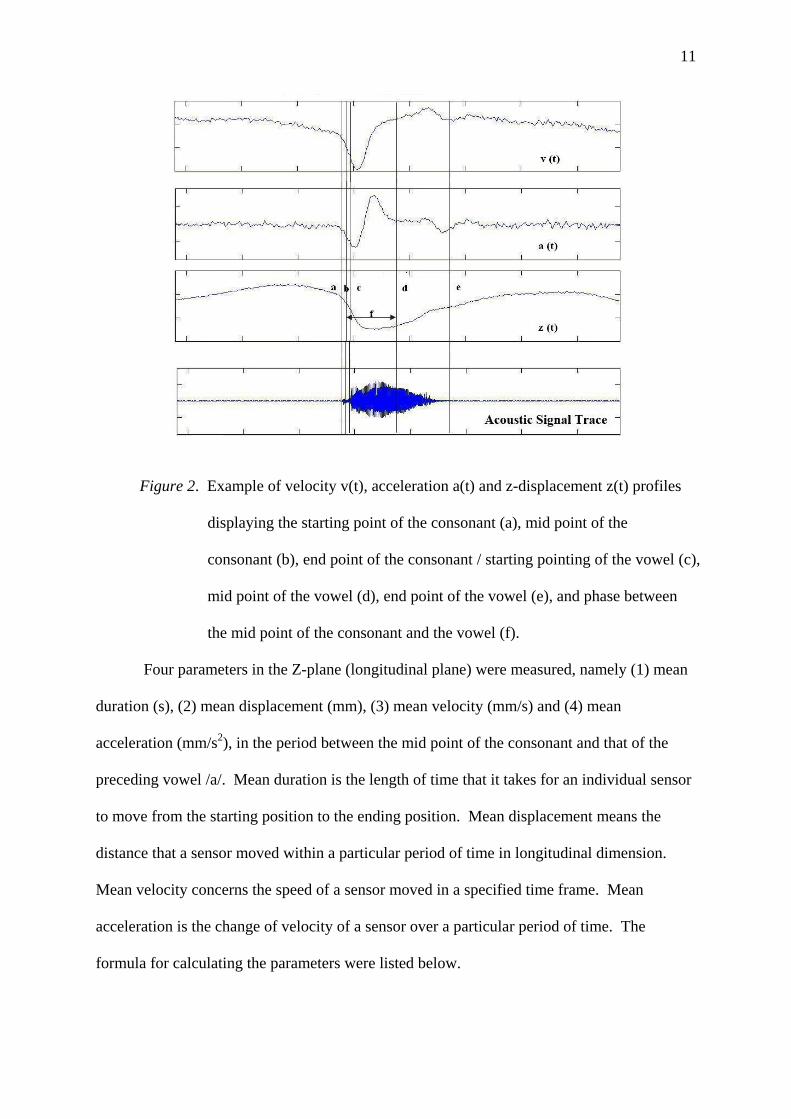
example was illustrated in figure 2.
11
Figure 2. Example of velocity v(t), acceleration a(t) and z-displacement z(t) profiles
displaying the starting point of the consonant (a), mid point of the
consonant (b), end point of the consonant / starting pointing of the vowel (c),
mid point of the vowel (d), end point of the vowel (e), and phase between
the mid point of the consonant and the vowel (f).
Four parameters in the Z-plane (longitudinal plane) were measured, namely (1) mean
duration (s), (2) mean displacement (mm), (3) mean velocity (mm/s) and (4) mean
acceleration (mm/s2), in the period between the mid point of the consonant and that of the
preceding vowel /a/. Mean duration is the length of time that it takes for an individual sensor
to move from the starting position to the ending position. Mean displacement means the
distance that a sensor moved within a particular period of time in longitudinal dimension.
Mean velocity concerns the speed of a sensor moved in a specified time frame. Mean
acceleration is the change of velocity of a sensor over a particular period of time. The
formula for calculating the parameters were listed below.
12
(1) Mean duration = t2 – t1 where t1 = time at mid point of the consonant
t2 = time at mid point of the vowel /a/
(2) Mean displacement = d2 – d1 where d1 = position at mid point of the consonant
d2 = position at mid point of the vowel /a/
(3) Mean Velocity = (d2 – d1)* (fn) where f = frequency of EMA
n = number of data points between the mid
point of the consonant and that of the
vowel /a/
(4) Mean Acceleration = (v2 – v1) * (fn) where v1 = velocity at mid point of the consonant
v2 = velocity at mid point of the vowel /a/
The kinematic data of the tongue at one cm was analyzed for all seven phonemes while the
four parameters of the tongue at two cm were also analyzed for alveolar unaspirated stop /t/,
velar unaspirated stop /k/ and velar aspirated stop /kh/.
Results
Perceptual Analysis
In the task of vowel prolongation, the maximum phonation time was found to be 2.86
seconds which was shorter than normal adult male (Kent, Kent, & Rosenbek, 1987). The
AMR (/pa/ = 2.3/sec; /ta/ = 2.3/sec, /ka/ = 1.4/sec) and the SMR (1.71/sec) were also slower
than non-impaired adults (Kent et. al, 1987). For dysarthria rating scale, DP’s speech
appeared to be normal in all the parameters in resonance and respiration (Appendix A).
Monoloudness was noted to be mild in the speech sample (i.e. the carrier phrases carrying the
target), with no occurrence of loudness decay and alternation. DP’s voice was found to be
mildly strained-strangled, with mild excess and equal stress. His production rate was
moderately slow and the phrases produced were severely short. DP’s pitch level was
abnormally high, especially at the end of sentences. Based on the speech sample, four
13
articulatory errors were observed: stopping (/s/ [t]), deaspiration (/kh/ [k]; /tsh/ [t]; /th/
[t]), deaffrication (/ts/ [t]; /tsh/ [t]) and fronting (/N/ [t]).
EMA Data Analysis
Descriptive statistics were used to analyze the kinematic parameters of (1) mean
duration (s), (2) mean displacement (mm), (3) mean velocity (mm/s) and (4) mean
acceleration (mm/s2) in the phase between the mid-point of consonant and the vowel. The
mean values of these parameters of the tongue tip and mid-portion of the tongue are
summarized in Appendix B and Appendix C respectively.
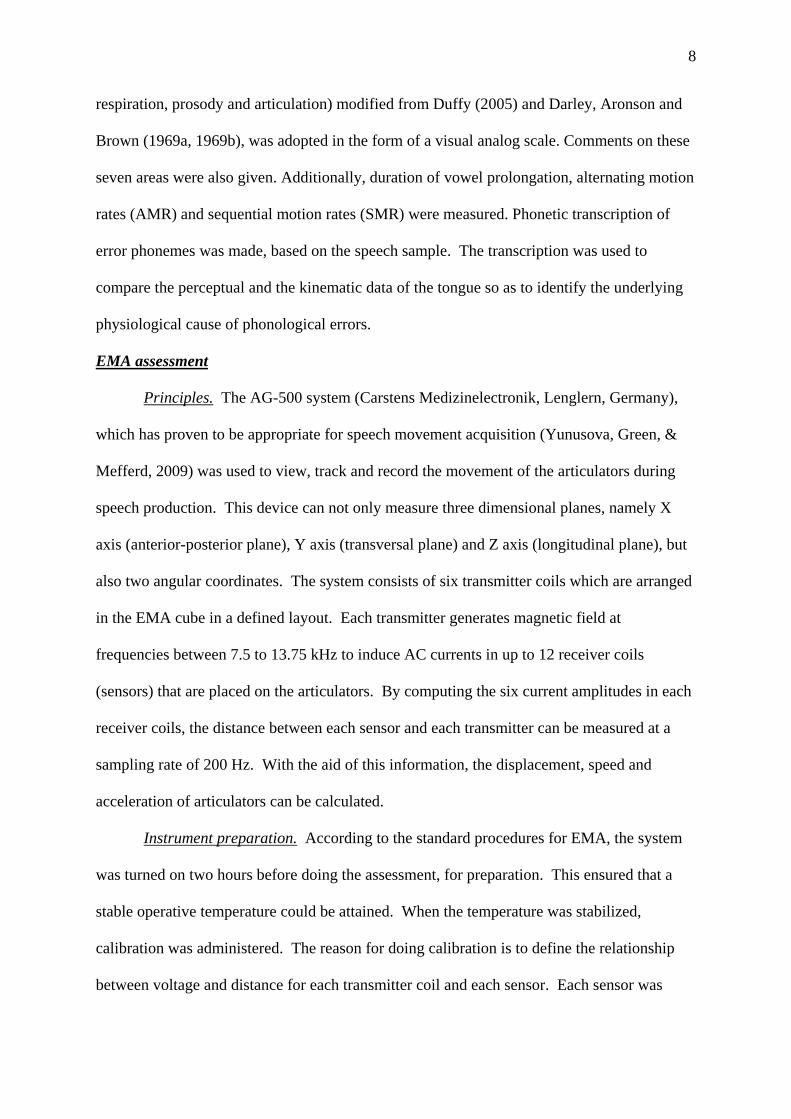
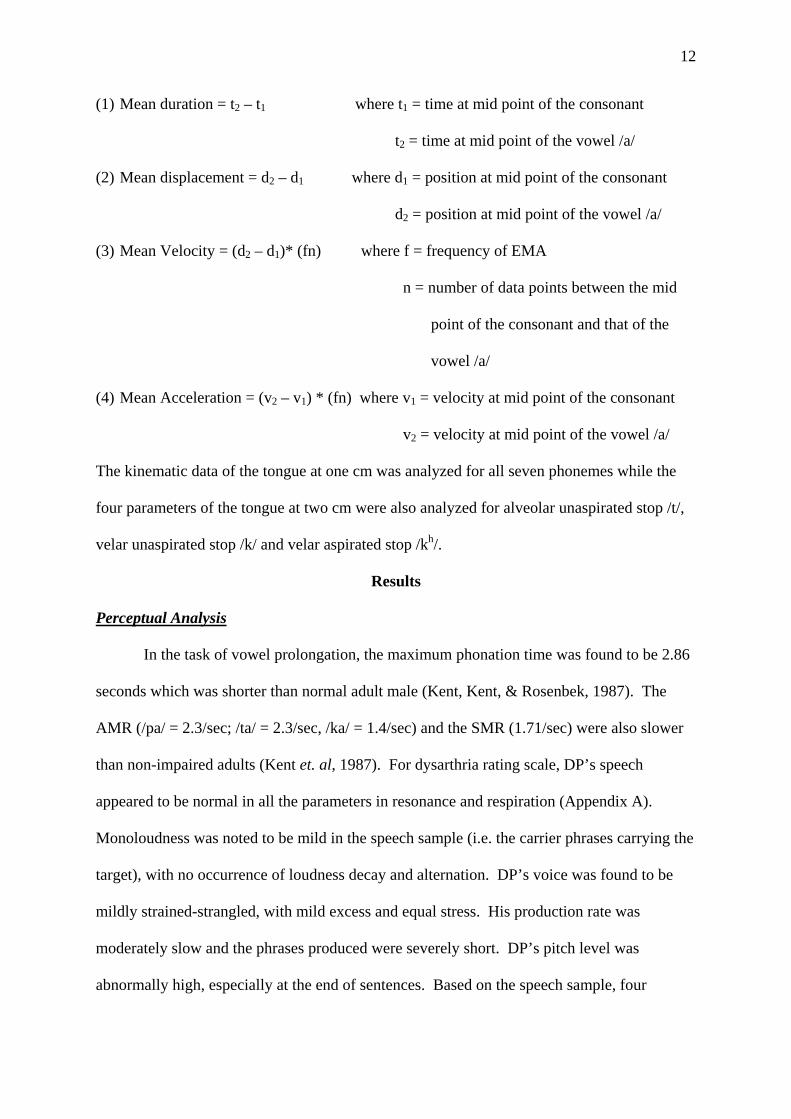
Mean Duration
The mean duration of tongue tip for each target phonemes were compared between
CP and DP. The absolute values are shown in Appendix D. Figure 3 shows the comparison
of the mean duration of different phonemes of the two participants. The mean duration of all
phonemes of CP was averagely 0.25 seconds (Standard deviation (SD): 0.07) shorter than
that of DP. The greatest difference between CP and DP was observed in the production of
initial unaspirated velar plosive /k/ (0.36 seconds).
0
0.1
0.2
0.3
0.4
0.5
0.6
/t/ /th/ /ts/ /tsh/ /s/ /k/ /kh/
Phonemes
Tim
e (s
)
CPDP
Figure 3. Comparison of mean duration of different phonemes for the control (CP) and the
dysarthric participant (DP).

14
Mean Velocity. Mean velocity differences between CP and DP were calculated for
each phoneme. The absolute values are shown in Appendix D. Figure 4 compares the mean
velocity of the phonemes at one cm for the two individuals. It was observed that the tongue
tip of CP moved faster than that of DP for all phonemes, with an average difference 14.26
mm/s (SD: 8.36). The greatest difference in mean velocity between CP and DP was observed
in the production of initial aspirated velar plosive /kh/ (24.75 mm/s).
0
20
40
60
80
/t/ /th/ /ts/ /tsh/ /s/ /k/ /kh/
Phonemes
Vel
ocity
(m
m/s)
CPDP
Figure 4. Comparison of mean velocity of tongue tip of different phonemes for the control
(CP) and the dysarthric participant (DP).
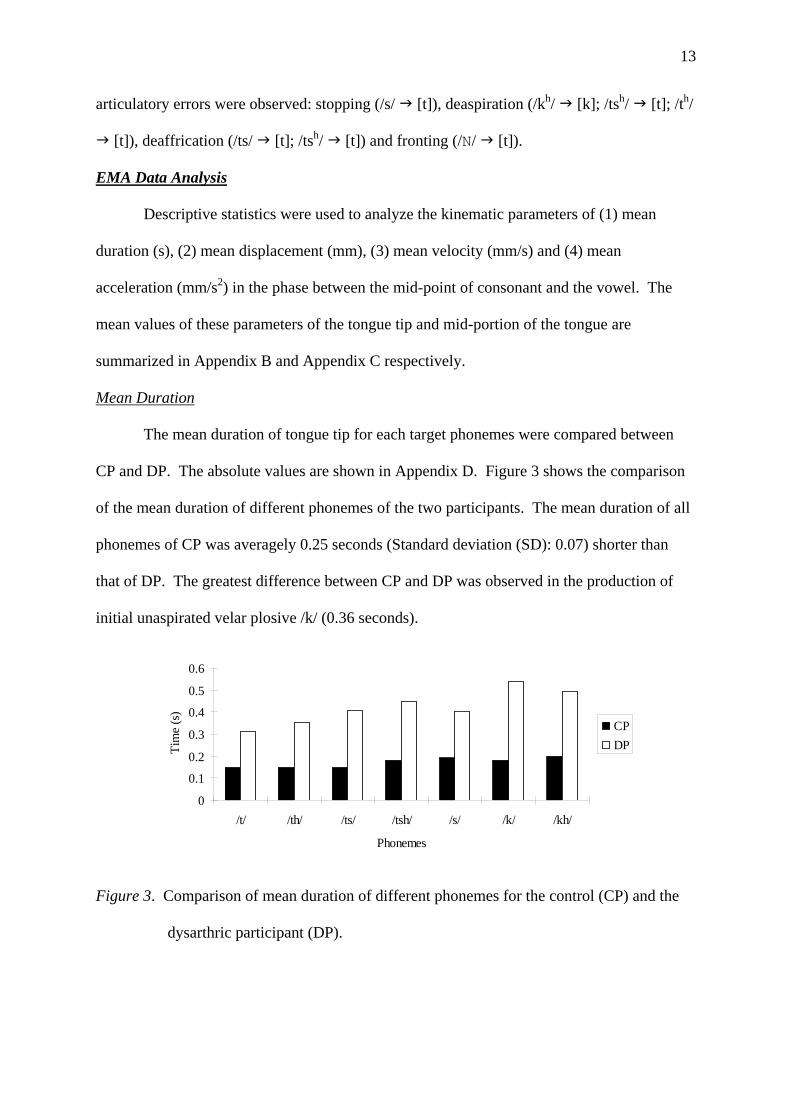
Mean Acceleration. Mean acceleration differences between CP and DP were
calculated for each phoneme. The absolute values are shown in Appendix D. Figure 5
showed the comparison on the mean acceleration of phonemes at tongue one cm among two
individuals. The mean acceleration of CP’s tongue tip for all phonemes was on average
106.13 mm/s2 (SD: 72.85) higher than that of DP. The greatest difference in mean
acceleration between CP and DP was observed in the production of initial aspirated alveolar
plosive /th/ (198.48 mm/s2).
15
050
100150200250300
/t/ /th/ /ts/ /tsh/ /s/ /k/ /kh/
Phonemes
Acc
eler
atio
n (m
m/s2
)
CPDP
Figure 5. Comparison of mean acceleration of tongue tip in the seven phonemes between the
control (CP) and the dysarthric participant (DP).
Displacement. Mean displacement differences between CP and DP were calculated
for each phoneme. The absolute values are shown in Appendix D. Figure 6 illustrated the
comparison of displacement of phonemes at tongue tip among two individuals. Results
showed that the tongue tip of CP moved on average 6.54 mm (SD: 1.72) less than that of
DP for the seven phonemes. The greatest difference in mean displacement between CP and
DP was observed in the production of initial unaspirated velar plosive /k/ (9.76 mm).
0
5
10
15
20
/t/ /th/ /ts/ /tsh/ /s/ /k/ /kh/
Phonemes
Disp
lacem
ent (
mm
)
CPDP
Figure 6. Comparison of mean displacement of tongue tip in the seven phonemes between
the control (CP) and the dysarthric participant (DP)
16
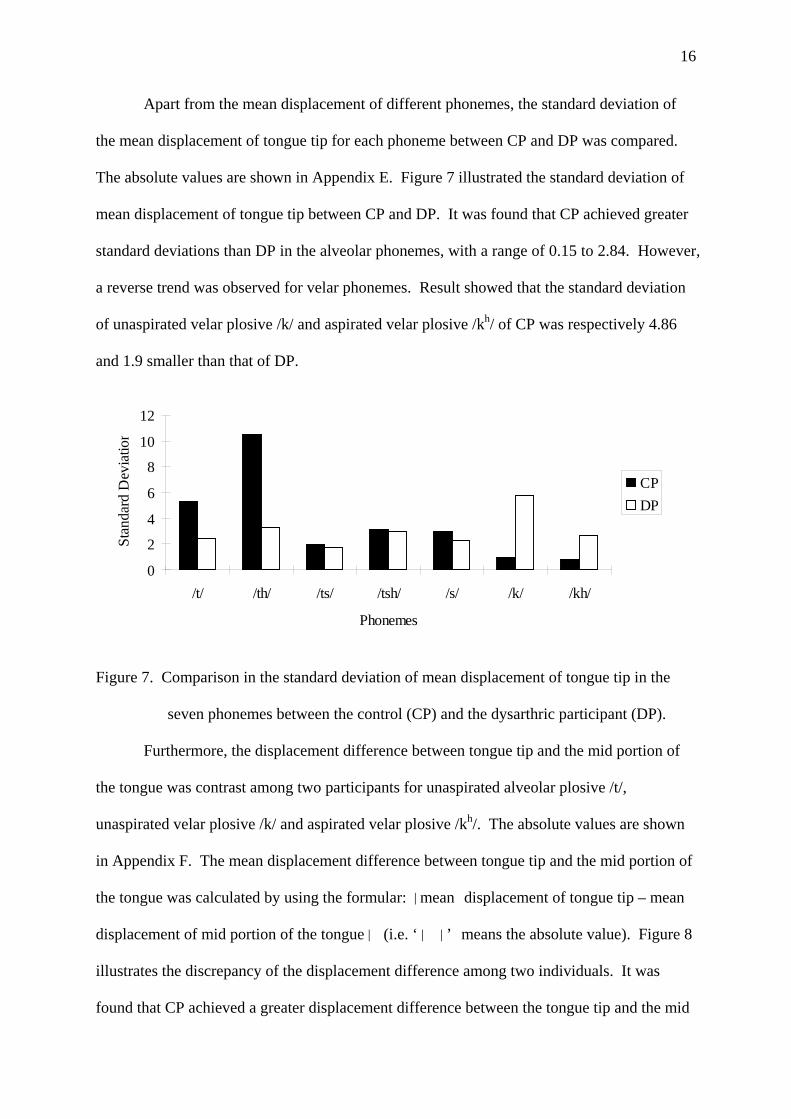
Apart from the mean displacement of different phonemes, the standard deviation of
the mean displacement of tongue tip for each phoneme between CP and DP was compared.
The absolute values are shown in Appendix E. Figure 7 illustrated the standard deviation of
mean displacement of tongue tip between CP and DP. It was found that CP achieved greater
standard deviations than DP in the alveolar phonemes, with a range of 0.15 to 2.84. However,
a reverse trend was observed for velar phonemes. Result showed that the standard deviation
of unaspirated velar plosive /k/ and aspirated velar plosive /kh/ of CP was respectively 4.86
and 1.9 smaller than that of DP.
0
2
4
6
8
10
12
/t/ /th/ /ts/ /tsh/ /s/ /k/ /kh/
Phonemes
Stan
dard
Dev
iatio
n
CPDP
Figure 7. Comparison in the standard deviation of mean displacement of tongue tip in the
seven phonemes between the control (CP) and the dysarthric participant (DP).
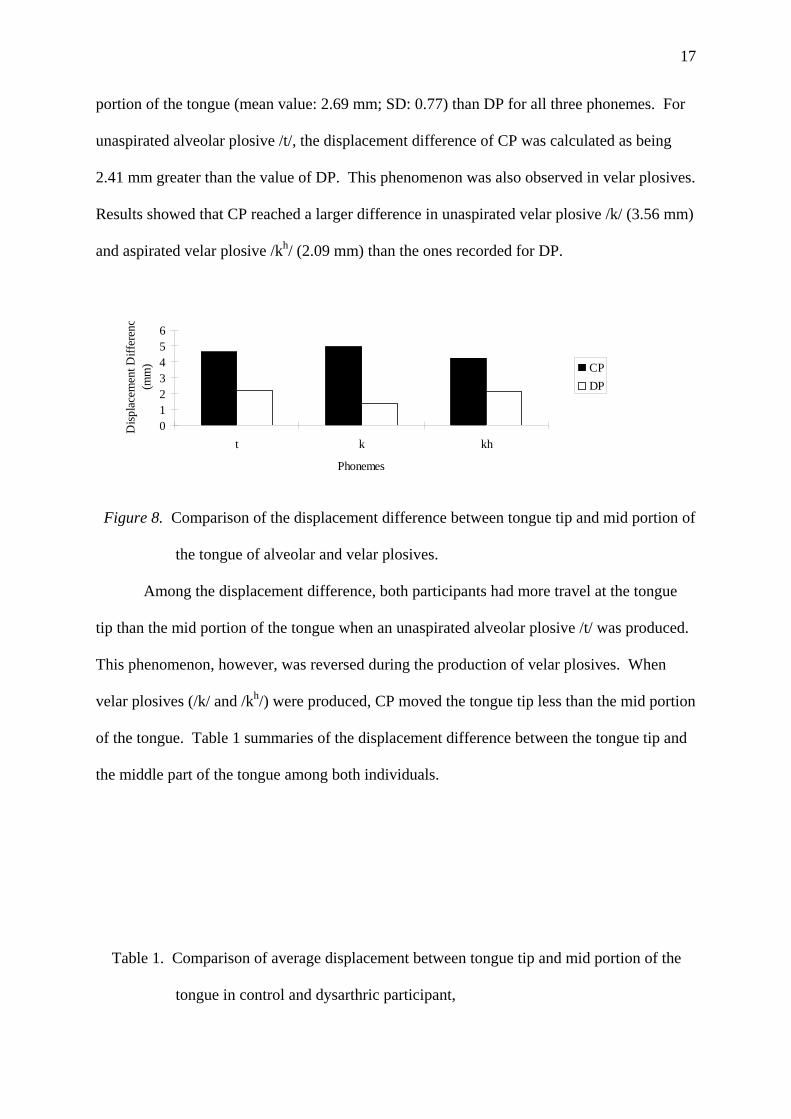
Furthermore, the displacement difference between tongue tip and the mid portion of
the tongue was contrast among two participants for unaspirated alveolar plosive /t/,
unaspirated velar plosive /k/ and aspirated velar plosive /kh/. The absolute values are shown
in Appendix F. The mean displacement difference between tongue tip and the mid portion of
the tongue was calculated by using the formular: |mean displacement of tongue tip – mean
displacement of mid portion of the tongue| (i.e. ‘| |’ means the absolute value). Figure 8
illustrates the discrepancy of the displacement difference among two individuals. It was
found that CP achieved a greater displacement difference between the tongue tip and the mid
17
portion of the tongue (mean value: 2.69 mm; SD: 0.77) than DP for all three phonemes. For
unaspirated alveolar plosive /t/, the displacement difference of CP was calculated as being
2.41 mm greater than the value of DP. This phenomenon was also observed in velar plosives.
Results showed that CP reached a larger difference in unaspirated velar plosive /k/ (3.56 mm)
and aspirated velar plosive /kh/ (2.09 mm) than the ones recorded for DP.
0123456
t k kh
Phonemes
Disp
lace
men
t Diff
eren
c(m
m) CP
DP
Figure 8. Comparison of the displacement difference between tongue tip and mid portion of
the tongue of alveolar and velar plosives.
Among the displacement difference, both participants had more travel at the tongue
tip than the mid portion of the tongue when an unaspirated alveolar plosive /t/ was produced.
This phenomenon, however, was reversed during the production of velar plosives. When
velar plosives (/k/ and /kh/) were produced, CP moved the tongue tip less than the mid portion
of the tongue. Table 1 summaries of the displacement difference between the tongue tip and
the middle part of the tongue among both individuals.
Table 1. Comparison of average displacement between tongue tip and mid portion of the
tongue in control and dysarthric participant,
18
Displacement difference (mm) Phoneme Control Dysarthric participant /t/ + 4.62 + 2.21 /k/ - 4.96 - 1.40 /kh/ - 4.23 - 2.14
Note: Negative value = average displacement of tongue tip less than that of mid portion of
the tongue; Positive value = average displacement of tongue tip greater than that of
mid portion of the tongue
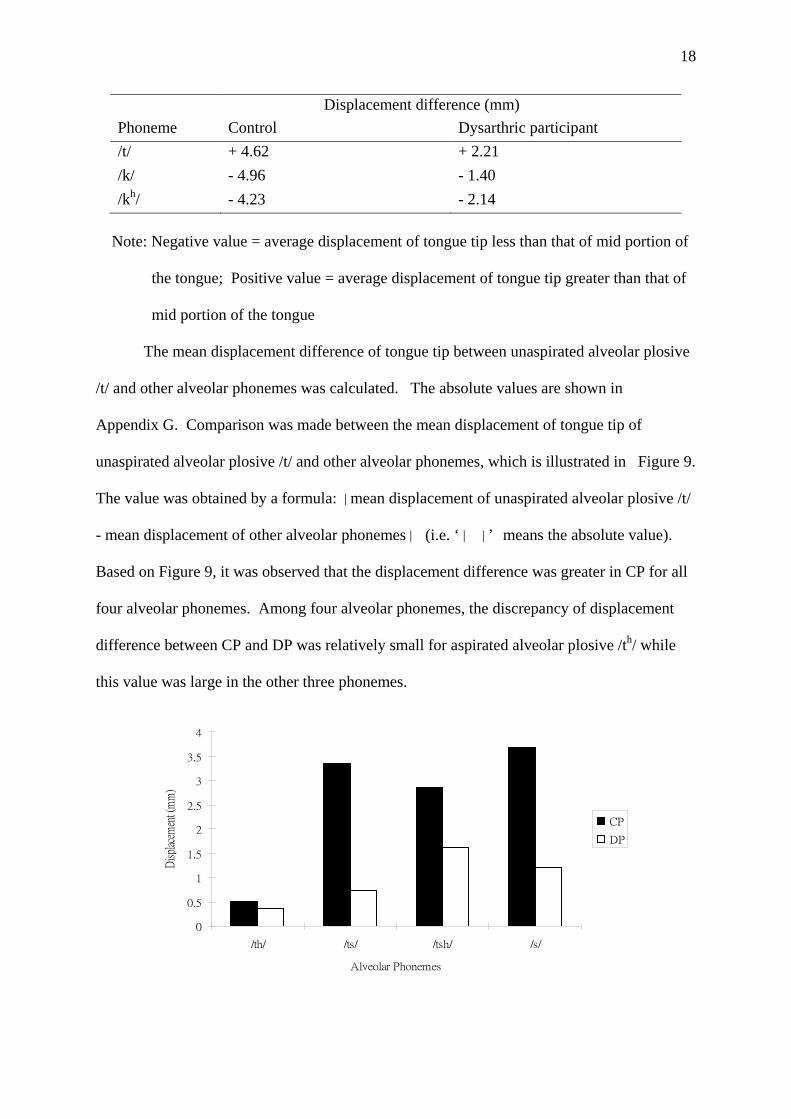
The mean displacement difference of tongue tip between unaspirated alveolar plosive
/t/ and other alveolar phonemes was calculated. The absolute values are shown in
Appendix G. Comparison was made between the mean displacement of tongue tip of
unaspirated alveolar plosive /t/ and other alveolar phonemes, which is illustrated in Figure 9.
The value was obtained by a formula: |mean displacement of unaspirated alveolar plosive /t/
- mean displacement of other alveolar phonemes| (i.e. ‘| |’ means the absolute value).
Based on Figure 9, it was observed that the displacement difference was greater in CP for all
four alveolar phonemes. Among four alveolar phonemes, the discrepancy of displacement
difference between CP and DP was relatively small for aspirated alveolar plosive /th/ while
this value was large in the other three phonemes.
0
0.5
1
1.5
2
2.5
3
3.5
4
/th/ /ts/ /tsh/ /s/
Alveolar Phonemes
Dis
plac
emen
t (m
m)
CP
DP
19
Figure 8. Bar chart for the comparison of displacement difference of tongue tip
between unaspirated alveolar plosive /t/ and other alveolar phonemes.
The mean displacement difference at tongue two cm between unaspirated velar
plosive /k/ and aspirated velar plosive /kh/ was calculated. The value obtained by CP and DP
was 0.50 mm and 0.86 mm respectively, with 0.36 difference in between.
Discussion
The aim of the study was to investigate the kinematic parameters, namely
displacement, velocity and acceleration, of a Cantonese dysarthric speaker for seven target
lingual phonemes. The results demonstrated that DP exhibited deviant kinematic
characteristics in all seven phonemes, when compared with a non-impaired control speaker,
CP. Additional information on comparing the mean displacement difference between the
alveolar error phonemes and /t/ was shown.
In the production for all seven phonemes, the mean duration was longer in DP than
CP during the phase between the mid point of the consonants and the vowel. Smaller mean
velocity and acceleration value were also observed in DP. This was consistent with the
results found by Chen et. al. (2008a). Three possible explanations may be used to account for
these phenomena, including the increased in mean displacement traveled, reduced tongue
muscle force production and muscle spasiticity.
The longer time required for DP to reach each target may be the consequence of
increased displacement traveled for the phonemes. As shown from the result, it was found
that the mean displacement measured at DP’s tongue tip (1cm) was longer than that for CP.
The longer distance to be traveled may have resulted in the slower velocity and acceleration
rates.
Another possible factor contributing to the increased duration may be reduced tongue
strength, caused by insufficient motoneural activiation (McClean & Clay, 1995). The UMN
20
system is responsible for sending nerve impulses to innervate muscle responsible for
articulatory movement (Darley et al., 1975). With a disruption of motor areas in the cerebral
cortex after stroke, less motor unit recruitment may be available to control the tongue, leading
to a reduction in tongue muscle force. Due to the weakness and imbalance of muscle strength,
more time will be necessary to allow full range of movement and coordination of various
muscle units (Duffy, 2005). While displacement and speed have been noted to be positively
correlated with electromyography (EMG) activity in lip and jaw muscles, this relationship is
only speculated for tongue muscle (McClean & Tasko, 2003). To confirm the hypothesis
would require further investigation of the relationship between tongue muscle force and
displacement during phoneme production.
The third contributor to the longer duration of DP may be caused by spasticity and
increased muscle tone. Spastic dysarthric is usually associated with lesion to both the
indirect activation pathway and the direct activation pathway of the UMN system (Darley et
al., 1975). Since the indirect activation pathway is predominantly used for inhibitory motor
control, its damage will result in overactivity including increased muscle tone and spasiticity.
In the presence of spasticity and abnormally high muscle tone in DP, the resistance of muscle
movement will be increased, resulting in slowness of tongue muscle movement (Duffy, 2005).
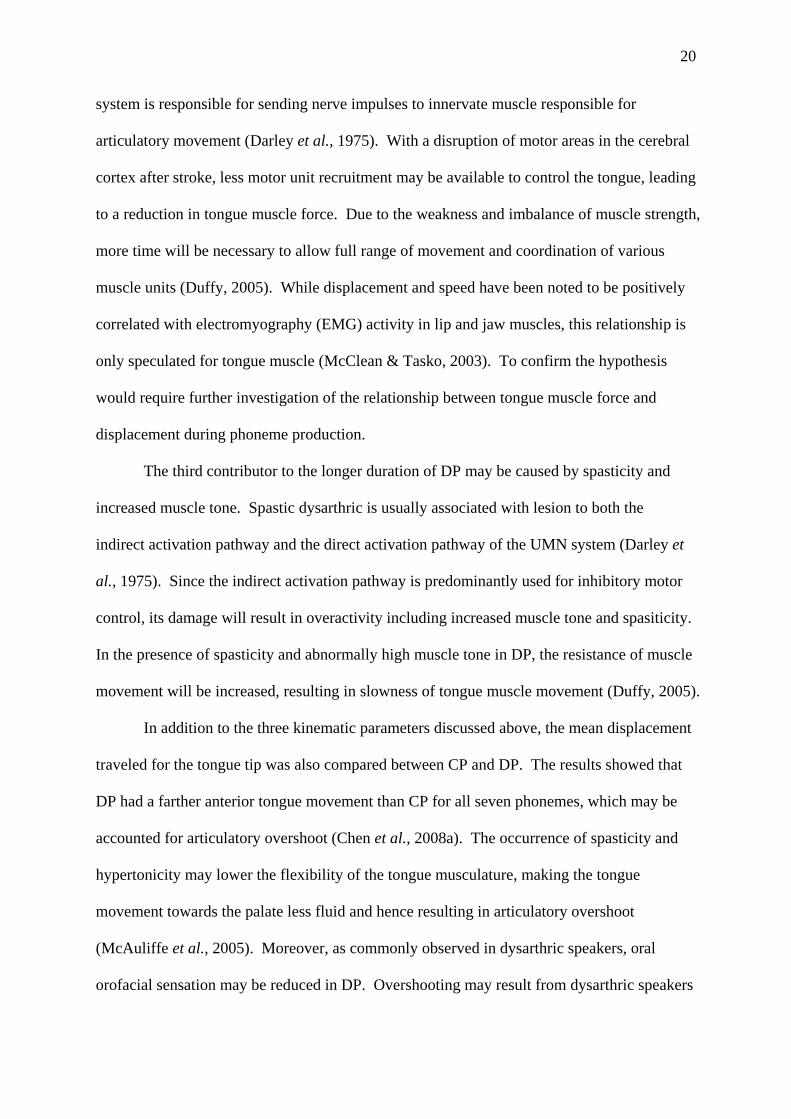
In addition to the three kinematic parameters discussed above, the mean displacement
traveled for the tongue tip was also compared between CP and DP. The results showed that
DP had a farther anterior tongue movement than CP for all seven phonemes, which may be
accounted for articulatory overshoot (Chen et al., 2008a). The occurrence of spasticity and
hypertonicity may lower the flexibility of the tongue musculature, making the tongue
movement towards the palate less fluid and hence resulting in articulatory overshoot
(McAuliffe et al., 2005). Moreover, as commonly observed in dysarthric speakers, oral
orofacial sensation may be reduced in DP. Overshooting may result from dysarthric speakers
21
being less able to detect lingual-palatal contact (McAuliffe et al., 2005). As more tongue-
palatal contact may occur in DP during phoneme production, greater mean displacement
traveled may be necessary in the period between the mid point of the consonant and that of
vowel /a/. However, whether the lingual position is correlated with the displacement traveled
by the tongue remains speculation. Hence, further investigation on this area using EPG will
be necessary.
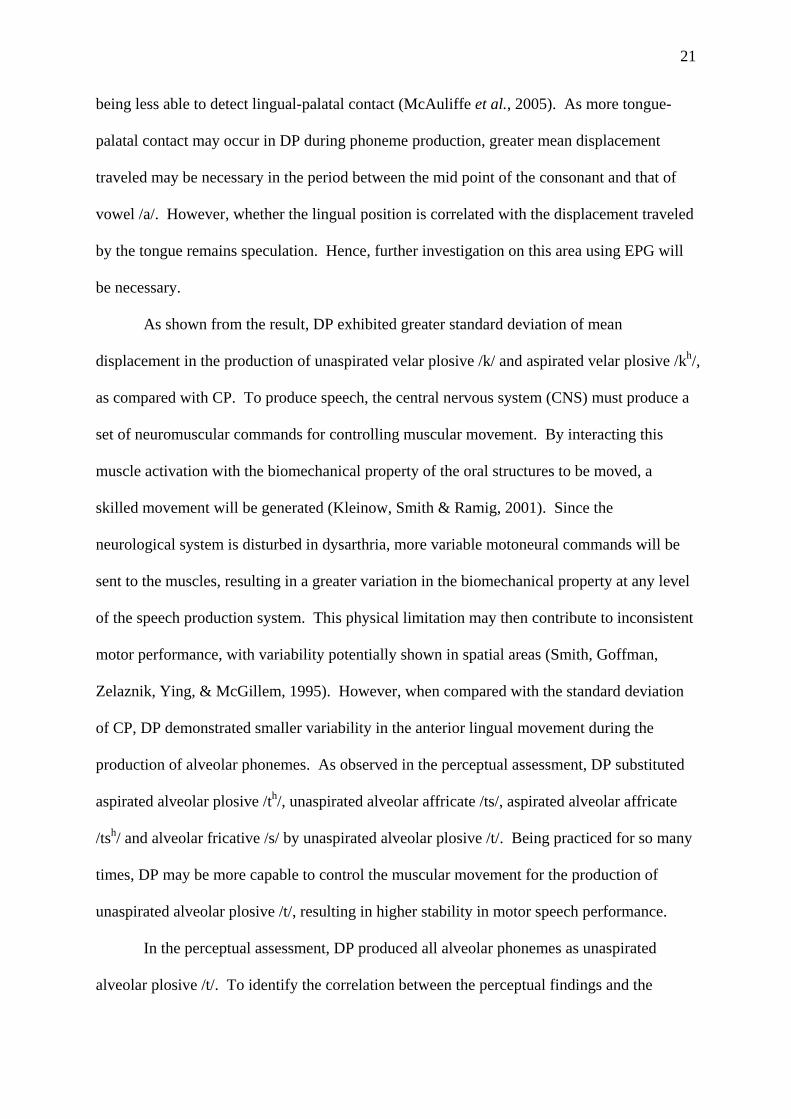
As shown from the result, DP exhibited greater standard deviation of mean
displacement in the production of unaspirated velar plosive /k/ and aspirated velar plosive /kh/,
as compared with CP. To produce speech, the central nervous system (CNS) must produce a
set of neuromuscular commands for controlling muscular movement. By interacting this
muscle activation with the biomechanical property of the oral structures to be moved, a
skilled movement will be generated (Kleinow, Smith & Ramig, 2001). Since the
neurological system is disturbed in dysarthria, more variable motoneural commands will be
sent to the muscles, resulting in a greater variation in the biomechanical property at any level
of the speech production system. This physical limitation may then contribute to inconsistent
motor performance, with variability potentially shown in spatial areas (Smith, Goffman,
Zelaznik, Ying, & McGillem, 1995). However, when compared with the standard deviation
of CP, DP demonstrated smaller variability in the anterior lingual movement during the
production of alveolar phonemes. As observed in the perceptual assessment, DP substituted
aspirated alveolar plosive /th/, unaspirated alveolar affricate /ts/, aspirated alveolar affricate
/tsh/ and alveolar fricative /s/ by unaspirated alveolar plosive /t/. Being practiced for so many
times, DP may be more capable to control the muscular movement for the production of
unaspirated alveolar plosive /t/, resulting in higher stability in motor speech performance.
In the perceptual assessment, DP produced all alveolar phonemes as unaspirated
alveolar plosive /t/. To identify the correlation between the perceptual findings and the
22
kinematic parameters, the mean displacement of the substituted phonemes were compared
with unaspirated alveolar plosive /t/. According to the results, smaller displacement
difference was observed in DP than CP. Since all these five phonemes shares same place of
articulation (alveolar), the discrepancy in displacement traveled by the tongue tip may
account for different phoneme perception in CP. In order words, displacement may be a
contributing factor to different phoneme perception. As the displacement traveled by DP’s
tongue in the production of unaspirated alveolar plosive /t/ was similar to that of other
alveolar phonemes, all alveolar phonemes were be perceived as unaspirated alveolar plosive
/t/. Hence, one may hypothesize that longitudinal displacement may be used to identify the
error patterns involving phonemes with same place of articulation. However, this factor may
not be applicable to the identification of deaspiration. Although deaspiration was evidenced
perceptually in aspirated alveolar plosive /th/ and aspirated velar plosive /kh/, their
displacement values for both participants were similar to their unaspirated counterparts. As
aspiration was produced with a spread glottis configuration in larynx (Kim, 1970), one may
speculate that the perception difference between aspirated phoneme and its unaspirated
counterpart may not be explained by the lingual displacement value, but deficit at laryngeal
level. Since no previous published data was available in contrasting the lingual displacement
traveled among different phonemes, whether confirm or reject the hypothesis requires further
investigation on this area.
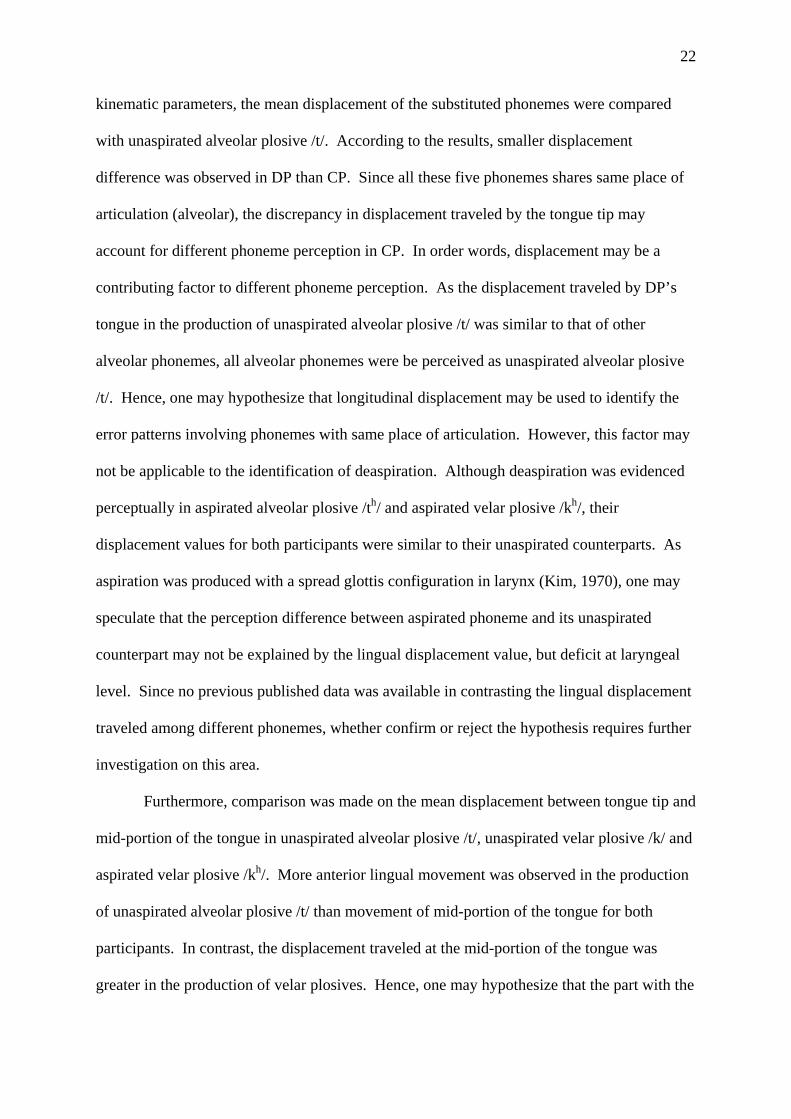
Furthermore, comparison was made on the mean displacement between tongue tip and
mid-portion of the tongue in unaspirated alveolar plosive /t/, unaspirated velar plosive /k/ and
aspirated velar plosive /kh/. More anterior lingual movement was observed in the production
of unaspirated alveolar plosive /t/ than movement of mid-portion of the tongue for both
participants. In contrast, the displacement traveled at the mid-portion of the tongue was
greater in the production of velar plosives. Hence, one may hypothesize that the part with the
23
greatest movement may determine the place of articulation. The displacement difference
between tongue tip and mid-part of the tongue was also calculated for the three phonemes
above. Results showed that these values were smaller in DP, which may be accounted by
deficit in fine lingual movement. Barlow and Abbs (1986) found that impairment in fine
lingual control on force and position was evidenced in UMN dysarthria, with the use of
orofacial transduction and movement transduction system respectively. According to Darley
et al. (1975), direct activation pathway is responsible for regulating skilled and discrete motor
movement. Since fine motor adjustment requires a large amount of motoneural activation,
damage to direct activation pathway may contribute to insufficient motor unit recruitment,
resulting in fine motor movement impairment. Moreover, spasticity and hypertonicity, as
commonly occurred in spastic dysarthria, may reduce the flexibility of lingual musculature
(Duffy, 2005). Being less capable to finely adjust the lingual movement, DP may move the
whole tongue during phoneme production, acting as a compensatory strategy for maintaining
speech intelligibility.
Further Studies
The aim of the present research was to investigate the kinematic parameters of
dysarthric individual. Since DP was unable to protrude his tongue for the placement of
sensor at the posterior part of the tongue, only two sensors could be put on the tongue at one
cm and two cm from tongue tip. In order to trace the posterior lingual movement, further
research involving the use of sensor at the back of the tongue may be considered.
Speech production is complex, requiring not only the use of tongue, but also other
articulators such as the jaw and lips (Duffy, 2005). Since previous EMA studies mainly
focused on lingual movement (Chen et al., 2008a; Chen et al., 2008b; Goozee et al., 2000;
Kuruvilla et al., 2007), further investigation on the articulatory movement of jaw and lips
24
would be essential. Additionally, instead of working independently, articulators work in a
coordinated fashion with other speech sub-system (Gracco, 1988; Mooshammer et al., 2003).
Though one research studying tongue-jaw coordination during dysarthric speech by EMA
was done (Bartle et al., 2005), further investigation on articulatory coordination such as
tongue-lip and lip-jaw is recommended.
Conclusion
The current study demonstrated deviant lingual kinematic characterisitics in a
dysarthric individual, when compared with a non-impaired age-matched control. The results
showed that slower rate and acceleration, and a longer duration were observed in dysarthric
speech production. This phenomenon may be the result of longer displacement traveled,
tongue strength reduction and spasticity (Duffy, 2005; McClean & Clay, 1995).
Additionally, the dysarthric participant exhibited greater displacement traveled by tongue tip,
which may be caused by articulatory overshoot and hypertonicity .
Additional information on displacement, basing on the articulatory errors of the
dysarthric participant, has also been investigated. Being damaged to CNS in dysarthria,
greater motor variability was observed for the dysarthric individual than the non-impaired
control in the production of velar plosives (/k/ and /kh/) (Smith et. al, 1995). In contrast,
possibly due to overuse in the production of unaspirated alveolar plosive /t/, motor variability
was smaller in the dysarthric individual when alveolar phonemes were produced. Results
also suggested that lingual displacement may contribute to phoneme perception, as shown by
similar displacement values between the target phonemes and the substituted phoneme /t/.
However, this explanation may not applicable to deaspiration which may be caused by
impairment at laryngeal level. In addition, displacement difference between the tongue tip
and mid-portion of the tongue was found to be smaller in dysarthric participant, when

25
compared with the age-matched control. Fine motor impairment and spasticity may account
for the phenomenon, subsequent to the movement of the whole tongue.
To conclude, the findings for the dysarthric participant supported the hypothesis of
the present study and EMA provided valuable information in investigating the physiological
underpinnings of dysarthria.
Acknowledgments
I would like to express my sincere thanks to my supervisors, Professor Tara Whitehill
and Dr. Lawrence Ng, for their suggestions, comments and supports.
26
References
Barlow, S. M., & Abbs, J. H. (1986). Fine force and position control of select orofacial
structures in the upper motor neuron syndrome. Experimental Neurology, 94, 699 – 713.
Bartle, C. J., Goozee, J. V., Scott, D., Murdoch, B. E., & Kuruvilla, M. (2006). EMA
assessment of tongue-jaw co-ordination during speech in dysarthria following traumatic
brain injury. Brain Injury, 20, 529 – 545.
Chen, Y. T., Murdoch, B. E., & Goozee, J. V. (2008a). Electromagnetic articulographic
assessment of tongue function in dysasrthric and nondysarthric speakers following
stroke. Journal of Medical Speech-Language Pathology, 16, 21 – 32.
Chen, Y. T., Murdoch, B. E., & Goozee, J. V. (2008b). Lingual kinematics during
sentence production in adults with dysarthria at 6 and 12 months post stroke. Asia
Pacific Journal of Speech, Language, and Hearing, 11, 15 – 22.
Darley, F. L., Aronson, A. E., & Brown, J. R. (1969a). Clusters of deviant speech
dimensions in the dysarthrias. Journal of Speech and Hearing Research, 12, 462 – 496.
Darley, F. L., Aronson, A. E., & Brown, J. R. (1969b). Differential diagnostic patterns of
dysarthria. Journal of Speech and Hearing Research, 12, 246 – 269.
Darley, F. L., Aronson, A. E., Brown J. R. (1975). Motor speech disorders. Philadelphia:
Saunders.
Duffy, J. R. (2005). Motor speech disorders: Motor speech disorders: Substrates,
differential diagnosis, and management. St. Louis, Mo.: Elsevier Mosby.
Duffy, J. R., & Folger, W. N. (1996). Dysarthria associated with unilateral central nervous
system lesions: A retrospective study. Journal of Medical Speech-Language Pathology,
4, 57 – 70.
27
Goozee, J. V., Murdoch, B. E., Theodoros, D. G., & Stokes, P. D. (2000). Kinematic
analysis of tongue movements in dysarthria following traumatic brain injury using
electromagnetic articulography. Brain Injury, 14, 153 – 174.
Gracco, V. L. (1988). Time factors in the coordination of speech movements. The Journal
of Neuroscience, 8, 4628 – 4639.
Hirose, H., Kiritani, S., & Sawashima, M. (1982). Velocity of articulatory movements in
normal and dysarthic subjects. Folia Phoniatrica, 34, 210 – 215.
Jaeger, M., Hertrich, I., Stattrop, U., Schonle, P. W., & Ackermann, H. (2000). Speech
disorders following severe traumatic brain injury: Kinematic analysis of syllabic
repetitions using electromagnetic articulography. Folia Phoniatrica et Logopaedica, 52,
187 – 196.
Kelly, S., Main, A., Manley, G., & McLean, C. (2000). Electropalatography and the
linguagraph system. Medical Engineering and Physics, 22, 47 – 58.
Kent, R. D., Kent, J. F., & Rosenbek, J. C. (1987). Maximum performance tests of speech
production. Journal of Speech and Hearing Disorders, 52, 367 – 387.
Kent, R. D., & Netsell, R. (1975). A case study of an ataxic dysarthric: Cineradiographic
and spectrographic observations. Journal of Speech and Hearing Disorders, 40, 115 –
134.
Kent, R. D., Netsell, R., & Bauer, L. L. (1975). Cineradiographic assessment of
articulatory mobility in the dysarthrias. Journal of Speech and Hearing Disorders, 40,
467 – 480.
Khedr, E. M., Abdel-Fadeila, M. R., El-Khilli, F., & Ibrahima, M. Q. (2005). Impaired
corticolingual pathways in patients with or without dysarthria after acute
monohemispheric stroke. Neurophysiologie Clinique, 35, 73 – 80.
Kim, C. W. (1970). A theory of aspiration. Phonetica, 21, 107 – 116.
28
Kleinow, J., Smith, A., & Ramig, L. O. (2001). Speech motor stability in IPD: Effects of
rate and loudness manipulations. Journal of Speech, Language, and Hearing Research,
44, 1041 – 1051.
Kuruvilla, M., Murdoch, B., & Goozee, J. (2007). Electromagnetic articulography
assessment of articulatory function in adults with dysarthria following traumatic brain
injury. Brain Injury, 21, 601 – 613.
McAuliffe, M. J., Ward, E. C., & Bruce, E. M. (2005). Articulatory function in
hypokinetic dysarthria: An electropalatographic examination of two cases. Journal of
Medical Speech-Language Pathology, 13, 149 – 168.
McClean, M. D., & Clay, J. L. (1995). Activation of lip motor units with variations in
speech rate and phonetic structure. Journal of Speech and Hearing Research, 38, 772 –
782.
McClean, M. D., & Tasko, S. M. (2003). Association of orofacial muscle activity and
movement during changes in speech rate and intensity. Journal of Speech, Language,
and Hearing Research, 46, 1387 – 1400.
Mooshammer, C., Geumann, A., Hoole, P., Alfonso, P., Lieshout, P. V., & Fuchs, S. (2003,
August). Coordination of lingual and mandibular gestures for different manners of
articulation. Proceedings of the 15th International Congress of Phonetic Sciences.
Barcelona, Spain. pp. 81 – 84
Schonle, P. W., Grabe, K., Wenig, P., Hohne, J., Schrader, J., & Conrad, B. (1987).
Electromagnetic articulography: Use of alternating magnetic fields for tacking
movements of multiple points inside and outside the vocal tract. Brain and Language,
31, 26 – 35.
Smith, A. (1992). The control of orofacial movements in speech. Critical Reviews in Oral
Biology and Medicines, 3, 233 – 267.
29
Smith, A., Goffman, L., Zelaznik, H. N., Ying, G., & McGillem, C. (1995). Spatiotemporal
stability and patterning of speech movement sequences. Experimental Brain Research,
104, 493 – 501.
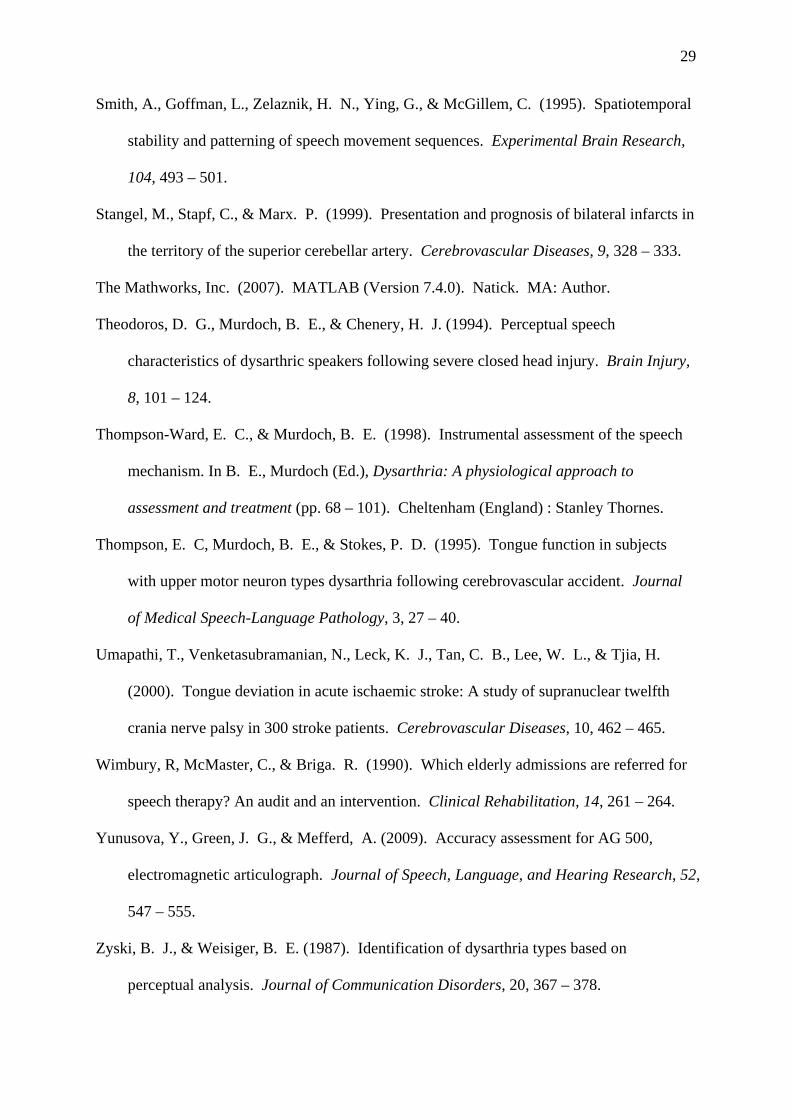
Stangel, M., Stapf, C., & Marx. P. (1999). Presentation and prognosis of bilateral infarcts in
the territory of the superior cerebellar artery. Cerebrovascular Diseases, 9, 328 – 333.
The Mathworks, Inc. (2007). MATLAB (Version 7.4.0). Natick. MA: Author.
Theodoros, D. G., Murdoch, B. E., & Chenery, H. J. (1994). Perceptual speech
characteristics of dysarthric speakers following severe closed head injury. Brain Injury,
8, 101 – 124.
Thompson-Ward, E. C., & Murdoch, B. E. (1998). Instrumental assessment of the speech
mechanism. In B. E., Murdoch (Ed.), Dysarthria: A physiological approach to
assessment and treatment (pp. 68 – 101). Cheltenham (England) : Stanley Thornes.
Thompson, E. C, Murdoch, B. E., & Stokes, P. D. (1995). Tongue function in subjects
with upper motor neuron types dysarthria following cerebrovascular accident. Journal
of Medical Speech-Language Pathology, 3, 27 – 40.
Umapathi, T., Venketasubramanian, N., Leck, K. J., Tan, C. B., Lee, W. L., & Tjia, H.
(2000). Tongue deviation in acute ischaemic stroke: A study of supranuclear twelfth
crania nerve palsy in 300 stroke patients. Cerebrovascular Diseases, 10, 462 – 465.
Wimbury, R, McMaster, C., & Briga. R. (1990). Which elderly admissions are referred for
speech therapy? An audit and an intervention. Clinical Rehabilitation, 14, 261 – 264.
Yunusova, Y., Green, J. G., & Mefferd, A. (2009). Accuracy assessment for AG 500,
electromagnetic articulograph. Journal of Speech, Language, and Hearing Research, 52,
547 – 555.
Zyski, B. J., & Weisiger, B. E. (1987). Identification of dysarthria types based on
perceptual analysis. Journal of Communication Disorders, 20, 367 – 378.
30
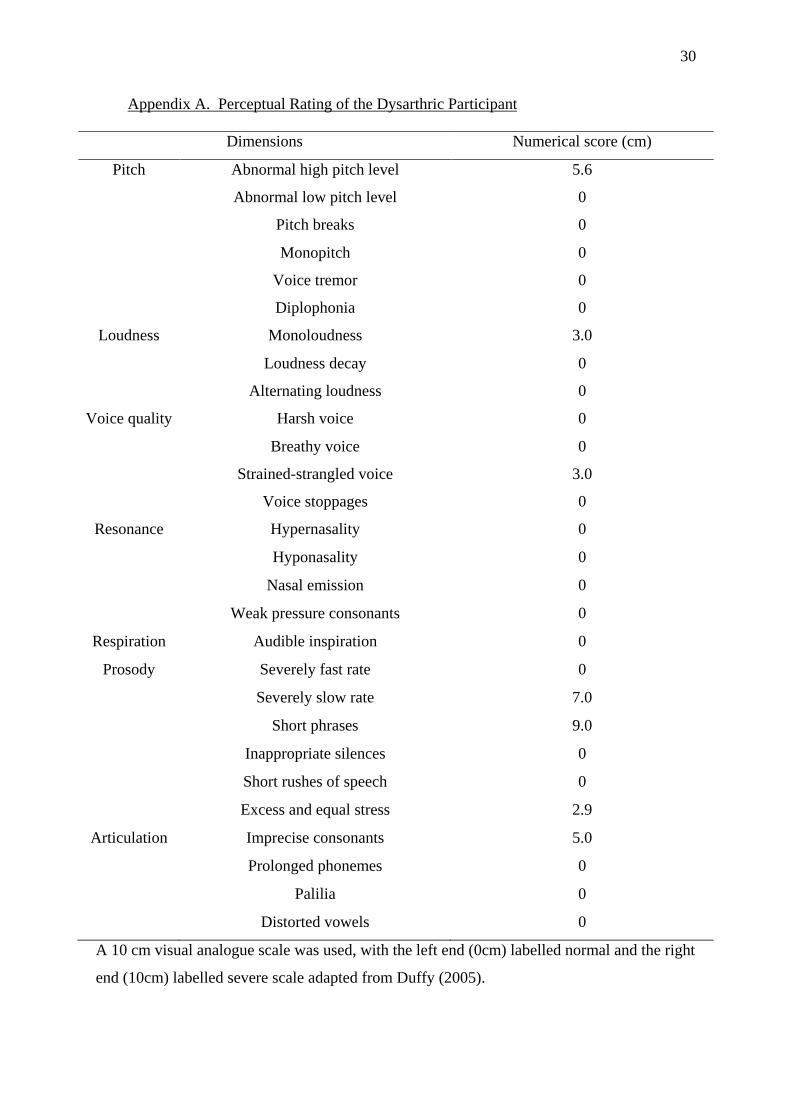
Appendix A. Perceptual Rating of the Dysarthric Participant
Dimensions Numerical score (cm)
Pitch Abnormal high pitch level 5.6
Abnormal low pitch level 0
Pitch breaks 0
Monopitch 0
Voice tremor 0
Diplophonia 0
Loudness Monoloudness 3.0
Loudness decay 0
Alternating loudness 0
Voice quality Harsh voice 0
Breathy voice 0
Strained-strangled voice 3.0
Voice stoppages 0
Resonance Hypernasality 0
Hyponasality 0
Nasal emission 0
Weak pressure consonants 0
Respiration Audible inspiration 0
Prosody Severely fast rate 0
Severely slow rate 7.0
Short phrases 9.0
Inappropriate silences 0
Short rushes of speech 0
Excess and equal stress 2.9
Articulation Imprecise consonants 5.0
Prolonged phonemes 0
Palilia 0
Distorted vowels 0
A 10 cm visual analogue scale was used, with the left end (0cm) labelled normal and the right
end (10cm) labelled severe scale adapted from Duffy (2005).
31
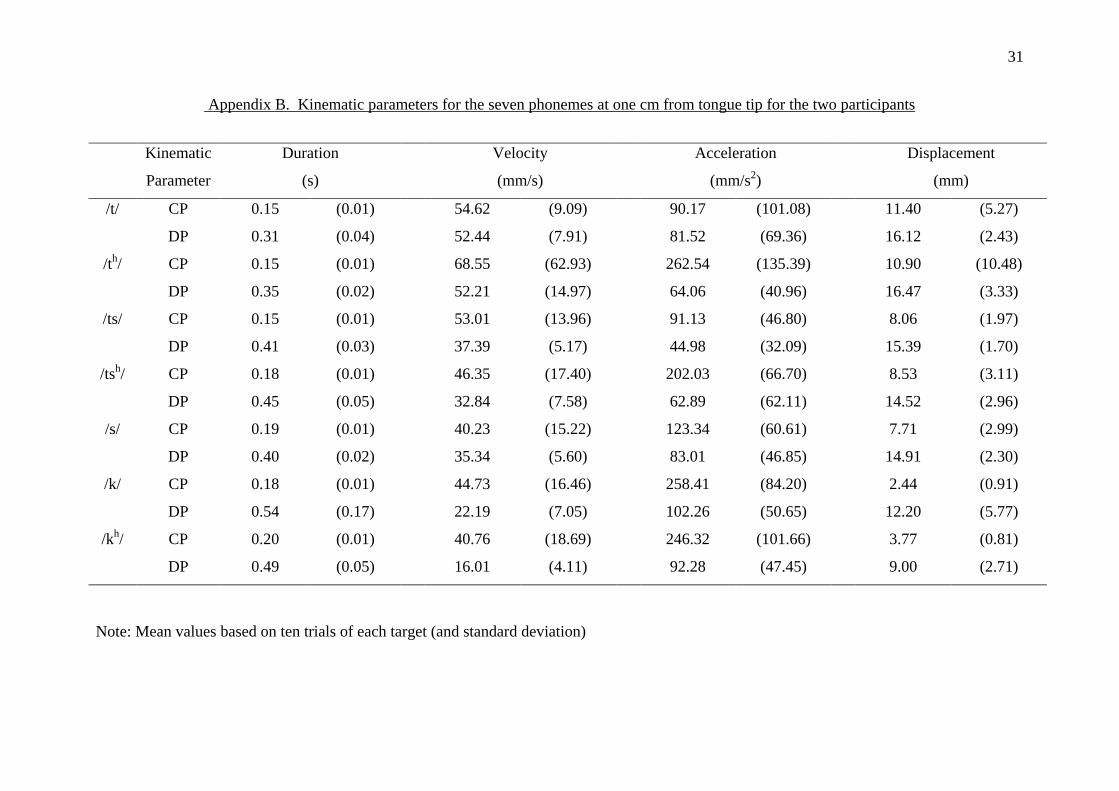
Appendix B. Kinematic parameters for the seven phonemes at one cm from tongue tip for the two participants
Note: Mean values based on ten trials of each target (and standard deviation)
Kinematic
Parameter
Duration
(s)
Velocity
(mm/s)
Acceleration
(mm/s2)
Displacement
(mm)
/t/ CP 0.15 (0.01) 54.62 (9.09) 90.17 (101.08) 11.40 (5.27)
DP 0.31 (0.04) 52.44 (7.91) 81.52 (69.36) 16.12 (2.43)
/th/ CP 0.15 (0.01) 68.55 (62.93) 262.54 (135.39) 10.90 (10.48)
DP 0.35 (0.02) 52.21 (14.97) 64.06 (40.96) 16.47 (3.33)
/ts/ CP 0.15 (0.01) 53.01 (13.96) 91.13 (46.80) 8.06 (1.97)
DP 0.41 (0.03) 37.39 (5.17) 44.98 (32.09) 15.39 (1.70)
/tsh/ CP 0.18 (0.01) 46.35 (17.40) 202.03 (66.70) 8.53 (3.11)
DP 0.45 (0.05) 32.84 (7.58) 62.89 (62.11) 14.52 (2.96)
/s/ CP 0.19 (0.01) 40.23 (15.22) 123.34 (60.61) 7.71 (2.99)
DP 0.40 (0.02) 35.34 (5.60) 83.01 (46.85) 14.91 (2.30)
/k/ CP 0.18 (0.01) 44.73 (16.46) 258.41 (84.20) 2.44 (0.91)
DP 0.54 (0.17) 22.19 (7.05) 102.26 (50.65) 12.20 (5.77)
/kh/ CP 0.20 (0.01) 40.76 (18.69) 246.32 (101.66) 3.77 (0.81)
DP 0.49 (0.05) 16.01 (4.11) 92.28 (47.45) 9.00 (2.71)
32
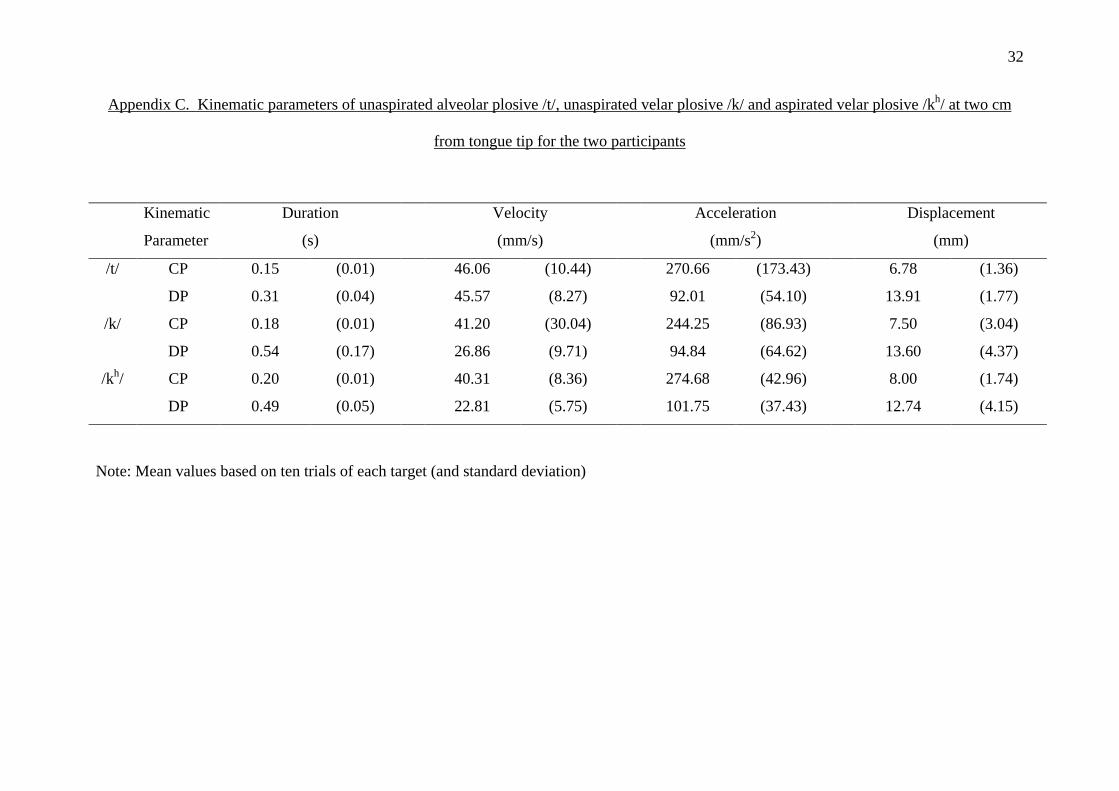
Appendix C. Kinematic parameters of unaspirated alveolar plosive /t/, unaspirated velar plosive /k/ and aspirated velar plosive /kh/ at two cm
from tongue tip for the two participants
Note: Mean values based on ten trials of each target (and standard deviation)
Kinematic
Parameter
Duration
(s)
Velocity
(mm/s)
Acceleration
(mm/s2)
Displacement
(mm)
/t/ CP 0.15 (0.01) 46.06 (10.44) 270.66 (173.43) 6.78 (1.36)
DP 0.31 (0.04) 45.57 (8.27) 92.01 (54.10) 13.91 (1.77)
/k/ CP 0.18 (0.01) 41.20 (30.04) 244.25 (86.93) 7.50 (3.04)
DP 0.54 (0.17) 26.86 (9.71) 94.84 (64.62) 13.60 (4.37)
/kh/ CP 0.20 (0.01) 40.31 (8.36) 274.68 (42.96) 8.00 (1.74)
DP 0.49 (0.05) 22.81 (5.75) 101.75 (37.43) 12.74 (4.15)
33
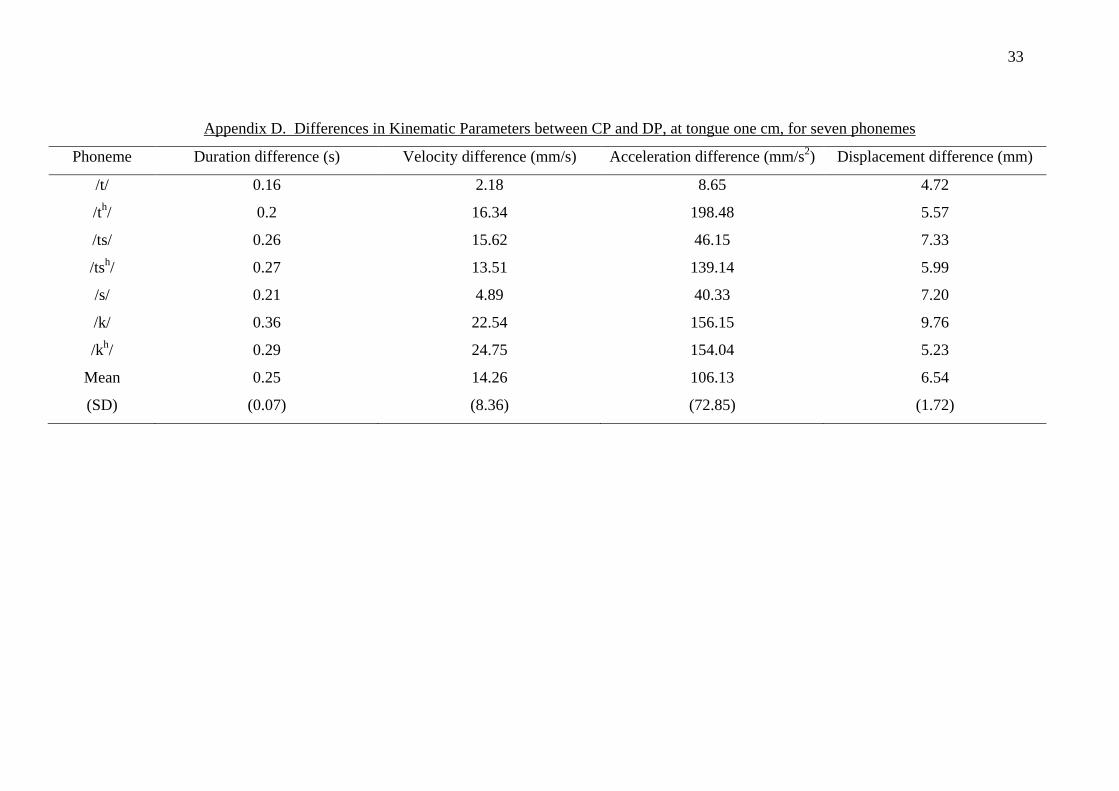
Appendix D. Differences in Kinematic Parameters between CP and DP, at tongue one cm, for seven phonemes
Phoneme Duration difference (s) Velocity difference (mm/s) Acceleration difference (mm/s2) Displacement difference (mm)
/t/ 0.16 2.18 8.65 4.72
/th/ 0.2 16.34 198.48 5.57
/ts/ 0.26 15.62 46.15 7.33
/tsh/ 0.27 13.51 139.14 5.99
/s/ 0.21 4.89 40.33 7.20
/k/ 0.36 22.54 156.15 9.76
/kh/ 0.29 24.75 154.04 5.23
Mean
(SD)
0.25
(0.07)
14.26
(8.36)
106.13
(72.85)
6.54
(1.72)
34
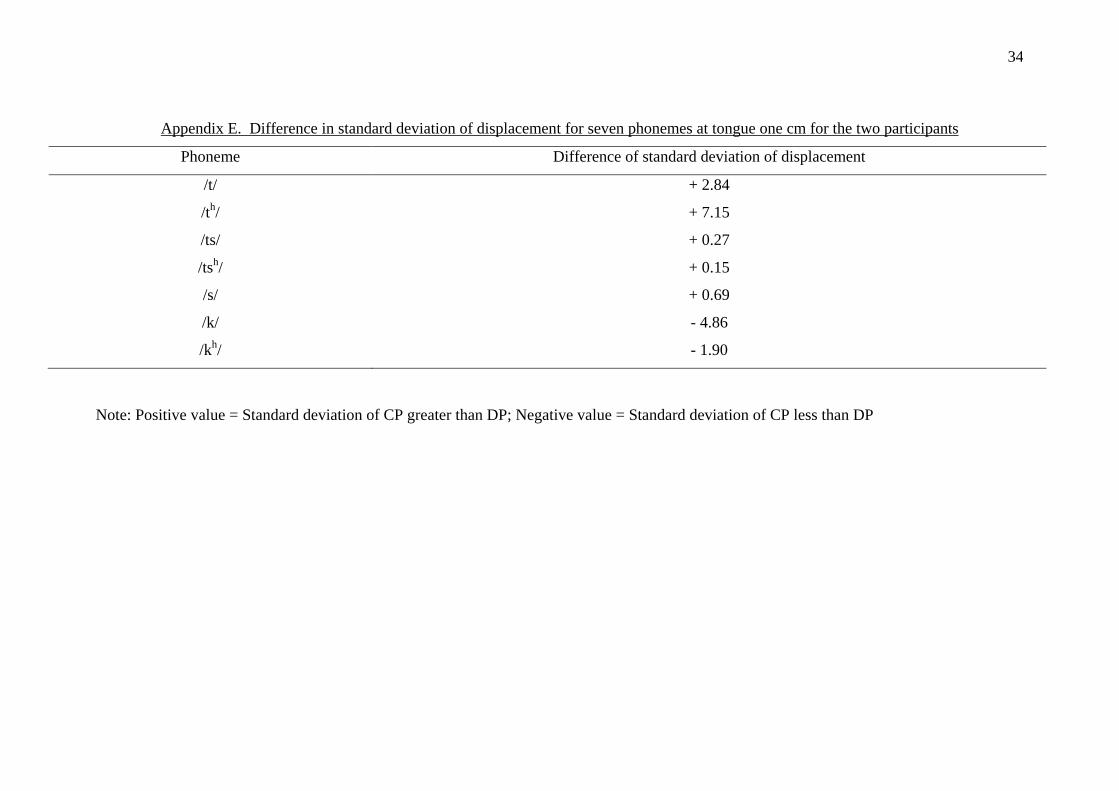
Appendix E. Difference in standard deviation of displacement for seven phonemes at tongue one cm for the two participants
Phoneme Difference of standard deviation of displacement
/t/ + 2.84
/th/ + 7.15
/ts/ + 0.27
/tsh/ + 0.15
/s/ + 0.69
/k/ - 4.86
/kh/ - 1.90
Note: Positive value = Standard deviation of CP greater than DP; Negative value = Standard deviation of CP less than DP
35
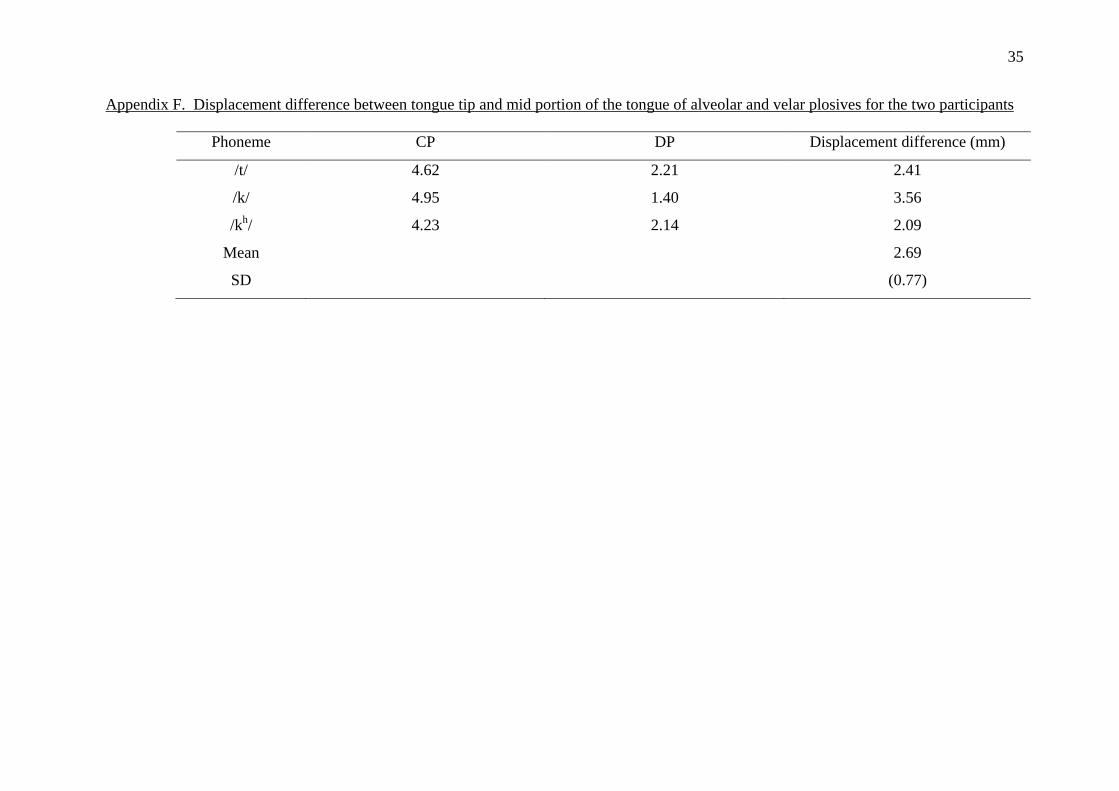
Appendix F. Displacement difference between tongue tip and mid portion of the tongue of alveolar and velar plosives for the two participants
Phoneme CP DP Displacement difference (mm)
/t/ 4.62 2.21 2.41
/k/ 4.95 1.40 3.56
/kh/ 4.23 2.14 2.09
Mean 2.69
SD (0.77)
36
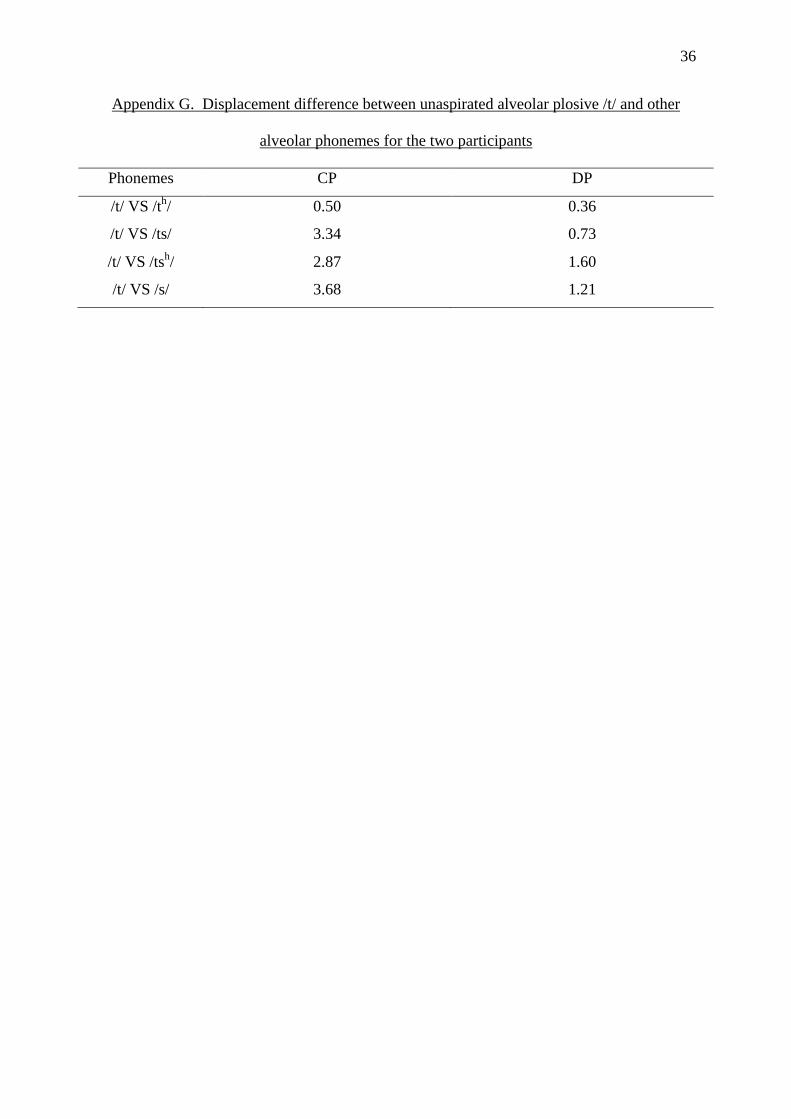
Appendix G. Displacement difference between unaspirated alveolar plosive /t/ and other
alveolar phonemes for the two participants
Phonemes CP DP
/t/ VS /th/ 0.50 0.36
/t/ VS /ts/ 3.34 0.73
/t/ VS /tsh/ 2.87 1.60
/t/ VS /s/ 3.68 1.21

![Pure dysarthria and dysarthria-facial paresis syndrome due ...except for those related to articulation [4], and not accom-panied by facial paresis. DFP was defined as PD combined](https://img.pdfslide.tips/doc/110x75/5e352eeab913cf57dc24931a/pure-dysarthria-and-dysarthria-facial-paresis-syndrome-due-except-for-those.jpg)