Embed Size (px)
Citation preview
P R A M SMassachusetts
Pregnancy Risk Assessment Monitoring System
Massachusetts PRAMS 2007/2008 Surveillance Report
Deval L. Patrick, Governor
Timothy P. Murray, Lieutenant Governor JudyAnn Bigby, MD, Secretary of Health and Human Services
John Auerbach, Commissioner of Public Health
Ron Benham, Director Bureau of Family Health and Nutrition Hafsatou Diop, MD, MPH, Director
Office of Data Translation
Massachusetts Department of Public Health
September 2010
3
Acknowledgments
This report was prepared by Emily Lu, Hafsatou Diop, and Susan E. Manning of the Office of Data Translation, Bureau of Family Health and Nutrition, Massachusetts Department of Public Health. Special thanks go to: Diane Gradozzi, Roger Wong, Jonathan Gottlieb, Ana Sanchez, Rashmi Dayalu, Lizzie Harvey, Bureau of Family Health and Nutrition; Candice Belanoff, Boston University; Alice Mroszczyk, Privacy and Data Access Office; The Research and Data Access Review Committee; The PRAMS Advisory Committee;* Stanley Nyberg, Jane Purtill, Maria Vu, Kevin Foster, Charlene Zion, Sharon Pagnano, and Karin Barret, Registry of Vital Records and Statistics; Letitia Williams, Seema Gupta, Centers for Disease Control and Prevention. We wish to also thank DPH peer reviewers for their comprehensive review of this publication. Most importantly, our thanks go to all the mothers who completed the 2007/2008 Massachusetts PRAMS questionnaires which led to this report. Suggested Citation: Massachusetts Department of Public Health. Massachusetts Pregnancy Risk Assessment Monitoring System (PRAMS) 2007/2008 Surveillance Report. Boston, MA; September 2010. To obtain additional copies of this report, please contact: Massachusetts Department of Public Health Bureau of Family Health and Nutrition Office of Data Translation 250 Washington Street, 4th Floor Boston, MA 02108 Telephone: 1-800-311-2229 TTY: 617-624-5992 Email: [email protected] This publication can be downloaded from the following website: http://www.mass.gov/dph/prams Funding for Massachusetts Pregnancy Risk Assessment Monitoring System was provided in part by the Centers for Disease Control and Prevention Grant # UR6DP000513.
*See Appendix F for an alphabetical list of PRAMS Advisory Committee Members
4
TABLE OF CONTENTS PAGE
Acknowledgements 3
Table of Contents 4-5
List of Figures 6-9
List of Tables (for main document) 10-11
List of Tables (for Appendix A) 12-14
Executive Summary 15-17
Introduction 18
Methodology 19
Limitations 20
PRAMS Sample Characteristics (weighted) 21-22
Pre-Pregnancy
Pre-pregnancy health insurance 23-24
Body Mass Index 25
Prenatal multivitamin use 26
Pregnancy intention 27-29
Contraception use 30-31
Fertility treatment 32-33
Previous birth outcomes 34
Pregnancy
WIC participation during pregnancy 35-36
Health complications during pregnancy 37
Gestational diabetes 38
Exercise and diet 39
Stressful life events 40
Physical abuse 41-42
Prenatal care 43-49
HIV testing during pregnancy 50-52
5
TABLE OF CONTENTS, Cont’d PAGE
Method of delivery 53
Cesarean delivery request 54
Infant birth hospitalization 55
Maternal delivery hospitalization 56
Delivery payer source 56
Post-partum
Contraception use 57
Maternal self-rated health 58
Post-partum depressive symptoms 59-61
Post-partum health care 62
Infant health care 63
Infant sleep position 64
Infant sleep location 65-66
Infant safety 67
Breastfeeding 68-75
Oral Health Care 76-77
Substance Use
Alcohol 78-79
Tobacco 80-81
Appendix A. Supplemental data
Tables from questions in order of PRAMS 2007/2008 survey 82-101
Technical notes 102
Appendix B. Massachusetts PRAMS 2007/2008 survey 103-118
Appendix C. PRAMS weighting system 119-120
Appendix D. Adequacy of Prenatal Care Utilization Index 121-122
Appendix E. List of references 123-126
Appendix F. Alphabetical List of PRAMS Advisory Committee Members
127-128
6
LIST OF FIGURES
PAGE
Figure 1. Prevalence of insurance types prior to pregnancy, 2007/2008 MA PRAMS
23
Figure 2. Maternal Body Mass Index (BMI) prior to pregnancy, 2007/2008 MA PRAMS
25
Figure 3. Prevalence of multivitamin use in the month prior to pregnancy, 2007/2008 MA PRAMS
26
Figure 4. Proportion of women trying to become pregnant, 2007/2008 MA PRAMS
27
Figure 5. Feelings about becoming pregnant prior to this pregnancy, 2007/2008 MA PRAMS
27
Figure 6. Prevalence of pre-pregnancy contraception use among women who were not trying to become pregnant, 2007/2008 MA PRAMS
30
Figure 7. Reasons for not using a contraceptive method prior to this pregnancy, 2007/2008 MA PRAMS
31
Figure 8. Prevalence of fertility treatment use, 2007/2008 MA PRAMS 32
Figure 9. Prevalence of previous low birth weight and preterm births among multiparous women, 2007/2008 MA PRAMS
34
Figure 10. Proportion of women participating in WIC during pregnancy, 2007/2008 MA PRAMS
35
Figure 11. Maternal health complications during pregnancy, 2007/2008 MA PRAMS
37
Figure 12. Frequency of physical activity prior to and during pregnancy, 2007/2008 MA PRAMS
39
Figure 13. Consumption of fruits/vegetables per day in the last three months of pregnancy, 2007/2008 MA PRAMS
39
Figure 14. Prevalence of stressful life events in the 12 months before birth, by type, 2007/2008 MA PRAMS
40
Figure 15. Prevalence of stressful life events during pregnancy, by event, 2007/2008 MA PRAMS
40
Figure 16. Prevalence of intimate partner violence in 12 months before pregnancy, during pregnancy, and at either time period, 2007/2008 MA PRAMS
41
Figure 17. Gestational age when pregnancy was confirmed, 2007/2008 MA PRAMS
43
Figure 18. Timing of initiation of prenatal care (PNC), 2007/2008 MA PRAMS
43
7
LIST OF FIGURES PAGE
Figure 19. Adequacy of prenatal care (as measured by Adequacy of Prenatal Care Utilization Index, APNCU), 2007/2008 MA PRAMS
45
Figure 20. Reasons for not receiving prenatal care as early as wanted, 2007/2008 MA PRAMS
47
Figure 21. Topics discussed with health care providers during prenatal care visits, 2007/2008 MA PRAMS
48
Figure 22. Discussion of the signs of preterm labor (PTL) with health care providers, 2007/2008 MA PRAMS
49
Figure 23. Proportion of women offered HIV testing during pregnancy, 2007/2008 MA PRAMS
50
Figure 24. Proportion of women tested for HIV during pregnancy, 2007/2008 MA PRAMS
50
Figure 25. Proportion of women who refused HIV testing during pregnancy (among those offered), 2007/2008 MA PRAMS
52
Figure 26. Reasons for refusing HIV testing during pregnancy, 2007/2008 MA PRAMS
52
Figure 27. Proportion of births by vaginal and cesarean delivery, 2007/2008 MA PRAMS
53
Figure 28. Source of cesarean delivery request, among women who delivered by cesarean, 2007/2008 MA PRAMS
54
Figure 29. Source of cesarean delivery request among women who delivered by cesarean, by prior-birth history, 2007/2008 MA PRAMS
54
Figure 30. Proportion of infants staying in the neonatal intensive care unit, 2007/2008 MA PRAMS
55
Figure 31. Infant length of hospital stay at birth, 2007/2008 MA PRAMS
55
Figure 32. Maternal length of hospital stay for delivery, 2007/2008 MA PRAMS
56
Figure 33. Prevalence of delivery payment sources, 2007/2008 MA PRAMS
56
Figure 34. Proportion of women using contraception post-partum, 2007/2008 MA PRAMS
57
Figure 35. Reasons for not using contraception post-partum (among those reporting no use), 2007/2008 MA PRAMS
57
Figure 36. Maternal self-rated health post-partum, 2007/2008 MA PRAMS
58
Figure 37. Frequency of feeling depressed post-partum, 2007/2008 MA PRAMS
59
8
LIST OF FIGURES PAGE
Figure 38. Proportion of women often/always experiencing little interest in activities post-partum, 2007/2008 MA PRAMS
60
Figure 39. Proportion of women seeking help for post-partum depression (among all mothers regardless of depressive symptoms’ frequencies), 2007/2008 MA PRAMS
61
Figure 40. Proportion of women seeking help for post-partum depression (only among those reporting “often” or “always” feeling depressed or “often” or “always” experiencing loss of interest/pleasure in doing things), 2007/2008 MA PRAMS
61
Figure 41. Proportion of women receiving a post-partum checkup by the time of survey, 2007/2008 MA PRAMS
62
Figure 42. Proportion of women receiving a post-partum checkup, by insurance type, 2007/2008 MA PRAMS
62
Figure 43. Proportion of infants seen by health care provider within one week of leaving birth hospital, 2007/2008 MA PRAMS
63
Figure 44. Proportion of infants receiving a well-baby visit by the time of survey, 2007/2008 MA PRAMS
63
Figure 45. Prevalence of infant sleep positions, 2007/2008 MA PRAMS
64
Figure 46. Prevalence of infant sleep locations, 2007/2008 MA PRAMS
65
Figure 47. Prevalence of infant safety practices, 2007/2008 MA PRAMS
67
Figure 48. Prevalence of breastfeeding (BF) initiation, duration, and exclusivity, all mothers, 2007/2008 MA PRAMS
68
Figure 49. Prevalence of breastfeeding initiation, duration, and exclusivity, by maternal race/ethnicity, 2007/2008 MA PRAMS
69
Figure 50. Prevalence of breastfeeding initiation, duration, and exclusivity, by maternal age (years), 2007/2008 MA PRAMS
70
Figure 51. Prevalence of breastfeeding initiation, duration, and exclusivity, by maternal education, 2007/2008 MA PRAMS
71
Figure 52. Prevalence of breastfeeding initiation, duration, and exclusivity, by poverty level, 2007/2008 MA PRAMS
72
Figure 53. Prevalence of breastfeeding initiation, duration, and exclusivity, by maternal nativity, 2007/2008 MA PRAMS
73
Figure 54. Prevalence of breastfeeding initiation, duration, and exclusivity, by WIC participation during pregnancy, 2007/2008 MA PRAMS
74
9
LIST OF FIGURES PAGE
Figure 55. Prevalence of breastfeeding initiation, duration, and exclusivity, by feelings about this pregnancy, 2007/2008 MA PRAMS
Figure 56. Prevalence of teeth cleaning ever before, during, and after pregnancy, 2007/2008 MA PRAMS
75
76
Figure 57. Prevalence of teeth cleaning, never, ever but not recently, or recently, 2007/2008 MA PRAMS
76
Figure 58. Prevalence of maternal alcohol consumption prior to and during pregnancy, 2007/2008 MA PRAMS
78
Figure 59. Prevalence of maternal tobacco use prior to, during, and after pregnancy, 2007/2008 MA PRAMS
80
Figure 60. PRAMS Data Weighting Illustration 120
10
LIST OF TABLES PAGE
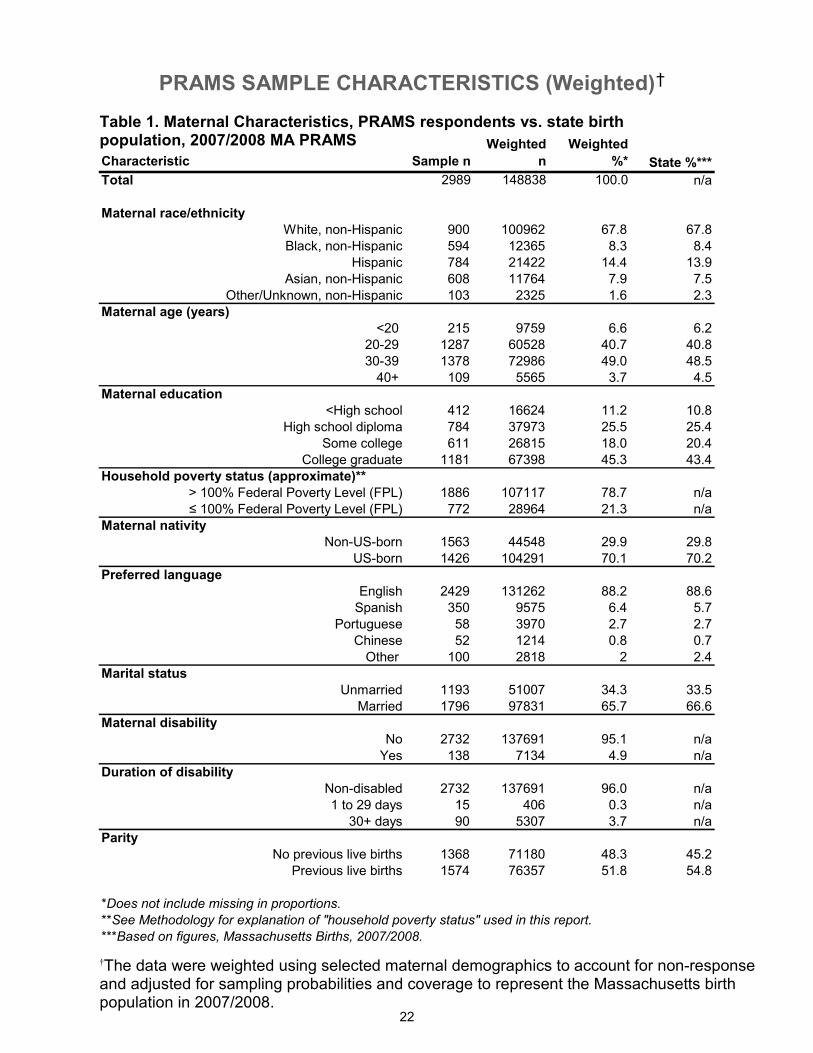
Table 1. Maternal Characteristics, PRAMS respondents vs. state birth population, 2007/2008 MA PRAMS
Table 2. Prevalence of no insurance coverage prior to pregnancy, by socio-demographic characteristics, 2007/2008 MA PRAMS
22
24
Table 3. Prevalence of daily multivitamin use in the month prior to pregnancy, by socio-demographic characteristics, 2007/2008 MA PRAMS
26
Table 4. Prevalence of pregnancy intention and feelings about the timing of most recent pregnancy, by socio-demographic characteristics and history of abuse, 2007/2008 MA PRAMS
28
Table 5. Prevalence of wanting the pregnancy sooner, by socio-demographic characteristics and history of abuse, 2007/2008 MA PRAMS
29
Table 6. Proportion of women who reported knowing about emergency contraception (the “morning-after pill”) before pregnancy, 2007/2008 MA PRAMS
31
Table 7. Prevalence of fertility treatment use, by socio-demographic characteristics, 2007/2008 MA PRAMS
33
Table 8. Prevalence of WIC participation during pregnancy, by socio-demographic characteristics, 2007/2008 MA PRAMS
36
Table 9. Prevalence of gestational diabetes, by socio-demographic characteristics, 2007/2008 MA PRAMS
38
Table 10. Prevalence of physical abuse (before pregnancy, during pregnancy, and during either time period), 2007/2008 MA PRAMS
42
Table 11. Prevalence of entry to prenatal care in the first trimester, by socio-demographic characteristics, 2007/2008 MA PRAMS
44
Table 12. Prevalence of inadequate/no prenatal care, as measured by the Adequacy of Prenatal Care Utilization (APNCU) Index, by socio-demographic characteristics, 2007/2008 MA PRAMS
46
Table 13. Prevalence of offer-of-testing/HIV testing during pregnancy, by socio-demographic characteristics, 2007/2008 MA PRAMS
51
Table 14. Prevalence of fair/poor self-rated health, by socio-demographic characteristics, 2007/2008 MA PRAMS
58
Table 15. Prevalence of often or always feeling depressed post-partum, by socio-demographic characteristics, 2007/2008 MA PRAMS
59
Table 16. Prevalence of often or always experiencing loss of interest/pleasure in doing things, by socio-demographic characteristics, 2007/2008 MA PRAMS
60
Table 17. Prevalence of placing infant to sleep on back, by socio-demographic characteristics, 2007/2008 MA PRAMS
64
11
LIST OF TABLES PAGE
Table 18. Prevalence of infant sleeping on an adult bed with other person(s), by socio-demographic characteristics, 2007/2008 MA PRAMS
66
Table 19. Prevalence of teeth cleaning (ever), by socio-demographic characteristics, 2007/2008 MA PRAMS
77
Table 20. Prevalence of maternal alcohol consumption in the last three months of pregnancy, by socio-demographic characteristics, 2007/2008 MA PRAMS
79
Table 21. Prevalence of maternal tobacco use during the last three months of pregnancy, by socio-demographic characteristics, 2007/2008 MA PRAMS
81
12
LIST OF TABLES (APPENDIX A) PAGE
Table 1. From survey questions 1-2, Prevalence of insurance types prior to pregnancy, 2007/2008 MA PRAMS
83
Table 2. From survey question 3, Prevalence of daily multivitamin use in the month prior to pregnancy, 2007/2008 MA PRAMS
83
Table 3. From survey questions 5-6, Maternal Body Mass Index (BMI) immediately prior to pregnancy (derived from maternal report of height and weight), 2007/2008 MA PRAMS
84
Table 4. From survey question 7, Maternal self-rated health post-partum, 2007/2008 MA PRAMS
84
Table 5. From survey questions 8-10, Prevalence of previous low birth weight and previous preterm births among multiparous women, 2007/2008 MA PRAMS
84
Table 6. From survey question 11, Feelings about becoming pregnant prior to this pregnancy, 2007/2008 MA PRAMS
85
Table 7. From survey question 12, Proportion of women trying to become pregnant, 2007/2008 MA PRAMS
85
Table 8. From survey question 13, Prevalence of pre-pregnancy contraception use among women who were not trying to become pregnant, 2007/2008 MA PRAMS
85
Table 9. From survey question 14, Reasons for not using a contraceptive method prior to pregnancy among women not trying to get pregnant, 2007/2008 MA PRAMS
85
Table 10. From survey questions 15-16, Prevalence of fertility treatment use, 2007/2008 MA PRAMS
86
Table 11. From survey question 17, Weeks pregnant when sure of pregnancy, 2007/2008 MA PRAMS
86
Table 12. From survey question 18, Timing of entry to prenatal care, 2007/2008 MA PRAMS
86
Table 13. From survey question 19, Prevalence of women receiving prenatal care as early as wanted, 2007/2008 MA PRAMS
87
Table 14. From survey question 20, Reasons for not getting prenatal care as early as wanted, 2007/2008 MA PRAMS
87
Table 15. From survey question 21, Sources of payment for prenatal care, 2007/2008 MA PRAMS
87
Table 16. From survey question 22, Topics discussed by health care providers during prenatal care visits, 2007/2008 MA PRAMS
88
Table 17. From survey questions 23-26, Prevalence of HIV testing, offer and refusal during pregnancy, and reasons for declining HIV testing, 2007/2008 MA PRAMS
88
13
LIST OF TABLES (APPENDIX A) PAGE
Table 18. From survey question 27, Prevalence of WIC participation during pregnancy, 2007/2008 MA PRAMS
89
Table 19. From survey question 28, Maternal health complications during pregnancy, 2007/2008 MA PRAMS
89
Table 20. From survey question 29, Prevalence of maternal hospitalization and bed rest among women with complications during pregnancy, 2007/2008 MA PRAMS
89
Table 21. From survey questions 30-33, Prevalence of maternal tobacco use prior to, during, and after pregnancy, and change in smoking status, 2007/2008 MA PRAMS
90
Table 22. From survey questions 34-36, Prevalence of maternal alcohol consumption and bingeing prior to and during pregnancy, and change in alcohol use, 2007/2008 MA PRAMS
91
Table 23. From survey question 37, Prevalence of stressful life events during pregnancy, 2007/2008 MA PRAMS
92
Table 24. From survey questions 38-39, Prevalence of physical abuse prior to and during pregnancy, 2007/2008 MA PRAMS
92
Table 25. From survey question 44, Prevalence of delivery payment sources, 2007/2008 MA PRAMS
93
Table 26. From survey questions 45-46, Infant-stay in the neonatal intensive unit (NICU) and length of infant hospital stay at birth, 2007/2008 MA PRAMS
93
Table 27. From survey questions 47-48, Infant alive now, infant living with mother, 2007/2008 MA PRAMS
94
Table 28. From survey questions 49-52, Prevalence of ever breastfeeding, any breastfeeding at 4- and 8-weeks post-partum, and exclusivity at 4- and 8-weeks post-partum, 2007/2008 MA PRAMS
94
Table 29. From survey question 53, Hours per day infant in the same room with someone who is smoking, 2007/2008 MA PRAMS
95
Table 30. From survey question 54, Prevalence of infant sleep position, 2007/2008 MA PRAMS
95
Table 31. From survey questions 55-56, Proportion of infants seen by a health care provider (HCP) within a week after leaving hospital and proportion who received a well-baby checkup, 2007/2008 MA PRAMS
95
Table 32. From survey question 57, Prevalence of infant health insurance types, 2007/2008 MA PRAMS
96
14
LIST OF TABLES (APPENDIX A) PAGE
Table 33. From survey questions 58-59, Prevalence of contraception use post-partum and reasons for not using a contraception method, 2007/2008 MA PRAMS
Table 34. From survey question 60, Prevalence of maternal post-partum checkup, 2007/2008 MA PRAMS
96
96
Table 35. From survey question 61, Sources of household income, 2007/2008 MA PRAMS
97
Table 36. From survey question 62, Total household income, 2007/2008 MA PRAMS
97
Table 37. From survey question 64, Prevalence of knowledge of emergency contraception (the “morning-after” pill), 2007/2008 MA PRAMS
97
Table 38. From survey questions 65-67, Frequency of physical activity prior to and during pregnancy; servings of fruits/vegetables per day in the last trimester of pregnancy, 2007/2008 MA PRAMS
98
Table 39. From survey question 68, Timing of discussion of the signs of preterm labor with health care providers, 2007/2008 MA PRAMS
98
Table 40. From survey questions 69-71, Prevalence of prior cesarean delivery, mode of delivery for current birth, and source of cesarean request, 2007/2008 MA PRAMS
99
Table 41. From survey question 72, Infant sleep location and bed sharing, 2007/2008 MA PRAMS
99
Table 42. From survey question 73, Prevalence of infant safety practices, 2007/2008 MA PRAMS
100
Table 43. From survey questions 74-75, Prevalence of maternal post-partum depressive symptoms and help-seeking for post-partum depression, 2007/2008 MA PRAMS
100
Table 44. From survey question 76, Prevalence of maternal health insurance types post-partum, 2007/2008 MA PRAMS
101
Table 45. From survey questions 77-78, Prevalence of maternal disability status and length of disability, 2007/2008 MA PRAMS
101
Table 46. From survey questions 79-80, Prevalence of maternal teeth cleaning, prior to, during, and after pregnancy, 2007/2008 MA PRAMS
Table 47. From survey questions 79-80, Prevalence of maternal teeth cleaning, never, ever but not recently, or recently, 2007/2008 MA PRAMS
101
101
15
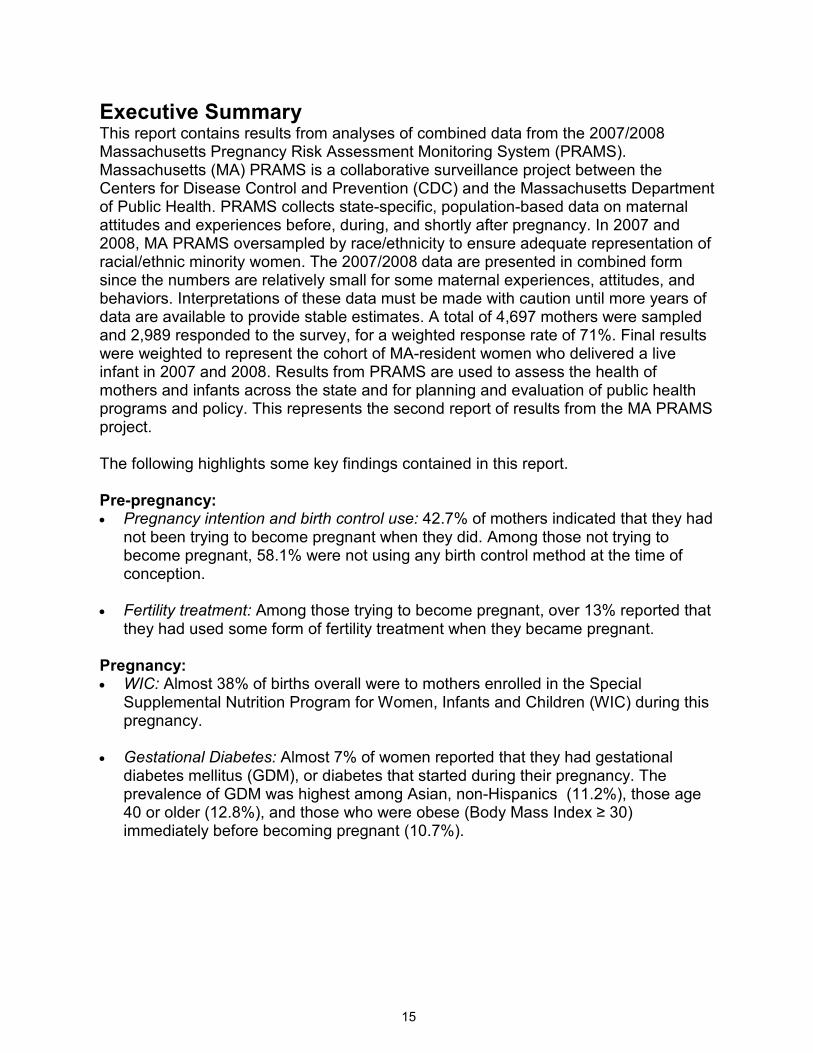
Executive Summary This report contains results from analyses of combined data from the 2007/2008 Massachusetts Pregnancy Risk Assessment Monitoring System (PRAMS). Massachusetts (MA) PRAMS is a collaborative surveillance project between the Centers for Disease Control and Prevention (CDC) and the Massachusetts Department of Public Health. PRAMS collects state-specific, population-based data on maternal attitudes and experiences before, during, and shortly after pregnancy. In 2007 and 2008, MA PRAMS oversampled by race/ethnicity to ensure adequate representation of racial/ethnic minority women. The 2007/2008 data are presented in combined form since the numbers are relatively small for some maternal experiences, attitudes, and behaviors. Interpretations of these data must be made with caution until more years of data are available to provide stable estimates. A total of 4,697 mothers were sampled and 2,989 responded to the survey, for a weighted response rate of 71%. Final results were weighted to represent the cohort of MA-resident women who delivered a live infant in 2007 and 2008. Results from PRAMS are used to assess the health of mothers and infants across the state and for planning and evaluation of public health programs and policy. This represents the second report of results from the MA PRAMS project. The following highlights some key findings contained in this report. Pre-pregnancy: • Pregnancy intention and birth control use: 42.7% of mothers indicated that they had
not been trying to become pregnant when they did. Among those not trying to become pregnant, 58.1% were not using any birth control method at the time of conception.
• Fertility treatment: Among those trying to become pregnant, over 13% reported that
they had used some form of fertility treatment when they became pregnant. Pregnancy: • WIC: Almost 38% of births overall were to mothers enrolled in the Special
Supplemental Nutrition Program for Women, Infants and Children (WIC) during this pregnancy.
• Gestational Diabetes: Almost 7% of women reported that they had gestational
diabetes mellitus (GDM), or diabetes that started during their pregnancy. The prevalence of GDM was highest among Asian, non-Hispanics (11.2%), those age 40 or older (12.8%), and those who were obese (Body Mass Index ≥ 30) immediately before becoming pregnant (10.7%).
16
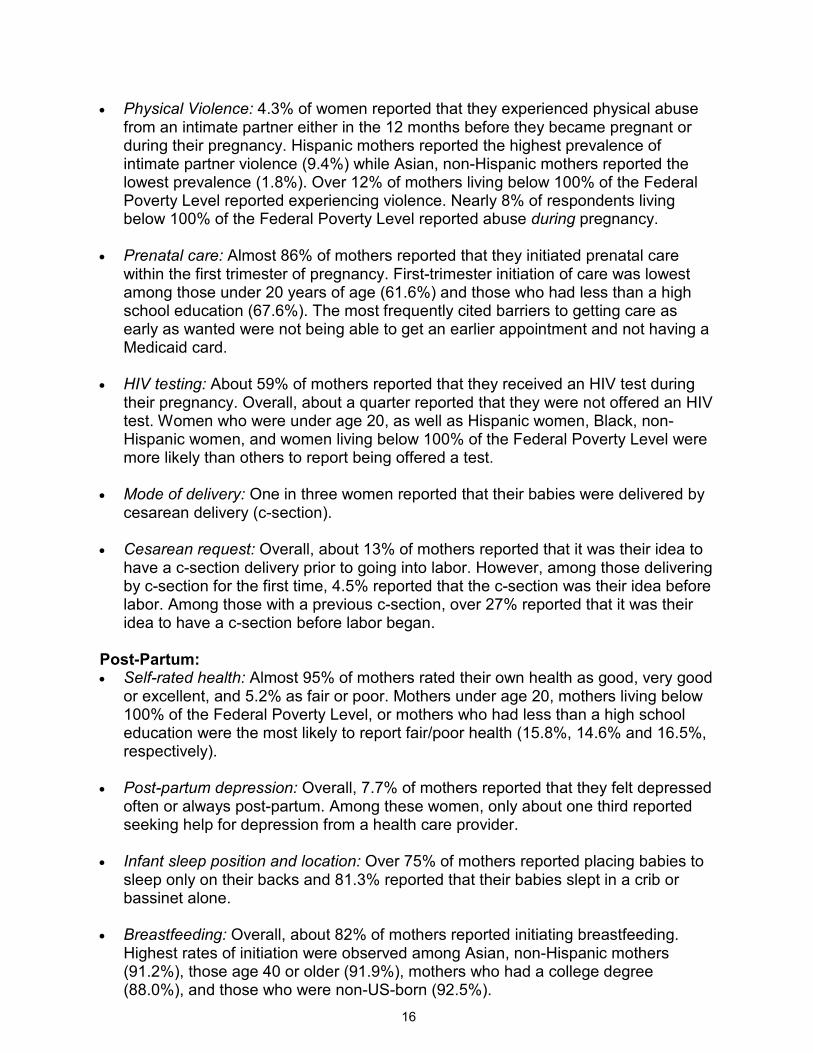
• Physical Violence: 4.3% of women reported that they experienced physical abuse from an intimate partner either in the 12 months before they became pregnant or during their pregnancy. Hispanic mothers reported the highest prevalence of intimate partner violence (9.4%) while Asian, non-Hispanic mothers reported the lowest prevalence (1.8%). Over 12% of mothers living below 100% of the Federal Poverty Level reported experiencing violence. Nearly 8% of respondents living below 100% of the Federal Poverty Level reported abuse during pregnancy.
• Prenatal care: Almost 86% of mothers reported that they initiated prenatal care
within the first trimester of pregnancy. First-trimester initiation of care was lowest among those under 20 years of age (61.6%) and those who had less than a high school education (67.6%). The most frequently cited barriers to getting care as early as wanted were not being able to get an earlier appointment and not having a Medicaid card.
• HIV testing: About 59% of mothers reported that they received an HIV test during
their pregnancy. Overall, about a quarter reported that they were not offered an HIV test. Women who were under age 20, as well as Hispanic women, Black, non-Hispanic women, and women living below 100% of the Federal Poverty Level were more likely than others to report being offered a test.
• Mode of delivery: One in three women reported that their babies were delivered by
cesarean delivery (c-section). • Cesarean request: Overall, about 13% of mothers reported that it was their idea to
have a c-section delivery prior to going into labor. However, among those delivering by c-section for the first time, 4.5% reported that the c-section was their idea before labor. Among those with a previous c-section, over 27% reported that it was their idea to have a c-section before labor began.
Post-Partum: • Self-rated health: Almost 95% of mothers rated their own health as good, very good
or excellent, and 5.2% as fair or poor. Mothers under age 20, mothers living below 100% of the Federal Poverty Level, or mothers who had less than a high school education were the most likely to report fair/poor health (15.8%, 14.6% and 16.5%, respectively).
• Post-partum depression: Overall, 7.7% of mothers reported that they felt depressed
often or always post-partum. Among these women, only about one third reported seeking help for depression from a health care provider.
• Infant sleep position and location: Over 75% of mothers reported placing babies to
sleep only on their backs and 81.3% reported that their babies slept in a crib or bassinet alone.
• Breastfeeding: Overall, about 82% of mothers reported initiating breastfeeding.
Highest rates of initiation were observed among Asian, non-Hispanic mothers (91.2%), those age 40 or older (91.9%), mothers who had a college degree (88.0%), and those who were non-US-born (92.5%).
17
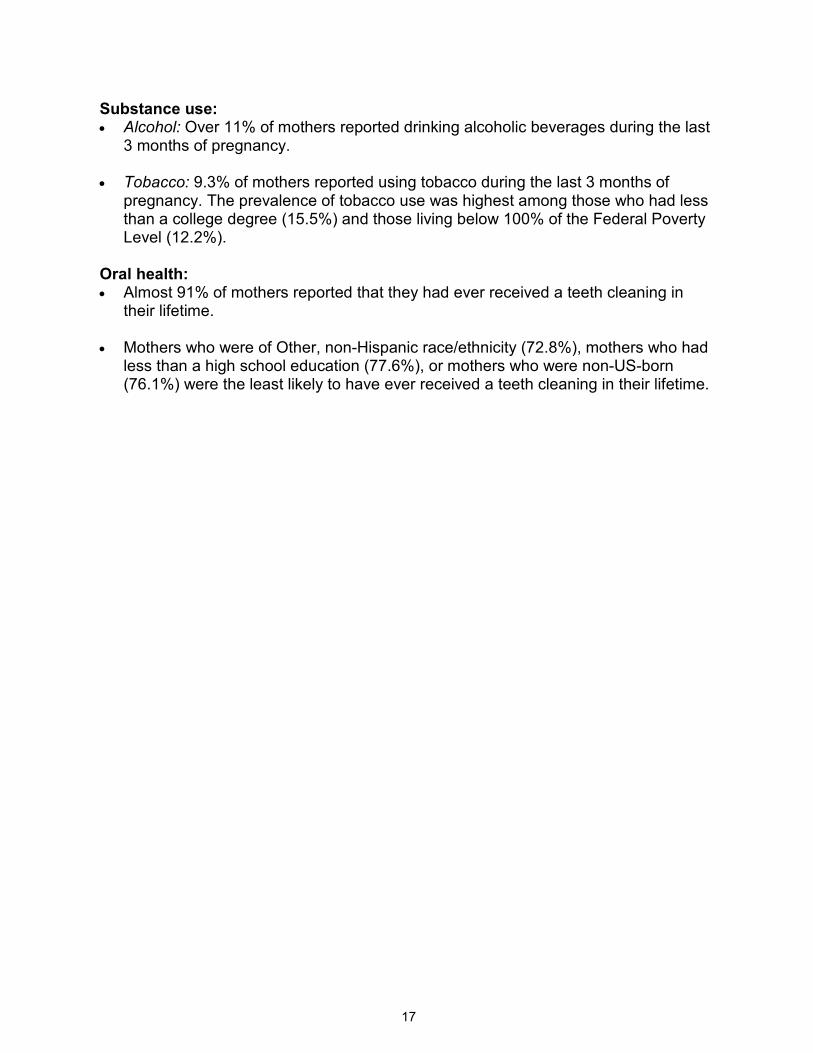
Substance use: • Alcohol: Over 11% of mothers reported drinking alcoholic beverages during the last
3 months of pregnancy. • Tobacco: 9.3% of mothers reported using tobacco during the last 3 months of
pregnancy. The prevalence of tobacco use was highest among those who had less than a college degree (15.5%) and those living below 100% of the Federal Poverty Level (12.2%).
Oral health: • Almost 91% of mothers reported that they had ever received a teeth cleaning in
their lifetime. • Mothers who were of Other, non-Hispanic race/ethnicity (72.8%), mothers who had
less than a high school education (77.6%), or mothers who were non-US-born (76.1%) were the least likely to have ever received a teeth cleaning in their lifetime.
18
Introduction The Pregnancy Risk Assessment Monitoring System (PRAMS) is a collaborative surveillance project of the Centers for Disease Control and Prevention (CDC) and state health departments. PRAMS collects state-specific, population-based data on maternal attitudes and experiences before, during, and shortly after pregnancy. Mothers are sampled for participation between two and six months post-partum, with the majority sampled two months post-partum. The goal of the PRAMS project is to improve the health of mothers and infants by supporting the reduction of adverse outcomes such as low birth weight, infant morbidity and mortality, and maternal morbidity. Initiated in 1987 as part of the CDC’s initiative to reduce infant mortality and low birth weight, the program has been expanded in recent years in support of the CDC’s Safe Motherhood Initiative to promote healthy pregnancies and the delivery of healthy infants. Currently, thirty-seven states, New York City, and South Dakota Yankton Sioux Tribe participate in PRAMS. States participating in PRAMS now account for 75% of all U.S. births. Massachusetts PRAMS began collecting data in 2007. This represents the second report of results from the Massachusetts PRAMS project. A copy of the complete MA PRAMS survey can be found in Appendix B.
19
Methodology The Massachusetts Pregnancy Risk Assessment Monitoring System (PRAMS) is an ongoing, population-based surveillance system designed to identify and monitor selected maternal attitudes, experiences and behaviors that occur before, during and after pregnancy. PRAMS began in 1987 as part of the Centers for Disease Control and Prevention (CDC) initiative to reduce infant mortality and low birth weight. In recent years, the program has been expanded in support of CDC’s Safe Motherhood Initiative to promote healthy pregnancies and the delivery of healthy infants. Massachusetts (MA) PRAMS began collecting data in 2007. The PRAMS survey consists of three types of questions. All surveys include a required set of questions (“Core” questions), which allow for multi-state analyses. Each state can select additional questions from a CDC-approved-questions list (“Standard” questions), or can create questions tailored to meet its needs (“State-developed” questions). The MA PRAMS 2007/2008 survey included a total of 80 questions: the 54 Core questions required by CDC, 16 Standard questions and 10 MA-developed questions (see Appendix B for copy of 2007/2008 MA PRAMS survey). The questionnaire was administered in English and Spanish only. PRAMS survey participants were sampled from a frame of eligible birth certificates which included all live-born infants born to MA-resident women, delivered in the state, for whom a birth certificate was available. Based on CDC’s PRAMS protocol, stillbirths, fetal deaths, induced abortions and multiple-births with quadruplets or more were excluded from the sampling frame. For the 2007/2008 samples, MA used a stratified sampling methodology, sampling disproportionately from four racial/ethnic groups: (1) White, non-Hispanic; (2) Black, non-Hispanic; (3) Hispanic; and (4) all Other, non-Hispanic. All but White, non-Hispanic mothers were over-sampled to improve precision in examining disparities by race/ethnicity. The category of Other, non-Hispanic includes all racial/ethnic groups besides White, Hispanic and Black mothers. In MA, this category contains predominantly Asian mothers. Due to small numbers in a single year, Asians, as well as those of other smaller racial/ethnic groups, were grouped into the category of “Other, non-Hispanic” for sampling purposes. In the 2007/2008 report, MA separates Asians from the “Other, non Hispanic” group for analytical purposes using the combined two-year data. Additional demographic information was obtained from the birth file, including maternal education, age, and country of birth. Women who were two to six months post-partum were selected to receive up to three mailed paper surveys. Women who had not responded to the survey after the third mailing were contacted by telephone. About three percent of MA women with a live-birth in our study period were sampled. The data were weighted using selected maternal demographics to account for non-response and adjusted for sampling probabilities and coverage to represent the MA birth population in 2007/2008. Analyses for the MA PRAMS 2007/2008 report accounted for the stratified sampling method and included the final survey weights. SAS version 9.1 and SUDAAN version 10 were used to calculate prevalence and bivariate statistics.
20
Limitations Due to the exclusion criteria of the MA PRAMS survey, the data presented in this report are generalizable only to pregnancies resulting in a live birth of singletons or multiples of fewer than four, to Massachusetts residents who gave birth in the state. The PRAMS survey is only administered in English and Spanish at this time. This presents a limitation in collecting data from mothers who speak neither survey language. Because PRAMS is based on self-reported information, there is the potential for misclassification error. Bias may occur if some groups of mothers may recall experiences more or less accurately than others. Income data were collected, however, almost 11% of respondents declined to report income, and analyses involving household poverty could not include these respondents. Lastly, while PRAMS data are weighted to reflect the population of women giving birth in Massachusetts in 2007/2008, about 30% of those surveyed did not respond and results may be biased if weighting did not account for certain characteristics or experiences associated with non-response.
PRAMS SAMPLE CHARACTERISTICS (Weighted)
21
Race/ethnicity and nativity After applying sampling weights, PRAMS 2007/2008 respondents were largely reflective of the overall population of MA mothers. White, non-Hispanics constituted almost 67.8% of the sample, Hispanics represented 14.4%, Black, non-Hispanics 8.3%, Asian, non-Hispanics, 7.9%, and Other, non-Hispanics, 1.6%. About 30% of respondents were not born in the United States.
Marital Status Over 34% of respondents were unmarried.
Parity Just over half of mothers (51.8%) in our sample had previously given birth to a live-born infant.
Education Most mothers, almost 89%, had at least a high school education, with over 45% holding a college degree.
Preferred Language Most mothers, about 88%, preferred to read or discuss health-related materials in English, followed by Spanish, 6.4%, Portuguese, 2.7%, Chinese, 0.8%, and all other languages, 2%.
Age Eighty-nine percent of mothers were between 20 and 39 years of age, 6.4% were under age 20 and 4.4% were 40 years or older.
Income and public assistance More than one in five mothers were living at or below 100% of the Federal Poverty Level* (FPL) in the year before their babies were born. Over 88% lived in a household where at least some income was from employment and almost 16% received some form of public assistance.
Disability Almost 5% of mothers reported having a current emotional or physical disability. Most indicated that the disability had existed for at least a month.
*See Appendix A for technical note on the calculation of household poverty level.
PRAMS SAMPLE CHARACTERISTICS (Weighted)
22
Characteristic Sample n
Weighted
n
Weighted
%* State %***
Total 2989 148838 100.0 n/a
Maternal race/ethnicity
White, non-Hispanic 900 100962 67.8 67.8
Black, non-Hispanic 594 12365 8.3 8.4
Hispanic 784 21422 14.4 13.9
Asian, non-Hispanic 608 11764 7.9 7.5
Other/Unknown, non-Hispanic 103 2325 1.6 2.3
Maternal age (years)
<20 215 9759 6.6 6.2
20-29 1287 60528 40.7 40.8
30-39 1378 72986 49.0 48.5
40+ 109 5565 3.7 4.5
Maternal education
<High school 412 16624 11.2 10.8
High school diploma 784 37973 25.5 25.4
Some college 611 26815 18.0 20.4
College graduate 1181 67398 45.3 43.4
Household poverty status (approximate)**
> 100% Federal Poverty Level (FPL) 1886 107117 78.7 n/a
≤ 100% Federal Poverty Level (FPL) 772 28964 21.3 n/a
Maternal nativity
Non-US-born 1563 44548 29.9 29.8
US-born 1426 104291 70.1 70.2
Preferred language
English 2429 131262 88.2 88.6
Spanish 350 9575 6.4 5.7
Portuguese 58 3970 2.7 2.7
Chinese 52 1214 0.8 0.7
Other 100 2818 2 2.4
Marital status
Unmarried 1193 51007 34.3 33.5
Married 1796 97831 65.7 66.6
Maternal disability
No 2732 137691 95.1 n/a
Yes 138 7134 4.9 n/a
Duration of disability
Non-disabled 2732 137691 96.0 n/a
1 to 29 days 15 406 0.3 n/a
30+ days 90 5307 3.7 n/a
Parity
No previous live births 1368 71180 48.3 45.2
Previous live births 1574 76357 51.8 54.8
*Does not include missing in proportions.
**See Methodology for explanation of "household poverty status" used in this report.
***Based on figures, Massachusetts Births, 2007/2008.
Table 1. Maternal Characteristics, PRAMS respondents vs. state birth population, 2007/2008 MA PRAMS
†
†The data were weighted using selected maternal demographics to account for non-response and adjusted for sampling probabilities and coverage to represent the Massachusetts birth population in 2007/2008.
PRE-PREGNANCY
23
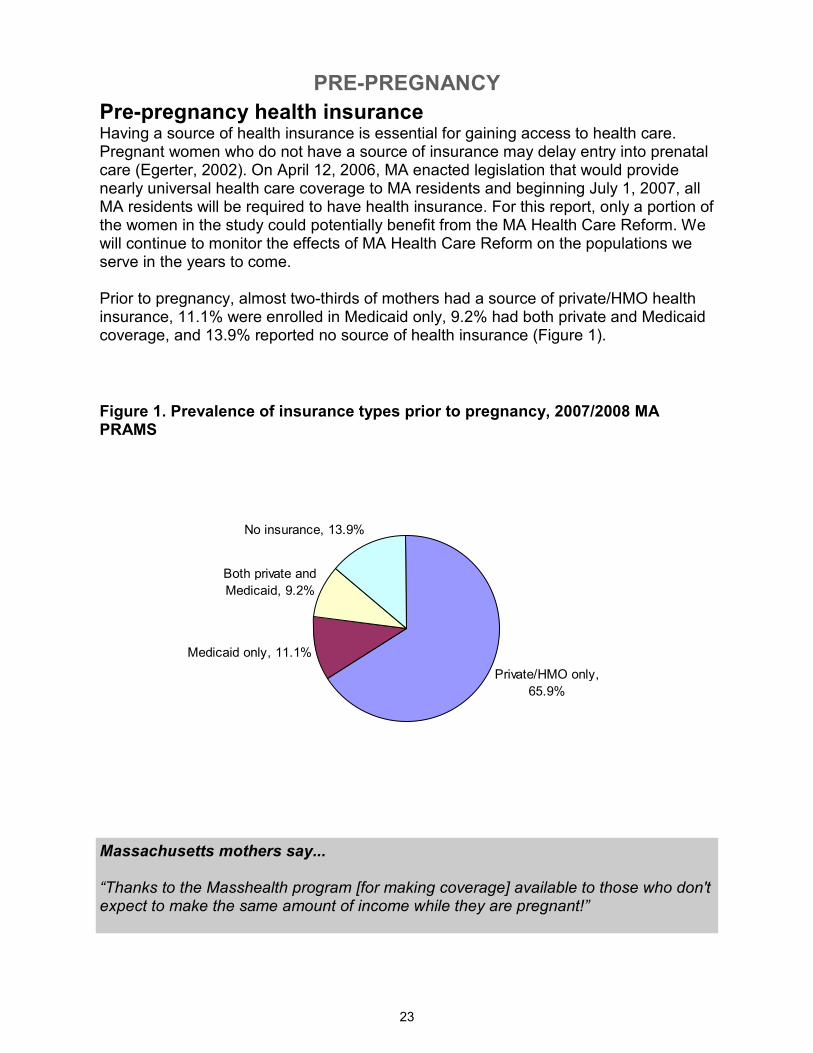
Pre-pregnancy health insurance Having a source of health insurance is essential for gaining access to health care. Pregnant women who do not have a source of insurance may delay entry into prenatal care (Egerter, 2002). On April 12, 2006, MA enacted legislation that would provide nearly universal health care coverage to MA residents and beginning July 1, 2007, all MA residents will be required to have health insurance. For this report, only a portion of the women in the study could potentially benefit from the MA Health Care Reform. We will continue to monitor the effects of MA Health Care Reform on the populations we serve in the years to come. Prior to pregnancy, almost two-thirds of mothers had a source of private/HMO health insurance, 11.1% were enrolled in Medicaid only, 9.2% had both private and Medicaid coverage, and 13.9% reported no source of health insurance (Figure 1).
Massachusetts mothers say... “Thanks to the Masshealth program [for making coverage] available to those who don't expect to make the same amount of income while they are pregnant!”
Figure 1. Prevalence of insurance types prior to pregnancy, 2007/2008 MA PRAMS
Private/HMO only,
65.9%
Medicaid only, 11.1%
Both private and
Medicaid, 9.2%
No insurance, 13.9%
PRE-PREGNANCY
24
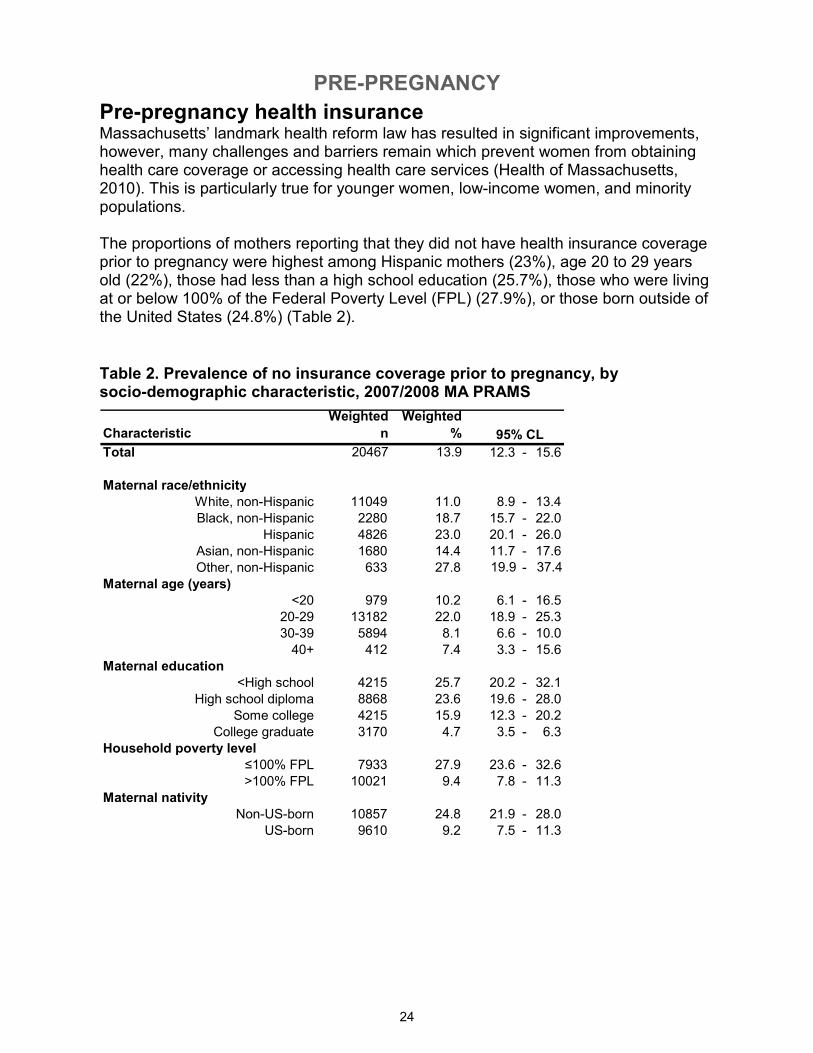
Pre-pregnancy health insurance Massachusetts’ landmark health reform law has resulted in significant improvements, however, many challenges and barriers remain which prevent women from obtaining health care coverage or accessing health care services (Health of Massachusetts, 2010). This is particularly true for younger women, low-income women, and minority populations. The proportions of mothers reporting that they did not have health insurance coverage prior to pregnancy were highest among Hispanic mothers (23%), age 20 to 29 years old (22%), those had less than a high school education (25.7%), those who were living at or below 100% of the Federal Poverty Level (FPL) (27.9%), or those born outside of the United States (24.8%) (Table 2).
Table 2. Prevalence of no insurance coverage prior to pregnancy, by socio-demographic characteristic, 2007/2008 MA PRAMS
Characteristic
Weighted
n
Weighted
%
Total 20467 13.9 # 12.3 - 15.6
Maternal race/ethnicity
White, non-Hispanic 11049 11.0 # 8.9 - 13.4
Black, non-Hispanic 2280 18.7 # 15.7 - 22.0
Hispanic 4826 23.0 # 20.1 - 26.0
Asian, non-Hispanic 1680 14.4 # 11.7 - 17.6
Other, non-Hispanic 633 27.8 # 19.9 - 37.4
Maternal age (years)
<20 979 10.2 # 6.1 - 16.5
20-29 13182 22.0 # 18.9 - 25.3
30-39 5894 8.1 # 6.6 - 10.0
40+ 412 7.4 # 3.3 - 15.6
Maternal education
<High school 4215 25.7 # 20.2 - 32.1
High school diploma 8868 23.6 # 19.6 - 28.0
Some college 4215 15.9 # 12.3 - 20.2
College graduate 3170 4.7 # 3.5 - 6.3
Household poverty level
≤100% FPL 7933 27.9 # 23.6 - 32.6
>100% FPL 10021 9.4 # 7.8 - 11.3
Maternal nativity
Non-US-born 10857 24.8 # 21.9 - 28.0
US-born 9610 9.2 # 7.5 - 11.3
95% CL
PRE-PREGNANCY
25
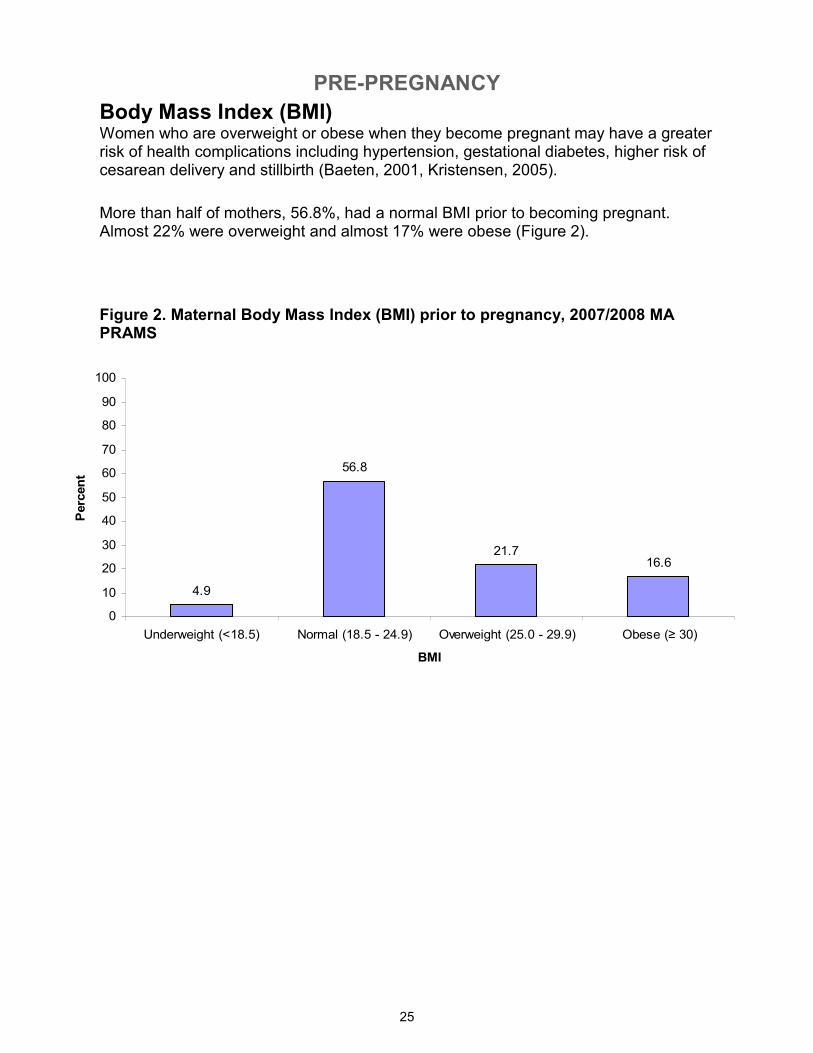
Body Mass Index (BMI) Women who are overweight or obese when they become pregnant may have a greater risk of health complications including hypertension, gestational diabetes, higher risk of cesarean delivery and stillbirth (Baeten, 2001, Kristensen, 2005).
More than half of mothers, 56.8%, had a normal BMI prior to becoming pregnant. Almost 22% were overweight and almost 17% were obese (Figure 2).
Figure 2. Maternal Body Mass Index (BMI) prior to pregnancy, 2007/2008 MA PRAMS
4.9
56.8
21.716.6
0
10
20
30
40
50
60
70
80
90
100
Underweight (<18.5) Normal (18.5 - 24.9) Overweight (25.0 - 29.9) Obese (≥ 30)
BMI
Percent
PRE-PREGNANCY
26
< Every day, 16.2%
Every day, 47.7%
Never, 36.1%
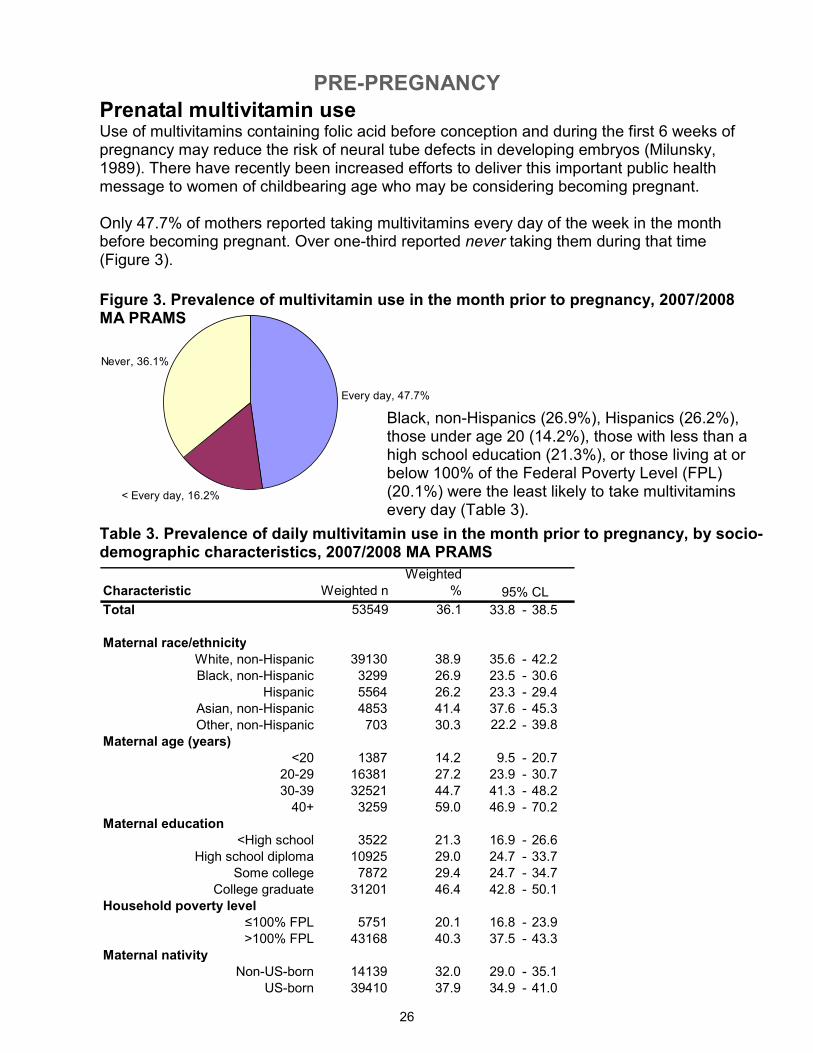
Black, non-Hispanics (26.9%), Hispanics (26.2%), those under age 20 (14.2%), those with less than a high school education (21.3%), or those living at or below 100% of the Federal Poverty Level (FPL) (20.1%) were the least likely to take multivitamins every day (Table 3).
Table 3. Prevalence of daily multivitamin use in the month prior to pregnancy, by socio-demographic characteristics, 2007/2008 MA PRAMS
Characteristic Weighted n
Weighted
%
Total 53549 36.1 # 33.8 - 38.5
Maternal race/ethnicity
White, non-Hispanic 39130 38.9 # 35.6 - 42.2
Black, non-Hispanic 3299 26.9 # 23.5 - 30.6
Hispanic 5564 26.2 # 23.3 - 29.4
Asian, non-Hispanic 4853 41.4 # 37.6 - 45.3
Other, non-Hispanic 703 30.3 # 22.2 - 39.8
Maternal age (years)
<20 1387 14.2 # 9.5 - 20.7
20-29 16381 27.2 # 23.9 - 30.7
30-39 32521 44.7 # 41.3 - 48.2
40+ 3259 59.0 # 46.9 - 70.2
Maternal education
<High school 3522 21.3 # 16.9 - 26.6
High school diploma 10925 29.0 # 24.7 - 33.7
Some college 7872 29.4 # 24.7 - 34.7
College graduate 31201 46.4 # 42.8 - 50.1
Household poverty level
≤100% FPL 5751 20.1 # 16.8 - 23.9
>100% FPL 43168 40.3 # 37.5 - 43.3
Maternal nativity
Non-US-born 14139 32.0 # 29.0 - 35.1
US-born 39410 37.9 # 34.9 - 41.0
95% CL
Figure 3. Prevalence of multivitamin use in the month prior to pregnancy, 2007/2008 MA PRAMS
Prenatal multivitamin use Use of multivitamins containing folic acid before conception and during the first 6 weeks of pregnancy may reduce the risk of neural tube defects in developing embryos (Milunsky, 1989). There have recently been increased efforts to deliver this important public health message to women of childbearing age who may be considering becoming pregnant. Only 47.7% of mothers reported taking multivitamins every day of the week in the month before becoming pregnant. Over one-third reported never taking them during that time (Figure 3).
PRE-PREGNANCY
27
Wanted right then
45.7%
Wanted sooner
22.1%
Wanted later
25.2%
Wanted never
7.0%
Not trying
42.7%
Trying to
get
pregnant
57.3%
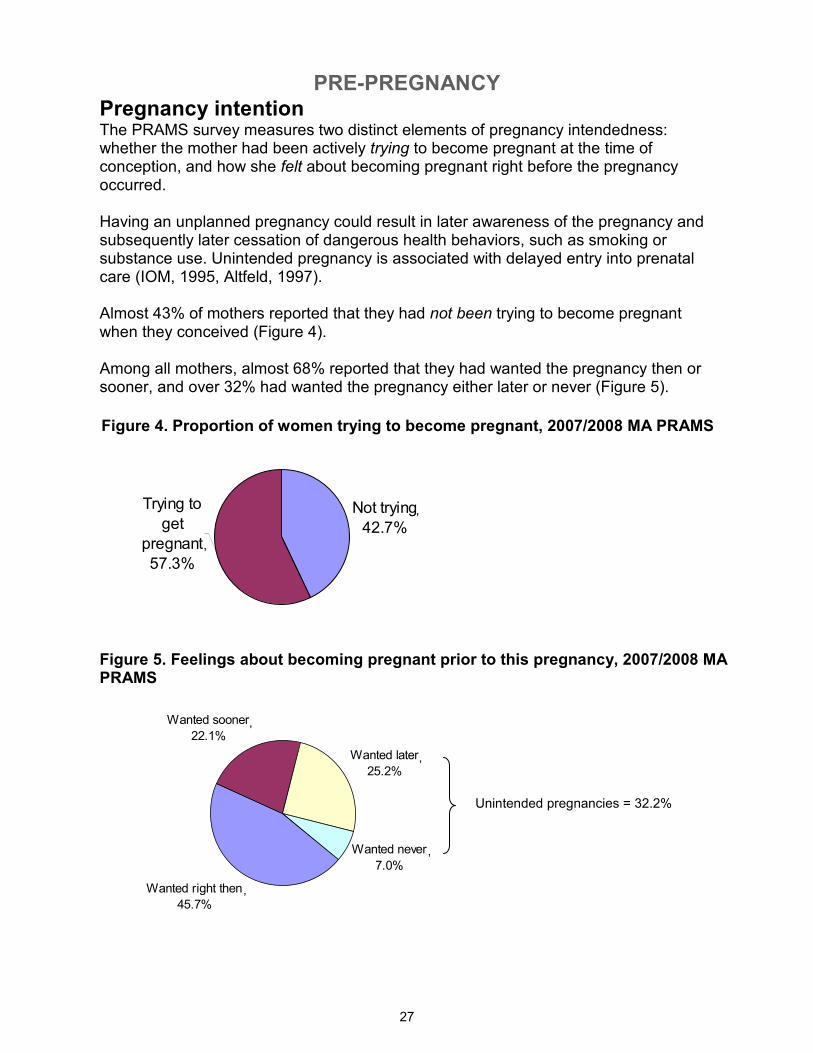
Pregnancy intention The PRAMS survey measures two distinct elements of pregnancy intendedness: whether the mother had been actively trying to become pregnant at the time of conception, and how she felt about becoming pregnant right before the pregnancy occurred. Having an unplanned pregnancy could result in later awareness of the pregnancy and subsequently later cessation of dangerous health behaviors, such as smoking or substance use. Unintended pregnancy is associated with delayed entry into prenatal care (IOM, 1995, Altfeld, 1997). Almost 43% of mothers reported that they had not been trying to become pregnant when they conceived (Figure 4). Among all mothers, almost 68% reported that they had wanted the pregnancy then or sooner, and over 32% had wanted the pregnancy either later or never (Figure 5).
Figure 4. Proportion of women trying to become pregnant, 2007/2008 MA PRAMS
Figure 5. Feelings about becoming pregnant prior to this pregnancy, 2007/2008 MA PRAMS
,
,
Unintended pregnancies = 32.2%
,
,
,
,
PRE-PREGNANCY
28
Characteristic
Weighted
n
Weighted
%
s
e
Weighted
n
Weighted
%
s
e
Total 62735 42.7 # 40.3 - 45.1 47125 32.2 # 30.0 - 34.5
Maternal race/ethnicity
White, non-Hispanic 37297 37.3 2 34.0 - 40.8 27138 27.4 # 24.3 - 30.6
Black, non-Hispanic 8055 66.1 2 62.2 - 69.8 6084 49.9 # 45.9 - 53.9
Hispanic 11940 56.7 2 53.3 - 60.2 9699 46.3 # 42.8 - 49.8
Asian, non-Hispanic 4213 36.5 2 32.7 - 40.4 3229 27.9 # 24.4 - 31.7
Other, non-Hispanic 1230 53.6 5 43.9 - 63.0 976 42.3 # 33.1 - 52.1
Maternal age (years)
≤15 481 96.0 4 75.5 - 99.5 452 90.3 # 65.7 - 97.8
16-17 3148 98.1 1 92.7 - 99.5 3070 96.5 # 90.9 - 98.7
18-19 4733 78.5 5 66.7 - 87.0 3992 66.0 # 53.6 - 76.5
20-29 30782 51.7 2 47.8 - 55.5 23840 40.1 # 36.4 - 43.9
30-39 21956 30.4 2 27.4 33.6 14677 20.5 # 17.9 23.3
40+ 1635 30.1 5 20.8 - 41.4 1093 20.3 # 12.7 - 30.9
Maternal education
<High school 11778 71.8 3 66.0 - 76.9 9091 55.3 # 48.6 - 61.8
High school diploma 21245 56.9 3 51.8 - 61.8 15714 42.5 # 37.6 - 47.5
Some college 13170 49.6 3 44.2 - 55.1 10070 37.9 # 32.8 - 43.2
College graduate 16542 24.8 2 21.9 - 28.0 12250 18.5 # 15.9 - 21.5
Household poverty level
≤100% FPL 20442 71.2 2 66.8 - 75.3 15069 52.8 # 47.8 - 57.7
>100% FPL 35610 33.6 1 30.9 - 36.5 27196 25.8 # 23.3 - 28.5
Maternal nativity
Non-US-born 20750 47.5 2 44.3 - 50.8 15263 35.2 # 32.1 - 38.4
US-born 41984 40.6 2 37.6 - 43.8 31862 31.0 # 28.2 - 33.9
Marital status
Married 26818 27.7 1 25.1 - 30.5 18583 19.3 # 17.1 - 21.8
Unmarried 35916 71.5 2 67.8 - 74.9 28542 56.9 # 52.9 - 60.9
History of physical abuse
No 57623 41.7 1 39.3 - 44.2 42737 31.2 # 28.9 - 33.5
Yes 3866 62.6 6 51.0 - 73.0 3469 55.9 # 44.6 - 66.7
95% CL 95% CL
% Not trying to become pregnant % Wanted pregnancy later/never
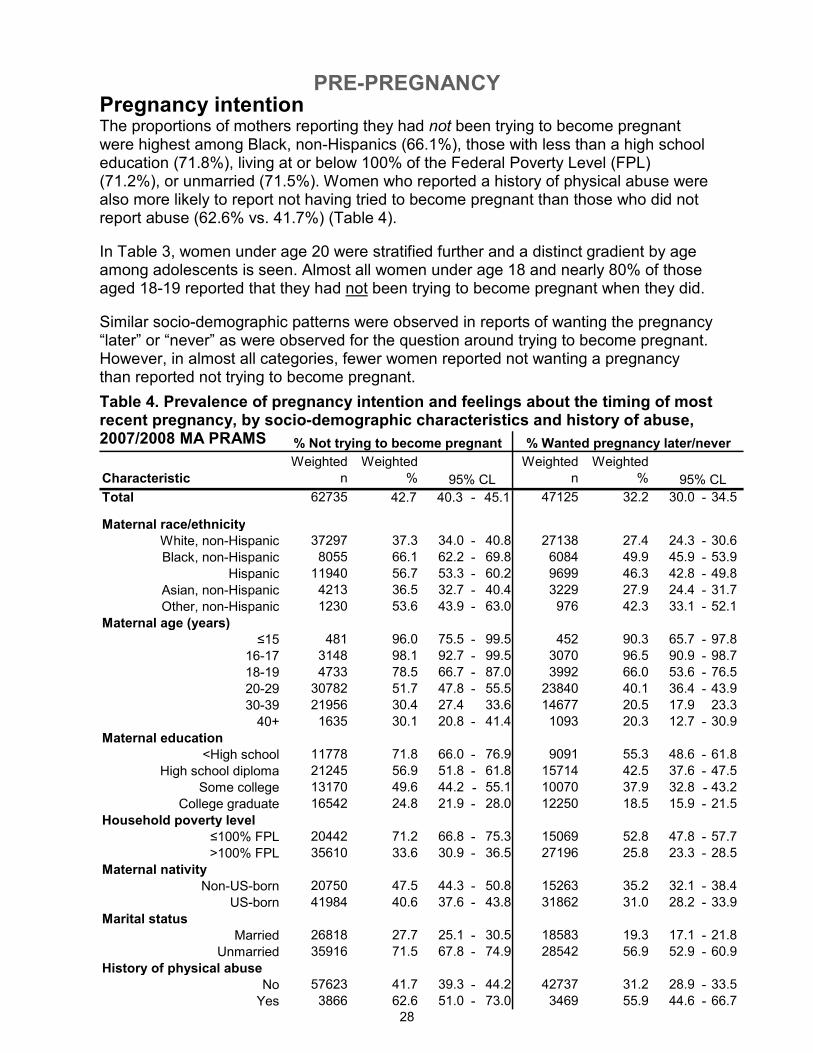
Pregnancy intention The proportions of mothers reporting they had not been trying to become pregnant were highest among Black, non-Hispanics (66.1%), those with less than a high school education (71.8%), living at or below 100% of the Federal Poverty Level (FPL) (71.2%), or unmarried (71.5%). Women who reported a history of physical abuse were also more likely to report not having tried to become pregnant than those who did not report abuse (62.6% vs. 41.7%) (Table 4).
In Table 3, women under age 20 were stratified further and a distinct gradient by age among adolescents is seen. Almost all women under age 18 and nearly 80% of those aged 18-19 reported that they had not been trying to become pregnant when they did.
Similar socio-demographic patterns were observed in reports of wanting the pregnancy “later” or “never” as were observed for the question around trying to become pregnant. However, in almost all categories, fewer women reported not wanting a pregnancy than reported not trying to become pregnant.
Table 4. Prevalence of pregnancy intention and feelings about the timing of most recent pregnancy, by socio-demographic characteristics and history of abuse, 2007/2008 MA PRAMS
PRE-PREGNANCY
29
Characteristic
Weighted
n
Weighted
%
s
e
Total 32340 22.1 # 20.2 - 24.2
Maternal race/ethnicity
White, non-Hispanic 23157 23.3 # 20.6 - 26.4
Black, non-Hispanic 2372 19.5 # 16.5 - 34.3
Hispanic 2719 13.0 # 10.8 - 15.5
Asian, non-Hispanic 3670 31.7 # 28.1 - 35.5
Other, non-Hispanic 422 18.3 # 12.1 - 26.7
Maternal age (years)
<20 280 2.9 # 1.6 - 5.2
20-29 10388 17.5 # 14.7 - 20.6
30-39 19196 26.8 # 23.8 - 30.0
40+ 2476 46.0 # 34.0 - 58.5
Maternal education
<High school 1706 10.4 # 7.1 - 14.8
High school diploma 6680 18.0 # 14.5 - 22.3
Some college 6077 22.9 # 18.5 - 27.9
College graduate 17876 27.0 # 23.9 - 30.4
Household poverty level
≤100% FPL 3609 12.6 # 9.8 - 16.1
>100% FPL 27096 25.7 # 23.2 - 28.4
Maternal nativity
Non-US-born 10152 23.4 # 20.7 - 26.4
US-born 22187 21.6 # 19.1 - 24.3
Marital status
Married 26578 27.7 # 25.0 - 30.5
Unmarried 5762 11.5 # 9.3 - 14.1
History of physical abuse
No 840 17.6 # 10.2 - 28.7
Yes 31149 22.4 # 20.4 - 24.6
95% CL
% Wanted pregnancy sooner
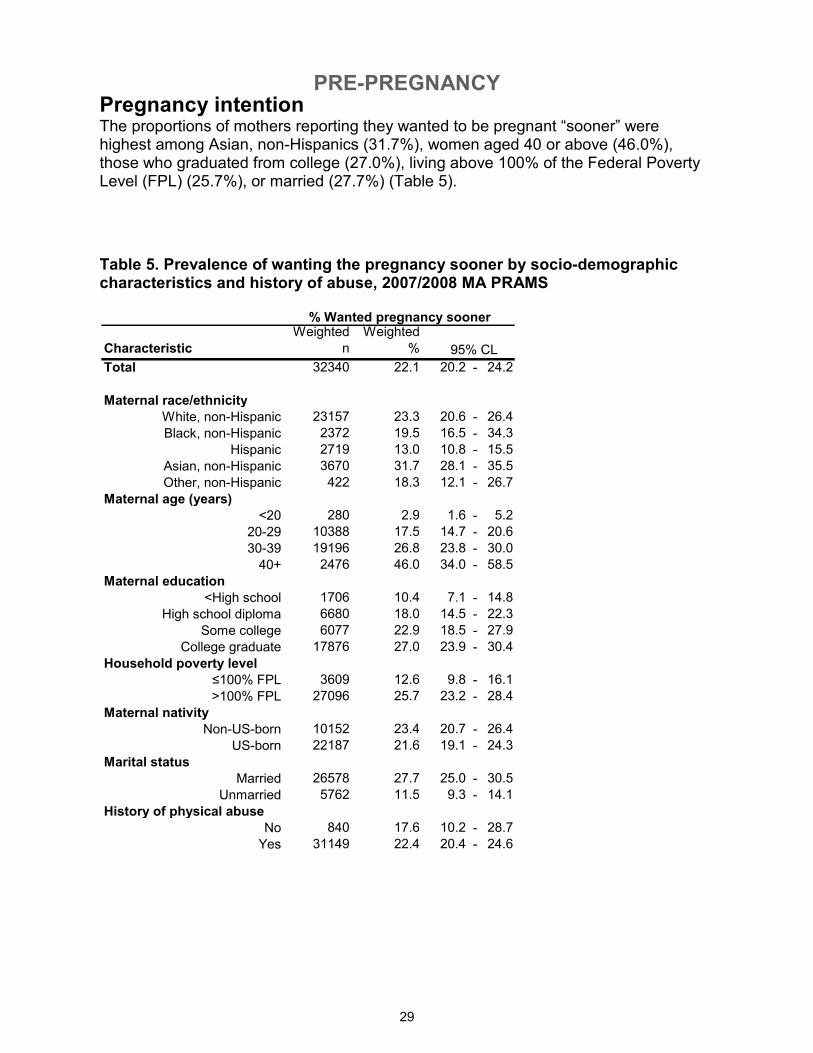
Pregnancy intention The proportions of mothers reporting they wanted to be pregnant “sooner” were highest among Asian, non-Hispanics (31.7%), women aged 40 or above (46.0%), those who graduated from college (27.0%), living above 100% of the Federal Poverty Level (FPL) (25.7%), or married (27.7%) (Table 5).
Table 5. Prevalence of wanting the pregnancy sooner by socio-demographic characteristics and history of abuse, 2007/2008 MA PRAMS
PRE-PREGNANCY
30
Did not use birth
control, 58.1%
Used birth control,
41.9%
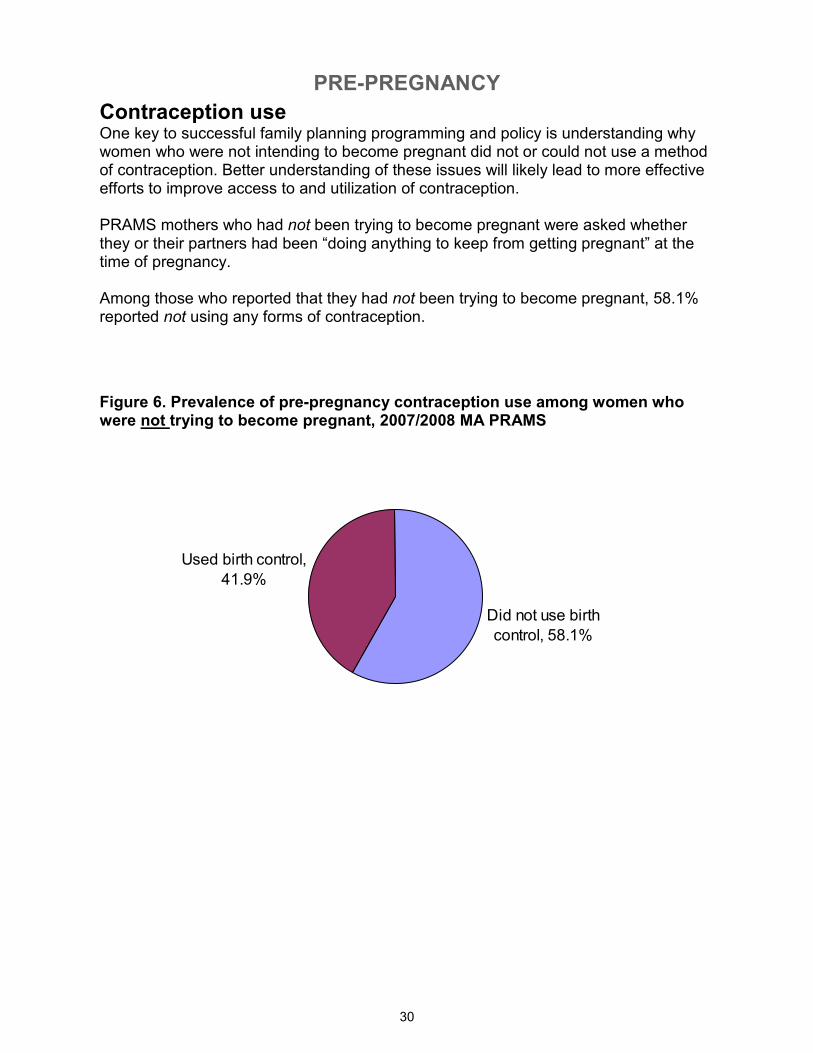
Contraception use One key to successful family planning programming and policy is understanding why women who were not intending to become pregnant did not or could not use a method of contraception. Better understanding of these issues will likely lead to more effective efforts to improve access to and utilization of contraception. PRAMS mothers who had not been trying to become pregnant were asked whether they or their partners had been “doing anything to keep from getting pregnant” at the time of pregnancy. Among those who reported that they had not been trying to become pregnant, 58.1% reported not using any forms of contraception.
Figure 6. Prevalence of pre-pregnancy contraception use among women who were not trying to become pregnant, 2007/2008 MA PRAMS
PRE-PREGNANCY
31
Weighted
n
Weighted
%
Total 123784 85.2 83.7 - 86.6
Feelings about becoming pregnant
Wanted to become pregnant sooner/then 85001 87.8 86.2 - 89.4Wanted to become pregnant later or never 36734 79.8 76.8 - 82.9
All respondents who answered both questions 121735 85.2 83.8 - 86.7
% Knowledgeable about
"morning after pill"
95% CL
48.8
26.8
13.4 13.3
6.73.1
12.0
0
10
20
30
40
50
60
Didn't mind
getting
pregnant
Didn't think
could become
pregnant
Partner didn't
want to use
Side effects
from BC
Thought
partner was
sterile
Problems
acquiring BC
Other
Reasons
Percent
Emergency contraception The majority of women, 85.2%, reported knowing about emergency contraception or the “morning after” pill before becoming pregnant. Women who reported that they had wanted to become pregnant later or never were less likely (79.8%) to report knowing about the morning after pill than those who had wanted to become pregnant then or sooner.
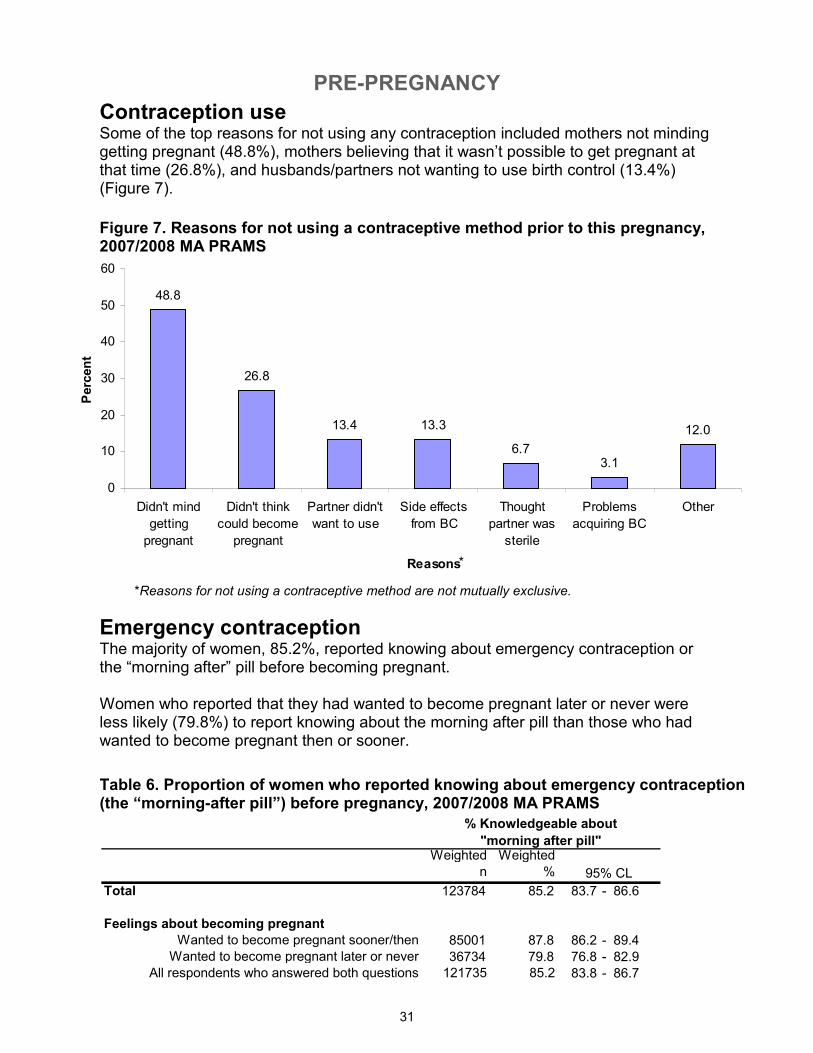
Contraception use Some of the top reasons for not using any contraception included mothers not minding getting pregnant (48.8%), mothers believing that it wasn’t possible to get pregnant at that time (26.8%), and husbands/partners not wanting to use birth control (13.4%) (Figure 7).
Figure 7. Reasons for not using a contraceptive method prior to this pregnancy, 2007/2008 MA PRAMS
Table 6. Proportion of women who reported knowing about emergency contraception (the “morning-after pill”) before pregnancy, 2007/2008 MA PRAMS
*
*Reasons for not using a contraceptive method are not mutually exclusive.
PRE-PREGNANCY
32
92.6%
7.4%3.6% 1.5% 2.8%
1.2%
0%
20%
40%
60%
80%
100%
No Yes Drugs Artificial
Insemination
Assisted
reproductive
technology
(IVF, other)
Other
treatment
Any help getting pregnant Type of reproductive assistance**
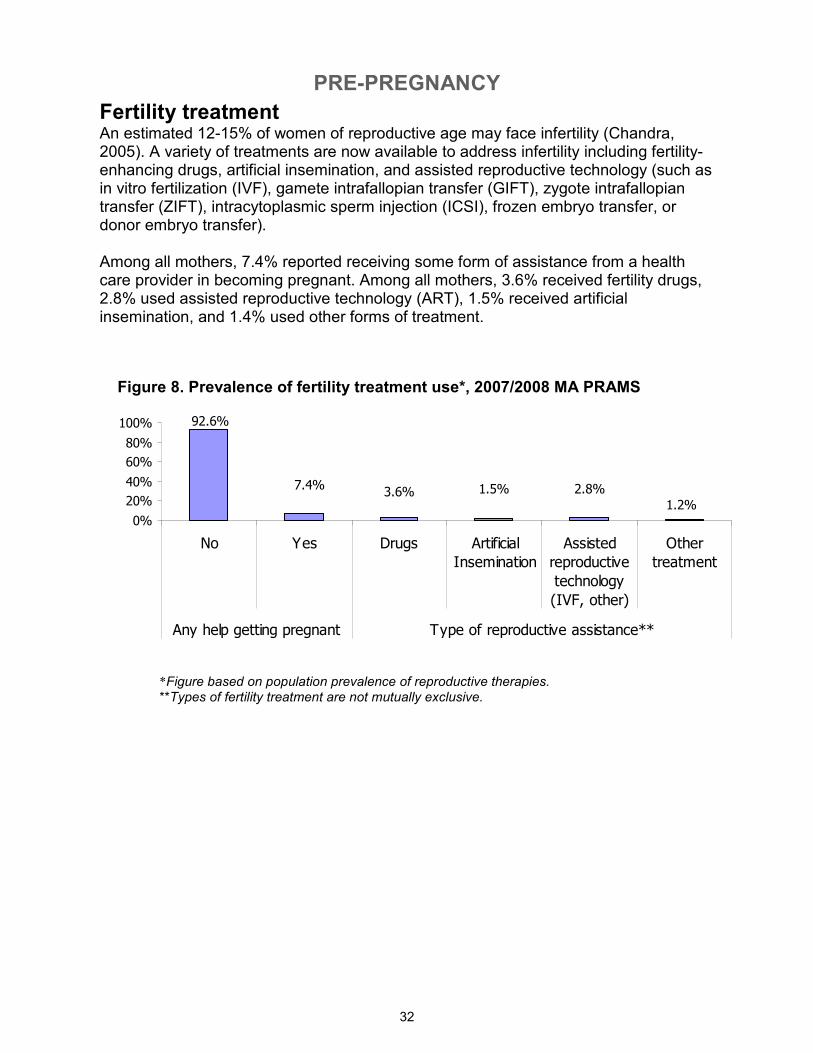
Fertility treatment An estimated 12-15% of women of reproductive age may face infertility (Chandra, 2005). A variety of treatments are now available to address infertility including fertility-enhancing drugs, artificial insemination, and assisted reproductive technology (such as in vitro fertilization (IVF), gamete intrafallopian transfer (GIFT), zygote intrafallopian transfer (ZIFT), intracytoplasmic sperm injection (ICSI), frozen embryo transfer, or donor embryo transfer). Among all mothers, 7.4% reported receiving some form of assistance from a health care provider in becoming pregnant. Among all mothers, 3.6% received fertility drugs, 2.8% used assisted reproductive technology (ART), 1.5% received artificial insemination, and 1.4% used other forms of treatment.
Figure 8. Prevalence of fertility treatment use*, 2007/2008 MA PRAMS
*Figure based on population prevalence of reproductive therapies. **Types of fertility treatment are not mutually exclusive.
PRE-PREGNANCY
33
CharacteristicWeighted
n
Weighted
%
Total 11044 7.4 6.2 - 8.8
Maternal race/ethnicity
White, non-Hispanic 8564 8.5 6.8 - 10.5
Black, non-Hispanic 449 3.6 2.4 - 5.4
Hispanic 956 4.5 3.3 - 6.1
Asian, non-Hispanic 1018 8.7 6.7 - 11.1
Other, non-Hispanic 57 2.5 0.6 - 9.0
Maternal age (years)
<20 174 1.8 0.3 - 11.4
20-29 1925 3.2 2.1 - 4.8
30-39 7493 10.3 8.3 - 12.6
40+ 1452 26.1 16.4 - 38.9
Maternal education
<High school 493 3.0 1.4 - 6.4
High school diploma 1547 4.1 2.5 - 6.6
Some college 1444 5.4 3.3 - 8.6
College graduate 7559 11.2 9.1 - 13.8
Household poverty level
≤100% FPL 657 2.3 1.2 - 4.1
>100% FPL 9717 9.1 7.5 - 10.9
Maternal nativity
Non-US born 2349 5.3 4.1 - 6.8
US born 8694 8.3 6.8 - 10.3
Had any medical assistance in
becoming pregnant
95% CL
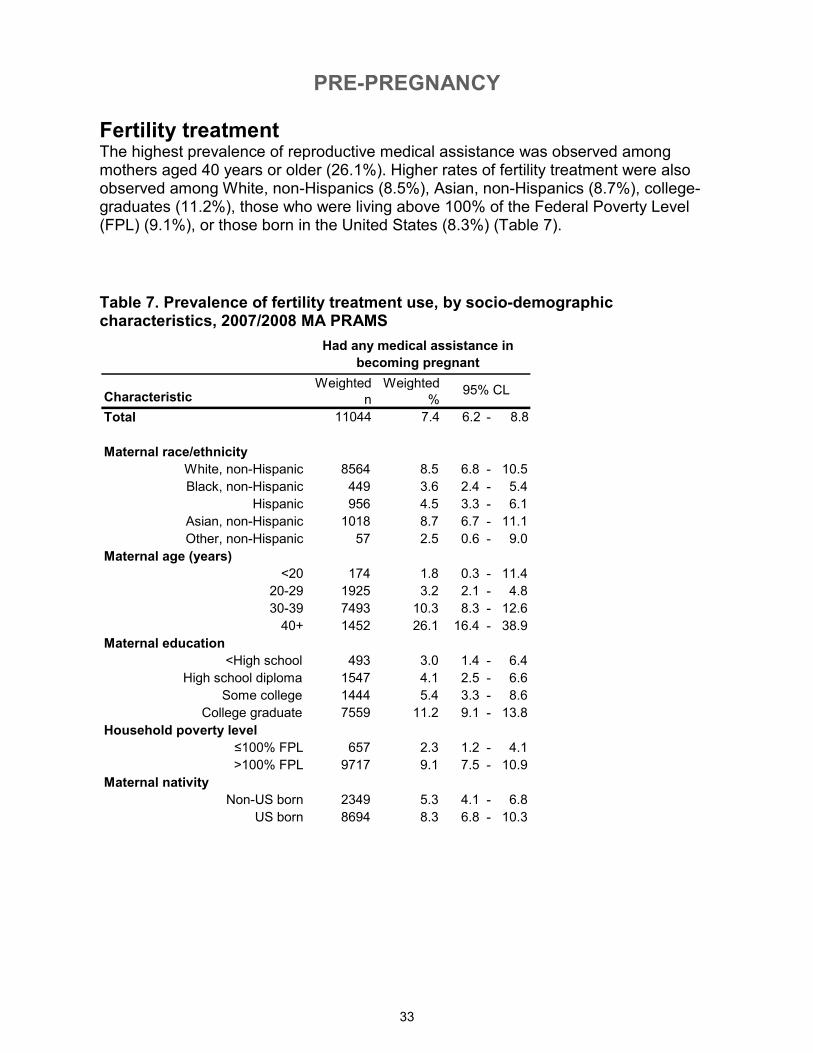
Fertility treatment The highest prevalence of reproductive medical assistance was observed among mothers aged 40 years or older (26.1%). Higher rates of fertility treatment were also observed among White, non-Hispanics (8.5%), Asian, non-Hispanics (8.7%), college-graduates (11.2%), those who were living above 100% of the Federal Poverty Level (FPL) (9.1%), or those born in the United States (8.3%) (Table 7).
Table 7. Prevalence of fertility treatment use, by socio-demographic characteristics, 2007/2008 MA PRAMS
PRE-PREGNANCY
34
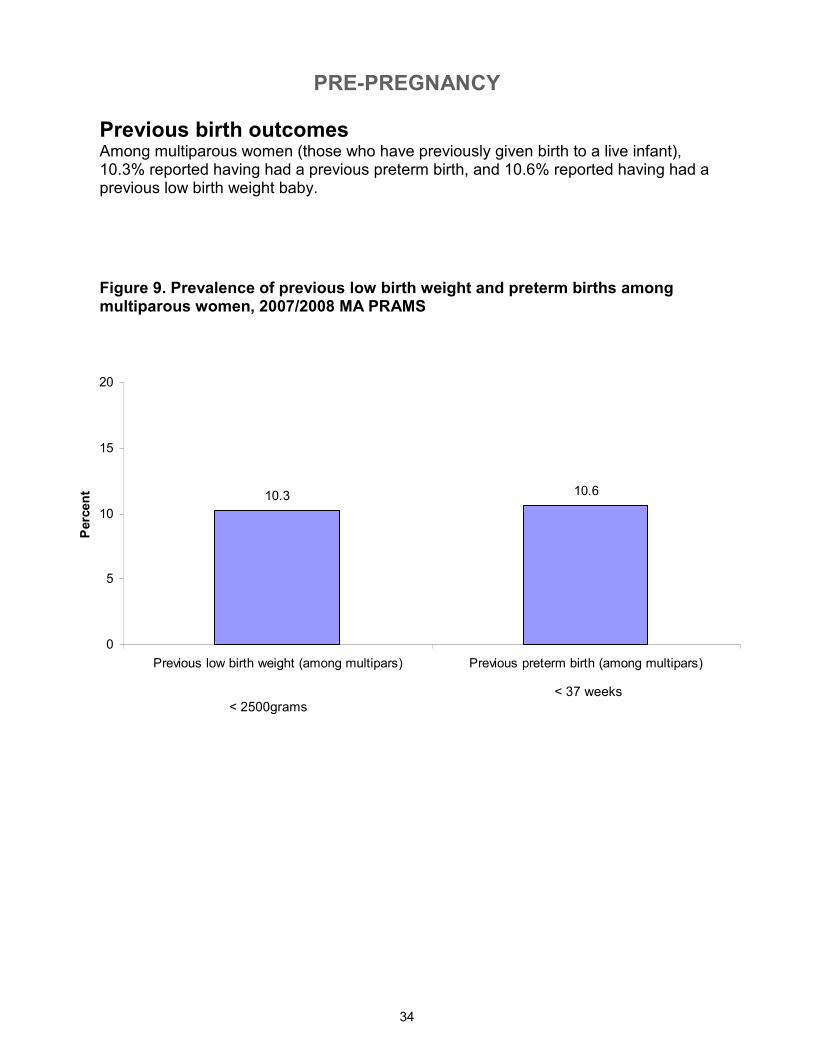
Previous birth outcomes Among multiparous women (those who have previously given birth to a live infant), 10.3% reported having had a previous preterm birth, and 10.6% reported having had a previous low birth weight baby.
Figure 9. Prevalence of previous low birth weight and preterm births among multiparous women, 2007/2008 MA PRAMS
< 2500grams < 37 weeks
10.3 10.6
0
5
10
15
20
Previous low birth weight (among multipars) Previous preterm birth (among multipars)
Percent
PREGNANCY
35
Did not use WIC,
62.1%
Used WIC, 37.9%
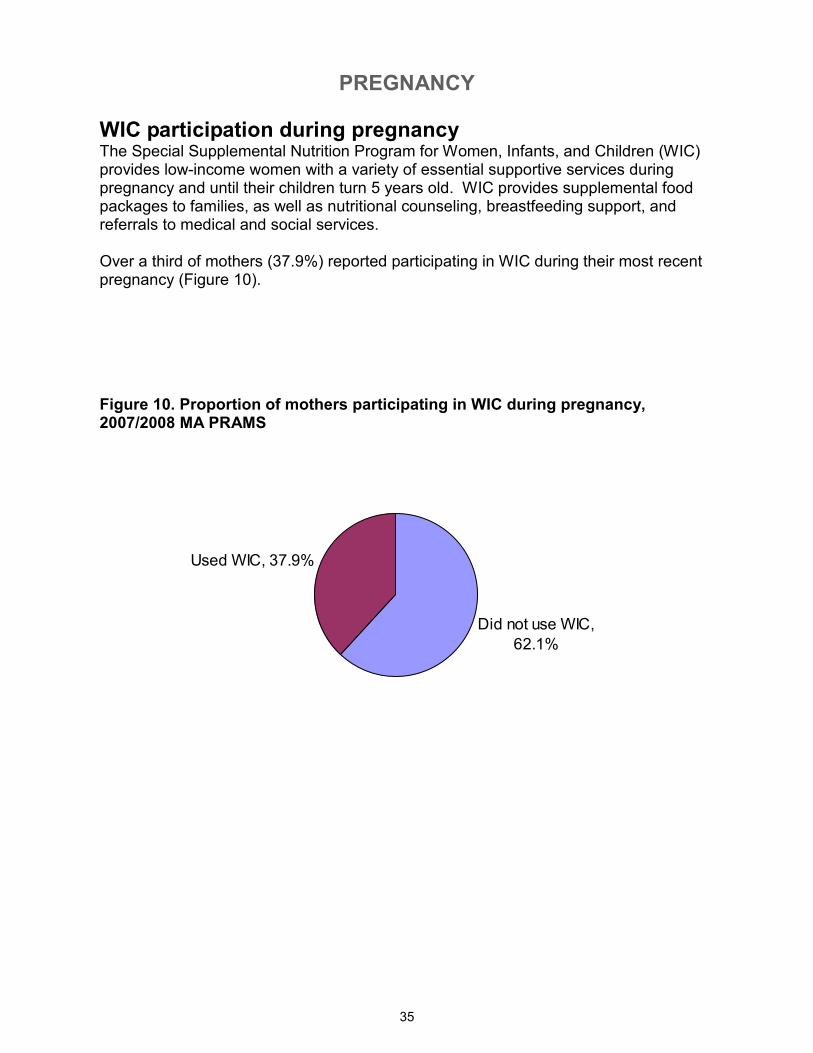
WIC participation during pregnancy The Special Supplemental Nutrition Program for Women, Infants, and Children (WIC) provides low-income women with a variety of essential supportive services during pregnancy and until their children turn 5 years old. WIC provides supplemental food packages to families, as well as nutritional counseling, breastfeeding support, and referrals to medical and social services. Over a third of mothers (37.9%) reported participating in WIC during their most recent pregnancy (Figure 10).
Figure 10. Proportion of mothers participating in WIC during pregnancy, 2007/2008 MA PRAMS
PREGNANCY
36
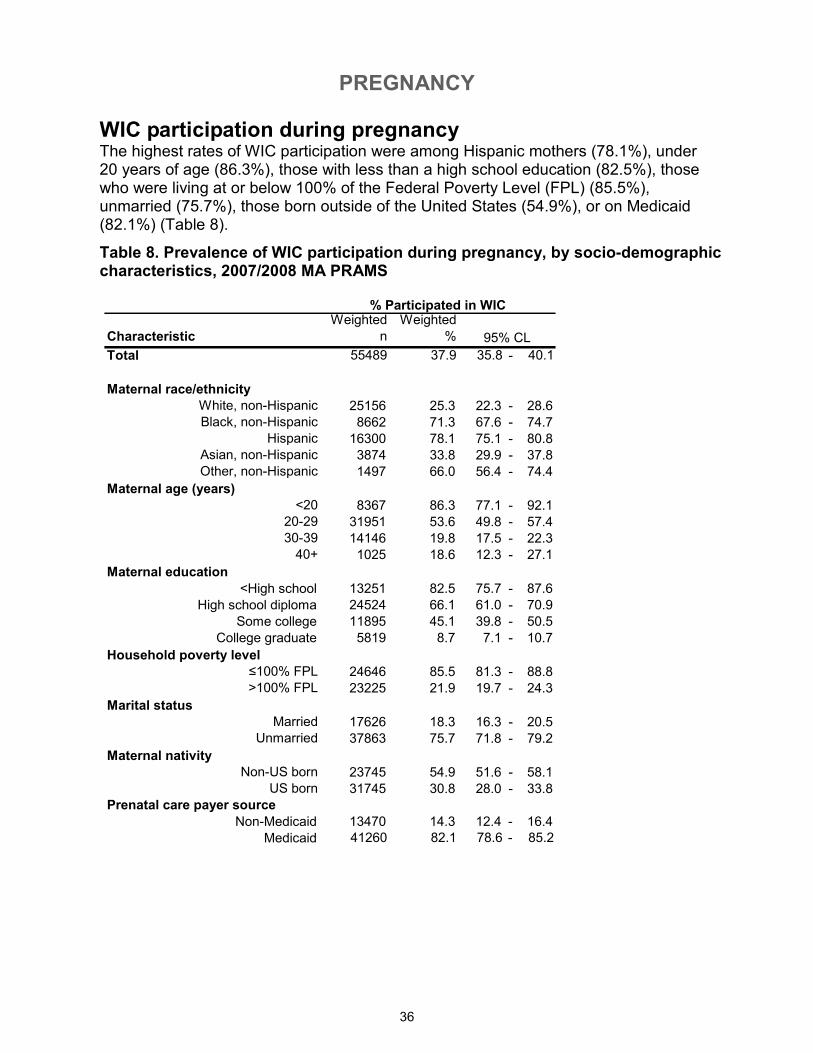
WIC participation during pregnancy The highest rates of WIC participation were among Hispanic mothers (78.1%), under 20 years of age (86.3%), those with less than a high school education (82.5%), those who were living at or below 100% of the Federal Poverty Level (FPL) (85.5%), unmarried (75.7%), those born outside of the United States (54.9%), or on Medicaid (82.1%) (Table 8).
Table 8. Prevalence of WIC participation during pregnancy, by socio-demographic characteristics, 2007/2008 MA PRAMS
Characteristic
Weighted
n
Weighted
%
Total 55489 37.9 35.8 - 40.1
Maternal race/ethnicity
White, non-Hispanic 25156 25.3 22.3 - 28.6Black, non-Hispanic 8662 71.3 67.6 - 74.7
Hispanic 16300 78.1 75.1 - 80.8Asian, non-Hispanic 3874 33.8 29.9 - 37.8Other, non-Hispanic 1497 66.0 56.4 - 74.4
Maternal age (years)
<20 8367 86.3 77.1 - 92.120-29 31951 53.6 49.8 - 57.430-39 14146 19.8 17.5 - 22.340+ 1025 18.6 12.3 - 27.1
Maternal education
<High school 13251 82.5 75.7 - 87.6
High school diploma 24524 66.1 61.0 - 70.9
Some college 11895 45.1 39.8 - 50.5
College graduate 5819 8.7 7.1 - 10.7
Household poverty level
≤100% FPL 24646 85.5 81.3 - 88.8>100% FPL 23225 21.9 19.7 - 24.3
Marital status
Married 17626 18.3 16.3 - 20.5Unmarried 37863 75.7 71.8 - 79.2
Maternal nativity
Non-US born 23745 54.9 51.6 - 58.1US born 31745 30.8 28.0 - 33.8
Prenatal care payer source
Non-Medicaid 13470 14.3 12.4 - 16.4
Medicaid 41260 82.1 78.6 - 85.2
% Participated in WIC
95% CL
PREGNANCY
37
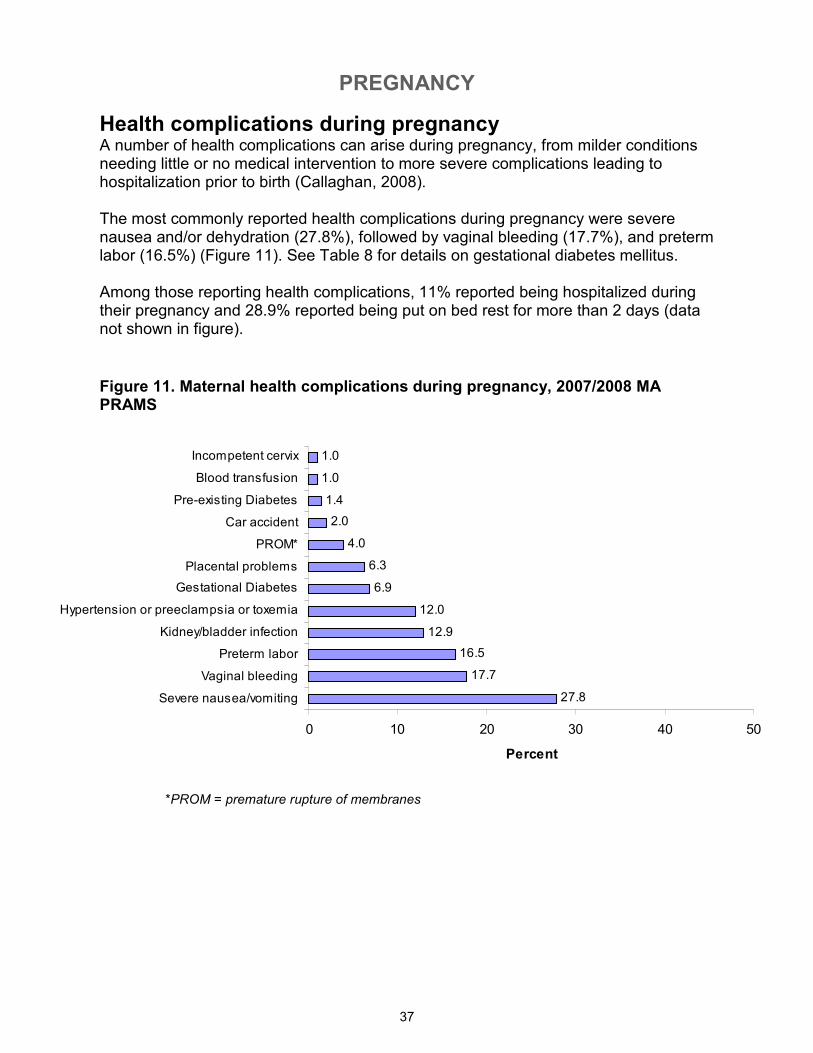
Health complications during pregnancy A number of health complications can arise during pregnancy, from milder conditions needing little or no medical intervention to more severe complications leading to hospitalization prior to birth (Callaghan, 2008). The most commonly reported health complications during pregnancy were severe nausea and/or dehydration (27.8%), followed by vaginal bleeding (17.7%), and preterm labor (16.5%) (Figure 11). See Table 8 for details on gestational diabetes mellitus. Among those reporting health complications, 11% reported being hospitalized during their pregnancy and 28.9% reported being put on bed rest for more than 2 days (data not shown in figure).
Figure 11. Maternal health complications during pregnancy, 2007/2008 MA PRAMS
*PROM = premature rupture of membranes
27.8
17.7
16.5
12.9
12.0
6.9
6.3
4.0
2.0
1.4
1.0
1.0
0 10 20 30 40 50
Severe nausea/vomiting
Vaginal bleeding
Preterm labor
Kidney/bladder infection
Hypertension or preeclampsia or toxemia
Gestational Diabetes
Placental problems
PROM*
Car accident
Pre-existing Diabetes
Blood transfusion
Incompetent cervix
Percent
PREGNANCY
38
Characteristic
Weighted
n
Weighted
%
Total 9982 6.9 5.8 - 8.2
Maternal race/ethnicity
White, non-Hispanic 6217 6.3 4.8 - 8.2
Black, non-Hispanic 930 7.7 5.8 - 10.1
Hispanic 1351 6.6 5.1 - 8.6
Asian, non-Hispanic 1268 11.2 8.9 - 13.9
Other, non-Hispanic 216 9.9 5.4 - 17.4
Maternal age (years)
<20 520 5.5 2.2 - 12.9
20-29 3052 5.2 3.8 - 7.0
30-39 5709 8.1 6.4 - 10.1
40+ 701 12.8 6.8 - 22.9
Maternal education
<High school 1078 6.7 3.8 - 11.5
High school diploma 1474 4.0 2.6 - 6.3
Some college 2140 8.1 5.6 - 11.6
College graduate 5290 8.0 6.3 - 10.2
Household poverty level
≤100% FPL 1187 4.3 3.0 - 6.1
>100% FPL 7522 7.1 5.8 - 8.7
Maternal nativity
Non-US-born 4292 10.1 8.2 - 12.4
US-born 5690 5.6 4.3 - 7.2
Body Mass Index (BMI)
Normal or underweight 4235 5.0 3.8 - 6.5
Overweight 3004 10.0 7.2 - 13.7
Obese 2487 10.7 7.5 - 15.0
Gestational Diabetes
95% CL
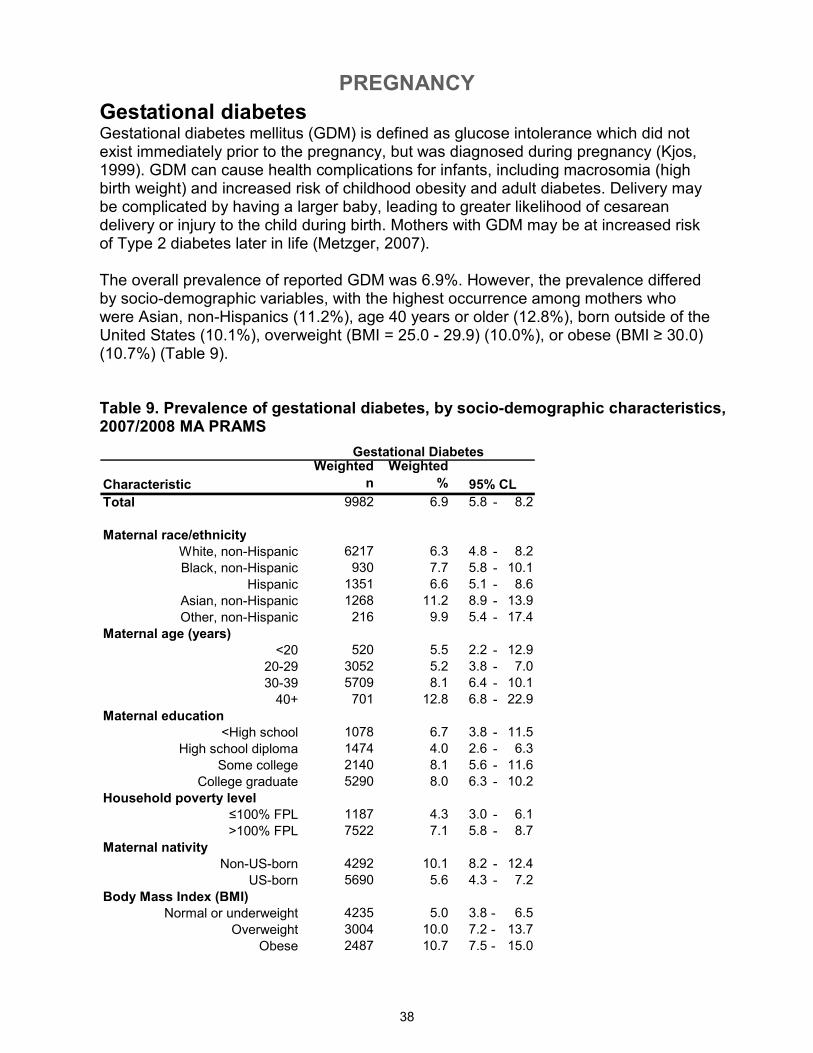
Gestational diabetes Gestational diabetes mellitus (GDM) is defined as glucose intolerance which did not exist immediately prior to the pregnancy, but was diagnosed during pregnancy (Kjos, 1999). GDM can cause health complications for infants, including macrosomia (high birth weight) and increased risk of childhood obesity and adult diabetes. Delivery may be complicated by having a larger baby, leading to greater likelihood of cesarean delivery or injury to the child during birth. Mothers with GDM may be at increased risk of Type 2 diabetes later in life (Metzger, 2007). The overall prevalence of reported GDM was 6.9%. However, the prevalence differed by socio-demographic variables, with the highest occurrence among mothers who were Asian, non-Hispanics (11.2%), age 40 years or older (12.8%), born outside of the United States (10.1%), overweight (BMI = 25.0 - 29.9) (10.0%), or obese (BMI ≥ 30.0) (10.7%) (Table 9).
Table 9. Prevalence of gestational diabetes, by socio-demographic characteristics, 2007/2008 MA PRAMS
PREGNANCY
39
1 to 2 servings/day,
41.2%3 to 4 servings/day,
39.4%
< 1 servings/day,
6.3%5+ servings/day,
13.1%
34.2
50.1
15.7
50.6
37.2
6.4 5.8
0
10
20
30
40
50
60
<1 days/wk 1 to 4
days/wk
5+ days/wk <1 days/wk 1 to 4
days/wk
5+ days/wk Told not to
exercise
Percent
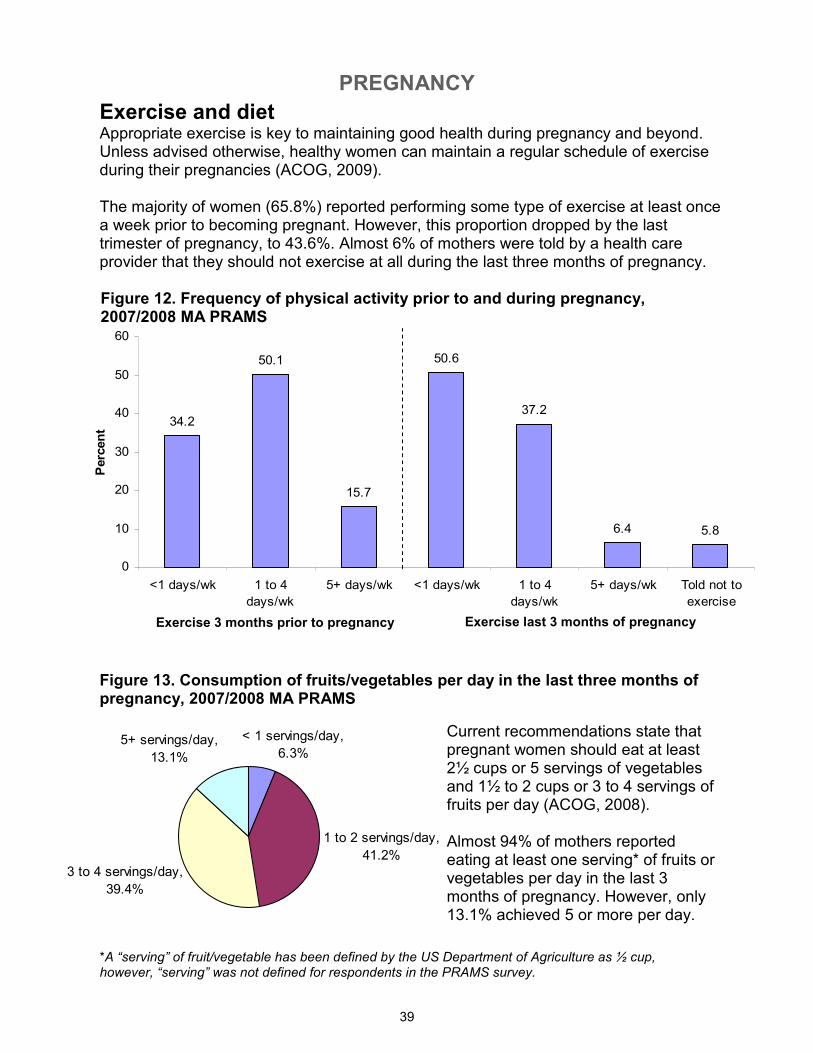
Exercise and diet Appropriate exercise is key to maintaining good health during pregnancy and beyond. Unless advised otherwise, healthy women can maintain a regular schedule of exercise during their pregnancies (ACOG, 2009). The majority of women (65.8%) reported performing some type of exercise at least once a week prior to becoming pregnant. However, this proportion dropped by the last trimester of pregnancy, to 43.6%. Almost 6% of mothers were told by a health care provider that they should not exercise at all during the last three months of pregnancy.
Figure 12. Frequency of physical activity prior to and during pregnancy, 2007/2008 MA PRAMS
Figure 13. Consumption of fruits/vegetables per day in the last three months of pregnancy, 2007/2008 MA PRAMS
Current recommendations state that pregnant women should eat at least 2½ cups or 5 servings of vegetables and 1½ to 2 cups or 3 to 4 servings of fruits per day (ACOG, 2008). Almost 94% of mothers reported eating at least one serving* of fruits or vegetables per day in the last 3 months of pregnancy. However, only 13.1% achieved 5 or more per day.
Exercise 3 months prior to pregnancy Exercise last 3 months of pregnancy
*A “serving” of fruit/vegetable has been defined by the US Department of Agriculture as ½ cup, however, “serving” was not defined for respondents in the PRAMS survey.
PREGNANCY
40
16.1
21.7
3.2
8.5
9.9
20.0
32.8
2.1
2.9
6.6
7.7
11.4
22.5
0 10 20 30 40
Someone close died
Family member sick
Homeless
Mother lost job
Partner lost job
Had bills couldn't pay
Moved to new address
In a physical fight
Partner went to jail
Separation/divorce
Partner said didn't want pregnancy
Someone close had problem with drinking/drugs
Argued with partner more than usual
Percent
33.8
46.5
28.1
0
10
20
30
40
50
At least 1 family-related
stressor
At least 1 f inancial stressor At least 1 illness/death-related
stressor
Stressor type
Percent
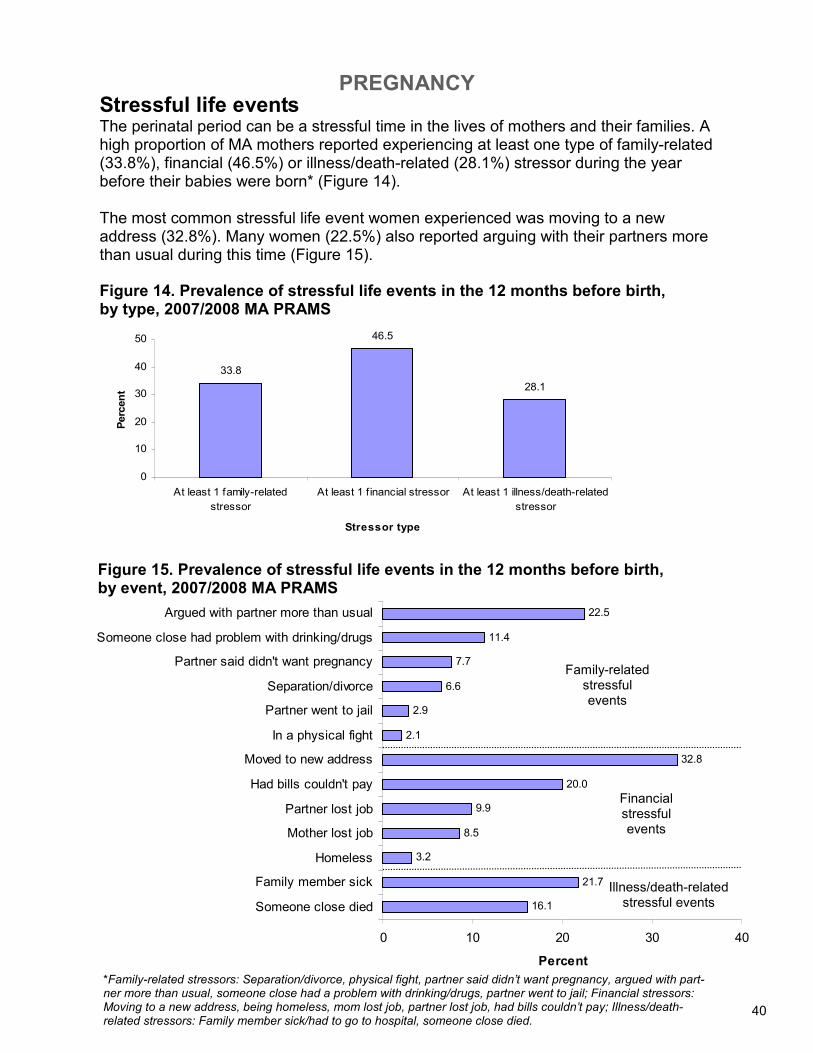
Stressful life events The perinatal period can be a stressful time in the lives of mothers and their families. A high proportion of MA mothers reported experiencing at least one type of family-related (33.8%), financial (46.5%) or illness/death-related (28.1%) stressor during the year before their babies were born* (Figure 14). The most common stressful life event women experienced was moving to a new address (32.8%). Many women (22.5%) also reported arguing with their partners more than usual during this time (Figure 15).
*Family-related stressors: Separation/divorce, physical fight, partner said didn’t want pregnancy, argued with part-ner more than usual, someone close had a problem with drinking/drugs, partner went to jail; Financial stressors: Moving to a new address, being homeless, mom lost job, partner lost job, had bills couldn’t pay; Illness/death-related stressors: Family member sick/had to go to hospital, someone close died.
Figure 14. Prevalence of stressful life events in the 12 months before birth, by type, 2007/2008 MA PRAMS
Figure 15. Prevalence of stressful life events in the 12 months before birth, by event, 2007/2008 MA PRAMS
40
Family-related stressful events
Financial stressful events
Illness/death-related stressful events
PREGNANCY
41
3.3
2.6
4.3
0
1
2
3
4
5
6
7
8
9
10
Physical abuse before pregnancy Physical abuse during pregnancy Physical abuse (before or during
pregnancy)
Percent
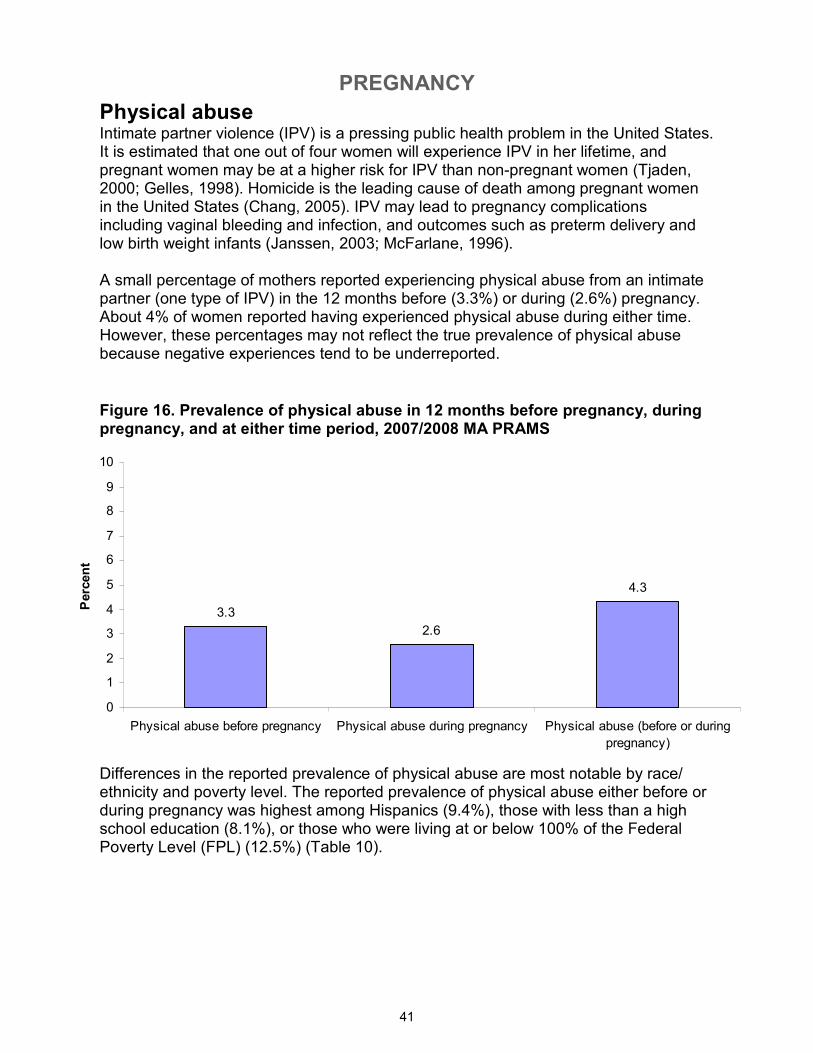
Physical abuse Intimate partner violence (IPV) is a pressing public health problem in the United States. It is estimated that one out of four women will experience IPV in her lifetime, and pregnant women may be at a higher risk for IPV than non-pregnant women (Tjaden, 2000; Gelles, 1998). Homicide is the leading cause of death among pregnant women in the United States (Chang, 2005). IPV may lead to pregnancy complications including vaginal bleeding and infection, and outcomes such as preterm delivery and low birth weight infants (Janssen, 2003; McFarlane, 1996). A small percentage of mothers reported experiencing physical abuse from an intimate partner (one type of IPV) in the 12 months before (3.3%) or during (2.6%) pregnancy. About 4% of women reported having experienced physical abuse during either time. However, these percentages may not reflect the true prevalence of physical abuse because negative experiences tend to be underreported.
Figure 16. Prevalence of physical abuse in 12 months before pregnancy, during pregnancy, and at either time period, 2007/2008 MA PRAMS
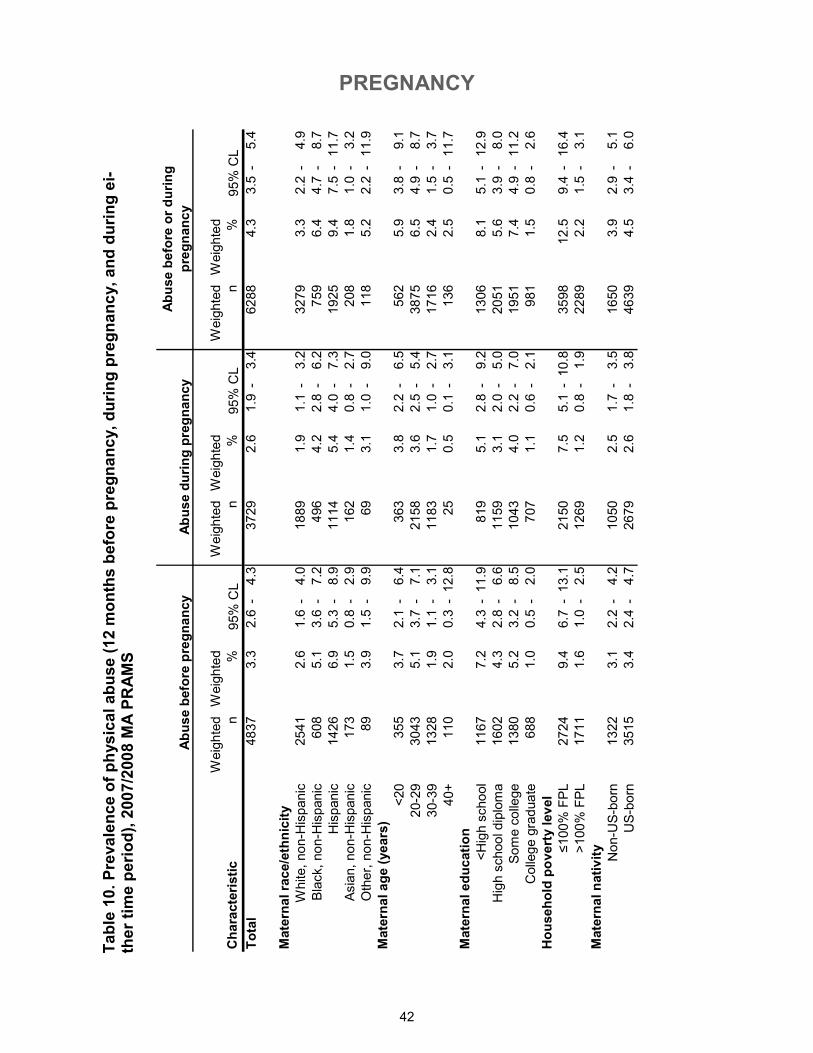
Differences in the reported prevalence of physical abuse are most notable by race/ethnicity and poverty level. The reported prevalence of physical abuse either before or during pregnancy was highest among Hispanics (9.4%), those with less than a high school education (8.1%), or those who were living at or below 100% of the Federal Poverty Level (FPL) (12.5%) (Table 10).
PREGNANCY
42
Characteristic
Weighted
n
Weighted
%
Weighted
n
Weighted
%
Weighted
n
Weighted
%
Total
4837
3.3
2.6
-4.3
3729
2.6
1.9
-3.4
6288
4.3
3.5
-5.4
Maternal race/ethnicity
White, non-Hispanic
2541
2.6
1.6
-4.0
1889
1.9
1.1
-3.2
3279
3.3
2.2
-4.9
Black, non-Hispanic
608
5.1
3.6
-7.2
496
4.2
2.8
-6.2
759
6.4
4.7
-8.7
Hispanic
1426
6.9
5.3
-8.9
1114
5.4
4.0
-7.3
1925
9.4
7.5
-11.7
Asian, non-Hispanic
173
1.5
0.8
-2.9
162
1.4
0.8
-2.7
208
1.8
1.0
-3.2
Other, non-Hispanic
89
3.9
1.5
-9.9
69
3.1
1.0
-9.0
118
5.2
2.2
-11.9
Maternal age (years)
<20
355
3.7
2.1
-6.4
363
3.8
2.2
-6.5
562
5.9
3.8
-9.1
20-29
3043
5.1
3.7
-7.1
2158
3.6
2.5
-5.4
3875
6.5
4.9
-8.7
30-39
1328
1.9
1.1
-3.1
1183
1.7
1.0
-2.7
1716
2.4
1.5
-3.7
40+
110
2.0
0.3
-12.8
25
0.5
0.1
-3.1
136
2.5
0.5
-11.7
Maternal education
<High school
1167
7.2
4.3
-11.9
819
5.1
2.8
-9.2
1306
8.1
5.1
-12.9
High school diploma
1602
4.3
2.8
-6.6
1159
3.1
2.0
-5.0
2051
5.6
3.9
-8.0
Some college
1380
5.2
3.2
-8.5
1043
4.0
2.2
-7.0
1951
7.4
4.9
-11.2
College graduate
688
1.0
0.5
-2.0
707
1.1
0.6
-2.1
981
1.5
0.8
-2.6
Household poverty level
≤100% FPL
2724
9.4
6.7
-13.1
2150
7.5
5.1
-10.8
3598
12.5
9.4
-16.4
>100% FPL
1711
1.6
1.0
-2.5
1269
1.2
0.8
-1.9
2289
2.2
1.5
-3.1
Maternal nativity
Non-US-born
1322
3.1
2.2
-4.2
1050
2.5
1.7
-3.5
1650
3.9
2.9
-5.1
US-born
3515
3.4
2.4
-4.7
2679
2.6
1.8
-3.8
4639
4.5
3.4
-6.0
Abuse before pregnancy
Abuse during pregnancy
Abuse before or during
pregnancy
95% CL
95% CL
95% CL
Table 10. Prevalence of physical abuse (12 months before pregnancy, during pregnancy, and during ei-
ther time period), 2007/2008 MA PRAMS
PREGNANCY
43
Initiated
within 1st
trimester,
Did not
have PNC,
0.9%
Did not
initiate
within 1st
trimester,
13.3%
13+ weeks, 4.1%
9 to 12 weeks,
7.3%
5 to 8 weeks,
38.5%
0 to 4 weeks,
50.2%
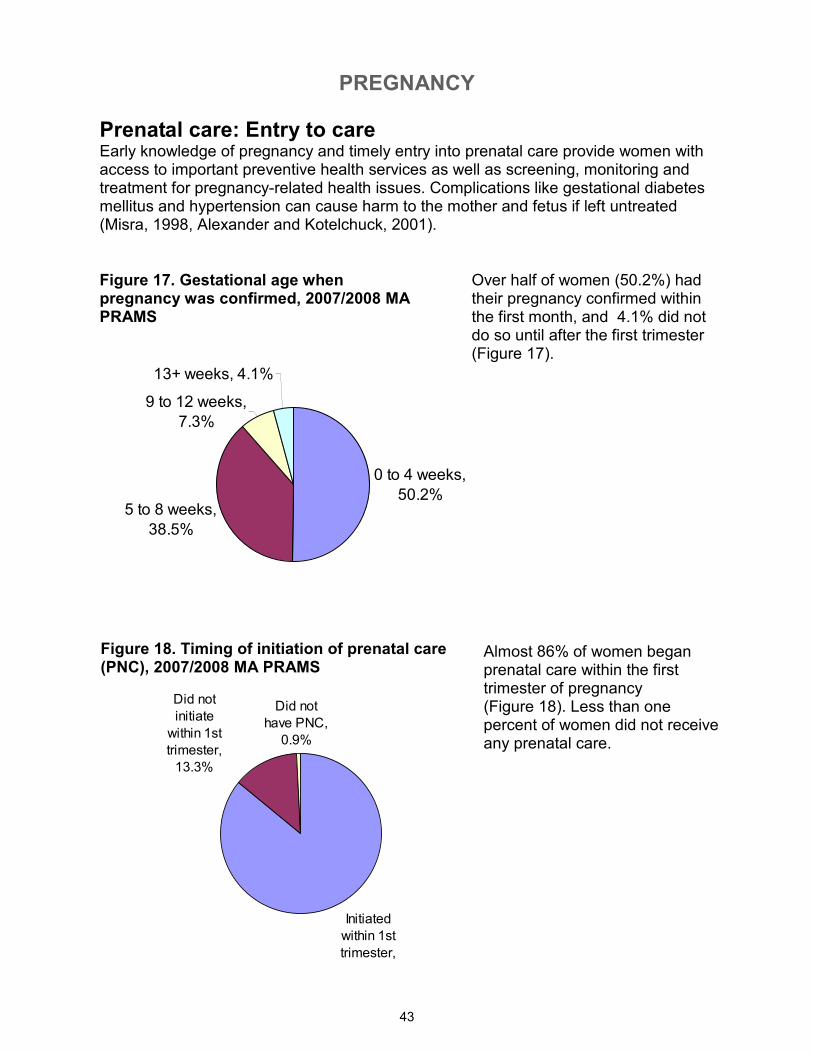
Prenatal care: Entry to care Early knowledge of pregnancy and timely entry into prenatal care provide women with access to important preventive health services as well as screening, monitoring and treatment for pregnancy-related health issues. Complications like gestational diabetes mellitus and hypertension can cause harm to the mother and fetus if left untreated (Misra, 1998, Alexander and Kotelchuck, 2001).
Figure 17. Gestational age when pregnancy was confirmed, 2007/2008 MA PRAMS
Over half of women (50.2%) had their pregnancy confirmed within the first month, and 4.1% did not do so until after the first trimester (Figure 17).
Figure 18. Timing of initiation of prenatal care (PNC), 2007/2008 MA PRAMS
Almost 86% of women began prenatal care within the first trimester of pregnancy (Figure 18). Less than one percent of women did not receive any prenatal care.
PREGNANCY
44
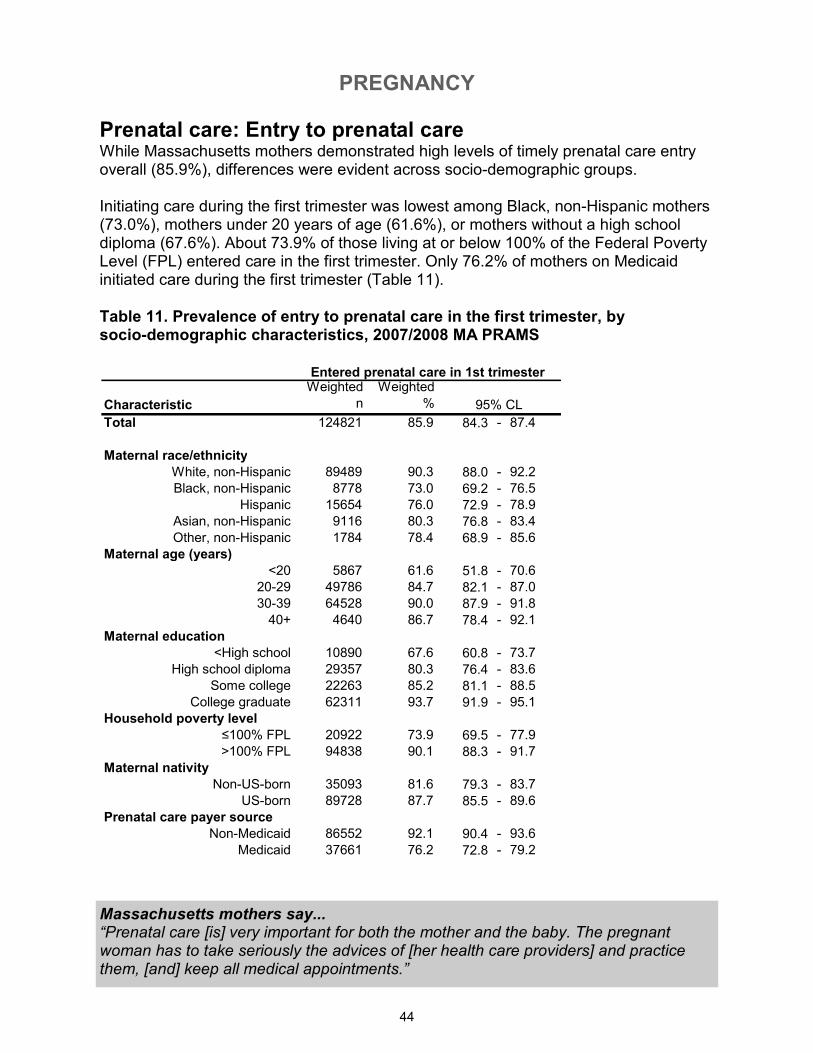
Prenatal care: Entry to prenatal care While Massachusetts mothers demonstrated high levels of timely prenatal care entry overall (85.9%), differences were evident across socio-demographic groups. Initiating care during the first trimester was lowest among Black, non-Hispanic mothers (73.0%), mothers under 20 years of age (61.6%), or mothers without a high school diploma (67.6%). About 73.9% of those living at or below 100% of the Federal Poverty Level (FPL) entered care in the first trimester. Only 76.2% of mothers on Medicaid initiated care during the first trimester (Table 11).
Table 11. Prevalence of entry to prenatal care in the first trimester, by socio-demographic characteristics, 2007/2008 MA PRAMS
Massachusetts mothers say... “Prenatal care [is] very important for both the mother and the baby. The pregnant woman has to take seriously the advices of [her health care providers] and practice them, [and] keep all medical appointments.”
Characteristic
Weighted
n
Weighted
%
Total 124821 85.9 84.3 - 87.4
Maternal race/ethnicity
White, non-Hispanic 89489 90.3 88.0 - 92.2
Black, non-Hispanic 8778 73.0 69.2 - 76.5
Hispanic 15654 76.0 72.9 - 78.9
Asian, non-Hispanic 9116 80.3 76.8 - 83.4
Other, non-Hispanic 1784 78.4 68.9 - 85.6
Maternal age (years)
<20 5867 61.6 51.8 - 70.6
20-29 49786 84.7 82.1 - 87.0
30-39 64528 90.0 87.9 - 91.8
40+ 4640 86.7 78.4 - 92.1
Maternal education
<High school 10890 67.6 60.8 - 73.7
High school diploma 29357 80.3 76.4 - 83.6
Some college 22263 85.2 81.1 - 88.5
College graduate 62311 93.7 91.9 - 95.1
Household poverty level
≤100% FPL 20922 73.9 69.5 - 77.9
>100% FPL 94838 90.1 88.3 - 91.7
Maternal nativity
Non-US-born 35093 81.6 79.3 - 83.7
US-born 89728 87.7 85.5 - 89.6
Prenatal care payer source
Non-Medicaid 86552 92.1 90.4 - 93.6
Medicaid 37661 76.2 72.8 - 79.2
Entered prenatal care in 1st trimester
95% CL
PREGNANCY
45
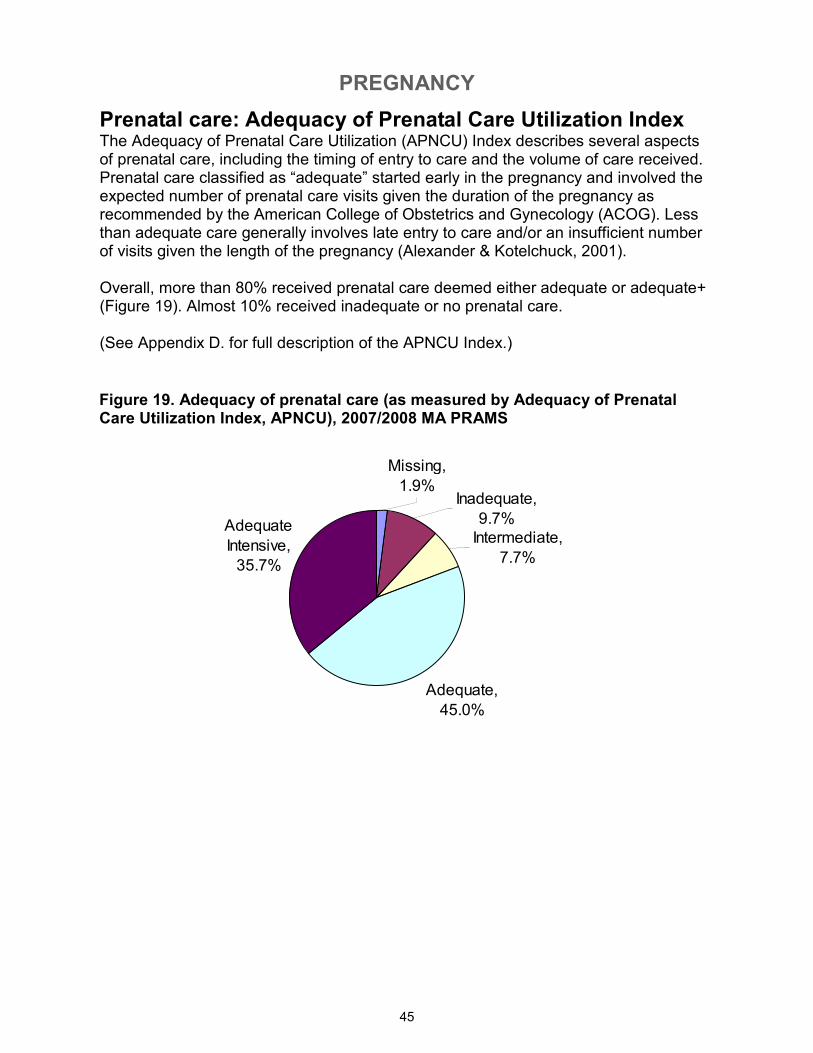
Figure 19. Adequacy of prenatal care (as measured by Adequacy of Prenatal Care Utilization Index, APNCU), 2007/2008 MA PRAMS
Prenatal care: Adequacy of Prenatal Care Utilization Index The Adequacy of Prenatal Care Utilization (APNCU) Index describes several aspects of prenatal care, including the timing of entry to care and the volume of care received. Prenatal care classified as “adequate” started early in the pregnancy and involved the expected number of prenatal care visits given the duration of the pregnancy as recommended by the American College of Obstetrics and Gynecology (ACOG). Less than adequate care generally involves late entry to care and/or an insufficient number of visits given the length of the pregnancy (Alexander & Kotelchuck, 2001). Overall, more than 80% received prenatal care deemed either adequate or adequate+ (Figure 19). Almost 10% received inadequate or no prenatal care. (See Appendix D. for full description of the APNCU Index.)
Adequate,
45.0%
Adequate
Intensive,
35.7%
Intermediate,
7.7%
Missing,
1.9%Inadequate,
9.7%
PREGNANCY
46
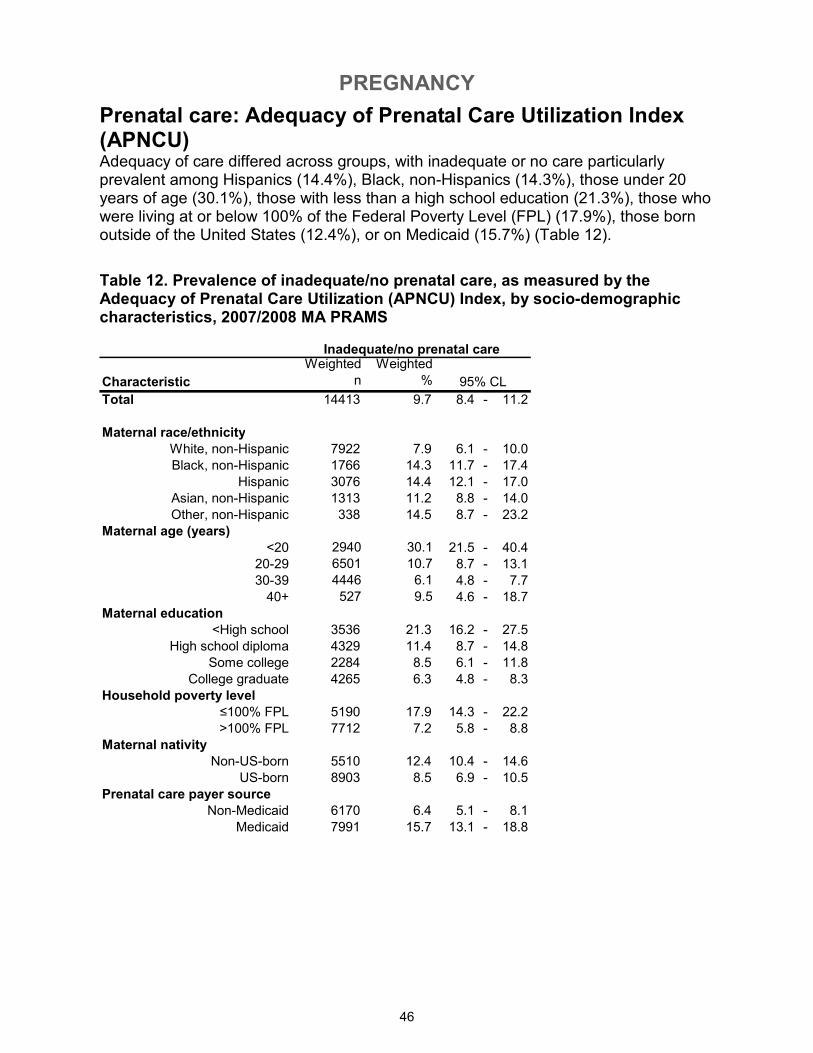
Prenatal care: Adequacy of Prenatal Care Utilization Index (APNCU) Adequacy of care differed across groups, with inadequate or no care particularly prevalent among Hispanics (14.4%), Black, non-Hispanics (14.3%), those under 20 years of age (30.1%), those with less than a high school education (21.3%), those who were living at or below 100% of the Federal Poverty Level (FPL) (17.9%), those born outside of the United States (12.4%), or on Medicaid (15.7%) (Table 12).
Table 12. Prevalence of inadequate/no prenatal care, as measured by the Adequacy of Prenatal Care Utilization (APNCU) Index, by socio-demographic characteristics, 2007/2008 MA PRAMS
Characteristic
Weighted
n
Weighted
%
Total 14413 9.7 8.4 - 11.2
Maternal race/ethnicity
White, non-Hispanic 7922 7.9 6.1 - 10.0
Black, non-Hispanic 1766 14.3 11.7 - 17.4
Hispanic 3076 14.4 12.1 - 17.0
Asian, non-Hispanic 1313 11.2 8.8 - 14.0
Other, non-Hispanic 338 14.5 8.7 - 23.2
Maternal age (years)
<20 2940 30.1 21.5 - 40.4
20-29 6501 10.7 8.7 - 13.1
30-39 4446 6.1 4.8 - 7.7
40+ 527 9.5 4.6 - 18.7
Maternal education
<High school 3536 21.3 16.2 - 27.5
High school diploma 4329 11.4 8.7 - 14.8
Some college 2284 8.5 6.1 - 11.8
College graduate 4265 6.3 4.8 - 8.3
Household poverty level
≤100% FPL 5190 17.9 14.3 - 22.2
>100% FPL 7712 7.2 5.8 - 8.8
Maternal nativity
Non-US-born 5510 12.4 10.4 - 14.6
US-born 8903 8.5 6.9 - 10.5
Prenatal care payer source
Non-Medicaid 6170 6.4 5.1 - 8.1
Medicaid 7991 15.7 13.1 - 18.8
Inadequate/no prenatal care
95% CL
PREGNANCY
47
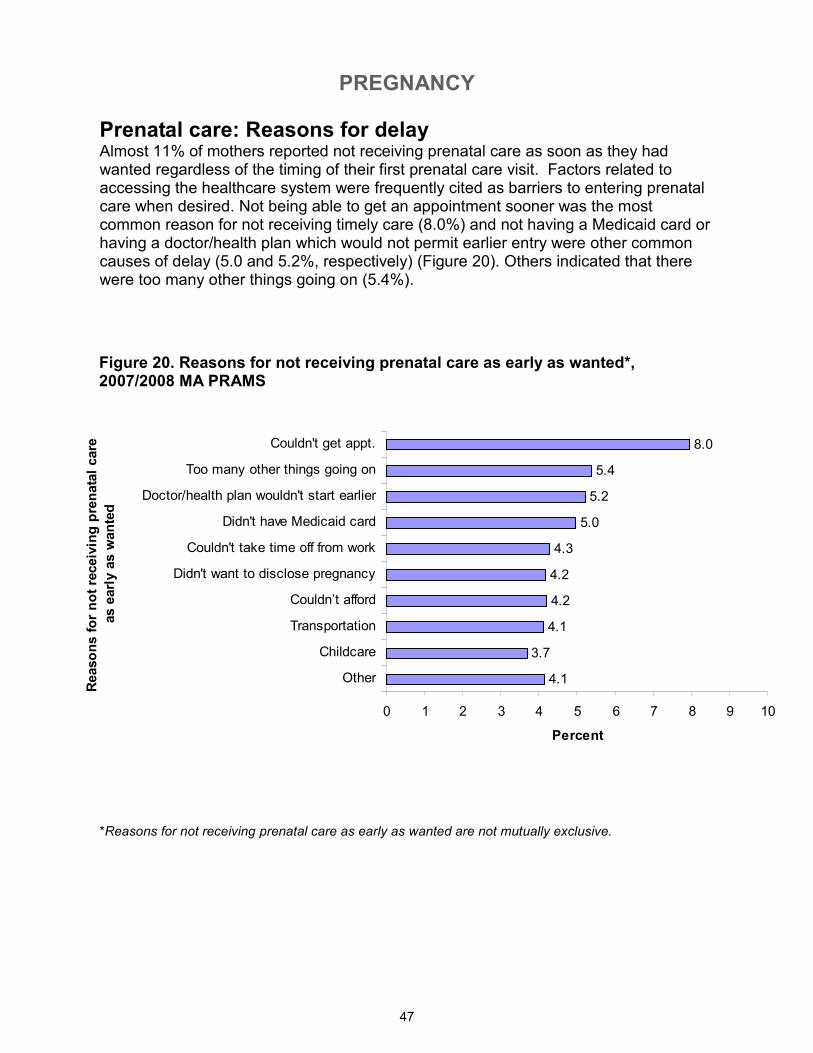
Prenatal care: Reasons for delay Almost 11% of mothers reported not receiving prenatal care as soon as they had wanted regardless of the timing of their first prenatal care visit. Factors related to accessing the healthcare system were frequently cited as barriers to entering prenatal care when desired. Not being able to get an appointment sooner was the most common reason for not receiving timely care (8.0%) and not having a Medicaid card or having a doctor/health plan which would not permit earlier entry were other common causes of delay (5.0 and 5.2%, respectively) (Figure 20). Others indicated that there were too many other things going on (5.4%).
Figure 20. Reasons for not receiving prenatal care as early as wanted*, 2007/2008 MA PRAMS
*Reasons for not receiving prenatal care as early as wanted are not mutually exclusive.
4.1
3.7
4.1
4.2
4.2
4.3
5.0
5.2
5.4
8.0
0 1 2 3 4 5 6 7 8 9 10
Other
Childcare
Transportation
Couldn’t afford
Didn't want to disclose pregnancy
Couldn't take time off from work
Didn't have Medicaid card
Doctor/health plan wouldn't start earlier
Too many other things going on
Couldn't get appt.
Reasons for not receiving prenatal care
as early as wanted
Percent
PREGNANCY
48
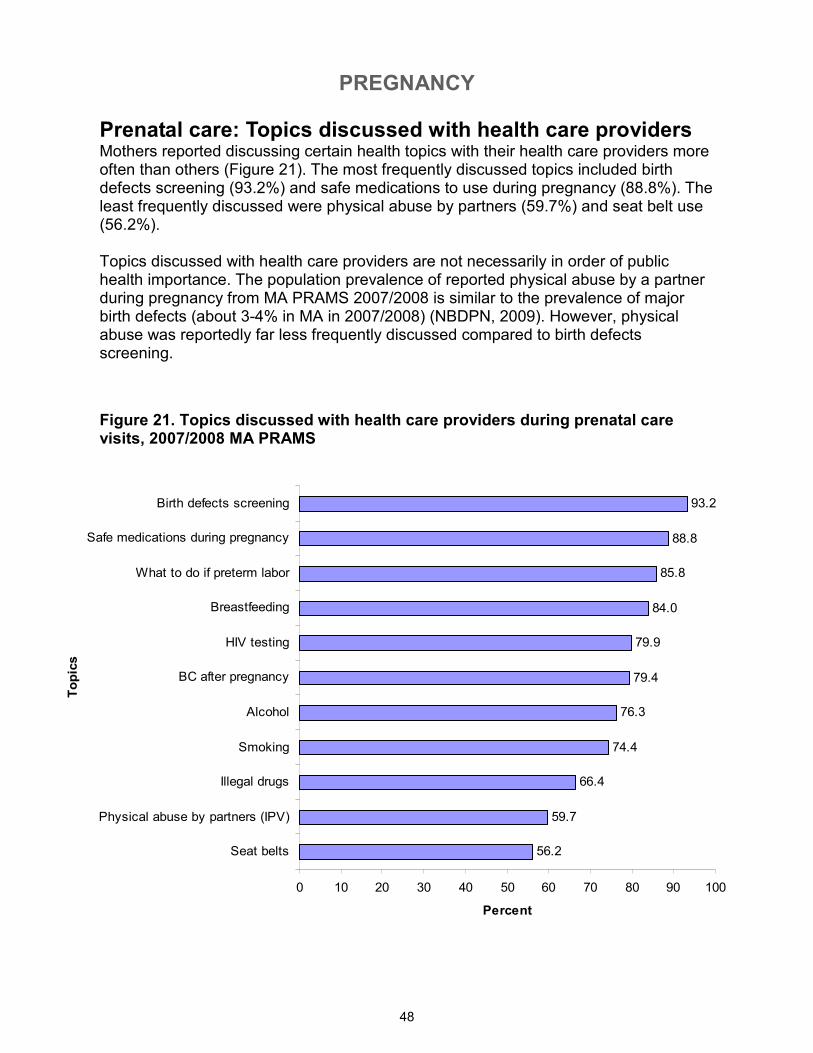
Prenatal care: Topics discussed with health care providers Mothers reported discussing certain health topics with their health care providers more often than others (Figure 21). The most frequently discussed topics included birth defects screening (93.2%) and safe medications to use during pregnancy (88.8%). The least frequently discussed were physical abuse by partners (59.7%) and seat belt use (56.2%). Topics discussed with health care providers are not necessarily in order of public health importance. The population prevalence of reported physical abuse by a partner during pregnancy from MA PRAMS 2007/2008 is similar to the prevalence of major birth defects (about 3-4% in MA in 2007/2008) (NBDPN, 2009). However, physical abuse was reportedly far less frequently discussed compared to birth defects screening.
Figure 21. Topics discussed with health care providers during prenatal care visits, 2007/2008 MA PRAMS
56.2
59.7
66.4
74.4
76.3
79.4
79.9
84.0
85.8
88.8
93.2
0 10 20 30 40 50 60 70 80 90 100
Seat belts
Physical abuse by partners (IPV)
Illegal drugs
Smoking
Alcohol
BC after pregnancy
HIV testing
Breastfeeding
What to do if preterm labor
Safe medications during pregnancy
Birth defects screening
Topics
Percent
PREGNANCY
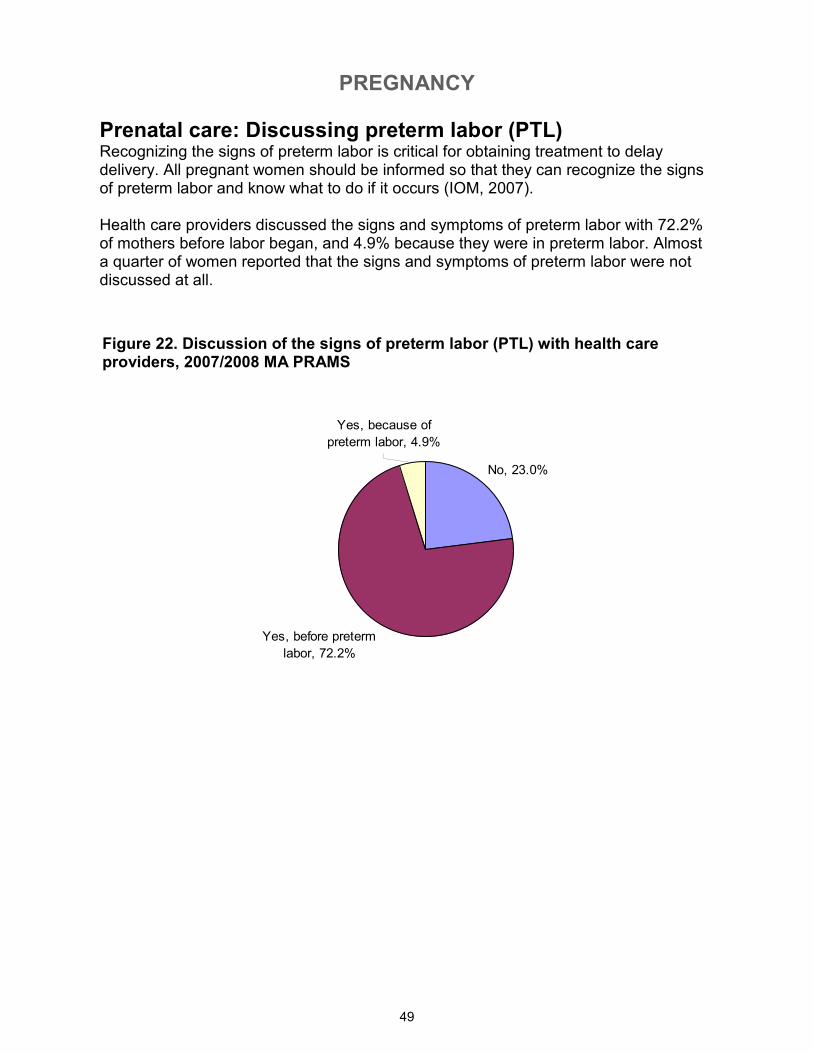
49
Prenatal care: Discussing preterm labor (PTL) Recognizing the signs of preterm labor is critical for obtaining treatment to delay delivery. All pregnant women should be informed so that they can recognize the signs of preterm labor and know what to do if it occurs (IOM, 2007). Health care providers discussed the signs and symptoms of preterm labor with 72.2% of mothers before labor began, and 4.9% because they were in preterm labor. Almost a quarter of women reported that the signs and symptoms of preterm labor were not discussed at all.
Figure 22. Discussion of the signs of preterm labor (PTL) with health care providers, 2007/2008 MA PRAMS
Yes, before preterm
labor, 72.2%
No, 23.0%
Yes, because of
preterm labor, 4.9%
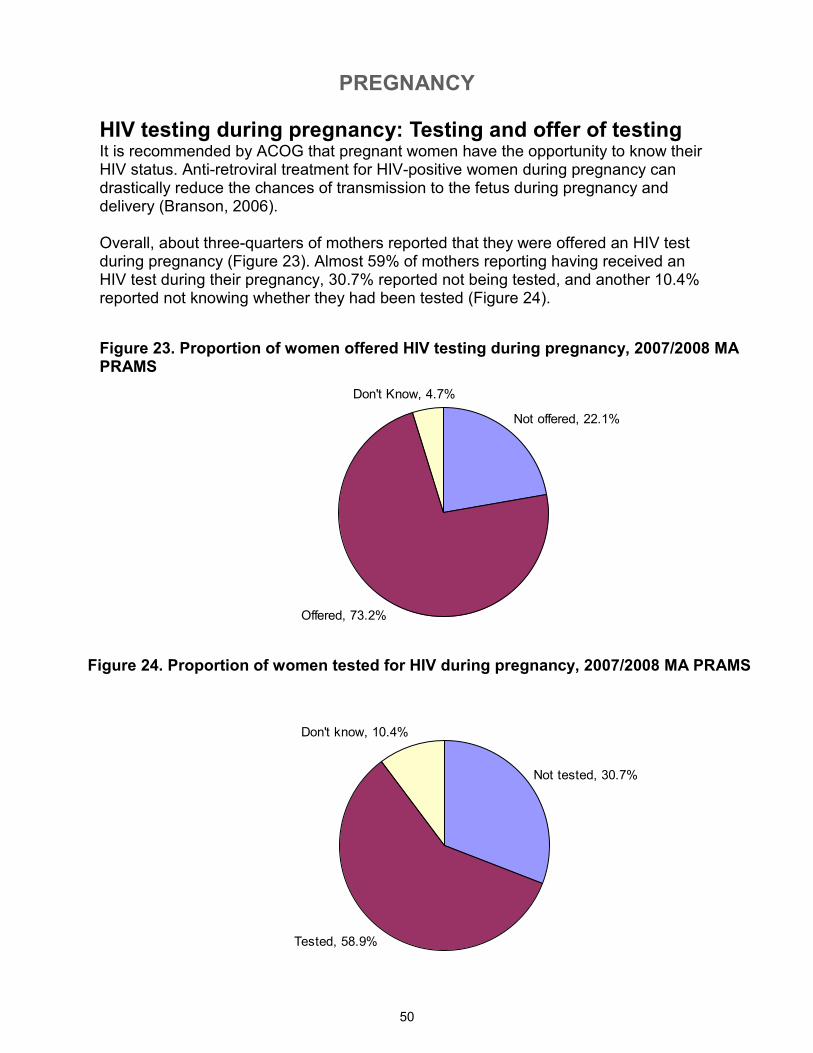
PREGNANCY
50
Figure 23. Proportion of women offered HIV testing during pregnancy, 2007/2008 MA PRAMS
HIV testing during pregnancy: Testing and offer of testing It is recommended by ACOG that pregnant women have the opportunity to know their HIV status. Anti-retroviral treatment for HIV-positive women during pregnancy can drastically reduce the chances of transmission to the fetus during pregnancy and delivery (Branson, 2006). Overall, about three-quarters of mothers reported that they were offered an HIV test during pregnancy (Figure 23). Almost 59% of mothers reporting having received an HIV test during their pregnancy, 30.7% reported not being tested, and another 10.4% reported not knowing whether they had been tested (Figure 24).
Figure 24. Proportion of women tested for HIV during pregnancy, 2007/2008 MA PRAMS
Offered, 73.2%
Not offered, 22.1%
Don't Know, 4.7%
Tested, 58.9%
Not tested, 30.7%
Don't know, 10.4%
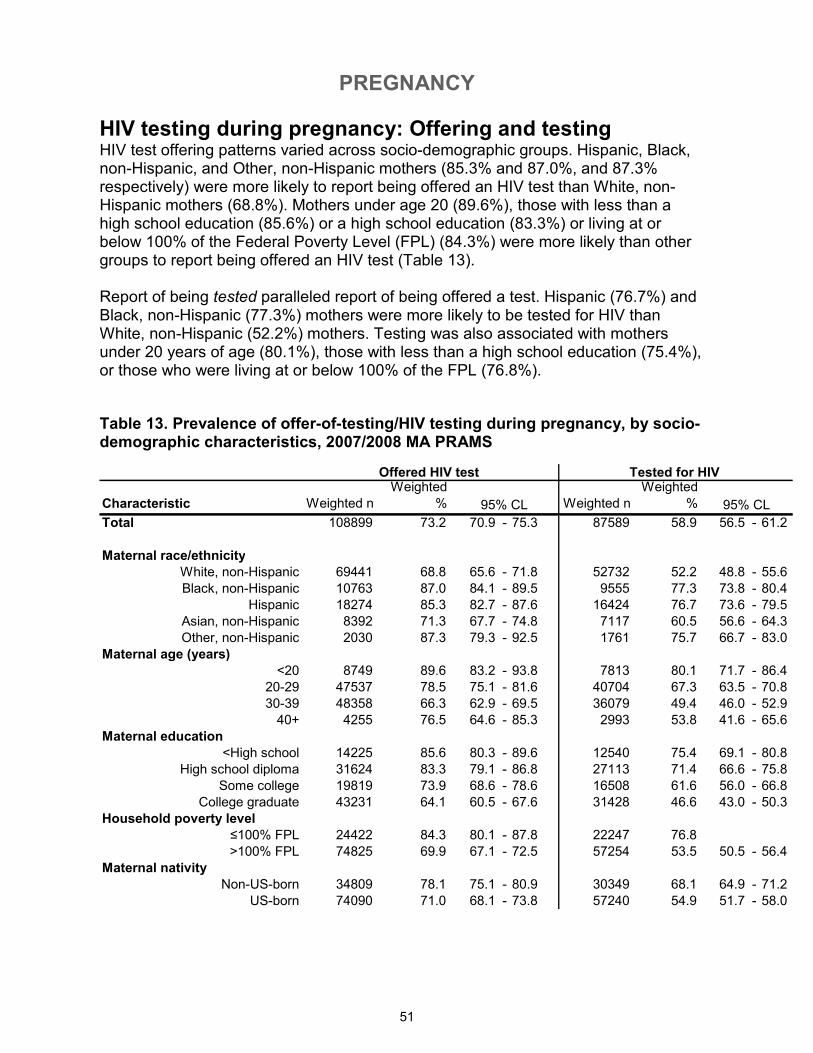
PREGNANCY
51
HIV testing during pregnancy: Offering and testing HIV test offering patterns varied across socio-demographic groups. Hispanic, Black, non-Hispanic, and Other, non-Hispanic mothers (85.3% and 87.0%, and 87.3% respectively) were more likely to report being offered an HIV test than White, non-Hispanic mothers (68.8%). Mothers under age 20 (89.6%), those with less than a high school education (85.6%) or a high school education (83.3%) or living at or below 100% of the Federal Poverty Level (FPL) (84.3%) were more likely than other groups to report being offered an HIV test (Table 13). Report of being tested paralleled report of being offered a test. Hispanic (76.7%) and Black, non-Hispanic (77.3%) mothers were more likely to be tested for HIV than White, non-Hispanic (52.2%) mothers. Testing was also associated with mothers under 20 years of age (80.1%), those with less than a high school education (75.4%), or those who were living at or below 100% of the FPL (76.8%).
Table 13. Prevalence of offer-of-testing/HIV testing during pregnancy, by socio-demographic characteristics, 2007/2008 MA PRAMS
Characteristic Weighted n
Weighted
% Weighted n
Weighted
%
Total 108899 73.2 70.9 - 75.3 87589 58.9 56.5 - 61.2
Maternal race/ethnicity
White, non-Hispanic 69441 68.8 65.6 - 71.8 52732 52.2 48.8 - 55.6
Black, non-Hispanic 10763 87.0 84.1 - 89.5 9555 77.3 73.8 - 80.4
Hispanic 18274 85.3 82.7 - 87.6 16424 76.7 73.6 - 79.5
Asian, non-Hispanic 8392 71.3 67.7 - 74.8 7117 60.5 56.6 - 64.3
Other, non-Hispanic 2030 87.3 79.3 - 92.5 1761 75.7 66.7 - 83.0
Maternal age (years)
<20 8749 89.6 83.2 - 93.8 7813 80.1 71.7 - 86.4
20-29 47537 78.5 75.1 - 81.6 40704 67.3 63.5 - 70.8
30-39 48358 66.3 62.9 - 69.5 36079 49.4 46.0 - 52.9
40+ 4255 76.5 64.6 - 85.3 2993 53.8 41.6 - 65.6
Maternal education
<High school 14225 85.6 80.3 - 89.6 12540 75.4 69.1 - 80.8
High school diploma 31624 83.3 79.1 - 86.8 27113 71.4 66.6 - 75.8
Some college 19819 73.9 68.6 - 78.6 16508 61.6 56.0 - 66.8
College graduate 43231 64.1 60.5 - 67.6 31428 46.6 43.0 - 50.3
Household poverty level
≤100% FPL 24422 84.3 80.1 - 87.8 22247 76.8
>100% FPL 74825 69.9 67.1 - 72.5 57254 53.5 50.5 - 56.4
Maternal nativity
Non-US-born 34809 78.1 75.1 - 80.9 30349 68.1 64.9 - 71.2
US-born 74090 71.0 68.1 - 73.8 57240 54.9 51.7 - 58.0
95% CL 95% CL
Offered HIV test Tested for HIV
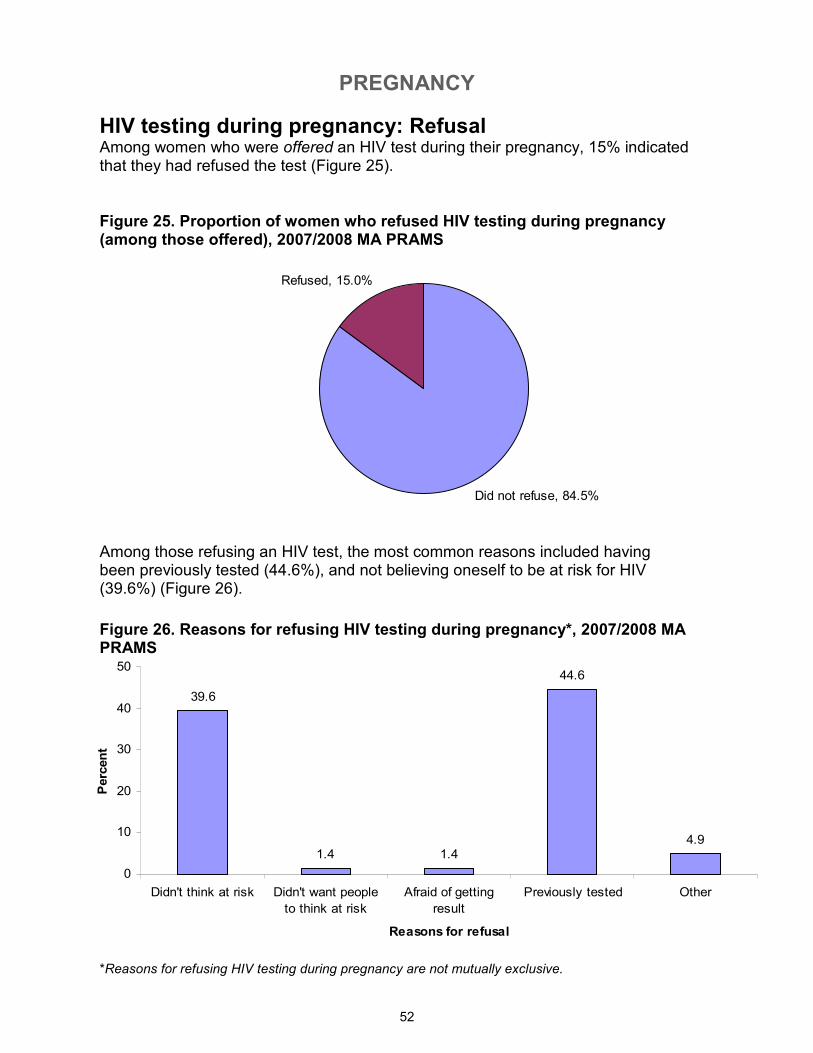
PREGNANCY
52
Did not refuse, 84.5%
Refused, 15.0%
39.6
1.4 1.4
44.6
4.9
0
10
20
30
40
50
Didn't think at risk Didn't want people
to think at risk
Afraid of getting
result
Previously tested Other
Reasons for refusal
Percent
Figure 26. Reasons for refusing HIV testing during pregnancy*, 2007/2008 MA PRAMS
HIV testing during pregnancy: Refusal Among women who were offered an HIV test during their pregnancy, 15% indicated that they had refused the test (Figure 25).
Among those refusing an HIV test, the most common reasons included having been previously tested (44.6%), and not believing oneself to be at risk for HIV (39.6%) (Figure 26).
Figure 25. Proportion of women who refused HIV testing during pregnancy (among those offered), 2007/2008 MA PRAMS
*Reasons for refusing HIV testing during pregnancy are not mutually exclusive.
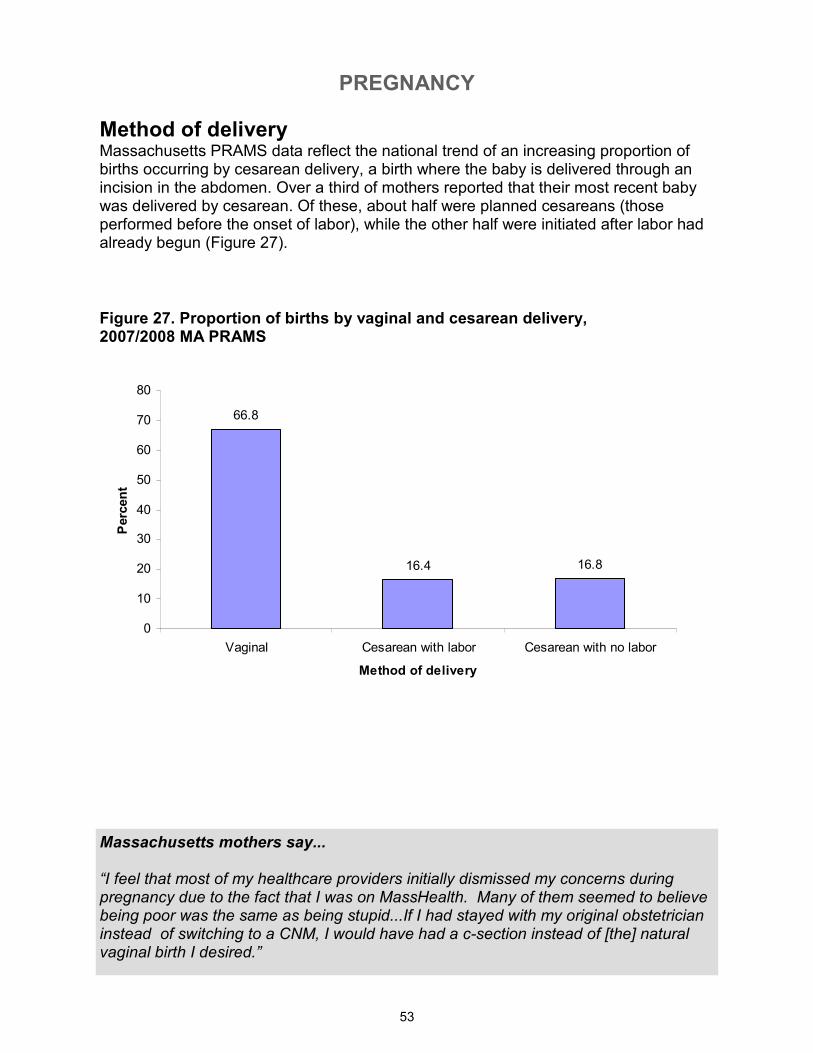
PREGNANCY
53
66.8
16.4 16.8
0
10
20
30
40
50
60
70
80
Vaginal Cesarean with labor Cesarean with no labor
Method of delivery
Percent
Method of delivery Massachusetts PRAMS data reflect the national trend of an increasing proportion of births occurring by cesarean delivery, a birth where the baby is delivered through an incision in the abdomen. Over a third of mothers reported that their most recent baby was delivered by cesarean. Of these, about half were planned cesareans (those performed before the onset of labor), while the other half were initiated after labor had already begun (Figure 27).
Figure 27. Proportion of births by vaginal and cesarean delivery, 2007/2008 MA PRAMS
Massachusetts mothers say... “I feel that most of my healthcare providers initially dismissed my concerns during pregnancy due to the fact that I was on MassHealth. Many of them seemed to believe being poor was the same as being stupid...If I had stayed with my original obstetrician instead of switching to a CNM, I would have had a c-section instead of [the] natural vaginal birth I desired.”
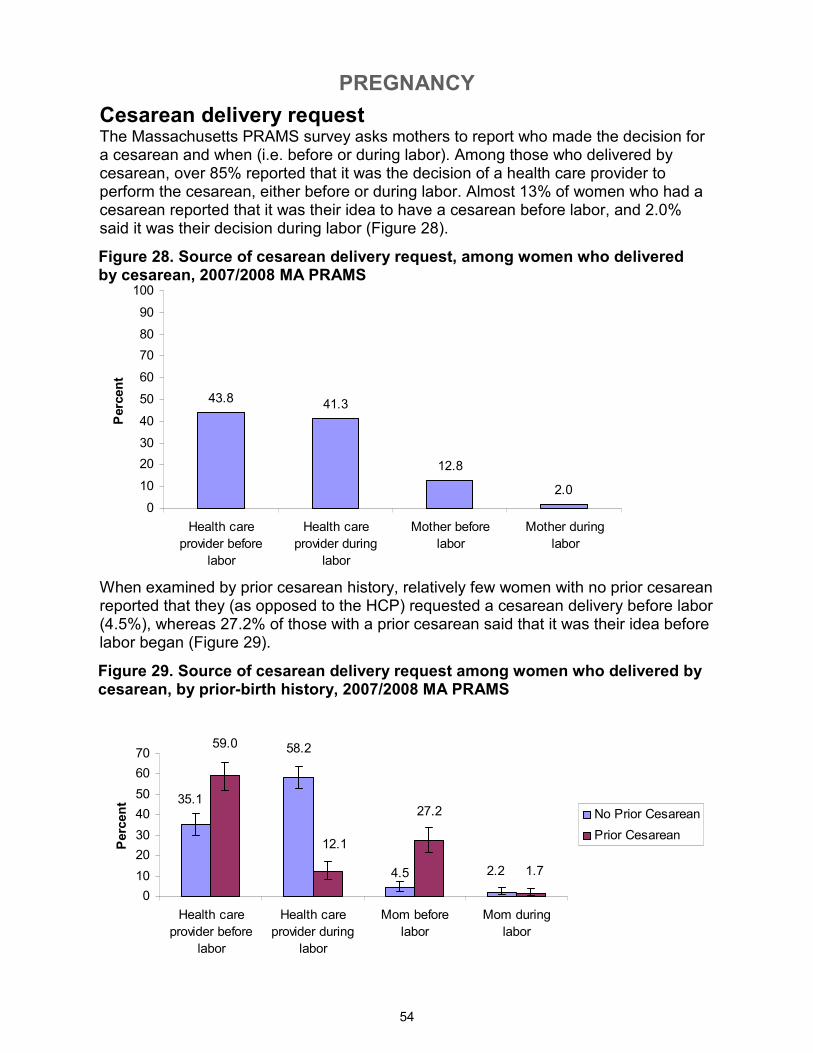
PREGNANCY
54
43.8 41.3
12.8
2.0
0
10
20
30
40
50
60
70
80
90
100
Health care
provider before
labor
Health care
provider during
labor
Mother before
labor
Mother during
labor
Percent
Cesarean delivery request The Massachusetts PRAMS survey asks mothers to report who made the decision for a cesarean and when (i.e. before or during labor). Among those who delivered by cesarean, over 85% reported that it was the decision of a health care provider to perform the cesarean, either before or during labor. Almost 13% of women who had a cesarean reported that it was their idea to have a cesarean before labor, and 2.0% said it was their decision during labor (Figure 28).
Figure 28. Source of cesarean delivery request, among women who delivered by cesarean, 2007/2008 MA PRAMS
When examined by prior cesarean history, relatively few women with no prior cesarean reported that they (as opposed to the HCP) requested a cesarean delivery before labor (4.5%), whereas 27.2% of those with a prior cesarean said that it was their idea before labor began (Figure 29).
Figure 29. Source of cesarean delivery request among women who delivered by cesarean, by prior-birth history, 2007/2008 MA PRAMS
4.5 2.2
58.2
35.1
1.7
27.2
59.0
12.1
0
10
20
30
40
50
60
70
Health care
provider before
labor
Health care
provider during
labor
Mom before
labor
Mom during
labor
Percent
No Prior Cesarean
Prior Cesarean
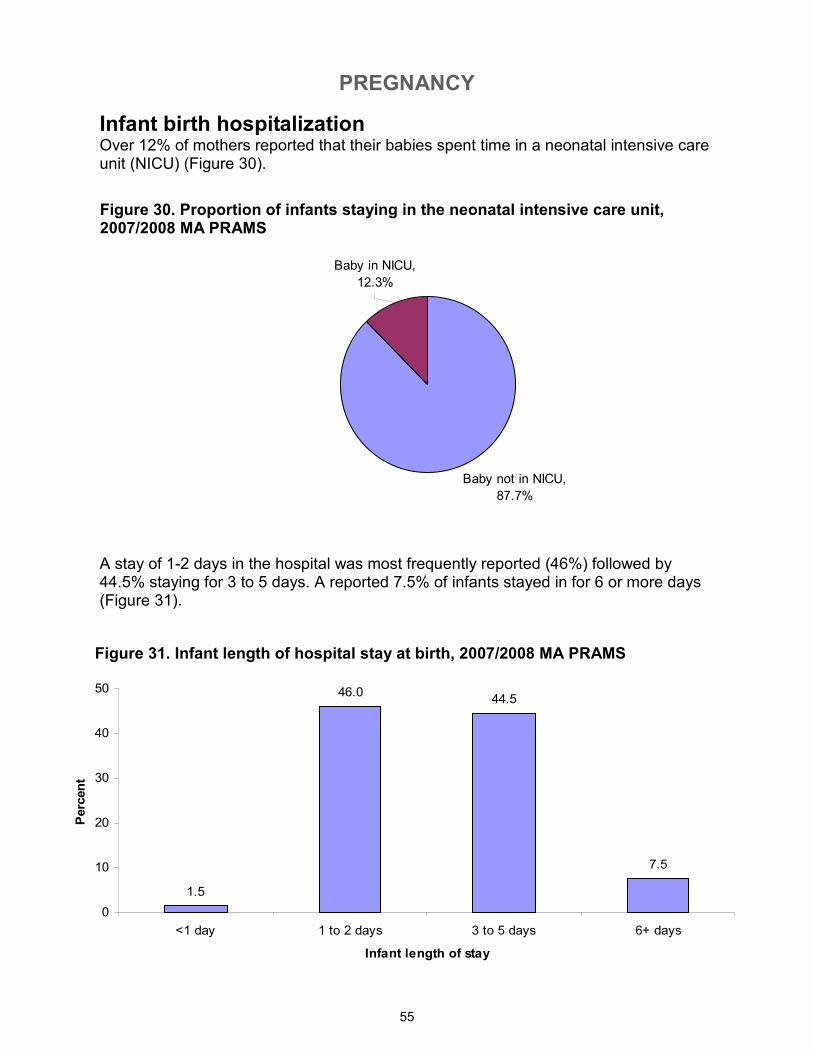
PREGNANCY
55
Baby not in NICU,
87.7%
Baby in NICU,
12.3%
Infant birth hospitalization Over 12% of mothers reported that their babies spent time in a neonatal intensive care unit (NICU) (Figure 30).
Figure 30. Proportion of infants staying in the neonatal intensive care unit, 2007/2008 MA PRAMS
Figure 31. Infant length of hospital stay at birth, 2007/2008 MA PRAMS
A stay of 1-2 days in the hospital was most frequently reported (46%) followed by 44.5% staying for 3 to 5 days. A reported 7.5% of infants stayed in for 6 or more days (Figure 31).
1.5
46.044.5
7.5
0
10
20
30
40
50
<1 day 1 to 2 days 3 to 5 days 6+ days
Infant length of stay
Percent
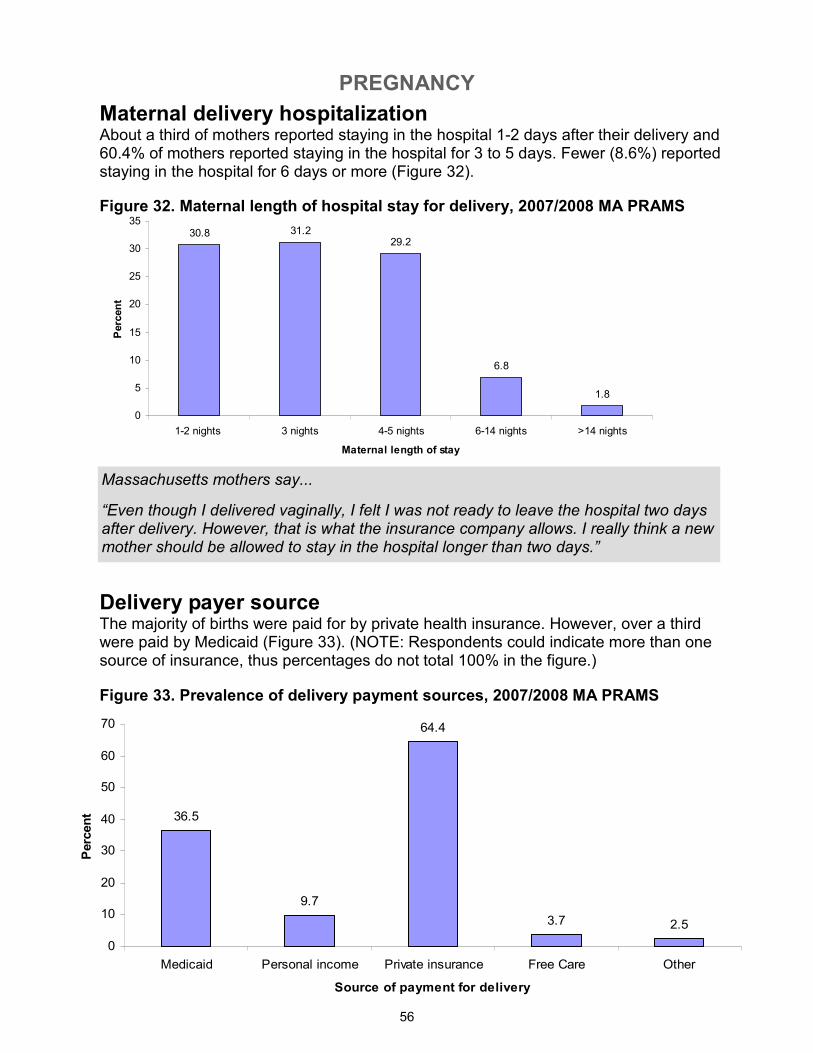
PREGNANCY
56
30.8 31.229.2
6.8
1.8
0
5
10
15
20
25
30
35
1-2 nights 3 nights 4-5 nights 6-14 nights >14 nights
Maternal length of stay
Percent
36.5
9.7
64.4
3.7 2.5
0
10
20
30
40
50
60
70
Medicaid Personal income Private insurance Free Care Other
Source of payment for delivery
Percent
Maternal delivery hospitalization About a third of mothers reported staying in the hospital 1-2 days after their delivery and 60.4% of mothers reported staying in the hospital for 3 to 5 days. Fewer (8.6%) reported staying in the hospital for 6 days or more (Figure 32).
Delivery payer source The majority of births were paid for by private health insurance. However, over a third were paid by Medicaid (Figure 33). (NOTE: Respondents could indicate more than one source of insurance, thus percentages do not total 100% in the figure.)
Figure 32. Maternal length of hospital stay for delivery, 2007/2008 MA PRAMS
Massachusetts mothers say...
“Even though I delivered vaginally, I felt I was not ready to leave the hospital two days after delivery. However, that is what the insurance company allows. I really think a new mother should be allowed to stay in the hospital longer than two days.”
Figure 33. Prevalence of delivery payment sources, 2007/2008 MA PRAMS
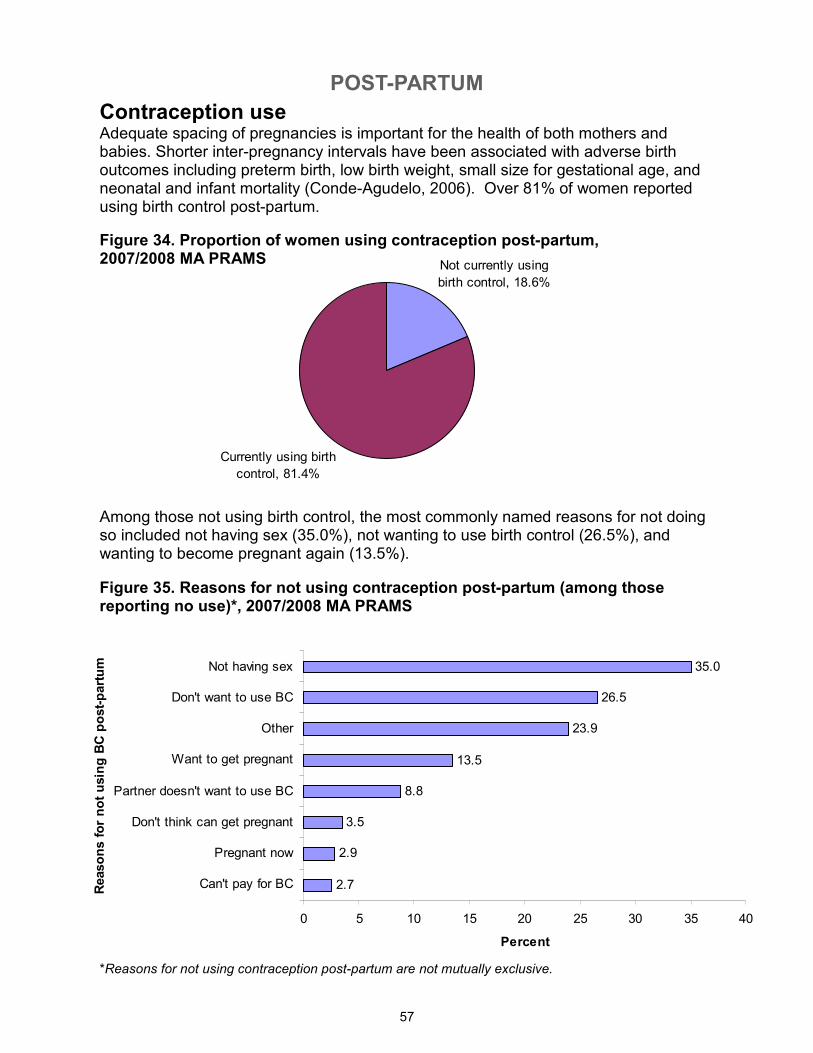
POST-PARTUM
57
Currently using birth
control, 81.4%
Not currently using
birth control, 18.6%
2.7
2.9
3.5
8.8
13.5
23.9
26.5
35.0
0 5 10 15 20 25 30 35 40
Can't pay for BC
Pregnant now
Don't think can get pregnant
Partner doesn't want to use BC
Want to get pregnant
Other
Don't want to use BC
Not having sex
Reasons for not using BC post-partum
Percent
Contraception use Adequate spacing of pregnancies is important for the health of both mothers and babies. Shorter inter-pregnancy intervals have been associated with adverse birth outcomes including preterm birth, low birth weight, small size for gestational age, and neonatal and infant mortality (Conde-Agudelo, 2006). Over 81% of women reported using birth control post-partum.
Figure 34. Proportion of women using contraception post-partum, 2007/2008 MA PRAMS
Figure 35. Reasons for not using contraception post-partum (among those reporting no use)*, 2007/2008 MA PRAMS
Among those not using birth control, the most commonly named reasons for not doing so included not having sex (35.0%), not wanting to use birth control (26.5%), and wanting to become pregnant again (13.5%).
*Reasons for not using contraception post-partum are not mutually exclusive.
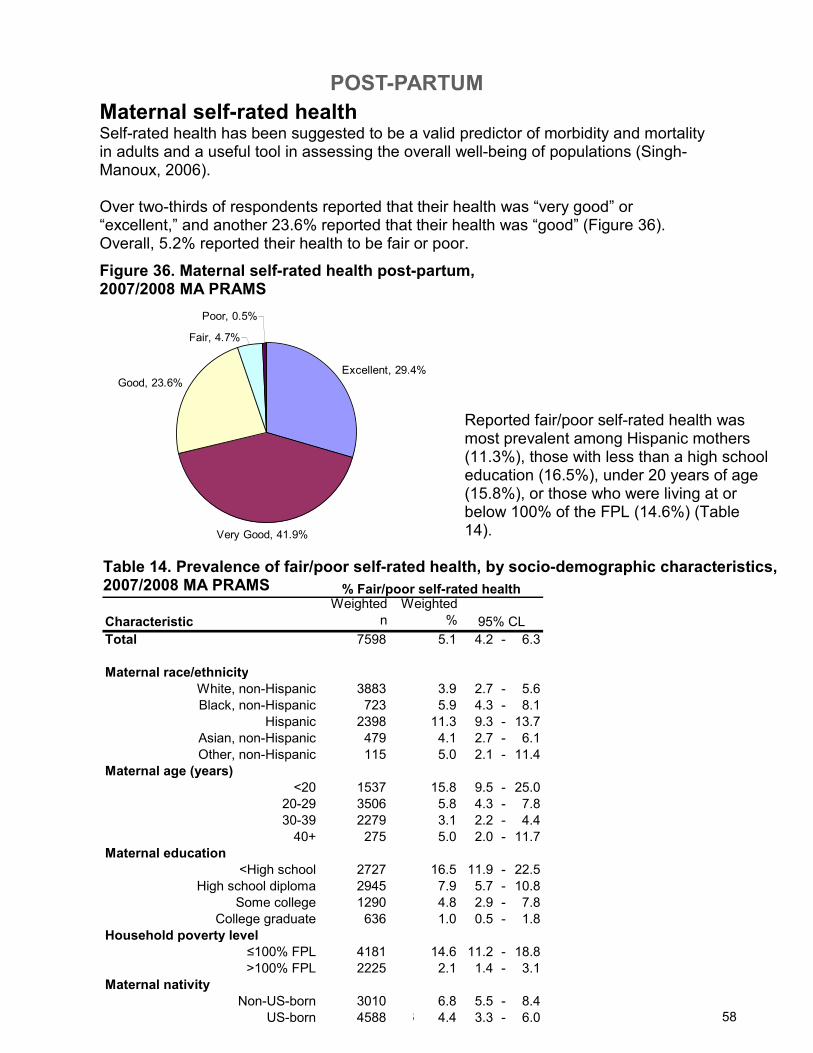
POST-PARTUM
58
Characteristic
Weighted
n
Weighted
%
Total 7598 5.1 4.2 - 6.3
Maternal race/ethnicity
White, non-Hispanic 3883 3.9 2.7 - 5.6
Black, non-Hispanic 723 5.9 4.3 - 8.1
Hispanic 2398 11.3 9.3 - 13.7
Asian, non-Hispanic 479 4.1 2.7 - 6.1
Other, non-Hispanic 115 5.0 2.1 - 11.4
Maternal age (years)
<20 1537 15.8 9.5 - 25.0
20-29 3506 5.8 4.3 - 7.8
30-39 2279 3.1 2.2 - 4.4
40+ 275 5.0 2.0 - 11.7
Maternal education
<High school 2727 16.5 11.9 - 22.5
High school diploma 2945 7.9 5.7 - 10.8
Some college 1290 4.8 2.9 - 7.8
College graduate 636 1.0 0.5 - 1.8
Household poverty level
≤100% FPL 4181 14.6 11.2 - 18.8
>100% FPL 2225 2.1 1.4 - 3.1
Maternal nativity
Non-US-born 3010 6.8 5.5 - 8.4
US-born 4588 4.4 3.3 - 6.0
% Fair/poor self-rated health
95% CL
Excellent, 29.4%
Very Good, 41.9%
Good, 23.6%
Fair, 4.7%
Poor, 0.5%
Maternal self-rated health Self-rated health has been suggested to be a valid predictor of morbidity and mortality in adults and a useful tool in assessing the overall well-being of populations (Singh-Manoux, 2006). Over two-thirds of respondents reported that their health was “very good” or “excellent,” and another 23.6% reported that their health was “good” (Figure 36). Overall, 5.2% reported their health to be fair or poor.
Figure 36. Maternal self-rated health post-partum, 2007/2008 MA PRAMS
Reported fair/poor self-rated health was most prevalent among Hispanic mothers (11.3%), those with less than a high school education (16.5%), under 20 years of age (15.8%), or those who were living at or below 100% of the FPL (14.6%) (Table 14).
Table 14. Prevalence of fair/poor self-rated health, by socio-demographic characteristics, 2007/2008 MA PRAMS
58
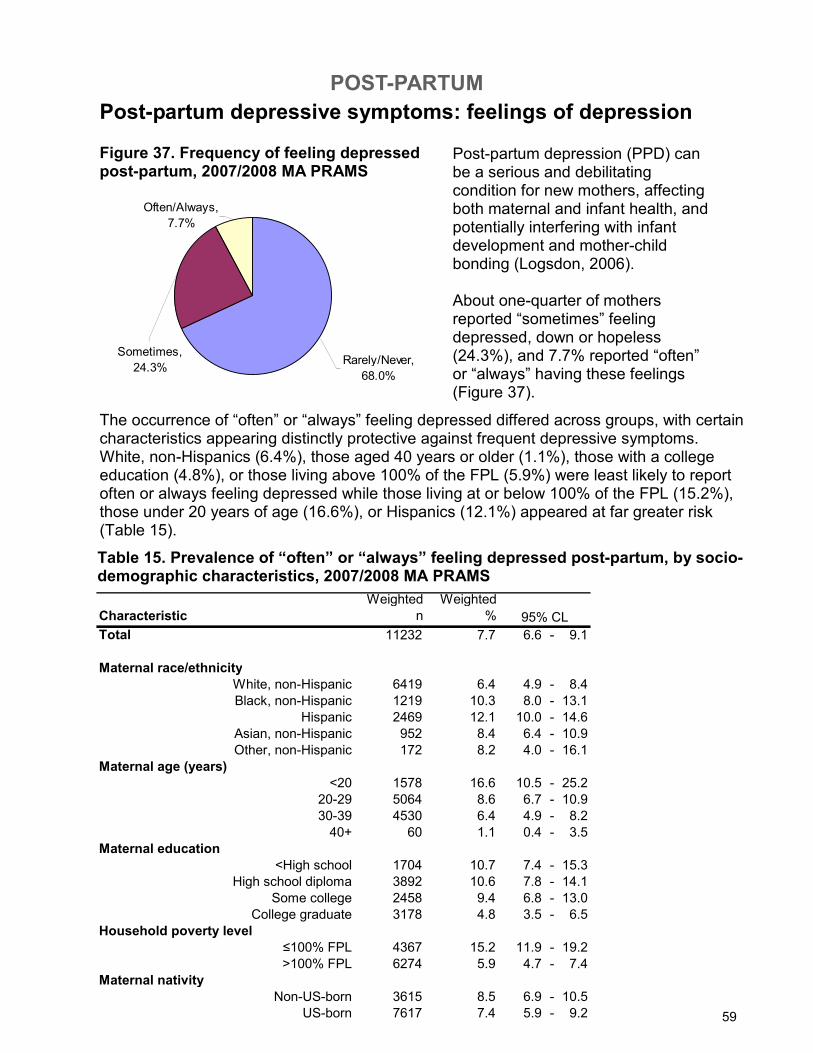
POST-PARTUM
59
Rarely/Never,
68.0%
Sometimes,
24.3%
Often/Always,
7.7%
Post-partum depressive symptoms: feelings of depression
Post-partum depression (PPD) can be a serious and debilitating condition for new mothers, affecting both maternal and infant health, and potentially interfering with infant development and mother-child bonding (Logsdon, 2006). About one-quarter of mothers reported “sometimes” feeling depressed, down or hopeless(24.3%), and 7.7% reported “often” or “always” having these feelings (Figure 37).
Figure 37. Frequency of feeling depressed post-partum, 2007/2008 MA PRAMS
The occurrence of “often” or “always” feeling depressed differed across groups, with certain characteristics appearing distinctly protective against frequent depressive symptoms. White, non-Hispanics (6.4%), those aged 40 years or older (1.1%), those with a college education (4.8%), or those living above 100% of the FPL (5.9%) were least likely to report often or always feeling depressed while those living at or below 100% of the FPL (15.2%), those under 20 years of age (16.6%), or Hispanics (12.1%) appeared at far greater risk (Table 15).
Table 15. Prevalence of “often” or “always” feeling depressed post-partum, by socio-demographic characteristics, 2007/2008 MA PRAMS
59
Characteristic
Weighted
n
Weighted
%
Total 11232 7.7 6.6 - 9.1
Maternal race/ethnicity
White, non-Hispanic 6419 6.4 4.9 - 8.4
Black, non-Hispanic 1219 10.3 8.0 - 13.1
Hispanic 2469 12.1 10.0 - 14.6
Asian, non-Hispanic 952 8.4 6.4 - 10.9
Other, non-Hispanic 172 8.2 4.0 - 16.1
Maternal age (years)
<20 1578 16.6 10.5 - 25.2
20-29 5064 8.6 6.7 - 10.9
30-39 4530 6.4 4.9 - 8.2
40+ 60 1.1 0.4 - 3.5
Maternal education
<High school 1704 10.7 7.4 - 15.3
High school diploma 3892 10.6 7.8 - 14.1
Some college 2458 9.4 6.8 - 13.0
College graduate 3178 4.8 3.5 - 6.5
Household poverty level
≤100% FPL 4367 15.2 11.9 - 19.2
>100% FPL 6274 5.9 4.7 - 7.4
Maternal nativity
Non-US-born 3615 8.5 6.9 - 10.5
US-born 7617 7.4 5.9 - 9.2
95% CL
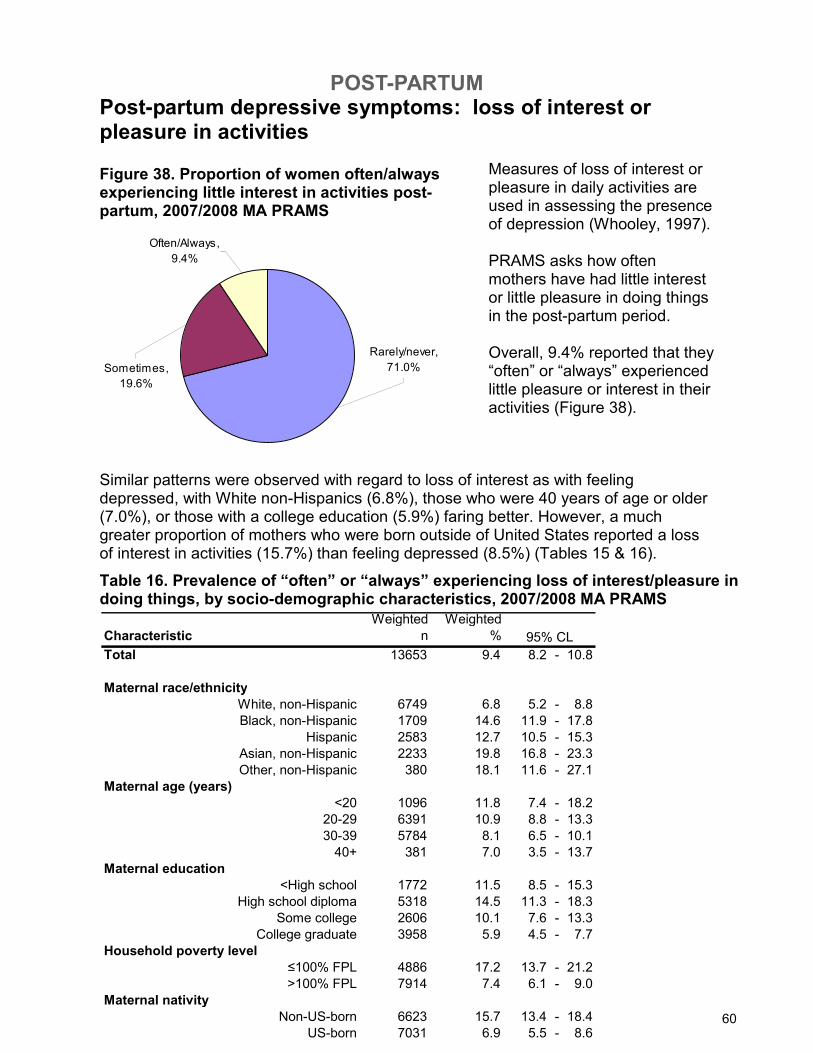
POST-PARTUM
60
Often/Always,
9.4%
Rarely/never,
71.0%Sometimes,
19.6%
Post-partum depressive symptoms: loss of interest or pleasure in activities
Figure 38. Proportion of women often/always experiencing little interest in activities post-partum, 2007/2008 MA PRAMS
Measures of loss of interest or pleasure in daily activities are used in assessing the presence of depression (Whooley, 1997). PRAMS asks how often mothers have had little interest or little pleasure in doing things in the post-partum period. Overall, 9.4% reported that they “often” or “always” experienced little pleasure or interest in their activities (Figure 38).
Similar patterns were observed with regard to loss of interest as with feeling depressed, with White non-Hispanics (6.8%), those who were 40 years of age or older (7.0%), or those with a college education (5.9%) faring better. However, a much greater proportion of mothers who were born outside of United States reported a loss of interest in activities (15.7%) than feeling depressed (8.5%) (Tables 15 & 16).
60
Table 16. Prevalence of “often” or “always” experiencing loss of interest/pleasure in doing things, by socio-demographic characteristics, 2007/2008 MA PRAMS
Characteristic
Weighted
n
Weighted
%
Total 13653 9.4 8.2 - 10.8
Maternal race/ethnicity
White, non-Hispanic 6749 6.8 5.2 - 8.8
Black, non-Hispanic 1709 14.6 11.9 - 17.8
Hispanic 2583 12.7 10.5 - 15.3
Asian, non-Hispanic 2233 19.8 16.8 - 23.3
Other, non-Hispanic 380 18.1 11.6 - 27.1
Maternal age (years)
<20 1096 11.8 7.4 - 18.2
20-29 6391 10.9 8.8 - 13.3
30-39 5784 8.1 6.5 - 10.1
40+ 381 7.0 3.5 - 13.7
Maternal education
<High school 1772 11.5 8.5 - 15.3
High school diploma 5318 14.5 11.3 - 18.3
Some college 2606 10.1 7.6 - 13.3
College graduate 3958 5.9 4.5 - 7.7
Household poverty level
≤100% FPL 4886 17.2 13.7 - 21.2
>100% FPL 7914 7.4 6.1 - 9.0
Maternal nativity
Non-US-born 6623 15.7 13.4 - 18.4
US-born 7031 6.9 5.5 - 8.6
95% CL
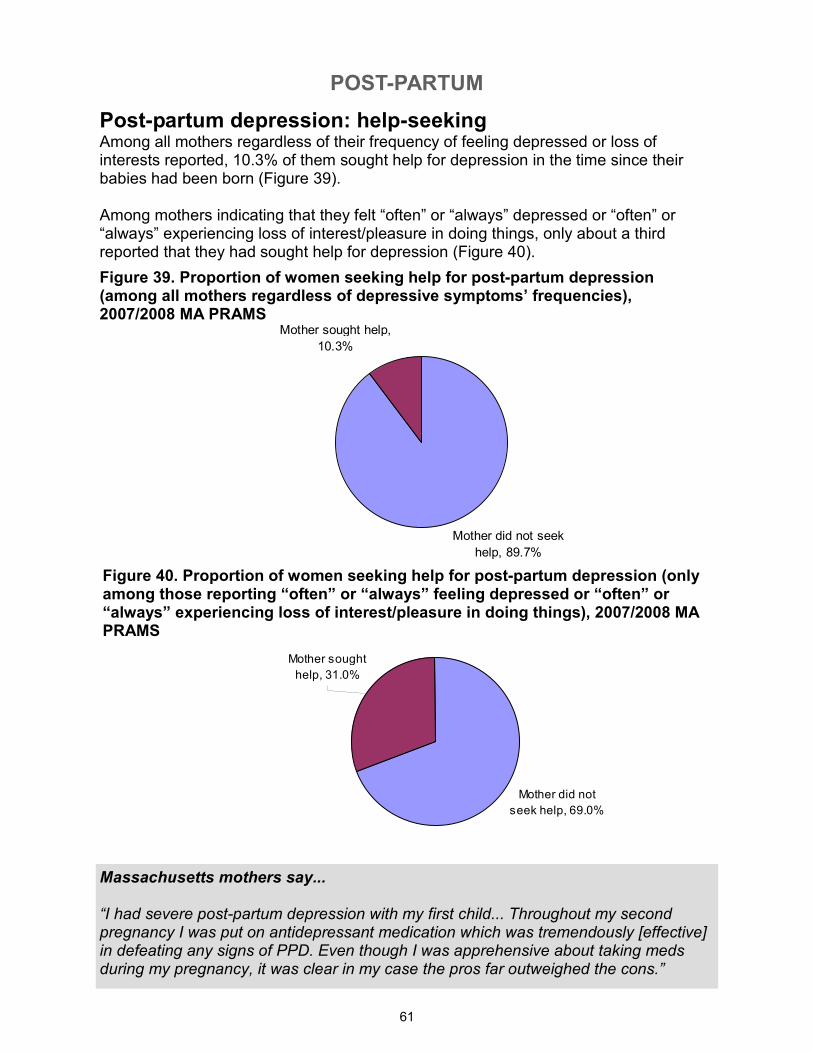
POST-PARTUM
61
Mother did not
seek help, 69.0%
Mother sought
help, 31.0%
Mother did not seek
help, 89.7%
Mother sought help,
10.3%
Post-partum depression: help-seeking Among all mothers regardless of their frequency of feeling depressed or loss of interests reported, 10.3% of them sought help for depression in the time since their babies had been born (Figure 39). Among mothers indicating that they felt “often” or “always” depressed or “often” or “always” experiencing loss of interest/pleasure in doing things, only about a third reported that they had sought help for depression (Figure 40).
Figure 39. Proportion of women seeking help for post-partum depression (among all mothers regardless of depressive symptoms’ frequencies), 2007/2008 MA PRAMS
Figure 40. Proportion of women seeking help for post-partum depression (only among those reporting “often” or “always” feeling depressed or “often” or “always” experiencing loss of interest/pleasure in doing things), 2007/2008 MA PRAMS
Massachusetts mothers say... “I had severe post-partum depression with my first child... Throughout my second pregnancy I was put on antidepressant medication which was tremendously [effective] in defeating any signs of PPD. Even though I was apprehensive about taking meds during my pregnancy, it was clear in my case the pros far outweighed the cons.”
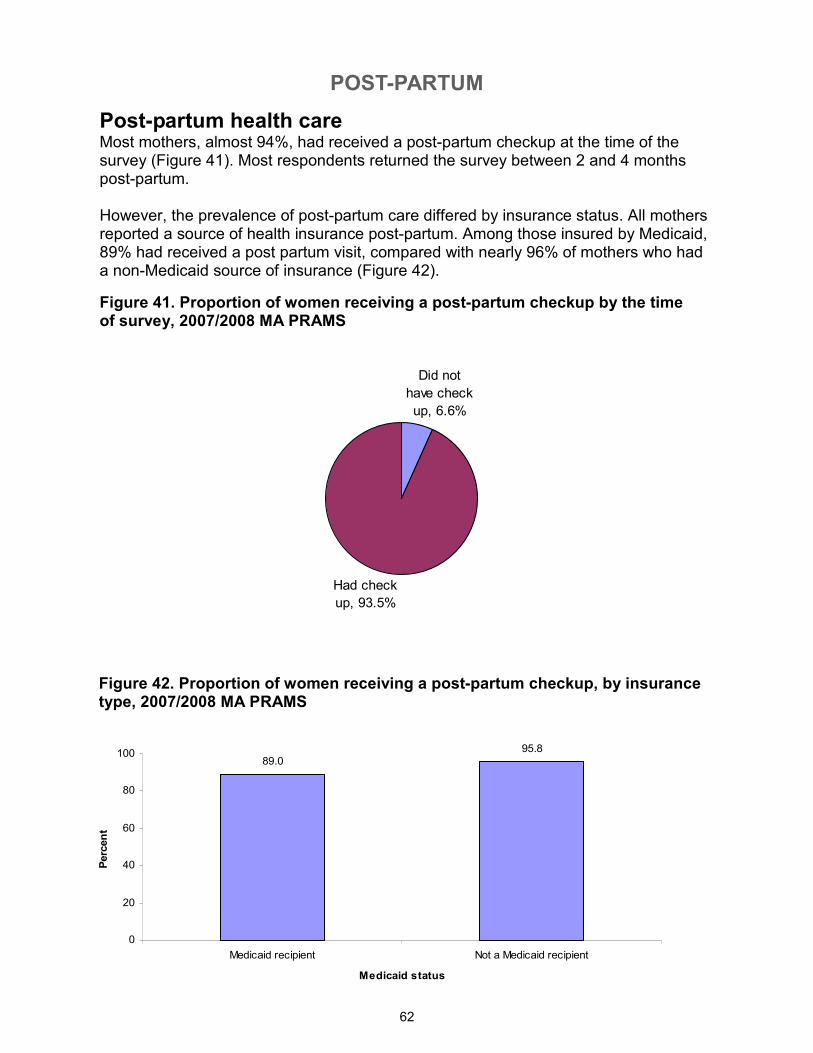
POST-PARTUM
62
Had check
up, 93.5%
Did not
have check
up, 6.6%
Post-partum health care Most mothers, almost 94%, had received a post-partum checkup at the time of the survey (Figure 41). Most respondents returned the survey between 2 and 4 months post-partum. However, the prevalence of post-partum care differed by insurance status. All mothers reported a source of health insurance post-partum. Among those insured by Medicaid, 89% had received a post partum visit, compared with nearly 96% of mothers who had a non-Medicaid source of insurance (Figure 42).
Figure 41. Proportion of women receiving a post-partum checkup by the time of survey, 2007/2008 MA PRAMS
Figure 42. Proportion of women receiving a post-partum checkup, by insurance type, 2007/2008 MA PRAMS
89.095.8
0
20
40
60
80
100
Medicaid recipient Not a Medicaid recipient
Medicaid status
Percent
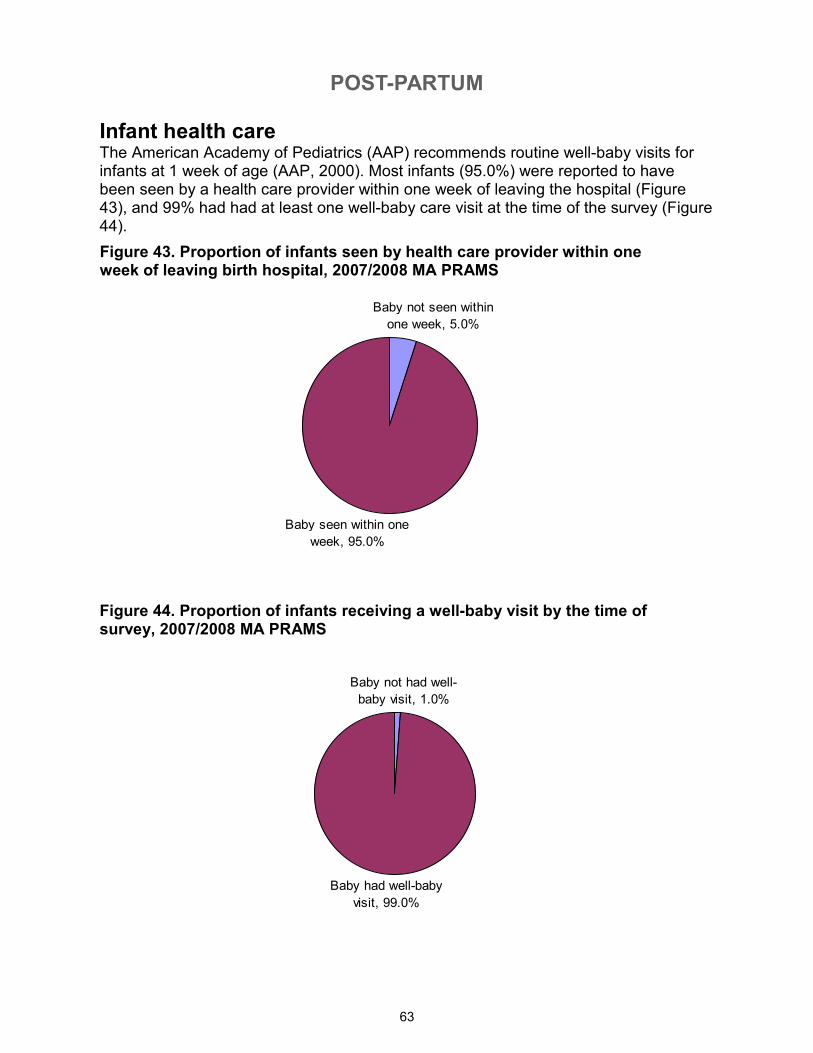
POST-PARTUM
63
Baby not had well-
baby visit, 1.0%
Baby had well-baby
visit, 99.0%
Baby seen within one
week, 95.0%
Baby not seen within
one week, 5.0%
Infant health care The American Academy of Pediatrics (AAP) recommends routine well-baby visits for infants at 1 week of age (AAP, 2000). Most infants (95.0%) were reported to have been seen by a health care provider within one week of leaving the hospital (Figure 43), and 99% had had at least one well-baby care visit at the time of the survey (Figure 44).
Figure 43. Proportion of infants seen by health care provider within one week of leaving birth hospital, 2007/2008 MA PRAMS
Figure 44. Proportion of infants receiving a well-baby visit by the time of survey, 2007/2008 MA PRAMS
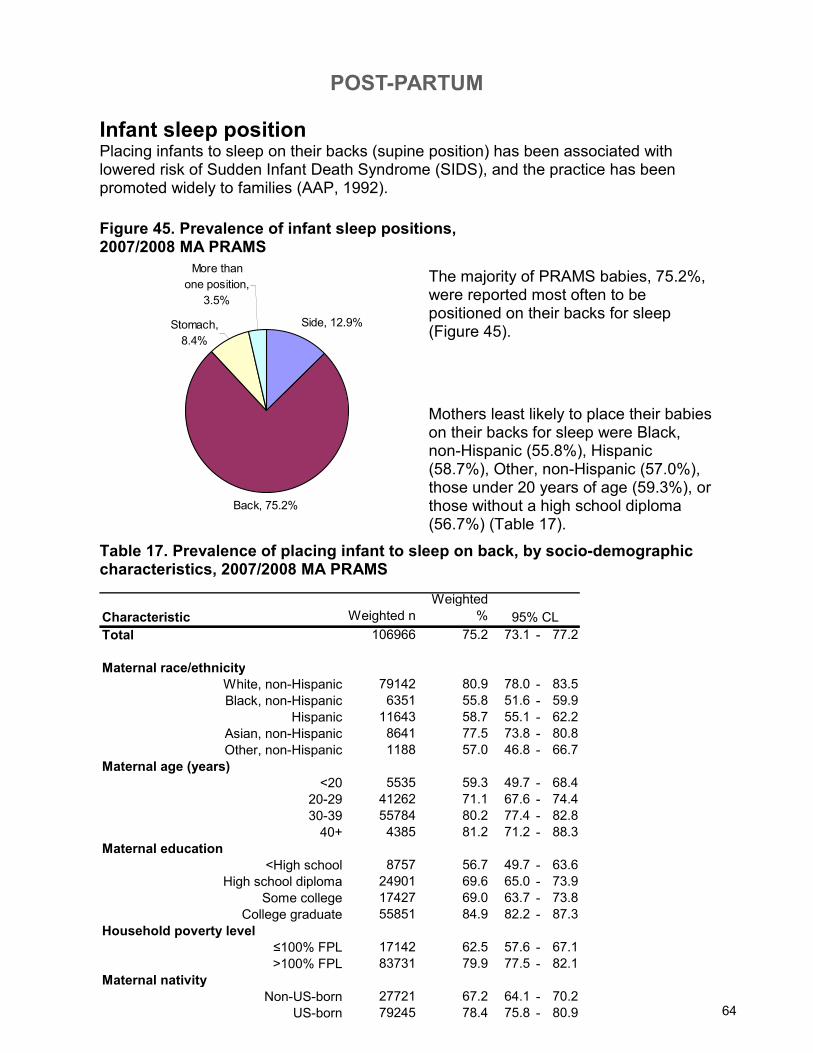
POST-PARTUM
64
Stomach,
8.4%
More than
one position,
3.5%
Back, 75.2%
Side, 12.9%
Infant sleep position Placing infants to sleep on their backs (supine position) has been associated with lowered risk of Sudden Infant Death Syndrome (SIDS), and the practice has been promoted widely to families (AAP, 1992).
Figure 45. Prevalence of infant sleep positions, 2007/2008 MA PRAMS
Mothers least likely to place their babies on their backs for sleep were Black, non-Hispanic (55.8%), Hispanic (58.7%), Other, non-Hispanic (57.0%), those under 20 years of age (59.3%), or those without a high school diploma (56.7%) (Table 17).
The majority of PRAMS babies, 75.2%, were reported most often to be positioned on their backs for sleep (Figure 45).
Table 17. Prevalence of placing infant to sleep on back, by socio-demographic characteristics, 2007/2008 MA PRAMS
64
Characteristic Weighted n
Weighted
%
Total 106966 75.2 73.1 - 77.2
Maternal race/ethnicity
White, non-Hispanic 79142 80.9 78.0 - 83.5
Black, non-Hispanic 6351 55.8 51.6 - 59.9
Hispanic 11643 58.7 55.1 - 62.2
Asian, non-Hispanic 8641 77.5 73.8 - 80.8
Other, non-Hispanic 1188 57.0 46.8 - 66.7
Maternal age (years)
<20 5535 59.3 49.7 - 68.4
20-29 41262 71.1 67.6 - 74.4
30-39 55784 80.2 77.4 - 82.8
40+ 4385 81.2 71.2 - 88.3
Maternal education
<High school 8757 56.7 49.7 - 63.6
High school diploma 24901 69.6 65.0 - 73.9
Some college 17427 69.0 63.7 - 73.8
College graduate 55851 84.9 82.2 - 87.3
Household poverty level
≤100% FPL 17142 62.5 57.6 - 67.1
>100% FPL 83731 79.9 77.5 - 82.1
Maternal nativity
Non-US-born 27721 67.2 64.1 - 70.2
US-born 79245 78.4 75.8 - 80.9
95% CL
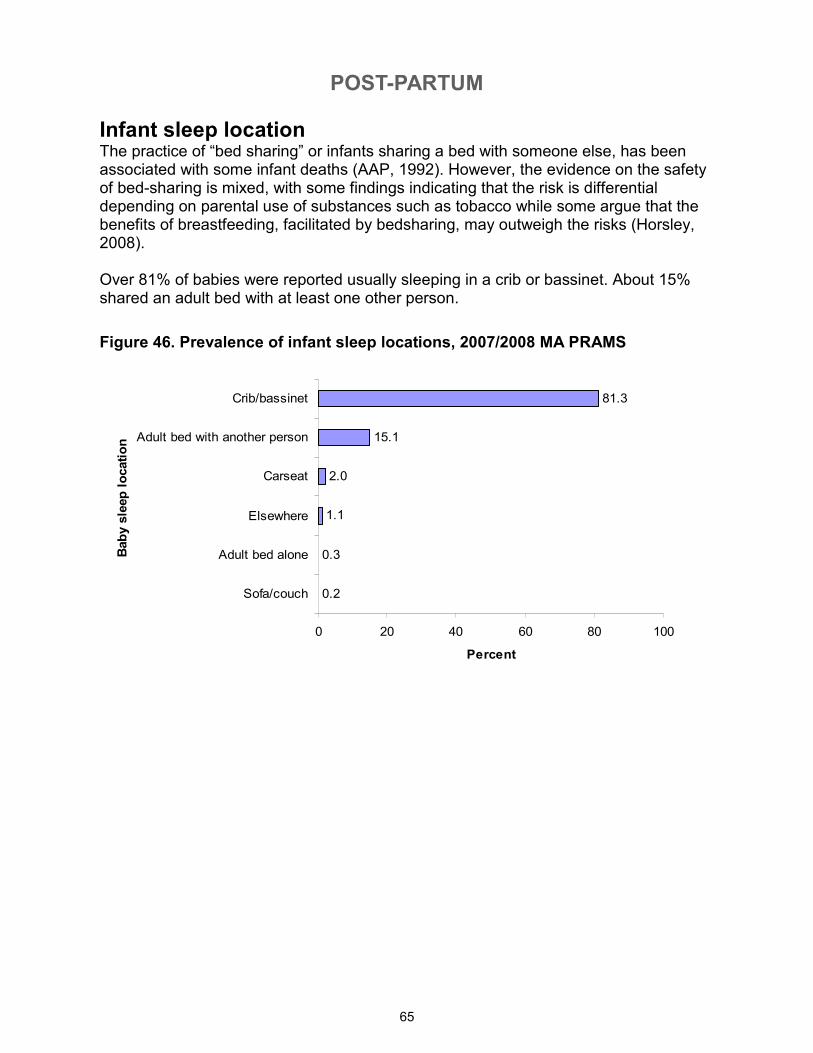
POST-PARTUM
65
Figure 46. Prevalence of infant sleep locations, 2007/2008 MA PRAMS
Infant sleep location The practice of “bed sharing” or infants sharing a bed with someone else, has been associated with some infant deaths (AAP, 1992). However, the evidence on the safety of bed-sharing is mixed, with some findings indicating that the risk is differential depending on parental use of substances such as tobacco while some argue that the benefits of breastfeeding, facilitated by bedsharing, may outweigh the risks (Horsley, 2008). Over 81% of babies were reported usually sleeping in a crib or bassinet. About 15% shared an adult bed with at least one other person.
0.2
0.3
1.1
2.0
15.1
81.3
0 20 40 60 80 100
Sofa/couch
Adult bed alone
Elsewhere
Carseat
Adult bed with another person
Crib/bassinet
Baby sleep location
Percent
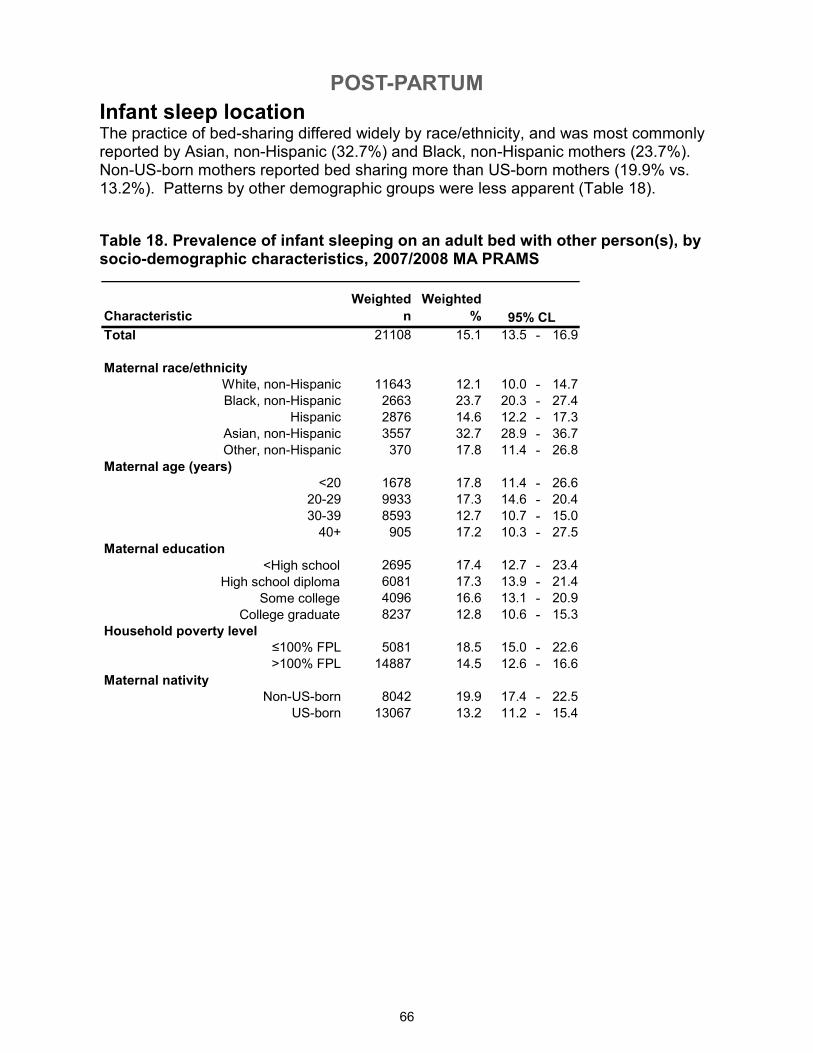
POST-PARTUM
66
Table 18. Prevalence of infant sleeping on an adult bed with other person(s), by socio-demographic characteristics, 2007/2008 MA PRAMS
Infant sleep location The practice of bed-sharing differed widely by race/ethnicity, and was most commonly reported by Asian, non-Hispanic (32.7%) and Black, non-Hispanic mothers (23.7%). Non-US-born mothers reported bed sharing more than US-born mothers (19.9% vs. 13.2%). Patterns by other demographic groups were less apparent (Table 18).
Characteristic
Weighted
n
Weighted
%
Total 21108 15.1 13.5 - 16.9
Maternal race/ethnicity
White, non-Hispanic 11643 12.1 10.0 - 14.7
Black, non-Hispanic 2663 23.7 20.3 - 27.4
Hispanic 2876 14.6 12.2 - 17.3
Asian, non-Hispanic 3557 32.7 28.9 - 36.7
Other, non-Hispanic 370 17.8 11.4 - 26.8
Maternal age (years)
<20 1678 17.8 11.4 - 26.6
20-29 9933 17.3 14.6 - 20.4
30-39 8593 12.7 10.7 - 15.0
40+ 905 17.2 10.3 - 27.5
Maternal education
<High school 2695 17.4 12.7 - 23.4
High school diploma 6081 17.3 13.9 - 21.4
Some college 4096 16.6 13.1 - 20.9
College graduate 8237 12.8 10.6 - 15.3
Household poverty level
≤100% FPL 5081 18.5 15.0 - 22.6
>100% FPL 14887 14.5 12.6 - 16.6
Maternal nativity
Non-US-born 8042 19.9 17.4 - 22.5
US-born 13067 13.2 11.2 - 15.4
95% CL
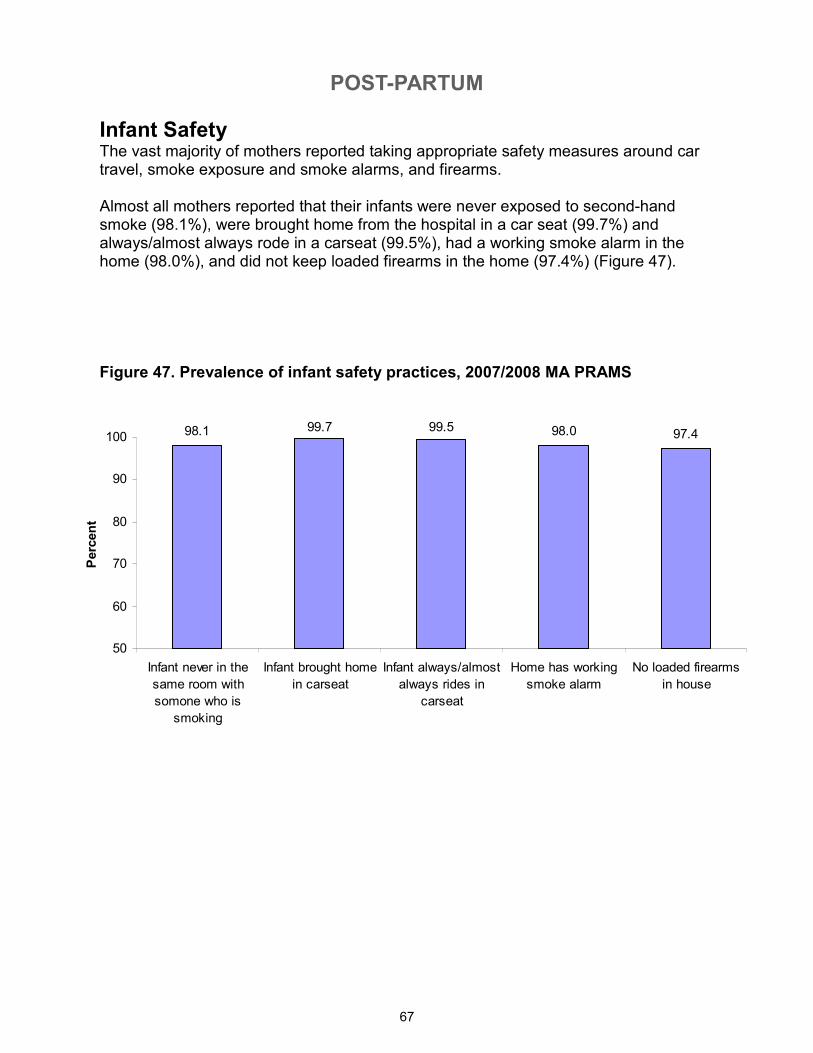
POST-PARTUM
67
Infant Safety The vast majority of mothers reported taking appropriate safety measures around car travel, smoke exposure and smoke alarms, and firearms. Almost all mothers reported that their infants were never exposed to second-hand smoke (98.1%), were brought home from the hospital in a car seat (99.7%) and always/almost always rode in a carseat (99.5%), had a working smoke alarm in the home (98.0%), and did not keep loaded firearms in the home (97.4%) (Figure 47).
Figure 47. Prevalence of infant safety practices, 2007/2008 MA PRAMS
98.1 99.7 99.5 98.0 97.4
50
60
70
80
90
100
Infant never in the
same room with
somone who is
smoking
Infant brought home
in carseat
Infant always/almost
always rides in
carseat
Home has working
smoke alarm
No loaded firearms
in house
Percent
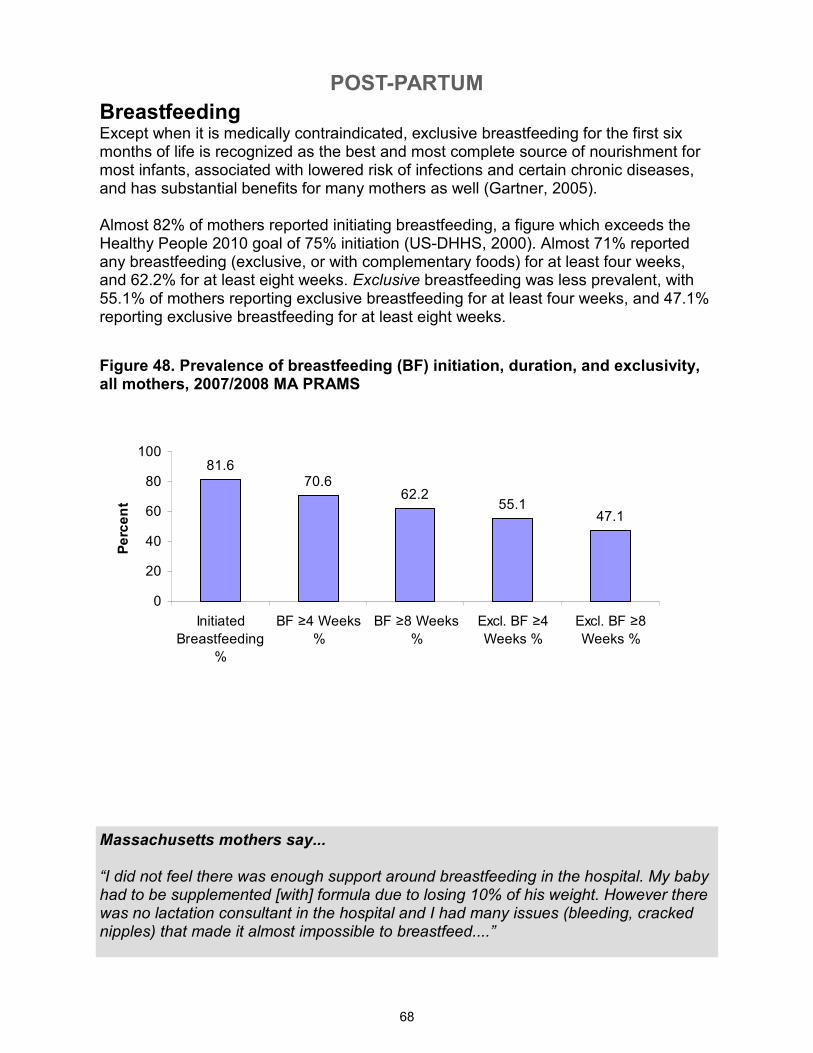
POST-PARTUM
68
Breastfeeding Except when it is medically contraindicated, exclusive breastfeeding for the first six months of life is recognized as the best and most complete source of nourishment for most infants, associated with lowered risk of infections and certain chronic diseases, and has substantial benefits for many mothers as well (Gartner, 2005). Almost 82% of mothers reported initiating breastfeeding, a figure which exceeds the Healthy People 2010 goal of 75% initiation (US-DHHS, 2000). Almost 71% reported any breastfeeding (exclusive, or with complementary foods) for at least four weeks, and 62.2% for at least eight weeks. Exclusive breastfeeding was less prevalent, with 55.1% of mothers reporting exclusive breastfeeding for at least four weeks, and 47.1% reporting exclusive breastfeeding for at least eight weeks.
Figure 48. Prevalence of breastfeeding (BF) initiation, duration, and exclusivity, all mothers, 2007/2008 MA PRAMS
Massachusetts mothers say... “I did not feel there was enough support around breastfeeding in the hospital. My baby had to be supplemented [with] formula due to losing 10% of his weight. However there was no lactation consultant in the hospital and I had many issues (bleeding, cracked nipples) that made it almost impossible to breastfeed....”
81.670.6
62.255.1
47.1
0
20
40
60
80
100
Initiated
Breastfeeding
%
BF ≥4 Weeks
%
BF ≥8 Weeks
%
Excl. BF ≥4
Weeks %
Excl. BF ≥8
Weeks %
Percent
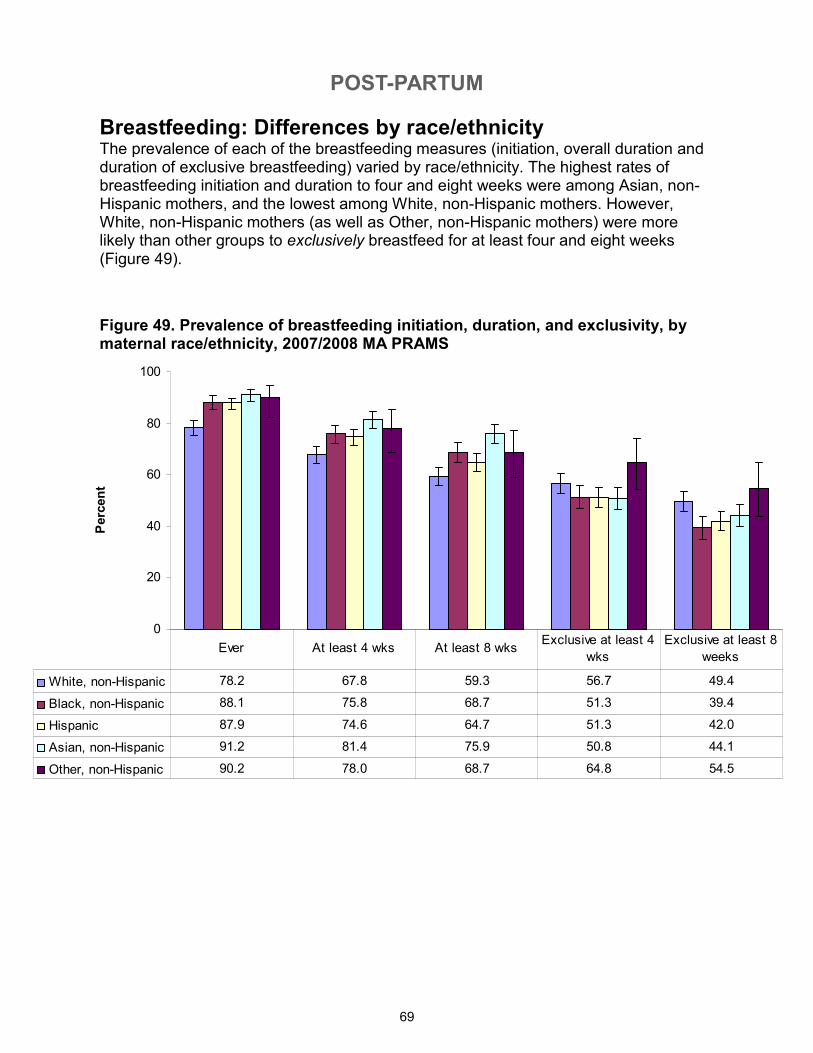
POST-PARTUM
69
0
20
40
60
80
100
Percent
White, non-Hispanic 78.2 67.8 59.3 56.7 49.4
Black, non-Hispanic 88.1 75.8 68.7 51.3 39.4
Hispanic 87.9 74.6 64.7 51.3 42.0
Asian, non-Hispanic 91.2 81.4 75.9 50.8 44.1
Other, non-Hispanic 90.2 78.0 68.7 64.8 54.5
Ever At least 4 wks At least 8 wksExclusive at least 4
wks
Exclusive at least 8
weeks
Breastfeeding: Differences by race/ethnicity The prevalence of each of the breastfeeding measures (initiation, overall duration and duration of exclusive breastfeeding) varied by race/ethnicity. The highest rates of breastfeeding initiation and duration to four and eight weeks were among Asian, non-Hispanic mothers, and the lowest among White, non-Hispanic mothers. However, White, non-Hispanic mothers (as well as Other, non-Hispanic mothers) were more likely than other groups to exclusively breastfeed for at least four and eight weeks (Figure 49).
Figure 49. Prevalence of breastfeeding initiation, duration, and exclusivity, by maternal race/ethnicity, 2007/2008 MA PRAMS

POST-PARTUM
70
0
20
40
60
80
100
Percent
<20 73.7 41.6 27.6 43.3 32.1
20-29 80.8 66.9 58.5 54.8 46.3
30-39 82.5 75.9 68.7 56.0 49.0
40+ 91.9 90.2 78.4 63.5 54.4
Ever At least 4 wks At least 8 wksExclusive at least 4
wks
Exclusive at least 8
weeks
Breastfeeding: Differences by age Increasing maternal age was associated with greater initiation and duration of breastfeeding. Mothers aged 40 years or older reported breastfeeding more than younger age groups (Figure 50).
Figure 50. Prevalence of breastfeeding initiation, duration, and exclusivity, by maternal age (years), 2007/2008 MA PRAMS
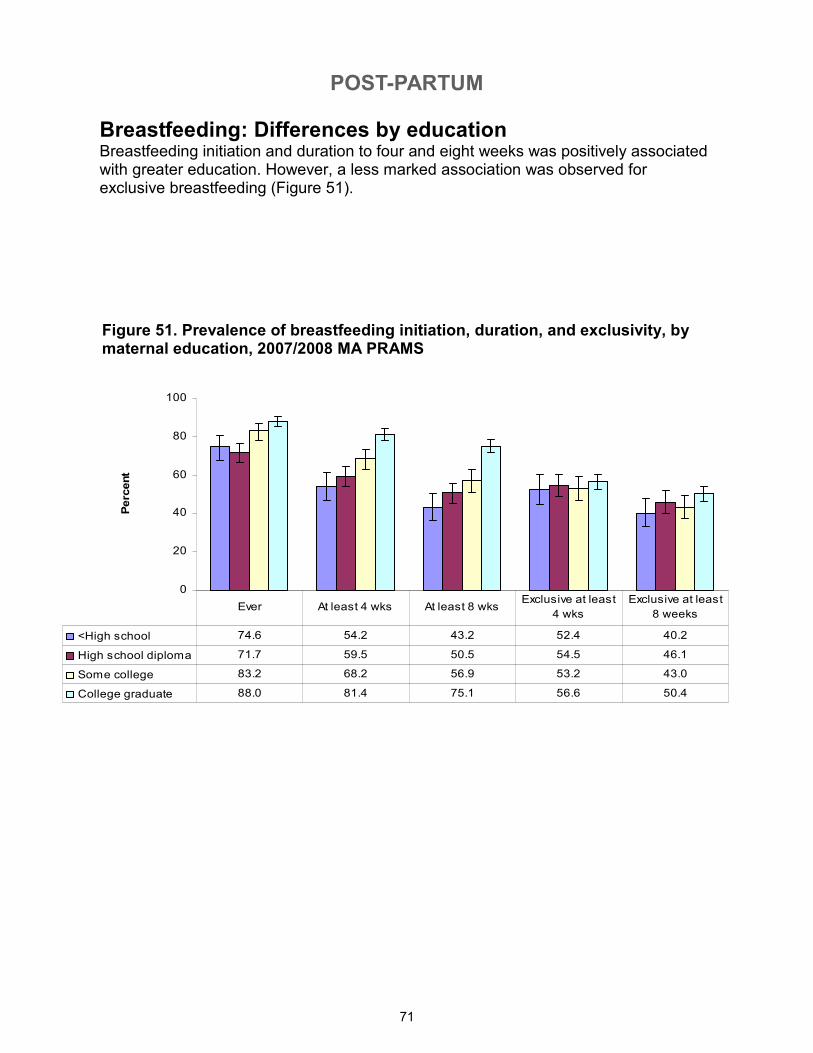
POST-PARTUM
71
Figure 51. Prevalence of breastfeeding initiation, duration, and exclusivity, by maternal education, 2007/2008 MA PRAMS
Breastfeeding: Differences by education Breastfeeding initiation and duration to four and eight weeks was positively associated with greater education. However, a less marked association was observed for exclusive breastfeeding (Figure 51).
0
20
40
60
80
100
Percent
<High school 74.6 54.2 43.2 52.4 40.2
High school diploma 71.7 59.5 50.5 54.5 46.1
Some college 83.2 68.2 56.9 53.2 43.0
College graduate 88.0 81.4 75.1 56.6 50.4
Ever At least 4 wks At least 8 wksExclusive at least
4 wks
Exclusive at least
8 weeks
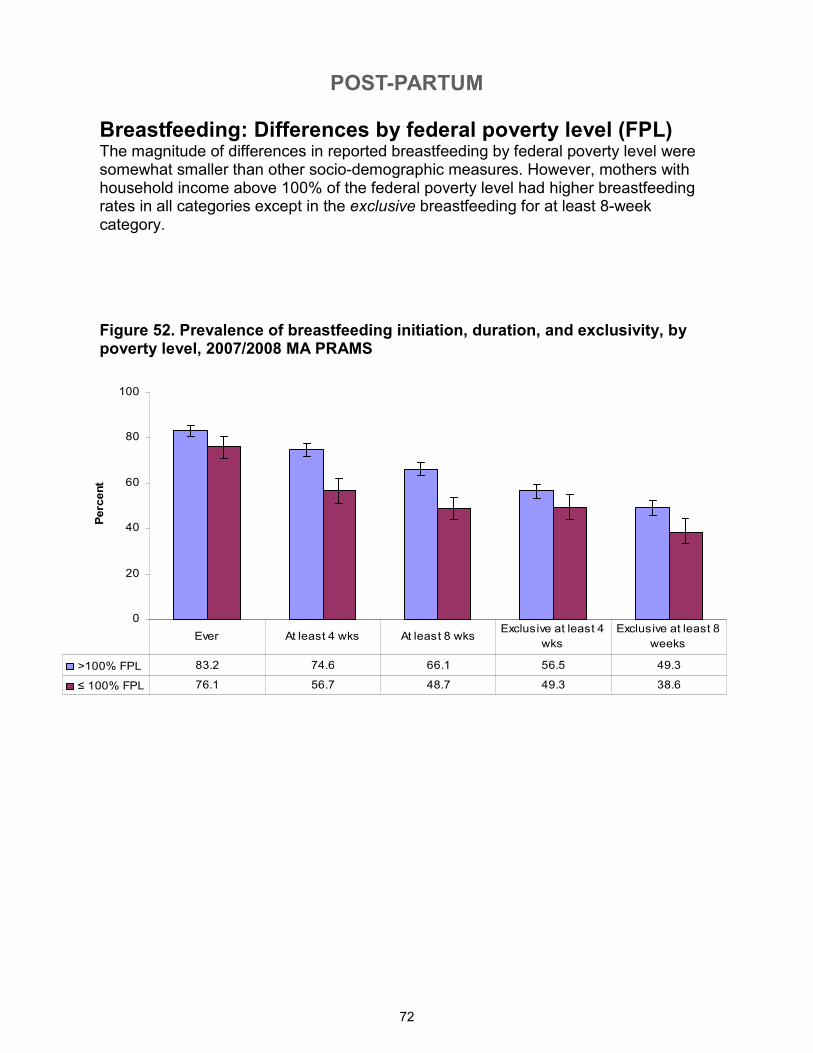
POST-PARTUM
72
Breastfeeding: Differences by federal poverty level (FPL) The magnitude of differences in reported breastfeeding by federal poverty level were somewhat smaller than other socio-demographic measures. However, mothers with household income above 100% of the federal poverty level had higher breastfeeding rates in all categories except in the exclusive breastfeeding for at least 8-week category.
Figure 52. Prevalence of breastfeeding initiation, duration, and exclusivity, by poverty level, 2007/2008 MA PRAMS
0
20
40
60
80
100
Percent
>100% FPL 83.2 74.6 66.1 56.5 49.3
≤ 100% FPL 76.1 56.7 48.7 49.3 38.6
Ever At least 4 wks At least 8 wksExclusive at least 4
wks
Exclusive at least 8
weeks
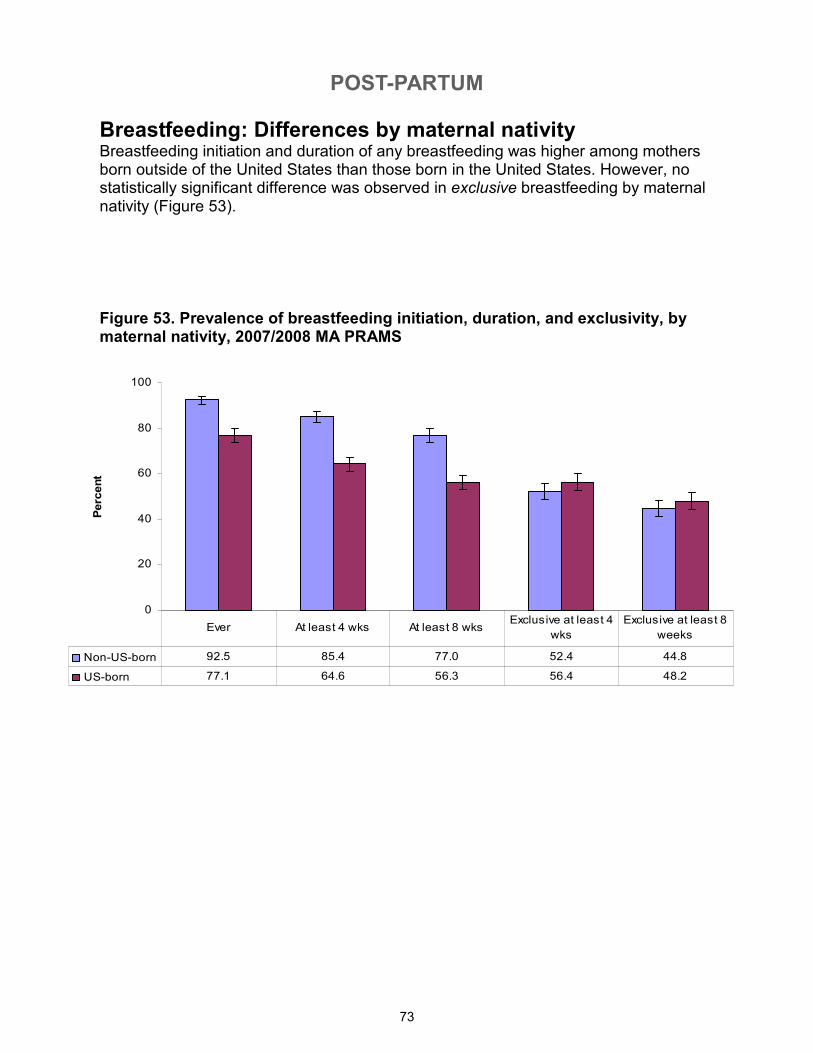
POST-PARTUM
73
Breastfeeding: Differences by maternal nativity Breastfeeding initiation and duration of any breastfeeding was higher among mothers born outside of the United States than those born in the United States. However, no statistically significant difference was observed in exclusive breastfeeding by maternal nativity (Figure 53).
Figure 53. Prevalence of breastfeeding initiation, duration, and exclusivity, by maternal nativity, 2007/2008 MA PRAMS
0
20
40
60
80
100
Percent
Non-US-born 92.5 85.4 77.0 52.4 44.8
US-born 77.1 64.6 56.3 56.4 48.2
Ever At least 4 wks At least 8 wksExclusive at least 4
wks
Exclusive at least 8
weeks
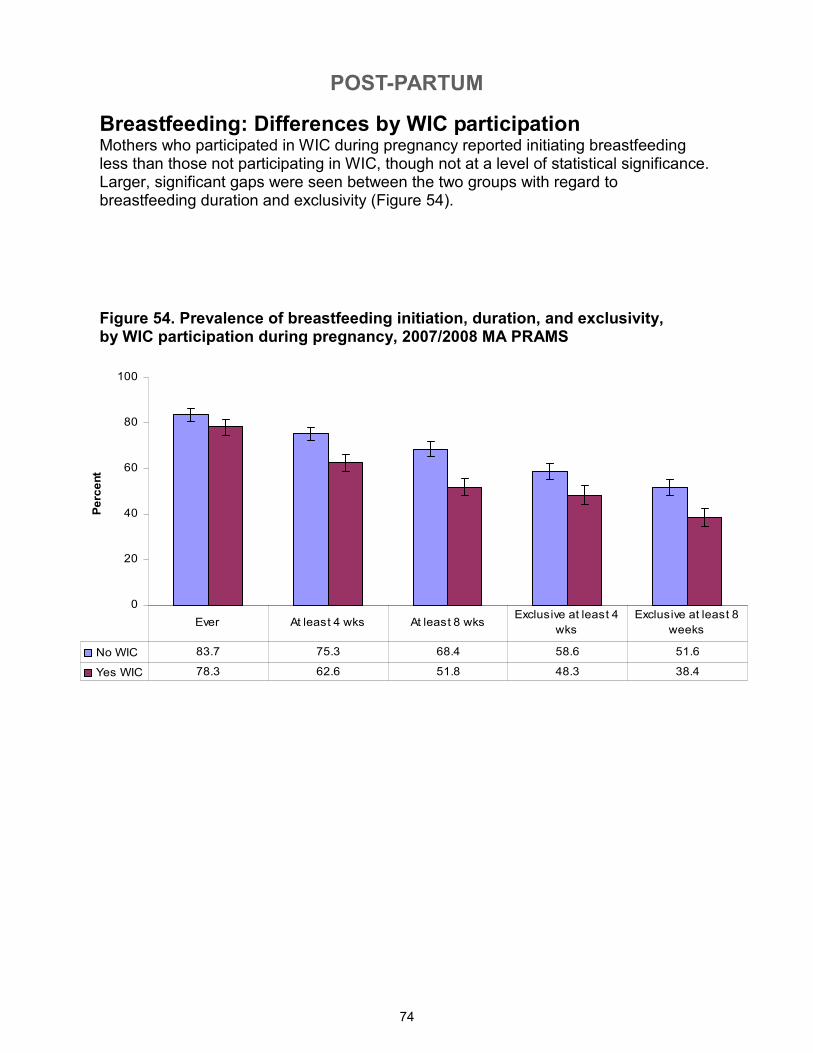
POST-PARTUM
74
Breastfeeding: Differences by WIC participation Mothers who participated in WIC during pregnancy reported initiating breastfeeding less than those not participating in WIC, though not at a level of statistical significance. Larger, significant gaps were seen between the two groups with regard to breastfeeding duration and exclusivity (Figure 54).
Figure 54. Prevalence of breastfeeding initiation, duration, and exclusivity, by WIC participation during pregnancy, 2007/2008 MA PRAMS
0
20
40
60
80
100
Percent
No WIC 83.7 75.3 68.4 58.6 51.6
Yes WIC 78.3 62.6 51.8 48.3 38.4
Ever At least 4 wks At least 8 wksExclusive at least 4
wks
Exclusive at least 8
weeks
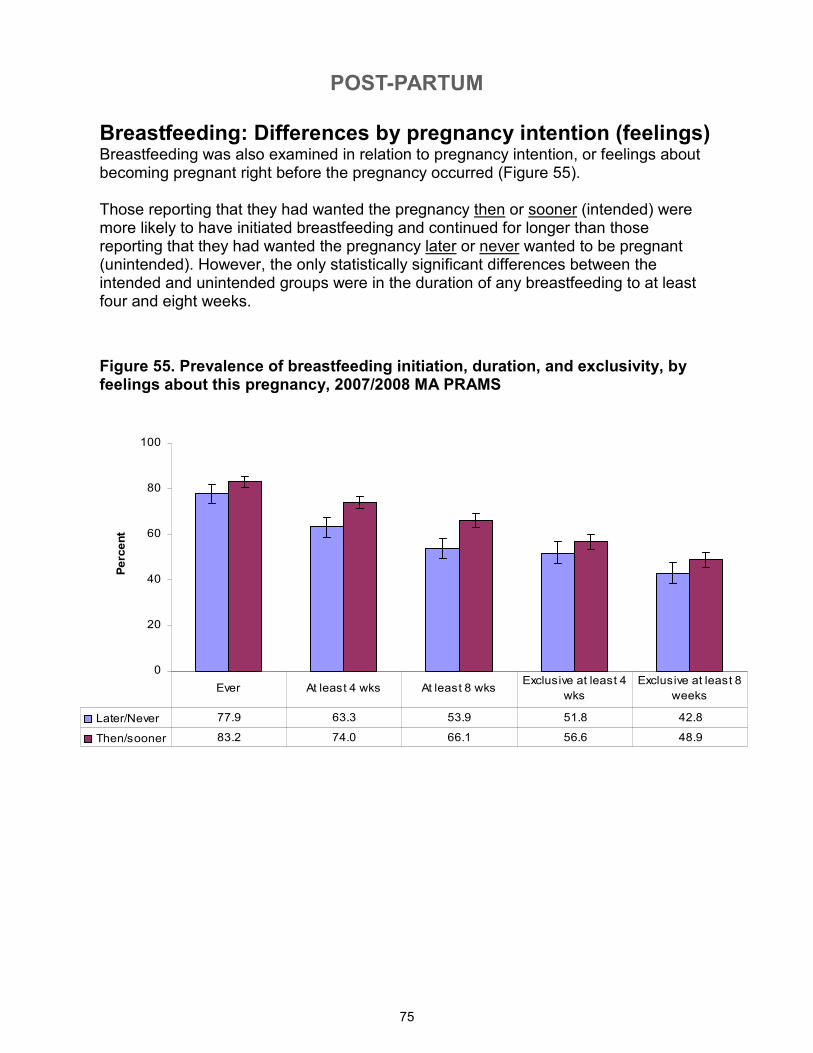
POST-PARTUM
75
Breastfeeding: Differences by pregnancy intention (feelings) Breastfeeding was also examined in relation to pregnancy intention, or feelings about becoming pregnant right before the pregnancy occurred (Figure 55). Those reporting that they had wanted the pregnancy then or sooner (intended) were more likely to have initiated breastfeeding and continued for longer than those reporting that they had wanted the pregnancy later or never wanted to be pregnant (unintended). However, the only statistically significant differences between the intended and unintended groups were in the duration of any breastfeeding to at least four and eight weeks.
Figure 55. Prevalence of breastfeeding initiation, duration, and exclusivity, by feelings about this pregnancy, 2007/2008 MA PRAMS
0
20
40
60
80
100
Percent
Later/Never 77.9 63.3 53.9 51.8 42.8
Then/sooner 83.2 74.0 66.1 56.6 48.9
Ever At least 4 wks At least 8 wksExclusive at least 4
wks
Exclusive at least 8
weeks
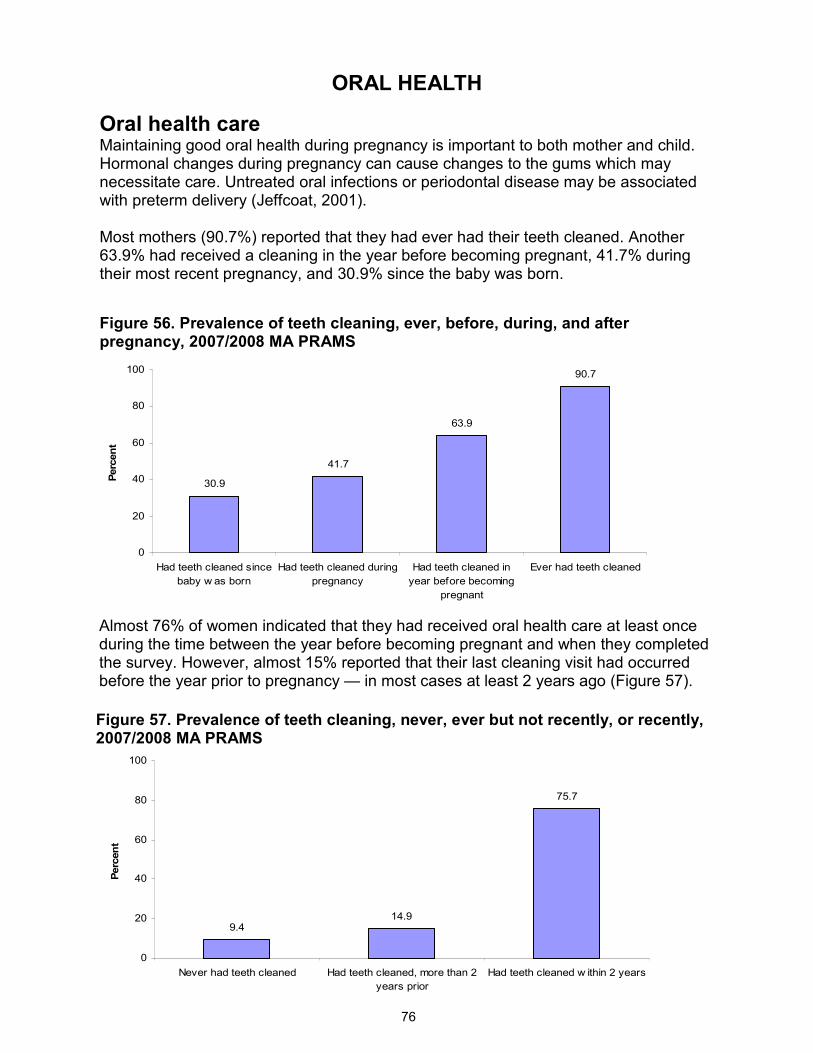
ORAL HEALTH
76
9.414.9
75.7
0
20
40
60
80
100
Never had teeth cleaned Had teeth cleaned, more than 2
years prior
Had teeth cleaned w ithin 2 years
Percent
30.9
41.7
63.9
90.7
0
20
40
60
80
100
Had teeth cleaned since
baby w as born
Had teeth cleaned during
pregnancy
Had teeth cleaned in
year before becoming
pregnant
Ever had teeth cleaned
Percent
Figure 56. Prevalence of teeth cleaning, ever, before, during, and after pregnancy, 2007/2008 MA PRAMS
Oral health care Maintaining good oral health during pregnancy is important to both mother and child. Hormonal changes during pregnancy can cause changes to the gums which may necessitate care. Untreated oral infections or periodontal disease may be associated with preterm delivery (Jeffcoat, 2001). Most mothers (90.7%) reported that they had ever had their teeth cleaned. Another 63.9% had received a cleaning in the year before becoming pregnant, 41.7% during their most recent pregnancy, and 30.9% since the baby was born.
Figure 57. Prevalence of teeth cleaning, never, ever but not recently, or recently, 2007/2008 MA PRAMS
Almost 76% of women indicated that they had received oral health care at least once during the time between the year before becoming pregnant and when they completed the survey. However, almost 15% reported that their last cleaning visit had occurred before the year prior to pregnancy — in most cases at least 2 years ago (Figure 57).
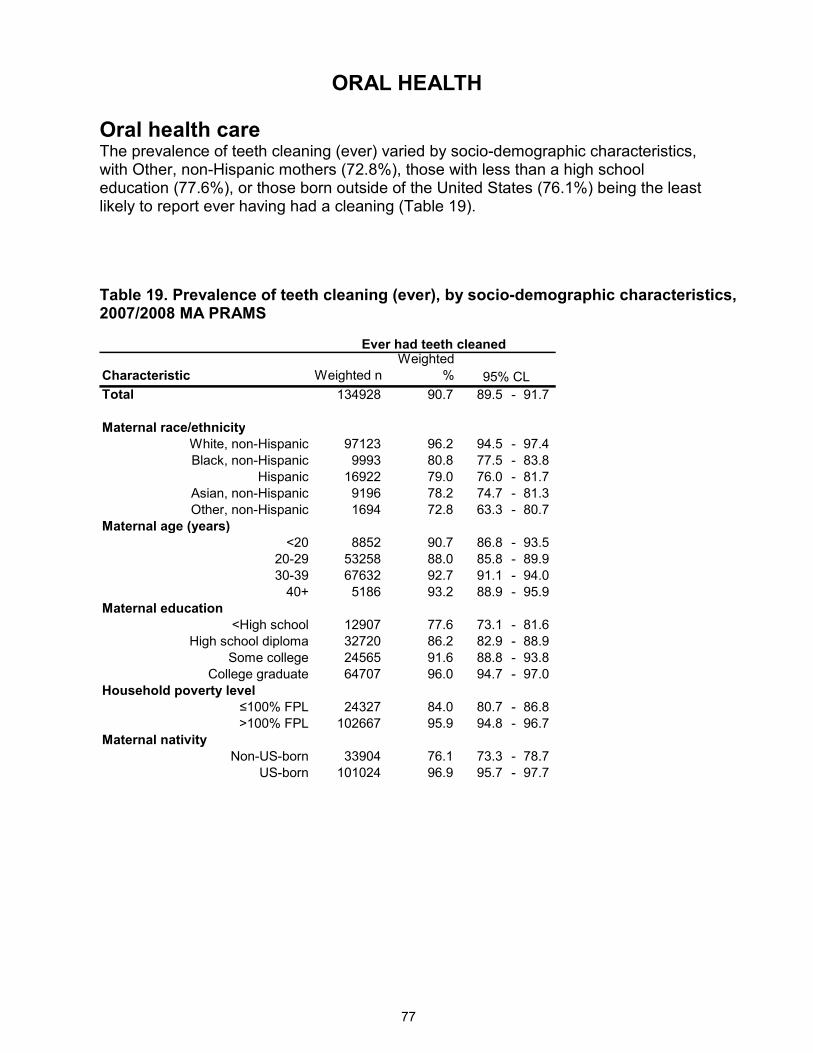
ORAL HEALTH
77
Oral health care The prevalence of teeth cleaning (ever) varied by socio-demographic characteristics, with Other, non-Hispanic mothers (72.8%), those with less than a high school education (77.6%), or those born outside of the United States (76.1%) being the least likely to report ever having had a cleaning (Table 19).
Table 19. Prevalence of teeth cleaning (ever), by socio-demographic characteristics, 2007/2008 MA PRAMS
Characteristic Weighted n
Weighted
%
Total 134928 90.7 89.5 - 91.7
Maternal race/ethnicity
White, non-Hispanic 97123 96.2 94.5 - 97.4
Black, non-Hispanic 9993 80.8 77.5 - 83.8
Hispanic 16922 79.0 76.0 - 81.7
Asian, non-Hispanic 9196 78.2 74.7 - 81.3
Other, non-Hispanic 1694 72.8 63.3 - 80.7
Maternal age (years)
<20 8852 90.7 86.8 - 93.5
20-29 53258 88.0 85.8 - 89.9
30-39 67632 92.7 91.1 - 94.0
40+ 5186 93.2 88.9 - 95.9
Maternal education
<High school 12907 77.6 73.1 - 81.6
High school diploma 32720 86.2 82.9 - 88.9
Some college 24565 91.6 88.8 - 93.8
College graduate 64707 96.0 94.7 - 97.0
Household poverty level
≤100% FPL 24327 84.0 80.7 - 86.8
>100% FPL 102667 95.9 94.8 - 96.7
Maternal nativity
Non-US-born 33904 76.1 73.3 - 78.7
US-born 101024 96.9 95.7 - 97.7
Ever had teeth cleaned
95% CL
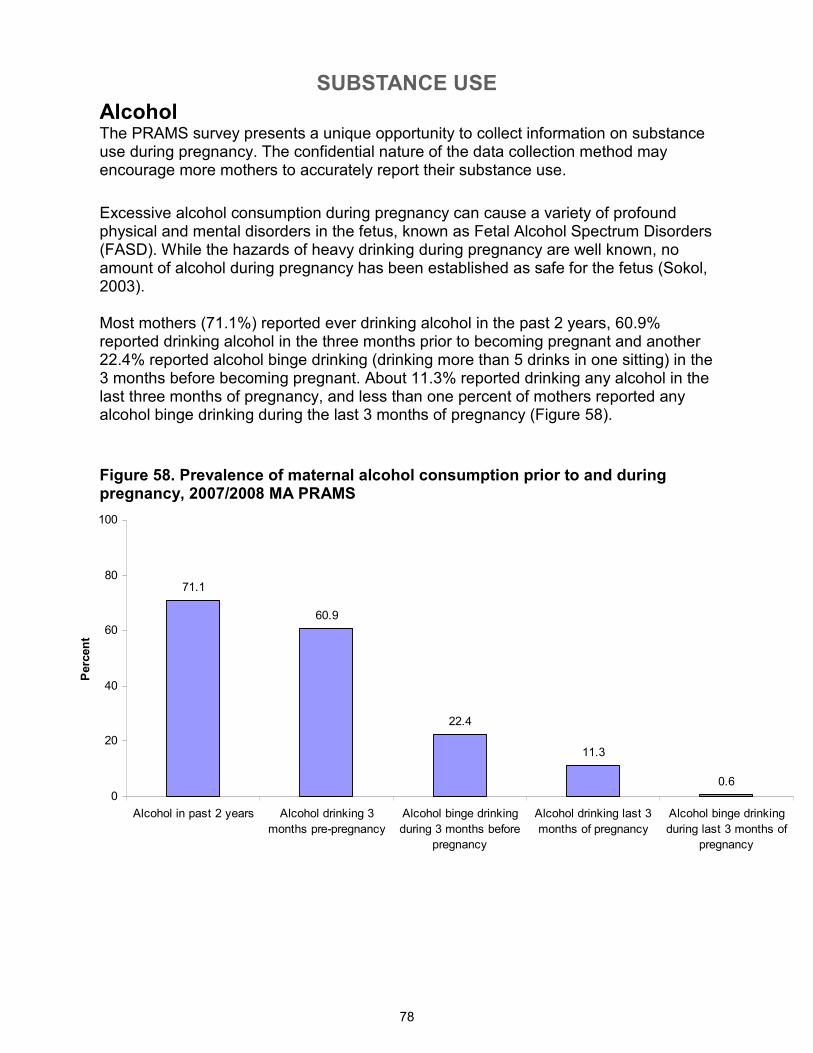
SUBSTANCE USE
78
71.1
60.9
22.4
11.3
0.60
20
40
60
80
100
Alcohol in past 2 years Alcohol drinking 3
months pre-pregnancy
Alcohol binge drinking
during 3 months before
pregnancy
Alcohol drinking last 3
months of pregnancy
Alcohol binge drinking
during last 3 months of
pregnancy
Percent
Alcohol The PRAMS survey presents a unique opportunity to collect information on substance use during pregnancy. The confidential nature of the data collection method may encourage more mothers to accurately report their substance use.
Excessive alcohol consumption during pregnancy can cause a variety of profound physical and mental disorders in the fetus, known as Fetal Alcohol Spectrum Disorders (FASD). While the hazards of heavy drinking during pregnancy are well known, no amount of alcohol during pregnancy has been established as safe for the fetus (Sokol, 2003). Most mothers (71.1%) reported ever drinking alcohol in the past 2 years, 60.9% reported drinking alcohol in the three months prior to becoming pregnant and another 22.4% reported alcohol binge drinking (drinking more than 5 drinks in one sitting) in the 3 months before becoming pregnant. About 11.3% reported drinking any alcohol in the last three months of pregnancy, and less than one percent of mothers reported any alcohol binge drinking during the last 3 months of pregnancy (Figure 58).
Figure 58. Prevalence of maternal alcohol consumption prior to and during pregnancy, 2007/2008 MA PRAMS
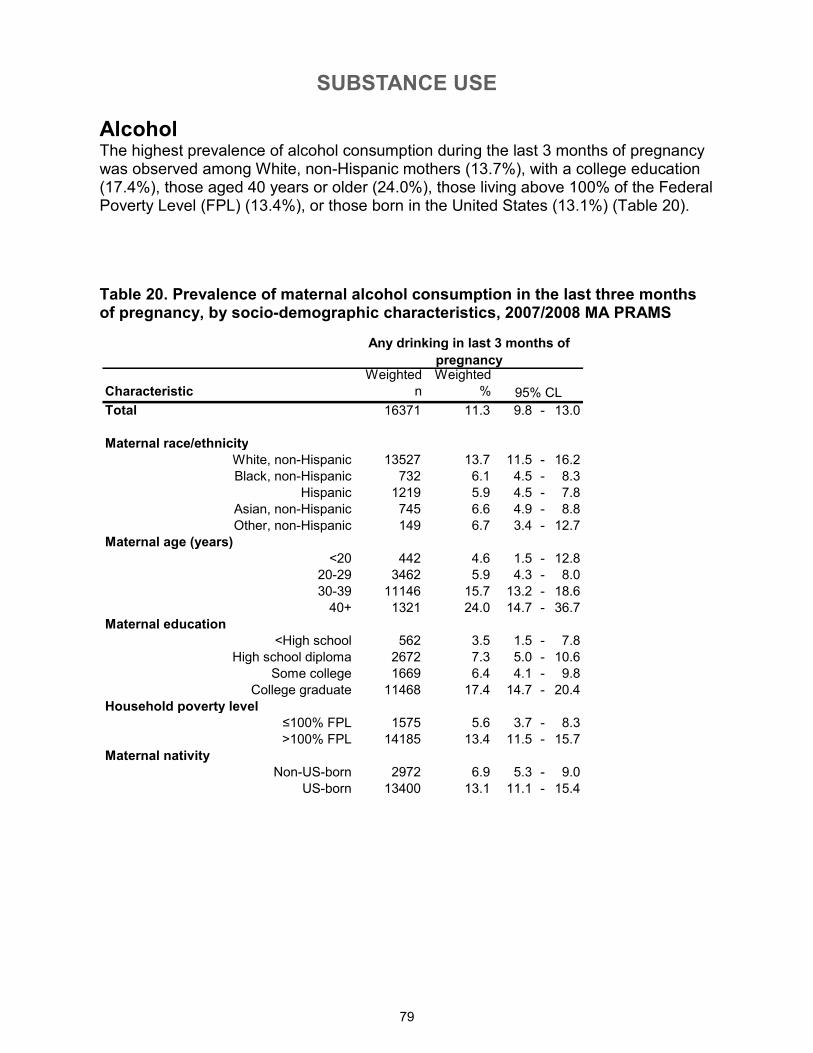
SUBSTANCE USE
79
Alcohol The highest prevalence of alcohol consumption during the last 3 months of pregnancy was observed among White, non-Hispanic mothers (13.7%), with a college education (17.4%), those aged 40 years or older (24.0%), those living above 100% of the Federal Poverty Level (FPL) (13.4%), or those born in the United States (13.1%) (Table 20).
Table 20. Prevalence of maternal alcohol consumption in the last three months of pregnancy, by socio-demographic characteristics, 2007/2008 MA PRAMS
Characteristic
Weighted
n
Weighted
%
Total 16371 11.3 9.8 - 13.0
Maternal race/ethnicity
White, non-Hispanic 13527 13.7 11.5 - 16.2
Black, non-Hispanic 732 6.1 4.5 - 8.3
Hispanic 1219 5.9 4.5 - 7.8
Asian, non-Hispanic 745 6.6 4.9 - 8.8
Other, non-Hispanic 149 6.7 3.4 - 12.7
Maternal age (years)
<20 442 4.6 1.5 - 12.8
20-29 3462 5.9 4.3 - 8.0
30-39 11146 15.7 13.2 - 18.6
40+ 1321 24.0 14.7 - 36.7
Maternal education
<High school 562 3.5 1.5 - 7.8
High school diploma 2672 7.3 5.0 - 10.6
Some college 1669 6.4 4.1 - 9.8
College graduate 11468 17.4 14.7 - 20.4
Household poverty level
≤100% FPL 1575 5.6 3.7 - 8.3
>100% FPL 14185 13.4 11.5 - 15.7
Maternal nativity
Non-US-born 2972 6.9 5.3 - 9.0
US-born 13400 13.1 11.1 - 15.4
Any drinking in last 3 months of
pregnancy
95% CL
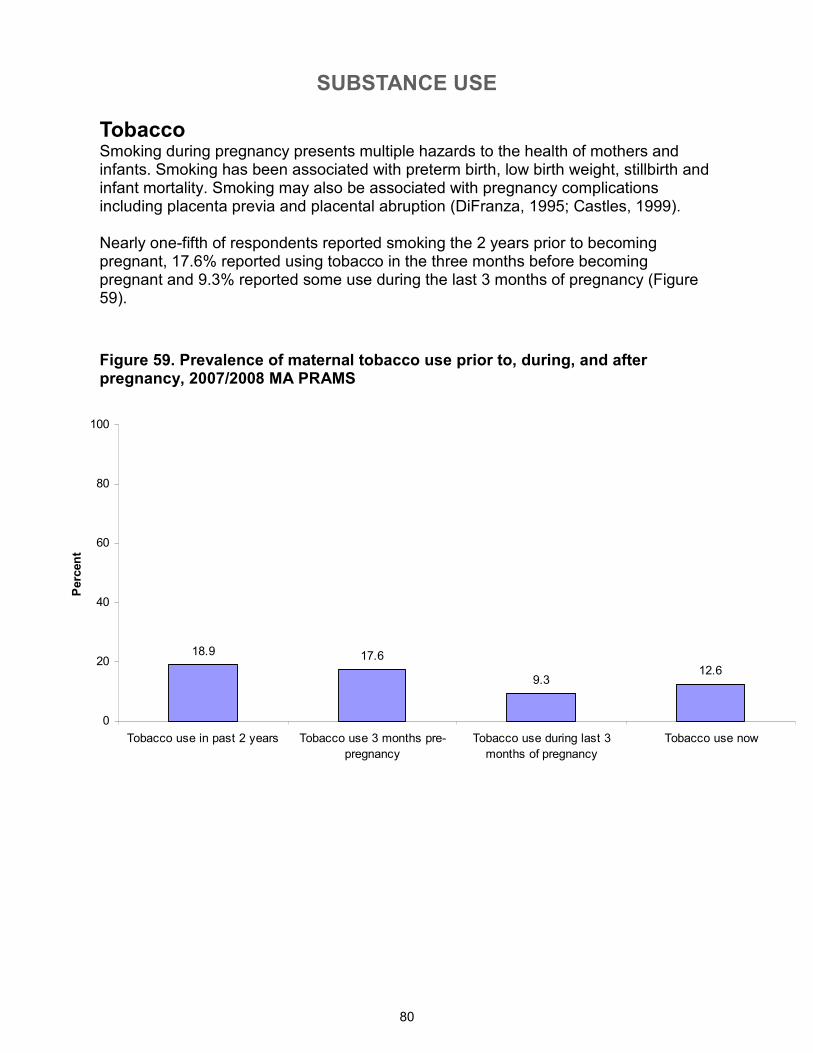
SUBSTANCE USE
80
Tobacco Smoking during pregnancy presents multiple hazards to the health of mothers and infants. Smoking has been associated with preterm birth, low birth weight, stillbirth and infant mortality. Smoking may also be associated with pregnancy complications including placenta previa and placental abruption (DiFranza, 1995; Castles, 1999). Nearly one-fifth of respondents reported smoking the 2 years prior to becoming pregnant, 17.6% reported using tobacco in the three months before becoming pregnant and 9.3% reported some use during the last 3 months of pregnancy (Figure 59).
Figure 59. Prevalence of maternal tobacco use prior to, during, and after pregnancy, 2007/2008 MA PRAMS
18.9 17.6
9.312.6
0
20
40
60
80
100
Tobacco use in past 2 years Tobacco use 3 months pre-
pregnancy
Tobacco use during last 3
months of pregnancy
Tobacco use now
Percent
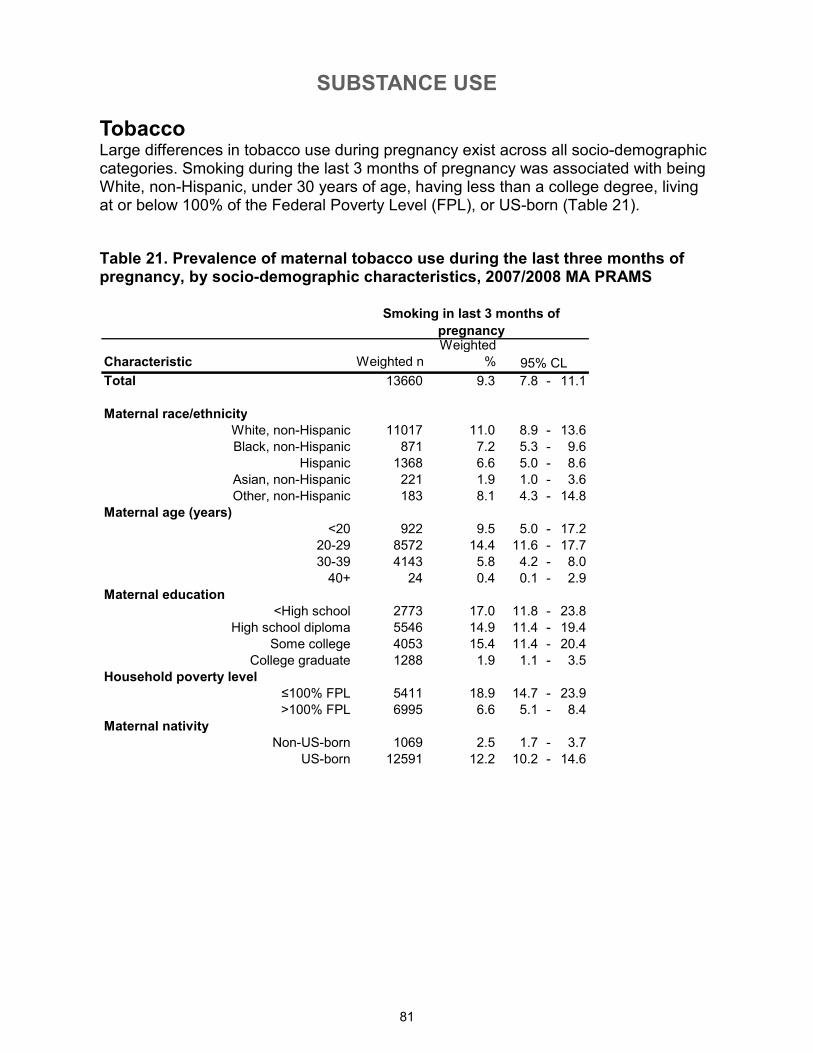
SUBSTANCE USE
81
Characteristic Weighted n
Weighted
%
Total 13660 9.3 7.8 - 11.1
Maternal race/ethnicity
White, non-Hispanic 11017 11.0 8.9 - 13.6
Black, non-Hispanic 871 7.2 5.3 - 9.6
Hispanic 1368 6.6 5.0 - 8.6
Asian, non-Hispanic 221 1.9 1.0 - 3.6
Other, non-Hispanic 183 8.1 4.3 - 14.8
Maternal age (years)
<20 922 9.5 5.0 - 17.2
20-29 8572 14.4 11.6 - 17.7
30-39 4143 5.8 4.2 - 8.0
40+ 24 0.4 0.1 - 2.9
Maternal education
<High school 2773 17.0 11.8 - 23.8
High school diploma 5546 14.9 11.4 - 19.4
Some college 4053 15.4 11.4 - 20.4
College graduate 1288 1.9 1.1 - 3.5
Household poverty level
≤100% FPL 5411 18.9 14.7 - 23.9
>100% FPL 6995 6.6 5.1 - 8.4
Maternal nativity
Non-US-born 1069 2.5 1.7 - 3.7
US-born 12591 12.2 10.2 - 14.6
Smoking in last 3 months of
pregnancy
95% CL
Tobacco Large differences in tobacco use during pregnancy exist across all socio-demographic categories. Smoking during the last 3 months of pregnancy was associated with being White, non-Hispanic, under 30 years of age, having less than a college degree, living at or below 100% of the Federal Poverty Level (FPL), or US-born (Table 21).
Table 21. Prevalence of maternal tobacco use during the last three months of pregnancy, by socio-demographic characteristics, 2007/2008 MA PRAMS
82
Appendix A. Supplemental Data Tables*
*The following data tables reflect questions in the order that they appear in the Massachusetts PRAMS 2007/2008 survey.
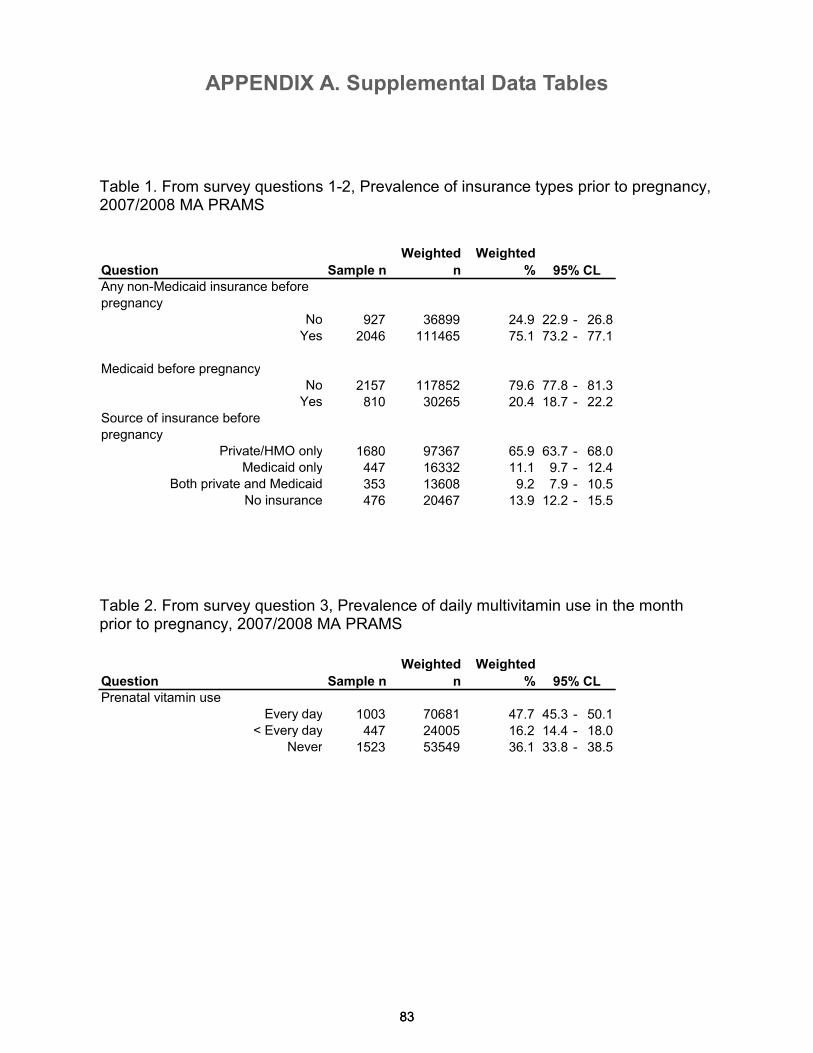
APPENDIX A. Supplemental Data Tables
83
Question Sample n
Weighted
n
Weighted
%
Any non-Medicaid insurance before
pregnancy
No 927 36899 24.9 22.9 - 26.8Yes 2046 111465 75.1 73.2 - 77.1
Medicaid before pregnancy
No 2157 117852 79.6 77.8 - 81.3Yes 810 30265 20.4 18.7 - 22.2
Source of insurance before
pregnancy
Private/HMO only 1680 97367 65.9 63.7 - 68.0Medicaid only 447 16332 11.1 9.7 - 12.4
Both private and Medicaid 353 13608 9.2 7.9 - 10.5No insurance 476 20467 13.9 12.2 - 15.5
Question Sample n
Weighted
n
Weighted
%
Prenatal vitamin use
Every day 1003 70681 47.7 45.3 - 50.1< Every day 447 24005 16.2 14.4 - 18.0
Never 1523 53549 36.1 33.8 - 38.5
95% CL
95% CL
Table 1. From survey questions 1-2, Prevalence of insurance types prior to pregnancy, 2007/2008 MA PRAMS
Table 2. From survey question 3, Prevalence of daily multivitamin use in the month prior to pregnancy, 2007/2008 MA PRAMS
83
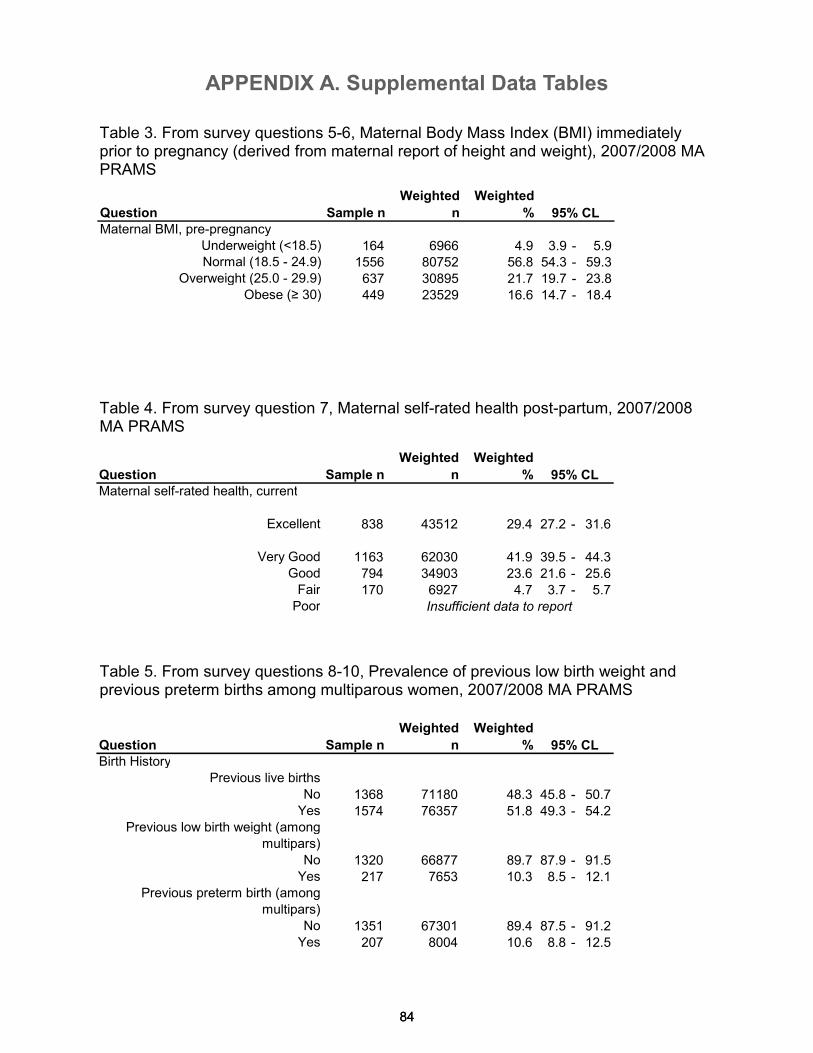
APPENDIX A. Supplemental Data Tables
84
Question Sample n
Weighted
n
Weighted
%
Maternal BMI, pre-pregnancy
Underweight (<18.5) 164 6966 4.9 3.9 - 5.9Normal (18.5 - 24.9) 1556 80752 56.8 54.3 - 59.3
Overweight (25.0 - 29.9) 637 30895 21.7 19.7 - 23.8Obese (≥ 30) 449 23529 16.6 14.7 - 18.4
95% CL
84
Table 3. From survey questions 5-6, Maternal Body Mass Index (BMI) immediately prior to pregnancy (derived from maternal report of height and weight), 2007/2008 MA PRAMS
Table 4. From survey question 7, Maternal self-rated health post-partum, 2007/2008 MA PRAMS
Table 5. From survey questions 8-10, Prevalence of previous low birth weight and previous preterm births among multiparous women, 2007/2008 MA PRAMS
Question Sample n
Weighted
n
Weighted
%
Maternal self-rated health, current
Excellent 838 43512 29.4 27.2 - 31.6
Very Good 1163 62030 41.9 39.5 - 44.3Good 794 34903 23.6 21.6 - 25.6Fair 170 6927 4.7 3.7 - 5.7Poor
95% CL
Insufficient data to report
Question Sample n
Weighted
n
Weighted
%
Birth History
Previous live births
No 1368 71180 48.3 45.8 - 50.7Yes 1574 76357 51.8 49.3 - 54.2
Previous low birth weight (among
multipars)
No 1320 66877 89.7 87.9 - 91.5Yes 217 7653 10.3 8.5 - 12.1
Previous preterm birth (among
multipars)
No 1351 67301 89.4 87.5 - 91.2Yes 207 8004 10.6 8.8 - 12.5
95% CL
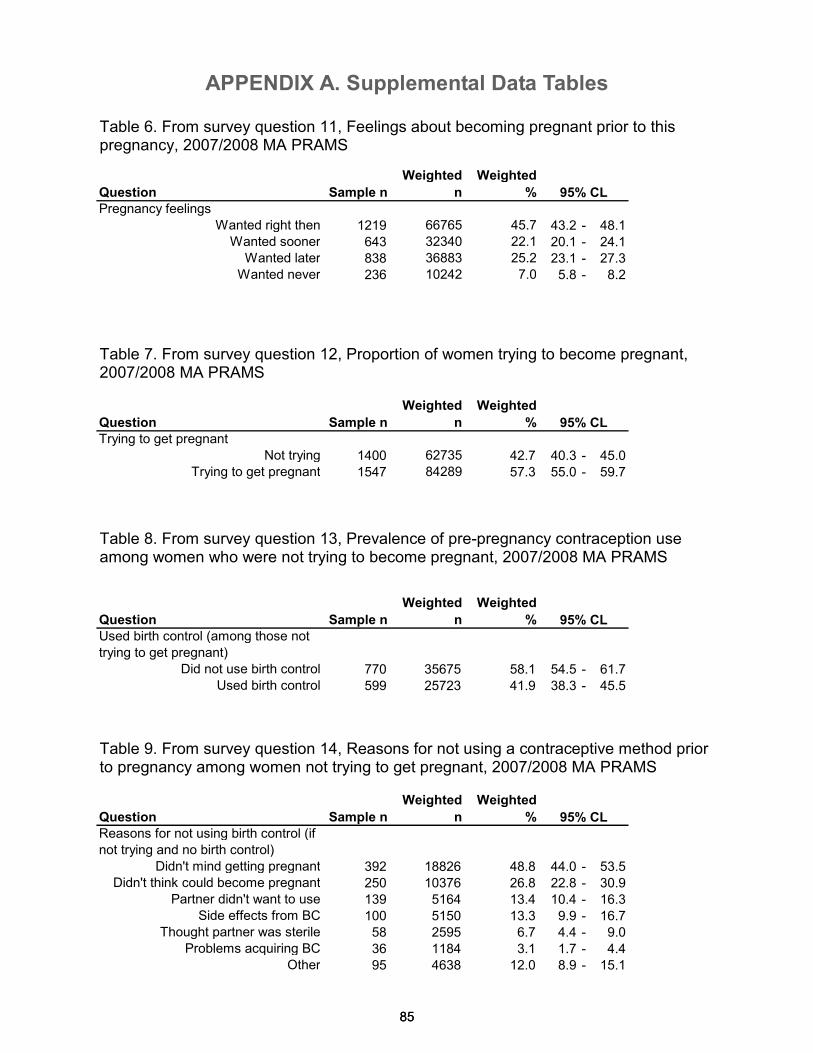
APPENDIX A. Supplemental Data Tables
85
Question Sample n
Weighted
n
Weighted
%
Pregnancy feelings
Wanted right then 1219 66765 45.7 43.2 - 48.1Wanted sooner 643 32340 22.1 20.1 - 24.1
Wanted later 838 36883 25.2 23.1 - 27.3Wanted never 236 10242 7.0 5.8 - 8.2
Question Sample n
Weighted
n
Weighted
%
Trying to get pregnant
Not trying 1400 62735 42.7 40.3 - 45.0Trying to get pregnant 1547 84289 57.3 55.0 - 59.7
Question Sample n
Weighted
n
Weighted
%
Used birth control (among those not
trying to get pregnant)
Did not use birth control 770 35675 58.1 54.5 - 61.7Used birth control 599 25723 41.9 38.3 - 45.5
Question Sample n
Weighted
n
Weighted
%
Reasons for not using birth control (if
not trying and no birth control)
Didn't mind getting pregnant 392 18826 48.8 44.0 - 53.5Didn't think could become pregnant 250 10376 26.8 22.8 - 30.9
Partner didn't want to use 139 5164 13.4 10.4 - 16.3Side effects from BC 100 5150 13.3 9.9 - 16.7
Thought partner was sterile 58 2595 6.7 4.4 - 9.0Problems acquiring BC 36 1184 3.1 1.7 - 4.4
Other 95 4638 12.0 8.9 - 15.1
95% CL
95% CL
95% CL
95% CL
85
Table 6. From survey question 11, Feelings about becoming pregnant prior to this pregnancy, 2007/2008 MA PRAMS
Table 7. From survey question 12, Proportion of women trying to become pregnant, 2007/2008 MA PRAMS
Table 8. From survey question 13, Prevalence of pre-pregnancy contraception use among women who were not trying to become pregnant, 2007/2008 MA PRAMS
Table 9. From survey question 14, Reasons for not using a contraceptive method prior to pregnancy among women not trying to get pregnant, 2007/2008 MA PRAMS
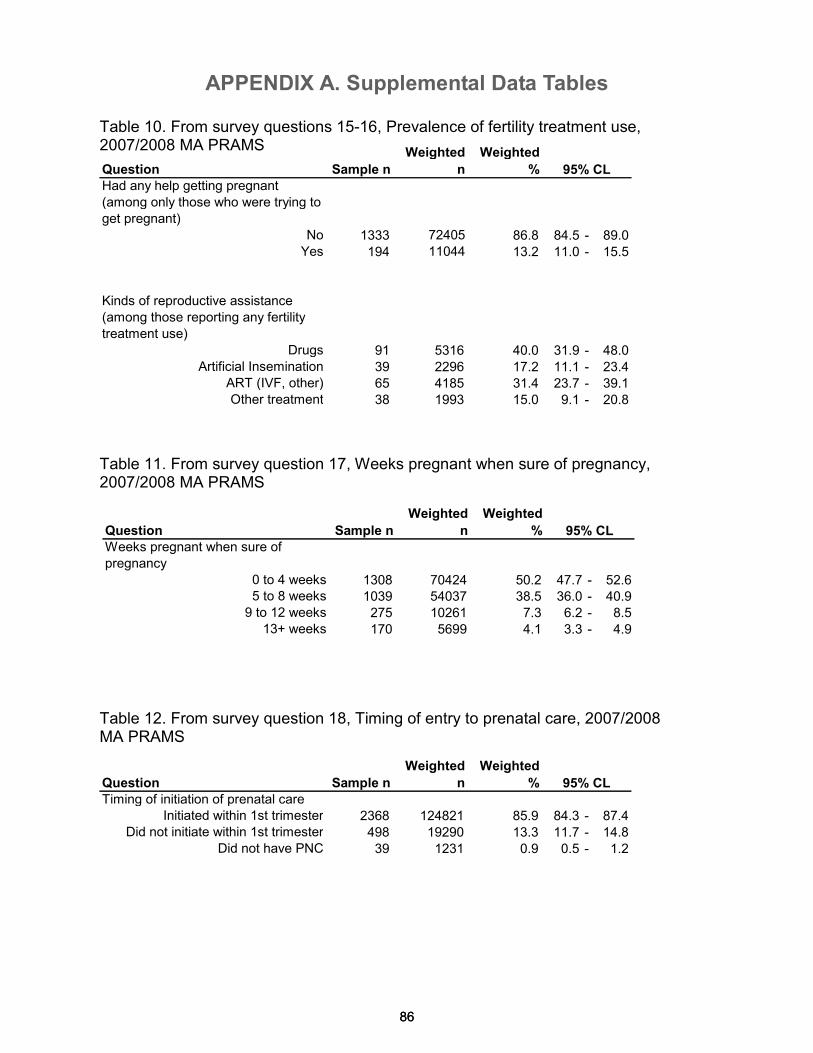
APPENDIX A. Supplemental Data Tables
86
Question Sample n
Weighted
n
Weighted
%
Had any help getting pregnant
(among only those who were trying to
get pregnant)
No 1333 72405 86.8 84.5 - 89.0Yes 194 11044 13.2 11.0 - 15.5
Kinds of reproductive assistance
(among those reporting any fertility
treatment use)
Drugs 91 5316 40.0 31.9 - 48.0Artificial Insemination 39 2296 17.2 11.1 - 23.4
ART (IVF, other) 65 4185 31.4 23.7 - 39.1Other treatment 38 1993 15.0 9.1 - 20.8
95% CL
86
Table 10. From survey questions 15-16, Prevalence of fertility treatment use, 2007/2008 MA PRAMS
Table 12. From survey question 18, Timing of entry to prenatal care, 2007/2008 MA PRAMS
Table 11. From survey question 17, Weeks pregnant when sure of pregnancy, 2007/2008 MA PRAMS
Question Sample n
Weighted
n
Weighted
%
Timing of initiation of prenatal careInitiated within 1st trimester 2368 124821 85.9 84.3 - 87.4
Did not initiate within 1st trimester 498 19290 13.3 11.7 - 14.8Did not have PNC 39 1231 0.9 0.5 - 1.2
95% CL
Question Sample n
Weighted
n
Weighted
%
Weeks pregnant when sure of
pregnancy
0 to 4 weeks 1308 70424 50.2 47.7 - 52.65 to 8 weeks 1039 54037 38.5 36.0 - 40.99 to 12 weeks 275 10261 7.3 6.2 - 8.5
13+ weeks 170 5699 4.1 3.3 - 4.9
95% CL
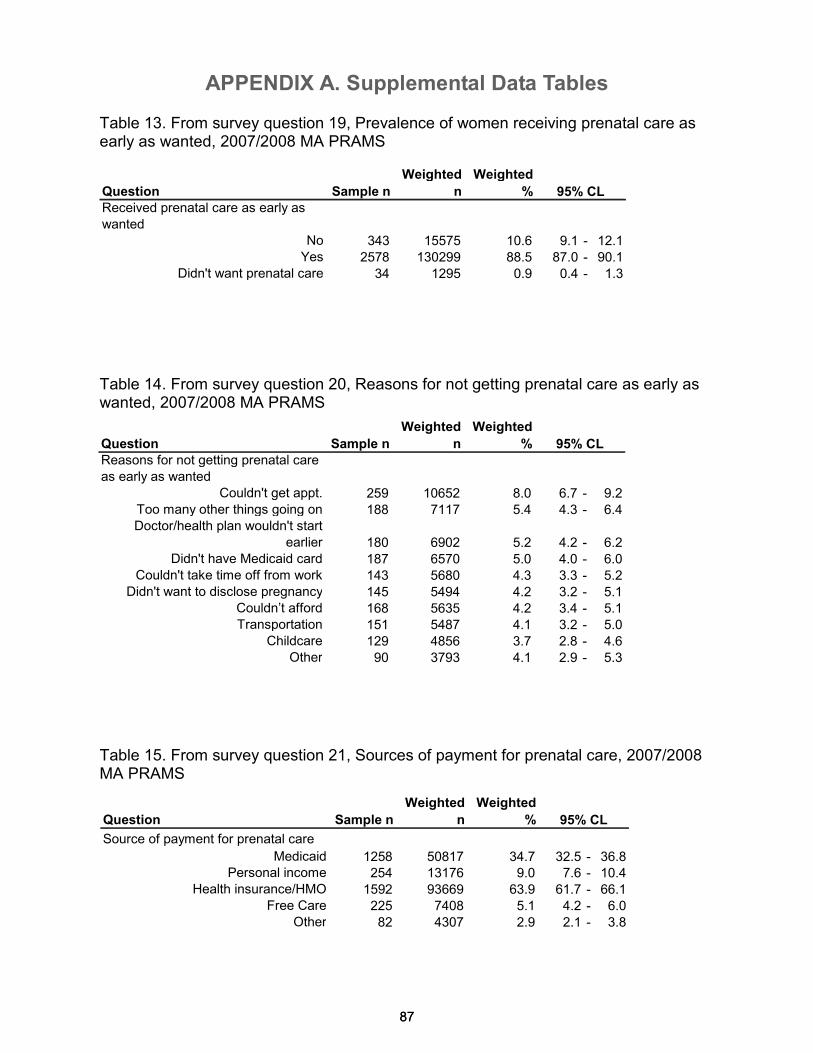
APPENDIX A. Supplemental Data Tables
87 87
Table 13. From survey question 19, Prevalence of women receiving prenatal care as early as wanted, 2007/2008 MA PRAMS
Table 14. From survey question 20, Reasons for not getting prenatal care as early as wanted, 2007/2008 MA PRAMS
Table 15. From survey question 21, Sources of payment for prenatal care, 2007/2008 MA PRAMS
Question Sample n
Weighted
n
Weighted
%
Received prenatal care as early as
wantedNo 343 15575 10.6 9.1 - 12.1Yes 2578 130299 88.5 87.0 - 90.1
Didn't want prenatal care 34 1295 0.9 0.4 - 1.3
95% CL
Question Sample n
Weighted
n
Weighted
%
Reasons for not getting prenatal care
as early as wanted
Couldn't get appt. 259 10652 8.0 6.7 - 9.2Too many other things going on 188 7117 5.4 4.3 - 6.4Doctor/health plan wouldn't start
earlier 180 6902 5.2 4.2 - 6.2Didn't have Medicaid card 187 6570 5.0 4.0 - 6.0
Couldn't take time off from work 143 5680 4.3 3.3 - 5.2Didn't want to disclose pregnancy 145 5494 4.2 3.2 - 5.1
Couldn’t afford 168 5635 4.2 3.4 - 5.1Transportation 151 5487 4.1 3.2 - 5.0
Childcare 129 4856 3.7 2.8 - 4.6Other 90 3793 4.1 2.9 - 5.3
95% CL
Question Sample n
Weighted
n
Weighted
%
Source of payment for prenatal care
Medicaid 1258 50817 34.7 32.5 - 36.8Personal income 254 13176 9.0 7.6 - 10.4
Health insurance/HMO 1592 93669 63.9 61.7 - 66.1Free Care 225 7408 5.1 4.2 - 6.0
Other 82 4307 2.9 2.1 - 3.8
95% CL
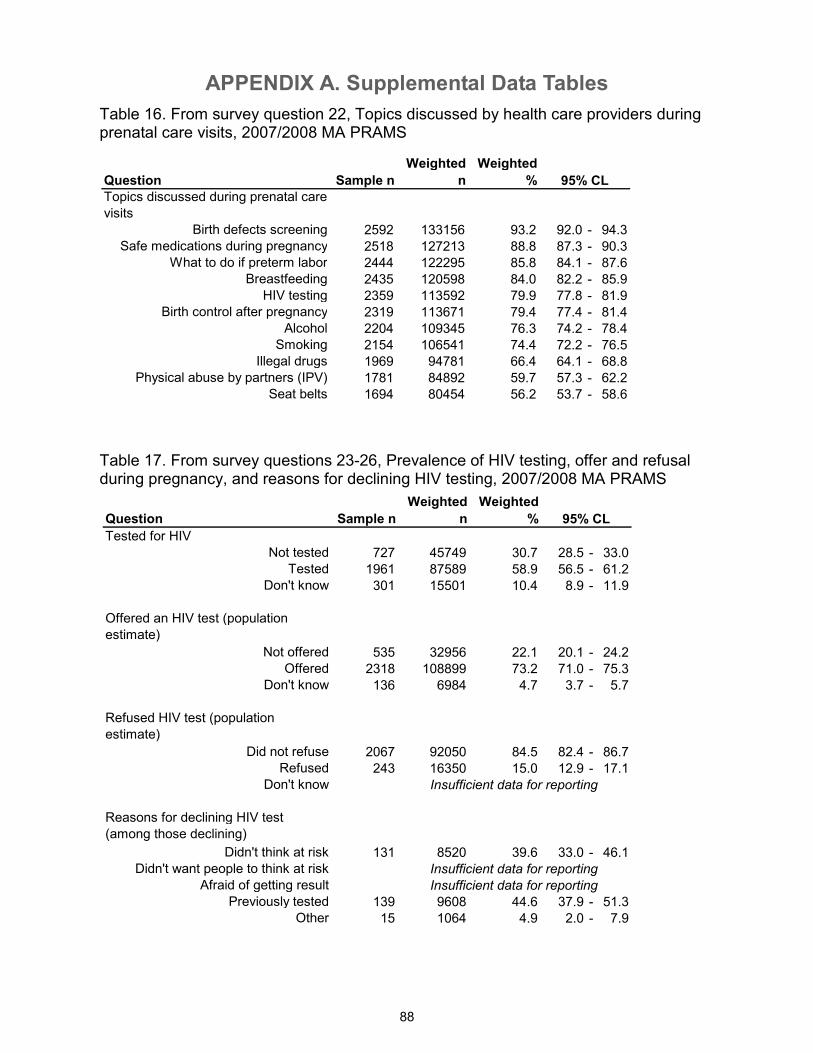
APPENDIX A. Supplemental Data Tables
88
Table 16. From survey question 22, Topics discussed by health care providers during prenatal care visits, 2007/2008 MA PRAMS
Table 17. From survey questions 23-26, Prevalence of HIV testing, offer and refusal during pregnancy, and reasons for declining HIV testing, 2007/2008 MA PRAMS
Question Sample n
Weighted
n
Weighted
%
Tested for HIV
Not tested 727 45749 30.7 28.5 - 33.0Tested 1961 87589 58.9 56.5 - 61.2
Don't know 301 15501 10.4 8.9 - 11.9
Offered an HIV test (population
estimate)
Not offered 535 32956 22.1 20.1 - 24.2Offered 2318 108899 73.2 71.0 - 75.3
Don't know 136 6984 4.7 3.7 - 5.7
Refused HIV test (population
estimate)
Did not refuse 2067 92050 84.5 82.4 - 86.7Refused 243 16350 15.0 12.9 - 17.1
Don't know
Reasons for declining HIV test
(among those declining)
Didn't think at risk 131 8520 39.6 33.0 - 46.1Didn't want people to think at risk
Afraid of getting result
Previously tested 139 9608 44.6 37.9 - 51.3Other 15 1064 4.9 2.0 - 7.9
95% CL
Insufficient data for reporting
Insufficient data for reporting
Insufficient data for reporting
Question Sample n
Weighted
n
Weighted
%
Topics discussed during prenatal care
visits
Birth defects screening 2592 133156 93.2 92.0 - 94.3Safe medications during pregnancy 2518 127213 88.8 87.3 - 90.3
What to do if preterm labor 2444 122295 85.8 84.1 - 87.6Breastfeeding 2435 120598 84.0 82.2 - 85.9
HIV testing 2359 113592 79.9 77.8 - 81.9Birth control after pregnancy 2319 113671 79.4 77.4 - 81.4
Alcohol 2204 109345 76.3 74.2 - 78.4Smoking 2154 106541 74.4 72.2 - 76.5
Illegal drugs 1969 94781 66.4 64.1 - 68.8Physical abuse by partners (IPV) 1781 84892 59.7 57.3 - 62.2
Seat belts 1694 80454 56.2 53.7 - 58.6
95% CL
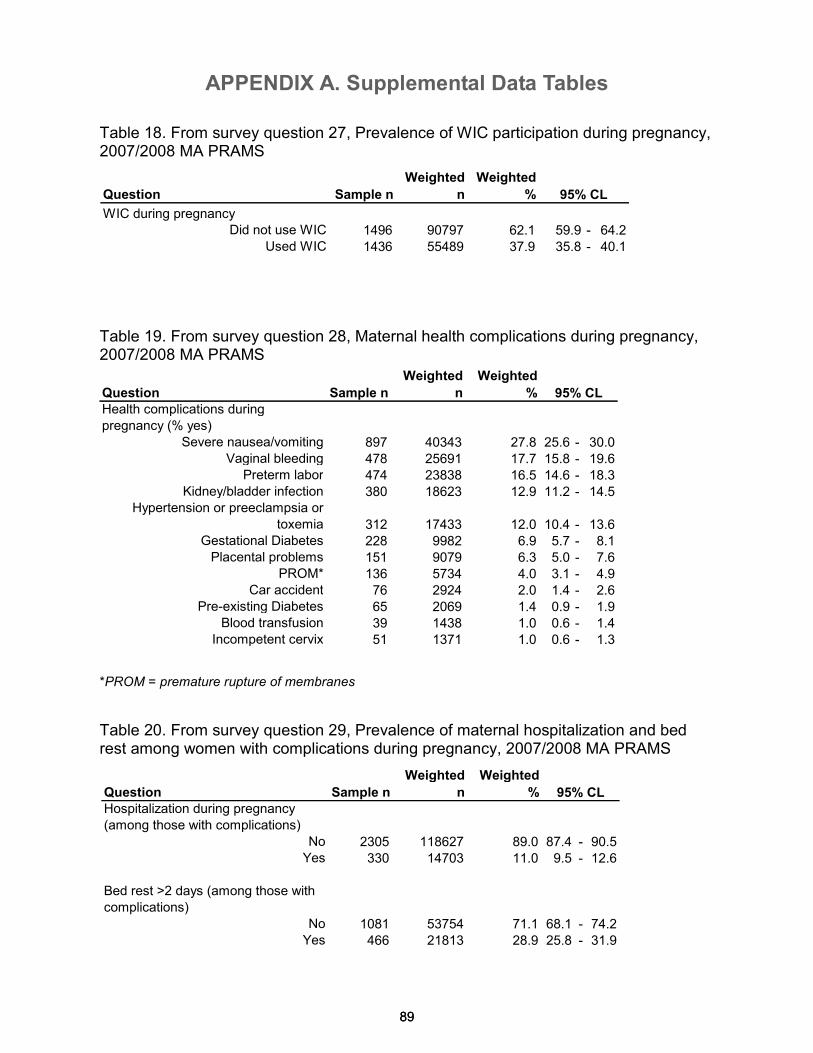
APPENDIX A. Supplemental Data Tables
89 89
Table 18. From survey question 27, Prevalence of WIC participation during pregnancy, 2007/2008 MA PRAMS
Table 19. From survey question 28, Maternal health complications during pregnancy, 2007/2008 MA PRAMS
Table 20. From survey question 29, Prevalence of maternal hospitalization and bed rest among women with complications during pregnancy, 2007/2008 MA PRAMS
*PROM = premature rupture of membranes
Question Sample n
Weighted
n
Weighted
%
Health complications during
pregnancy (% yes)
Severe nausea/vomiting 897 40343 27.8 25.6 - 30.0Vaginal bleeding 478 25691 17.7 15.8 - 19.6
Preterm labor 474 23838 16.5 14.6 - 18.3Kidney/bladder infection 380 18623 12.9 11.2 - 14.5
Hypertension or preeclampsia or
toxemia 312 17433 12.0 10.4 - 13.6Gestational Diabetes 228 9982 6.9 5.7 - 8.1Placental problems 151 9079 6.3 5.0 - 7.6
PROM* 136 5734 4.0 3.1 - 4.9Car accident 76 2924 2.0 1.4 - 2.6
Pre-existing Diabetes 65 2069 1.4 0.9 - 1.9Blood transfusion 39 1438 1.0 0.6 - 1.4
Incompetent cervix 51 1371 1.0 0.6 - 1.3
95% CL
Question Sample n
Weighted
n
Weighted
%
Hospitalization during pregnancy
(among those with complications)
No 2305 118627 89.0 87.4 - 90.5Yes 330 14703 11.0 9.5 - 12.6
Bed rest >2 days (among those with
complications)
No 1081 53754 71.1 68.1 - 74.2Yes 466 21813 28.9 25.8 - 31.9
95% CL
Question Sample n
Weighted
n
Weighted
%
WIC during pregnancyDid not use WIC 1496 90797 62.1 59.9 - 64.2
Used WIC 1436 55489 37.9 35.8 - 40.1
95% CL
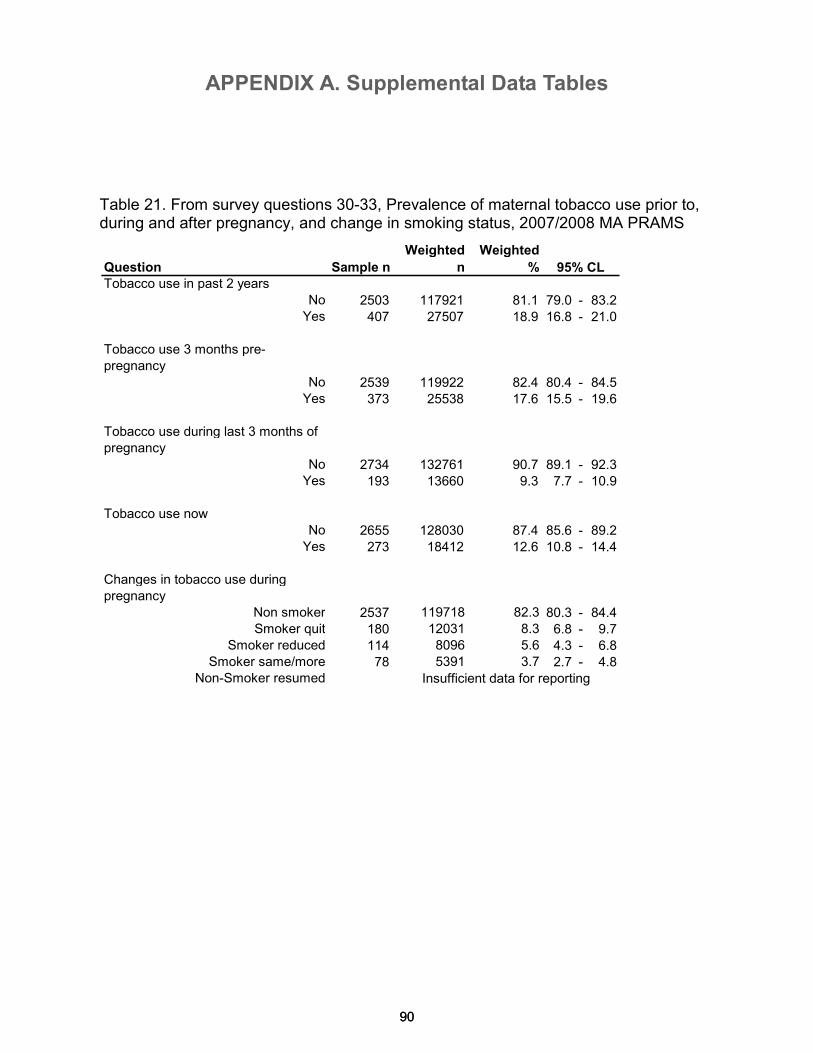
APPENDIX A. Supplemental Data Tables
90 90
Table 21. From survey questions 30-33, Prevalence of maternal tobacco use prior to, during and after pregnancy, and change in smoking status, 2007/2008 MA PRAMS
Question Sample n
Weighted
n
Weighted
%
Tobacco use in past 2 years
No 2503 117921 81.1 79.0 - 83.2Yes 407 27507 18.9 16.8 - 21.0
Tobacco use 3 months pre-
pregnancy
No 2539 119922 82.4 80.4 - 84.5Yes 373 25538 17.6 15.5 - 19.6
Tobacco use during last 3 months of
pregnancy
No 2734 132761 90.7 89.1 - 92.3Yes 193 13660 9.3 7.7 - 10.9
Tobacco use now
No 2655 128030 87.4 85.6 - 89.2Yes 273 18412 12.6 10.8 - 14.4
Changes in tobacco use during
pregnancy
Non smoker 2537 119718 82.3 80.3 - 84.4Smoker quit 180 12031 8.3 6.8 - 9.7
Smoker reduced 114 8096 5.6 4.3 - 6.8Smoker same/more 78 5391 3.7 2.7 - 4.8
Non-Smoker resumed
95% CL
Insufficient data for reporting
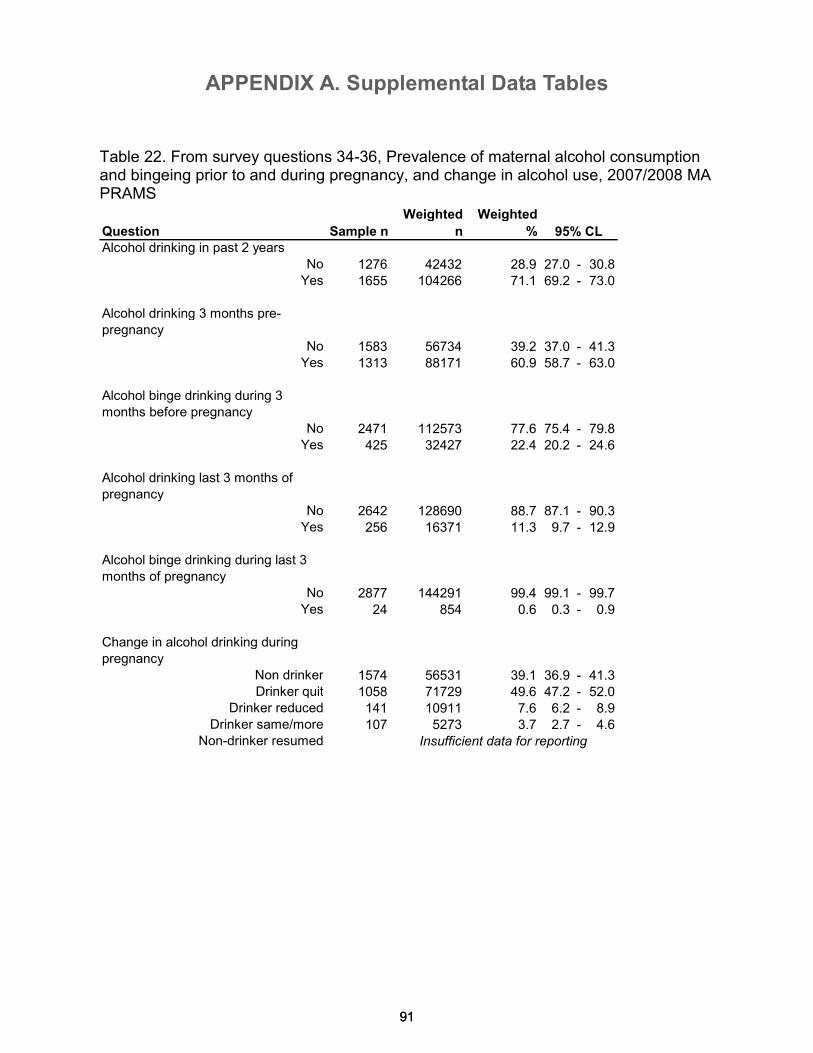
APPENDIX A. Supplemental Data Tables
91 91
Table 22. From survey questions 34-36, Prevalence of maternal alcohol consumption and bingeing prior to and during pregnancy, and change in alcohol use, 2007/2008 MA PRAMS
Question Sample n
Weighted
n
Weighted
%
Alcohol drinking in past 2 years
No 1276 42432 28.9 27.0 - 30.8Yes 1655 104266 71.1 69.2 - 73.0
Alcohol drinking 3 months pre-
pregnancy
No 1583 56734 39.2 37.0 - 41.3Yes 1313 88171 60.9 58.7 - 63.0
Alcohol binge drinking during 3
months before pregnancy
No 2471 112573 77.6 75.4 - 79.8Yes 425 32427 22.4 20.2 - 24.6
Alcohol drinking last 3 months of
pregnancy
No 2642 128690 88.7 87.1 - 90.3Yes 256 16371 11.3 9.7 - 12.9
Alcohol binge drinking during last 3
months of pregnancy
No 2877 144291 99.4 99.1 - 99.7Yes 24 854 0.6 0.3 - 0.9
Change in alcohol drinking during
pregnancy
Non drinker 1574 56531 39.1 36.9 - 41.3Drinker quit 1058 71729 49.6 47.2 - 52.0
Drinker reduced 141 10911 7.6 6.2 - 8.9Drinker same/more 107 5273 3.7 2.7 - 4.6
Non-drinker resumed Insufficient data for reporting
95% CL
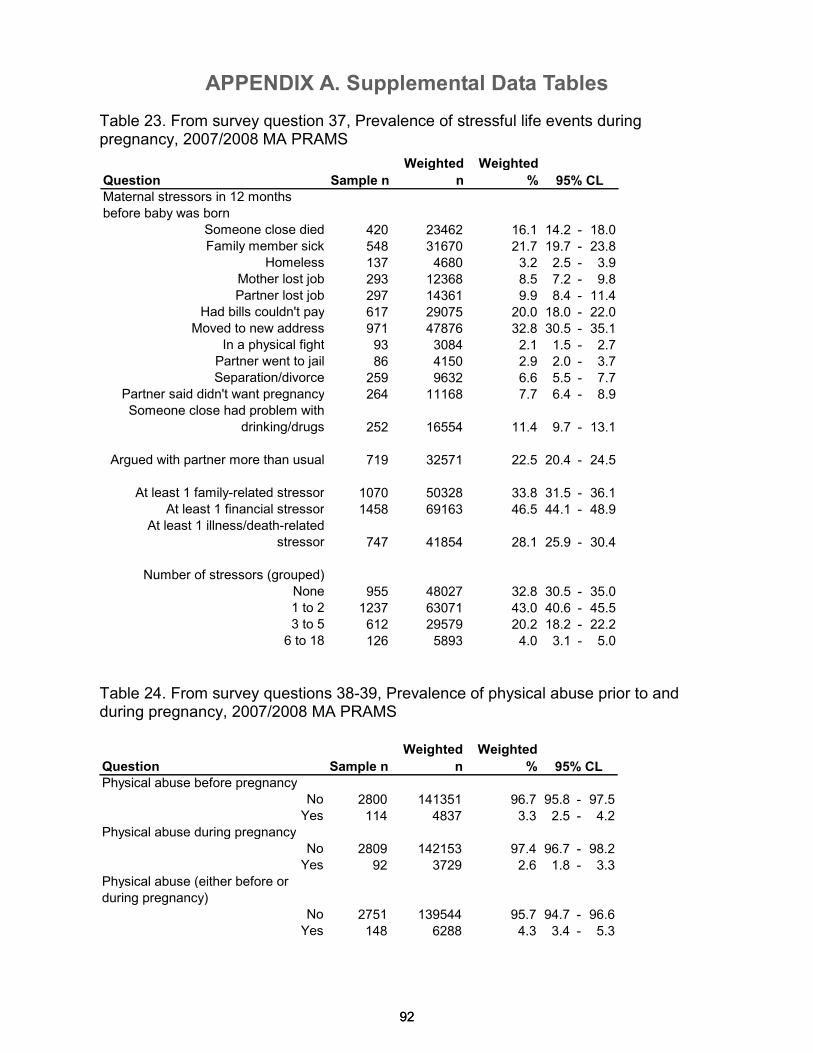
APPENDIX A. Supplemental Data Tables
92 92
Table 23. From survey question 37, Prevalence of stressful life events during pregnancy, 2007/2008 MA PRAMS
Table 24. From survey questions 38-39, Prevalence of physical abuse prior to and during pregnancy, 2007/2008 MA PRAMS
Question Sample n
Weighted
n
Weighted
%
Maternal stressors in 12 months
before baby was born
Someone close died 420 23462 16.1 14.2 - 18.0Family member sick 548 31670 21.7 19.7 - 23.8
Homeless 137 4680 3.2 2.5 - 3.9Mother lost job 293 12368 8.5 7.2 - 9.8Partner lost job 297 14361 9.9 8.4 - 11.4
Had bills couldn't pay 617 29075 20.0 18.0 - 22.0Moved to new address 971 47876 32.8 30.5 - 35.1
In a physical fight 93 3084 2.1 1.5 - 2.7Partner went to jail 86 4150 2.9 2.0 - 3.7Separation/divorce 259 9632 6.6 5.5 - 7.7
Partner said didn't want pregnancy 264 11168 7.7 6.4 - 8.9Someone close had problem with
drinking/drugs 252 16554 11.4 9.7 - 13.1
Argued with partner more than usual 719 32571 22.5 20.4 - 24.5
At least 1 family-related stressor 1070 50328 33.8 31.5 - 36.1At least 1 financial stressor 1458 69163 46.5 44.1 - 48.9
At least 1 illness/death-related
stressor 747 41854 28.1 25.9 - 30.4
Number of stressors (grouped)
None 955 48027 32.8 30.5 - 35.01 to 2 1237 63071 43.0 40.6 - 45.53 to 5 612 29579 20.2 18.2 - 22.2
6 to 18 126 5893 4.0 3.1 - 5.0
95% CL
Question Sample n
Weighted
n
Weighted
%
Physical abuse before pregnancy
No 2800 141351 96.7 95.8 - 97.5Yes 114 4837 3.3 2.5 - 4.2
Physical abuse during pregnancy
No 2809 142153 97.4 96.7 - 98.2Yes 92 3729 2.6 1.8 - 3.3
Physical abuse (either before or
during pregnancy)
No 2751 139544 95.7 94.7 - 96.6Yes 148 6288 4.3 3.4 - 5.3
95% CL
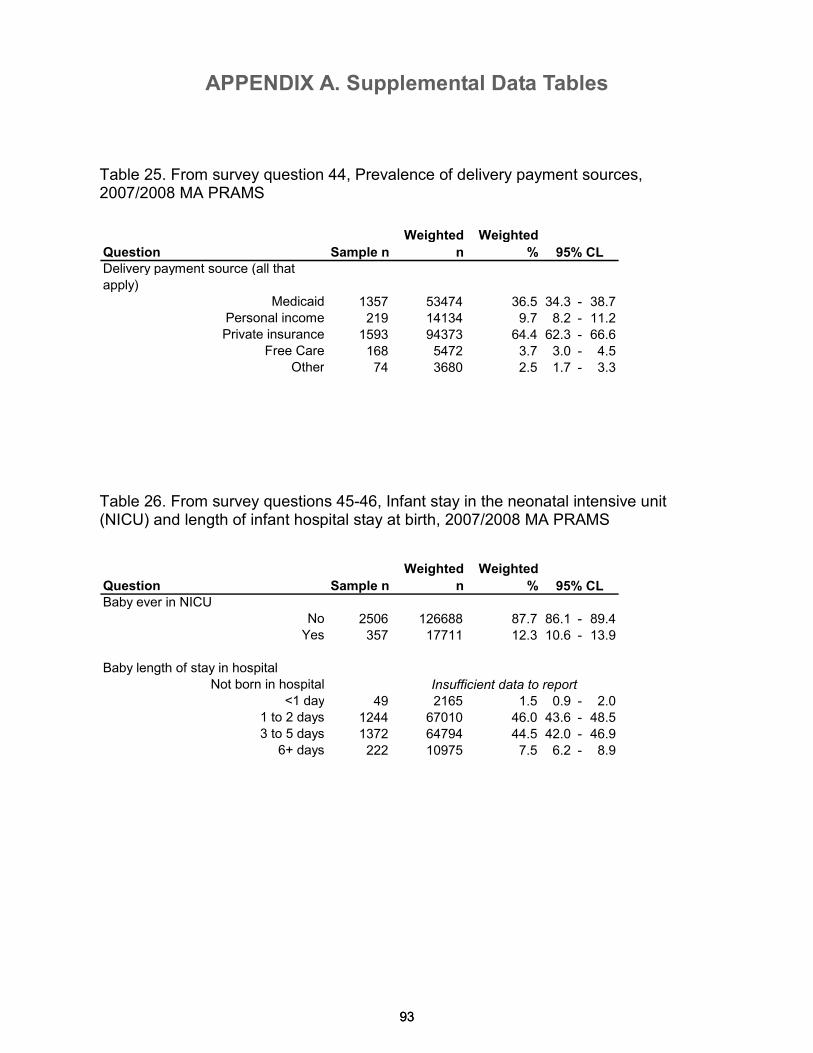
APPENDIX A. Supplemental Data Tables
93
Question Sample n
Weighted
n
Weighted
%
Delivery payment source (all that
apply)
Medicaid 1357 53474 36.5 34.3 - 38.7Personal income 219 14134 9.7 8.2 - 11.2Private insurance 1593 94373 64.4 62.3 - 66.6
Free Care 168 5472 3.7 3.0 - 4.5Other 74 3680 2.5 1.7 - 3.3
Question Sample n
Weighted
n
Weighted
%
Baby ever in NICU
No 2506 126688 87.7 86.1 - 89.4Yes 357 17711 12.3 10.6 - 13.9
Baby length of stay in hospital
Not born in hospital
<1 day 49 2165 1.5 0.9 - 2.01 to 2 days 1244 67010 46.0 43.6 - 48.53 to 5 days 1372 64794 44.5 42.0 - 46.9
6+ days 222 10975 7.5 6.2 - 8.9
95% CL
95% CL
Insufficient data to report
93
Table 25. From survey question 44, Prevalence of delivery payment sources, 2007/2008 MA PRAMS
Table 26. From survey questions 45-46, Infant stay in the neonatal intensive unit (NICU) and length of infant hospital stay at birth, 2007/2008 MA PRAMS
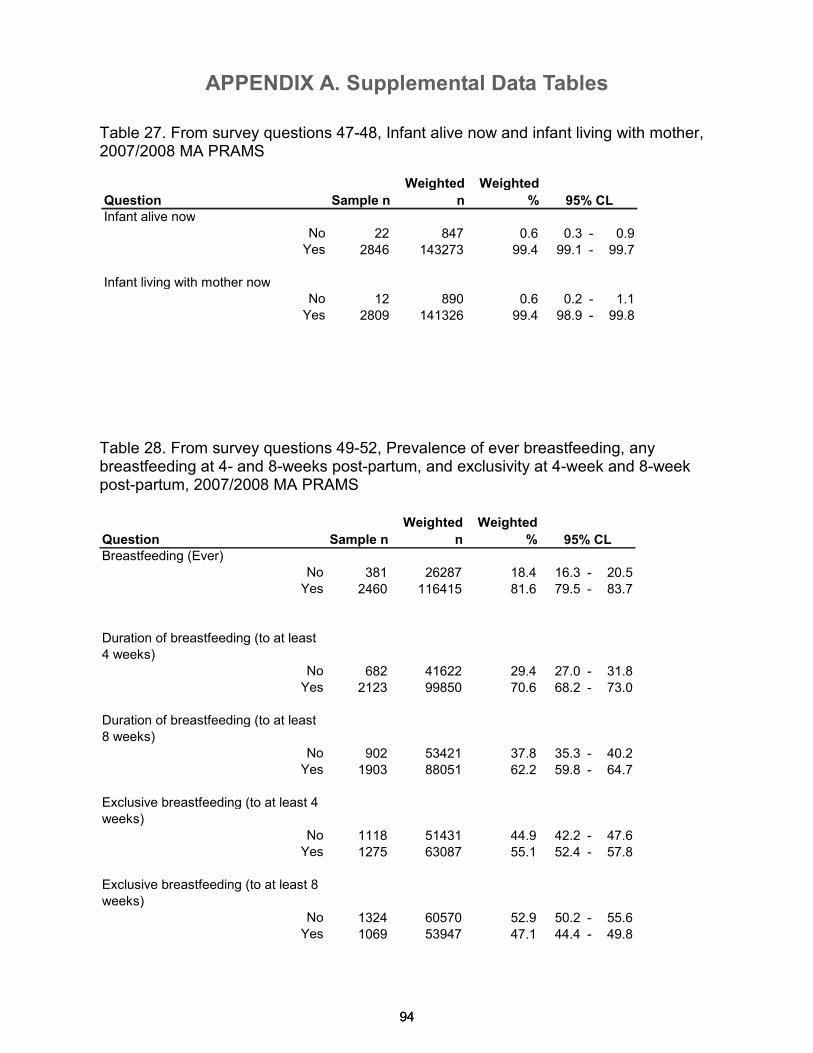
APPENDIX A. Supplemental Data Tables
94 94
Table 27. From survey questions 47-48, Infant alive now and infant living with mother, 2007/2008 MA PRAMS
Table 28. From survey questions 49-52, Prevalence of ever breastfeeding, any breastfeeding at 4- and 8-weeks post-partum, and exclusivity at 4-week and 8-week post-partum, 2007/2008 MA PRAMS
Question Sample n
Weighted
n
Weighted
%
Breastfeeding (Ever)
No 381 26287 18.4 16.3 - 20.5Yes 2460 116415 81.6 79.5 - 83.7
Duration of breastfeeding (to at least
4 weeks)
No 682 41622 29.4 27.0 - 31.8Yes 2123 99850 70.6 68.2 - 73.0
Duration of breastfeeding (to at least
8 weeks)
No 902 53421 37.8 35.3 - 40.2Yes 1903 88051 62.2 59.8 - 64.7
Exclusive breastfeeding (to at least 4
weeks)
No 1118 51431 44.9 42.2 - 47.6Yes 1275 63087 55.1 52.4 - 57.8
Exclusive breastfeeding (to at least 8
weeks)
No 1324 60570 52.9 50.2 - 55.6Yes 1069 53947 47.1 44.4 - 49.8
95% CL
Question Sample n
Weighted
n
Weighted
%
Infant alive now
No 22 847 0.6 0.3 - 0.9Yes 2846 143273 99.4 99.1 - 99.7
Infant living with mother now
No 12 890 0.6 0.2 - 1.1Yes 2809 141326 99.4 98.9 - 99.8
95% CL
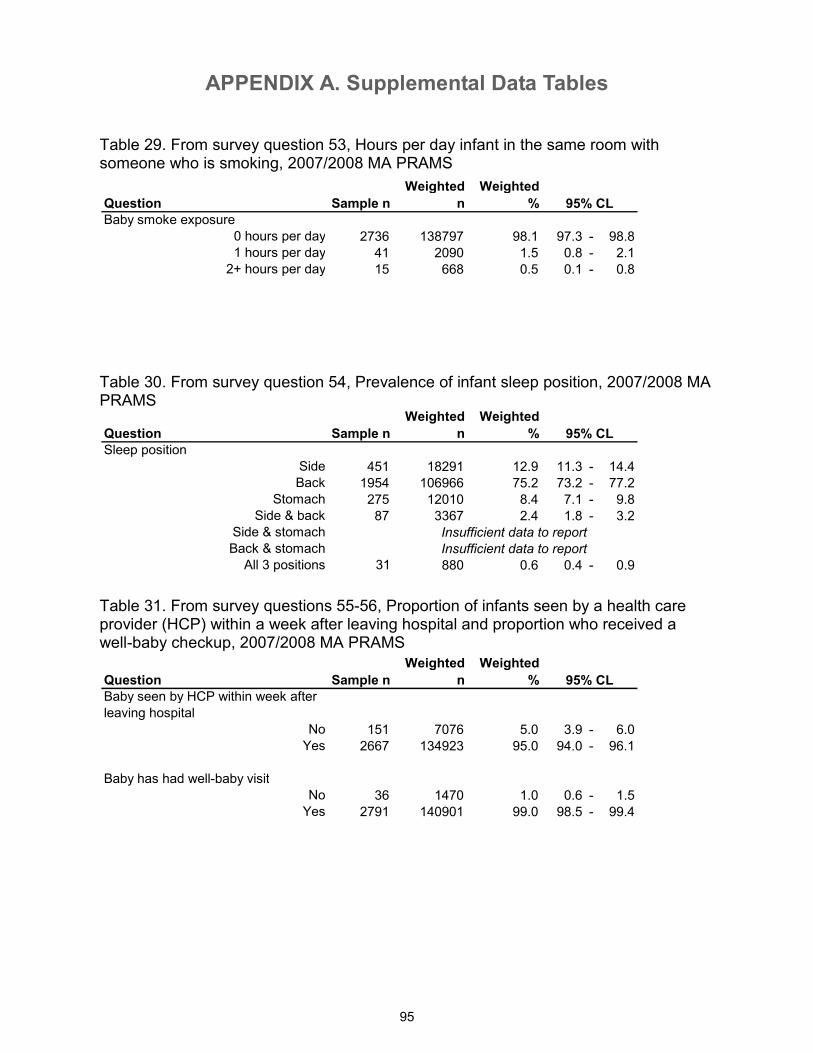
APPENDIX A. Supplemental Data Tables
95
Question Sample n
Weighted
n
Weighted
%
Baby smoke exposure
0 hours per day 2736 138797 98.1 97.3 - 98.81 hours per day 41 2090 1.5 0.8 - 2.1
2+ hours per day 15 668 0.5 0.1 - 0.8
Question Sample n
Weighted
n
Weighted
%
Sleep position
Side 451 18291 12.9 11.3 - 14.4Back 1954 106966 75.2 73.2 - 77.2
Stomach 275 12010 8.4 7.1 - 9.8Side & back 87 3367 2.4 1.8 - 3.2
Side & stomach
Back & stomach
All 3 positions 31 880 0.6 0.4 - 0.9
Question Sample n
Weighted
n
Weighted
%
Baby seen by HCP within week after
leaving hospital
No 151 7076 5.0 3.9 - 6.0Yes 2667 134923 95.0 94.0 - 96.1
Baby has had well-baby visit
No 36 1470 1.0 0.6 - 1.5Yes 2791 140901 99.0 98.5 - 99.4
Insufficient data to report
Insufficient data to report
95% CL
95% CL
95% CL
Table 29. From survey question 53, Hours per day infant in the same room with someone who is smoking, 2007/2008 MA PRAMS
Table 30. From survey question 54, Prevalence of infant sleep position, 2007/2008 MA PRAMS
Table 31. From survey questions 55-56, Proportion of infants seen by a health care provider (HCP) within a week after leaving hospital and proportion who received a well-baby checkup, 2007/2008 MA PRAMS
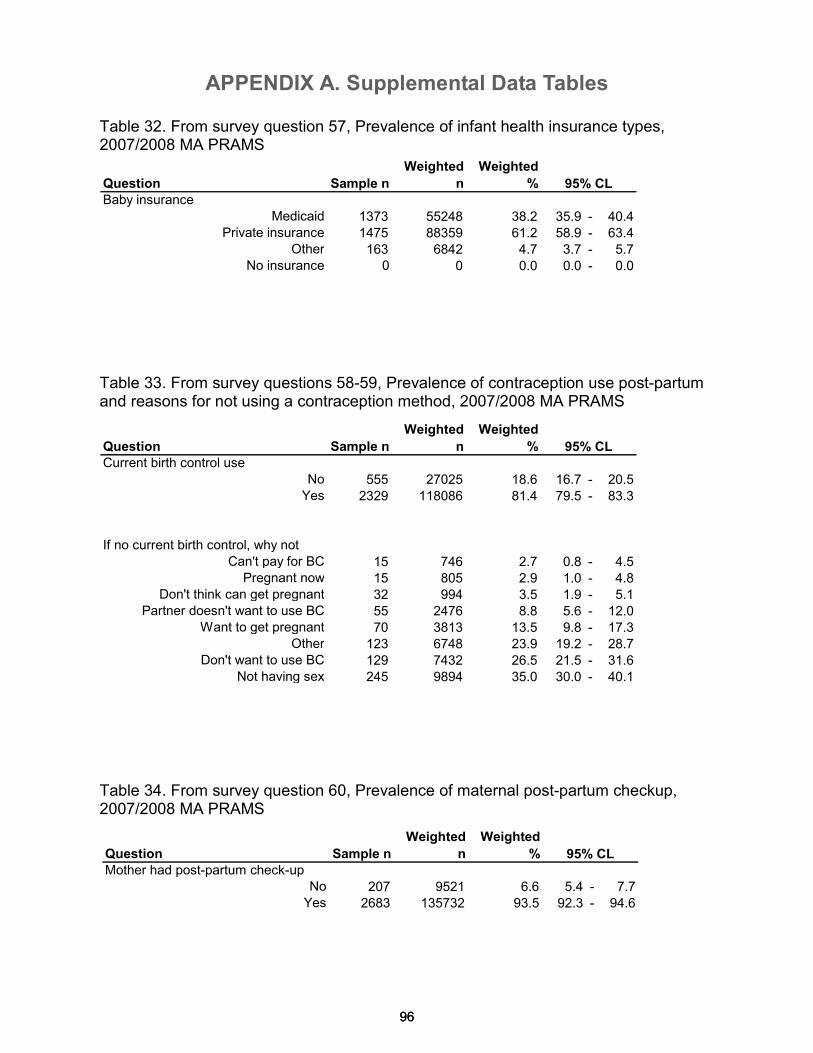
APPENDIX A. Supplemental Data Tables
96
Question Sample n
Weighted
n
Weighted
%
Baby insurance
Medicaid 1373 55248 38.2 35.9 - 40.4Private insurance 1475 88359 61.2 58.9 - 63.4
Other 163 6842 4.7 3.7 - 5.7No insurance 0 0 0.0 0.0 - 0.0
Question Sample n
Weighted
n
Weighted
%
Current birth control use
No 555 27025 18.6 16.7 - 20.5Yes 2329 118086 81.4 79.5 - 83.3
If no current birth control, why not
Can't pay for BC 15 746 2.7 0.8 - 4.5Pregnant now 15 805 2.9 1.0 - 4.8
Don't think can get pregnant 32 994 3.5 1.9 - 5.1Partner doesn't want to use BC 55 2476 8.8 5.6 - 12.0
Want to get pregnant 70 3813 13.5 9.8 - 17.3Other 123 6748 23.9 19.2 - 28.7
Don't want to use BC 129 7432 26.5 21.5 - 31.6Not having sex 245 9894 35.0 30.0 - 40.1
95% CL
95% CL
96
Table 32. From survey question 57, Prevalence of infant health insurance types, 2007/2008 MA PRAMS
Table 34. From survey question 60, Prevalence of maternal post-partum checkup, 2007/2008 MA PRAMS
Table 33. From survey questions 58-59, Prevalence of contraception use post-partum and reasons for not using a contraception method, 2007/2008 MA PRAMS
Question Sample n
Weighted
n
Weighted
%
Mother had post-partum check-upNo 207 9521 6.6 5.4 - 7.7Yes 2683 135732 93.5 92.3 - 94.6
95% CL
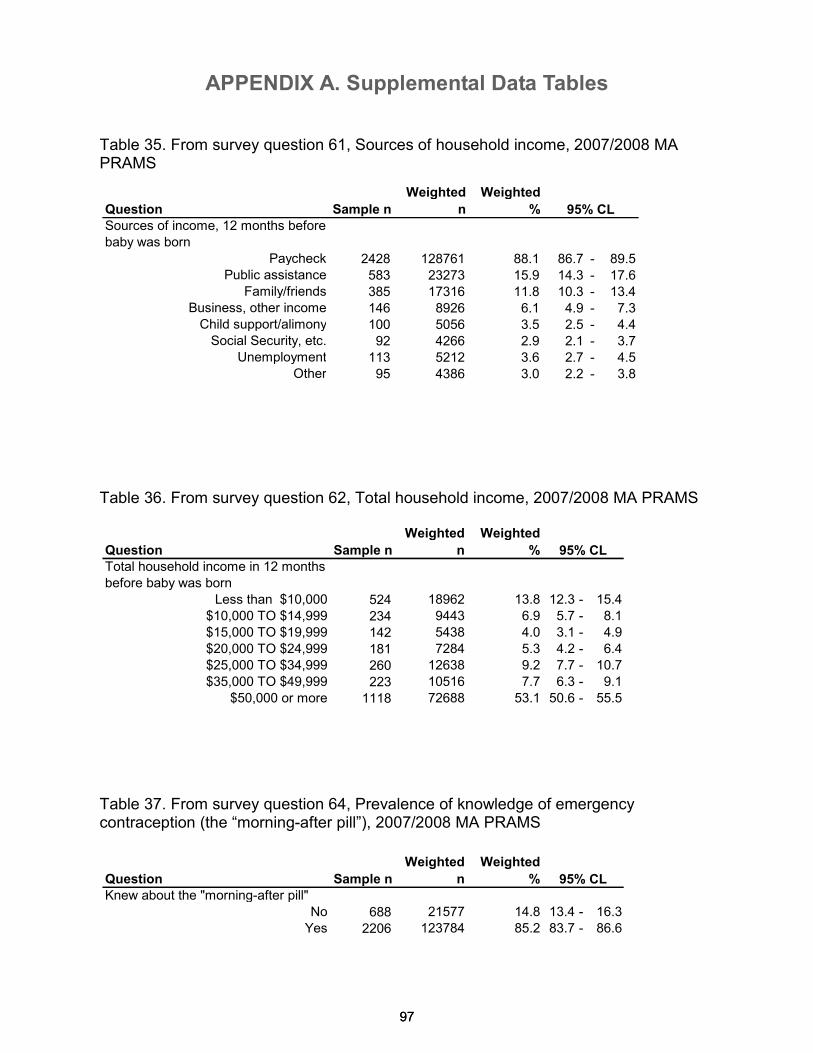
APPENDIX A. Supplemental Data Tables
97
Question Sample n
Weighted
n
Weighted
%
Total household income in 12 months
before baby was born
Less than $10,000 524 18962 13.8 12.3 - 15.4
$10,000 TO $14,999 234 9443 6.9 5.7 - 8.1
$15,000 TO $19,999 142 5438 4.0 3.1 - 4.9
$20,000 TO $24,999 181 7284 5.3 4.2 - 6.4
$25,000 TO $34,999 260 12638 9.2 7.7 - 10.7
$35,000 TO $49,999 223 10516 7.7 6.3 - 9.1
$50,000 or more 1118 72688 53.1 50.6 - 55.5
Question Sample n
Weighted
n
Weighted
%
Knew about the "morning-after pill"
No 688 21577 14.8 13.4 - 16.3
Yes 2206 123784 85.2 83.7 - 86.6
95% CL
95% CL
97
Table 35. From survey question 61, Sources of household income, 2007/2008 MA PRAMS
Table 36. From survey question 62, Total household income, 2007/2008 MA PRAMS
Table 37. From survey question 64, Prevalence of knowledge of emergency contraception (the “morning-after pill”), 2007/2008 MA PRAMS
Question Sample n
Weighted
n
Weighted
%
Sources of income, 12 months before
baby was born
Paycheck 2428 128761 88.1 86.7 - 89.5Public assistance 583 23273 15.9 14.3 - 17.6
Family/friends 385 17316 11.8 10.3 - 13.4Business, other income 146 8926 6.1 4.9 - 7.3Child support/alimony 100 5056 3.5 2.5 - 4.4Social Security, etc. 92 4266 2.9 2.1 - 3.7
Unemployment 113 5212 3.6 2.7 - 4.5Other 95 4386 3.0 2.2 - 3.8
95% CL
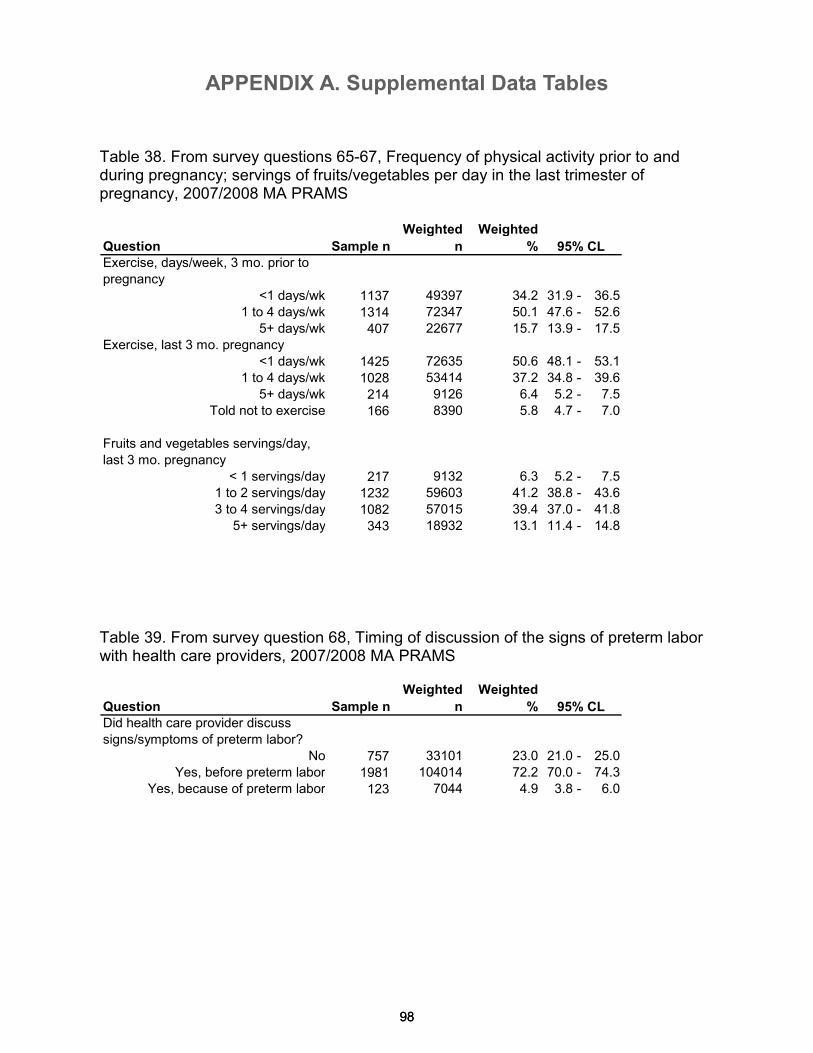
APPENDIX A. Supplemental Data Tables
98
Question Sample n
Weighted
n
Weighted
%
Exercise, days/week, 3 mo. prior to
pregnancy
<1 days/wk 1137 49397 34.2 31.9 - 36.5
1 to 4 days/wk 1314 72347 50.1 47.6 - 52.6
5+ days/wk 407 22677 15.7 13.9 - 17.5
Exercise, last 3 mo. pregnancy
<1 days/wk 1425 72635 50.6 48.1 - 53.1
1 to 4 days/wk 1028 53414 37.2 34.8 - 39.6
5+ days/wk 214 9126 6.4 5.2 - 7.5
Told not to exercise 166 8390 5.8 4.7 - 7.0
Fruits and vegetables servings/day,
last 3 mo. pregnancy
< 1 servings/day 217 9132 6.3 5.2 - 7.5
1 to 2 servings/day 1232 59603 41.2 38.8 - 43.6
3 to 4 servings/day 1082 57015 39.4 37.0 - 41.8
5+ servings/day 343 18932 13.1 11.4 - 14.8
Question Sample n
Weighted
n
Weighted
%
Did health care provider discuss
signs/symptoms of preterm labor?
No 757 33101 23.0 21.0 - 25.0
Yes, before preterm labor 1981 104014 72.2 70.0 - 74.3
Yes, because of preterm labor 123 7044 4.9 3.8 - 6.0
95% CL
95% CL
98
Table 38. From survey questions 65-67, Frequency of physical activity prior to and during pregnancy; servings of fruits/vegetables per day in the last trimester of pregnancy, 2007/2008 MA PRAMS
Table 39. From survey question 68, Timing of discussion of the signs of preterm labor with health care providers, 2007/2008 MA PRAMS
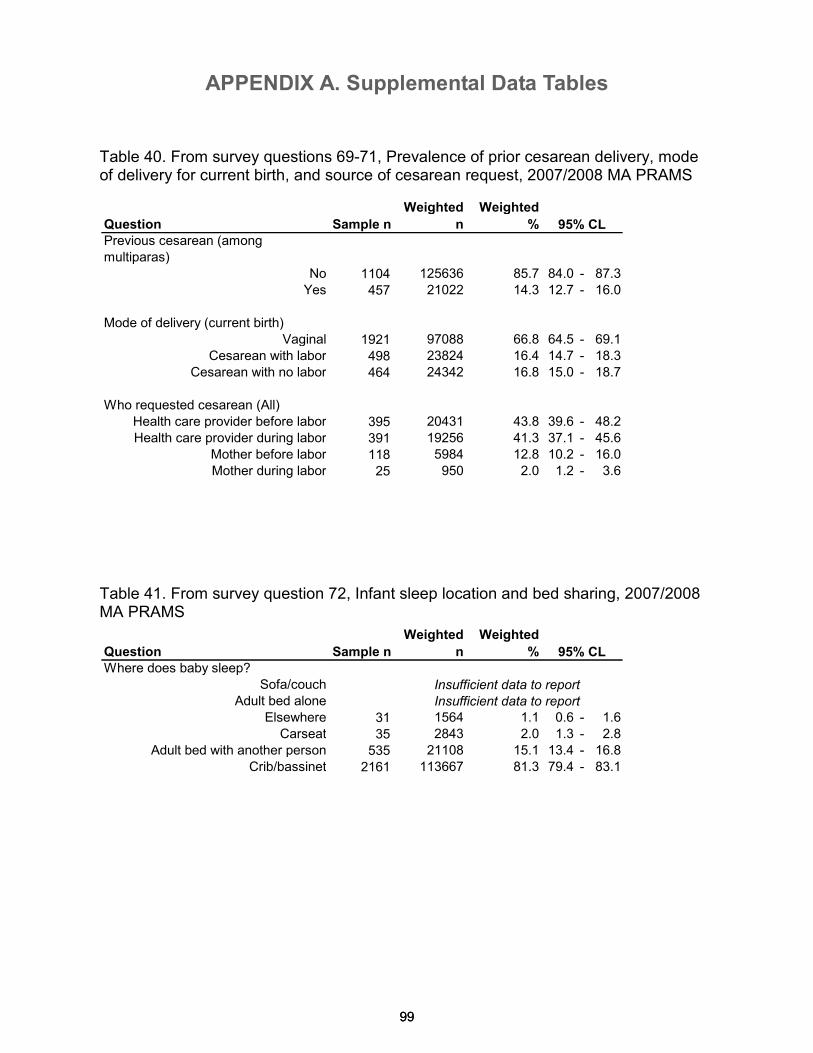
APPENDIX A. Supplemental Data Tables
99
Question Sample n
Weighted
n
Weighted
%
Previous cesarean (among
multiparas)
No 1104 125636 85.7 84.0 - 87.3
Yes 457 21022 14.3 12.7 - 16.0
Mode of delivery (current birth)
Vaginal 1921 97088 66.8 64.5 - 69.1
Cesarean with labor 498 23824 16.4 14.7 - 18.3
Cesarean with no labor 464 24342 16.8 15.0 - 18.7
Who requested cesarean (All)
Health care provider before labor 395 20431 43.8 39.6 - 48.2
Health care provider during labor 391 19256 41.3 37.1 - 45.6
Mother before labor 118 5984 12.8 10.2 - 16.0
Mother during labor 25 950 2.0 1.2 - 3.6
Question Sample n
Weighted
n
Weighted
%
Where does baby sleep?
Sofa/couch
Adult bed alone
Elsewhere 31 1564 1.1 0.6 - 1.6
Carseat 35 2843 2.0 1.3 - 2.8
Adult bed with another person 535 21108 15.1 13.4 - 16.8
Crib/bassinet 2161 113667 81.3 79.4 - 83.1
Insufficient data to report
Insufficient data to report
95% CL
95% CL
99
Table 40. From survey questions 69-71, Prevalence of prior cesarean delivery, mode of delivery for current birth, and source of cesarean request, 2007/2008 MA PRAMS
Table 41. From survey question 72, Infant sleep location and bed sharing, 2007/2008 MA PRAMS
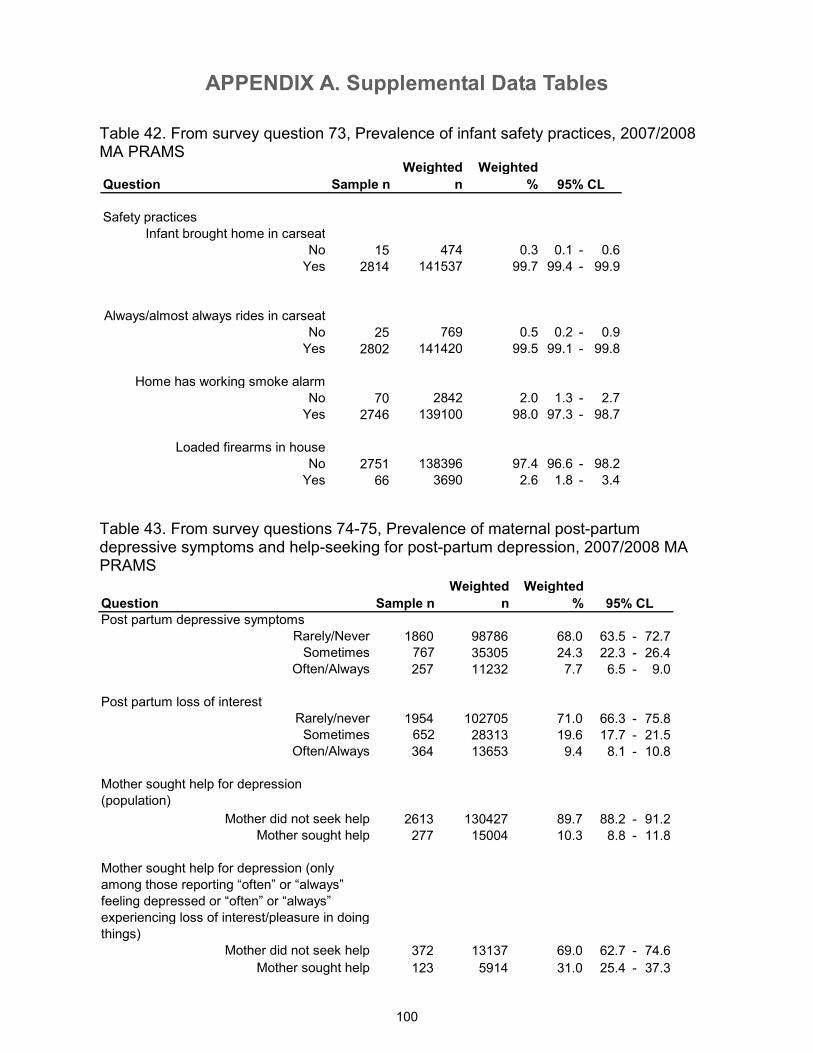
APPENDIX A. Supplemental Data Tables
100
Question Sample n
Weighted
n
Weighted
%
Safety practices
Infant brought home in carseat
No 15 474 0.3 0.1 - 0.6
Yes 2814 141537 99.7 99.4 - 99.9
Always/almost always rides in carseat
No 25 769 0.5 0.2 - 0.9
Yes 2802 141420 99.5 99.1 - 99.8
Home has working smoke alarm
No 70 2842 2.0 1.3 - 2.7
Yes 2746 139100 98.0 97.3 - 98.7
Loaded firearms in house
No 2751 138396 97.4 96.6 - 98.2
Yes 66 3690 2.6 1.8 - 3.4
95% CL
Table 42. From survey question 73, Prevalence of infant safety practices, 2007/2008 MA PRAMS
Table 43. From survey questions 74-75, Prevalence of maternal post-partum depressive symptoms and help-seeking for post-partum depression, 2007/2008 MA PRAMS
Question Sample n
Weighted
n
Weighted
%
Post partum depressive symptoms
Rarely/Never 1860 98786 68.0 63.5 - 72.7Sometimes 767 35305 24.3 22.3 - 26.4
Often/Always 257 11232 7.7 6.5 - 9.0
Post partum loss of interest
Rarely/never 1954 102705 71.0 66.3 - 75.8Sometimes 652 28313 19.6 17.7 - 21.5
Often/Always 364 13653 9.4 8.1 - 10.8
Mother sought help for depression
(population)
Mother did not seek help 2613 130427 89.7 88.2 - 91.2Mother sought help 277 15004 10.3 8.8 - 11.8
Mother sought help for depression (only
among those reporting “often” or “always”
feeling depressed or “often” or “always”
experiencing loss of interest/pleasure in doing
things)
Mother did not seek help 372 13137 69.0 62.7 - 74.6
Mother sought help 123 5914 31.0 25.4 - 37.3
95% CL
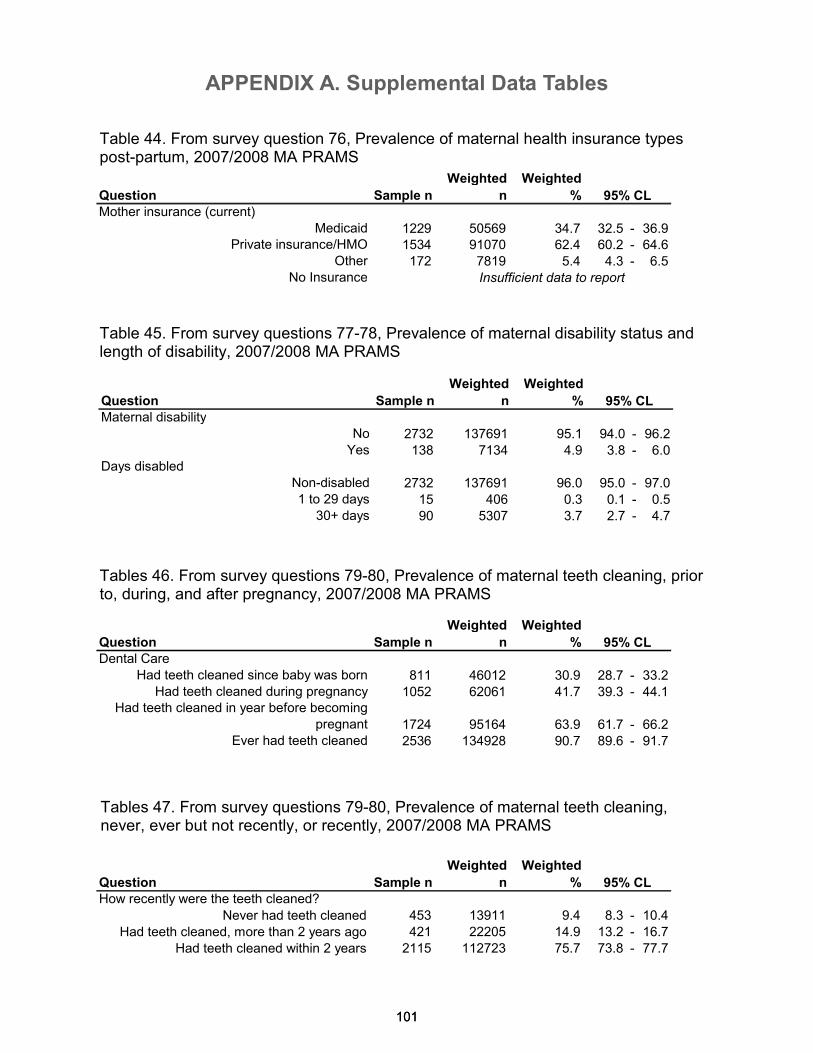
APPENDIX A. Supplemental Data Tables
101 101
Table 44. From survey question 76, Prevalence of maternal health insurance types post-partum, 2007/2008 MA PRAMS
Table 45. From survey questions 77-78, Prevalence of maternal disability status and length of disability, 2007/2008 MA PRAMS
Tables 46. From survey questions 79-80, Prevalence of maternal teeth cleaning, prior to, during, and after pregnancy, 2007/2008 MA PRAMS
Question Sample n
Weighted
n
Weighted
%
How recently were the teeth cleaned?
Never had teeth cleaned 453 13911 9.4 8.3 - 10.4
Had teeth cleaned, more than 2 years ago 421 22205 14.9 13.2 - 16.7
Had teeth cleaned within 2 years 2115 112723 75.7 73.8 - 77.7
95% CL
Question Sample n
Weighted
n
Weighted
%
Mother insurance (current)
Medicaid 1229 50569 34.7 32.5 - 36.9Private insurance/HMO 1534 91070 62.4 60.2 - 64.6
Other 172 7819 5.4 4.3 - 6.5No Insurance
95% CL
Insufficient data to report
Question Sample n
Weighted
n
Weighted
%
Maternal disability
No 2732 137691 95.1 94.0 - 96.2Yes 138 7134 4.9 3.8 - 6.0
Days disabled
Non-disabled 2732 137691 96.0 95.0 - 97.01 to 29 days 15 406 0.3 0.1 - 0.5
30+ days 90 5307 3.7 2.7 - 4.7
95% CL
Question Sample n
Weighted
n
Weighted
%
Dental Care
Had teeth cleaned since baby was born 811 46012 30.9 28.7 - 33.2Had teeth cleaned during pregnancy 1052 62061 41.7 39.3 - 44.1
Had teeth cleaned in year before becoming
pregnant 1724 95164 63.9 61.7 - 66.2Ever had teeth cleaned 2536 134928 90.7 89.6 - 91.7
95% CL
Tables 47. From survey questions 79-80, Prevalence of maternal teeth cleaning, never, ever but not recently, or recently, 2007/2008 MA PRAMS
APPENDIX A. Supplemental Data Tables
102
Technical notes Confidence limits and statistical significance: For the 2007/2008 PRAMS report, we calculated 95% confidence limits around population estimates, using the point estimates and their standard errors. When comparing prevalences across different socio-demographic subgroups, estimates with non-, or minimally-overlapping confidence limits were considered statistically significant. Differences in estimates between subgroups were presented as such when they were statistically significant, but in some cases were noted when the differences were not statistically significant but worth noting due to the potential public health impact. Weighted-n: Most data tables in this report present a “weighted n” which represents an estimate of the actual number of people affected by a behavior, condition or outcome in the Massachusetts population. PRAMS samples a small fraction of new mothers in the state, and as a result, our data are weighted to make estimates which represent the sampling frame from which our sample was drawn. Calculation of household Federal Poverty Level (FPL): Because we wished to examine differences in health by household income level, each respondent’s household Federal Poverty Level (FPL) was approximated using self-reported income (as a range) and the number of dependent household members, comparing these to the 2007 Department of Health and Human Services Federal Poverty guidelines (DHHS, 2007). Because exact dollar amounts were not reported by respondents, we used the mid-point of each income range to approximate household income. Thus, our estimated household poverty level should be viewed as approximate, and may misclassify some households.
103
Appendix B. Massachusetts PRAMS Survey,
2007/2008
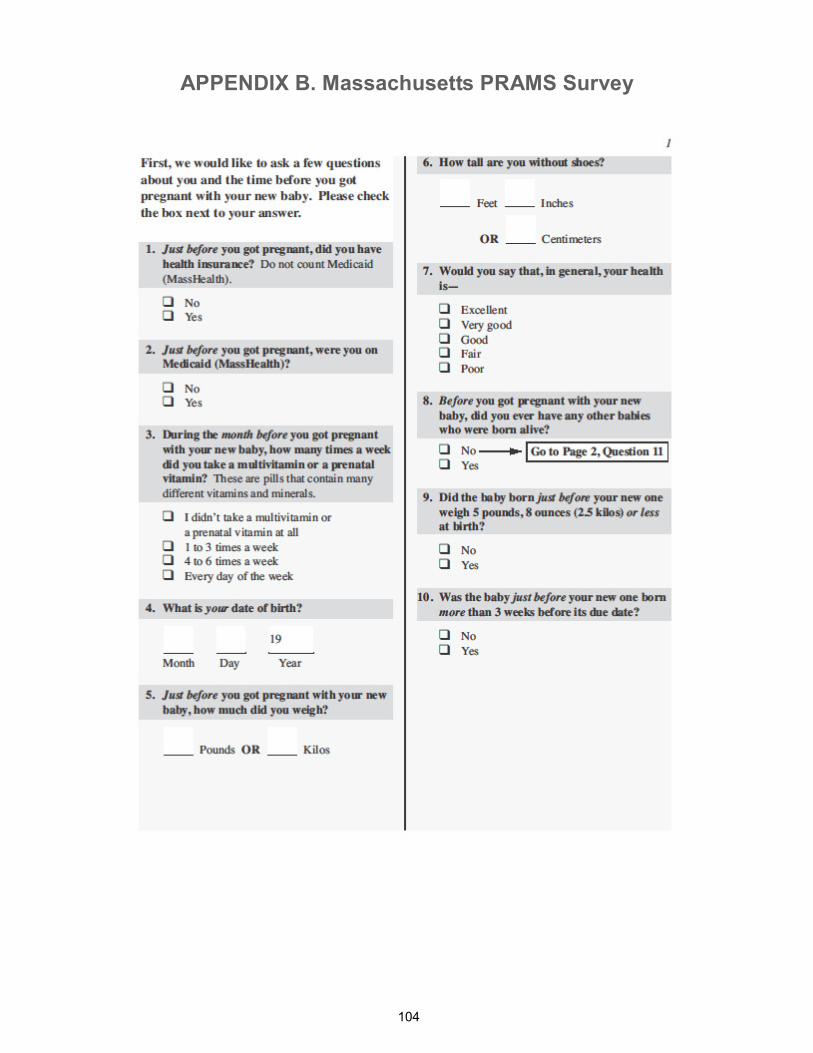
APPENDIX B. Massachusetts PRAMS Survey
104
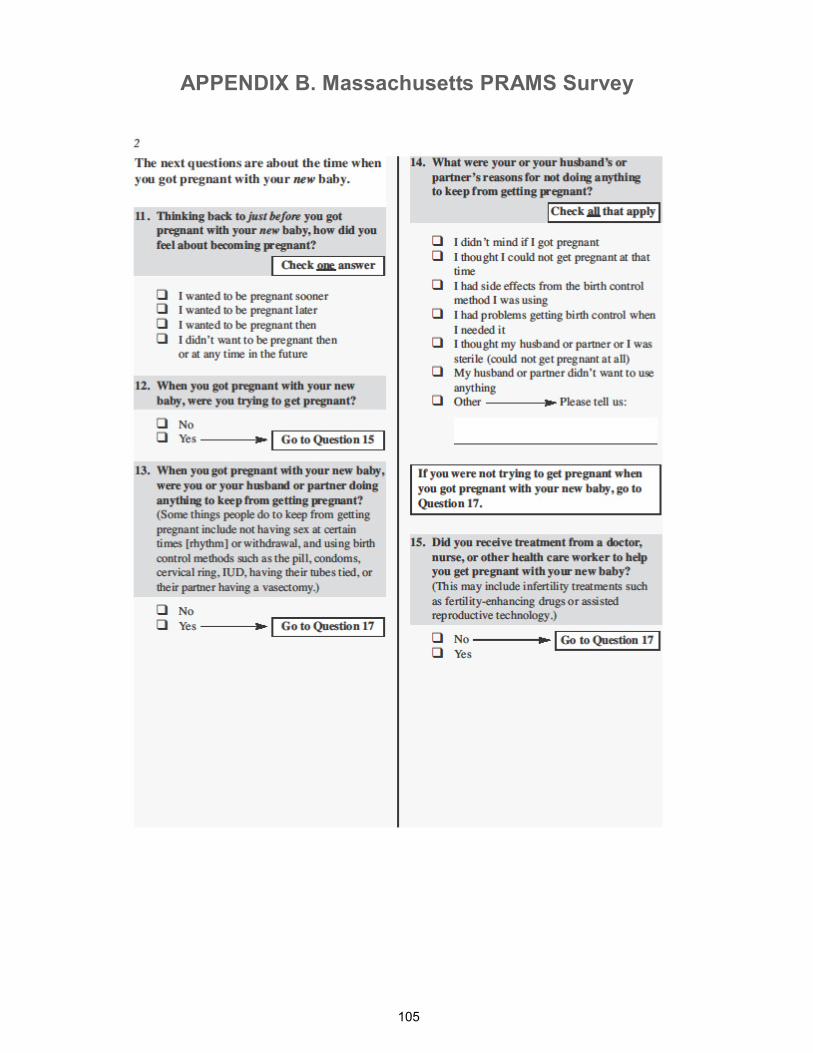
APPENDIX B. Massachusetts PRAMS Survey
105
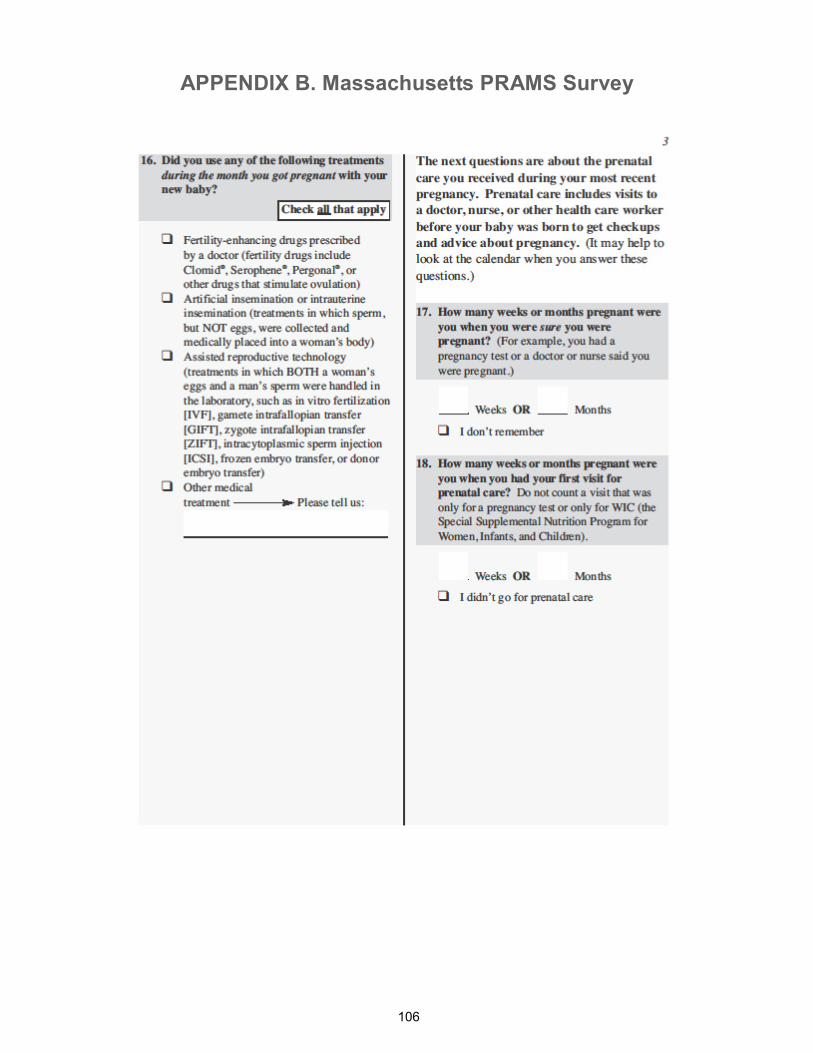
APPENDIX B. Massachusetts PRAMS Survey
106
APPENDIX B. Massachusetts PRAMS Survey
107
APPENDIX B. Massachusetts PRAMS Survey
108
APPENDIX B. Massachusetts PRAMS Survey
109
APPENDIX B. Massachusetts PRAMS Survey
110
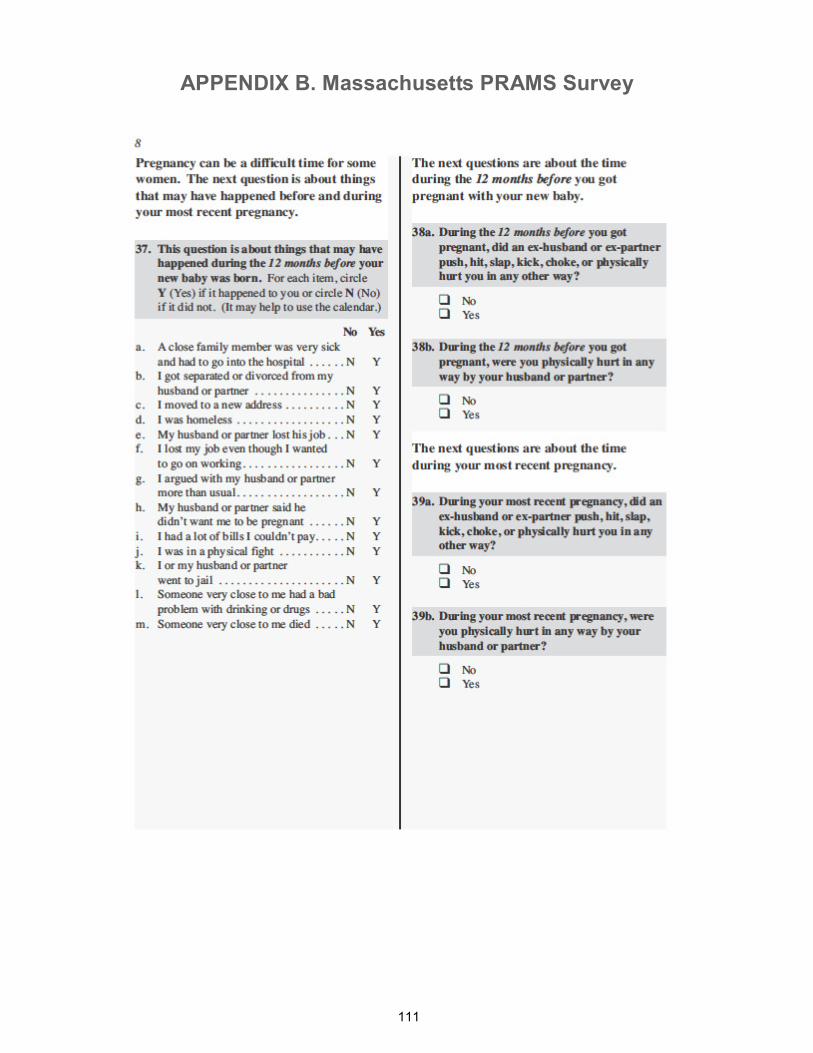
APPENDIX B. Massachusetts PRAMS Survey
111
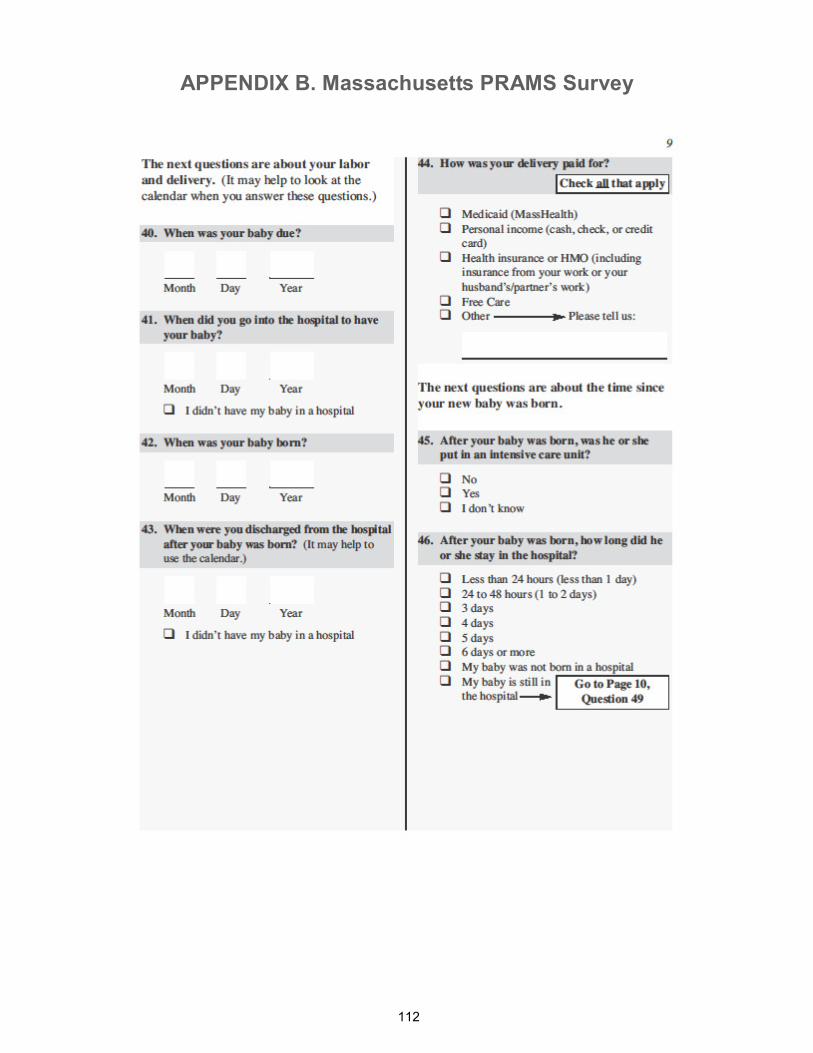
APPENDIX B. Massachusetts PRAMS Survey
112
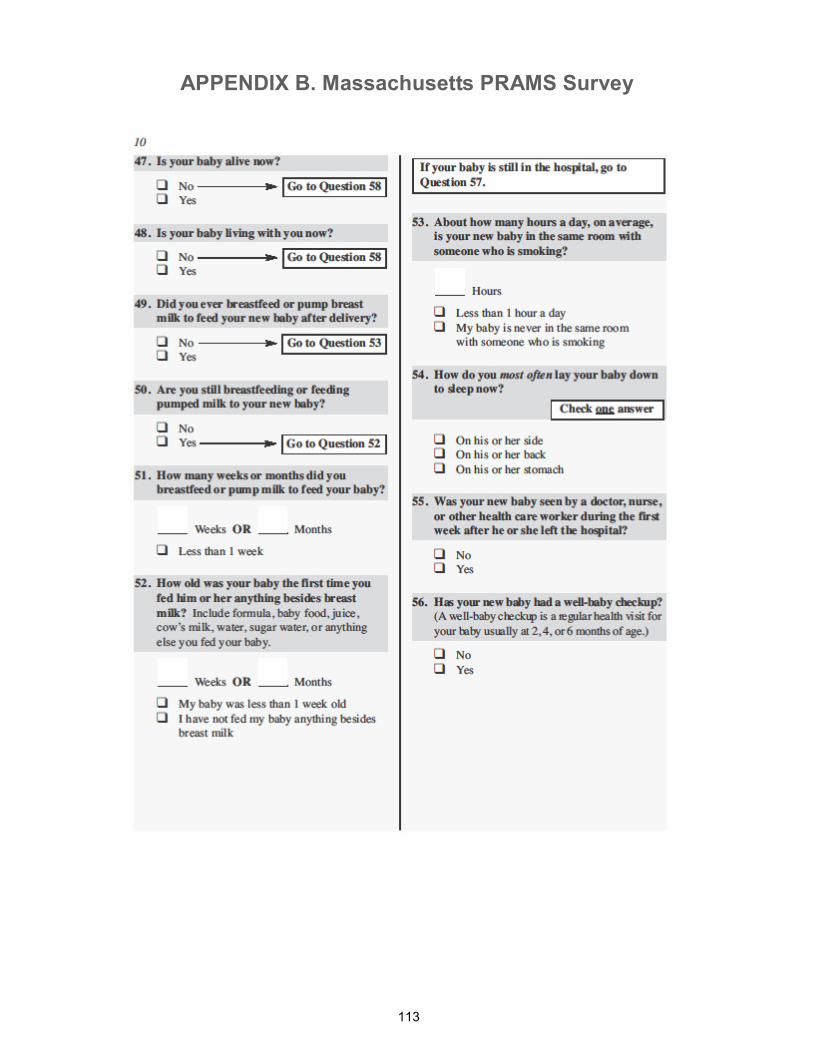
APPENDIX B. Massachusetts PRAMS Survey
113
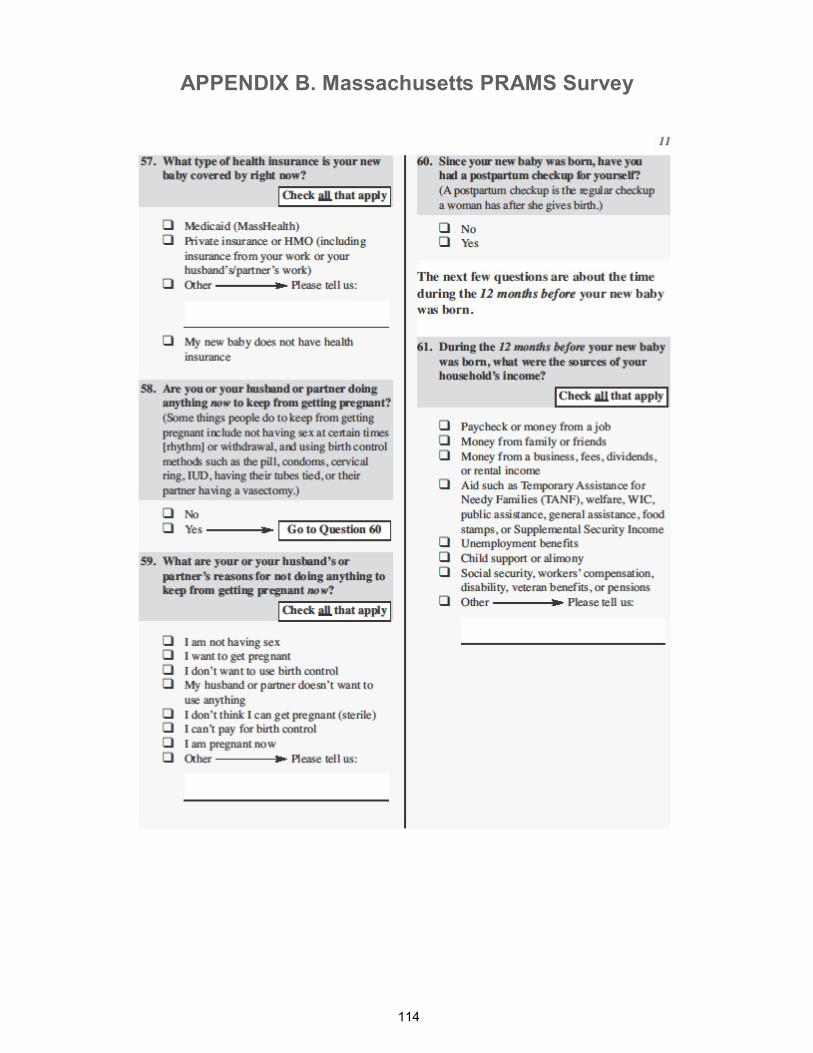
APPENDIX B. Massachusetts PRAMS Survey
114
APPENDIX B. Massachusetts PRAMS Survey
115
APPENDIX B. Massachusetts PRAMS Survey
116
APPENDIX B. Massachusetts PRAMS Survey
117
APPENDIX B. Massachusetts PRAMS Survey
118
119
Appendix C. Massachusetts PRAMS 2007/2008
Weighting Rubric
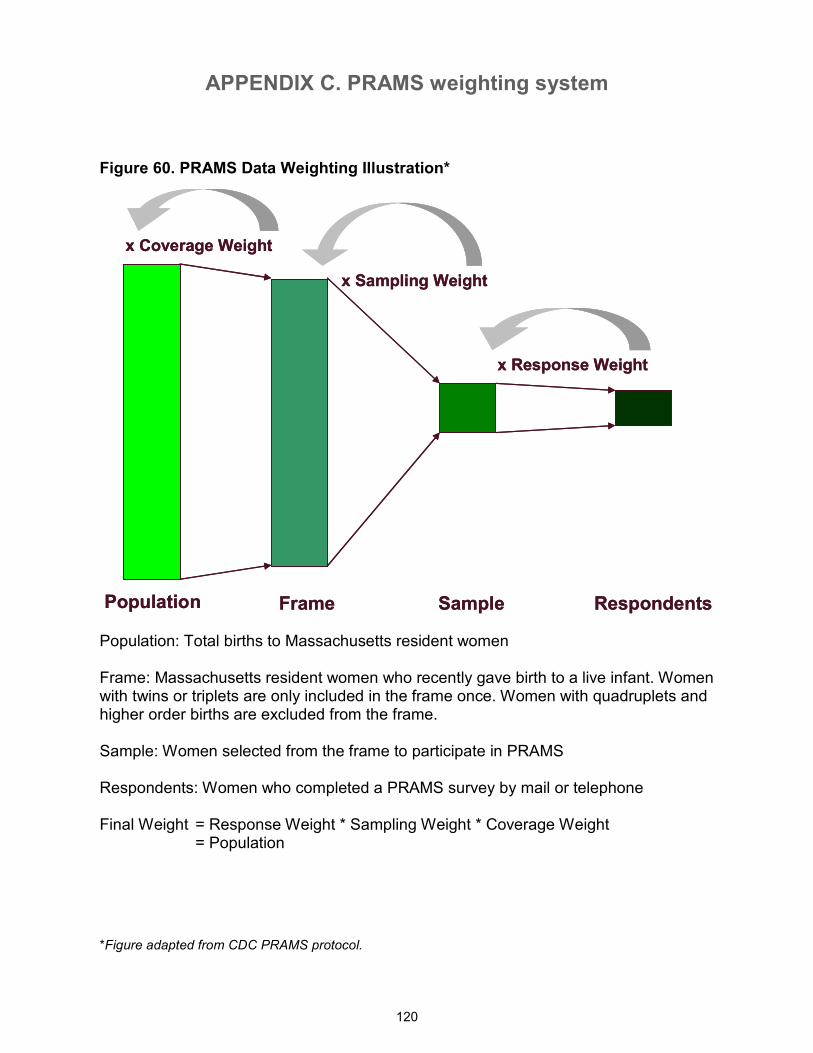
APPENDIX C. PRAMS weighting system
120
Figure 60. PRAMS Data Weighting Illustration*
Population Frame Sample Respondents
x Response Weight
x Sampling Weight
x Coverage Weight
Population Frame Sample Respondents
x Response Weight
x Sampling Weight
x Coverage Weight
Population: Total births to Massachusetts resident women Frame: Massachusetts resident women who recently gave birth to a live infant. Women with twins or triplets are only included in the frame once. Women with quadruplets and higher order births are excluded from the frame. Sample: Women selected from the frame to participate in PRAMS Respondents: Women who completed a PRAMS survey by mail or telephone Final Weight = Response Weight * Sampling Weight * Coverage Weight = Population
*Figure adapted from CDC PRAMS protocol.
121
Appendix D. Massachusetts PRAMS 2007/2008
Adequacy of Prenatal Care Utilization Index
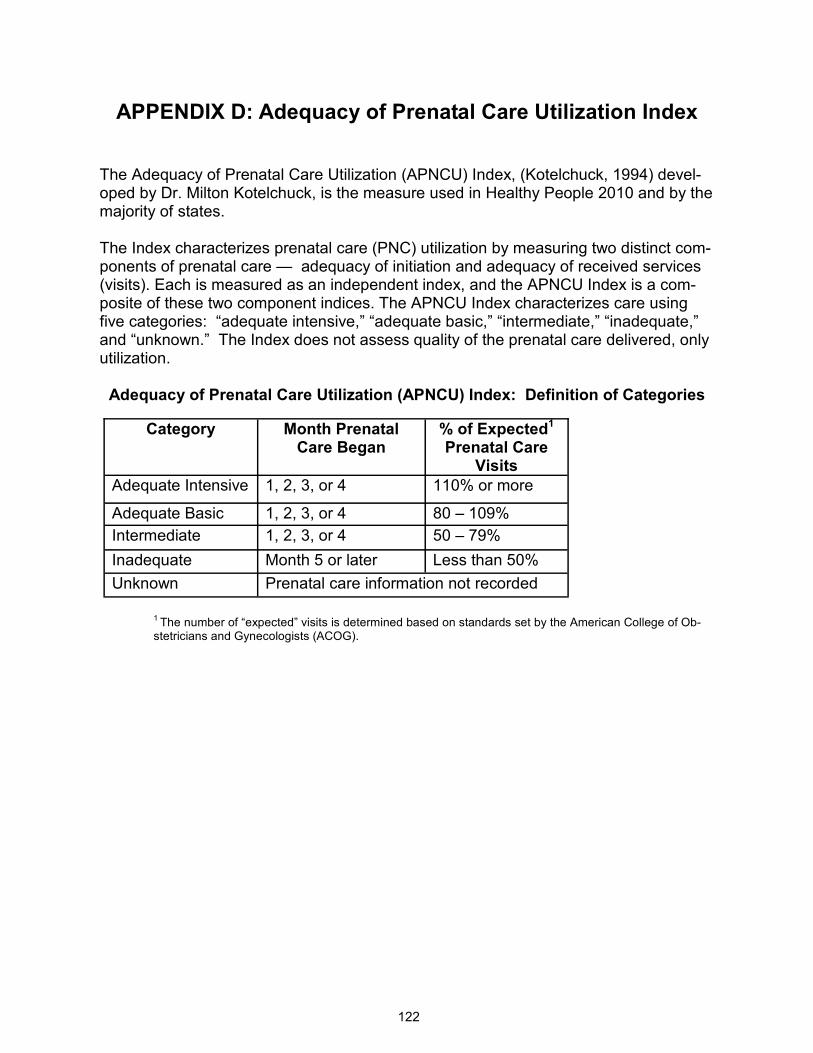
APPENDIX D: Adequacy of Prenatal Care Utilization Index
122
The Adequacy of Prenatal Care Utilization (APNCU) Index, (Kotelchuck, 1994) devel-oped by Dr. Milton Kotelchuck, is the measure used in Healthy People 2010 and by the majority of states. The Index characterizes prenatal care (PNC) utilization by measuring two distinct com-ponents of prenatal care — adequacy of initiation and adequacy of received services (visits). Each is measured as an independent index, and the APNCU Index is a com-posite of these two component indices. The APNCU Index characterizes care using five categories: “adequate intensive,” “adequate basic,” “intermediate,” “inadequate,” and “unknown.” The Index does not assess quality of the prenatal care delivered, only utilization. Adequacy of Prenatal Care Utilization (APNCU) Index: Definition of Categories
1 The number of “expected” visits is determined based on standards set by the American College of Ob-stetricians and Gynecologists (ACOG).
Category Month Prenatal Care Began
% of Expected1
Prenatal Care Visits
Adequate Intensive 1, 2, 3, or 4 110% or more
Adequate Basic 1, 2, 3, or 4 80 – 109%
Intermediate 1, 2, 3, or 4 50 – 79%
Inadequate Month 5 or later Less than 50%
Unknown Prenatal care information not recorded
123
Appendix E. Massachusetts PRAMS 2007/2008
List of references
APPENDIX E: List of References
124
Alexander, G. R.,& Kotelchuck, M. (2001). Assessing the role and effectiveness of prenatal care: His-tory, challenges, and directions for future research. Public Health Reports, 116, 306–316.
Altfeld S., Handler A., Burton D., & Berman L. (1997). Wantedness of pregnancy and prenatal health behaviors. Women Health, 26:29–43.
American Academy of Pediatrics (1992). American Academy of Pediatrics (AAP) Task Force on Infant Positioning and SIDS: Positioning and SIDS. Pediatrics, 89, 1120-1126.
American Academy of Pediatrics (2000). American Academy of Pediatrics Committee on Practice and Ambulatory Medicine. Recommendations for preventative pediatric health care. Pediatrics, 105(3):645–646.
American College of Obstetricians and Gynecologists (2003). Exercise During Pregnancy (Pamphlet). http://www.acog.org/publications/patient_education/bp119.cfm [On-line].
American College of Obstetricians and Gynecologists (2008). Nutrition During Pregnancy (Pamphlet). http://www.acog.org/publications/patient_education/bp001.cfm [On-line].
Baeten, J. M., Bukusi, E. A., & Lambe, M. (2001). Pregnancy complications and outcomes among over-weight and obese nulliparous women. Am.J.Public Health, 91, 436-440.
Branson, B. M., Handsfield, H. H., Lampe, M. A., Janssen, R. S., Taylor, A. W., Lyss, S. B. et al. (2006). Revised recommendations for HIV testing of adults, adolescents, and pregnant women in health-care settings. MMWR Recomm.Rep., 55, 1-17.
Callaghan, W. M., Mackay, A. P., & Berg, C. J. (2008). Identification of severe maternal morbidity during delivery hospitalizations, United States, 1991-2003. Am J Obstet Gynecol., 199; 133.e1-8.
Castles, A., Adams, E. K., Melvin, C. L., Kelsch, C., & Boulton, M. L. (1999). Effects of smoking during pregnancy. Five meta-analyses. Am.J.Prev.Med., 16, 208-215.
Chandra A., Martinez, G. M., Mosher, W. D., Abma, J. C., & Jones, J. Fertility, family planning, and re-productive health of U.S. women: Data from the 2002 National Survey of Family Growth. National Cen-ter for Health Statistics Vital and Health Statistics. 2005; 23:1-174.
Chang, J., Berg, C. J., Saltzman, L. E., & Herndon, J. (2005). Homicide: a leading cause of injury deaths among pregnant and post-partum women in the United States, 1991-1999. Am.J.Public Health, 95, 471-477.
Conde-Agudelo, A., Rosas-Bermudez, A., & Kafury-Goeta, A. C. (2006). Birth spacing and risk of ad-verse perinatal outcomes: a meta-analysis. JAMA, 295, 1809-1823.
DiFranza, J. R. & Lew, R. A. (1995). Effect of maternal cigarette smoking on pregnancy complications and sudden infant death syndrome. J.Fam.Pract., 40, 385-394.
Egerter, S., Braveman, P., & Marchi, K. (2002). Timing of insurance coverage and use of prenatal care among low-income women. Am.J.Public Health, 92, 423-427.
Gartner, L. M., Morton, J., Lawrence, R. A., Naylor, A. J., O'Hare, D., Schanler, R. J. et al. (2005). Breastfeeding and the use of human milk. Pediatrics, 115, 496-506.
Gelles, R. J. (1988). Violence and Pregnancy - Are Pregnant-Women at Greater Risk of Abuse. Journal of Marriage and the Family, 50, 841-847.
APPENDIX E: List of References
125
Hanson, L. A., Jalil, F., Ashraf, R., Bernini, S., Carlsson, B., Cruz, J. R. et al. (1991). Characteristics of human milk antibodies and their effect in relation to the epidemiology of breastfeeding and infections in a developing country. Adv.Exp.Med.Biol., 310, 1-15.
Horsley, T., Clifford, T., Barrowman, N., Bennett, S., Yazdi, F., Sampson, M. et al. (2007). Benefits and harms associated with the practice of bed sharing: a systematic review. Arch.Pediatr.Adolesc.Med., 161, 237-245.
Institute of Medicine. (1995). The best intentions: unintended pregnancy and the well-being of children and families. Brown SS, Eisenberg L, eds. Washington, DC: National Academy Press.
Institute of Medicine (US) Committee on Understanding Premature Birth and Assuring Healthy Out-comes; Behrman RE, Butler AS, editors. (2007). Preterm Birth: Causes, Consequences, and Prevention. Washington (DC): National Academies Press.
Janssen, P. A., Holt, V. L., Sugg, N. K., Emanuel, I., Critchlow, C. M., & Henderson, A. D. (2003). Inti-mate partner violence and adverse pregnancy outcomes: a population-based study. Am.J.Obstet.Gynecol., 188, 1341-1347.
Jeffcoat, M. K., Geurs, N. C., Reddy, M. S., Cliver, S. P., Goldenberg, R. L., & Hauth, J. C. (2001). Periodontal infection and preterm birth: results of a prospective study. J.Am.Dent.Assoc., 132, 875-880.
Kjos, S. L. & Buchanan, T. A. (1999). Gestational diabetes mellitus. N.Engl.J.Med., 341, 1749-1756.
Kotelchuck M (1994). Overview of Adequacy of Prenatal Care Utilization Index. http://mchlibrary.info/databases/HSNRCPDFs/Overview_APCUIndex.pdf [On-line].
Kristensen, J., Vestergaard, M., Wisborg, K., Kesmodel, U., & Secher, N. J. (2005). Pre-pregnancy weight and the risk of stillbirth and neonatal death. BJOG., 112, 403-408.
Logsdon, M. C., Wisner, K. L., & Pinto-Foltz, M. D. (2006). The impact of post-partum depression on mothering. J.Obstet.Gynecol.Neonatal Nurs., 35, 652-658.
Massachusetts Department of Public Health. (2010). Health of Massachusetts. Boston, MA.
McFarlane, J., Parker, B., & Soeken, K. (1996). Abuse during pregnancy: associations with maternal health and infant birth weight. Nurs.Res., 45, 37-42.
McKenna J, McDade, T. (2005). Why babies should never sleep alone: A review of the co-sleeping con-troversy in relation to SIDS, bedsharing and breast feeding. Paediatric Respiratory Reviews, 6, 134-152. Metzger, B. E., Buchanan, T. A., Coustan, D. R., de, L. A., Dunger, D. B., Hadden, D. R. et al. (2007). Summary and recommendations of the Fifth International Workshop-Conference on Gestational Diabe-tes Mellitus. Diabetes Care, 30 Suppl 2, S251-S260.
Milunsky, A., Jick, H., Jick, S. S., Bruell, C. L., MacLaughlin, D. S., Rothman, K. J. et al. (1989). Multivi-tamin/folic acid supplementation in early pregnancy reduces the prevalence of neural tube defects. JAMA, 262, 2847-2852.
Misra, D. P., & Guyer, B. (1998). Benefits and limitations of prenatal care. Journal of the American Medi-cal Association, 280, 2073.
National Birth Defects Prevention Network (NBDPN) (2009). Birth defects state profile – Massachusetts, January 2009. http://www.nbdpn.org/current/2009pdf/StateProfiles/MA_2009.pdf [On-line].
APPENDIX E: List of References
126
Singh-Manoux, A., Martikainen, P., Ferrie, J., Zins, M., Marmot, M., & Goldberg, M. (2006). What does self rated health measure? Results from the British Whitehall II and French Gazel cohort studies. J.Epidemiol.Community Health, 60, 364-372.
Sokol, R. J., Aney-Black, V., & Nordstrom, B. (2003). Fetal alcohol spectrum disorder. JAMA, 290, 2996-2999.
Stephen, E. H. & Chandra, A. (2006). Declining estimates of infertility in the United States: 1982-2002. Fertil.Steril., 86, 516-523.
Tjaden P & Thoennes N (2000). Full report of the prevalence, incidence, and consequences of violence against women: findings from the National Violence Against Women Survey (Rep. No. NCJ 183781).
Washington, DC: United States Department of Justice, National Institute of Justice.
U.S.Department of Health and Human Services (2000). Healthy People 2010: Understanding and Im-proving Health Washington, DC: U.S. Government Printing Office.
U.S.Department of Health and Human Services (2007). The 2007 HHS Poverty Guidelines. http://aspe.hhs.gov/POVERTY/07poverty.shtml [On-line].
Whooley, M. A., Avins, A. L., Miranda, J., & Browner, W. S. (1997). Case-finding instruments for depres-sion. Two questions are as good as many. J.Gen.Intern.Med., 12, 439-445.

127
Appendix F. Alphabetical List of PRAMS Advisory
Committee Members
APPENDIX F: Alphabetical List of PRAMS Advisory Committee Members
128
Name Organization Brianne Beagan Massachusetts Department of Public Health
Candice Belanoff Boston University School of Public Health
Lynn Bethel Massachusetts Department of Public Health
Meg Blanchet Massachusetts Department of Public Health
Sandra Broughton Massachusetts Department of Public Health
Paula Callahan Massachusetts Department of Children and Families
Jill Clark Massachusetts Department of Public Health
Jennifer Cochran Massachusetts Department of Public Health
Rachel Colchamiro Massachusetts Department of Public Health
Eugene Declercq Boston University School of Public Health
Ed Doherty March of Dimes Massachusetts Chapter
Karin Downs Massachusetts Department of Public Health
Milton Kotelchuck Boston University School of Public Health
Samuel Louis Massachusetts Department of Public Health
Vera Mouradian Massachusetts Department of Public Health
Beth Nagy Massachusetts Department of Public Health
Bill O’Connell Massachusetts Department of Public Health
Holly Hackman Massachusetts Department of Public Health
Barbara Namias North American Indian Center of Boston
G. Mike Portuphy Massachusetts Department of Public Health
Jane Purtill Massachusetts Department of Public Health
Snehal Shah Boston Public Health Commission
Physllis Sims Boston Public Health Commission
Lauren Smith Massachusetts Department of Public Health
Vincent Smith Beth Israel Deaconess Medical Center

129