Embed Size (px)
Citation preview
1
Household Animal Raising Behaviour in China’s Developed
Regions: The Case of Zhejiang Province 1
Xi-An Liu a, Hua-Yong Teng
b and Qing-Fang Guo
b
a Asian Agribusiness Research Centre
The University of Sydney
Orange NSW 2800
Emial: [email protected]
b College of Economics and Management
China Agricultural University
Beijing China 100094
Abstract
Due to the dominant role of household animal raising in China’s animal
production, an improved understanding of household animal raising practices
is essential to study China’s feedgrain markets. It is also noted that the level of
local economic development affects animal raising practices and the
development of feedgrain markets. This paper reports the findings from a rural
household survey we conducted recently in a China’s coastal and developed
province. It was specially designed to examine issues related to household
animal raising practices such as animal raising scale, sources of feed, feed
processing and feeding efficiency in a developed area. Discussed also are
implications of the findings on China’s regional feedgrain markets.
1. Introduction
There are three kinds of animal raising practices in China: (1) very small-scale traditional
household backyard animal raising; (2) specialised animal raising households; and (3) larger-
scale animal feedlots. The former two occupy an important share. For example, in 1998, about
95% of China’s pork was produced by the former two animal raising practices. Backyard
animal raising alone produced some 80% of total pork production (Qi et al. 1999, p. 2).
Although the share of animal production by backyard animal raising is declining in the past
years, the share by specialised animal raising households is increasing (NORHS 1998; Qi et
al. 1999, p. 2). Hence the total share of production by these two practices has remained at a
similar level in the past years. This makes it extremely important to gain an improved
understanding of household animal raising practice in order to better understand China’s
feedgrain issues.
1 Paper to be presented to the 46th Annual Conference of the Australian Agricultural and Resource Economics
Society, 13-15 February 2002, Canberra, Australia. This paper is part of the GRDC-funded project, ‘China’s
Regional Feedgrains Markets: Development and Prospects’. GRDC’s support is gratefully acknowledged. The
authors wish to thank Dr Zhang-Yue Zhou of the University of Sydney and Professor Wei-Ming Tian of China
Agricultural University for their assistance in this study.
2
Despite the need and importance of understanding household animal raising practice,
studies conducted at the farm level are not extensive. Earlier attempts include Zhang and Lu
(1997), NORHS (1998), Zhang (1998), and Wang et al. (1999). Using data collected by the
National Office for Rural Household Surveys, Zhang and Lu (1997) examine changes in pig
production scale and structure and feed conversion ratios between provinces. NORHS (1998),
based on a survey of some 5000 households of seven provinces, discusses a number of issues
related to animal production, e.g., composition and changes of animal feeding practices, feed
source and conversion ratios. Zhang (1998), using the same set of data of NORHS (1998), but
examines issues related to pig production only. Zhang provides an analysis and comparison of
economic returns from pig production between the seven surveyed provinces. Wang et al.
(1999), based on a survey of some 300 pig raising households in Sichuan province, also
address issues such as feed use and conversion ratios and pig raising costs and returns.
Cao (1998) believes that China’s animal production is still largely a sideline operation by
many farm households as evidenced by the fact that on average each household raises only
two pigs a year. However, due to the high homogeneity of Chinese farm household size and
other economic similarities, Chinese farmers tend to respond to market signals simultaneously
and similarly. Any small adjustment in animal production decision, e.g., raising one more or
one less pig, by the many millions of Chinese farmers can generate a huge impact on the
market. It is in this sense that Cao reinforces the importance of studying animal raising
practice at the household level.
It is also important to examine household animal raising behaviour in different regions.
Being such a vast country, China has regional variations in many aspects that affect feedgrain
demand and supply. Previous studies on China’s feedgrain market have dealt with the issues
largely at the aggregate national level. Zhou et al. (2001), however, point out that regional
characteristics need to be taken into consideration so to gain useful insights in understanding
China’s feedgrain issues. As part of a GRDC-funded three-year project on the development
and prospects of China’s feedgrain market, we conducted household surveys in four regions
in China on household animal raising practices. The four regions were chosen with the
following distinctions: a traditional pig-raising region, a feedgrain-surplus region, an
economically developed region and a region that is economically less developed, lack of
feedgrains and is dominated by small-scale traditional backyard animal raising.
This paper reports the findings from our rural household survey conducted in Zhejiang, a
south-east coastal and developed province. Through the survey, we attempt to find out the
reasons for farms to engage in animal husbandry, the composition and sources of feed, feed-
meat conversion ratios, farmers’ responses to input and output price changes, and their
intention towards future animal husbandry. In the next section, we describe the administration
of the surveys. In Section 3 we report and discuss major findings. We summarise the key
findings from the survey and discuss their implications in the final section.
2. The Survey
The survey was conducted in May-June 2001. Two hundred and seventy households were
surveyed, which were selected from six villages in Jiashan county, Zhejiang province.
Zhejiang province is situated in China’s south-east corner, south to Fujian, west to Jiangxi,
north to Jiangsu and Shanghai, and east to the China East Sea. By land area, Zhejiang is one
of the smallest provinces in China (being 1.1% of China’s total land area) yet it is one of the
most economically developed regions – it produces 6.8 per cent of China’s GDP. Its per
capita income in 2000 (¥6700) was almost double of the national average (¥3711). Telephone
possession is very high. In rural areas, per 100 households telephone possession in 2000 was
61 sets for fixed phones and 20 sets for mobile phones (compared to the national average 26
sets and 4 sets, respectively).
3
Due to rapid industrialisation and urbanisation, opportunity cost for agriculture is high. The
share of agriculture in total GDP has declined rapidly from 38 per cent in 1978 to 11 per cent
in 2000. Crop and animal husbandry is also on the decline. In 1987, per capita grain output
and meat output in Zhejiang were 386kg and 20.9kb, respectively, being slightly higher than
the national average that were 379kg and 20.7kg respectively. By 2000, however, both per
capita grain output (271kg) and per capita meat output (26.2kg) were lower than the national
average that were 374kg and 49.5kg, respectively. Hence, while per capita meat output was
marginally increased, per capita grain output had significantly dropped.
Limited resources can be spared to produce feedgrains and feedgrain production is low.
The percentage share of corn output – the major feedgrain item – out of total grain production
in 2000 is less than 2 per cent (Table 1). Imports of feedgrains have to be used and corns are
mainly sourced from China’s north-east provinces. Traditionally, barley is used to feed pigs in
order to produce a kind of special ham (Jin-Hua Ham). Some low quality of rice is also used
for feed. At the provincial level, although the gross value of animal husbandry has increased,
its share out of total agriculture has declined from 24% in 1990 to 17% in 2000. The number
of pigs in stock also declined in 2000 compared to 1990. The number of pigs slaughtered, on
the other hand, increased slightly (Table 1).
Table 1. Feedgrain Production and Meat Production in Zhejiang Province
1990 2000
Total Population (000) 42349 45012
Area Sown to Grains (000 ha) 3266 2300
Area Sown to Corn (000 ha) 48 52
Corn out of Grains (%) 1.5 2.3
Grain Output (000 t) 15861 12177
Corn Output (000 t) 128 203
Corn out of Grains (%) 0.8 1.7
Gross Value of Agriculture (m ¥) 33677 106290
Gross Value of Animal Husbandry (m ¥) 7957 17730
Animal Husbandry out of Agriculture (%) 24 17
Head of Pigs in Stock (year end) (000) 13305 10430
Head of Pigs Slaughtered (000) 12879 13598
Total Meat Output (000 t) 961 1176
Per Capita Meat Output (kg) 22.7 26.2 Note: Agriculture includes farming, forestry, animal husbandry, fishery and other economic activities carried out
by agricultural population.
Sources: Ministry of Agriculture, Chinese Agricultural Statistics, various issues.
Zhejiang Statistic Bureau, Zhejiang Statistics Yearbook, various issues.
Jiashan county is situated in the north-east plain of Zhejiang. It is close to three major
cities, Suzhou, Shanghai and Hangzhou (capital of Zhejiang). This provides important market
for animal husbandry products of this county. It is chosen for the survey due to its
predominant meat production position in the province. It is a commercial pig production base
of Zhejiang province. This county is also famous in piglet reproduction. Those pig feedlots in
the nearby major urban centres are important buyers of piglets produced in this region.
Six villages, three from each Xiang, were selected. The gross value of animal husbandry
out of total agricultural value in these villages ranged from 2% to 35% in 2000 (see Table 2).
In the past few years, the share of animal husbandry gross value out of total agricultural value
in three out of the six villages has declined with two remaining the same and only one
experiencing an increase. Table 2 also reveals that the gross value generated by other
activities other than farming and animal husbandry accounts for an important share in most of
4
the villages except in one village. All the villages have access to at least one major road and
all have access to extension services.
Table 2. Basic Indicators of Surveyed Villages
Village
and
Sample
Size
Total
Arable
Land
(mu)
Industry Structure According to Gross Value
(%)
Total
Work
Force
(person)
Per
Capita
Net
Annual
Income
(¥)
Any
Exten-
sion
Station
Any
Major
Roads
Passing
the
Village
Farming Animal
Husbandry
Others
1995 2000 1995 2000 1995 2000
1 (40) 5970 50 45 35 25 15 30 1445 5080 Yes Yes
2 (48) 2812 50 50 20 20 30 30 1075 4767 Yes Yes
3 (47) 3227 50 40 30 20 20 40 1293 4500 Yes Yes
4 (48) 4418 65 60 30 35 5 5 1767 5882 Yes Yes
5 (47) 4000 50 35 25 25 25 40 1187 4872 Yes Yes
6 (40) 4680 38 5 19 2 43 93 1348 4403 Yes Yes
Due to high labour opportunity cost and concerns of releasing family business and
financial information, conducting surveys with rural households in such economically
developed regions has become increasingly difficult. Strict random selection of households
was not feasible – due to the likely high rate of rejection for being surveyed. The households
chosen were largely according to local cadres’ understanding of the village situation.
Therefore, the sample is likely biased in favour of those that do raise animals, particularly
those that raise pigs. This, however, should not pose any major problem for this study as it is
mainly concerned about the animal raising behaviour. Nonetheless, it is noted that it would be
most ideal if random selection could be used as that would give us a more accurate picture
about the share of households that do not engage in raising animals.
In Jiashan county, pig production occupies an overwhelming position. Majority of feed is
used for raising pigs (over 80%) with a small share used for poultry production. Cattle and
sheep production is not significant. Therefore, in the rest of the paper, the discussion is
focused on pig production.
3. Findings
Of the 270 surveyed households, 235 households (87%) raise pigs and 35 of them (13%) do
not raise pigs. 2
3.1 Reasons for Raising or not Raising Pigs
It is not only interesting but also very useful to find out why some households do not raise
pigs. Of special interest is to know whether some households choose not to raise pigs is
because their income has increased. If that is the case, then one would anticipate that fewer
and fewer households would raise animals when their income level is increased. This would
likely lead to larger-scale animal raising units which would have subsequent effects on feed
sourcing and feed usage.
We obtained the following responses from our survey as to why some households do not
raise pigs (see Table 3).
2 As noted earlier, the sample is likely biased in favour of those that do raise animals, particularly those that raise
pigs. The actual share of households that do not raise pigs is likely somewhat higher than this percentage.
5
Table 3. Reasons that Farmers Do not Raise Pigs
Reason % of Respondents
1. Never raised pigs 23.1
2. Not profitable 46.2
3. Too troublesome 6.5
4. Too dirty 0.0
5. Too busy to do it 17.8
6. No need to do it because income has increased 1.8
7. Other 4.7 (35 respondents)
The results show that whether a farmer raises pigs or not has little to do with their income
level. It is also not related to whether raising pigs is too troublesome or too dirty. This is
somewhat surprising and needs to be verified from further investigations. Thus, the assertion
cannot be confirmed that a farmer would give up pig raising after income increase because of
the troubles and dirtiness associated with pig raising. In fact, except those that never bothered
to raise pigs (23.1%), the reasons for those not to raise pigs are primarily based on economic
considerations (64%): not profitable and opportunity cost is too high to do it.
Results in Table 4 clearly show that the most important motivation for farmers to raising
pigs in this region is to increase family income. Home consumption is not a major
consideration. Disposing of surplus grains and collecting manure are not important
consideration either. Thus, whether farmers raise or not raise pigs is largely driven by
economic considerations in this region.
Table 4. Reasons that Non-Specialised Households for Raising Pigs
Reason % of Respondents
1. For home consumption 3.4
2. To increase family income 92.2
3. For disposing of surplus grains 1.0
4. For disposing of on-farm by-products 0.5
5. For disposing of tables scrapes 2.4
6. For manure 0.5
7. Other 0.0 (205 corespondents)
Among the 235 households that raise pigs, 159 (68%) were backyard animal raising
(raising 15 hogs or less) and 76 (32%) were specialised. In our study, one sow is treated to be
equivalent to two hogs and five piglets are equivalent to one hog. It is found that the age and
education level of household head and farm size had little influence on whether a farm will
follow traditional backyard animal raising practice or will become a specialised household
(Table 5). However, a family with larger population size and more labour is more likely to
become a specialised animal-raising household. According to our investigation, pig-raising
expertise and the availability of funds seem to be the other two important reasons that affect a
farm’s pig-raising scale. It is interesting to note that the head of those households that do not
raise pigs tend to be younger and have more years of education. These families are also
relatively smaller and their farm size is also smaller (Table 5). This tends to suggest that, in
this region, the smaller nuclear family with higher level of education may lead to reduced
intention to raise pigs in the future, implying that the number of farms engaging in pig raising
will reduce.
6
Table 5. Attributes of Surveyed Households
Family
Size
(Person)
No. of
Labour
(Person)
Age of
Household
Head
(Year)
Education Level of
Household Head
(No. of Years of
Schooling)
Farm
Size
(mu)
Backyard animal raising 3.6 2.6 45.0 6.8 7.5
Specialised households 4.1 2.9 45.7 7.0 7.6
No animal raising 3.3 2.1 40.4 9.3 4.0
3.2 Feedgrain Production
The survey results tend to indicate that feedgrain production in this region has been declining
and is unlikely to increase in the future. The respondents were asked, compared to five years
ago, what changes had happened to their sown area to feedgrains (e.g., corn, barley) and
forage crops. The responses obtained are given in Table 6.
Table 6. Changes in Sown Area to Feedgrains and Forage Crops
Change %
1. A major increase 2.8
2. A slight increase 5.3
3. Almost the same 70.0
4. A slight decrease 10.9
5. A major decrease 10.9 (247 respondents)
It can be seen that, in balance, more farmers have chosen to reduce their area allocated to
feedgrain and forage production. For the few who indicated that their sown area to feedgrain
production and forage had increased, the major reasons they gave were for on-farm use
(30%), for high yield (28%), and for a good price (28%).
When asked how they would plan their sown area to feedgrain and forage crops in the near
future (2-3 years), the replies had suggested that the sown area is unlikely to increase but may
decline (see Table 7).
Table 7. Future Changes in Sown Area to Feedgrains and Forage Crops
Change %
1. A major increase 0.4
2. A slight increase 4.2
3. Almost the same 82.1
4. A slight decrease 10.4
5. A major decrease 2.9 (240 respondents)
3.3 Composition and Sources of Feed
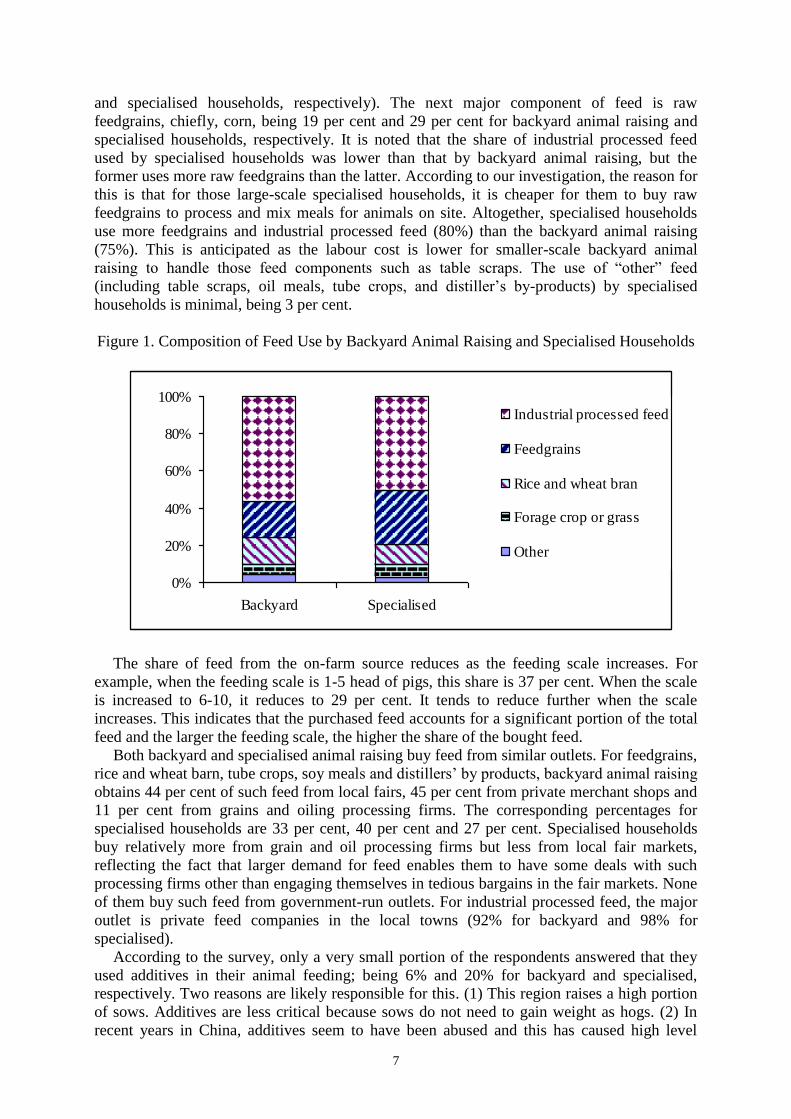
Figure 1 shows the composition of feed use by backyard animal raising and specialised
households. It is clear that in this region, industrial processed feed was a major component of
feed, accounting for over 50 per cent in both cases (56% and 51% for backyard animal raising
7
and specialised households, respectively). The next major component of feed is raw
feedgrains, chiefly, corn, being 19 per cent and 29 per cent for backyard animal raising and
specialised households, respectively. It is noted that the share of industrial processed feed
used by specialised households was lower than that by backyard animal raising, but the
former uses more raw feedgrains than the latter. According to our investigation, the reason for
this is that for those large-scale specialised households, it is cheaper for them to buy raw
feedgrains to process and mix meals for animals on site. Altogether, specialised households
use more feedgrains and industrial processed feed (80%) than the backyard animal raising
(75%). This is anticipated as the labour cost is lower for smaller-scale backyard animal
raising to handle those feed components such as table scraps. The use of “other” feed
(including table scraps, oil meals, tube crops, and distiller’s by-products) by specialised
households is minimal, being 3 per cent.
Figure 1. Composition of Feed Use by Backyard Animal Raising and Specialised Households
The share of feed from the on-farm source reduces as the feeding scale increases. For
example, when the feeding scale is 1-5 head of pigs, this share is 37 per cent. When the scale
is increased to 6-10, it reduces to 29 per cent. It tends to reduce further when the scale
increases. This indicates that the purchased feed accounts for a significant portion of the total
feed and the larger the feeding scale, the higher the share of the bought feed.
Both backyard and specialised animal raising buy feed from similar outlets. For feedgrains,
rice and wheat barn, tube crops, soy meals and distillers’ by products, backyard animal raising
obtains 44 per cent of such feed from local fairs, 45 per cent from private merchant shops and
11 per cent from grains and oiling processing firms. The corresponding percentages for
specialised households are 33 per cent, 40 per cent and 27 per cent. Specialised households
buy relatively more from grain and oil processing firms but less from local fair markets,
reflecting the fact that larger demand for feed enables them to have some deals with such
processing firms other than engaging themselves in tedious bargains in the fair markets. None
of them buy such feed from government-run outlets. For industrial processed feed, the major
outlet is private feed companies in the local towns (92% for backyard and 98% for
specialised).
According to the survey, only a very small portion of the respondents answered that they
used additives in their animal feeding; being 6% and 20% for backyard and specialised,
respectively. Two reasons are likely responsible for this. (1) This region raises a high portion
of sows. Additives are less critical because sows do not need to gain weight as hogs. (2) In
recent years in China, additives seem to have been abused and this has caused high level
0%
20%
40%
60%
80%
100%
Backyard Specialised
Industrial processed feed
Feedgrains
Rice and wheat bran
Forage crop or grass
Other
8
residuals in final products. Increasingly health-conscious consumers have been very
concerned and tried to avoid such products. Producers, being aware of such concerns, have
tried to distance their products from the use of additives. During our survey, we noticed that
many respondents avoided using the term “additives”, instead, they chose to use the term
“micro nutrients”. Therefore some respondents might have significantly underestimated their
use of additives.
3.4 Feed-Meat Conversion Ratios
Feed-meat conversion ratios are a critical variable in feedgrain demand projections (feed here
refers to fine feed only). To date, there are not many commonly accepted such ratios. This
may be not surprising due to regional differences and different animal raising practices.
NORHS (1998) believes that specialised households have a higher feeding efficiency than
backyard animal raising and therefore the former has a lower feedgrain-meat conversion ratio
while the latter has a higher conversion ratio. However, others argue that backyard raising has
the smallest feedgrain-meat conversion ratio because this practice uses less feedgrains but
more other feed components (Guo et al., re-cited from Zhang, X.H. 1998).
Our survey results show that, at the all-six village level, the difference in feedgrain-pork
conversion ratios between the backyard and specialised is marginal, being 3.13 for the former
and 3.08 for the latter. This is perhaps the composition of feed used in both cases is similar, as
shown in Figure 1. Therefore, the conversion ratio is likely more affected by the composition
of the feed and the kind of pig breeds but less by the scale of production.
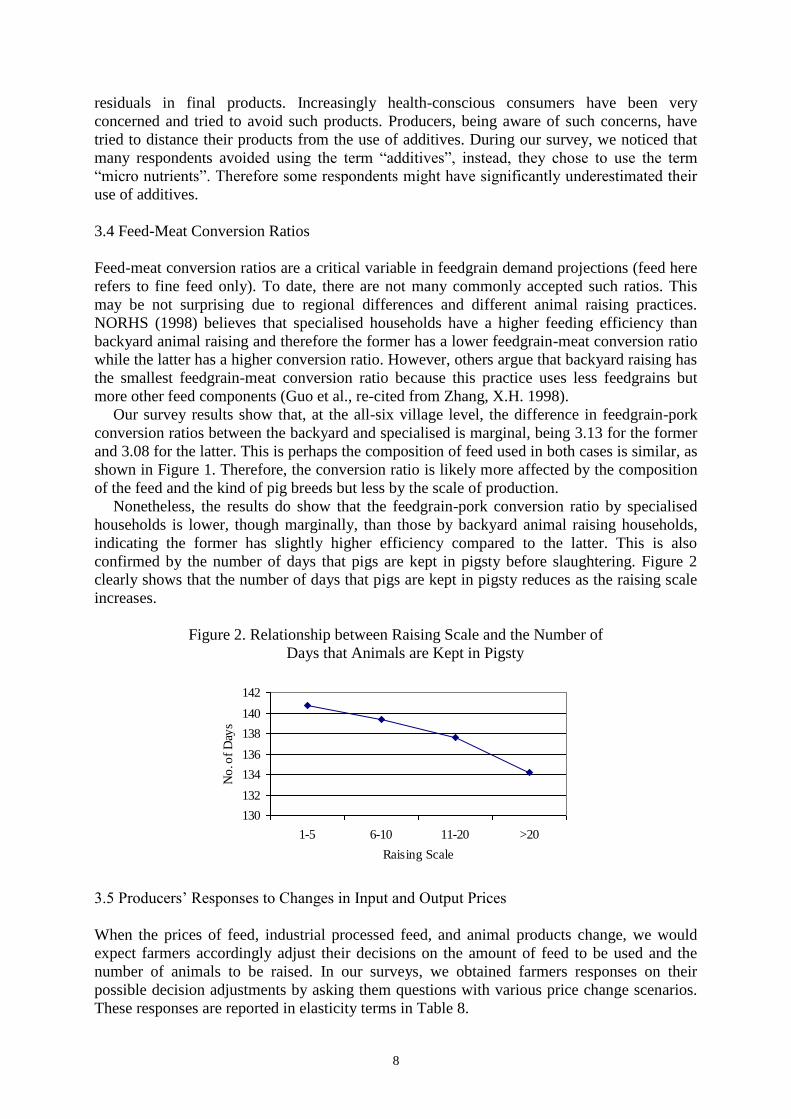
Nonetheless, the results do show that the feedgrain-pork conversion ratio by specialised
households is lower, though marginally, than those by backyard animal raising households,
indicating the former has slightly higher efficiency compared to the latter. This is also
confirmed by the number of days that pigs are kept in pigsty before slaughtering. Figure 2
clearly shows that the number of days that pigs are kept in pigsty reduces as the raising scale
increases.
Figure 2. Relationship between Raising Scale and the Number of
Days that Animals are Kept in Pigsty
3.5 Producers’ Responses to Changes in Input and Output Prices
When the prices of feed, industrial processed feed, and animal products change, we would
expect farmers accordingly adjust their decisions on the amount of feed to be used and the
number of animals to be raised. In our surveys, we obtained farmers responses on their
possible decision adjustments by asking them questions with various price change scenarios.
These responses are reported in elasticity terms in Table 8.
130
132
134
136
138
140
142
1-5 6-10 11-20 >20
Raising Scale
No
. of
Day
s
9
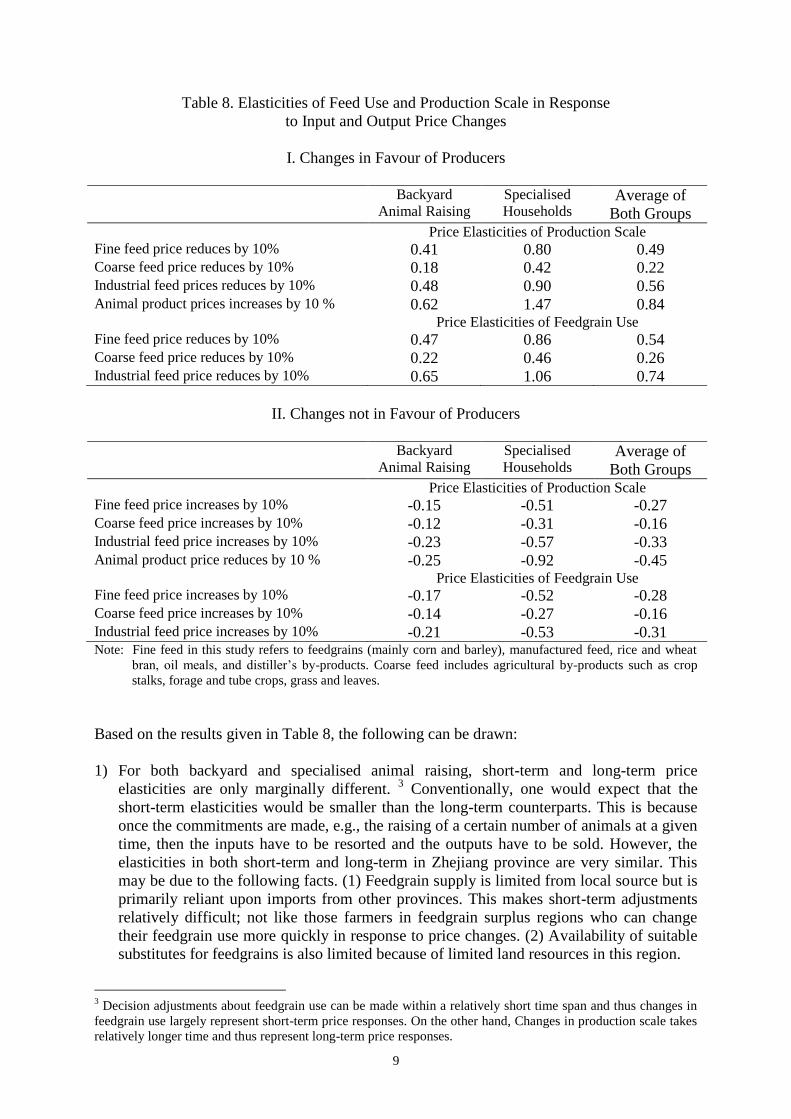
Table 8. Elasticities of Feed Use and Production Scale in Response
to Input and Output Price Changes
I. Changes in Favour of Producers
Backyard
Animal Raising Specialised
Households Average of
Both Groups Price Elasticities of Production Scale Fine feed price reduces by 10% 0.41 0.80 0.49 Coarse feed price reduces by 10% 0.18 0.42 0.22 Industrial feed prices reduces by 10% 0.48 0.90 0.56 Animal product prices increases by 10 % 0.62 1.47 0.84 Price Elasticities of Feedgrain Use Fine feed price reduces by 10% 0.47 0.86 0.54 Coarse feed price reduces by 10% 0.22 0.46 0.26 Industrial feed price reduces by 10% 0.65 1.06 0.74
II. Changes not in Favour of Producers
Backyard
Animal Raising Specialised
Households Average of
Both Groups Price Elasticities of Production Scale Fine feed price increases by 10% -0.15 -0.51 -0.27 Coarse feed price increases by 10% -0.12 -0.31 -0.16 Industrial feed price increases by 10% -0.23 -0.57 -0.33 Animal product price reduces by 10 % -0.25 -0.92 -0.45 Price Elasticities of Feedgrain Use Fine feed price increases by 10% -0.17 -0.52 -0.28 Coarse feed price increases by 10% -0.14 -0.27 -0.16 Industrial feed price increases by 10% -0.21 -0.53 -0.31 Note: Fine feed in this study refers to feedgrains (mainly corn and barley), manufactured feed, rice and wheat
bran, oil meals, and distiller’s by-products. Coarse feed includes agricultural by-products such as crop
stalks, forage and tube crops, grass and leaves.
Based on the results given in Table 8, the following can be drawn:
1) For both backyard and specialised animal raising, short-term and long-term price
elasticities are only marginally different. 3 Conventionally, one would expect that the
short-term elasticities would be smaller than the long-term counterparts. This is because
once the commitments are made, e.g., the raising of a certain number of animals at a given
time, then the inputs have to be resorted and the outputs have to be sold. However, the
elasticities in both short-term and long-term in Zhejiang province are very similar. This
may be due to the following facts. (1) Feedgrain supply is limited from local source but is
primarily reliant upon imports from other provinces. This makes short-term adjustments
relatively difficult; not like those farmers in feedgrain surplus regions who can change
their feedgrain use more quickly in response to price changes. (2) Availability of suitable
substitutes for feedgrains is also limited because of limited land resources in this region.
3 Decision adjustments about feedgrain use can be made within a relatively short time span and thus changes in
feedgrain use largely represent short-term price responses. On the other hand, Changes in production scale takes
relatively longer time and thus represent long-term price responses.
10
2) Among all short- and long-term elasticities, the response to animal product price change
tends to be the largest. This indicates that, ceteris paribus, output price delivers a stronger
message to producers.
3) In both short- and long-run, the price elasticities for backyard animal raising are smaller
than those for specialised household animal raising. This suggests that, in economically
developed regions like Zhejiang, specialised animal raising seems to be more responsive
to price changes than their backyard counterparts. It is possible for specialised households
to be more responsive to market changes in developed regions because there are more
other opportunities available in such regions.
4) Both groups of farmers are more responsive when price changes are in their favour. Thus,
if input prices reduce, it is likely that they will use more of such inputs.
3.6 Producers’ Intention towards Future Development of Animal Husbandry
Based on their current production cost and income, the majority of the respondents had
chosen not to increase their production scale (Table 9). It is clear that backyard animal raising
in this region will not expand, instead some farms may quit the pig-raising industry. Some 20
per cent of those specialised households are willing to expand. The possible future scenario is
that fewer but larger scale pig-raising will be emerging in this region.
Table 9. Intention to Expand Animal Raising Scale
Backyard Animal Raising Specialised Households
Intend to expand 8.9% 19.3%
Intend to reduce 3.7% 8.1%
No change 87.4% 72.6%
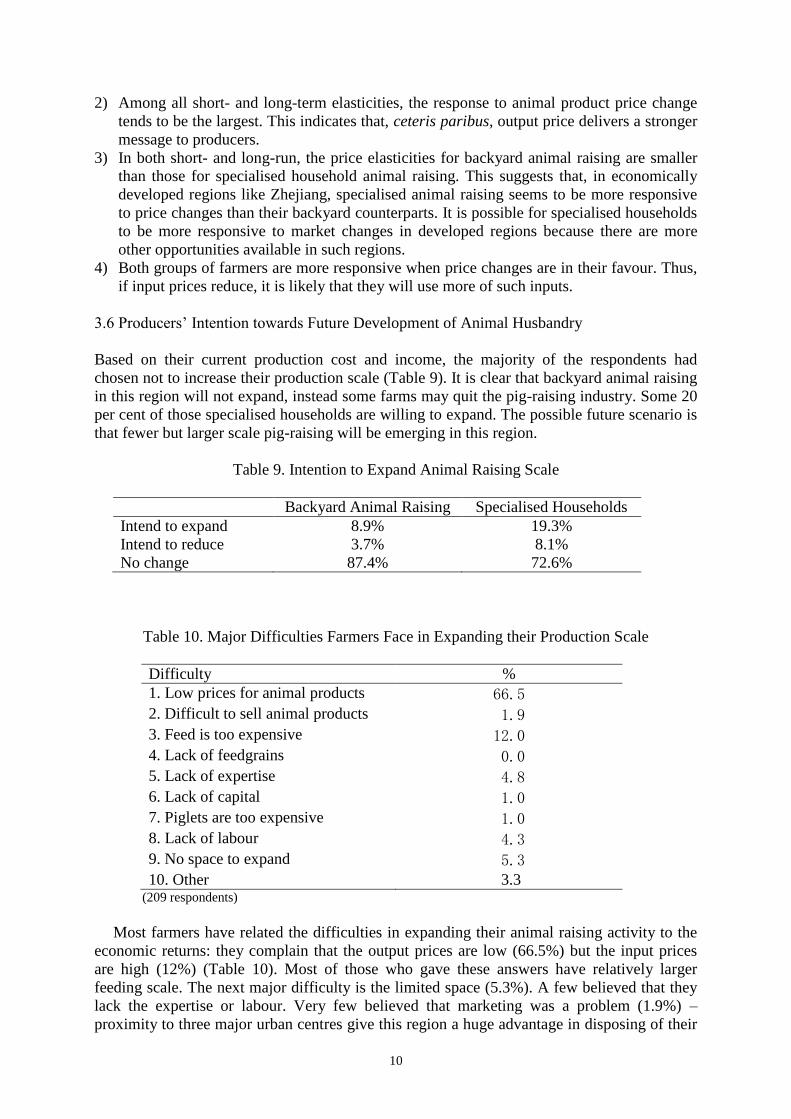
Table 10. Major Difficulties Farmers Face in Expanding their Production Scale
Difficulty %
1. Low prices for animal products 66.5 2. Difficult to sell animal products 1.9 3. Feed is too expensive 12.0 4. Lack of feedgrains 0.0 5. Lack of expertise 4.8 6. Lack of capital 1.0 7. Piglets are too expensive 1.0 8. Lack of labour 4.3 9. No space to expand 5.3 10. Other 3.3
(209 respondents)
Most farmers have related the difficulties in expanding their animal raising activity to the
economic returns: they complain that the output prices are low (66.5%) but the input prices
are high (12%) (Table 10). Most of those who gave these answers have relatively larger
feeding scale. The next major difficulty is the limited space (5.3%). A few believed that they
lack the expertise or labour. Very few believed that marketing was a problem (1.9%) –
proximity to three major urban centres give this region a huge advantage in disposing of their
11
products. Low feedgrain production in this region is not thought to be a problem by any of the
respondents. They can always import feedgrains if such imports are economically worthwhile.
Had they intended to expand their production scale, the way they would source their
increased feed is overwhelmingly through purchasing feedgrains or processed industrial feed
(78.8%). Some would expand feedgrain production (7.4%). Some others would choose to buy
more rice or wheat barn (1.4%) or tube crops, distillers’ by products, or soybean meals
(3.2%); those who choose these options generally have smaller feeding scale. None would
choose to buy table scraps from restaurants or others; perhaps too troublesome to do so. The
other 9.2 per cent of the respondents choose to use various “other” ways to increase their feed.
4. Summary and Concluding Comments
This paper reports the findings from a survey that examines issues related to farm household
animal raising practice in an economically developed region in China. The survey was
conducted in May-June 2001 in Jiashan country of Zhejiang province. Of the 270 households
surveyed, 87% raised pigs and 13% did not raise pigs. Except those that never raised pigs,
whether farmers raise pigs or not is largely driven by economic considerations in the surveyed
region.
Feedgrain production in this region has been declining and is unlikely to increase in the
future. The composition of feed used by backyard animal raising and specialised households
is very similar with raw feedgrains and industrial processed feed being the major component
and accounting for over 75 per cent. Farms buy a significant portion of their feed from the
market. This portion increases as the feeding scale increases.
At the village level, the feedgrain-pork conversion ratios by specialised households are
marginally lower than those by backyard animal raising households. The number of days that
pigs are kept in pigsty reduces as the raising scale increases. It seems specialised households
have slightly higher efficiency compared to their backyard counterparts.
When the animal raising scale is small, a household relies less on the market for obtaining
their feed inputs and for the disposal of their animal products, and thus is less responsive to
price changes. When the scale increases, a household’s reliance on the market increases and
subsequently becomes more responsive to price signals in the market. In the surveyed regions
in Zhejiang province, specialised animal raising is more responsive to price changes than
backyard animal raising.
Not many farmers are willing to expand their production scale. Apart from concerns of
economic returns, limited space in this highly populated area is another key constraint for the
expansion of animal production.
Hence, according to our survey, feedgrain production in Zhejiang province will continue to
decline and feedgrain imports will be necessary. The number of farm households that raise
animals will decline. However, the remaining animal raising farms are likely to increase their
production scale. Overall, the trends tend to indicate that the animal husbandry industry in
Zhejiang province is unlikely to expand but may gradually shrink.
As far as feedgrains are concerned, in this economically developed region, farmers can
afford to buy feed. They will buy more feed when their production scale increases. In
addition, our survey results show that farmers are more responsive when price changes are in
favour of them. Thus, if feed prices reduce, it is likely that they will use more of such inputs.
Given that China is now a member of the WTO, it will gradually open its grain markets.
Increased market opening up may lead to lower grain prices in China. Consequently, how this
may affect the demand for feedgrains in this region deserves continued attention.
12
References
Cao, L.Q. (1998), ‘Is animal production by households still a sideline operation?’, Reference
Materials for Rural Economic Research , No. 8, pp. 26-29.
Ministry of Agriculture, Chinese Agricultural Statistics, various issues, China Agricultural
Press, Beijing.
NORHS (National Office for Rural Household Surveys) (1998), ‘A comparative study of
production efficiency and profitability of various animal raising practices’, Reference
Materials for Rural Economic Research , No. 8, pp. 20-25.
Qi, J.F. et al. (1999), Yearbook of China Animal Husbandry Industry 1999, China
Agricultural Press, Beijing.
SSB (State Statistical Bureau), China Statistical Yearbook, various issues, China Statistical
Press, Beijing.
Wang, J.M., Zhou, L., Liang, S.M. and Fan, C.H. (1999), ‘Cost structure of pork production:
A case study of Sichuan province’, Problems of Agricultural Economics, No. 4, pp. 24-27.
Zhang, X.H. (1998), ‘An analysis of household pig raising situation and economic return in
China’, Chinese Rural Survey, No. 1, pp. 53-61.
Zhang, X.H. and Lu, M. (1997), ‘Pig production scale and feed conversion ratios’, Chinese
Rural Economy, No.10, pp.63-66.
Zhejiang Statistic Bureau, Zhejiang Statistical Yearbook, various issues, China Statistical
Press, Beijing.
Zhou, Z.Y., Tian, W.M., Liu, X.A. and Wan, G.H. (2001), ‘An issue of debate: China’s
feedgrain demand and supply’, AARC working Paper Series, No. 15, Asian Agribusiness
Research Centre, The University of Sydney.