Embed Size (px)
Citation preview
University of Illinois at Urbana ChampaignThe University of MaineUniversity of Maine at AugustaUniversity of Maine at FarmingtonUniversity of Maine at MachiasUniversity of Maine at Presque IsleUniversity of Maine at Fort KentUniversity of MarylandUniversity of Massachusetts AmherstUniversity of Massachusetts BostonUniversity of Massachusetts DartmouthUniversity of Massachusetts LowellUniversity of Michigan University of Minnesota
Sightlines LLCFY10 F iliti MB&A P t ti
University of Minnesota University of MissouriUniversity of Missouri ‐ Kansas CityUniversity of Missouri ‐ St. LouisUniversity of New HampshireUniversity of New HavenUniversity of Notre DameFY10 Facilities MB&A Presentation
University of Maine SystemUniversity of OregonUniversity of PennsylvaniaUniversity of PortlandUniversity of RedlandsThe University of Rhode Island, Narragansett BayThe University of Rhode Island, Feinstein ProvidencTh U i it f Rh d I l d Ki tJanuary 10th, 2011
Presented by: Jim Kadamus
The University of Rhode Island, KingstonUniversity of RochesterUniversity of San DiegoUniversity of San FranciscoUniversity of St. Thomas (TX)University of Southern MaineUniversity of ToledoyUniversity of VermontUpper Iowa UniversityUtica CollegeVassar CollegeVirginia Commonwealth UniversityVirginia Department of General Services
ll
1
Wagner CollegeWellesley CollegeWesleyan UniversityWest Chester University of PennsylvaniaWest Virginia University Western Oregon UniversityWheaton College (MA)
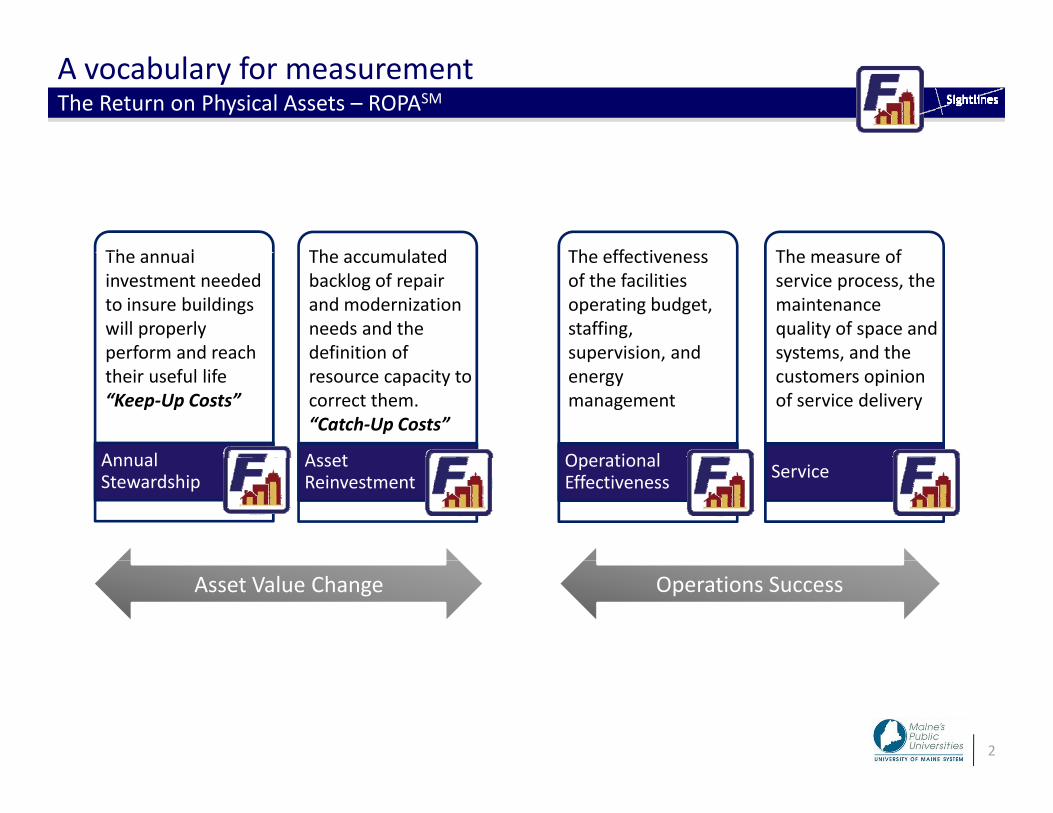
A vocabulary for measurementThe Return on Physical Assets – ROPASM
Th l Th l t d Th ff ti Th fThe annual investment needed to insure buildings will properly perform and reach
The accumulated backlog of repair and modernization needs and the definition of
The effectiveness of the facilities operating budget, staffing, supervision and
The measure of service process, the maintenance quality of space and systems and the
Annual
perform and reach their useful life “Keep‐Up Costs”
Asset
definition of resource capacity to correct them. “Catch‐Up Costs”
Operational
supervision, and energy management
systems, and the customers opinion of service delivery
Annual Stewardship
Asset Reinvestment
Operational Effectiveness Service
Asset Value Change Operations Success
2
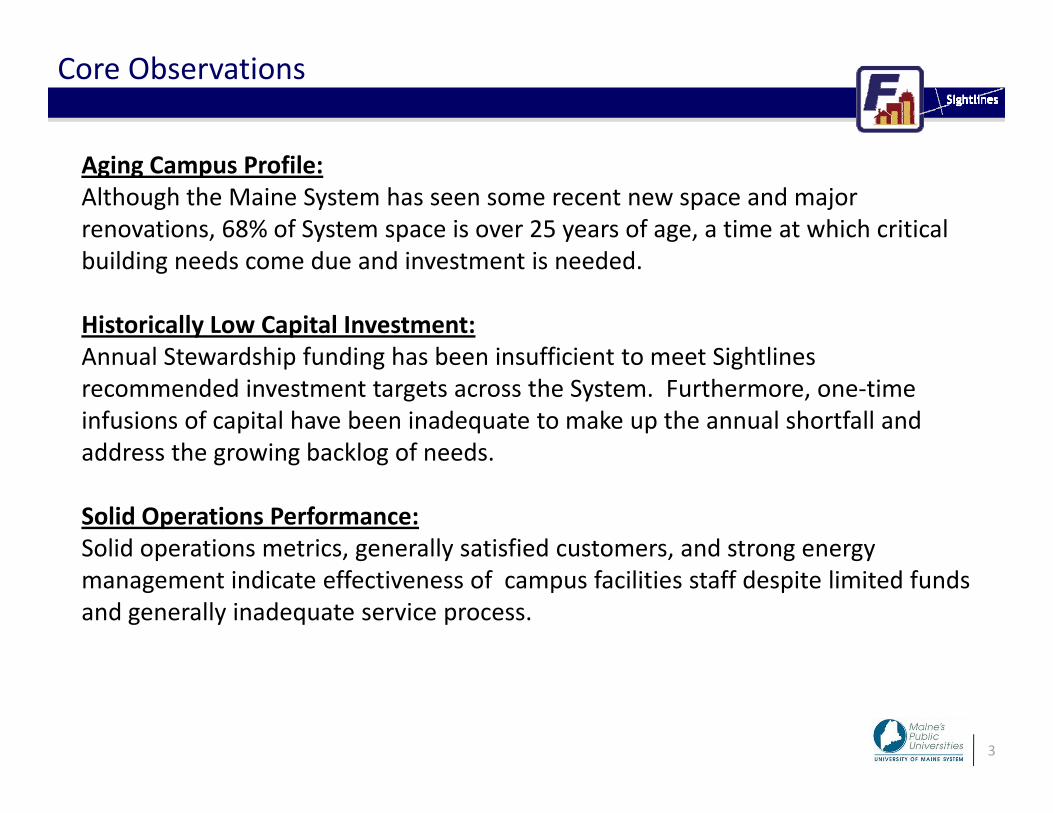
Core Observations
Aging Campus Profile:Although the Maine System has seen some recent new space and major renovations, 68% of System space is over 25 years of age, a time at which critical b ildi d d d i i d dbuilding needs come due and investment is needed.
Historically Low Capital Investment:Annual Stewardship funding has been insufficient to meet SightlinesAnnual Stewardship funding has been insufficient to meet Sightlines recommended investment targets across the System. Furthermore, one‐time infusions of capital have been inadequate to make up the annual shortfall andaddress the growing backlog of needs.address the growing backlog of needs.
Solid Operations Performance:Solid operations metrics, generally satisfied customers, and strong energy p g y g gymanagement indicate effectiveness of campus facilities staff despite limited funds and generally inadequate service process.
3
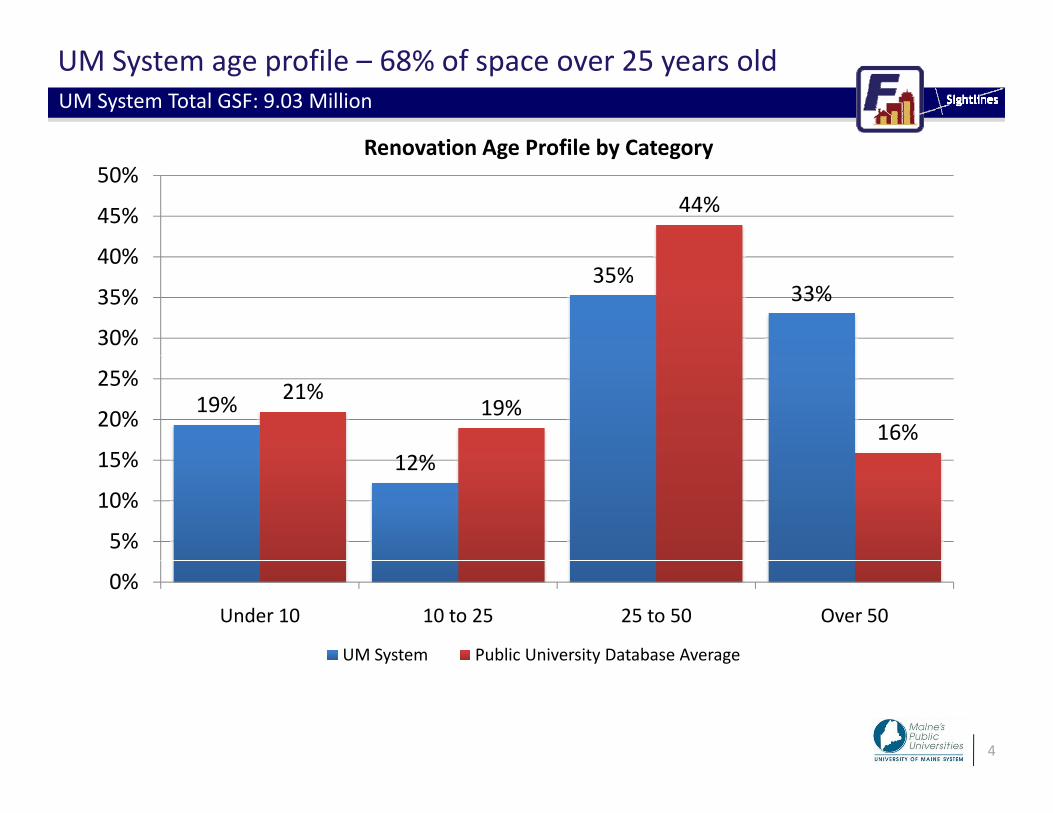
UM System age profile – 68% of space over 25 years oldUM System Total GSF: 9.03 Million
Renovation Age Profile by Category
44%
40%
45%
50%Renovation Age Profile by Category
35%33%
30%
35%
40%
19%
12%
21%19%
16%15%
20%
25%
12%
5%
10%
15%
0%Under 10 10 to 25 25 to 50 Over 50
UM System Public University Database Average
4
y y g
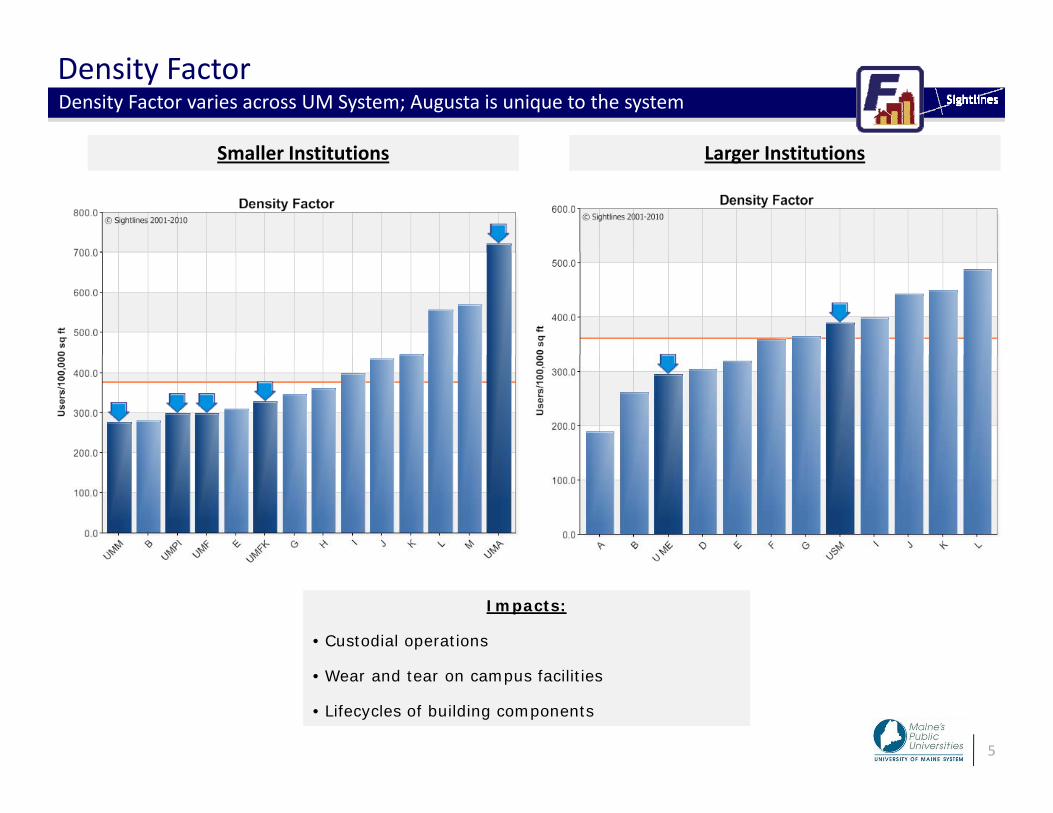
Density Factor
Smaller Institutions Larger Institutions
Density Factor varies across UM System; Augusta is unique to the system
Smaller Institutions Larger Institutions
Impacts:
• Custodial operations
5
• Wear and tear on campus facilities
• Lifecycles of building components
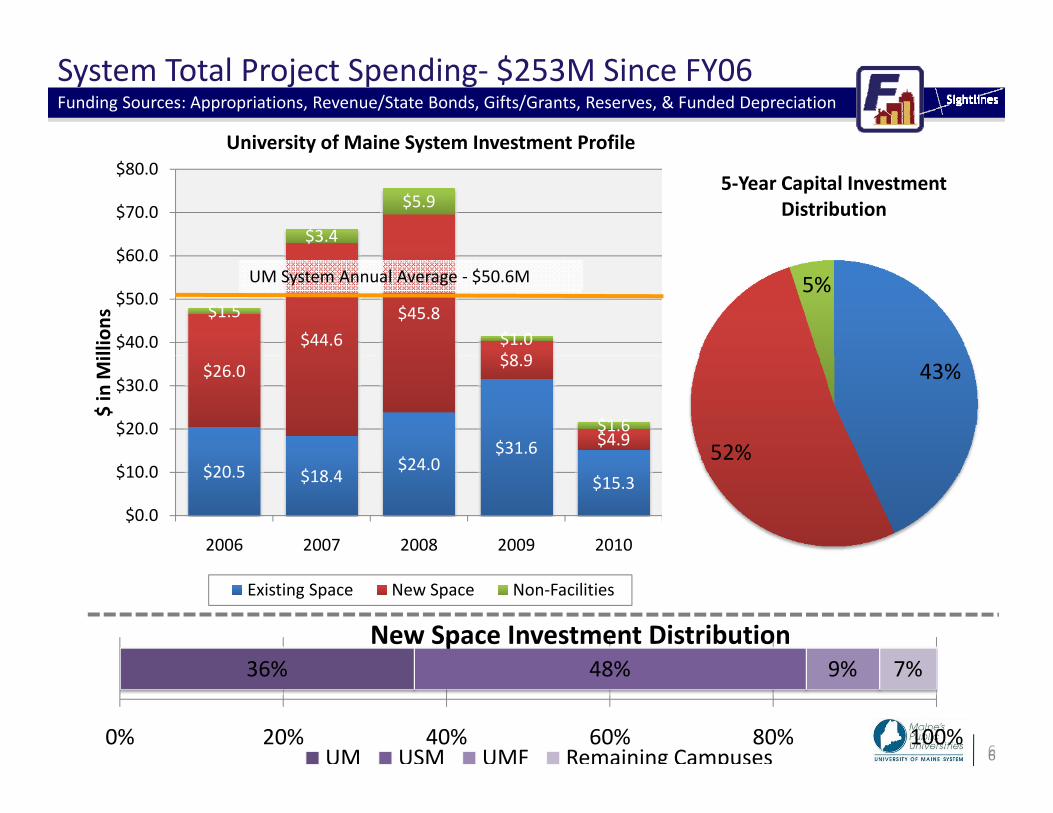
University of Maine System Investment Profile
System Total Project Spending‐ $253M Since FY06Funding Sources: Appropriations, Revenue/State Bonds, Gifts/Grants, Reserves, & Funded Depreciation
$3.4
$5.9
$60 0
$70.0
$80.0y y
5‐Year Capital Investment Distribution
$44.6$45.8
$8 9
$1.5$1.0$40.0
$50.0
$60.0
llion
s
UM System Annual Average ‐ $50.6M 5%
$$31.6
$26.0 $8.9
$4.9$1.6$20.0
$30.0
$ in M
i
43%
52%$20.5 $18.4
$24.0$15.3
$0.0
$10.0
2006 2007 2008 2009 2010
52%
Existing Space New Space Non‐Facilities
36% 48% 9% 7%New Space Investment Distribution
66
36% 48% 9% 7%
0% 20% 40% 60% 80% 100%UM USM UMF Remaining Campuses
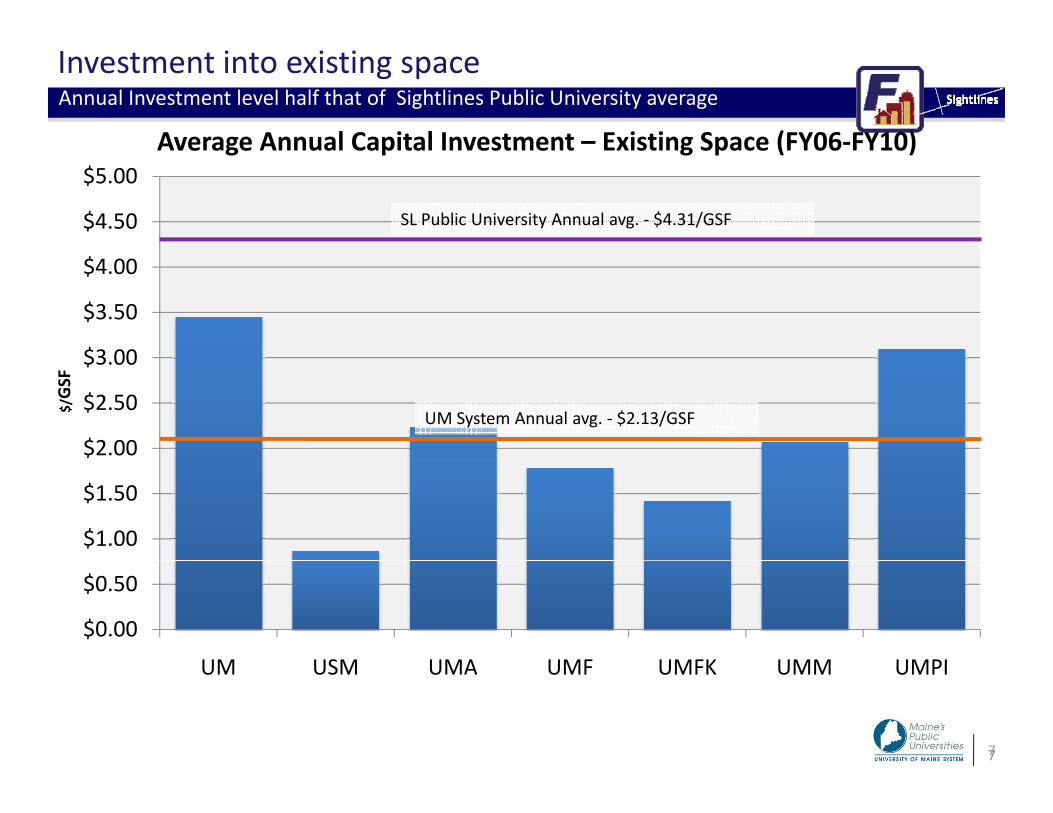
Investment into existing spaceAnnual Investment level half that of Sightlines Public University average
Average Annual Capital Investment – Existing Space (FY06‐FY10)
$4.50
$5.00Average Annual Capital Investment Existing Space (FY06 FY10)
SL Public University Annual avg. ‐ $4.31/GSF
$3 00
$3.50
$4.00
$2.00
$2.50
$3.00
$/GSF
UM System Annual avg. ‐ $2.13/GSF
$1.00
$1.50
$0.00
$0.50
UM USM UMA UMF UMFK UMM UMPI
77
UM USM UMA UMF UMFK UMM UMPI
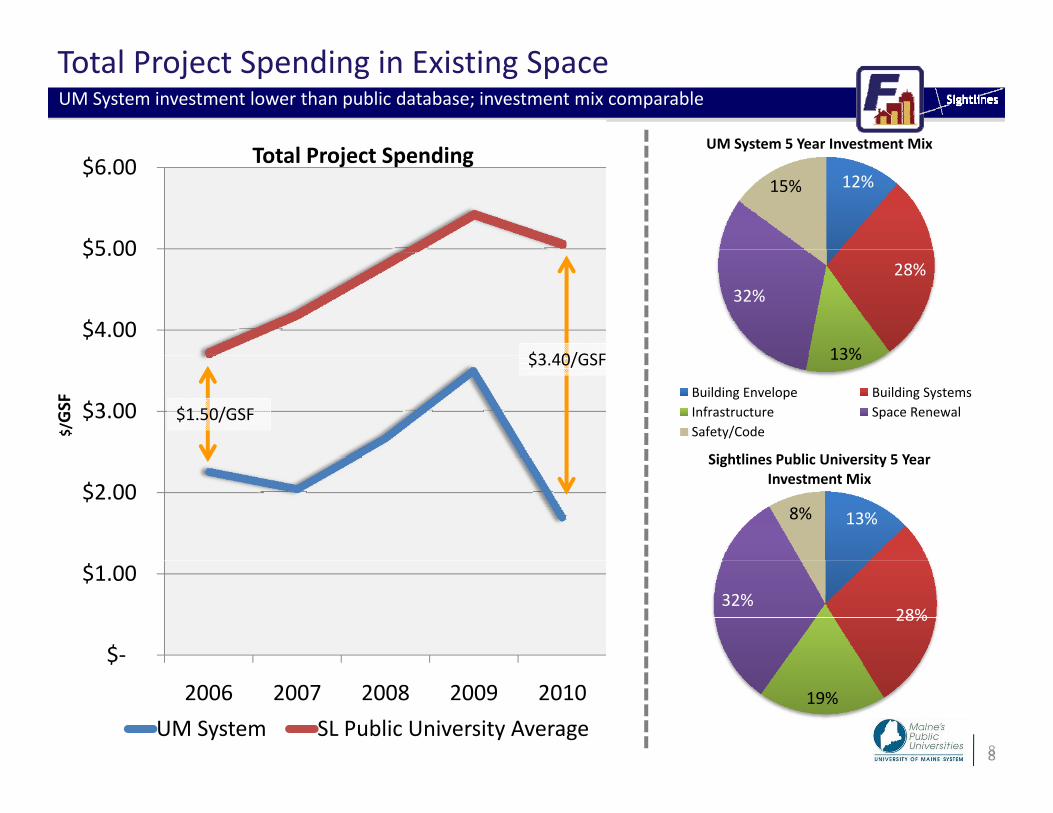
Total Project Spending in Existing SpaceUM System investment lower than public database; investment mix comparable
T t l P j t S di UM System 5 Year Investment Mix
$5 00
$6.00 Total Project Spending12%15%
y
$4.00
$5.00
$3 40/GSF
28%
13%
32%
$3.00
$/GSF
$3.40/GSF
$1.50/GSF
13%
Building Envelope Building SystemsInfrastructure Space RenewalSafety/Code
Sightlines Public University 5 Year
$2.00 13%8%
Sightlines Public University 5 Year Investment Mix
$‐
$1.00
28%32%
88
$
2006 2007 2008 2009 2010UM System SL Public University Average
19%
Annual Stewardship
Setting Investment goals to maintain System
9
FY2010 Stewardship Targets
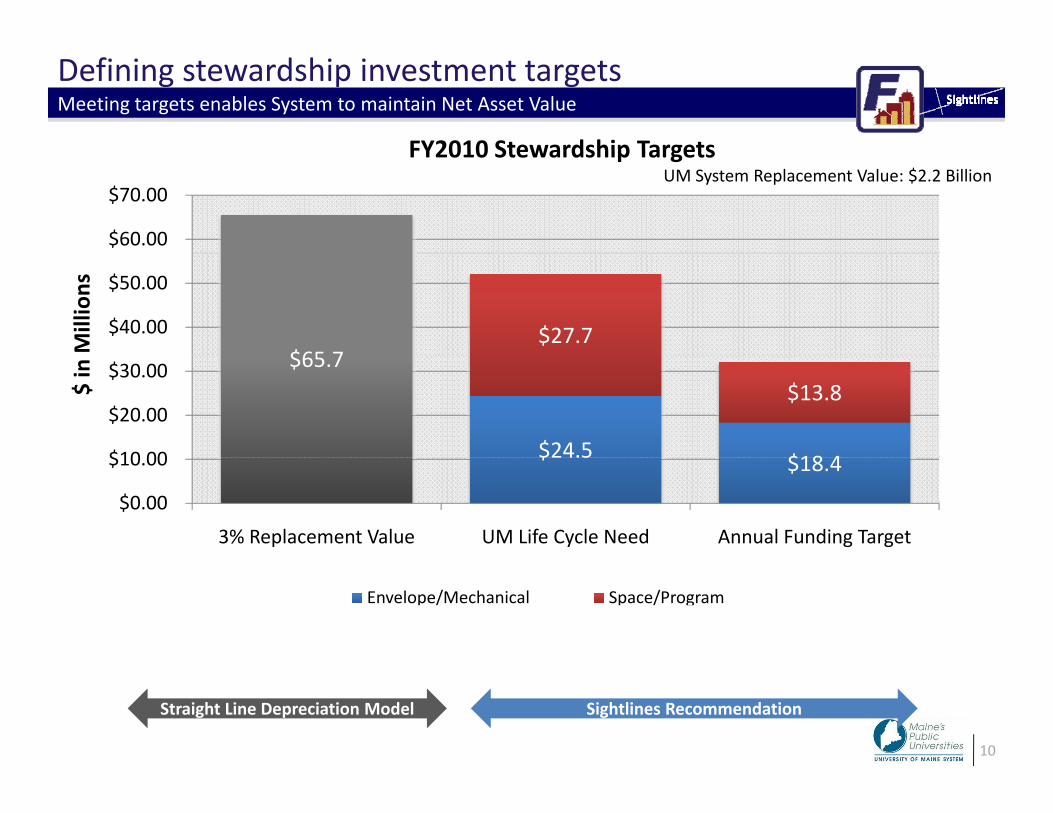
Defining stewardship investment targetsMeeting targets enables System to maintain Net Asset Value
$60.00
$70.00
FY2010 Stewardship TargetsUM System Replacement Value: $2.2 Billion
$65 7$27.7$40.00
$50.00
Millions
$65.7
$24.5 $18 4
$13.8
$10 00
$20.00
$30.00
$ in
$ $18.4
$0.00
$10.00
3% Replacement Value UM Life Cycle Need Annual Funding Target
Envelope/Mechanical Space/Program
Total $ in Millions $65.7 $52.2 $32.2
% of Replacement 3% 2 4% 1 5%
10
Straight Line Depreciation Model Sightlines Recommendation
% of Replacement 3% 2.4% 1.5%
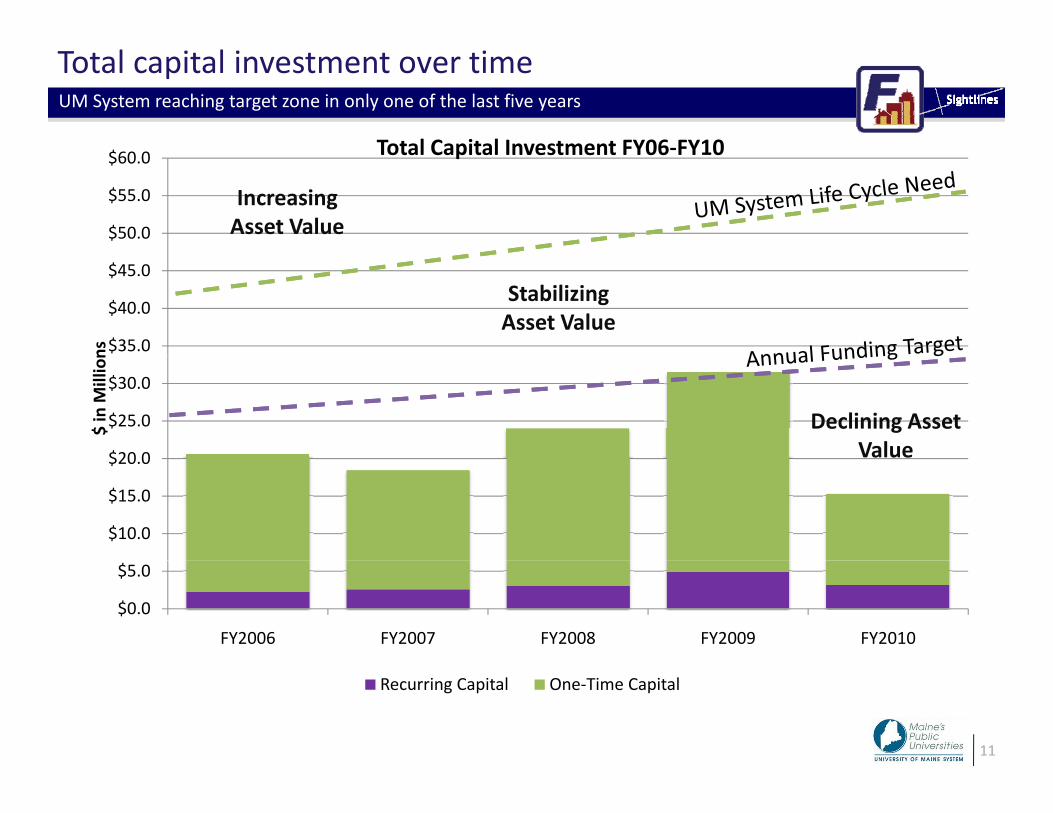
Total capital investment over time
$
UM System reaching target zone in only one of the last five years
Total Capital Investment FY06‐FY10
$50.0
$55.0
$60.0
Increasing Asset Value
Total Capital Investment FY06 FY10
$35.0
$40.0
$45.0
ns
Stabilizing Asset Value
$20 0
$25.0
$30.0
$ in M
illion
Declining Asset Value
$10.0
$15.0
$20.0
$0.0
$5.0
FY2006 FY2007 FY2008 FY2009 FY2010
11
Recurring Capital One‐Time Capital
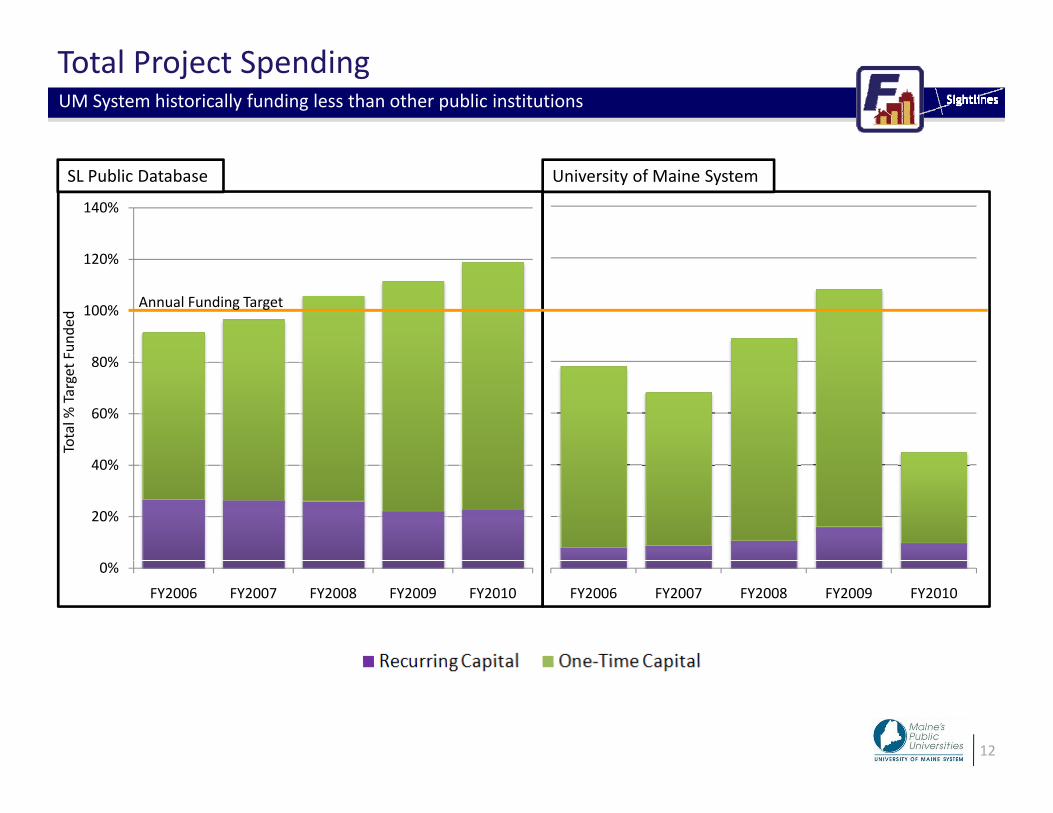
Total Project SpendingUM System historically funding less than other public institutions
140%
SL Public Database University of Maine System
100%
120%
Fund
ed
Annual Funding Target
60%
80%
Total %
Target F
20%
40%
0%
FY2006 FY2007 FY2008 FY2009 FY2010 FY2006 FY2007 FY2008 FY2009 FY2010
12
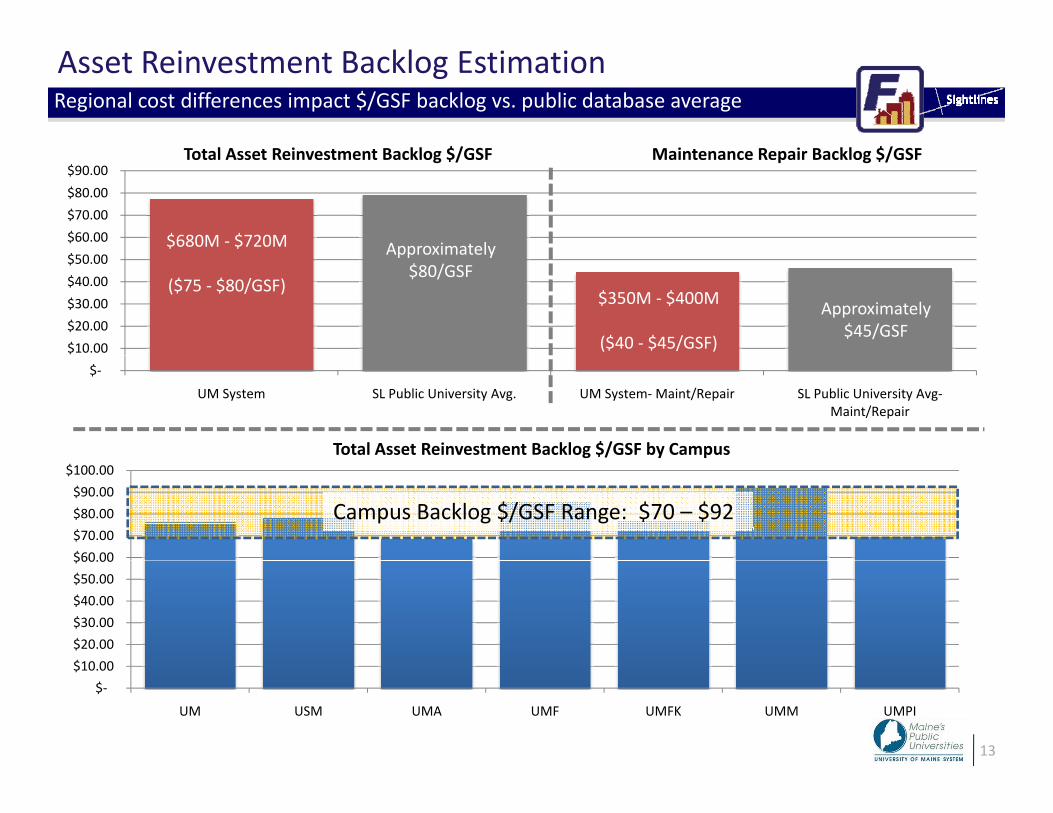
Asset Reinvestment Backlog EstimationRegional cost differences impact $/GSF backlog vs. public database average
T t l A t R i t t B kl $/GSF M i t R i B kl $/GSF
$$60.00 $70.00 $80.00 $90.00
Total Asset Reinvestment Backlog $/GSF
$680M ‐ $720M Approximately
Maintenance Repair Backlog $/GSF
$10.00 $20.00 $30.00 $40.00 $50.00
($75 ‐ $80/GSF)
Approximately $80/GSF
$350M ‐ $400M
($40 ‐ $45/GSF)
Approximately $45/GSF
$‐
UM System SL Public University Avg. UM System‐Maint/Repair SL Public University Avg‐Maint/Repair
Total Asset Reinvestment Backlog $/GSF by Campus
$60.00$70.00 $80.00 $90.00
$100.00 g y p
Campus Backlog $/GSF Range: $70 – $92
$10 00$20.00 $30.00 $40.00 $50.00 $60.00
13
$‐$10.00
UM USM UMA UMF UMFK UMM UMPI
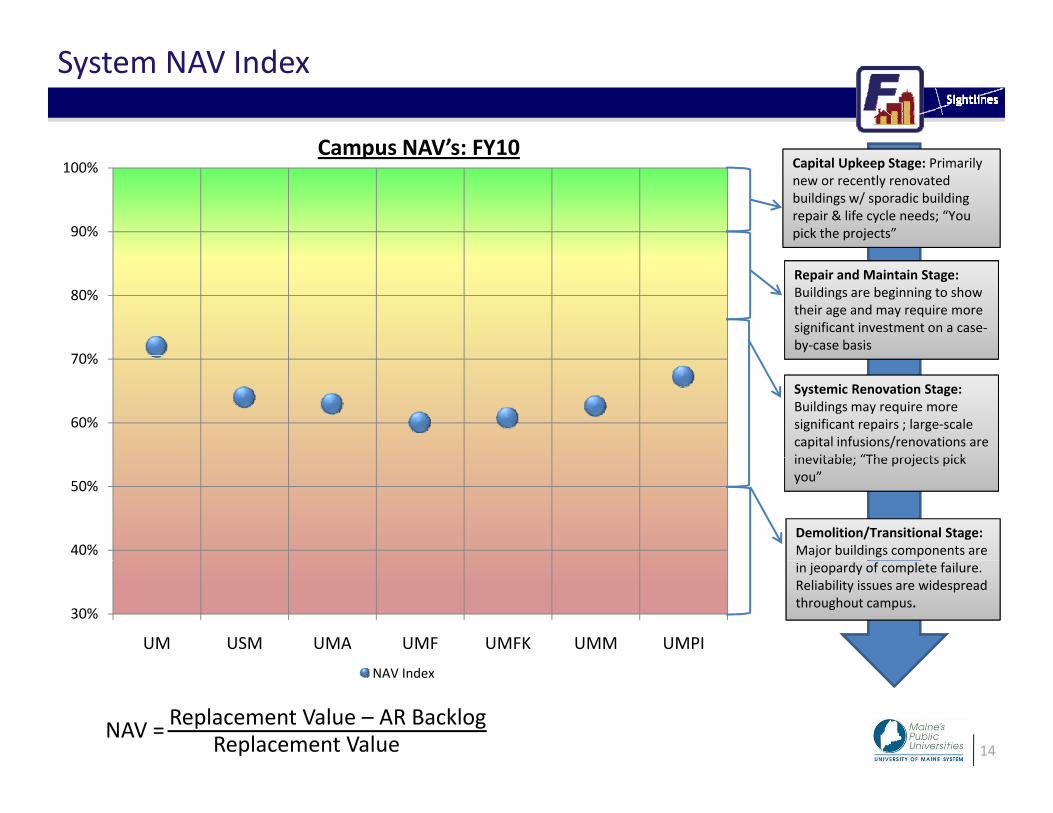
System NAV Index
Campus NAV’s: FY10
90%
100% Capital Upkeep Stage: Primarily new or recently renovated buildings w/ sporadic building repair & life cycle needs; “You pick the projects”
Campus NAV s: FY10
70%
80%Repair and Maintain Stage: Buildings are beginning to show their age and may require more significant investment on a case‐by‐case basis
60%
70%
Systemic Renovation Stage: Buildings may require more significant repairs ; large‐scale capital infusions/renovations are inevitable; “The projects pick
40%
50%
inevitable; The projects pick you”
Demolition/Transitional Stage: Major buildings components are
30%
UM USM UMA UMF UMFK UMM UMPI
in jeopardy of complete failure. Reliability issues are widespread throughout campus.
14
NAV Index
Replacement Value – AR BacklogNAV = Replacement Value
Campus Operations
15
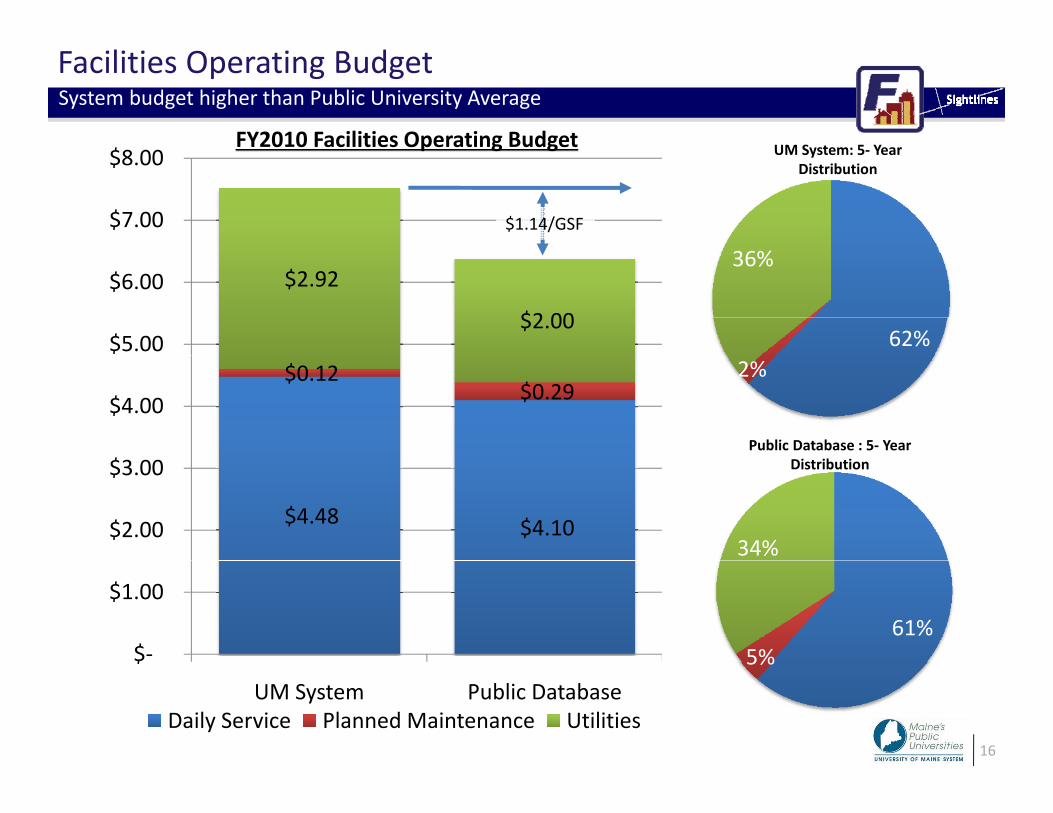
Facilities Operating BudgetSystem budget higher than Public University Average
$8 00 UM System: 5‐ YearFY2010 Facilities Operating Budget
36%
$7.00
$8.00 UM System: 5‐ Year Distribution
p g g
$1.14/GSF
62%
36%$2.92
$2.00 $5.00
$6.00
2%$0.12 $0.29
$
$4.00 Public Database : 5‐ Year
34%$4.48 $4.10 $2.00
$3.00 Distribution
61%5%$‐
$1.00
16
5%$
UM System Public DatabaseDaily Service Planned Maintenance Utilities
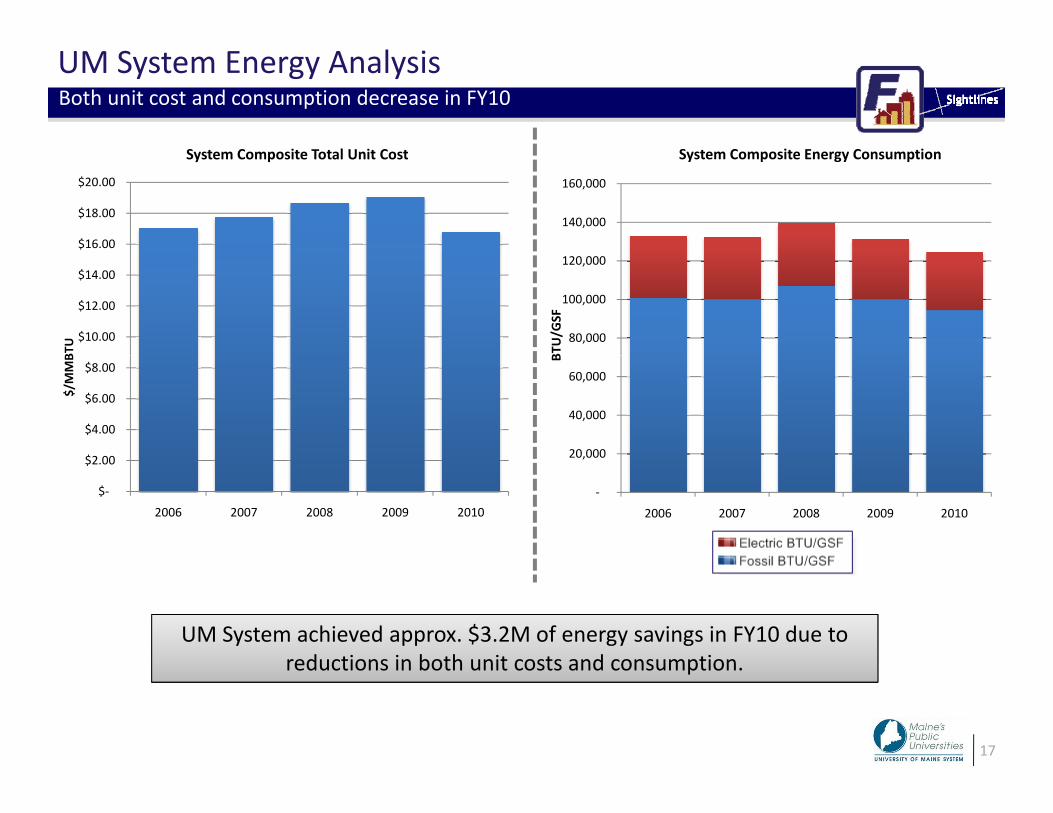
UM System Energy AnalysisBoth unit cost and consumption decrease in FY10
S t C it T t l U it C t S t C it E C ti
$16.00
$18.00
$20.00
System Composite Total Unit Cost
140,000
160,000
System Composite Energy Consumption
$10.00
$12.00
$14.00
BTU 80,000
100,000
120,000
BTU/G
SF
$2 00
$4.00
$6.00
$8.00
$/MMB
20,000
40,000
60,000
B
$‐
$2.00
2006 2007 2008 2009 2010‐
,
2006 2007 2008 2009 2010
UM System achieved approx. $3.2M of energy savings in FY10 due to reductions in both unit costs and consumption
17
reductions in both unit costs and consumption.
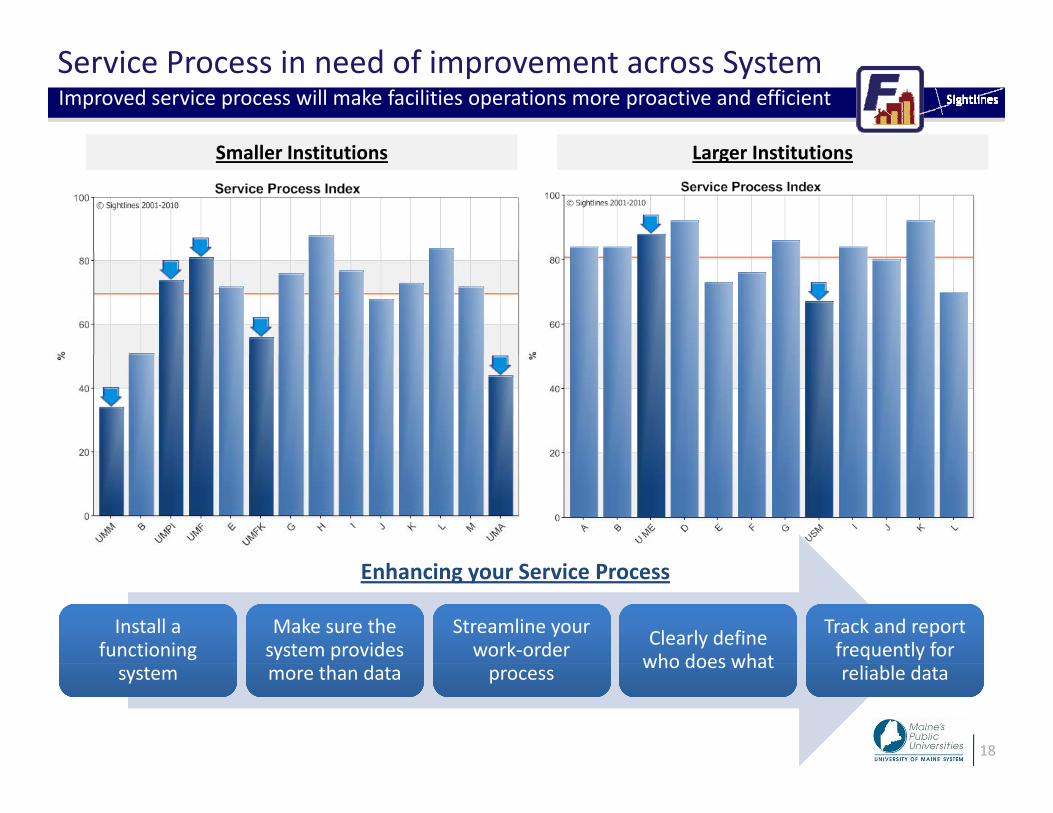
Service Process in need of improvement across SystemImproved service process will make facilities operations more proactive and efficient
Smaller Institutions Larger InstitutionsSmaller Institutions Larger Institutions
Install a functioning Install a
functioning Make sure the system provides Make sure the system provides
Streamline your work‐order
Streamline your work‐order Clearly define
who does whatClearly define who does what
Track and report frequently for
Track and report frequently for
Enhancing your Service Process
18
systemsystem more than datamore than data processprocess who does whatwho does what reliable datareliable data

Bringing it all together
19
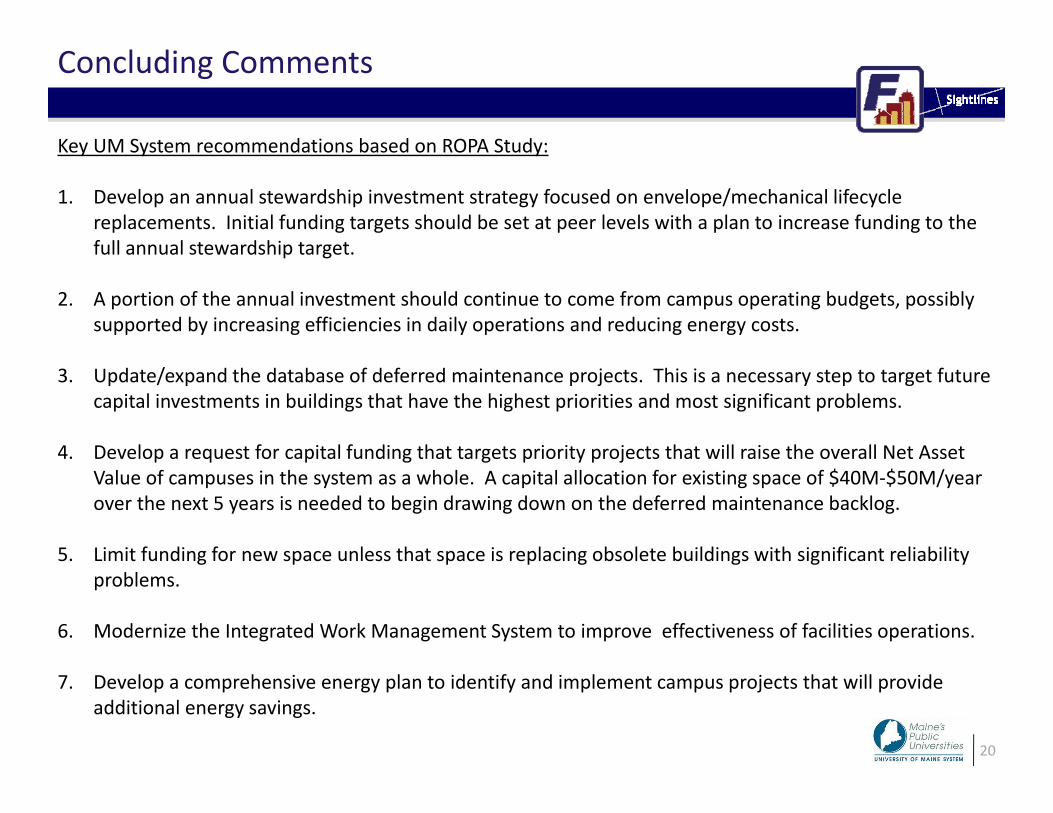
Concluding Comments
Key UM System recommendations based on ROPA Study:Key UM System recommendations based on ROPA Study:
1. Develop an annual stewardship investment strategy focused on envelope/mechanical lifecycle replacements. Initial funding targets should be set at peer levels with a plan to increase funding to the full annual stewardship target.full annual stewardship target.
2. A portion of the annual investment should continue to come from campus operating budgets, possibly supported by increasing efficiencies in daily operations and reducing energy costs.
3. Update/expand the database of deferred maintenance projects. This is a necessary step to target future capital investments in buildings that have the highest priorities and most significant problems.
4. Develop a request for capital funding that targets priority projects that will raise the overall Net Asset4. Develop a request for capital funding that targets priority projects that will raise the overall Net Asset Value of campuses in the system as a whole. A capital allocation for existing space of $40M‐$50M/year over the next 5 years is needed to begin drawing down on the deferred maintenance backlog.
5. Limit funding for new space unless that space is replacing obsolete buildings with significant reliability5. Limit funding for new space unless that space is replacing obsolete buildings with significant reliability problems.
6. Modernize the Integrated Work Management System to improve effectiveness of facilities operations.
20
7. Develop a comprehensive energy plan to identify and implement campus projects that will provide additional energy savings.