Embed Size (px)
Citation preview
Quelle: http://commons.ch/deutsch/weltlisten
Länder und Territorien nach Bruttoinlandsprodukt pro Kopf in US Dollar (Kaufkraftbereinigt*) 2015
*Kaufkraftbereinigt = Lokale Kaufkraft miteinbezogen
Rang Land BIP pro Kopf
1990 BIP pro Kopf
2005 BIP pro Kopf
2015
1. Katar 47.529 102.253 143.788
2. Macau 22.229 58.922 111.270
3. Luxemburg 32.083 67.081 101.926
4. Singapur 22.168 55.106 85.209
5. Kuwait 58.118 83.703 71.312
6. Brunei 49.815 67.367 70.817
7. UAE 74.017 84.338 70.238
8. Norwegen 18.255 48.357 61.472
9. Schweiz 26.734 39.153 60.535
10. Hongkong 17.434 36.428 56.719
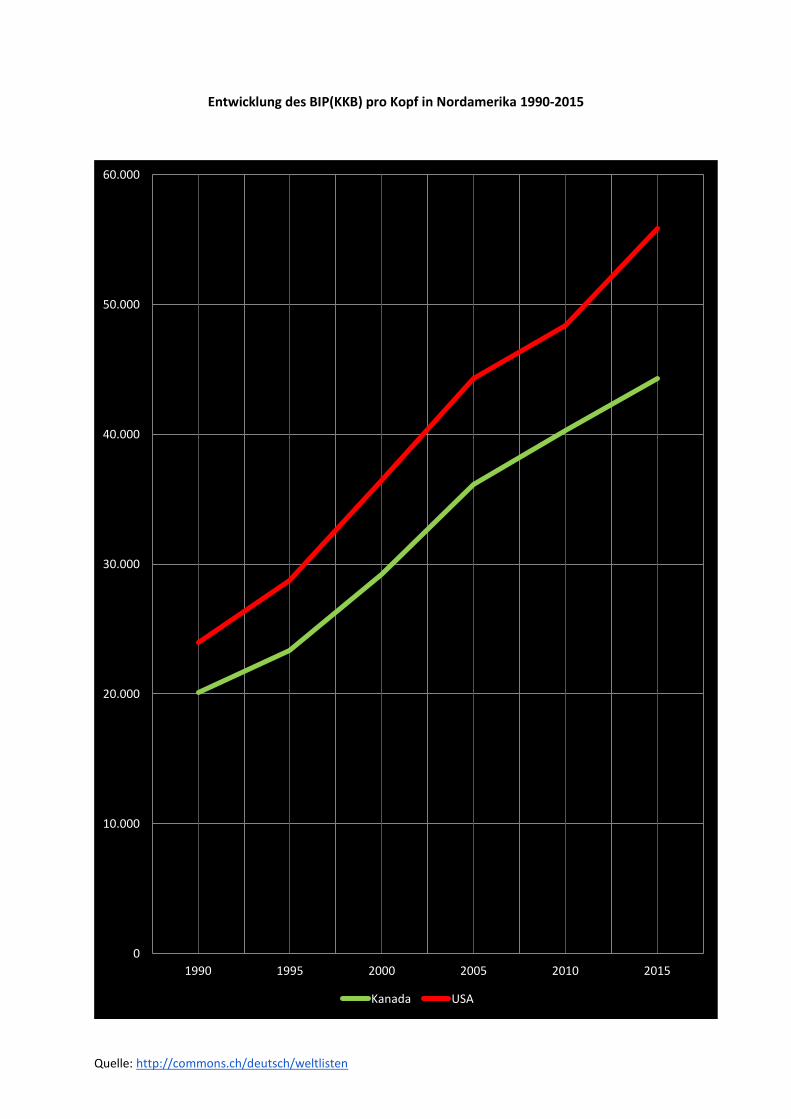
11. USA 23.954 44.308 55.837
12. Irland 13.384 40.447 54.654
13. Saudi-Arabien 22.843 34.552 53.430
14. Niederlande 18.792 37.306 48.459
15. Österreich 19.491 34.691 47.824
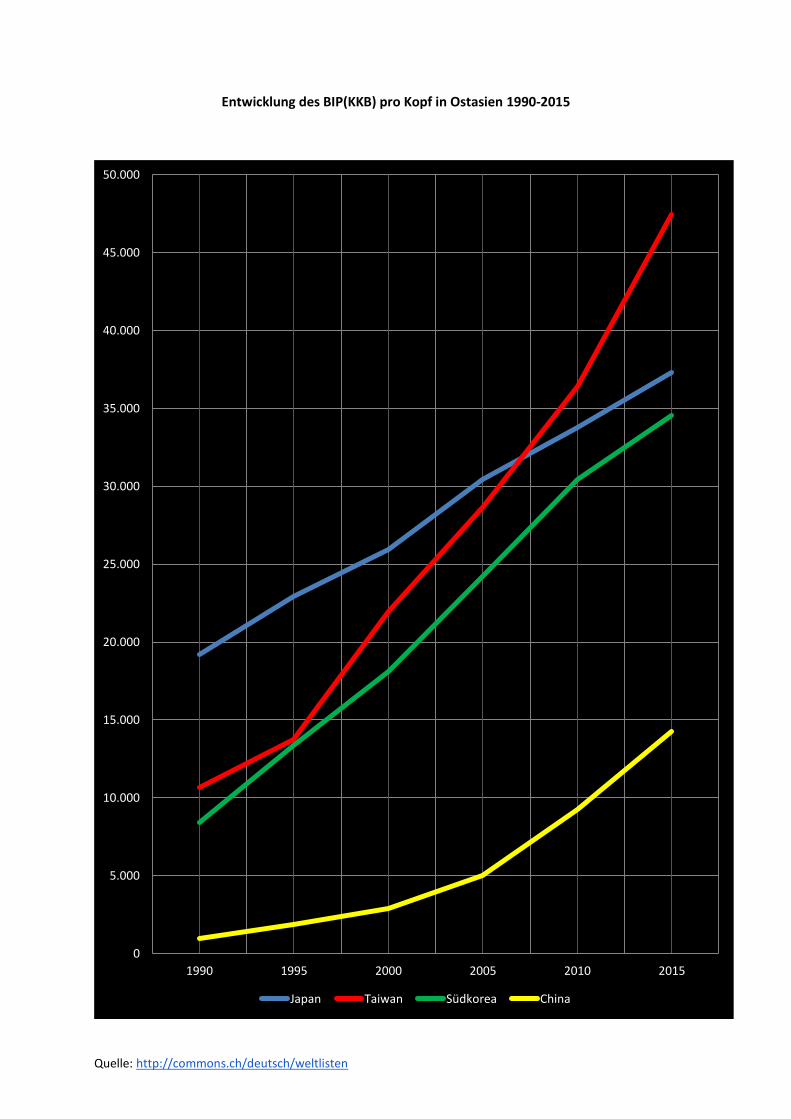
16. Taiwan 10.658 28.628 47.439
17. Deutschland 19.033 32.184 47.268
18. Bahrain 22.879 39.771 46.946
19. Dänemark 18.733 34.080 46.635
20. Island 21.807 35.881 46.547
21. Schweden 20.076 34.332 46.420
22. Australien 17.362 32.559 45.514
23. Kanada 20.085 36.135 44.310
24. Belgien 19.053 33.043 43.992
25. UK 17.446 34.623 41.325
26. Finnland 17.906 32.065 40.601
27. Frankreich 17.505 30.376 39.651
28. Oman 22.625 36.973 38.234
29. Japan 19.230 30.441 37.322
30. Neuseeland 14.856 25.677 36.982
31. Italien 18.273 29.652 35.896
32. Israel 13.381 24.885 35.432
33. Puerto Rico 16.336 33.292 35.029
34. Südkorea 8.436 24.220 34.529
35. Spanien 13.692 27.869 34.527
36. Trinidad und Tobago 7.839 23.288 32.597
37. Tschechien 12.716 22.286 32.164
38. Slowenien 13.227 23.888 31.122
39. Zypern 13.190 27.331 30.734
40. Äquatorialguinea 682 31.560 30.041

Quelle: http://commons.ch/deutsch/weltlisten
Rang Land BIP pro Kopf
1990 BIP pro Kopf
2005 BIP pro Kopf
2015
41. Malta 10.926 21.019 29.526
42. Portugal 11.185 22.073 29.214
43. Slowakei 8.992 16.526 28.877
44. Estland 8.238 16.561 28.095
45. Litauen 8.423 14.682 27.730
46. Seychellen 9.124 15.852 27.273
47. Malaysia 6.755 16.453 26.891
48. Griechenland 13.251 28.237 26.680
49. Polen 5.996 13.807 26.135
50. Kasachstan 8.791 8.221 25.877
51. Ungarn 8.252 17.314 25.582
52. Russland 8.013 11.822 24.451
53. Lettland 7.341 14.119 24.286
54. Bahamas 15.693 22.603 23.795
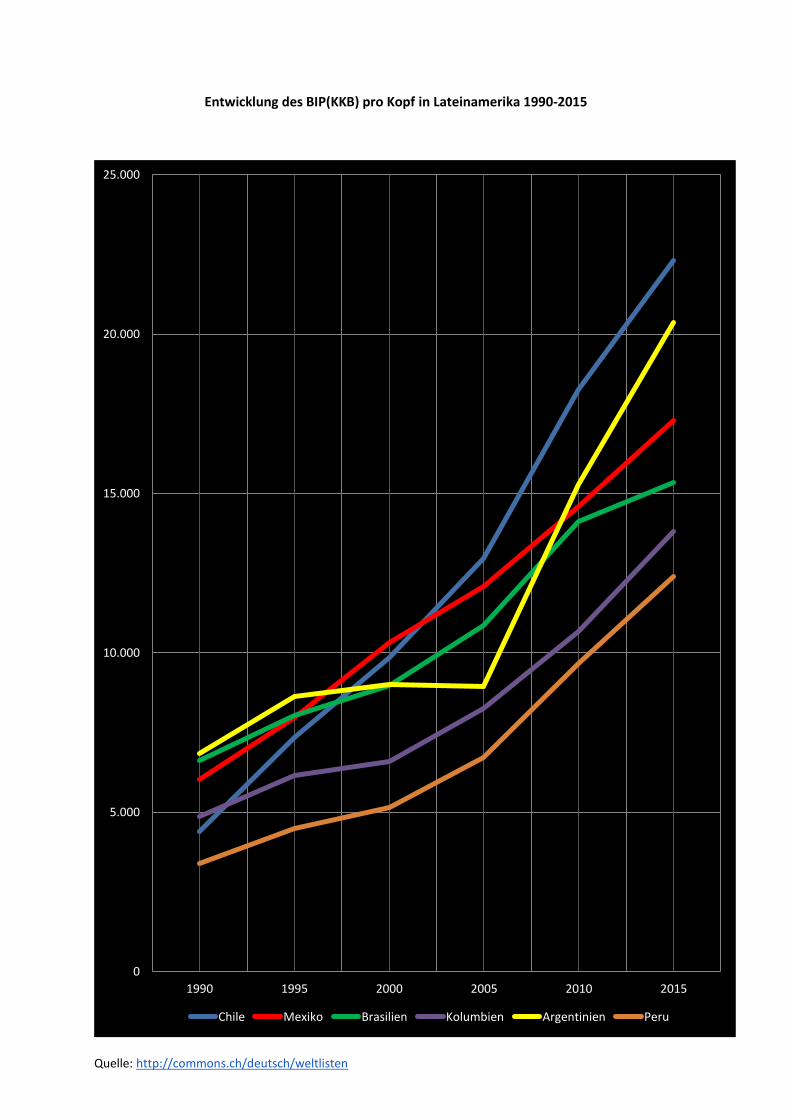
55. Chile 4.407 12.965 22.316
56. Panama 4.972 10.317 22.192
57. Kroatien 8.102 15.535 21.880
58. Rumänien 5.504 9.575 21.403
59. Uruguay 6.360 11.554 21.201
60. Kuba 8.851 12.679 20.649
61. Argentinien 8.847 8.937 20.364
62. Gabun 12.603 15.419 20.010
63. Türkei 4.439 11.512 19.618
64. Mauritius 4.891 11.349 19.480
65. Aserbaidschan 5.502 7.169 17.740
66. Belarus 5.225 9.662 17.661
67. Bulgarien 5.403 10.124 17.512
68. Iran 6.547 13.012 17.366
69. Mexiko 6.019 12.071 17.277
70. Venezuela 9.340 13.317 17.226
71. Surinam 6.841 11.050 16.970
72. Turkmenistan 5.399 5.792 16.499
73. Barbados 8.594 13.421 16.391
74. Thailand 4.299 10.194 16.305
75. Botswana 5.235 10.269 15.807
76. Montenegro * 8.406 15.486
77. Costa Rica 4.713 9.625 15.377
78. Brasilien 6.622 10.860 15.359
79. Irak 7.443 9.698 14.895
80. Algerien 6.618 10.976 14.687
81. China 980 5.053 14.239
82. Dominikanische
Republik 3.441 7.900 14.212
Quelle: http://commons.ch/deutsch/weltlisten
Rang Land BIP pro Kopf
1990 BIP pro Kopf
2005 BIP pro Kopf
2015
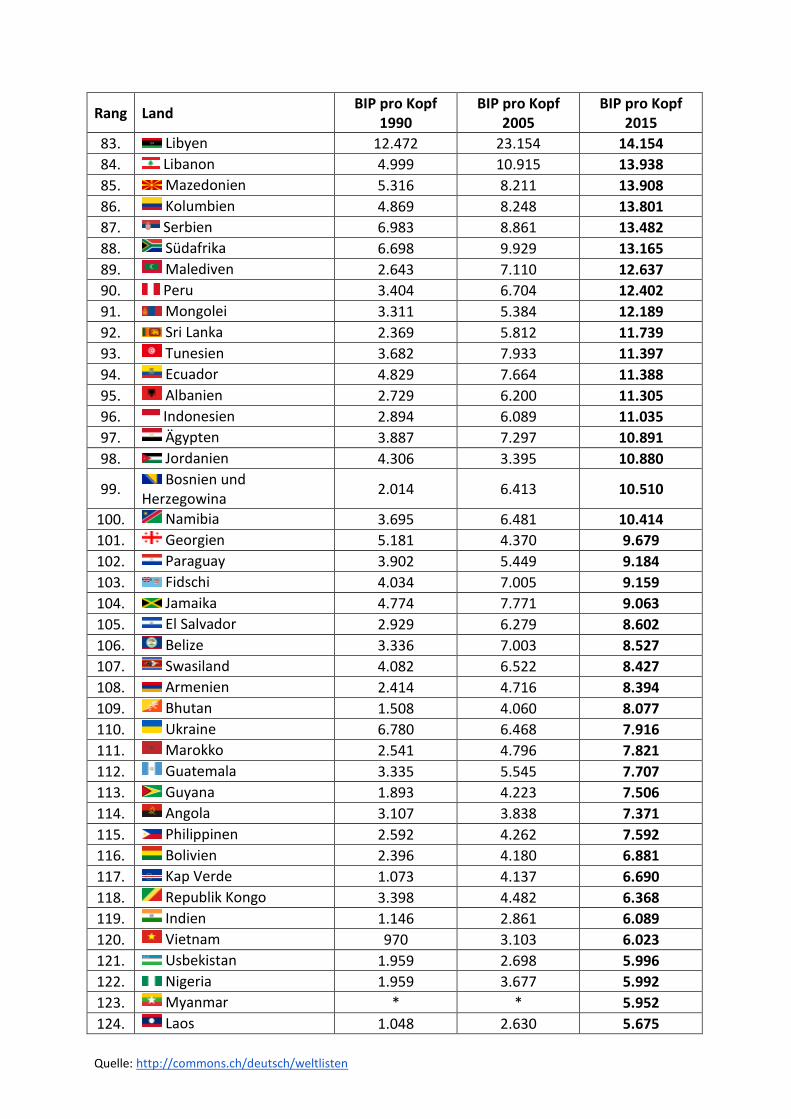
83. Libyen 12.472 23.154 14.154
84. Libanon 4.999 10.915 13.938
85. Mazedonien 5.316 8.211 13.908
86. Kolumbien 4.869 8.248 13.801
87. Serbien 6.983 8.861 13.482
88. Südafrika 6.698 9.929 13.165
89. Malediven 2.643 7.110 12.637
90. Peru 3.404 6.704 12.402
91. Mongolei 3.311 5.384 12.189
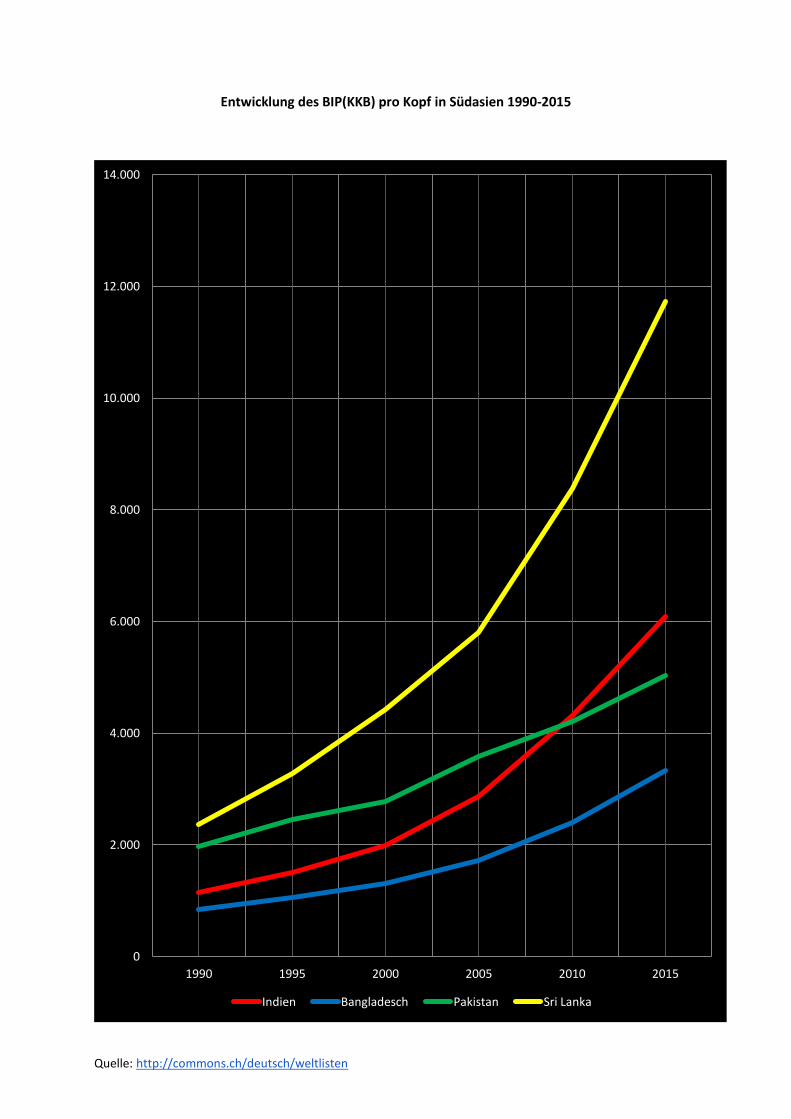
92. Sri Lanka 2.369 5.812 11.739
93. Tunesien 3.682 7.933 11.397
94. Ecuador 4.829 7.664 11.388
95. Albanien 2.729 6.200 11.305
96. Indonesien 2.894 6.089 11.035
97. Ägypten 3.887 7.297 10.891
98. Jordanien 4.306 3.395 10.880
99. Bosnien und
Herzegowina 2.014 6.413 10.510
100. Namibia 3.695 6.481 10.414
101. Georgien 5.181 4.370 9.679
102. Paraguay 3.902 5.449 9.184
103. Fidschi 4.034 7.005 9.159
104. Jamaika 4.774 7.771 9.063
105. El Salvador 2.929 6.279 8.602
106. Belize 3.336 7.003 8.527
107. Swasiland 4.082 6.522 8.427
108. Armenien 2.414 4.716 8.394
109. Bhutan 1.508 4.060 8.077
110. Ukraine 6.780 6.468 7.916
111. Marokko 2.541 4.796 7.821
112. Guatemala 3.335 5.545 7.707
113. Guyana 1.893 4.223 7.506
114. Angola 3.107 3.838 7.371
115. Philippinen 2.592 4.262 7.592
116. Bolivien 2.396 4.180 6.881
117. Kap Verde 1.073 4.137 6.690
118. Republik Kongo 3.398 4.482 6.368
119. Indien 1.146 2.861 6.089
120. Vietnam 970 3.103 6.023
121. Usbekistan 1.959 2.698 5.996
122. Nigeria 1.959 3.677 5.992
123. Myanmar * * 5.952
124. Laos 1.048 2.630 5.675
Quelle: http://commons.ch/deutsch/weltlisten
Rang Land BIP pro Kopf
1990 BIP pro Kopf
2005 BIP pro Kopf
2015
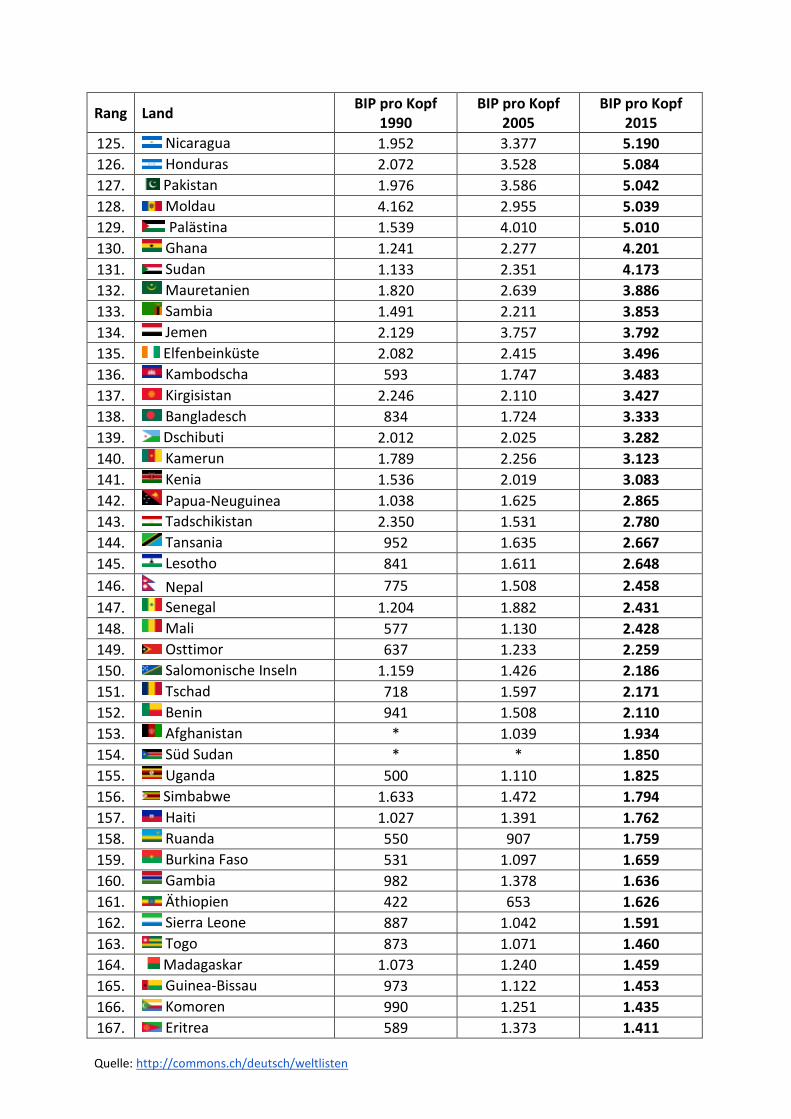
125. Nicaragua 1.952 3.377 5.190
126. Honduras 2.072 3.528 5.084
127. Pakistan 1.976 3.586 5.042
128. Moldau 4.162 2.955 5.039
129. Palästina 1.539 4.010 5.010
130. Ghana 1.241 2.277 4.201
131. Sudan 1.133 2.351 4.173
132. Mauretanien 1.820 2.639 3.886
133. Sambia 1.491 2.211 3.853
134. Jemen 2.129 3.757 3.792
135. Elfenbeinküste 2.082 2.415 3.496
136. Kambodscha 593 1.747 3.483
137. Kirgisistan 2.246 2.110 3.427
138. Bangladesch 834 1.724 3.333
139. Dschibuti 2.012 2.025 3.282
140. Kamerun 1.789 2.256 3.123
141. Kenia 1.536 2.019 3.083
142. Papua-Neuguinea 1.038 1.625 2.865
143. Tadschikistan 2.350 1.531 2.780
144. Tansania 952 1.635 2.667
145. Lesotho 841 1.611 2.648
146. Nepal 775 1.508 2.458
147. Senegal 1.204 1.882 2.431
148. Mali 577 1.130 2.428
149. Osttimor 637 1.233 2.259
150. Salomonische Inseln 1.159 1.426 2.186
151. Tschad 718 1.597 2.171
152. Benin 941 1.508 2.110
153. Afghanistan * 1.039 1.934
154. Süd Sudan * * 1.850
155. Uganda 500 1.110 1.825
156. Simbabwe 1.633 1.472 1.794
157. Haiti 1.027 1.391 1.762
158. Ruanda 550 907 1.759
159. Burkina Faso 531 1.097 1.659
160. Gambia 982 1.378 1.636
161. Äthiopien 422 653 1.626
162. Sierra Leone 887 1.042 1.591
163. Togo 873 1.071 1.460
164. Madagaskar 1.073 1.240 1.459
165. Guinea-Bissau 973 1.122 1.453
166. Komoren 990 1.251 1.435
167. Eritrea 589 1.373 1.411
Quelle: http://commons.ch/deutsch/weltlisten
Rang Land BIP pro Kopf
1990 BIP pro Kopf
2005 BIP pro Kopf
2015
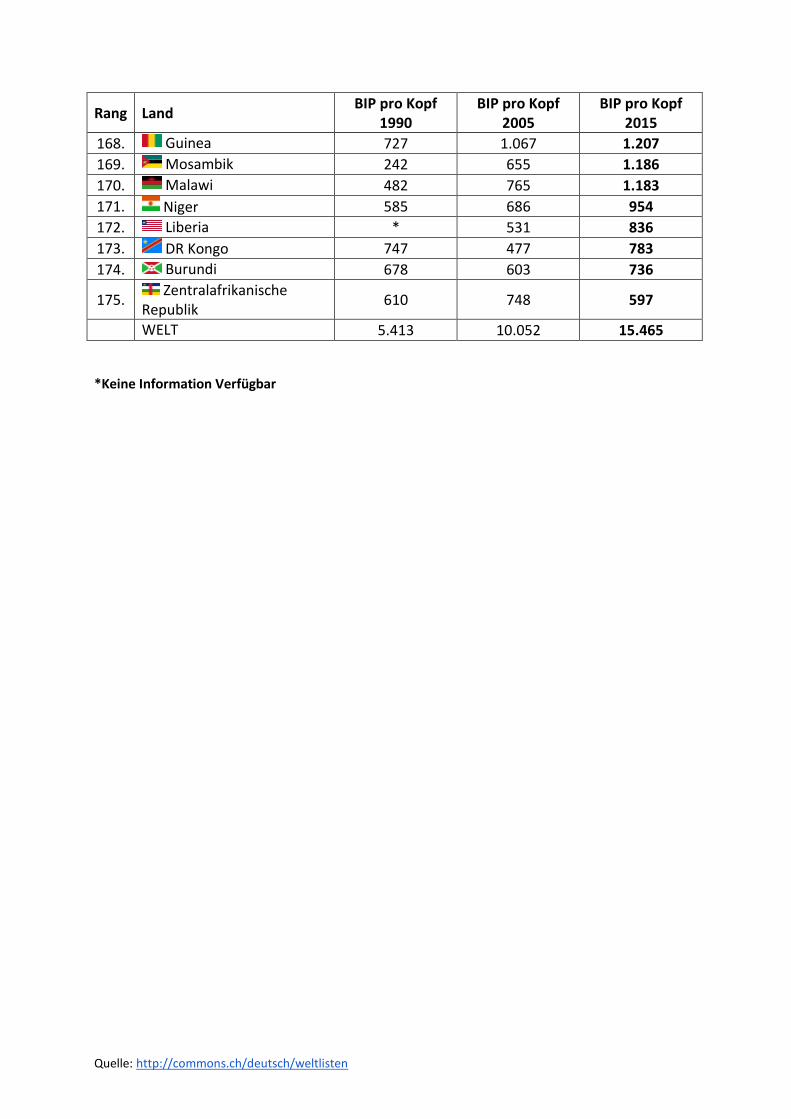
168. Guinea 727 1.067 1.207
169. Mosambik 242 655 1.186
170. Malawi 482 765 1.183
171. Niger 585 686 954
172. Liberia * 531 836
173. DR Kongo 747 477 783
174. Burundi 678 603 736
175. Zentralafrikanische
Republik 610 748 597
WELT 5.413 10.052 15.465
*Keine Information Verfügbar
Quelle: http://commons.ch/deutsch/weltlisten
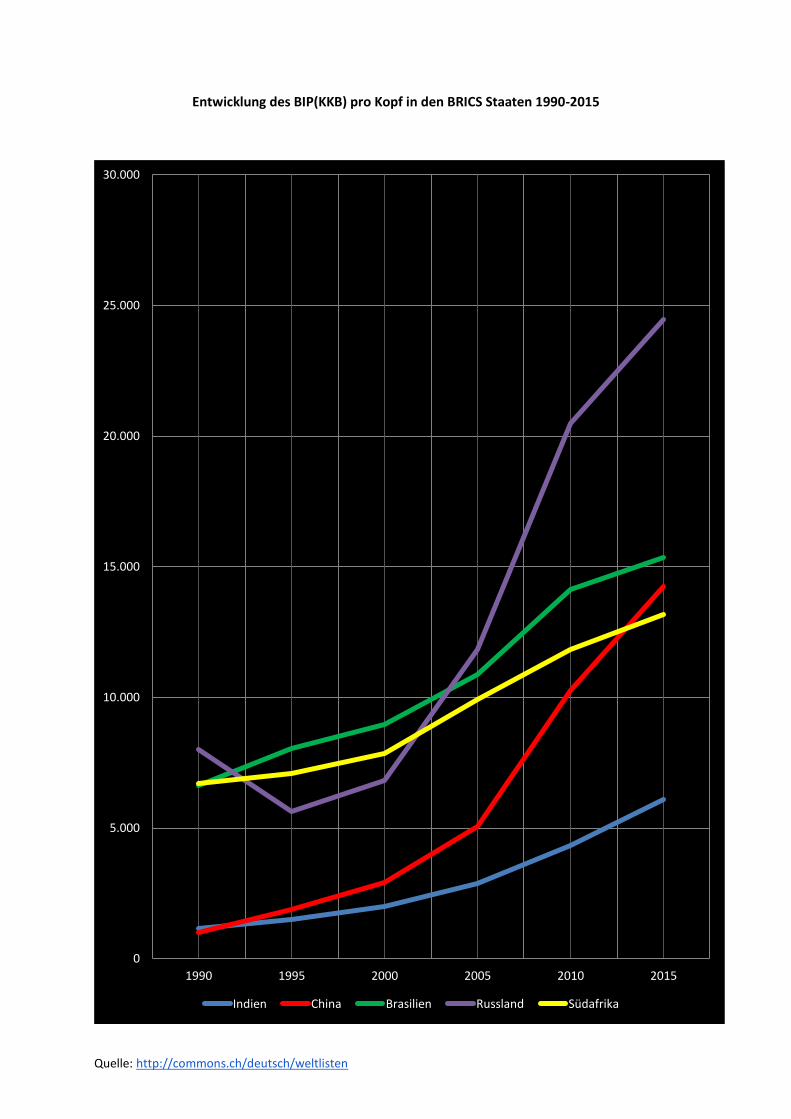
Entwicklung des BIP(KKB) pro Kopf in den BRICS Staaten 1990-2015
0
5.000
10.000
15.000
20.000
25.000
30.000
1990 1995 2000 2005 2010 2015
Indien China Brasilien Russland Südafrika
Quelle: http://commons.ch/deutsch/weltlisten
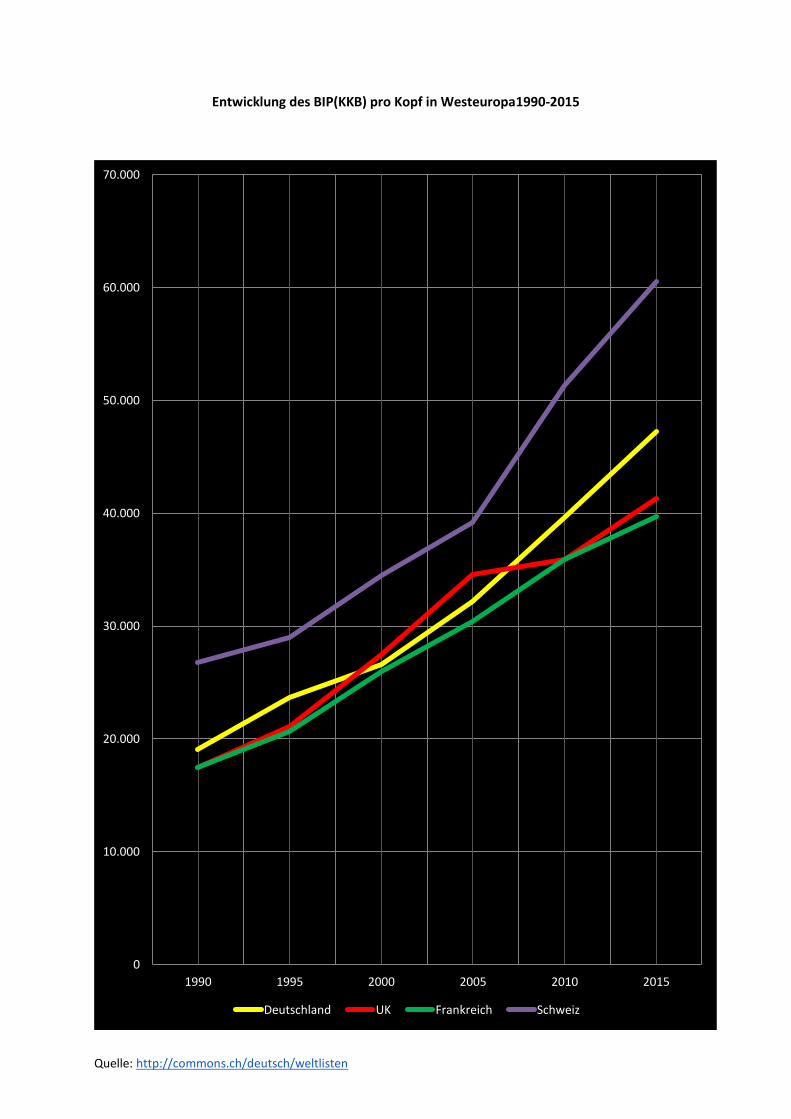
Entwicklung des BIP(KKB) pro Kopf in Westeuropa1990-2015
0
10.000
20.000
30.000
40.000
50.000
60.000
70.000
1990 1995 2000 2005 2010 2015
Deutschland UK Frankreich Schweiz
Quelle: http://commons.ch/deutsch/weltlisten
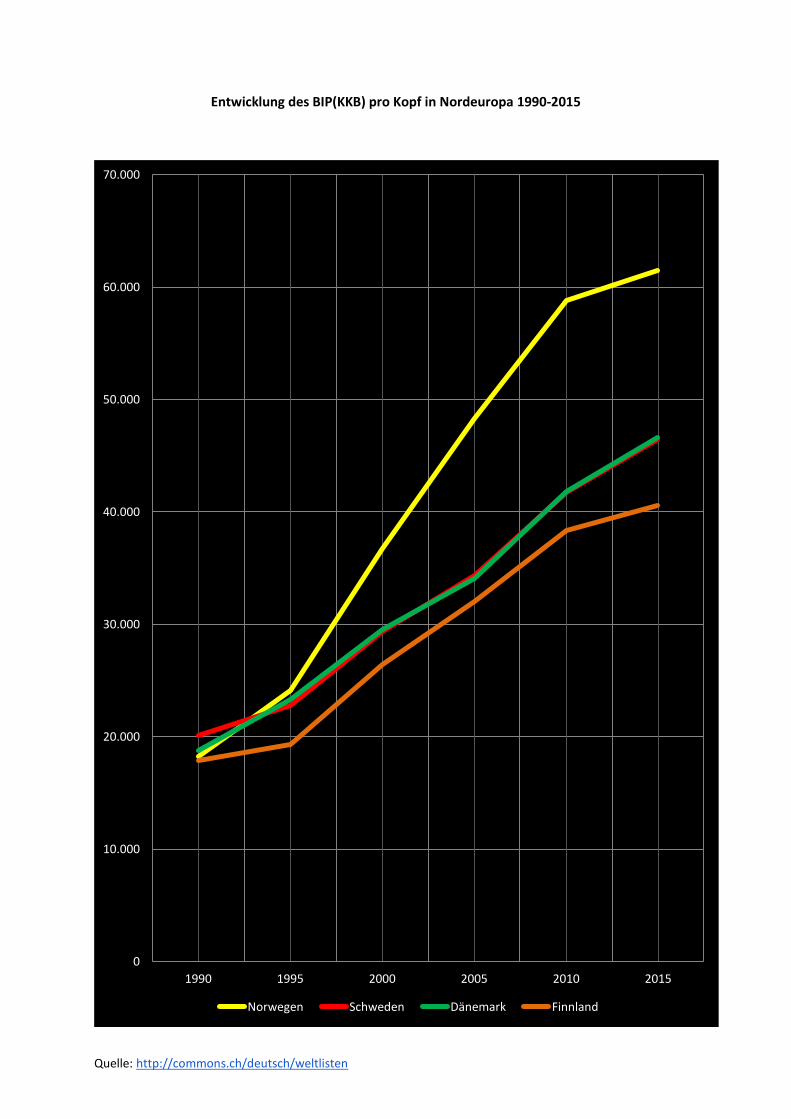
Entwicklung des BIP(KKB) pro Kopf in Nordeuropa 1990-2015
0
10.000
20.000
30.000
40.000
50.000
60.000
70.000
1990 1995 2000 2005 2010 2015
Norwegen Schweden Dänemark Finnland
Quelle: http://commons.ch/deutsch/weltlisten
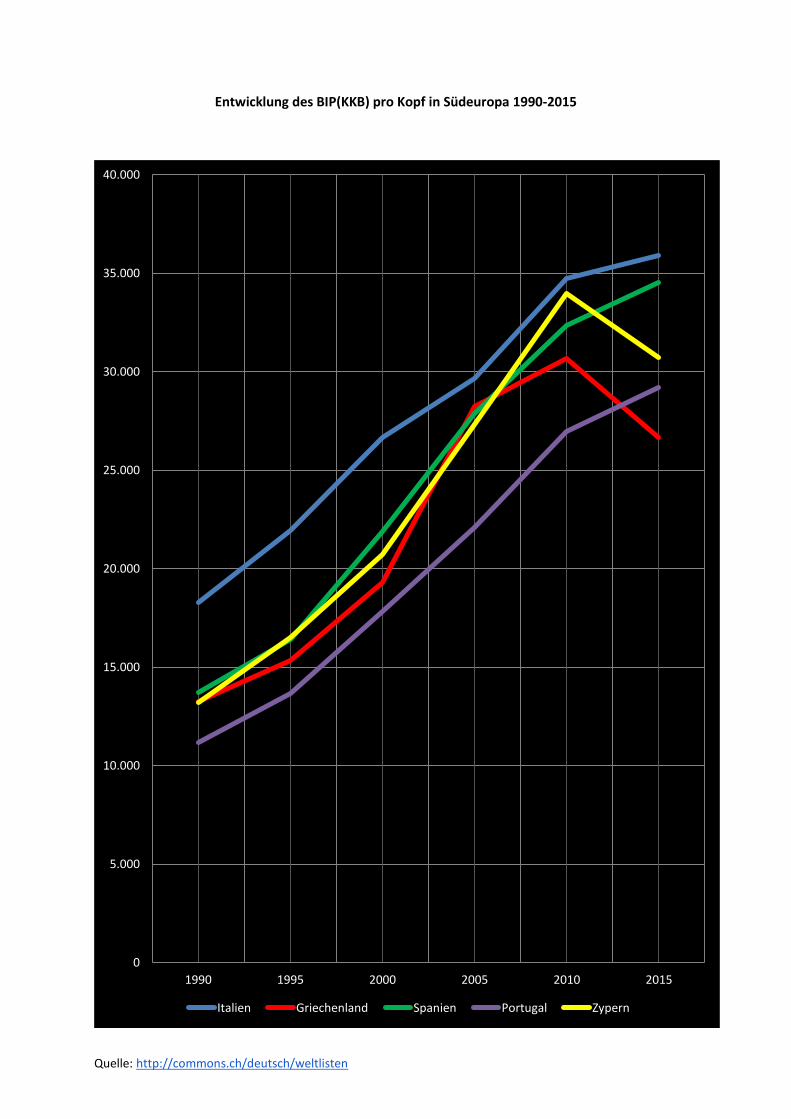
Entwicklung des BIP(KKB) pro Kopf in Südeuropa 1990-2015
0
5.000
10.000
15.000
20.000
25.000
30.000
35.000
40.000
1990 1995 2000 2005 2010 2015
Italien Griechenland Spanien Portugal Zypern
Quelle: http://commons.ch/deutsch/weltlisten
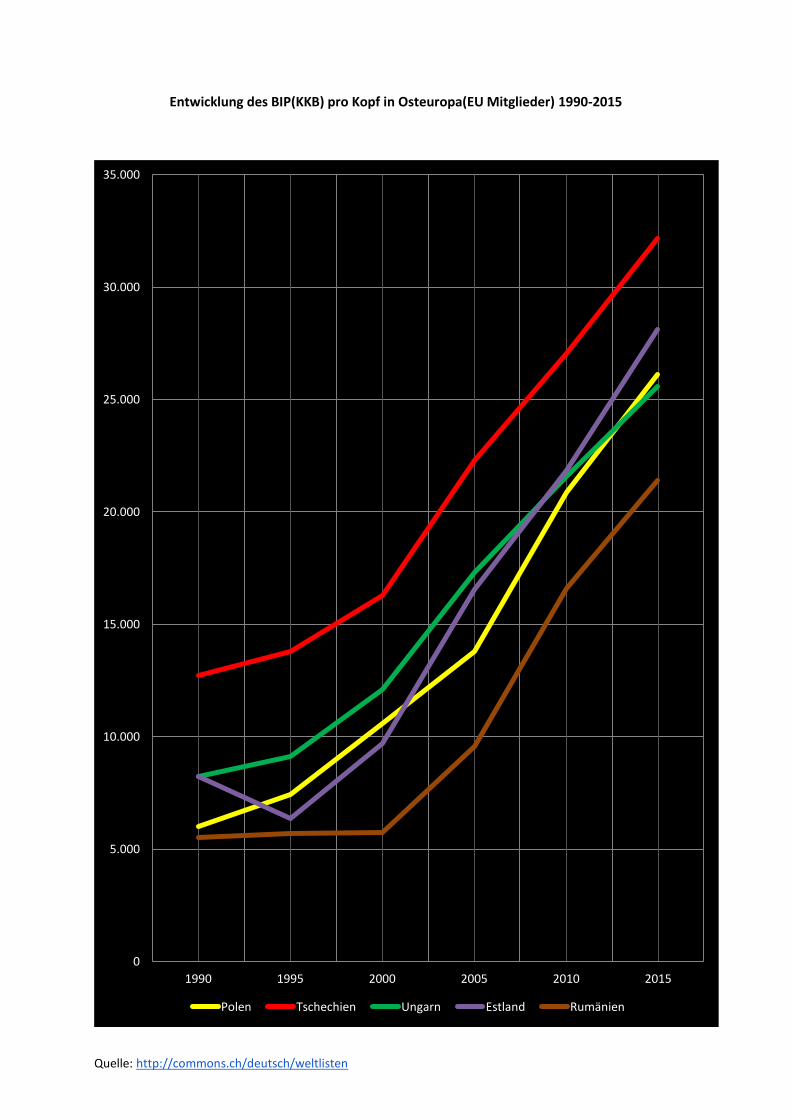
Entwicklung des BIP(KKB) pro Kopf in Osteuropa(EU Mitglieder) 1990-2015
0
5.000
10.000
15.000
20.000
25.000
30.000
35.000
1990 1995 2000 2005 2010 2015
Polen Tschechien Ungarn Estland Rumänien
Quelle: http://commons.ch/deutsch/weltlisten
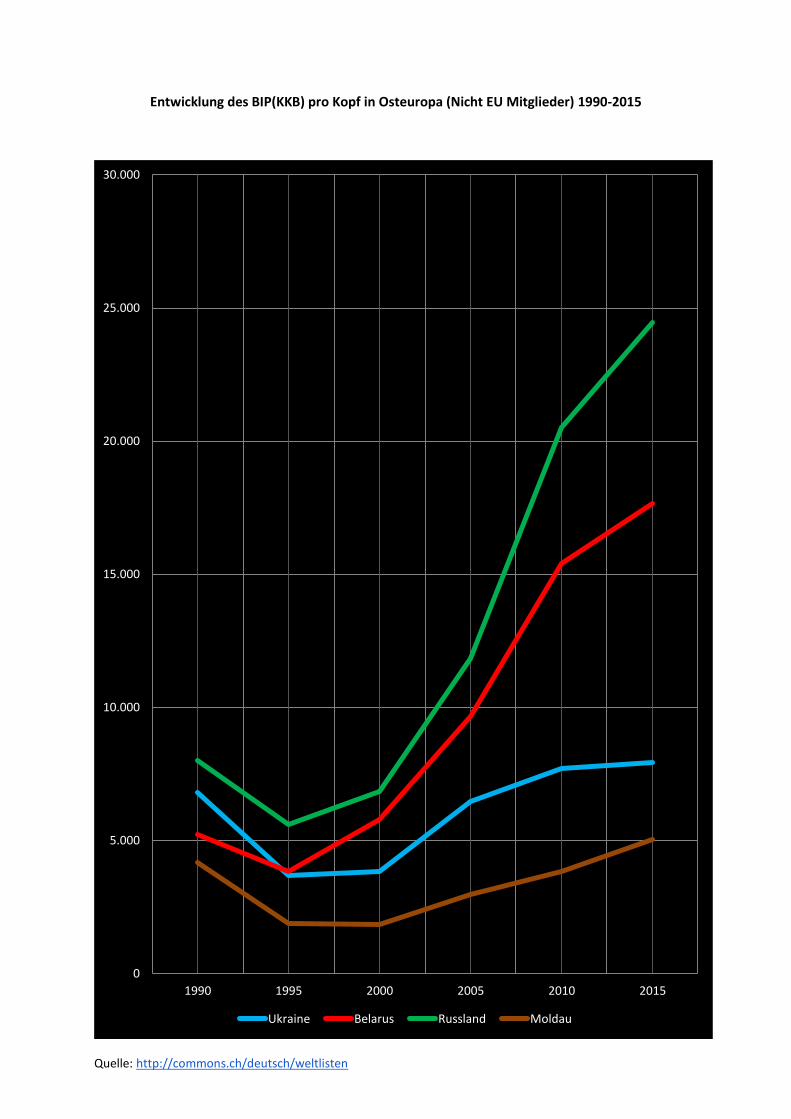
Entwicklung des BIP(KKB) pro Kopf in Osteuropa (Nicht EU Mitglieder) 1990-2015
0
5.000
10.000
15.000
20.000
25.000
30.000
1990 1995 2000 2005 2010 2015
Ukraine Belarus Russland Moldau
Quelle: http://commons.ch/deutsch/weltlisten
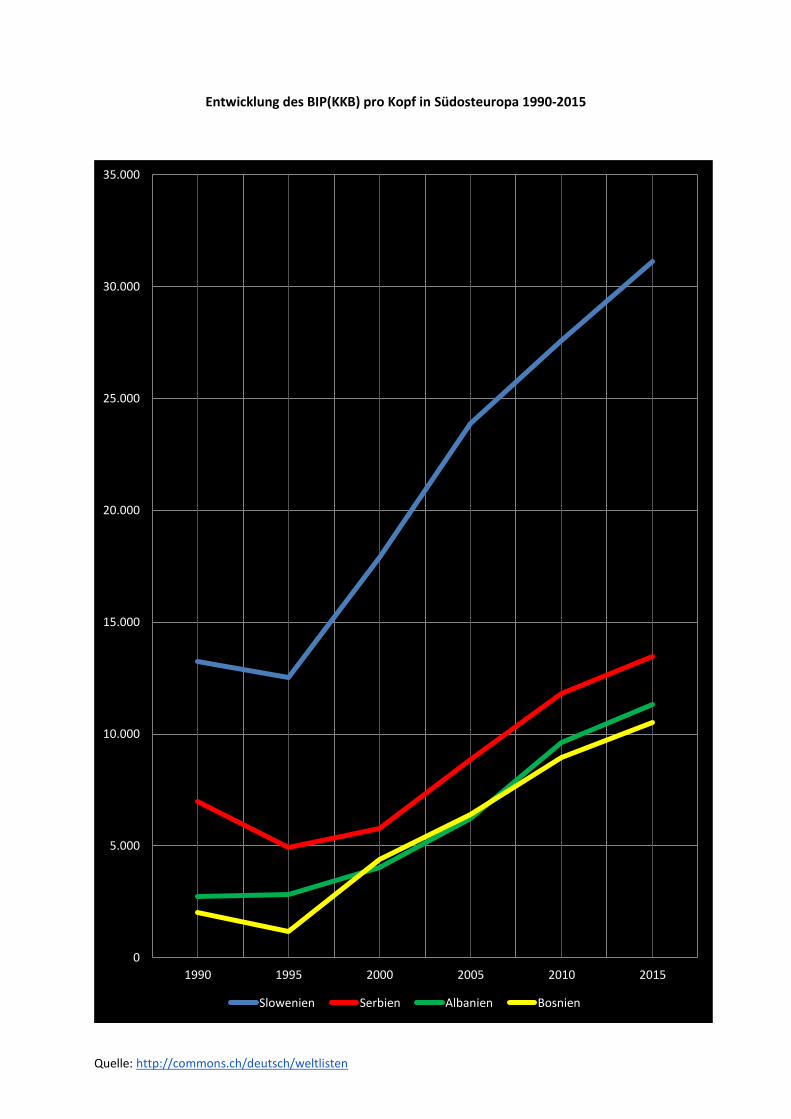
Entwicklung des BIP(KKB) pro Kopf in Südosteuropa 1990-2015
0
5.000
10.000
15.000
20.000
25.000
30.000
35.000
1990 1995 2000 2005 2010 2015
Slowenien Serbien Albanien Bosnien
Quelle: http://commons.ch/deutsch/weltlisten
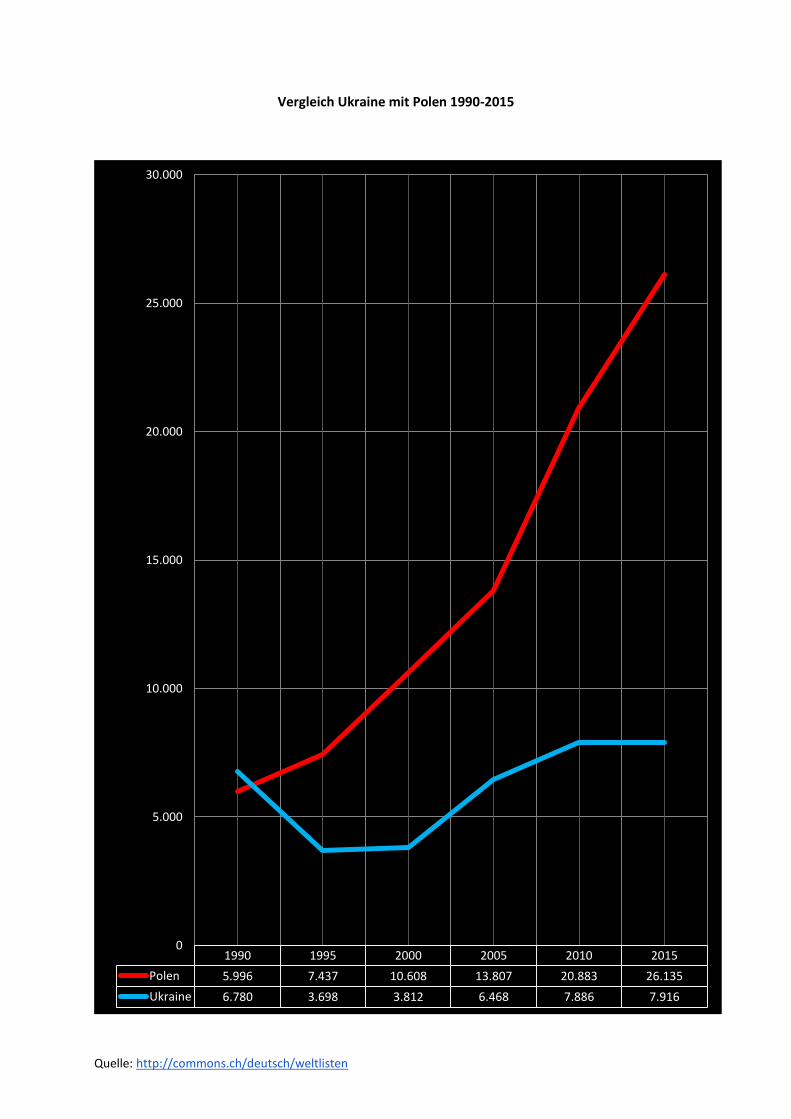
Vergleich Ukraine mit Polen 1990-2015
1990 1995 2000 2005 2010 2015
Polen 5.996 7.437 10.608 13.807 20.883 26.135
Ukraine 6.780 3.698 3.812 6.468 7.886 7.916
0
5.000
10.000
15.000
20.000
25.000
30.000

Quelle: http://commons.ch/deutsch/weltlisten
Entwicklung des BIP(KKB) pro Kopf in verschiedenen Ländern des Nahen Ostens 1990-2015
0
10.000
20.000
30.000
40.000
50.000
60.000
1990 1995 2000 2005 2010 2015
Türkei Irak Iran Saudi Arabien
Quelle: http://commons.ch/deutsch/weltlisten
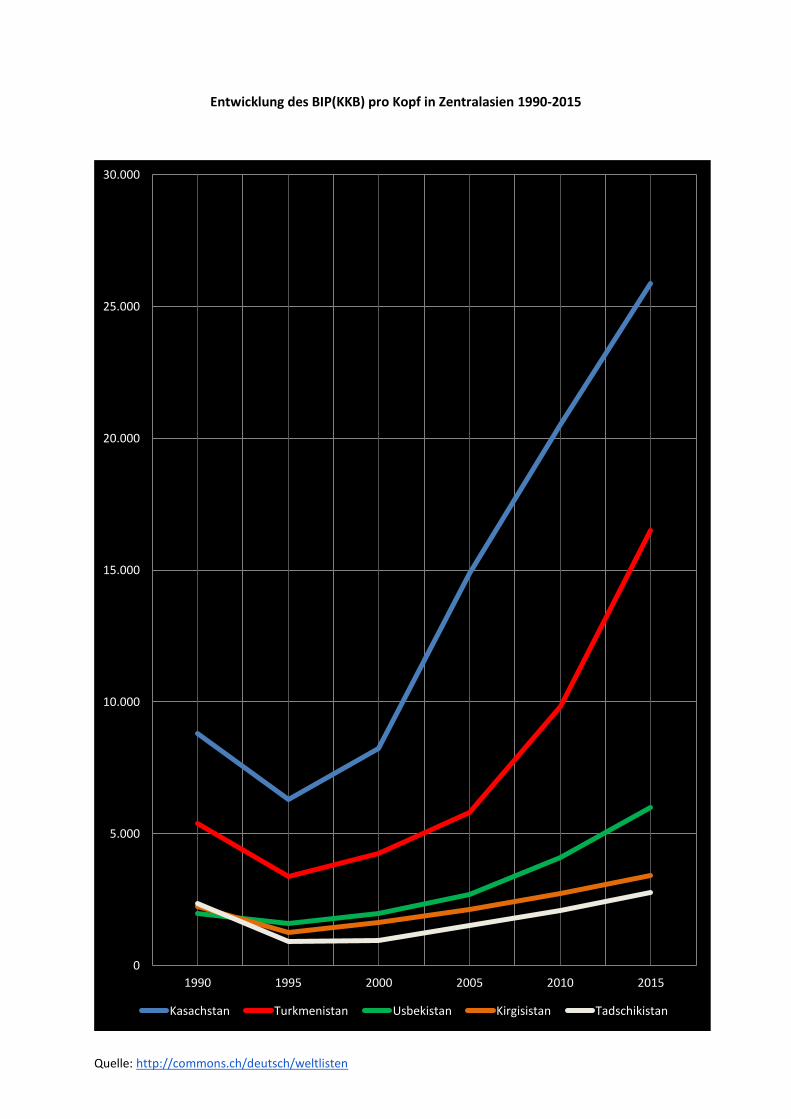
Entwicklung des BIP(KKB) pro Kopf in Zentralasien 1990-2015
0
5.000
10.000
15.000
20.000
25.000
30.000
1990 1995 2000 2005 2010 2015
Kasachstan Turkmenistan Usbekistan Kirgisistan Tadschikistan
Quelle: http://commons.ch/deutsch/weltlisten
Entwicklung des BIP(KKB) pro Kopf in Südasien 1990-2015
0
2.000
4.000
6.000
8.000
10.000
12.000
14.000
1990 1995 2000 2005 2010 2015
Indien Bangladesch Pakistan Sri Lanka

Quelle: http://commons.ch/deutsch/weltlisten
Entwicklung des BIP(KKB) pro Kopf in Südostasien 1990-2015
0
5.000
10.000
15.000
20.000
25.000
30.000
1990 1995 2000 2005 2010 2015
Vietnam Philippinen Indonesien Thailand Malaysia
Quelle: http://commons.ch/deutsch/weltlisten
Entwicklung des BIP(KKB) pro Kopf in Ostasien 1990-2015
0
5.000
10.000
15.000
20.000
25.000
30.000
35.000
40.000
45.000
50.000
1990 1995 2000 2005 2010 2015
Japan Taiwan Südkorea China
Quelle: http://commons.ch/deutsch/weltlisten
Entwicklung des BIP(KKB) pro Kopf in Nordamerika 1990-2015
0
10.000
20.000
30.000
40.000
50.000
60.000
1990 1995 2000 2005 2010 2015
Kanada USA
Quelle: http://commons.ch/deutsch/weltlisten
Entwicklung des BIP(KKB) pro Kopf in Lateinamerika 1990-2015
0
5.000
10.000
15.000
20.000
25.000
1990 1995 2000 2005 2010 2015
Chile Mexiko Brasilien Kolumbien Argentinien Peru
Quelle: http://commons.ch/deutsch/weltlisten
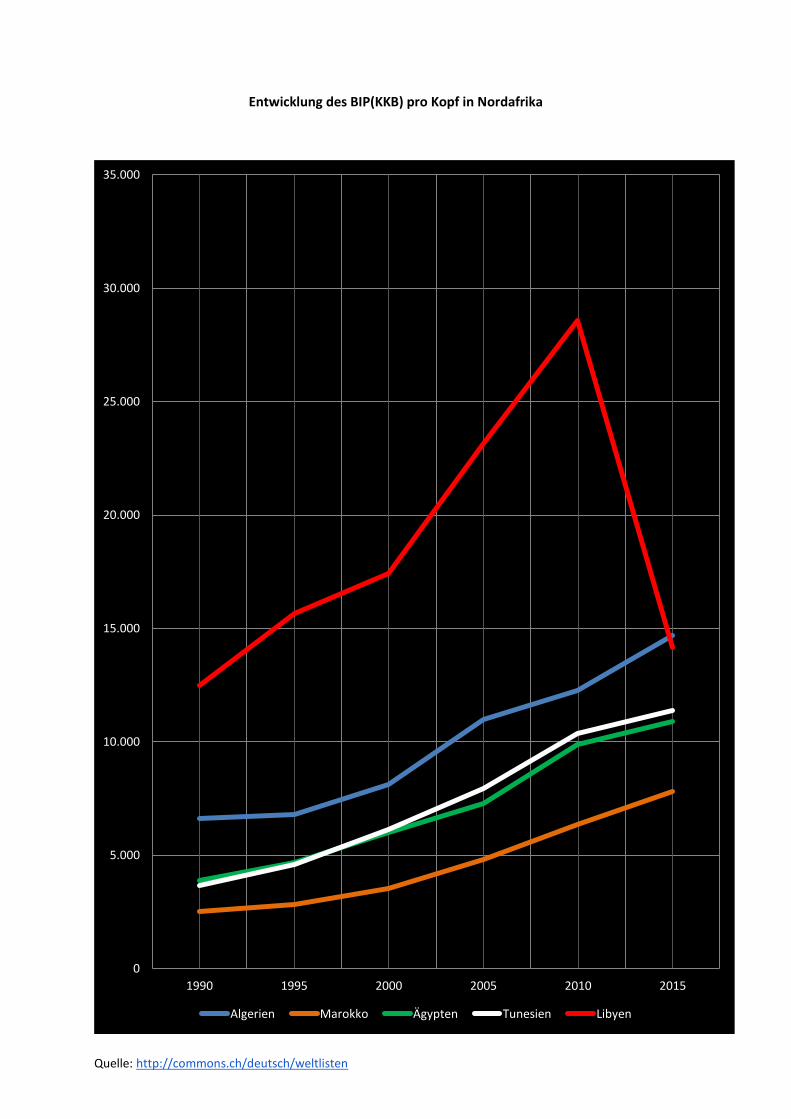
Entwicklung des BIP(KKB) pro Kopf in Nordafrika
0
5.000
10.000
15.000
20.000
25.000
30.000
35.000
1990 1995 2000 2005 2010 2015
Algerien Marokko Ägypten Tunesien Libyen
Quelle: http://commons.ch/deutsch/weltlisten
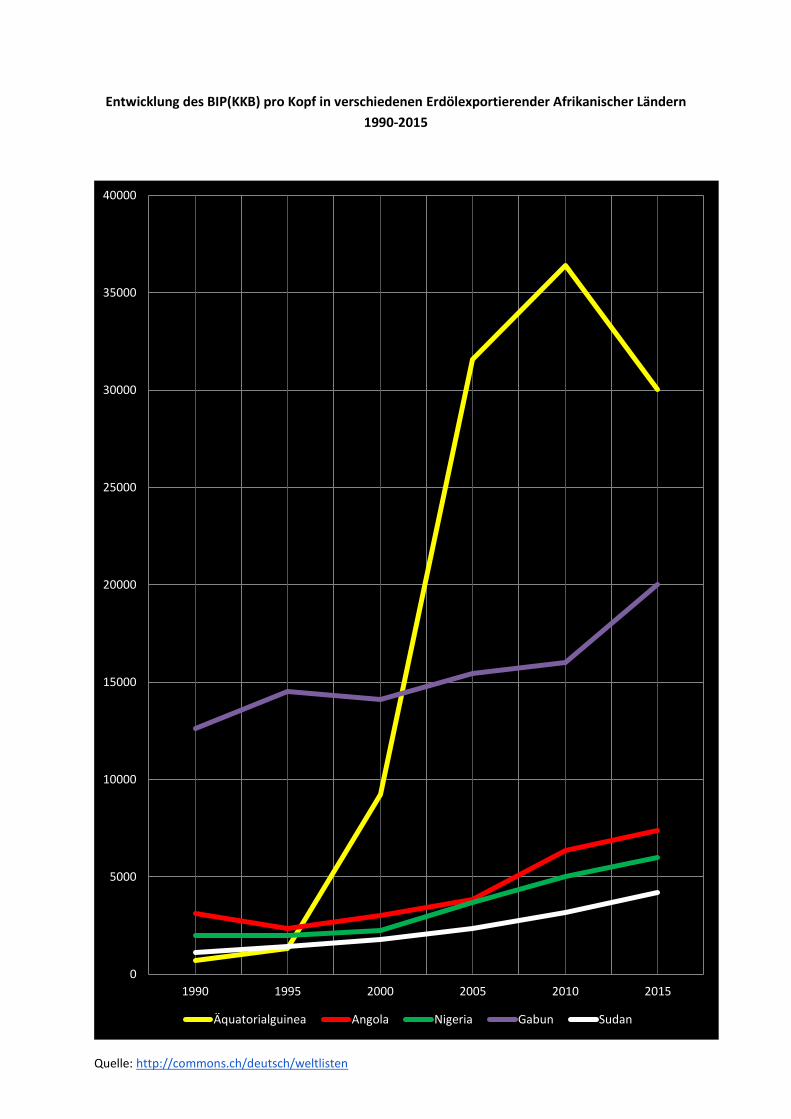
Entwicklung des BIP(KKB) pro Kopf in verschiedenen Erdölexportierender Afrikanischer Ländern
1990-2015
0
5000
10000
15000
20000
25000
30000
35000
40000
1990 1995 2000 2005 2010 2015
Äquatorialguinea Angola Nigeria Gabun Sudan
Quelle: http://commons.ch/deutsch/weltlisten
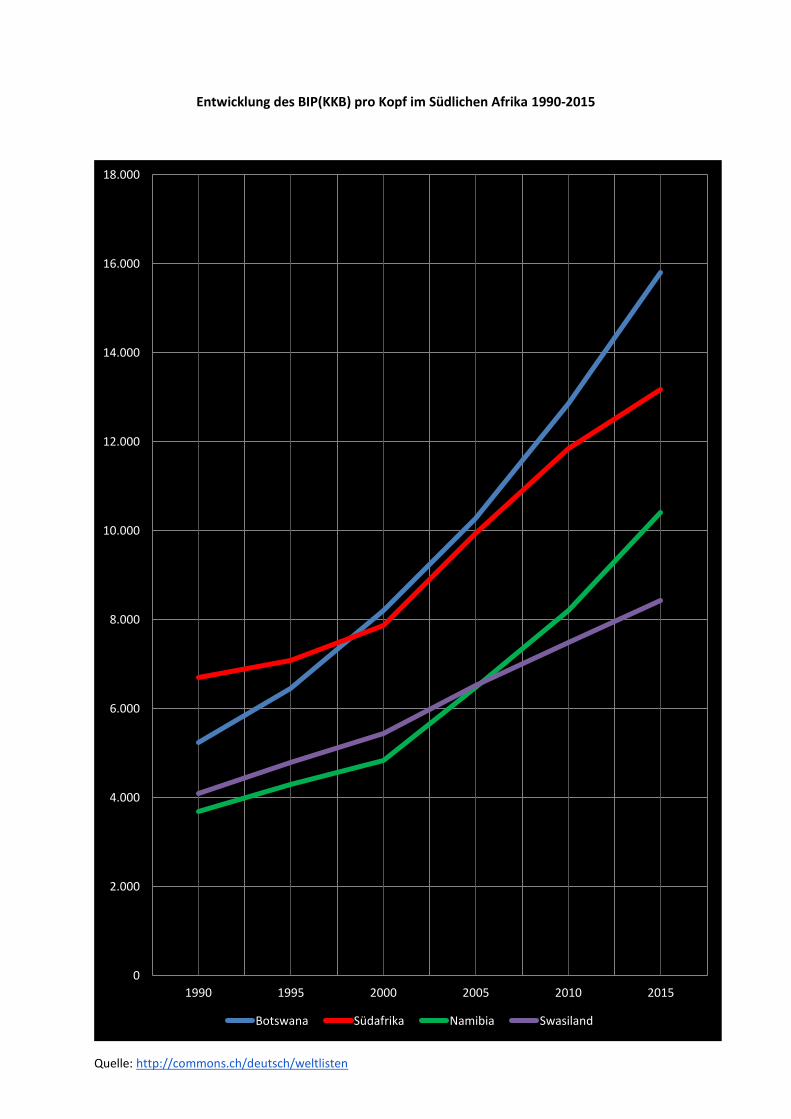
Entwicklung des BIP(KKB) pro Kopf im Südlichen Afrika 1990-2015
0
2.000
4.000
6.000
8.000
10.000
12.000
14.000
16.000
18.000
1990 1995 2000 2005 2010 2015
Botswana Südafrika Namibia Swasiland
Quelle: http://commons.ch/deutsch/weltlisten
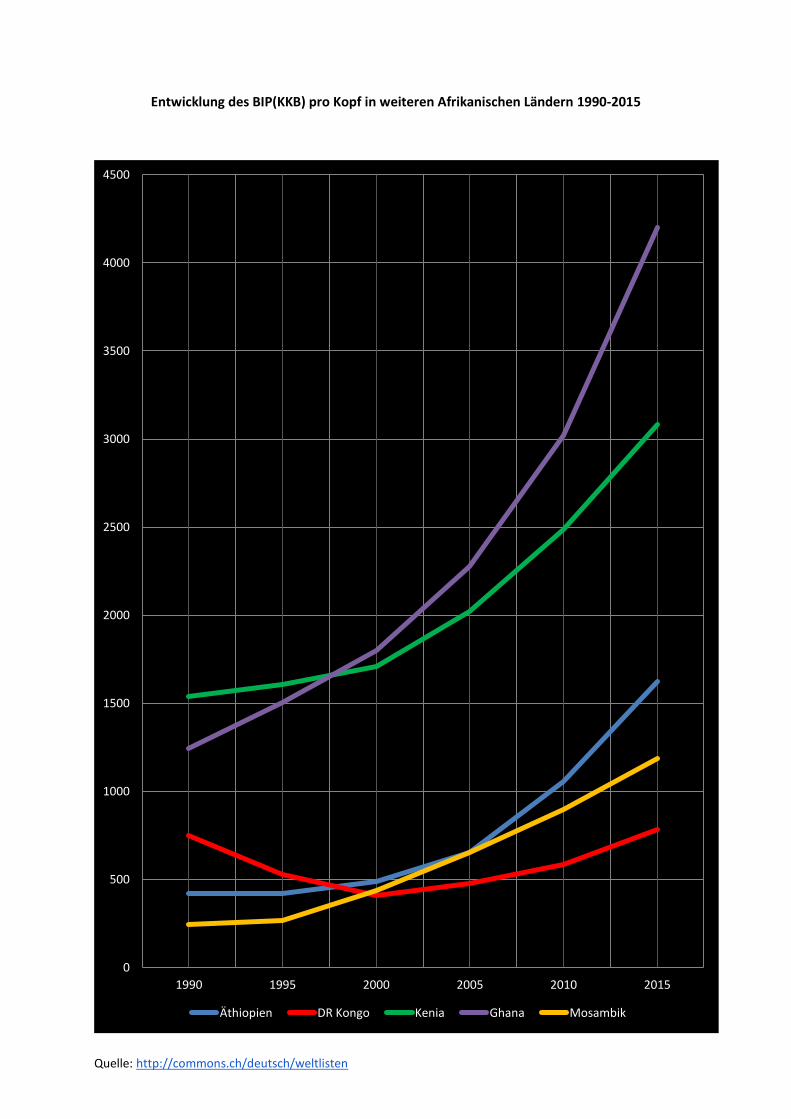
Entwicklung des BIP(KKB) pro Kopf in weiteren Afrikanischen Ländern 1990-2015
0
500
1000
1500
2000
2500
3000
3500
4000
4500
1990 1995 2000 2005 2010 2015
Äthiopien DR Kongo Kenia Ghana Mosambik
Quelle: http://commons.ch/deutsch/weltlisten
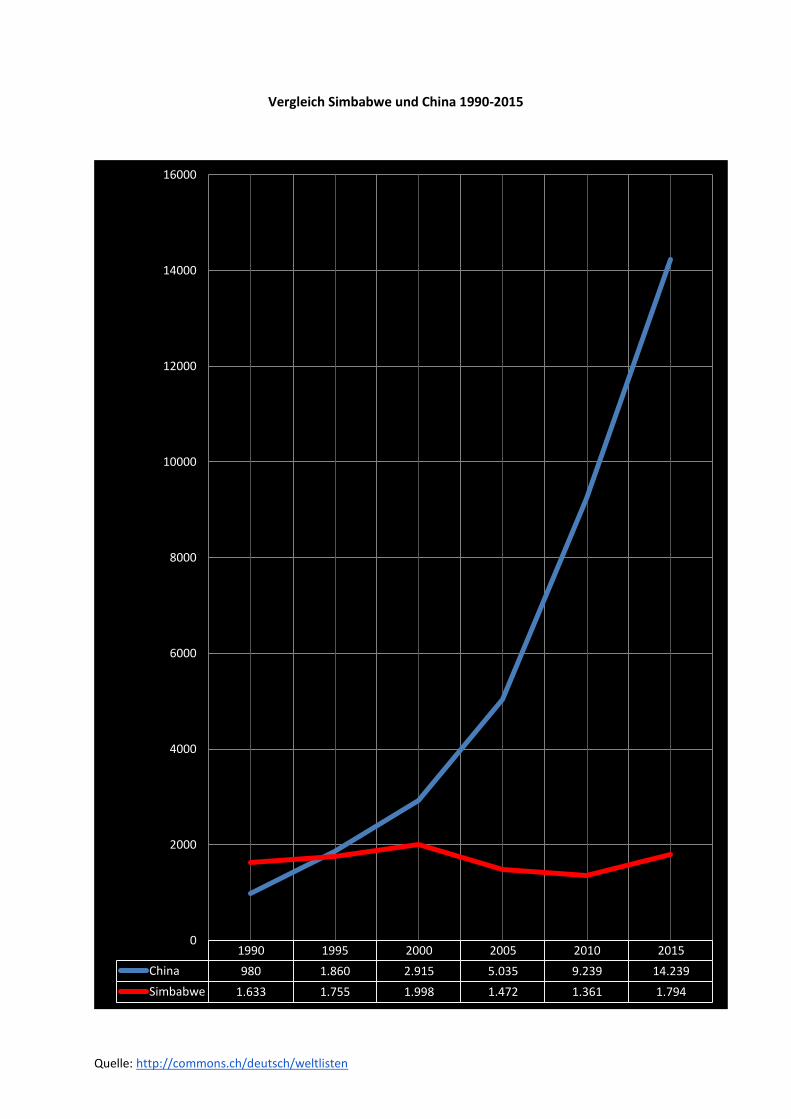
Vergleich Simbabwe und China 1990-2015
1990 1995 2000 2005 2010 2015
China 980 1.860 2.915 5.035 9.239 14.239
Simbabwe 1.633 1.755 1.998 1.472 1.361 1.794
0
2000
4000
6000
8000
10000
12000
14000
16000
Quelle: http://commons.ch/deutsch/weltlisten
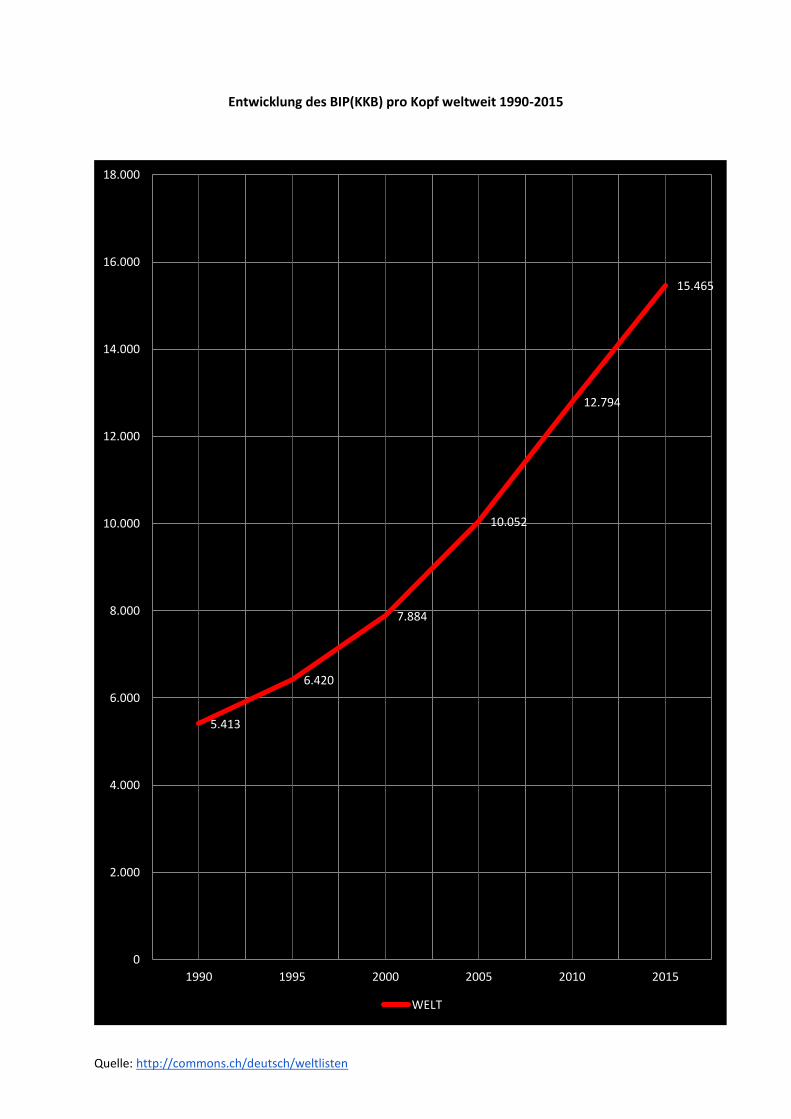
Entwicklung des BIP(KKB) pro Kopf weltweit 1990-2015
5.413
6.420
7.884
10.052
12.794
15.465
0
2.000
4.000
6.000
8.000
10.000
12.000
14.000
16.000
18.000
1990 1995 2000 2005 2010 2015
WELT