Embed Size (px)
Citation preview
Hindawi Publishing CorporationEURASIP Journal on Wireless Communications and NetworkingVolume 2008, Article ID 540873, 14 pagesdoi:10.1155/2008/540873
Research ArticleMACD-BasedMotion Detection Approach inHeterogeneous Networks
Yung-Mu Chen, Tein-Yaw Chung, Ming-Yen Lai, and Chih-Hung Hsu
Department of Computer Science and Engineering, Yuan Ze University, 135 Yuan-Tung Road, Chung-Li, Taiwan 32003, Taiwan
Correspondence should be addressed to Tein-Yaw Chung, [email protected]
Received 2 January 2008; Revised 19 May 2008; Accepted 22 July 2008
Recommended by Athanasios Vasilakos
Optimizing the balance between handoff quality and power consumption is a great challenge for seamless mobile communicationsin wireless networks. Traditional proactive schemes continuously monitor available access networks and exercise handoff.Although such schemes achieve good handoff quality, they consume much power because all interfaces must remain on allthe time. To save power, the reactive schemes use fixed RSS thresholds to determine when to search for a new available accessnetwork. However, since they do not consider user motion, these approaches require that all interfaces be turned on even whena user is stationary, and they tend initiate excessive unnecessary handoffs. To address this problem, this research presents a novelmotion-aware scheme called network discovery with motion detection (NDMD) to improve handoff quality and minimize powerconsumption. The NDMD first applies a moving average convergence divergence (MACD) scheme to analyze received signalstrength (RSS) samples of the current active interface. These results are then used to estimate user’s motion. The proposed NDMDscheme adds very little computing overhead to a mobile terminal (MT) and can be easily incorporated into existing schemes. Thesimulation results in this study showed that NDMD can quickly track user motion state without a positioning system and performnetwork discovery rapidly enough to achieve a much lower handoff-dropping rate with less power consumption.
Copyright © 2008 Yung-Mu Chen et al. This is an open access article distributed under the Creative Commons AttributionLicense, which permits unrestricted use, distribution, and reproduction in any medium, provided the original work is properlycited.
1. INTRODUCTION
As wireless technologies advance, various wireless networkssuch as UMTS, WiFi, and WiMax networks are expectedto jointly support universal ubiquitous services for futuremobile users. To enjoy such ubiquitous services, equippinga mobile terminal (MT) with multiple network interfaces (ormultimode) is getting more important. To ensure ubiquitousaccess, a multimode MT must seamlessly switch, or handoff,its connection between access points or base stations as usersmove between wireless networks.
Maintaining good handoff quality with minimal powerconsumption is an essential capability of multimode MT[1–3]. An active interface in a regular single-mode MTcontinuously monitors available access points and executeshandoff whenever it is beneficial in a homogeneous wirelessnetwork. However, the scenario for multimode handsetsdiffers. To continuously monitor varying wireless networks,a multimode MT must always turn on all other interfacesnot currently in use. Although this proactive scheme ensures
seamless handoff, a multimode MT requires much morepower than a single-mode MT.
To reduce power consumption, a multimode MT usesexisting reactive schemes [4–7] that turn on all interfaces fornetwork discovery only when the RSS or frame error rate(FER) of the current active interface exceeds a predeterminedthreshold. These reactive schemes, however, are insufficientlyreliable for handoff when users are quickly moving awayfrom an access point (AP) or a base station (BS), and theyoften activate interfaces unnecessarily even when users arestationary. Therefore, activating interfaces for network dis-covery according to user motion is important for improvinghandoff quality and minimizing power requirements.
This work presents a novel motion-aware scheme, callednetwork discovery with motion detection (NDMD) to assista handset in improving its handoff quality while reducingpower consumption. In NDMD, when a user moves awayfrom AP, an MT must start discovering available networksin its neighborhood early to avoid handoff failure. On theother hand, an MT can stop network discovery when a user
2 EURASIP Journal on Wireless Communications and Networking
is stationary even if the user is far from the BS or AP. Thus,NDMD can reduce the handoff dropping rate and powerconsumption of an MT.
The proposed NDMD system employs a user motiondetection (UMD) mechanism to estimate the user motionstate. The UMD analyzes RSS samples from current activeinterface then applies a moving average convergence diver-gence (MACD) scheme [8] to determine the user motionstate. The MACD consists of two lowpass filters with differentsmoothing factors. Since accurately estimating user motionrequires accurately selecting smoothing factors, this studypresented a set of possible choices and evaluated theirrespective performance. In contrast with previous work [7,9–12] that exploit a positioning system to maintain handoffquality, UMD estimates user motion states by analyzing RSSsamples. Therefore, no additional hardware, such as GPS, isneeded.
The NDMD has advantages as follows. (1) Without apositioning system, the MT can determine whether the useris leaving the AP, approaching the AP or stationary. (2)An MT can activate and terminate its interfaces rapidlyenough to minimize the handoff dropping rate and powerconsumption. (3) The simplicity of the system requiresminimal computing overhead. (4) Because the NDMD caninitiate network discovery, it can be combined with allhandoff decision mechanisms.
The rest of this paper is organized as follows. Section 2discusses related network discovery mechanisms. Section 3presents details of the predictive algorithm for networkdiscovery. Section 4 evaluates the performance of NDMD.Finally, Section 5 draws conclusions and discusses futureworks.
2. RELATEDWORK
Current network discovery mechanisms can be categorizedas proactive, reactive [13], and location-aware [14]. Acommon proactive approach uses a decision function basedon a handoff mechanism. In a heterogeneous network envi-ronment, traditional RSS comparisons [15, 16] are unreliablefor or incapable of making accurate handoff decisions.Therefore, many metrics, such as service type, monetary cost,network conditions, user preferences, velocity, have beenadopted in decision functions [17–20] to determine whethera handoff is needed. In the proactive approach, an MTmust turn on all its interfaces to perform network discoveryin advance and then monitor all available networks. Theseapproaches can reduce handoff latency, but it substantiallyincreases power consumption. Although Al-Gizawi et al.[20] proposed a mechanism for periodic, on demand or byevent network discovery in a UMTS-WLAN interoperabilityplatform, their methods were not described in detail.
On the other hand, many researchers have studied reac-tive network discovery schemes [4–7] that trigger handoffinitiation by using predefined thresholds. However, fewhave addressed the problem of network discovery. Powerconsumption and handoff dropping rate are a tradeoffif a predefined RSS threshold is adopted for networkdiscovery. For instance, if the RSS threshold is high, power
consumption may increase as an MT turns on its interfacesearly for network discovery, which then enhances handoff.In contrary, if the RSS threshold is set to a low value, thehandoff dropping rate may increase if the MT may turn onits interfaces late and leaves insufficient time for the MT toperform network discovery and handoff execution.
In location-aware schemes [7, 9–12], location informa-tion services such as GPS, location service server (LSS),and topology map are used to provide information such ascoverage area, latency, and bandwidth of available wirelessnetworks around an MT. In [7, 12], an MT first determineswhether the RSS falls below a predefined RSS threshold. Ifso, the MT applies a decision function to determine whetherhandoff is required based on the information that providedby LSS. If a handoff is not required, the MT does not activateother interfaces to save battery power. However, this workdemonstrates only the results of MT energy consumption butdoes not evaluate the handoff dropping rate.
In [10], a handoff trigger node installed in a WLAN/cellular transition region to generate a specific link layertrigger for vertical handoff. This specific trigger can enablean MT to initiate the vertical handoff process in time toreduce the handoff latency and the handoff dropping rate.However, the authors did not describe the details of interfacemanagement. In an earlier work [9], the authors assumedthat an MT manages its WLAN interface using a location-aware base station controller (BSC). Based on BSC, anMT can activate or terminate the WLAN interface in anappropriate time to reduce power consumption. However, areactive method was also used for handoff initiation.
In [11], a positioning system and LSS were employed fornetwork discovery to reduce unnecessary power consump-tion during handoff. Based on the distance between an APand an MT, the MT uses various time intervals to performnetwork discovery. If the distance to the AP is long, then theMT requires a long time interval to perform network dis-covery. However, the LSS-based network discovery schemerequires additional hardware and cannot be implementedin an indoor environment where no positioning system canwork.
3. NETWORK DISCOVERYWITHMOTION DETECTION
An MT must detect the movement of users to predict whenthey leave or enter the associated AP. The user behavior canbe classified into the following three states: (1) approachingstate: the user is moving toward the AP; (2) leaving state:the user is leaving the AP; (3) stationary state: the user isstationary. By using a user motion detection (UMD), an MTcan easily apply RSS to identify the user state without theassistance of a positioning system.
The simplest method for detecting the user motion stateis RSS. Since the receiving signal power of an MT is relatedto the distance between the MT and its associated AP, thereceived signal power Pr at distance d is given by
Pr[i] = Pt − 10ρ log[d] + XdB, (1)
where i is an accumulated value that is determined by themeasuring frequency, Pt is the transmitted signal power,
Yung-Mu Chen et al. 3
ρ is the path loss exponent, and XdB is a Gaussian randomvariable with zero mean and standard deviation σdB (alsocalled shadowing deviation) representing shadow fading.According to (1), the difference between two consecutivemeasured received signal powers at distances d1 and d2 can,without considering XdB, be expressed as
ΔPr[i] = Pr[i]− Pr[i− 1] = −10ρ log[d2
d1
]. (2)
Given the measured RSS interval and the direction and speedof user motion, the following characteristics of mobile radiopropagation can be specified based on (2). UMD motionbehavior
(DIF) =
⎧⎪⎪⎪⎨⎪⎪⎪⎩
Stationary state, if d1 = d2, ΔPr = 0,
Approaching state, if d1 > d2, ΔPr > 0,
Leaving state, if d1 < d2, ΔPr < 0.
(3)
Thus, the variation in ΔPr indicates the motion state ofa user. However, the received signal power measured by anMT fluctuates constantly because of the fading effect even ifa user is in a stationary state. Therefore, an MT cannot easilydetect user motion based only on the difference between twoconsecutive RSS values.
3.1. MACD-based UMDmechanism
This work uses a trend-following indicator called movingaverage convergence divergence (MACD) [8] to elucidate auser behavior in a wireless environment without a position-ing system. The MACD involves two exponentially weightedmoving average (EWMA) filters to analyze the time seriesdata. These two EWMA filters can be expressed as follows:
E[i] = (1− α)E[i− 1] + αO[i], (4)
where E[i] is the current estimate of the time series data,E[i− 1] is the prior estimate, O[i] is the current observation,and α is a smoothing factor within the range zero to one.Equation (4) indicates that E[i] represents a compromisebetween a previous estimate and the current observation.If α is large, then the current observation is emphasized,and the filter provides good agility. That is, the estimatecan be generated rapidly in response to changes in timeseries data. If α is small, more emphasis is given to theprior estimate, and the filter provides good stability. Restated,the generated estimate can resist the noise in individualobservations but cannot react rapidly to changes in timeseries data. Therefore, the EWMA filter can provide differentreactivity with different α.
The MACD employs two EWMA filters to calculate anagile estimate and a stable estimate in a single time seriesdata. If the observed values are increasing constantly, thenthe rising velocity of the agile estimate exceeds that of thestable estimate. Restated, the difference between the agileestimate and the stable estimate increases. This phenomenonis called divergence. Similarly, if the observed values declineconstantly, the same phenomenon occurs. If the observedvalues remain constant, the agile estimate and the stable
Measuringfrequency
Leaving state
Stationary state
Approaching state
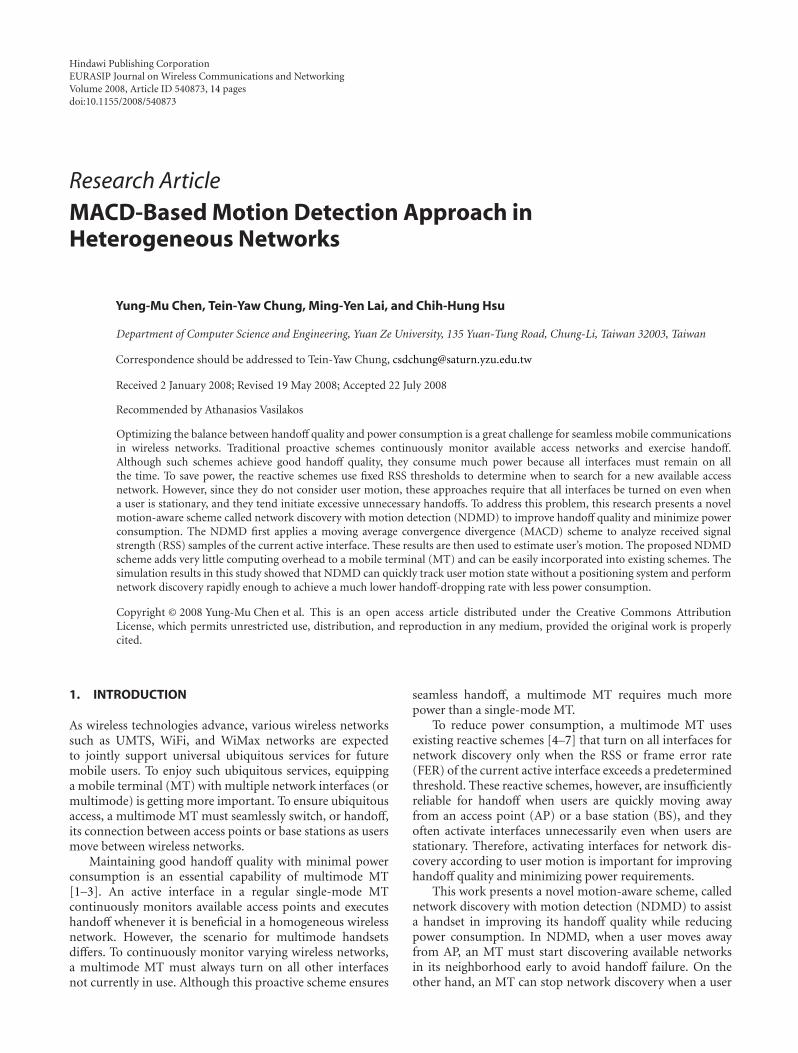
DIF
DIFthresh2
Zero line
DIFthresh1
Figure 1: Determining user’s behavior.
estimate gradually converge toward the same value. That is,the difference between the agile estimate and stable estimatebecomes smaller. This phenomenon is called convergence.Based on the difference between the agile estimate and thestable estimate, MACD can reduce random fluctuations andidentify the underlying direction (upward, downward, orunchanging) in the time series data. Since RSS is also timeseries data and changes with user motion, UMD uses MACDto smooth RSS fluctuation and identify RSS changes. The MTcan then determine the user motion state.
The proposed UMD mechanism operates as follows.It first adopts EWMA filter in MACD to calculate twosmoothed received signal strengths (SRSSs). Let α and βbe the smoothing factors used to calculate the agile andstable SRSS, respectively. R[i] is the received signal strengthmeasured by an MT. According to (4), the agile SRSS A[i]and stable SRSS S[i] can be obtained by
A[i] = (1− α)A[i− 1] + αR[i],
S[i] = (1− β)S[i− 1] + βR[i],(5)
where the initial values of A[0] and S[0] equal R[0]. Since βmust be smaller than α, the following relationship is defined:
0 < β < α < 1, β = α
k, k > 1, (6)
where k is a constant value. The difference DIF between theagile SRSS A[i] and the stable SRSS S[i] is defined as follows:
DIF[i] = A[i]− S[i]. (7)
The DIF can determine user state. As Figure 1 shows,two DIF thresholds are defined to determine user behavior.Based on the DIF value and the DIF thresholds, the detectionof user motion state by ΔPr is modified as follows: UMDmotion behavior
(DIF)=
⎧⎪⎪⎪⎨⎪⎪⎪⎩
Stationary, if DIFthresh2>DIF>DIFthresh1,
Approaching, if DIF > 0, DIF > DIFthresh2,
Leaving, if DIF < 0, DIF < DIFthresh1.(8)
3.2. NDMDalgorithm
Based on the user motion state determined by UMD,NDMD activates or terminates an MT interfaces for network
4 EURASIP Journal on Wireless Communications and Networking
Session start
RSSmeasurement
DIF calculation
RSS < THNDNo
Yes
DIF <DIFthresh2
No
Yes
Approachingthe AP
Set the MT to theNON ND mode
DIF <DIFthresh1
No
Yes
Stationary
Leaving the AP
Set the MT to theSEMI ND mode
Set the MT to theND mode
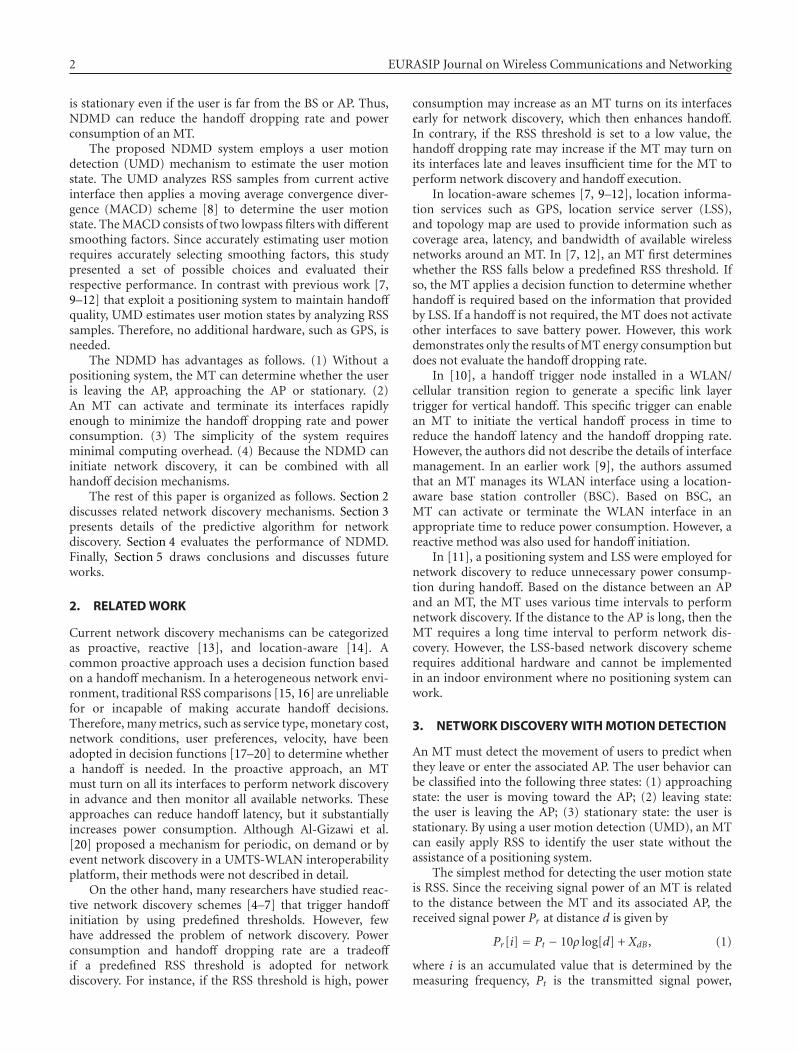
Figure 2: The NDMD algorithm for network discovery.
discovery at the right time to save power and reduce handoffdropping rate. In NDMD, a new network discovery threshold(THND) and three network discovery modes are defined. Thehigher THND is necessary since an MT must turn on all itsinterfaces in time to perform network discovery proceduressuch as searching base stations, association, AAA, addressacquisition, and other high layer signaling functions, beforeswitching to another network. However, using a high RSSthreshold certainly increases power consumption. Therefore,the following three network discovery modes are defined toreduce power consumption.
(i) NON ND mode: this mode is used when a useris approaching an AP or BS. Therefore, networkdiscovery is unneeded.
(ii) ND mode: this mode is used when a user is leavingthe associated AP or BS. Therefore, timely activationof interfaces is critical for detecting all availablewireless networks.
(iii) SEMI ND mode: this mode is applied when a useris stationary. An MT first determines whether anyAPs or BSs is available in its neighborhood. If so, itdetermines whether a horizontal handoff is required.Otherwise, the MT must activate all of its interfacesto perform network discovery.
Figure 2 shows a flow chart of the NDMD algorithm.When an MT connects to an AP, the RSS is measured andthe user motion is continuously determined. When the RSSis below or above the predefined RSS threshold mentionedabove, the MT is set to change to a suitable network discoverymode to activate or terminate its interfaces based on theNDMD algorithm.
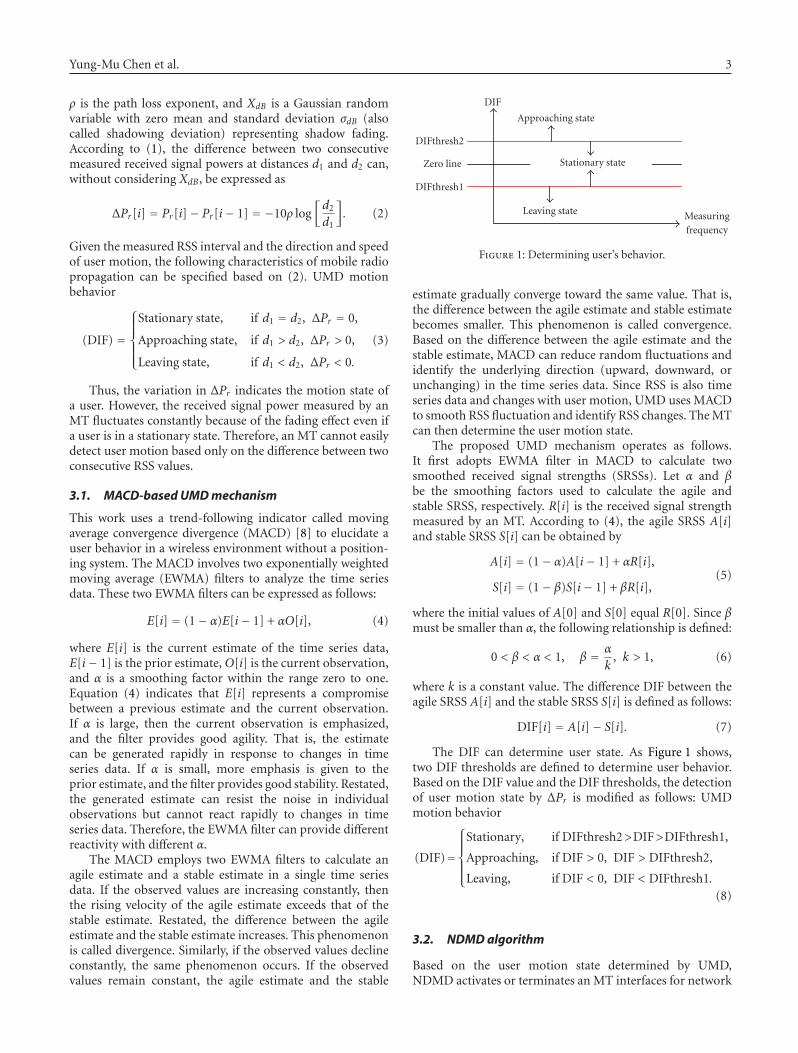
Figure 3 presents an example of NDMD application.Suppose an MT is currently associated with WLAN AP1. Inscenario (1), the MT can terminate its network discovery
WLAN AP2WLAN AP1
WiMAX BS3G BS
(2) (1)(3)
Figure 3: Example of proposed algorithm.
even if its initial location is far from AP1, because the useris in an approaching state. In scenario (2), the MT activatesits interfaces to discover other networks in time to reducethe handoff dropping rate because it is leaving the associatedAP. In scenario (3), the user is leaving AP1 initially but stopsbefore he has left. In this case, the MT certainly activates allits interfaces to discover other available networks when theRSS of the MT is below the predefined network discoverythreshold. However, the proposed algorithm eventuallydetects that the user is in a stationary state, thus the MTturn off other interfaces to reduce power consumption. Here,the MT simply determines whether a horizontal handoff isrequired because AP2 is nearby.
3.3. Analysis of NDMDalgorithm
In NDMD, an MT can predict whether a user is leavingits associated WLAN by applying UMD and then activatingor terminating its interfaces within an appropriate time.The UMD strongly affects the performance of the NDMDalgorithm. The change of DIF is used to determine themotion state of a user in UMD. Thus, the DIF value mustrespond quickly to user behavior so that the motion state canbe determined rapidly. The analysis requires determining thedifference, δ DIF, between two consecutive DIF values.
Substituting (5) into (7) yields
DIF[i] = A[i− 1]− S[i− 1] + α(R[i]− A[i− 1])
− β(R[i]− S[i− 1])
= DIF[i− 1] + α(R[i]− A[i− 1])
− β(R[i]− S[i− 1]).
(9)
Let ΔDIF denotes DIF[i]−DIF[i− 1], the DIF is given by
ΔDIF[i] = α(R[i]− A[i− 1])− β(R[i]− S[i− 1]).(10)
Using β = α/k in (6), we have
ΔDIF[i] = α[
(R[i]− A[i− 1])− 1k
(R[i]− S
[i− 1]
)].
(11)
Equation (11) shows that α, k, (R[i] − A[i − 1]), and(R[i] − S[i − 1]) strongly affect ΔDIF. (R[i] − A[i − 1]) and(R[i]− S[i− 1]) represent two forms of ΔDIF, which are thedifferences between two consecutive RSS measurements.
The ΔDIF is affected by many other factors, such asmobile radio propagation characteristics. Some of thesefactors are summarized as follows.
Yung-Mu Chen et al. 5
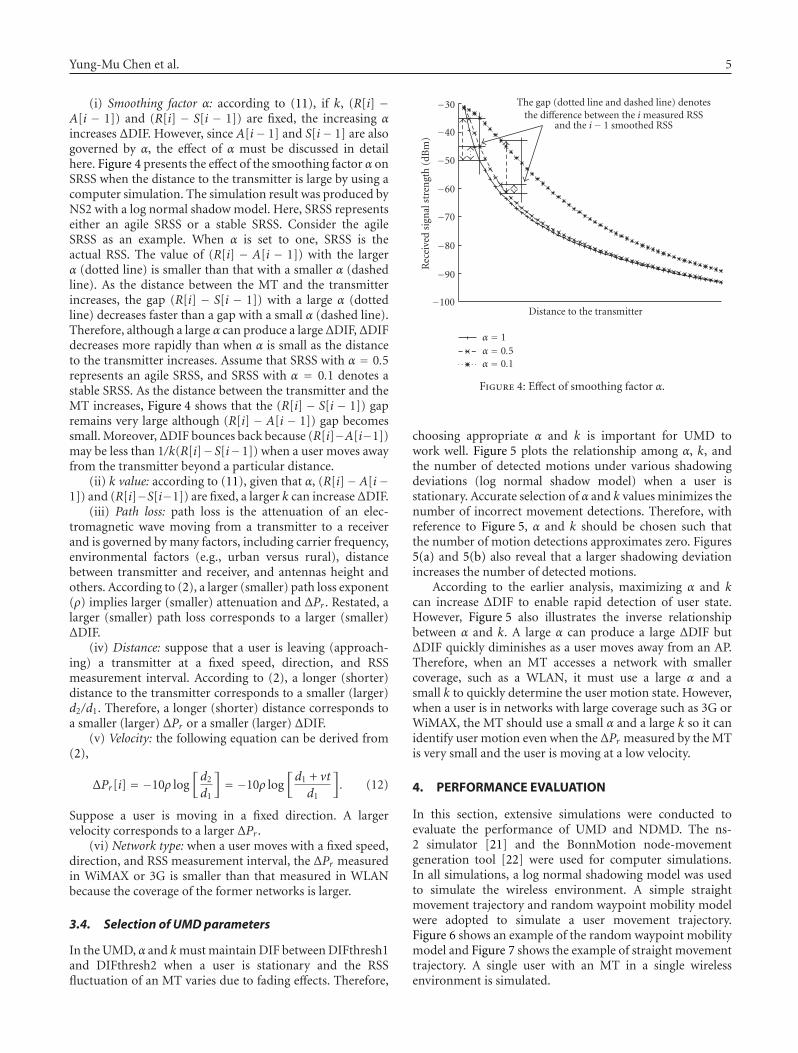
(i) Smoothing factor α: according to (11), if k, (R[i] −A[i − 1]) and (R[i] − S[i − 1]) are fixed, the increasing αincreases ΔDIF. However, since A[i− 1] and S[i− 1] are alsogoverned by α, the effect of α must be discussed in detailhere. Figure 4 presents the effect of the smoothing factor α onSRSS when the distance to the transmitter is large by using acomputer simulation. The simulation result was produced byNS2 with a log normal shadow model. Here, SRSS representseither an agile SRSS or a stable SRSS. Consider the agileSRSS as an example. When α is set to one, SRSS is theactual RSS. The value of (R[i] − A[i − 1]) with the largerα (dotted line) is smaller than that with a smaller α (dashedline). As the distance between the MT and the transmitterincreases, the gap (R[i] − S[i − 1]) with a large α (dottedline) decreases faster than a gap with a small α (dashed line).Therefore, although a large α can produce a large ΔDIF,ΔDIFdecreases more rapidly than when α is small as the distanceto the transmitter increases. Assume that SRSS with α = 0.5represents an agile SRSS, and SRSS with α = 0.1 denotes astable SRSS. As the distance between the transmitter and theMT increases, Figure 4 shows that the (R[i] − S[i − 1]) gapremains very large although (R[i] − A[i − 1]) gap becomessmall. Moreover, ΔDIF bounces back because (R[i]−A[i−1])may be less than 1/k(R[i]−S[i−1]) when a user moves awayfrom the transmitter beyond a particular distance.
(ii) k value: according to (11), given that α, (R[i]−A[i−1]) and (R[i]−S[i−1]) are fixed, a larger k can increase ΔDIF.
(iii) Path loss: path loss is the attenuation of an elec-tromagnetic wave moving from a transmitter to a receiverand is governed by many factors, including carrier frequency,environmental factors (e.g., urban versus rural), distancebetween transmitter and receiver, and antennas height andothers. According to (2), a larger (smaller) path loss exponent(ρ) implies larger (smaller) attenuation and ΔPr . Restated, alarger (smaller) path loss corresponds to a larger (smaller)ΔDIF.
(iv) Distance: suppose that a user is leaving (approach-ing) a transmitter at a fixed speed, direction, and RSSmeasurement interval. According to (2), a longer (shorter)distance to the transmitter corresponds to a smaller (larger)d2/d1. Therefore, a longer (shorter) distance corresponds toa smaller (larger) ΔPr or a smaller (larger) ΔDIF.
(v) Velocity: the following equation can be derived from(2),
ΔPr[i] = −10ρ log[d2
d1
]= −10ρ log
[d1 + vt
d1
]. (12)
Suppose a user is moving in a fixed direction. A largervelocity corresponds to a larger ΔPr .
(vi) Network type: when a user moves with a fixed speed,direction, and RSS measurement interval, the ΔPr measuredin WiMAX or 3G is smaller than that measured in WLANbecause the coverage of the former networks is larger.
3.4. Selection of UMDparameters
In the UMD, α and k must maintain DIF between DIFthresh1and DIFthresh2 when a user is stationary and the RSSfluctuation of an MT varies due to fading effects. Therefore,
Distance to the transmitter−100
−90
−80
−70
−60
−50
−40
−30
Rec
eive
dsi
gnal
stre
ngt
h(d
Bm
)
The gap (dotted line and dashed line) denotesthe difference between the i measured RSS
and the i− 1 smoothed RSS
α = 1α = 0.5α = 0.1
Figure 4: Effect of smoothing factor α.
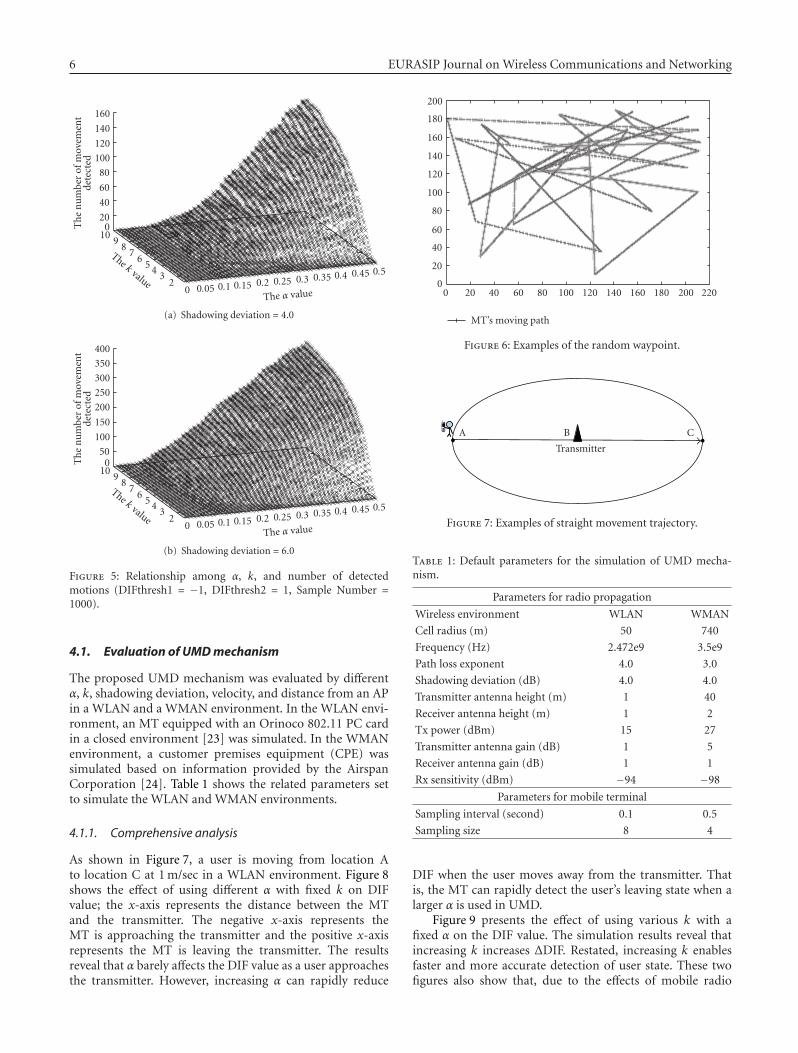
choosing appropriate α and k is important for UMD towork well. Figure 5 plots the relationship among α, k, andthe number of detected motions under various shadowingdeviations (log normal shadow model) when a user isstationary. Accurate selection of α and k values minimizes thenumber of incorrect movement detections. Therefore, withreference to Figure 5, α and k should be chosen such thatthe number of motion detections approximates zero. Figures5(a) and 5(b) also reveal that a larger shadowing deviationincreases the number of detected motions.
According to the earlier analysis, maximizing α and kcan increase ΔDIF to enable rapid detection of user state.However, Figure 5 also illustrates the inverse relationshipbetween α and k. A large α can produce a large ΔDIF butΔDIF quickly diminishes as a user moves away from an AP.Therefore, when an MT accesses a network with smallercoverage, such as a WLAN, it must use a large α and asmall k to quickly determine the user motion state. However,when a user is in networks with large coverage such as 3G orWiMAX, the MT should use a small α and a large k so it canidentify user motion even when the ΔPr measured by the MTis very small and the user is moving at a low velocity.
4. PERFORMANCE EVALUATION
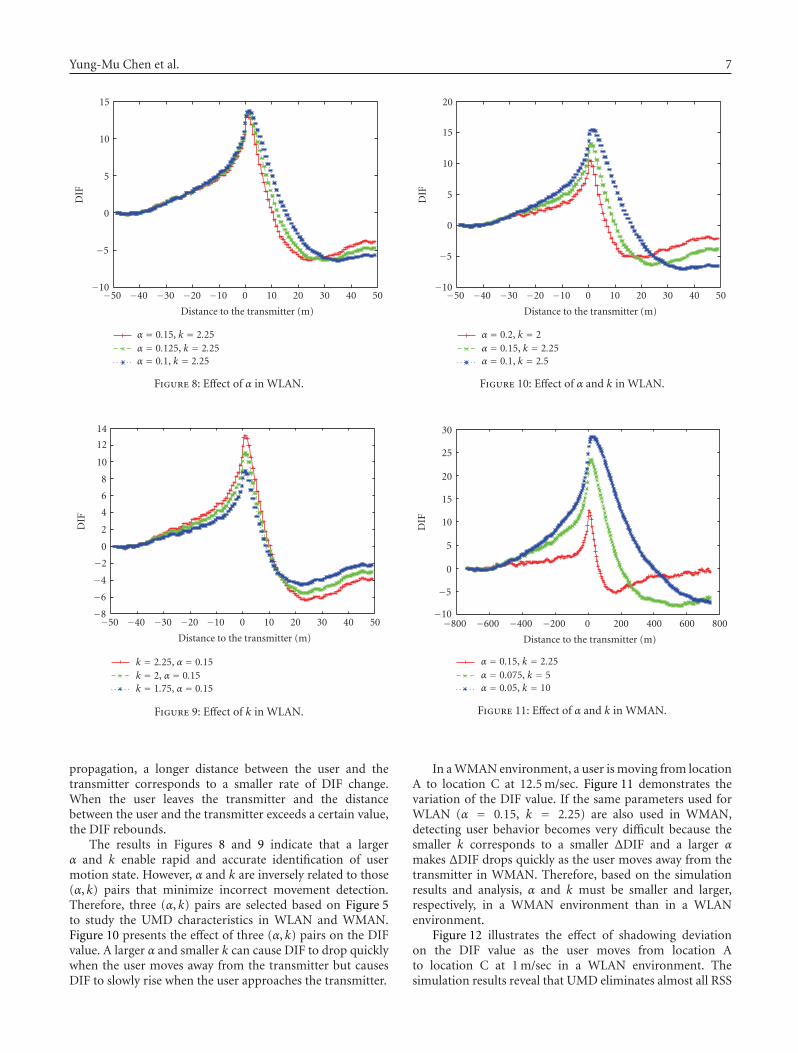
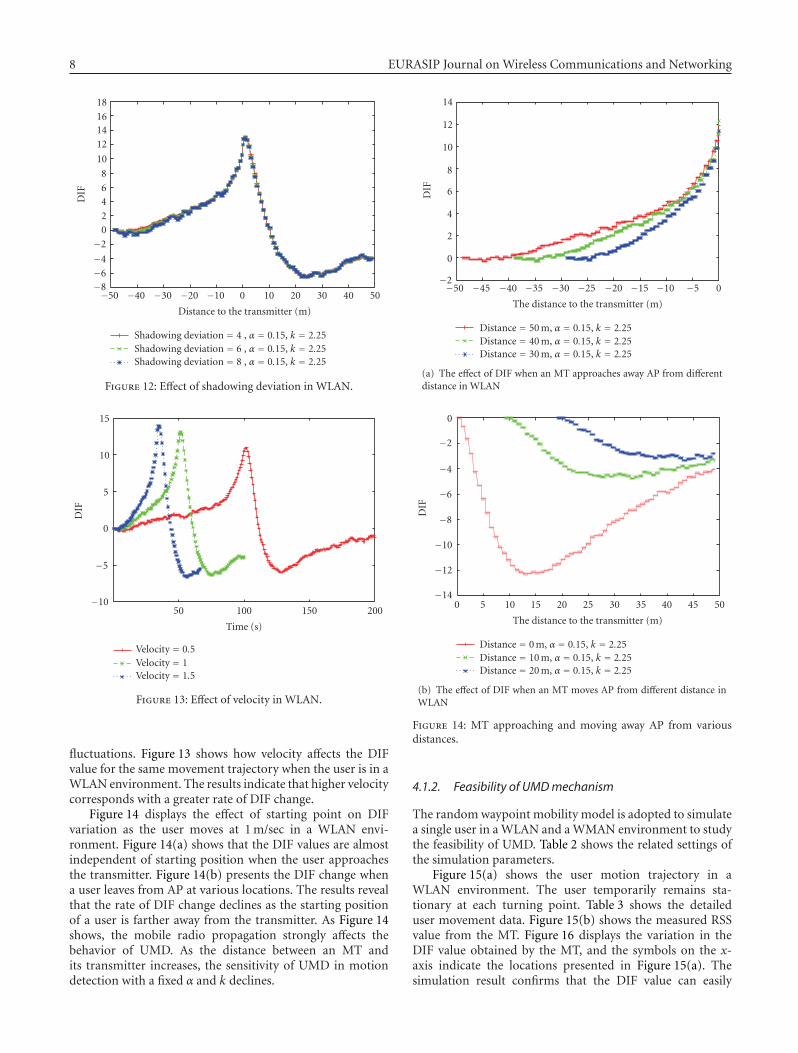
In this section, extensive simulations were conducted toevaluate the performance of UMD and NDMD. The ns-2 simulator [21] and the BonnMotion node-movementgeneration tool [22] were used for computer simulations.In all simulations, a log normal shadowing model was usedto simulate the wireless environment. A simple straightmovement trajectory and random waypoint mobility modelwere adopted to simulate a user movement trajectory.Figure 6 shows an example of the random waypoint mobilitymodel and Figure 7 shows the example of straight movementtrajectory. A single user with an MT in a single wirelessenvironment is simulated.
6 EURASIP Journal on Wireless Communications and Networking
020
40
60
80
100
120
140
160
Th
en
um
ber
ofm
ovem
ent
dete
cted
0 0.05 0.1 0.15 0.2 0.25 0.3 0.35 0.4 0.45 0.5
The α value2
345
67
89
10
The k value
(a) Shadowing deviation = 4.0
050
100
150
200
250
300
350
400
Th
en
um
ber
ofm
ovem
ent
dete
cted
0 0.05 0.1 0.15 0.2 0.25 0.3 0.35 0.4 0.45 0.5
The α value2
345
67
89
10
The k value
(b) Shadowing deviation = 6.0
Figure 5: Relationship among α, k, and number of detectedmotions (DIFthresh1 = −1, DIFthresh2 = 1, Sample Number =1000).
4.1. Evaluation of UMDmechanism
The proposed UMD mechanism was evaluated by differentα, k, shadowing deviation, velocity, and distance from an APin a WLAN and a WMAN environment. In the WLAN envi-ronment, an MT equipped with an Orinoco 802.11 PC cardin a closed environment [23] was simulated. In the WMANenvironment, a customer premises equipment (CPE) wassimulated based on information provided by the AirspanCorporation [24]. Table 1 shows the related parameters setto simulate the WLAN and WMAN environments.
4.1.1. Comprehensive analysis
As shown in Figure 7, a user is moving from location Ato location C at 1 m/sec in a WLAN environment. Figure 8shows the effect of using different α with fixed k on DIFvalue; the x-axis represents the distance between the MTand the transmitter. The negative x-axis represents theMT is approaching the transmitter and the positive x-axisrepresents the MT is leaving the transmitter. The resultsreveal that α barely affects the DIF value as a user approachesthe transmitter. However, increasing α can rapidly reduce
0
20
40
60
80
100
120
140
160
180
200
0 20 40 60 80 100 120 140 160 180 200 220
MT’s moving path
Figure 6: Examples of the random waypoint.
CBA
Transmitter
Figure 7: Examples of straight movement trajectory.
Table 1: Default parameters for the simulation of UMD mecha-nism.
Parameters for radio propagation
Wireless environment WLAN WMAN
Cell radius (m) 50 740
Frequency (Hz) 2.472e9 3.5e9
Path loss exponent 4.0 3.0
Shadowing deviation (dB) 4.0 4.0
Transmitter antenna height (m) 1 40
Receiver antenna height (m) 1 2
Tx power (dBm) 15 27
Transmitter antenna gain (dB) 1 5
Receiver antenna gain (dB) 1 1
Rx sensitivity (dBm) −94 −98
Parameters for mobile terminal
Sampling interval (second) 0.1 0.5
Sampling size 8 4
DIF when the user moves away from the transmitter. Thatis, the MT can rapidly detect the user’s leaving state when alarger α is used in UMD.
Figure 9 presents the effect of using various k with afixed α on the DIF value. The simulation results reveal thatincreasing k increases ΔDIF. Restated, increasing k enablesfaster and more accurate detection of user state. These twofigures also show that, due to the effects of mobile radio
Yung-Mu Chen et al. 7
−50 −40 −30 −20 −10 0 10 20 30 40 50
Distance to the transmitter (m)
−10
−5
0
5
10
15
DIF
α = 0.15, k = 2.25α = 0.125, k = 2.25α = 0.1, k = 2.25
Figure 8: Effect of α in WLAN.
−50 −40 −30 −20 −10 0 10 20 30 40 50
Distance to the transmitter (m)
−8
−6
−4
−2
0
2
4
6
8
10
12
14
DIF
k = 2.25, α = 0.15k = 2, α = 0.15k = 1.75, α = 0.15
Figure 9: Effect of k in WLAN.
propagation, a longer distance between the user and thetransmitter corresponds to a smaller rate of DIF change.When the user leaves the transmitter and the distancebetween the user and the transmitter exceeds a certain value,the DIF rebounds.
The results in Figures 8 and 9 indicate that a largerα and k enable rapid and accurate identification of usermotion state. However, α and k are inversely related to those(α, k) pairs that minimize incorrect movement detection.Therefore, three (α, k) pairs are selected based on Figure 5to study the UMD characteristics in WLAN and WMAN.Figure 10 presents the effect of three (α, k) pairs on the DIFvalue. A larger α and smaller k can cause DIF to drop quicklywhen the user moves away from the transmitter but causesDIF to slowly rise when the user approaches the transmitter.
−50 −40 −30 −20 −10 0 10 20 30 40 50
Distance to the transmitter (m)
−10
−5
0
5
10
15
20
DIF
α = 0.2, k = 2α = 0.15, k = 2.25α = 0.1, k = 2.5
Figure 10: Effect of α and k in WLAN.
−800 −600 −400 −200 0 200 400 600 800
Distance to the transmitter (m)
−10
−5
0
5
10
15
20
25
30D
IF
α = 0.15, k = 2.25α = 0.075, k = 5α = 0.05, k = 10
Figure 11: Effect of α and k in WMAN.
In a WMAN environment, a user is moving from locationA to location C at 12.5 m/sec. Figure 11 demonstrates thevariation of the DIF value. If the same parameters used forWLAN (α = 0.15, k = 2.25) are also used in WMAN,detecting user behavior becomes very difficult because thesmaller k corresponds to a smaller ΔDIF and a larger αmakes ΔDIF drops quickly as the user moves away from thetransmitter in WMAN. Therefore, based on the simulationresults and analysis, α and k must be smaller and larger,respectively, in a WMAN environment than in a WLANenvironment.
Figure 12 illustrates the effect of shadowing deviationon the DIF value as the user moves from location Ato location C at 1 m/sec in a WLAN environment. Thesimulation results reveal that UMD eliminates almost all RSS
8 EURASIP Journal on Wireless Communications and Networking
−50 −40 −30 −20 −10 0 10 20 30 40 50
Distance to the transmitter (m)
−8−6
−4
−2
02
46
8
10
121416
18
DIF
Shadowing deviation = 4 , α = 0.15, k = 2.25Shadowing deviation = 6 , α = 0.15, k = 2.25Shadowing deviation = 8 , α = 0.15, k = 2.25
Figure 12: Effect of shadowing deviation in WLAN.
50 100 150 200
Time (s)
−10
−5
0
5
10
15
DIF
Velocity = 0.5Velocity = 1Velocity = 1.5
Figure 13: Effect of velocity in WLAN.
fluctuations. Figure 13 shows how velocity affects the DIFvalue for the same movement trajectory when the user is in aWLAN environment. The results indicate that higher velocitycorresponds with a greater rate of DIF change.
Figure 14 displays the effect of starting point on DIFvariation as the user moves at 1 m/sec in a WLAN envi-ronment. Figure 14(a) shows that the DIF values are almostindependent of starting position when the user approachesthe transmitter. Figure 14(b) presents the DIF change whena user leaves from AP at various locations. The results revealthat the rate of DIF change declines as the starting positionof a user is farther away from the transmitter. As Figure 14shows, the mobile radio propagation strongly affects thebehavior of UMD. As the distance between an MT andits transmitter increases, the sensitivity of UMD in motiondetection with a fixed α and k declines.
−50 −45 −40 −35 −30 −25 −20 −15 −10 −5 0
The distance to the transmitter (m)
−2
0
2
4
6
8
10
12
14
DIF
Distance = 50 m, α = 0.15, k = 2.25Distance = 40 m, α = 0.15, k = 2.25Distance = 30 m, α = 0.15, k = 2.25
(a) The effect of DIF when an MT approaches away AP from differentdistance in WLAN
0 5 10 15 20 25 30 35 40 45 50
The distance to the transmitter (m)
−14
−12
−10
−8
−6
−4
−2
0D
IF
Distance = 0 m, α = 0.15, k = 2.25Distance = 10 m, α = 0.15, k = 2.25Distance = 20 m, α = 0.15, k = 2.25
(b) The effect of DIF when an MT moves AP from different distance inWLAN
Figure 14: MT approaching and moving away AP from variousdistances.
4.1.2. Feasibility of UMDmechanism
The random waypoint mobility model is adopted to simulatea single user in a WLAN and a WMAN environment to studythe feasibility of UMD. Table 2 shows the related settings ofthe simulation parameters.
Figure 15(a) shows the user motion trajectory in aWLAN environment. The user temporarily remains sta-tionary at each turning point. Table 3 shows the detaileduser movement data. Figure 15(b) shows the measured RSSvalue from the MT. Figure 16 displays the variation in theDIF value obtained by the MT, and the symbols on the x-axis indicate the locations presented in Figure 15(a). Thesimulation result confirms that the DIF value can easily
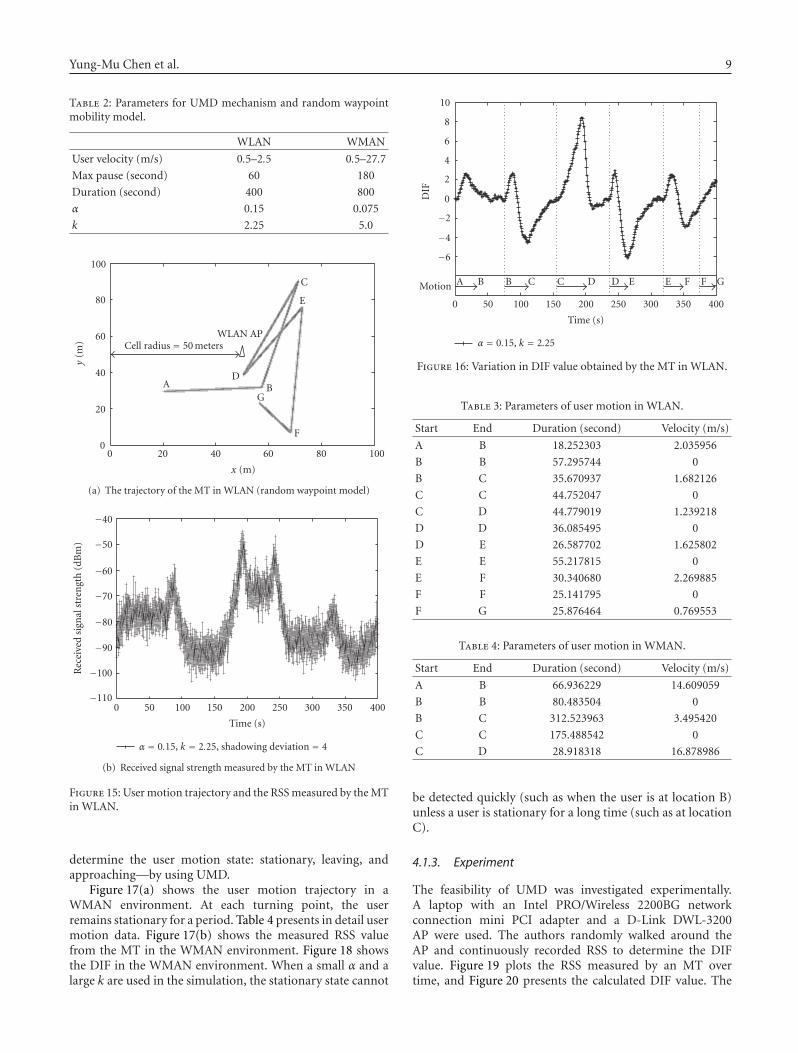
Yung-Mu Chen et al. 9
Table 2: Parameters for UMD mechanism and random waypointmobility model.
WLAN WMAN
User velocity (m/s) 0.5–2.5 0.5–27.7
Max pause (second) 60 180
Duration (second) 400 800
α 0.15 0.075
k 2.25 5.0
0 20 40 60 80 100
x (m)
0
20
40
60
80
100
y(m
) Cell radius = 50 metersWLAN AP
A BD
G
F
E
C
(a) The trajectory of the MT in WLAN (random waypoint model)
0 50 100 150 200 250 300 350 400
Time (s)
−110
−100
−90
−80
−70
−60
−50
−40
Rec
eive
dsi
gnal
stre
ngt
h(d
Bm
)
α = 0.15, k = 2.25, shadowing deviation = 4
(b) Received signal strength measured by the MT in WLAN
Figure 15: User motion trajectory and the RSS measured by the MTin WLAN.
determine the user motion state: stationary, leaving, andapproaching—by using UMD.
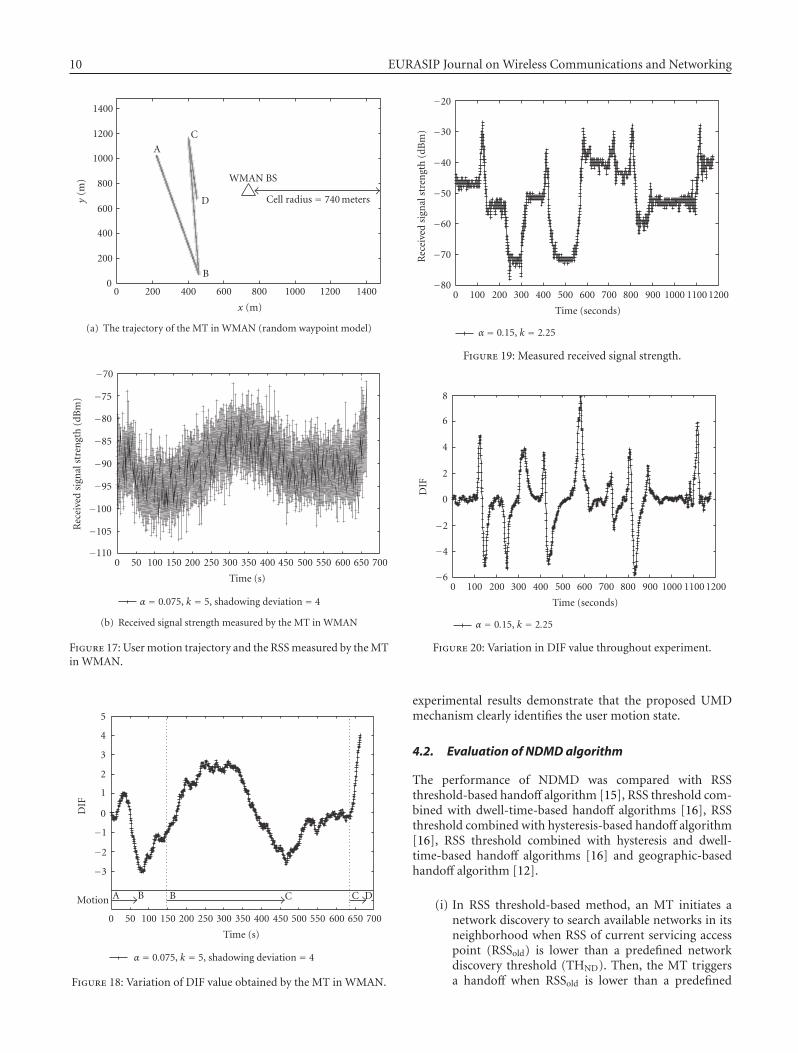
Figure 17(a) shows the user motion trajectory in aWMAN environment. At each turning point, the userremains stationary for a period. Table 4 presents in detail usermotion data. Figure 17(b) shows the measured RSS valuefrom the MT in the WMAN environment. Figure 18 showsthe DIF in the WMAN environment. When a small α and alarge k are used in the simulation, the stationary state cannot
0 50 100 150 200 250 300 350 400
Time (s)
Motion A B B C C D D E E F F G
−6
−4
−2
0
2
4
6
8
10
DIF
α = 0.15, k = 2.25
Figure 16: Variation in DIF value obtained by the MT in WLAN.
Table 3: Parameters of user motion in WLAN.
Start End Duration (second) Velocity (m/s)
A B 18.252303 2.035956
B B 57.295744 0
B C 35.670937 1.682126
C C 44.752047 0
C D 44.779019 1.239218
D D 36.085495 0
D E 26.587702 1.625802
E E 55.217815 0
E F 30.340680 2.269885
F F 25.141795 0
F G 25.876464 0.769553
Table 4: Parameters of user motion in WMAN.
Start End Duration (second) Velocity (m/s)
A B 66.936229 14.609059
B B 80.483504 0
B C 312.523963 3.495420
C C 175.488542 0
C D 28.918318 16.878986
be detected quickly (such as when the user is at location B)unless a user is stationary for a long time (such as at locationC).
4.1.3. Experiment
The feasibility of UMD was investigated experimentally.A laptop with an Intel PRO/Wireless 2200BG networkconnection mini PCI adapter and a D-Link DWL-3200AP were used. The authors randomly walked around theAP and continuously recorded RSS to determine the DIFvalue. Figure 19 plots the RSS measured by an MT overtime, and Figure 20 presents the calculated DIF value. The
10 EURASIP Journal on Wireless Communications and Networking
0 200 400 600 800 1000 1200 1400
x (m)
0
200
400
600
800
1000
1200
1400
y(m
)
Cell radius = 740 meters
WMAN BS
A
D
B
C
(a) The trajectory of the MT in WMAN (random waypoint model)
0 50 100 150 200 250 300 350 400 450 500 550 600 650 700
Time (s)
−110
−105
−100
−95
−90
−85
−80
−75
−70
Rec
eive
dsi
gnal
stre
ngt
h(d
Bm
)
α = 0.075, k = 5, shadowing deviation = 4
(b) Received signal strength measured by the MT in WMAN
Figure 17: User motion trajectory and the RSS measured by the MTin WMAN.
0 50 100 150 200 250 300 350 400 450 500 550 600 650 700
Time (s)
Motion A B B C C D
−3
−2
−1
0
1
2
3
4
5
DIF
α = 0.075, k = 5, shadowing deviation = 4
Figure 18: Variation of DIF value obtained by the MT in WMAN.
0 100 200 300 400 500 600 700 800 900 1000 1100 1200
Time (seconds)
−80
−70
−60
−50
−40
−30
−20
Rec
eive
dsi
gnal
stre
ngt
h(d
Bm
)
α = 0.15, k = 2.25
Figure 19: Measured received signal strength.
0 100 200 300 400 500 600 700 800 900 1000 1100 1200
Time (seconds)
−6
−4
−2
0
2
4
6
8
DIF
α = 0.15, k = 2.25
Figure 20: Variation in DIF value throughout experiment.
experimental results demonstrate that the proposed UMDmechanism clearly identifies the user motion state.
4.2. Evaluation of NDMDalgorithm
The performance of NDMD was compared with RSSthreshold-based handoff algorithm [15], RSS threshold com-bined with dwell-time-based handoff algorithms [16], RSSthreshold combined with hysteresis-based handoff algorithm[16], RSS threshold combined with hysteresis and dwell-time-based handoff algorithms [16] and geographic-basedhandoff algorithm [12].
(i) In RSS threshold-based method, an MT initiates anetwork discovery to search available networks in itsneighborhood when RSS of current servicing accesspoint (RSSold) is lower than a predefined networkdiscovery threshold (THND). Then, the MT triggersa handoff when RSSold is lower than a predefined
Yung-Mu Chen et al. 11
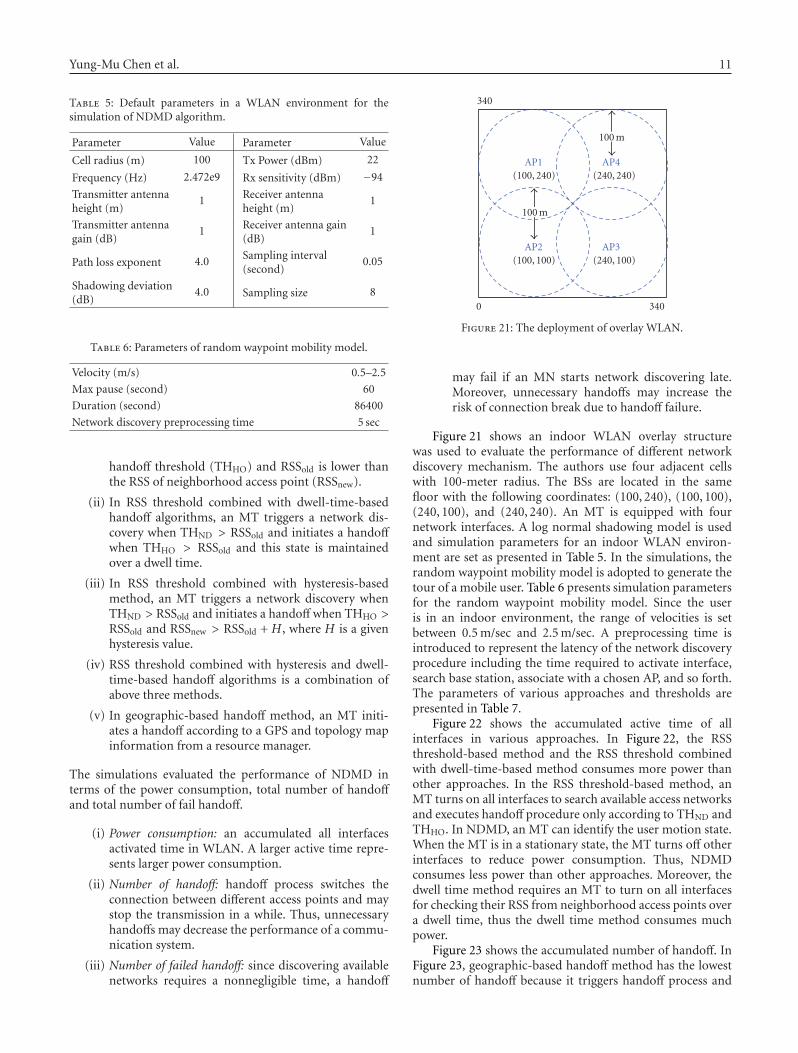
Table 5: Default parameters in a WLAN environment for thesimulation of NDMD algorithm.
Parameter Value Parameter Value
Cell radius (m) 100 Tx Power (dBm) 22
Frequency (Hz) 2.472e9 Rx sensitivity (dBm) −94
Transmitter antennaheight (m)
1 Receiver antennaheight (m)
1
Transmitter antennagain (dB)
1 Receiver antenna gain(dB)
1
Path loss exponent 4.0 Sampling interval(second)
0.05
Shadowing deviation(dB)
4.0 Sampling size 8
Table 6: Parameters of random waypoint mobility model.
Velocity (m/s) 0.5–2.5
Max pause (second) 60
Duration (second) 86400
Network discovery preprocessing time 5 sec
handoff threshold (THHO) and RSSold is lower thanthe RSS of neighborhood access point (RSSnew).
(ii) In RSS threshold combined with dwell-time-basedhandoff algorithms, an MT triggers a network dis-covery when THND > RSSold and initiates a handoffwhen THHO > RSSold and this state is maintainedover a dwell time.
(iii) In RSS threshold combined with hysteresis-basedmethod, an MT triggers a network discovery whenTHND > RSSold and initiates a handoff when THHO >RSSold and RSSnew > RSSold + H , where H is a givenhysteresis value.
(iv) RSS threshold combined with hysteresis and dwell-time-based handoff algorithms is a combination ofabove three methods.
(v) In geographic-based handoff method, an MT initi-ates a handoff according to a GPS and topology mapinformation from a resource manager.
The simulations evaluated the performance of NDMD interms of the power consumption, total number of handoffand total number of fail handoff.
(i) Power consumption: an accumulated all interfacesactivated time in WLAN. A larger active time repre-sents larger power consumption.
(ii) Number of handoff: handoff process switches theconnection between different access points and maystop the transmission in a while. Thus, unnecessaryhandoffs may decrease the performance of a commu-nication system.
(iii) Number of failed handoff: since discovering availablenetworks requires a nonnegligible time, a handoff
AP1(100, 240)
0 340
340
AP2(100, 100)
AP3(240, 100)
AP4(240, 240)
100 m
100 m
Figure 21: The deployment of overlay WLAN.
may fail if an MN starts network discovering late.Moreover, unnecessary handoffs may increase therisk of connection break due to handoff failure.
Figure 21 shows an indoor WLAN overlay structurewas used to evaluate the performance of different networkdiscovery mechanism. The authors use four adjacent cellswith 100-meter radius. The BSs are located in the samefloor with the following coordinates: (100, 240), (100, 100),(240, 100), and (240, 240). An MT is equipped with fournetwork interfaces. A log normal shadowing model is usedand simulation parameters for an indoor WLAN environ-ment are set as presented in Table 5. In the simulations, therandom waypoint mobility model is adopted to generate thetour of a mobile user. Table 6 presents simulation parametersfor the random waypoint mobility model. Since the useris in an indoor environment, the range of velocities is setbetween 0.5 m/sec and 2.5 m/sec. A preprocessing time isintroduced to represent the latency of the network discoveryprocedure including the time required to activate interface,search base station, associate with a chosen AP, and so forth.The parameters of various approaches and thresholds arepresented in Table 7.
Figure 22 shows the accumulated active time of allinterfaces in various approaches. In Figure 22, the RSSthreshold-based method and the RSS threshold combinedwith dwell-time-based method consumes more power thanother approaches. In the RSS threshold-based method, anMT turns on all interfaces to search available access networksand executes handoff procedure only according to THND andTHHO. In NDMD, an MT can identify the user motion state.When the MT is in a stationary state, the MT turns off otherinterfaces to reduce power consumption. Thus, NDMDconsumes less power than other approaches. Moreover, thedwell time method requires an MT to turn on all interfacesfor checking their RSS from neighborhood access points overa dwell time, thus the dwell time method consumes muchpower.
Figure 23 shows the accumulated number of handoff. InFigure 23, geographic-based handoff method has the lowestnumber of handoff because it triggers handoff process and
12 EURASIP Journal on Wireless Communications and Networking
Table 7: Parameters for different handoff mechanisms.
Method NDMD NDMD T T T + D T + D T + H + D T + H + D T + H T + H Geographic-based
α 0.15 0.15 None None None None None None None None None
k 5.5 5.5 None None None None None None None None None
THN (dBm) −1 −1 None None None None None None None None None
THP (dBm) 1 1 None None None None None None None None None
Hysteresis (dBm) None None None None None None 10 10 10 10 None
THND (dBm) −87 −92 −87 −92 −87 −92 −87 −92 −87 −92 None
THHO (dBm) −87 −92 −87 −92 −87 −92 −87 −92 −87 −92 None
THDwell (sec) None None None None 4 4 4 4 None None None
T: Threshold/D: Dwell-time/H: Hysteresis.
0 2 4 6 8 10 12 14 16 18 20 22 24
MN actived time in WLAN (hour)
0
2
4
6
8
10
12
14
16
18
Acc
um
ula
ted
alli
nte
rfac
esac
tiva
ted
tim
ein
WL
AN
(hou
r)
NDMD, α = 0.15, k = 5.5, ND threshold −87 dBmNDMD, α = 0.15, k = 5.5, ND threshold −92 dBmThreshold −87 dBmThreshold −92 dBmThreshold −87 dBm + dwell time 4 sThreshold −92 dBm + dwell time 4 sThreshold −87 dBm + hysteresis 10 dBm + Dwell time 4 sThreshold −92 dBm + hysteresis 10 dBm + Dwell time 4 sThreshold −87 dBm + hysteresis 10 dBmThreshold −92 dBm + hysteresis 10 dBm
Figure 22: Accumulated active time of all interfaces in WLAN.
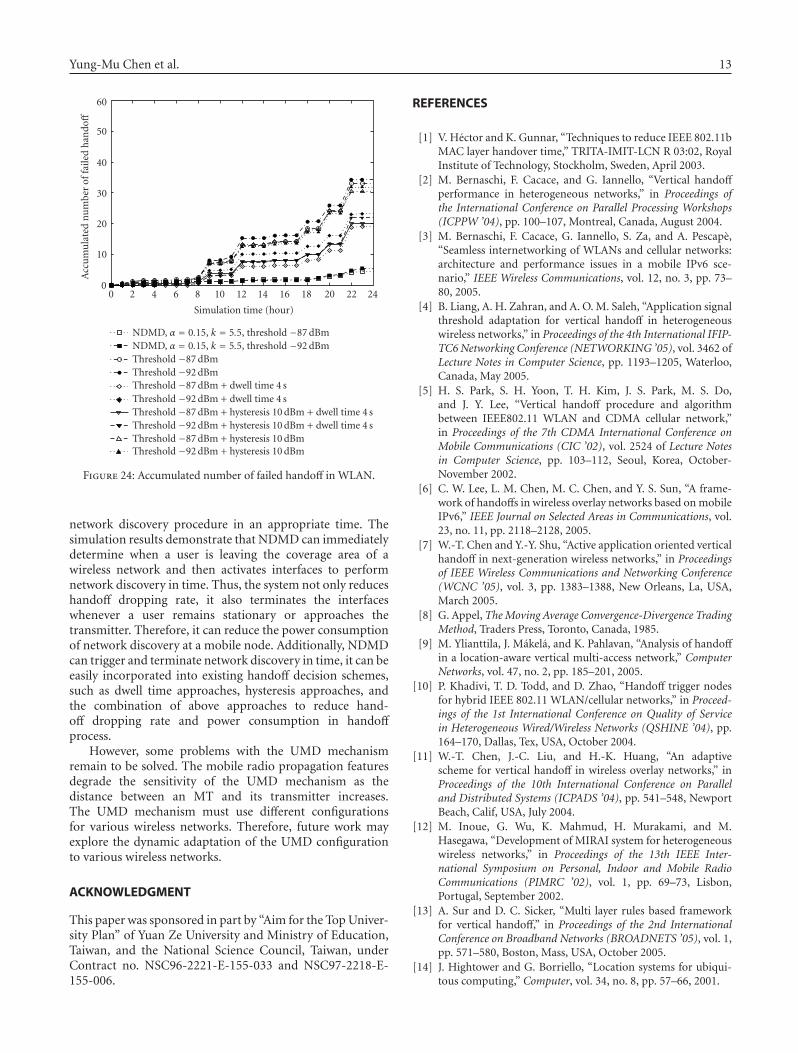
switches MT’s connection to a new AP according to MT’slocation information from a GPS and a location server(resource manager server). Since NDMD can identify usermotion of an MT, NDMD can reduce unnecessary handoffs.On the other hand, the RSS threshold based algorithmshas the largest number of handoff due to an MT alwaystriggers network discovery and handoff when the MT is ina stationary state. Moreover, the dwell time method limitsthe handoff trigger by a time constraint during the networkdiscovery, thus the MT triggers handoff late and reducesunnecessary handoffs. Nevertheless, both RSS thresholdbased method, RSS threshold combined with dwell timebased method, RSS threshold combined with hysteresis basedmethod, and RSS threshold combined with hysteresis anddwell time based method cause larger number of unnecessaryhandoffs. Figure 24 shows the accumulated number of failed
0 2 4 6 8 10 12 14 16 18 20 22 24
Simulation time (hour)
0
1000
2000
3000
4000
5000
6000
7000
Acc
um
ula
ted
nu
mbe
rof
han
doff
NDMD, α = 0.15, k = 5.5, threshold −87 dBmNDMD, α = 0.15, k = 5.5, threshold −92 dBmThreshold −87 dBmThreshold −92 dBmThreshold −87 dBm + dwell time 4 sThreshold −92 dBm + dwell time 4 sThreshold −87 dBm + hysteresis 10 dBm + dwell time 4 sThreshold −92 dBm + hysteresis 10 dBm + dwell time 4 s
Threshold −87 dBm + hysteresis 10 dBmThreshold −92 dBm + hysteresis 10 dBmGeographic-based, minimum number of necessary handoff
Figure 23: Accumulated number of handoff in WLAN.
handoff in WLAN. In Figure 24, NDMD performs betterthan other algorithms because NDMD can determines usermotion, activates and terminates MT’s interfaces rapidlyenough to reduce unnecessary handoffs.
5. CONCLUSION AND FUTUREWORK
This work presents MACD-based user motion detectionmechanism (UMD) and a predictive algorithm calledNDMD for network discovery in heterogeneous wireless net-work environments. Without any assistance from a position-ing system, UMD can identify the user’s behavior correctly.The NDMD determines when a user leaves, approaches orremains stationary with respect to its associated access pointby UMD and then initiates or terminates the corresponding
Yung-Mu Chen et al. 13
0 2 4 6 8 10 12 14 16 18 20 22 24
Simulation time (hour)
0
10
20
30
40
50
60
Acc
um
ula
ted
nu
mbe
rof
faile
dh
ando
ff
NDMD, α = 0.15, k = 5.5, threshold −87 dBmNDMD, α = 0.15, k = 5.5, threshold −92 dBmThreshold −87 dBmThreshold −92 dBmThreshold −87 dBm + dwell time 4 sThreshold −92 dBm + dwell time 4 sThreshold −87 dBm + hysteresis 10 dBm + dwell time 4 sThreshold −92 dBm + hysteresis 10 dBm + dwell time 4 sThreshold −87 dBm + hysteresis 10 dBmThreshold −92 dBm + hysteresis 10 dBm
Figure 24: Accumulated number of failed handoff in WLAN.
network discovery procedure in an appropriate time. Thesimulation results demonstrate that NDMD can immediatelydetermine when a user is leaving the coverage area of awireless network and then activates interfaces to performnetwork discovery in time. Thus, the system not only reduceshandoff dropping rate, it also terminates the interfaceswhenever a user remains stationary or approaches thetransmitter. Therefore, it can reduce the power consumptionof network discovery at a mobile node. Additionally, NDMDcan trigger and terminate network discovery in time, it can beeasily incorporated into existing handoff decision schemes,such as dwell time approaches, hysteresis approaches, andthe combination of above approaches to reduce hand-off dropping rate and power consumption in handoffprocess.
However, some problems with the UMD mechanismremain to be solved. The mobile radio propagation featuresdegrade the sensitivity of the UMD mechanism as thedistance between an MT and its transmitter increases.The UMD mechanism must use different configurationsfor various wireless networks. Therefore, future work mayexplore the dynamic adaptation of the UMD configurationto various wireless networks.
ACKNOWLEDGMENT
This paper was sponsored in part by “Aim for the Top Univer-sity Plan” of Yuan Ze University and Ministry of Education,Taiwan, and the National Science Council, Taiwan, underContract no. NSC96-2221-E-155-033 and NSC97-2218-E-155-006.
REFERENCES
[1] V. Hector and K. Gunnar, “Techniques to reduce IEEE 802.11bMAC layer handover time,” TRITA-IMIT-LCN R 03:02, RoyalInstitute of Technology, Stockholm, Sweden, April 2003.
[2] M. Bernaschi, F. Cacace, and G. Iannello, “Vertical handoffperformance in heterogeneous networks,” in Proceedings ofthe International Conference on Parallel Processing Workshops(ICPPW ’04), pp. 100–107, Montreal, Canada, August 2004.
[3] M. Bernaschi, F. Cacace, G. Iannello, S. Za, and A. Pescape,“Seamless internetworking of WLANs and cellular networks:architecture and performance issues in a mobile IPv6 sce-nario,” IEEE Wireless Communications, vol. 12, no. 3, pp. 73–80, 2005.
[4] B. Liang, A. H. Zahran, and A. O. M. Saleh, “Application signalthreshold adaptation for vertical handoff in heterogeneouswireless networks,” in Proceedings of the 4th International IFIP-TC6 Networking Conference (NETWORKING ’05), vol. 3462 ofLecture Notes in Computer Science, pp. 1193–1205, Waterloo,Canada, May 2005.
[5] H. S. Park, S. H. Yoon, T. H. Kim, J. S. Park, M. S. Do,and J. Y. Lee, “Vertical handoff procedure and algorithmbetween IEEE802.11 WLAN and CDMA cellular network,”in Proceedings of the 7th CDMA International Conference onMobile Communications (CIC ’02), vol. 2524 of Lecture Notesin Computer Science, pp. 103–112, Seoul, Korea, October-November 2002.
[6] C. W. Lee, L. M. Chen, M. C. Chen, and Y. S. Sun, “A frame-work of handoffs in wireless overlay networks based on mobileIPv6,” IEEE Journal on Selected Areas in Communications, vol.23, no. 11, pp. 2118–2128, 2005.
[7] W.-T. Chen and Y.-Y. Shu, “Active application oriented verticalhandoff in next-generation wireless networks,” in Proceedingsof IEEE Wireless Communications and Networking Conference(WCNC ’05), vol. 3, pp. 1383–1388, New Orleans, La, USA,March 2005.
[8] G. Appel, TheMoving Average Convergence-Divergence TradingMethod, Traders Press, Toronto, Canada, 1985.
[9] M. Ylianttila, J. Makela, and K. Pahlavan, “Analysis of handoffin a location-aware vertical multi-access network,” ComputerNetworks, vol. 47, no. 2, pp. 185–201, 2005.
[10] P. Khadivi, T. D. Todd, and D. Zhao, “Handoff trigger nodesfor hybrid IEEE 802.11 WLAN/cellular networks,” in Proceed-ings of the 1st International Conference on Quality of Servicein Heterogeneous Wired/Wireless Networks (QSHINE ’04), pp.164–170, Dallas, Tex, USA, October 2004.
[11] W.-T. Chen, J.-C. Liu, and H.-K. Huang, “An adaptivescheme for vertical handoff in wireless overlay networks,” inProceedings of the 10th International Conference on Paralleland Distributed Systems (ICPADS ’04), pp. 541–548, NewportBeach, Calif, USA, July 2004.
[12] M. Inoue, G. Wu, K. Mahmud, H. Murakami, and M.Hasegawa, “Development of MIRAI system for heterogeneouswireless networks,” in Proceedings of the 13th IEEE Inter-national Symposium on Personal, Indoor and Mobile RadioCommunications (PIMRC ’02), vol. 1, pp. 69–73, Lisbon,Portugal, September 2002.
[13] A. Sur and D. C. Sicker, “Multi layer rules based frameworkfor vertical handoff,” in Proceedings of the 2nd InternationalConference on Broadband Networks (BROADNETS ’05), vol. 1,pp. 571–580, Boston, Mass, USA, October 2005.
[14] J. Hightower and G. Borriello, “Location systems for ubiqui-tous computing,” Computer, vol. 34, no. 8, pp. 57–66, 2001.
14 EURASIP Journal on Wireless Communications and Networking
[15] ETSI, GSM Technical Specification, GSM 08.08, version 5.12.0ed., France, June 2000.
[16] S. Shirvani Moghaddam, V. Tabataba Vakili, and A. Falahati,“New handoff initiation algorithm (optimum combination ofhysteresis and threshold based methods),” in Proceedings of the52nd IEEE Vehicular Technology Conference (VTC ’00), vol. 4,pp. 1567–1574, Boston, Mass, USA, September 2000.
[17] J. McNair and F. Zhu, “Vertical handoffs in fourth-generationmultinetwork environments,” IEEE Wireless Communications,vol. 11, no. 3, pp. 8–15, 2004.
[18] F. Zhu and J. McNair, “Optimizations for vertical handoffdecision algorithms,” in Proceedings of IEEE Wireless Commu-nications and Networking Conference (WCNC ’04), vol. 2, pp.867–872, Atlanta, Ga, USA, March 2004.
[19] A. Hasswa, N. Nasser, and H. Hassanein, “Generic verticalhandoff decision function for heterogeneous wireless net-works,” in Proceedings of International Conference on Wirelessand Optical Communications Networks (WOCN ’05), pp. 239–243, Dubai, United Arab Emirates, March 2005.
[20] T. Al-Gizawi, K. Peppas, D. I. Axiotis, E. N. Protonotarios, andF. Lazarakis, “Interoperability criteria, mechanisms, and eval-uation of system performance for transparently interoperatingWLAN and UMTS-HSDPA networks,” IEEE Network, vol. 19,no. 4, pp. 66–72, 2005.
[21] The Network Simulator - ns-2, http://www.isi.edu/nsnam/ns/.[22] “BonnMotion: a mobility scenario generation and analy-
sis tool,” http://web.informatik.uni-bonn.de/IV/Mitarbeiter/dewaal/BonnMotion/.
[23] X. Wu and A. L. Ananda, “Link characteristics estimation forIEEE 802.11 DCF based WLAN,” in Proceedings of the 29thAnnual IEEE International Conference on Local Computer Net-works (LCN ’04), pp. 302–309, Tampa, Fla, USA, November2004.
[24] Airspan Corporation, http://www.airspan.com/.