Embed Size (px)
Citation preview
Machine Learning for Biological Data Mining
장 병 탁서울대 컴퓨터공학부
And
Modified by
Kim Hye Jin
포항공과대학교 컴퓨터공학과 IM
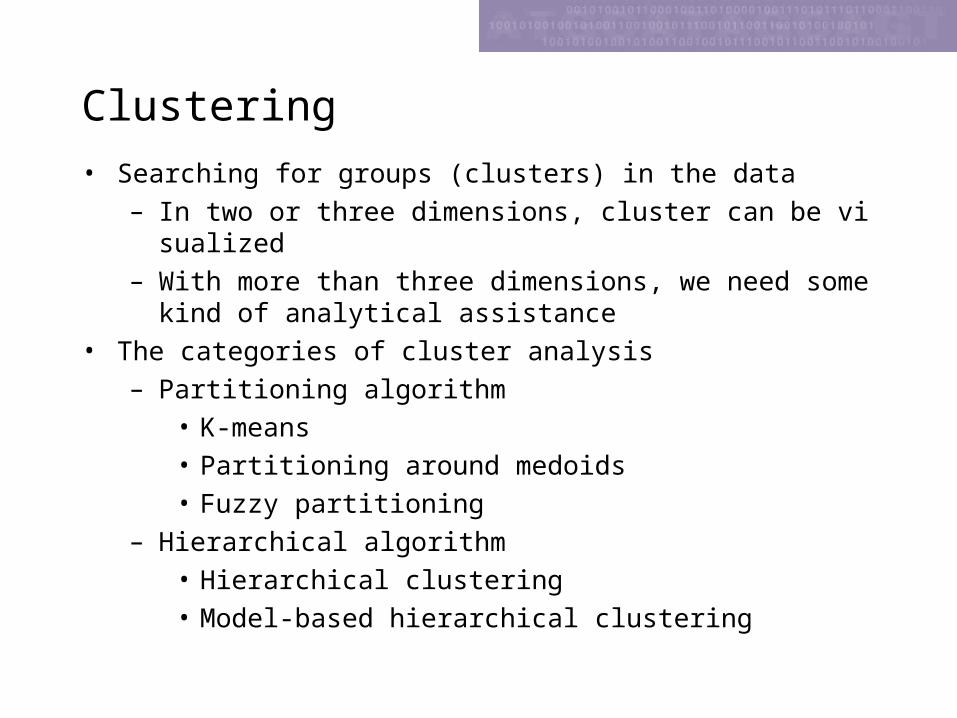
Clustering
• Searching for groups (clusters) in the data– In two or three dimensions, cluster can be visualized– With more than three dimensions, we need some kind of an
alytical assistance• The categories of cluster analysis
– Partitioning algorithm• K-means• Partitioning around medoids• Fuzzy partitioning
– Hierarchical algorithm• Hierarchical clustering• Model-based hierarchical clustering

An example of partitioning algorithm- K-means Clustering
Cluster 의 수(k) 가 정해지면 k 개의 initial seeds 를 선정한다 .
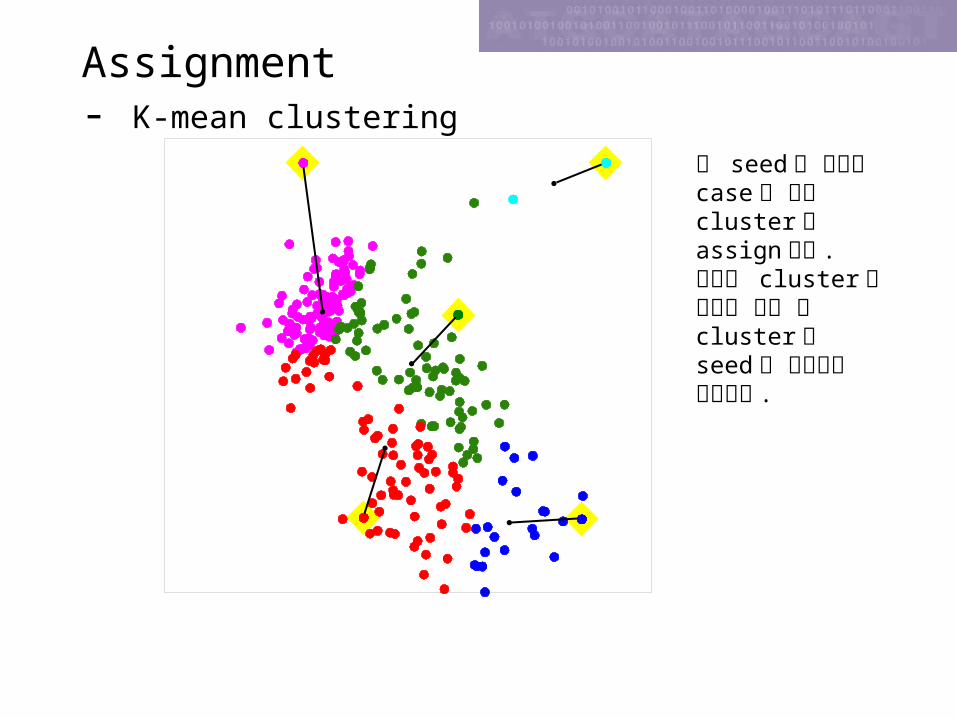
Assignment- K-mean clustering
각 seed 에 근접한 case 에 해당 cluster 를 assign한다 .그리고 cluster 의 평균을 구한 후 cluster 의 seed 를 평균으로 이동한다 .
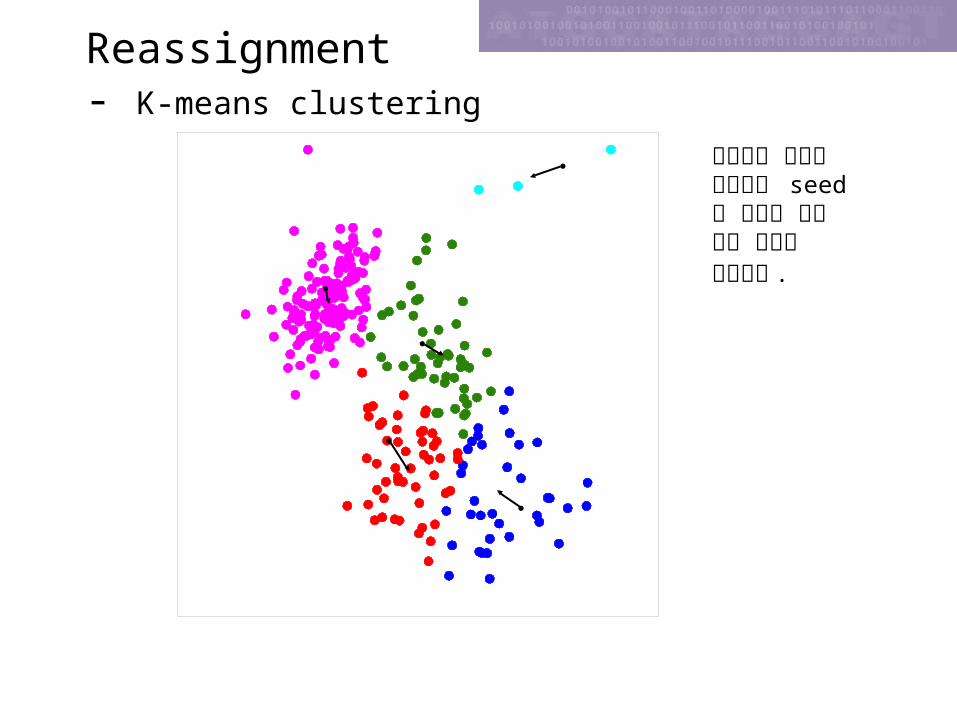
Reassignment- K-means clustering
앞에서의 과정을 반복하여 seed 의 이동이 아주 작을 때까지 계속한다 .
Hierarchical algorithm
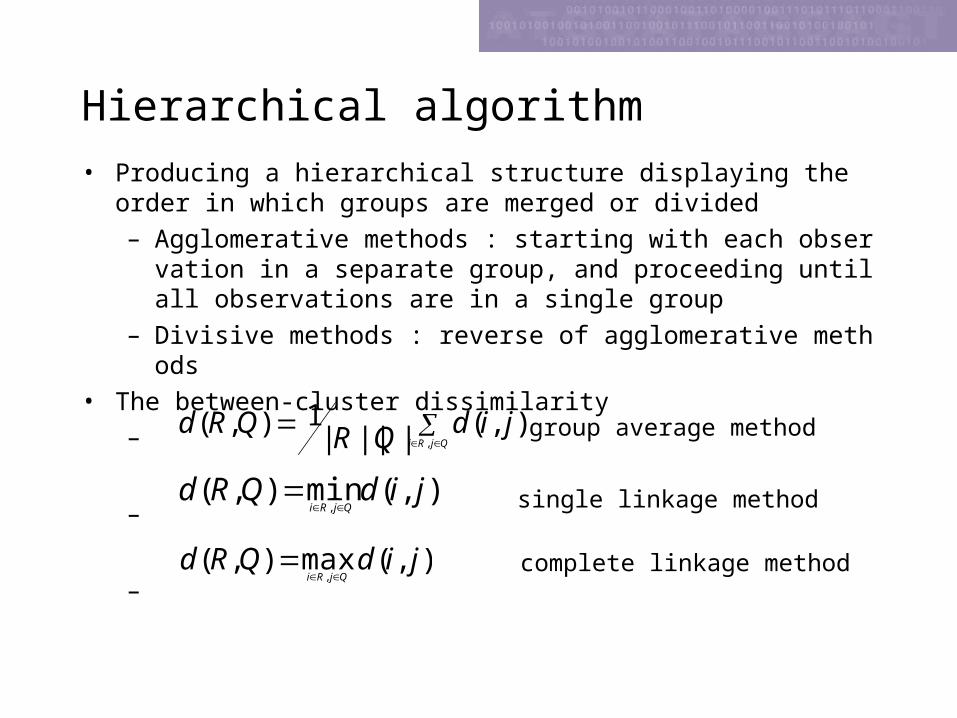
• Producing a hierarchical structure displaying the order in which groups are merged or divided– Agglomerative methods : starting with each observation in a
separate group, and proceeding until all observations are in a single group
– Divisive methods : reverse of agglomerative methods• The between-cluster dissimilarity
–
–
–
QjRi
jidQRQRd,
),(||||1),(
),(min),(,
jidQRdQjRi
),(max),(,
jidQRdQjRi
group average method
single linkage method
complete linkage method
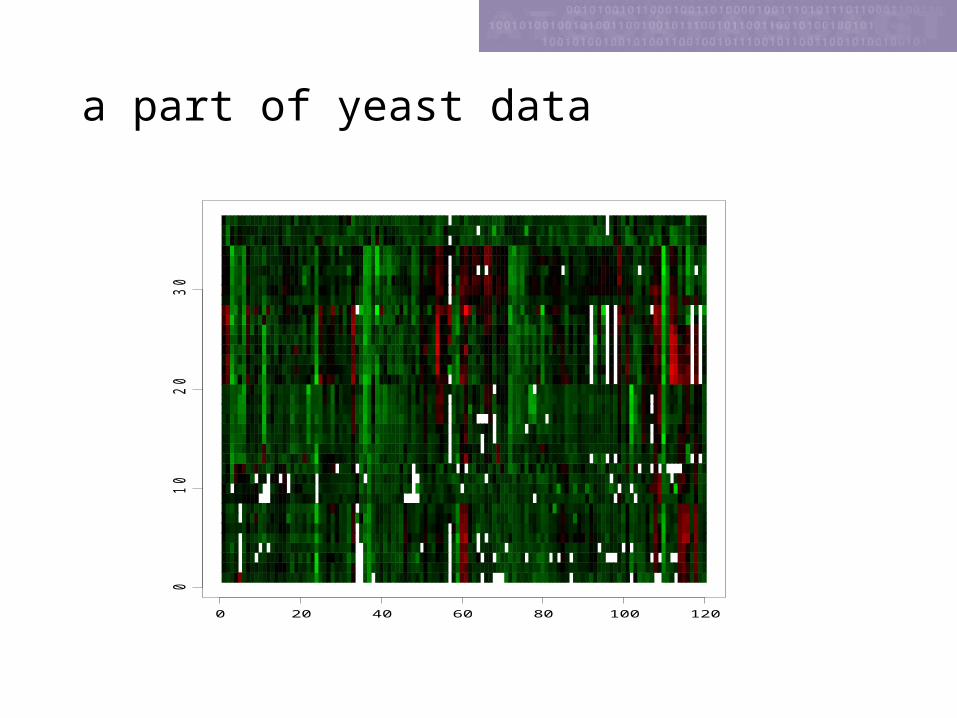
a part of yeast data
0 20 40 60 80 100 120
01
02
03
0
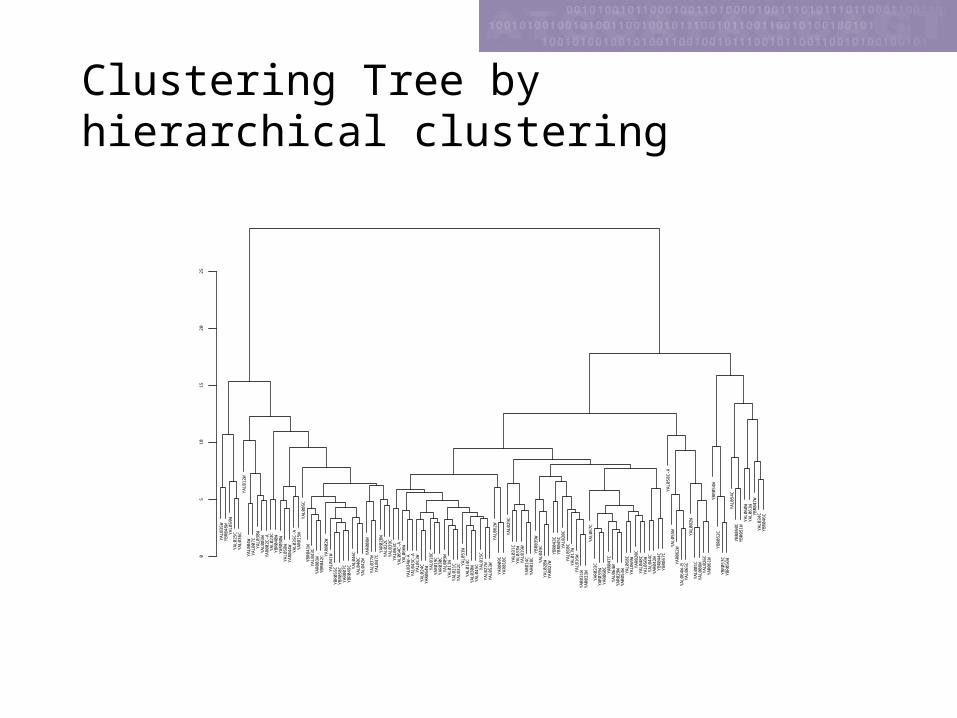
Clustering Tree by hierarchical clustering
YA
L0
01
CY
AL
00
2W
YA
L0
03
W
YA
L0
04
W
YA
L0
05
C
YA
L0
07
C
YA
L0
08
W
YA
L0
09
W
YA
L0
10
C
YA
L0
11W
YA
L0
12
W
YA
L0
13
W
YA
L0
14
C
YA
L0
15
C
YA
L0
16
WY
AL
01
7W
YA
L0
18
C
YA
L0
19
W YA
L0
20
C
YA
L0
21
C
YA
L0
22
C
YA
L0
23
C
YA
L0
24
C
YA
L0
25
C
YA
L0
26
C
YA
L0
27
W
YA
L0
28
W
YA
L0
29
C
YA
L0
30
W
YA
L0
31
C
YA
L0
32
C YA
L0
33
W
YA
L0
34
C
YA
L0
34
W-A
YA
L0
35
C-A
YA
L0
35
W
YA
L0
36
C
YA
L0
37
W
YA
L0
38
W
YA
L0
39
C
YA
L0
40
C
YA
L0
41
W
YA
L0
42
W
YA
L0
43
C
YA
L0
43
C-A
YA
L0
44
C
YA
L0
45
C
YA
L0
46
C
YA
L0
47
C
YA
L0
48
C
YA
L0
49
C
YA
L0
51
W
YA
L0
53
W
YA
L0
54
C
YA
L0
55
W
YA
L0
56
W
YA
L0
58
C-A
YA
L0
58
W
YA
L0
59
W
YA
L0
60
WY
AL
06
1W
YA
L0
62
W
YA
L0
63
CY
AL
06
4C
-A
YA
L0
64
W
YA
L0
64
W-B
YA
L0
65
CYA
L0
66
W
YA
L0
67
C
YA
L0
68
CY
AL
06
9WY
AR
00
2C
-A
YA
R0
02
W
YA
R0
03
W
YA
R0
07
C
YA
R0
08
W
YA
R0
09
CY
AR
01
0C
YA
R0
14
C
YA
R0
15
W
YA
R0
18
C
YA
R0
19
C
YA
R0
20
C
YA
R0
23
C
YA
R0
27
W
YA
R0
28
W
YA
R0
29
W
YA
R0
30
C
YA
R0
31
WY
AR
03
3W
YA
R0
35
W
YA
R0
42
W
YA
R0
44
W
YA
R0
47
C
YA
R0
50
W
YA
R0
53
W
YA
R0
60
C
YA
R0
61
W
YA
R0
62
W
YA
R0
64
W
YB
R0
39
W
YB
R0
40
W
YB
R0
41
W
YB
R0
42
C YB
R0
43
C
YB
R0
44
CYB
R0
45
C
YB
R0
46
CYB
R0
47
W
YB
R0
48
W
YB
R0
49
C
YB
R0
50
CY
BR
05
1W
YB
R0
52
CY
BR
05
3C
YB
R0
54
W
YB
R0
55
C
YB
R0
56
W
YB
R0
57
C
YB
R0
58
C
05
10
15
20
25
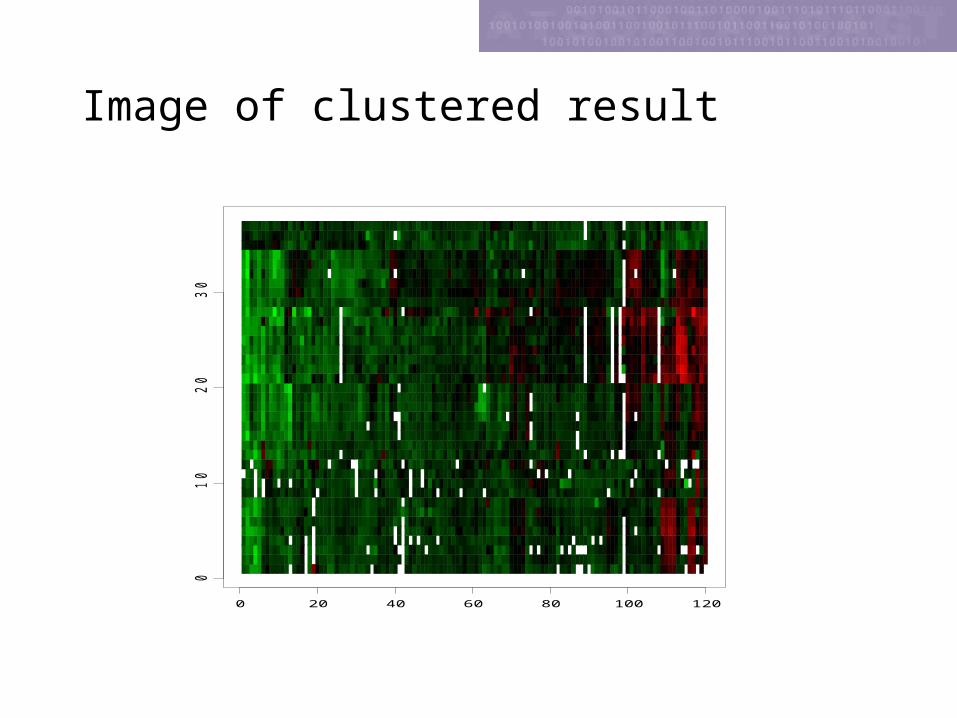
Image of clustered result
0 20 40 60 80 100 120
01
02
03
0
Questions
• Significant 한 cluster 와 개수는 ?
• 각 슬라이드가 다른 cell-line 으로 부터의 결과인 경우도 기존의
clustering 기법을 적용하여야 하는가 ?
• 즉 , 실험과 그 목적에 적합한 cluster analysis 는 ?
Gene ShavingBy Hastie, Tibshirani,… (2000)
Motivation and Details
• We favor subsets of genes that
– All behave in a similar manner (coherence)
– And all show large across the cell lines.
• Given an expression array, we seek a sequence of nested gene
clusters of size k. has the property that the variance of the
cluster mean is maximum over all clusters of size k.
kS kS
Gene Shaving Algorithm-1
• STEP 1. Start with the entire expression data X, each row
centered to have zero mean.
• STEP 2. Compute the leading principal component of the rows
of X.
• STEP 3. Shave off the proportion alpha (typically 10%) of the
rows having smallest inner-product with the leading principal
component.
• STEP 4. Repeat step 2 and 3 until only one gene remains.
Gene Shaving Algorithm-2
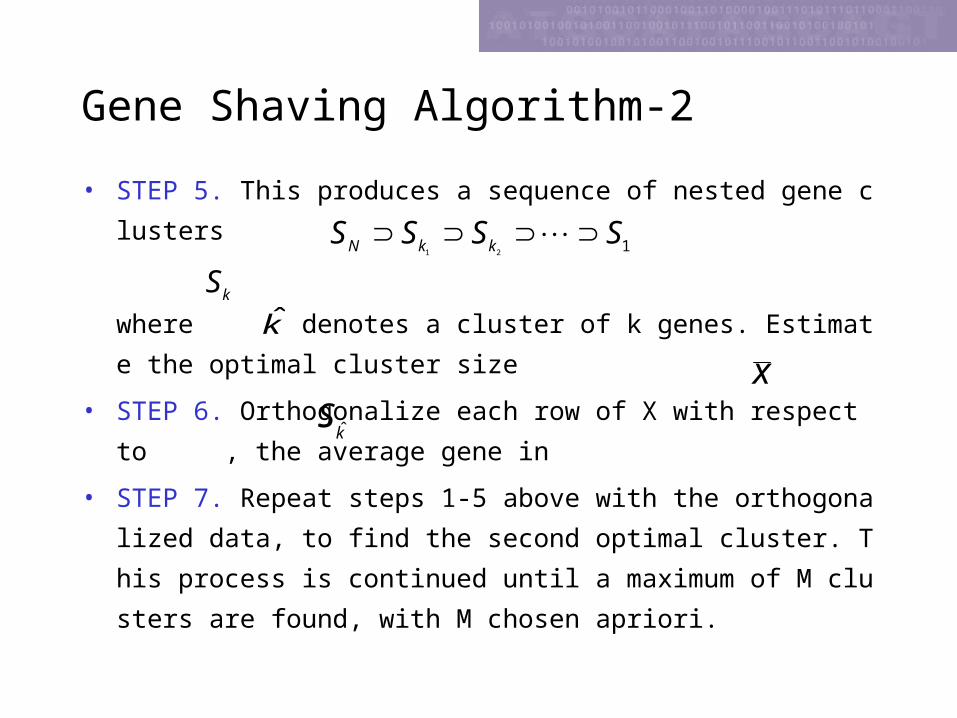
• STEP 5. This produces a sequence of nested gene clusters
where denotes a cluster of k genes. Estimate the optimal clu
ster size
• STEP 6. Orthogonalize each row of X with respect to , the av
erage gene in
• STEP 7. Repeat steps 1-5 above with the orthogonalized data, t
o find the second optimal cluster. This process is continued until
a maximum of M clusters are found, with M chosen apriori.
121
SSSS kkN
kS
xk̂
kS ˆ
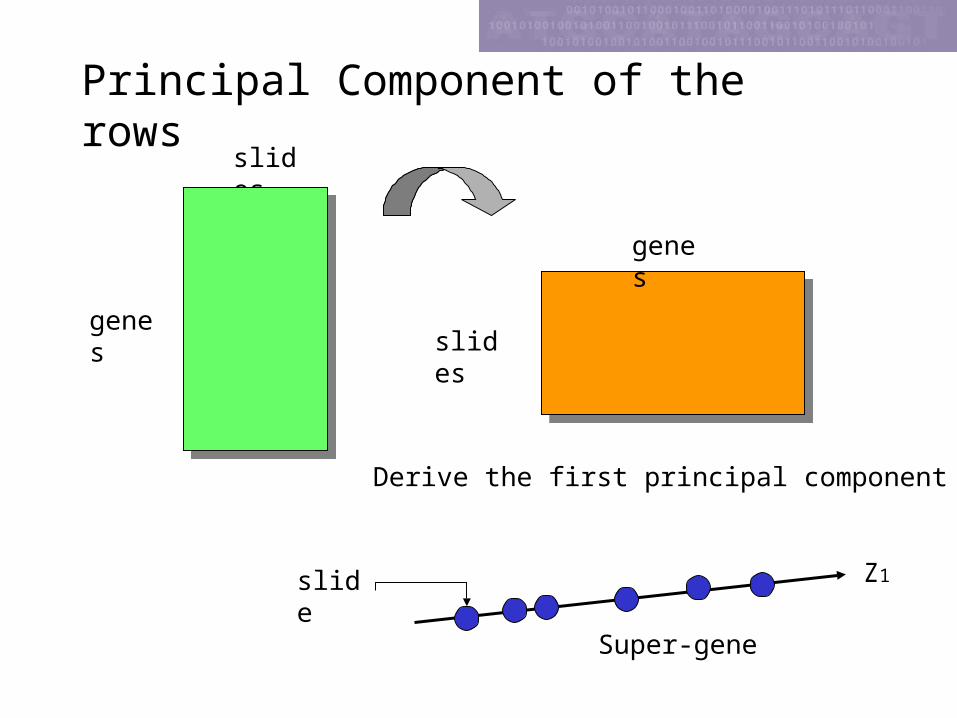
Principal Component of the rowsslides
genesslides
genes
Derive the first principal component Z1
Z1slide
Super-gene
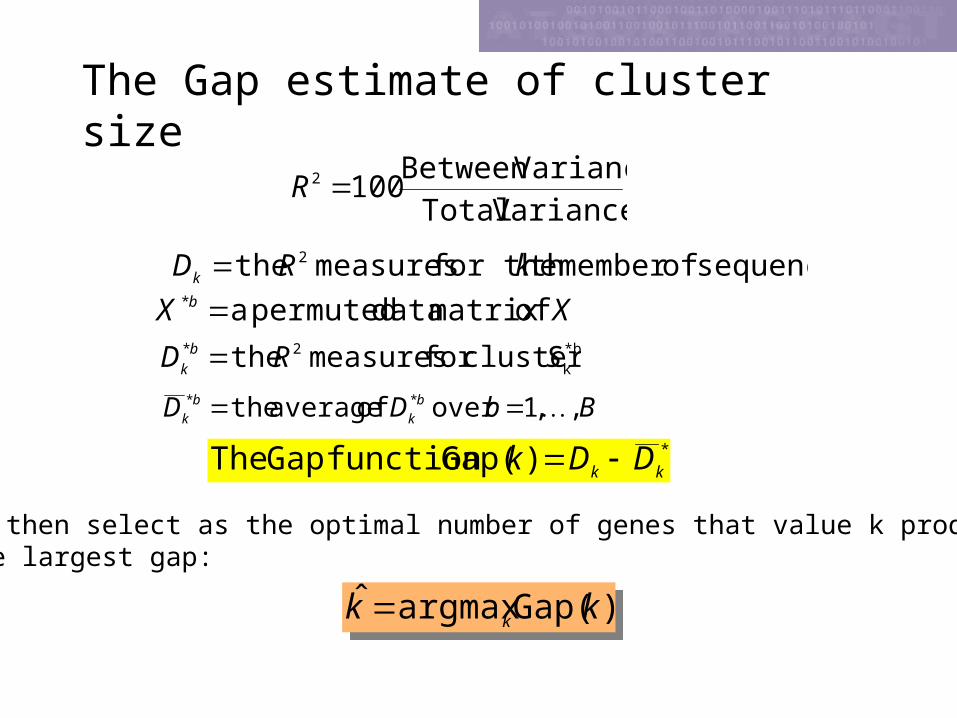
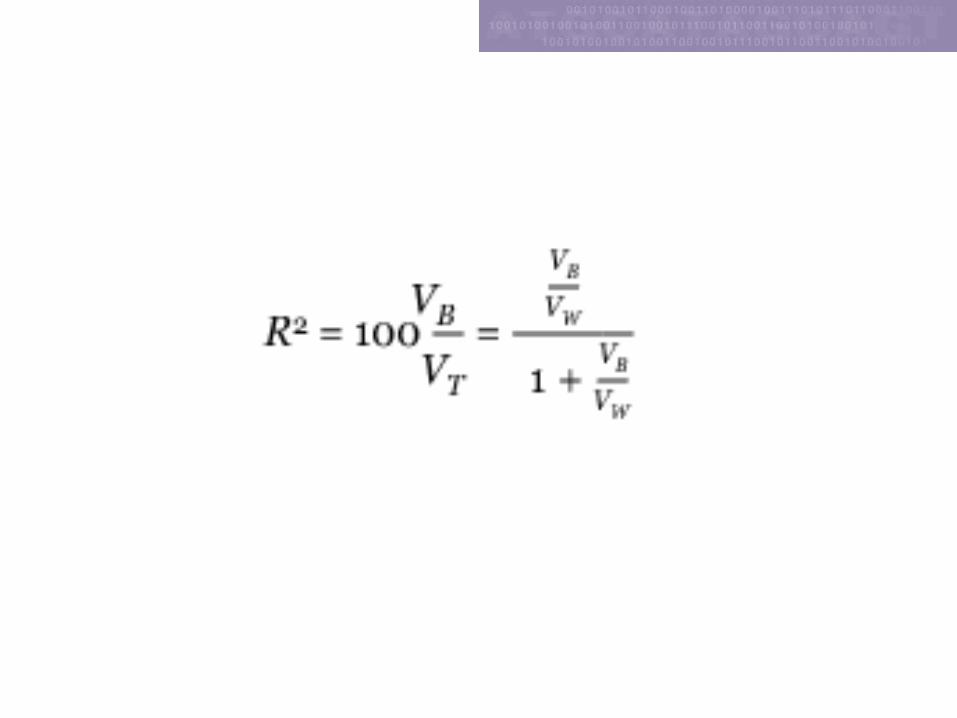
The Gap estimate of cluster size
Variance Total
VarianceBetween 1002 R
sequence ofmember th for the measures the 2 kRDk XX b ofmatrix data permuted a*
*b
k
2* cluster for measures the SRD b
k
BbDD b
k
b
k ,,1over of average the ** *)Gap(function Gap The kk DDk
We then select as the optimal number of genes that value k producingThe largest gap:
)Gap(argmaxˆ kk k )Gap(argmaxˆ kk k
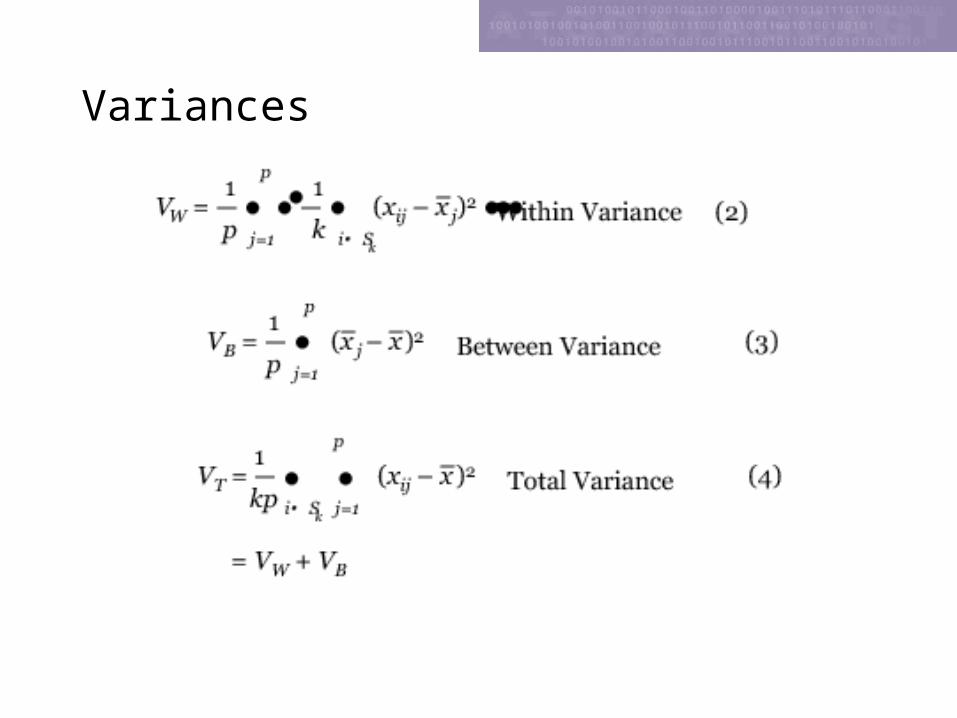
Variances
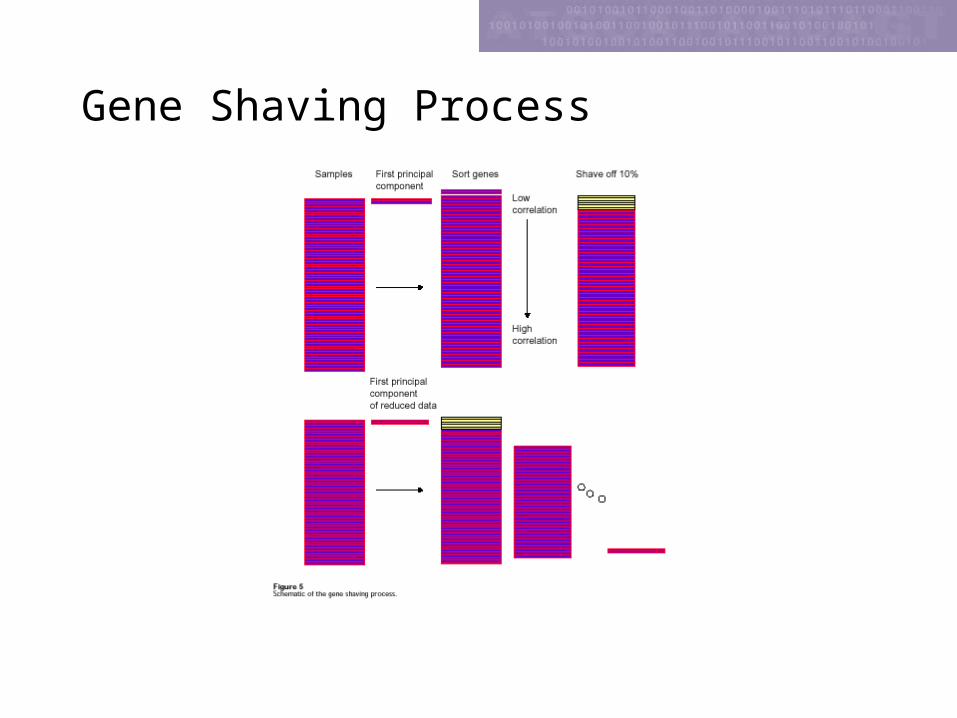
Gene Shaving Process

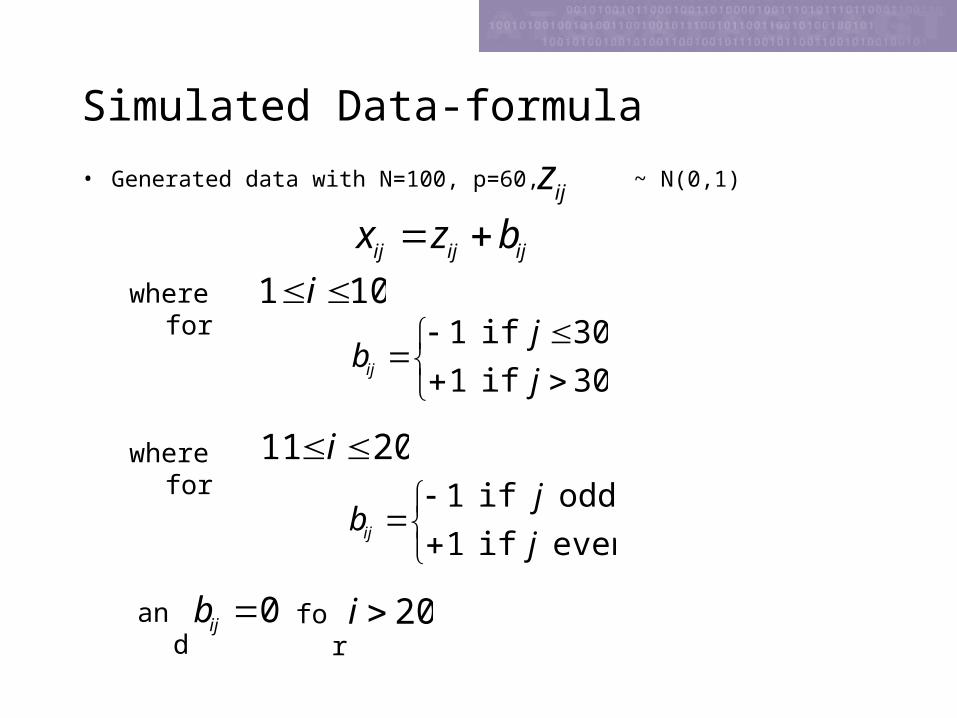
Simulated Data-formula
• Generated data with N=100, p=60, ~ N(0,1)ijz
ijijij bzx where for 101 i
30
30
if
if
1
1
j
jbij
where for 2011 i
even
odd
if
if
1
1
j
jbij
and 0ijb for 20i

Simulated Data-image
0 20 40 60 80 100
01
02
03
04
05
06
0
slidesp=60
genes, N=100
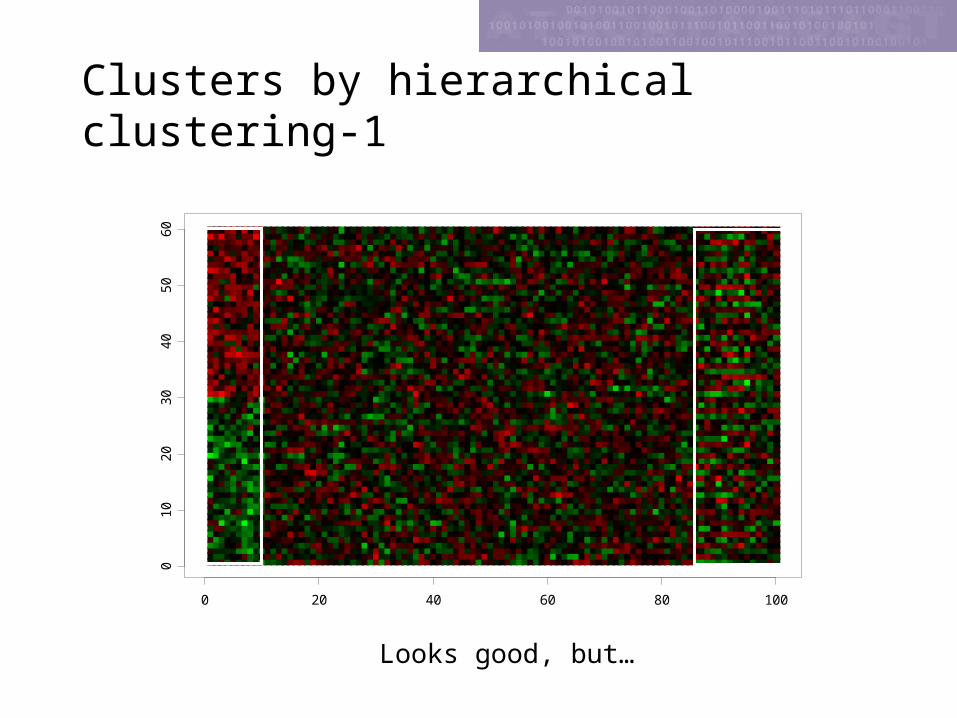
Clusters by hierarchical clustering-1
0 20 40 60 80 100
01
02
03
04
05
06
0
Looks good, but…
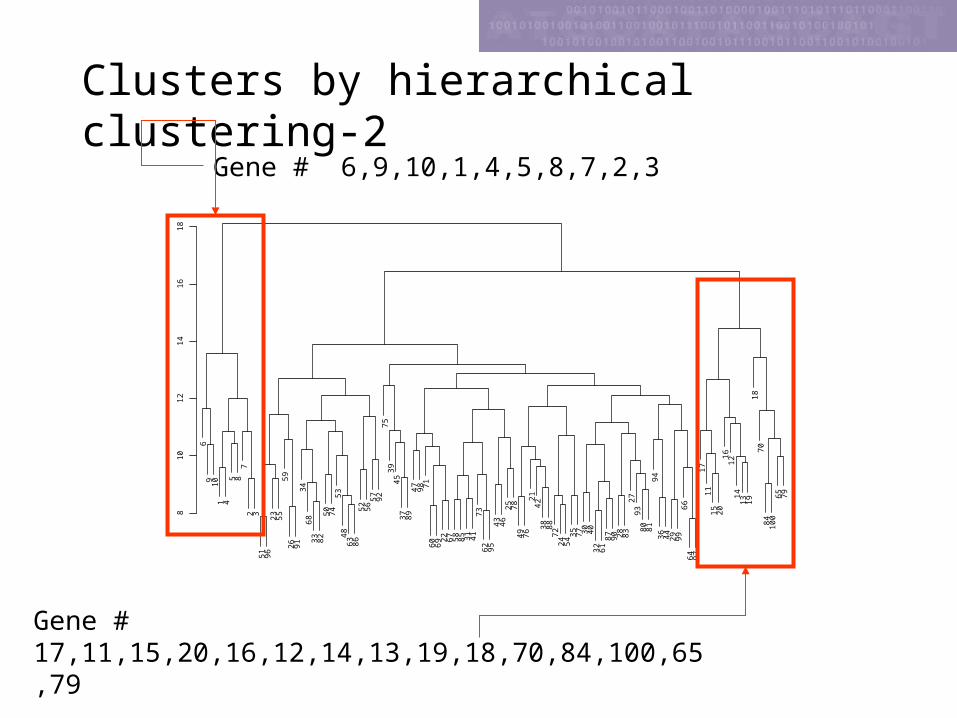
Clusters by hierarchical clustering-2
1
2 3
45
6
789 10
11
12
131
4
15
16
17
18
19
20
21
22
23
24
25
26
27
28
293
0
31
32
33
34
35
36
37
38
39
40
41
42
43
44
45
46
47
48
49
50
51
52
53
54
55 5
65
7
58
59
60
61626
3
64
65
66
67
68
69
70
71
72
7374
75
76 77
78
79
80
81
82 8
3
84
85
86 8
7
88
89
90
91
92
93
94
95
96
97
98
99
10
0
81
01
21
41
61
8Gene # 6,9,10,1,4,5,8,7,2,3
Gene # 17,11,15,20,16,12,14,13,19,18,70,84,100,65,79
Running Gene Shaving
• Alpha=0.1• B=20• No. Cluster M=4
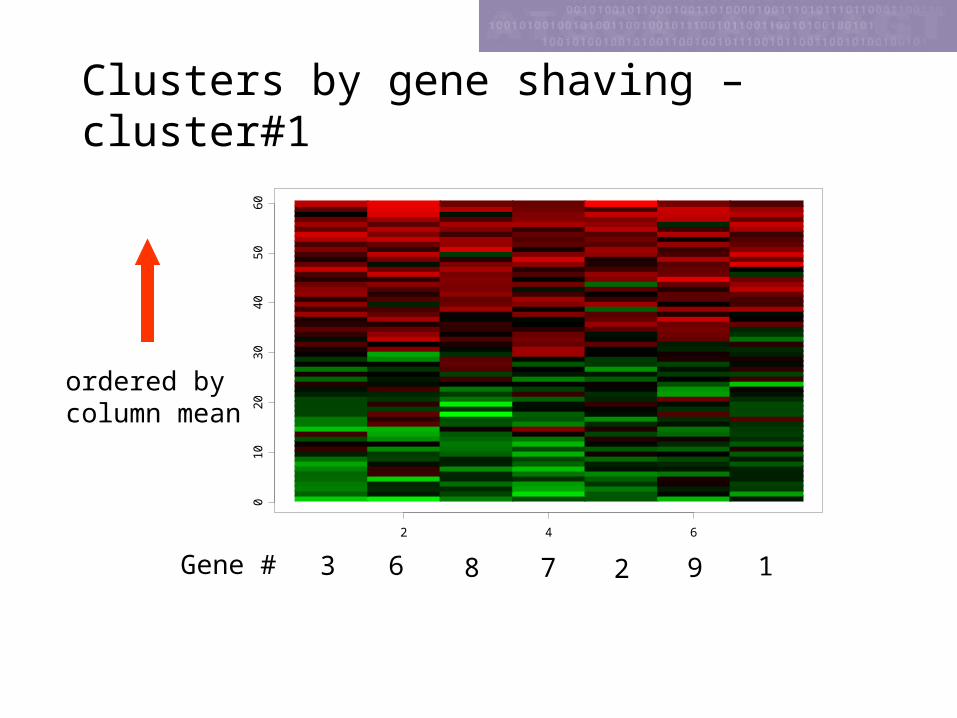
Clusters by gene shaving –cluster#1
2 4 6
01
02
03
04
05
06
0
3 6 8 2 9 17Gene #
ordered bycolumn mean

Clusters by gene shaving –cluster#2
2 4 6 8
01
02
03
04
05
06
0
ordered bycolumn mean
12 19 13 16 17 1418Gene # 11
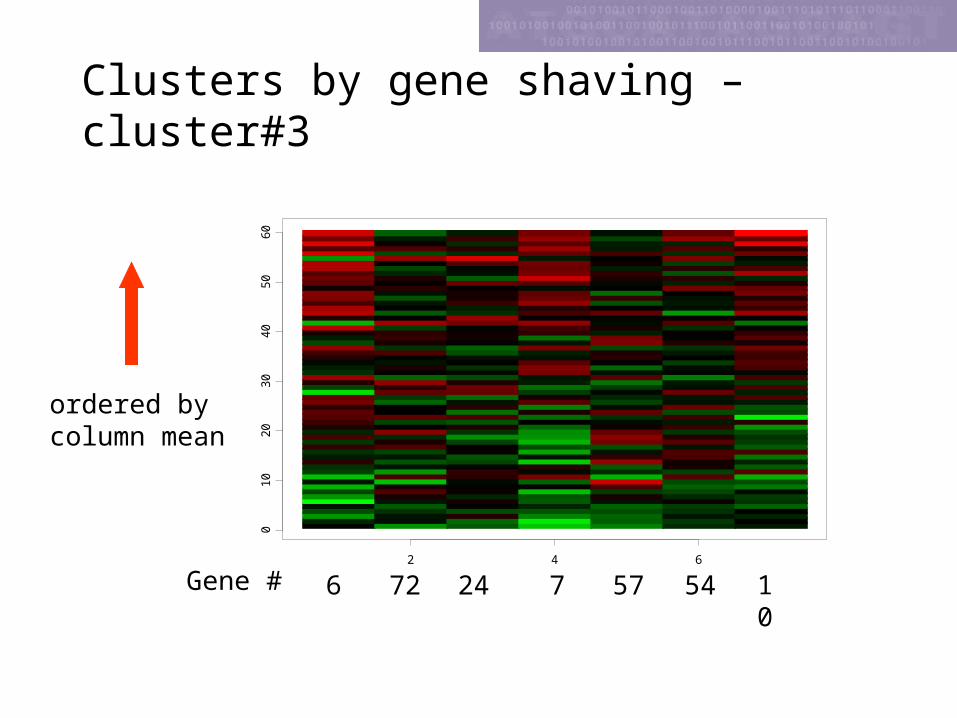
Clusters by gene shaving –cluster#3
2 4 6
01
02
03
04
05
06
0
ordered bycolumn mean
6 72 24 57 54 107Gene #
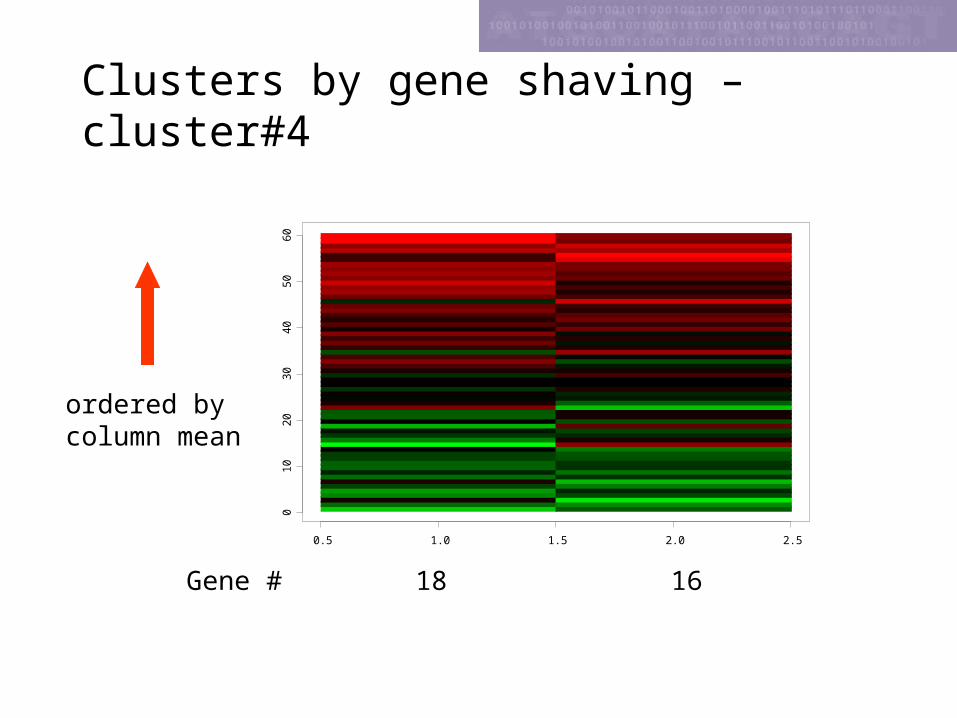
Clusters by gene shaving –cluster#4
0.5 1.0 1.5 2.0 2.5
01
02
03
04
05
06
0
ordered bycolumn mean
18 16Gene #
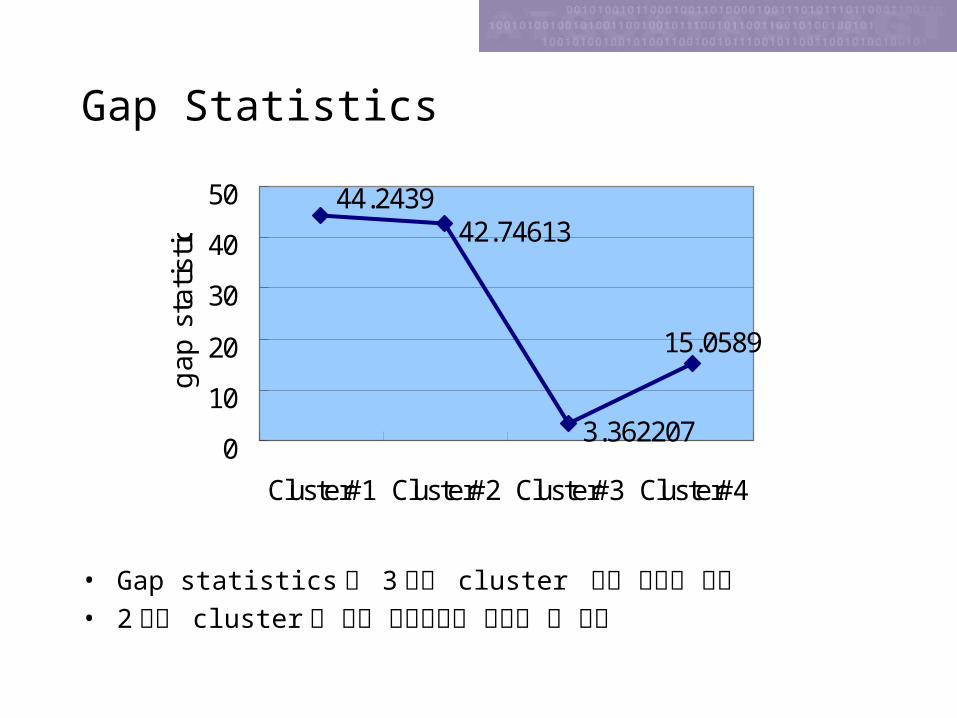
Gap Statistics
• Gap statistics 가 3 번째 cluster 부터 급격히 감소• 2 개의 cluster 가 가장 적절하다고 판단할 수 있음
42.74613
3.362207
44.2439
15.0589
0
10
20
30
40
50
Cluster#1 Cluster#2 Cluster#3 Cluster#4
gap
sta
tistic
s


![하나UBS 코스닥벤처기업 공모주증권투자신탁 주혼합 …...하나UBS 코스닥벤처기업&공모주증권투자신탁[주혼합 -파생형] 1 신 탁 계 약 서](https://img.pdfslide.tips/doc/110x75/5f13f7d3bcf0a00e15220504/eubs-eee-eeeoef-eubs.jpg)
![이스트스프링 미국 뱅크론 (H)[...1 이스트스프링 미국 뱅크론 특별자산자투자신탁(H)[대출채권-재간접형] 신 탁 계 약 서](https://img.pdfslide.tips/doc/110x75/5f38433f0a890142de0ae2a0/e-ee-ee-h-1-e-ee-ee.jpg)