Embed Size (px)
Citation preview
Mitigation Strategies of Reservoir
Sedimentation in China
Zhao-Yin WangProfessor, Tsinghua University
Vice president of IAHR and Chairman of the Division of Hydro-environment of IAHR
Chairman, Advisory Council of IRTCES
Editor “International Journal of Sediment Research”
Asso.Editor “Journal of Environmental Informatics”
Contents
1. Reservoir sedimentation
2. Soil erosion control and vegetation-
erosion dynamics
3. Methods of sediment removal
4. Lessons learnt from Sanmenxia
5. Conclusions
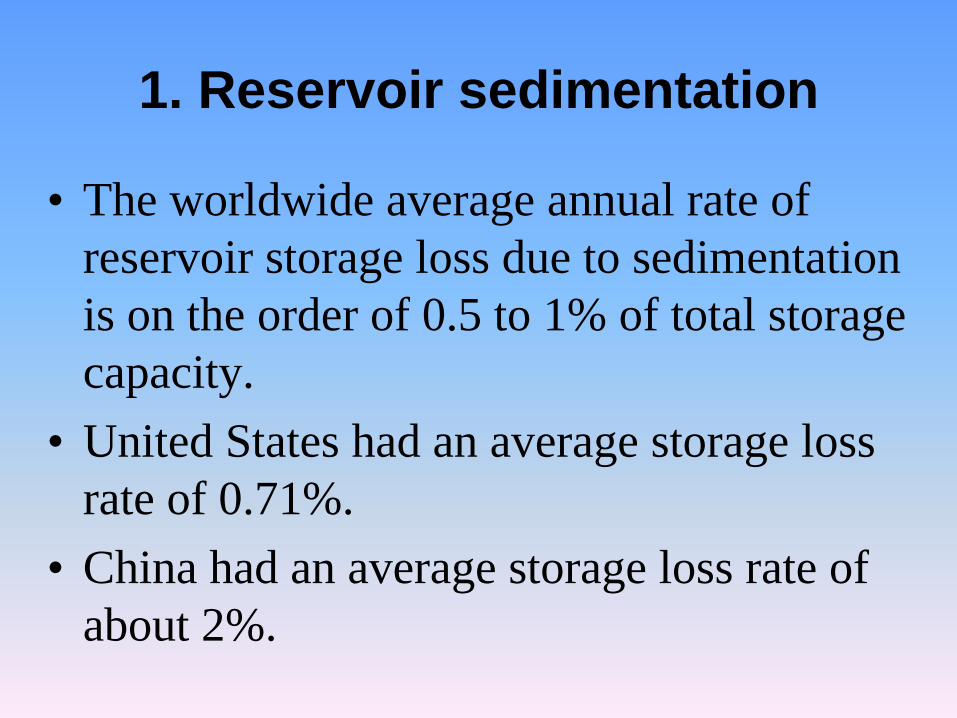
1. Reservoir sedimentation
• The worldwide average annual rate of
reservoir storage loss due to sedimentation
is on the order of 0.5 to 1% of total storage
capacity.
• United States had an average storage loss
rate of 0.71%.
• China had an average storage loss rate of
about 2%.
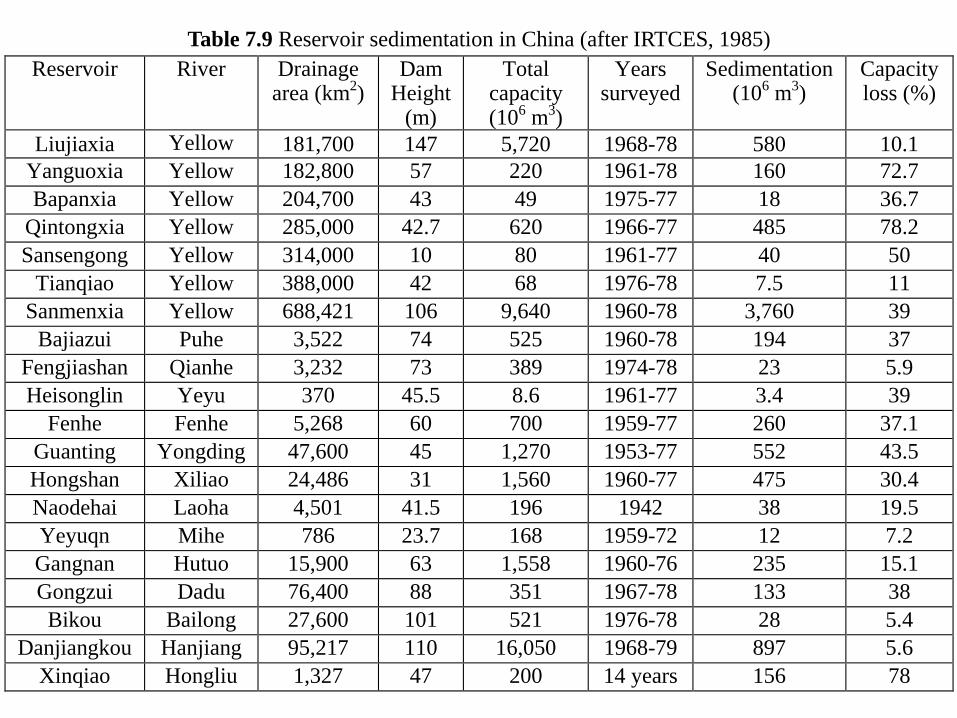
Table 7.9 Reservoir sedimentation in China (after IRTCES, 1985)
Reservoir River Drainage area (km2)
Dam Height
(m)
Total capacity (106 m3)
Years surveyed
Sedimentation (106 m3)
Capacity loss (%)
Liujiaxia Yellow 181,700 147 5,720 1968-78 580 10.1
Yanguoxia Yellow 182,800 57 220 1961-78 160 72.7
Bapanxia Yellow 204,700 43 49 1975-77 18 36.7
Qintongxia Yellow 285,000 42.7 620 1966-77 485 78.2
Sansengong Yellow 314,000 10 80 1961-77 40 50
Tianqiao Yellow 388,000 42 68 1976-78 7.5 11
Sanmenxia Yellow 688,421 106 9,640 1960-78 3,760 39
Bajiazui Puhe 3,522 74 525 1960-78 194 37
Fengjiashan Qianhe 3,232 73 389 1974-78 23 5.9
Heisonglin Yeyu 370 45.5 8.6 1961-77 3.4 39
Fenhe Fenhe 5,268 60 700 1959-77 260 37.1
Guanting Yongding 47,600 45 1,270 1953-77 552 43.5
Hongshan Xiliao 24,486 31 1,560 1960-77 475 30.4
Naodehai Laoha 4,501 41.5 196 1942 38 19.5
Yeyuqn Mihe 786 23.7 168 1959-72 12 7.2
Gangnan Hutuo 15,900 63 1,558 1960-76 235 15.1
Gongzui Dadu 76,400 88 351 1967-78 133 38
Bikou Bailong 27,600 101 521 1976-78 28 5.4
Danjiangkou Hanjiang 95,217 110 16,050 1968-79 897 5.6
Xinqiao Hongliu 1,327 47 200 14 years 156 78
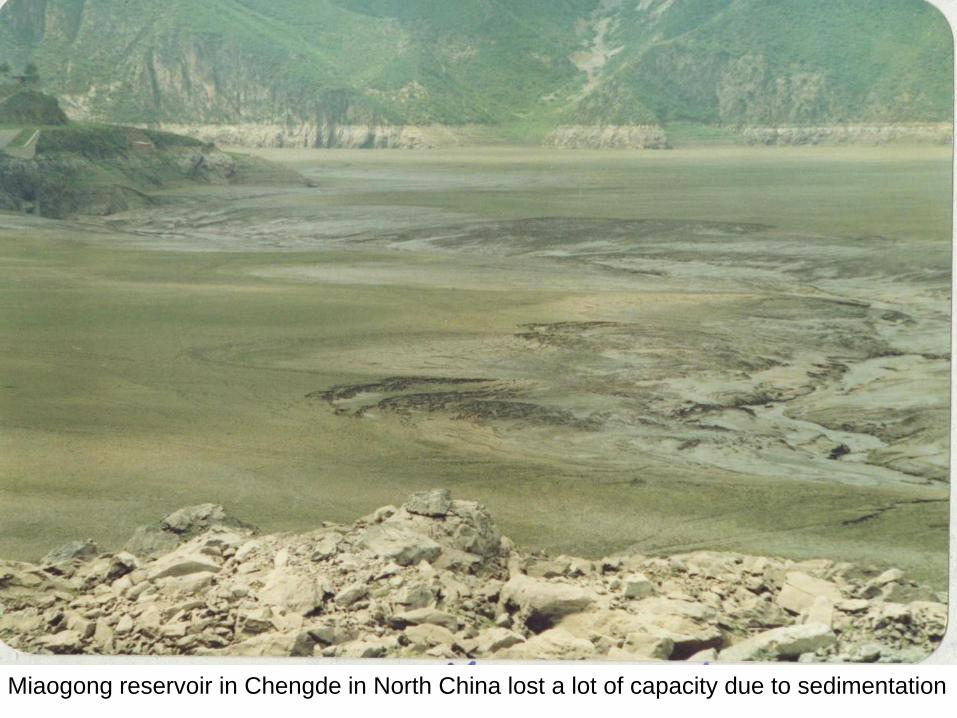
Miaogong reservoir in Chengde in North China lost a lot of capacity due to sedimentation
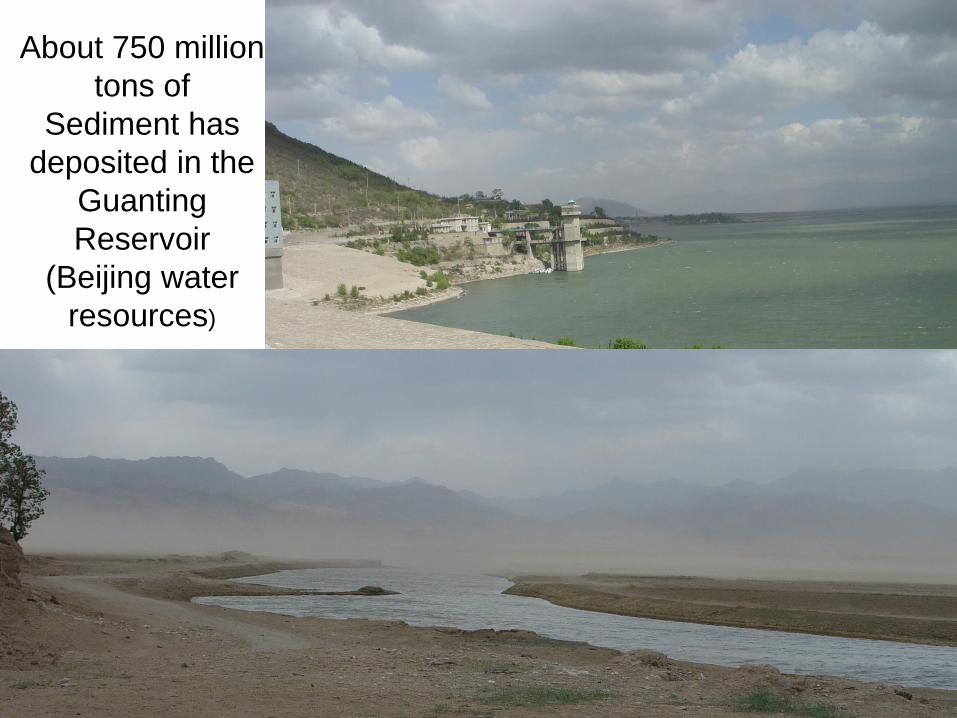
About 750 million
tons of
Sediment has
deposited in the
Guanting
Reservoir
(Beijing water
resources)
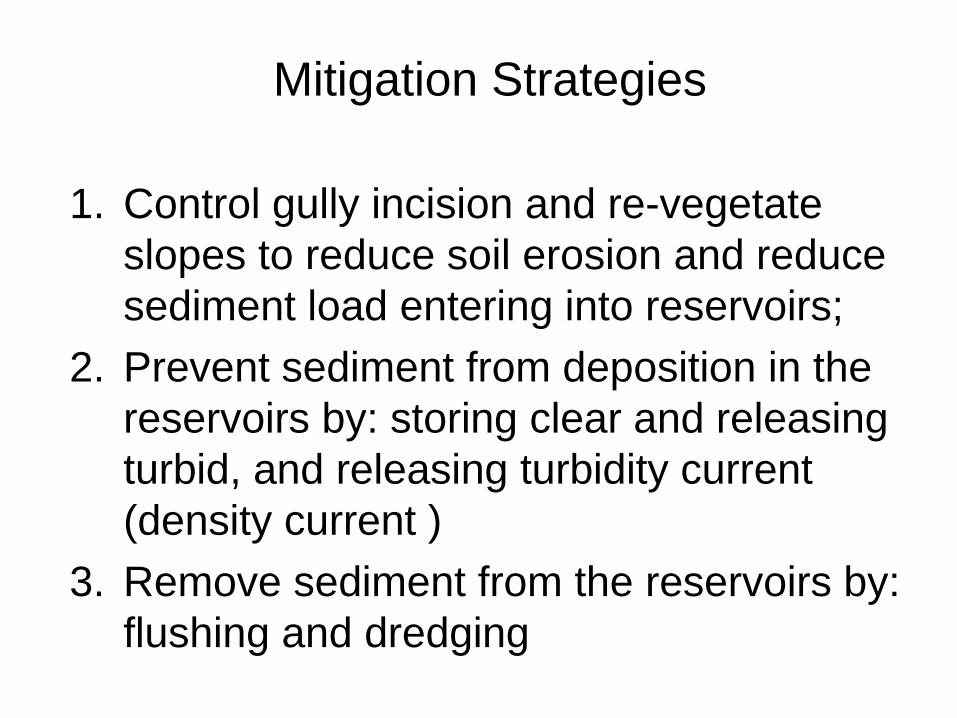
Mitigation Strategies
1. Control gully incision and re-vegetate
slopes to reduce soil erosion and reduce
sediment load entering into reservoirs;
2. Prevent sediment from deposition in the
reservoirs by: storing clear and releasing
turbid, and releasing turbidity current
(density current )
3. Remove sediment from the reservoirs by:
flushing and dredging
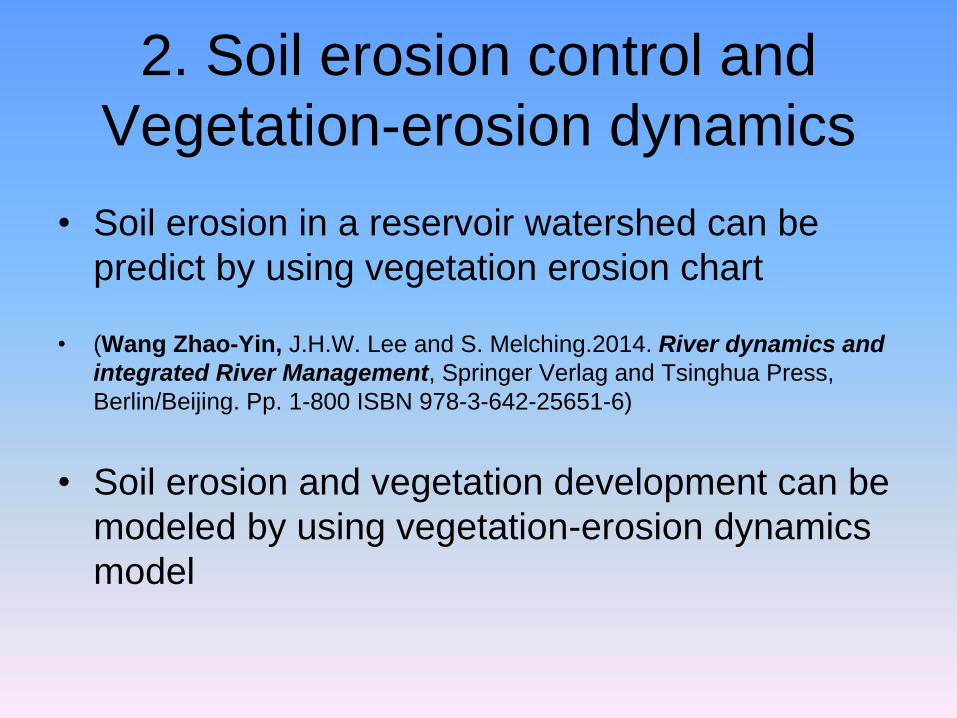
2. Soil erosion control and
Vegetation-erosion dynamics
• Soil erosion in a reservoir watershed can be
predict by using vegetation erosion chart
• (Wang Zhao-Yin, J.H.W. Lee and S. Melching.2014. River dynamics and
integrated River Management, Springer Verlag and Tsinghua Press,
Berlin/Beijing. Pp. 1-800 ISBN 978-3-642-25651-6)
• Soil erosion and vegetation development can be
modeled by using vegetation-erosion dynamics
model
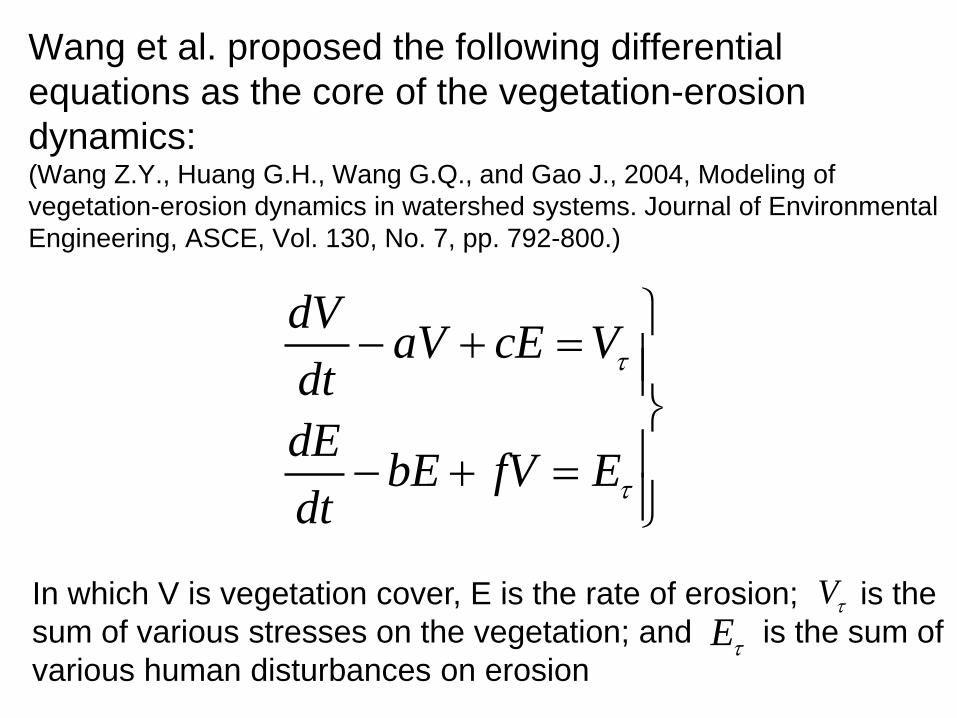
Wang et al. proposed the following differential
equations as the core of the vegetation-erosion
dynamics: (Wang Z.Y., Huang G.H., Wang G.Q., and Gao J., 2004, Modeling of
vegetation-erosion dynamics in watershed systems. Journal of Environmental
Engineering, ASCE, Vol. 130, No. 7, pp. 792-800.)
dVaV cE V
dt
dEbE fV E
dt
In which V is vegetation cover, E is the rate of erosion; is the
sum of various stresses on the vegetation; and is the sum of
various human disturbances on erosion
V
E
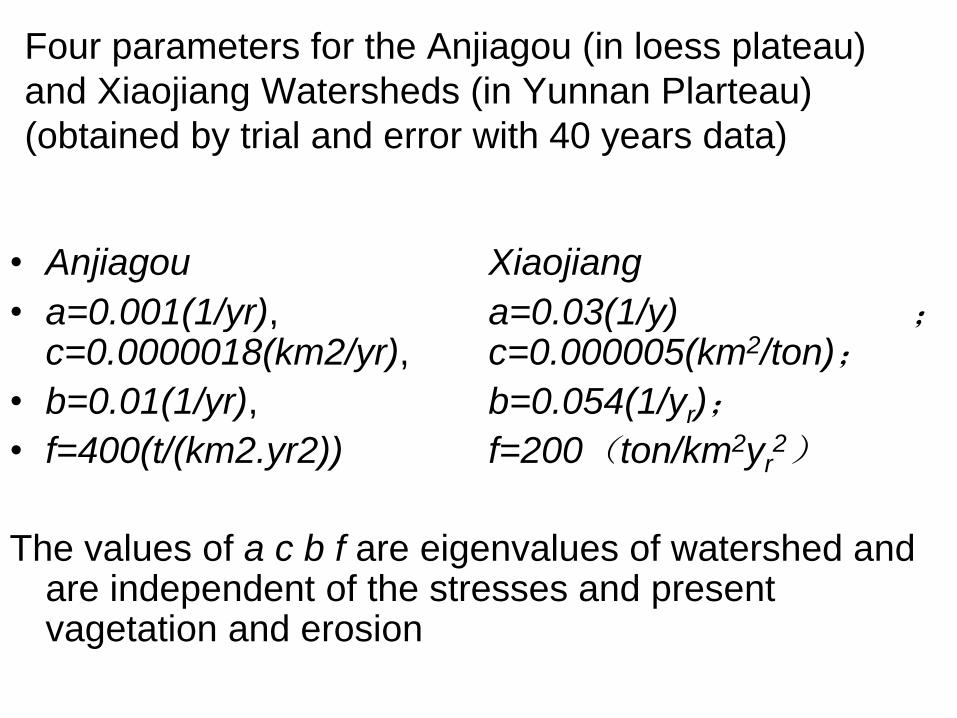
Four parameters for the Anjiagou (in loess plateau)
and Xiaojiang Watersheds (in Yunnan Plarteau)
(obtained by trial and error with 40 years data)
• Anjiagou Xiaojiang
• a=0.001(1/yr), a=0.03(1/y) ;c=0.0000018(km2/yr), c=0.000005(km2/ton);
• b=0.01(1/yr), b=0.054(1/yr);
• f=400(t/(km2.yr2)) f=200(ton/km2yr2)
The values of a c b f are eigenvalues of watershed and are independent of the stresses and present vagetation and erosion
1950 1955 1960 1965 1970 1975 1980 1985 1990
0.05
0.10
0.15
0.20
0.25
0.30
0.35
0.40
0.45
0.50
V (
%)
Year
Computed
Measured
(a)
1950 1955 1960 1965 1970 1975 1980 1985 19900
2000
4000
6000
8000
10000
E (
t.km
-2.y
r-1)
Year
Computed
Measured
(b)
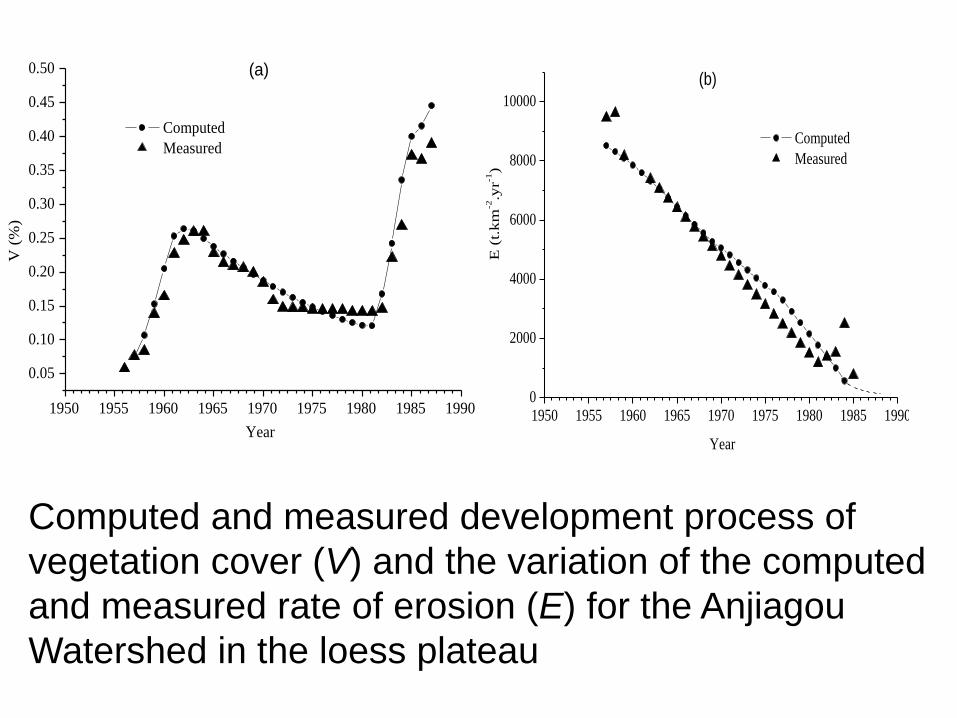
Computed and measured development process of
vegetation cover (V) and the variation of the computed
and measured rate of erosion (E) for the Anjiagou
Watershed in the loess plateau
1950 1955 1960 1965 1970 1975 1980 1985 1990 1995 20000
2000
4000
6000
8000
10000
12000
14000
16000
18000
Computed
Measured
E (
t.k
m-2
.yr-1
)
Year
(b)
1950 1955 1960 1965 1970 1975 1980 1985 1990 1995 20000
5
10
15
20
25
30
V (
%)
Year
Computed
Measured
(a)
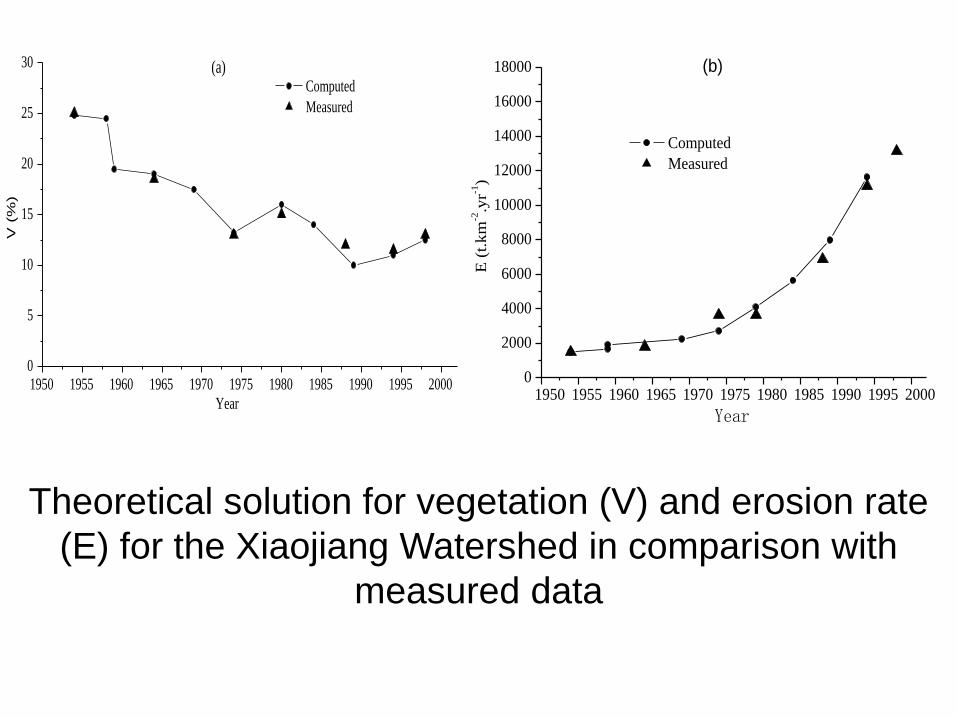
Theoretical solution for vegetation (V) and erosion rate
(E) for the Xiaojiang Watershed in comparison with
measured data
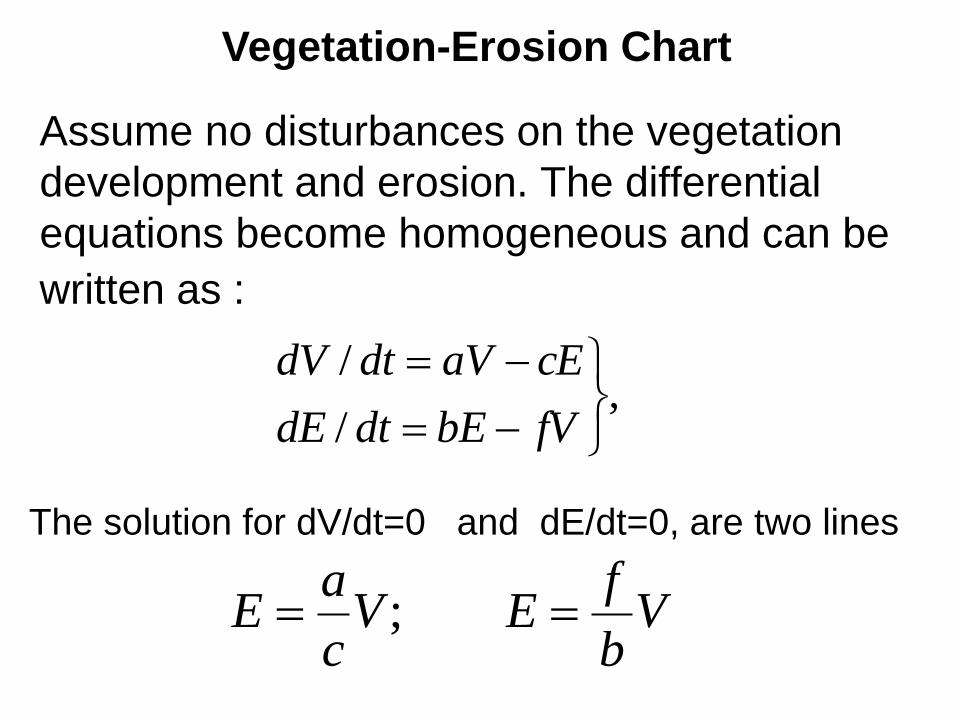
Assume no disturbances on the vegetation
development and erosion. The differential
equations become homogeneous and can be
written as :
,/
/
fVbEdtdE
cEaVdtdV
The solution for dV/dt=0 and dE/dt=0, are two lines
Vb
fEV
c
aE ;
Vegetation-Erosion Chart
0.0 0.1 0.2 0.3 0.4 0.5 0.6 0.7 0.8 0.9 1.0
0
2000
4000
6000
8000
10000
12000
14000
0E
0V
0
0
E
V
0
0
E
V
0
0
E
V
C
B
A
E /t
.km
-2.a
-1
V
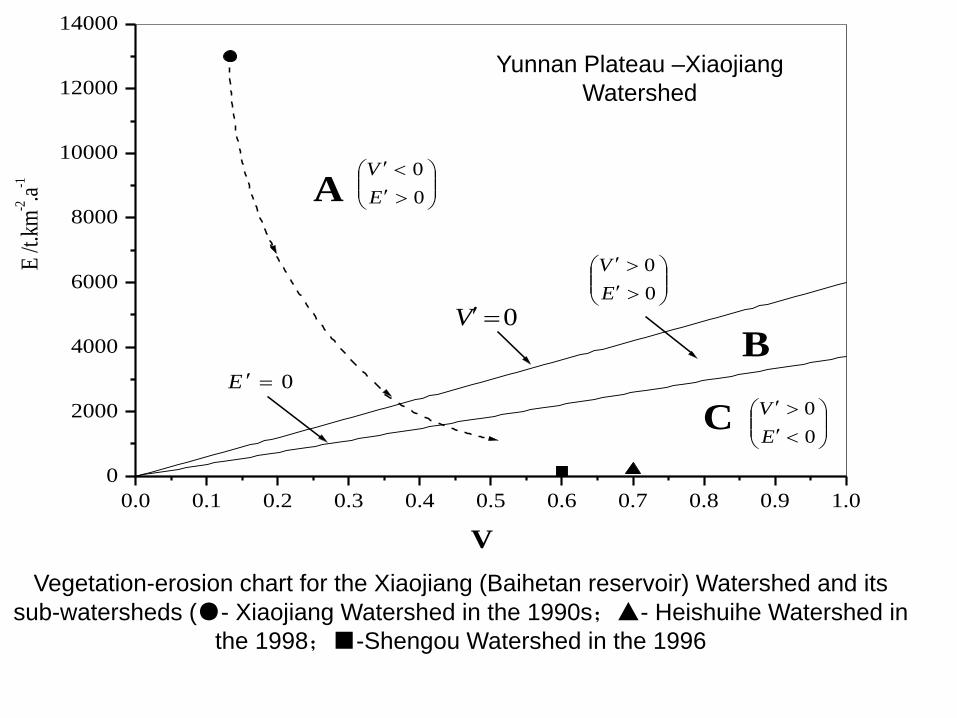
Yunnan Plateau –Xiaojiang
Watershed
Vegetation-erosion chart for the Xiaojiang (Baihetan reservoir) Watershed and its
sub-watersheds (●- Xiaojiang Watershed in the 1990s;▲- Heishuihe Watershed in
the 1998;■-Shengou Watershed in the 1996
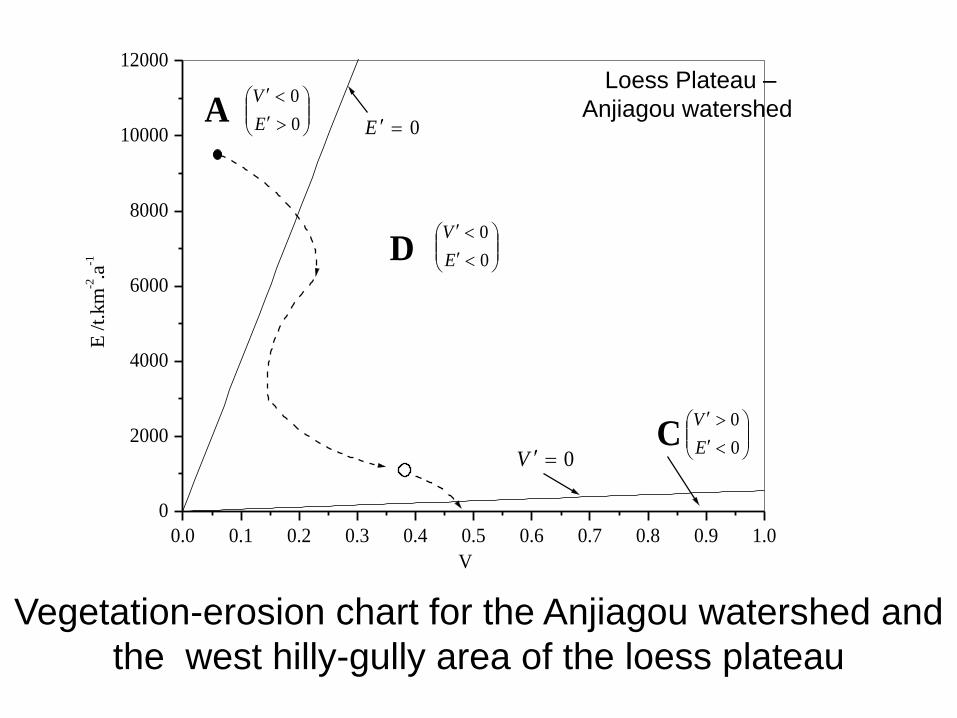
There are two stable status of vegetation and erosion
under no human disturbances: Zone C and A.
Zone A, dV/dt < 0, dE/dt >0. vegetation reducing
and erosion increasing. The larger is a/c, the bigger
is the Zone.
Zone C, dV/dt>0, dE/dt<0. vegetation developing
and the erosion decreasing. The larger is the value
of f/d, the bigger is the Zone C. The forest may be
logged to a certain extent and the vegetation may
restore by itself.
Zone B, dV/dt>0, dE/dt >0. Transitional zone.
or Zone D, dV/dt<0, dE/dt <0. Transitional zone.
The vegetation may be restored and has capacity of
self-restoration because the C-zone is big.
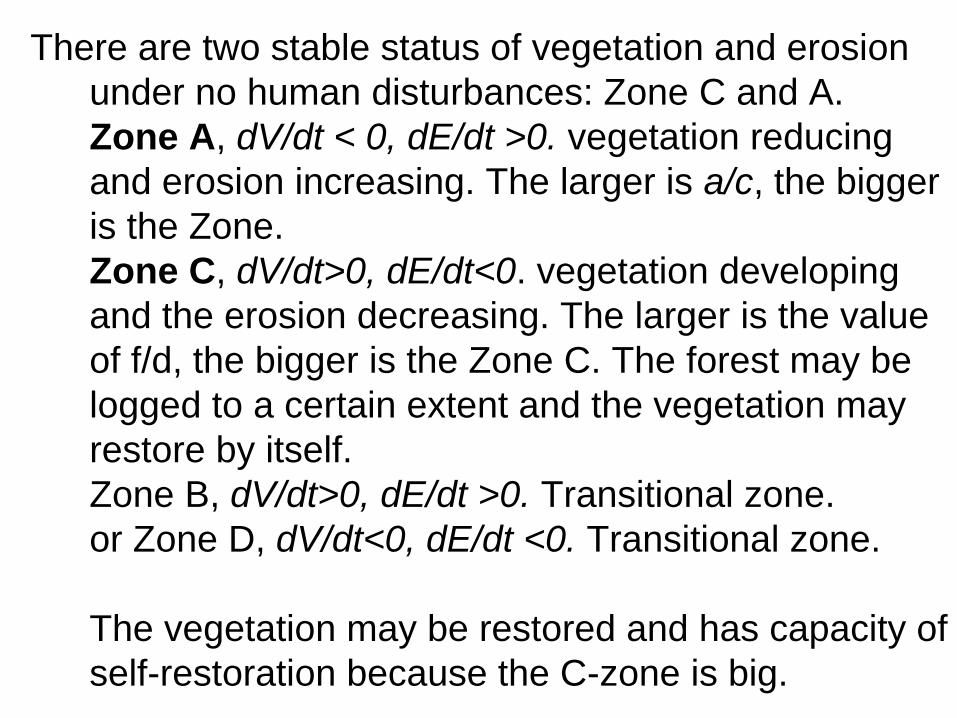
Two status in the Xiaojiang WatershedPoor vegetation and severe erosion
– A-zone
Good
vegetation
no erosion
In C-zone
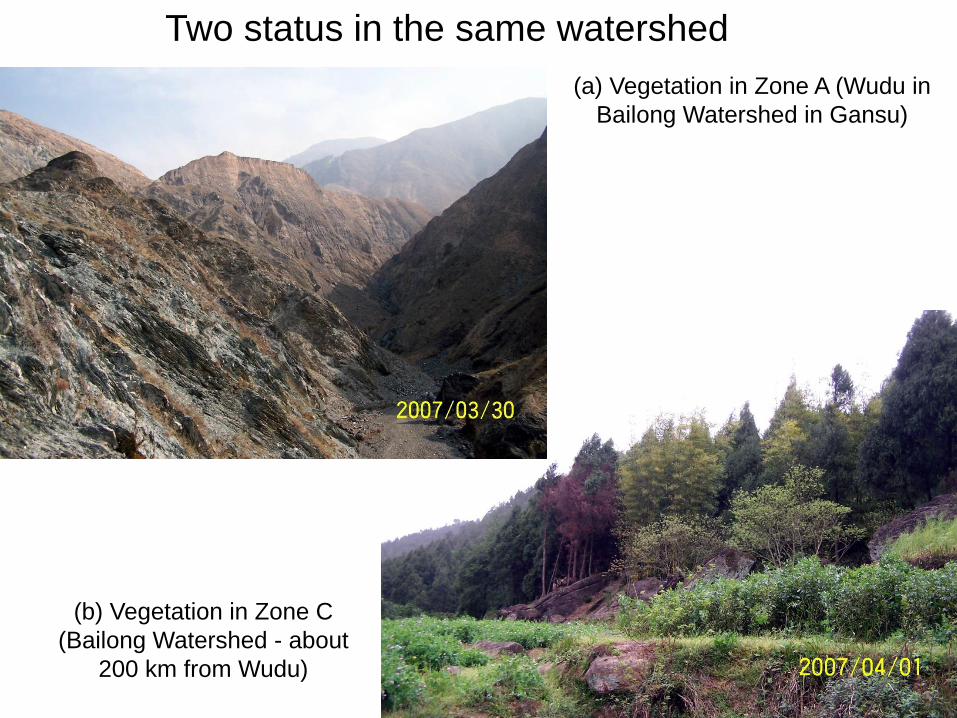
(b) Vegetation in Zone C
(Bailong Watershed - about
200 km from Wudu)
(a) Vegetation in Zone A (Wudu in
Bailong Watershed in Gansu)
Two status in the same watershed

0.0 0.1 0.2 0.3 0.4 0.5 0.6 0.7 0.8 0.9 1.0
0
2000
4000
6000
8000
10000
12000
14000
0E
0V
0
0
E
V
0
0
E
V
0
0
E
V
C
B
A
E /t
.km
-2.a
-1
V
Yunnan Plateau –Xiaojiang
Watershed
Vegetation-erosion chart for the Xiaojiang (Baihetan reservoir) Watershed and its
sub-watersheds (●- Xiaojiang Watershed in the 1990s;▲- Heishuihe Watershed in
the 1998;■-Shengou Watershed in the 1996
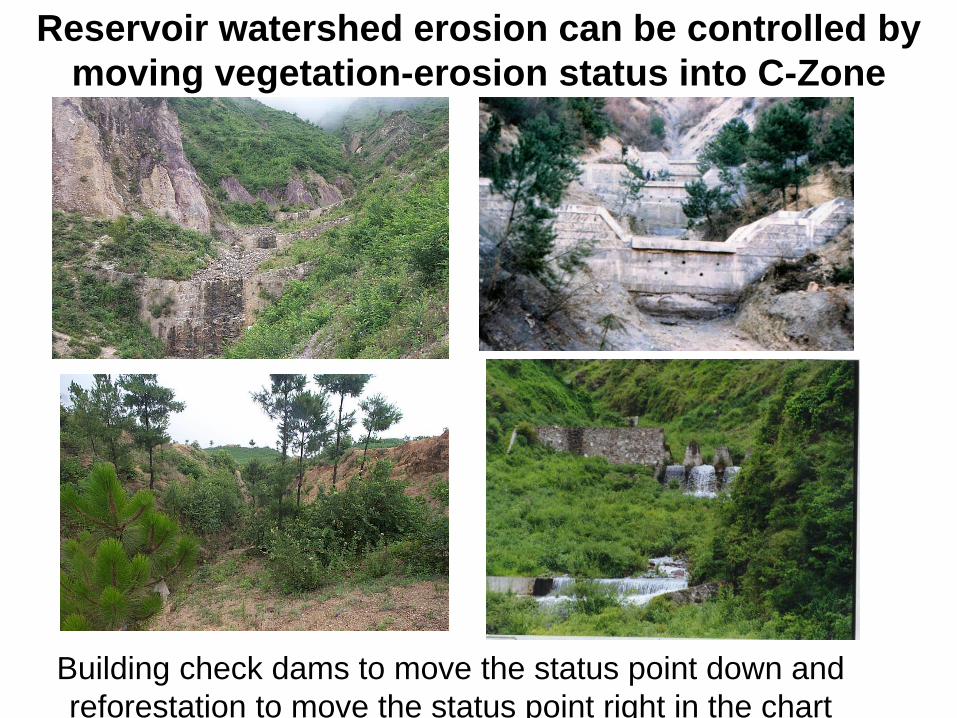
Building check dams to move the status point down and
reforestation to move the status point right in the chart
Reservoir watershed erosion can be controlled by
moving vegetation-erosion status into C-Zone
0.0 0.1 0.2 0.3 0.4 0.5 0.6 0.7 0.8 0.9 1.0
0
2000
4000
6000
8000
10000
12000
D
0E
0V
0
0
E
V
0
0
E
V
0
0
E
VA
C
E /
t.km
-2.a
-1
V
Loess Plateau –
Anjiagou watershed
Vegetation-erosion chart for the Anjiagou watershed and
the west hilly-gully area of the loess plateau
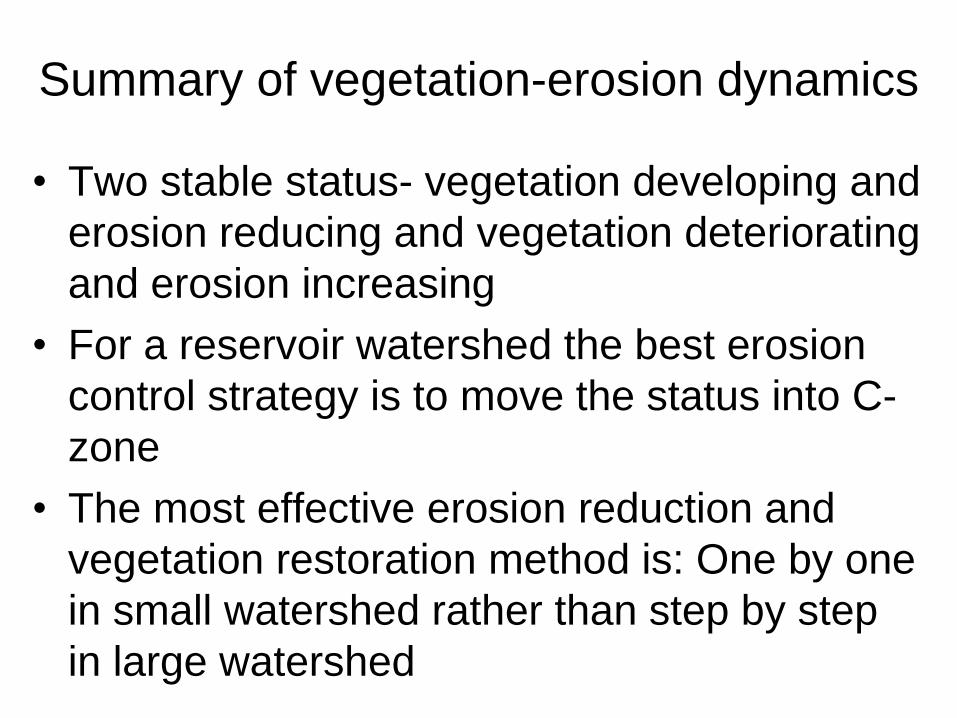
Summary of vegetation-erosion dynamics
• Two stable status- vegetation developing and
erosion reducing and vegetation deteriorating
and erosion increasing
• For a reservoir watershed the best erosion
control strategy is to move the status into C-
zone
• The most effective erosion reduction and
vegetation restoration method is: One by one
in small watershed rather than step by step
in large watershed
3. Sediment Removal
• Strategies for reservoir sedimentation control:
• 1) Drawdown flushing or pressure flushing;
• 2) Empty flushing or free flow flushing;
• 3) Releasing density currents;
• 4) Storing the clear and releasing the turbid;
• 5) Sediment mining and dredging;
(1) Empty flushing
• Some irrigation reservoirs with small capacity are emptied before flood season and flushed during the first part of the flood season.
• A wider channel can be deepened by using either smaller or larger flows, but widening is achieved by large flows only “Deepen by small flow, widen by flood flow.”
• Flushing effect is maximized if the reservoir is emptied immediately prior to the arrival of floods so that the flood flow can exert its erosive force on deposits which have not yet had the time to fully dewater and consolidate after empting the reservoir.
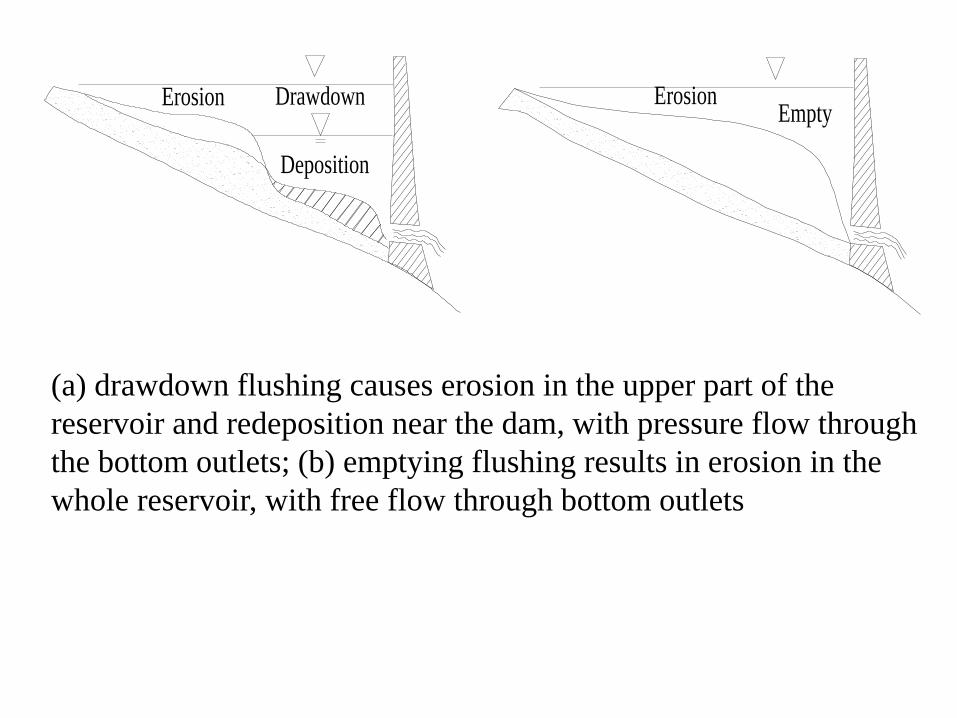
Erosion Drawdown
Deposition
ErosionEmpty
(a) drawdown flushing causes erosion in the upper part of the
reservoir and redeposition near the dam, with pressure flow through
the bottom outlets; (b) emptying flushing results in erosion in the
whole reservoir, with free flow through bottom outlets
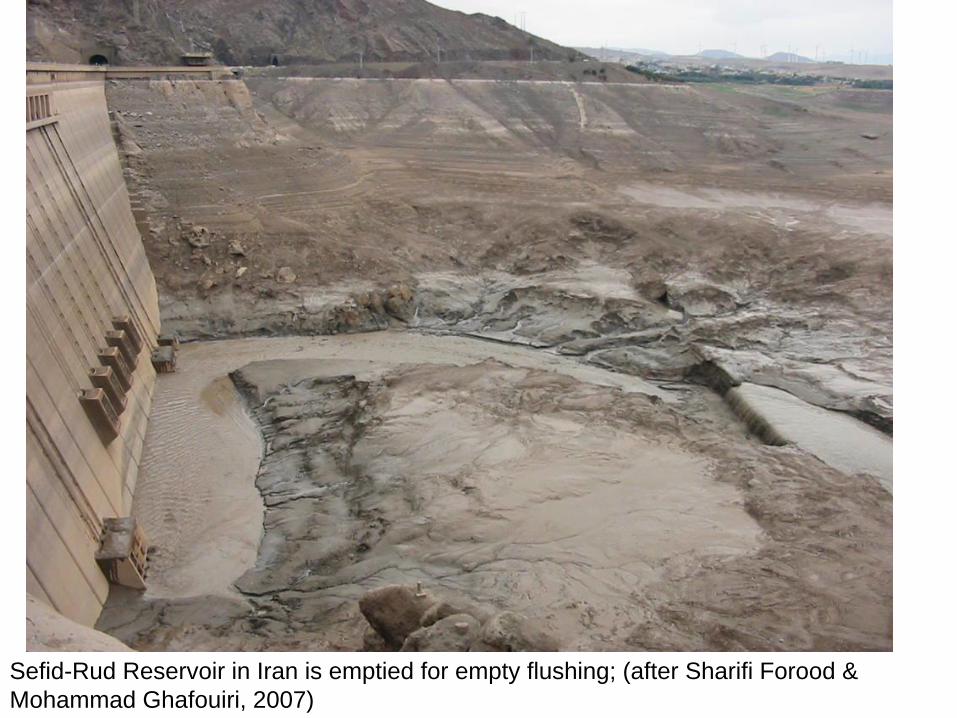
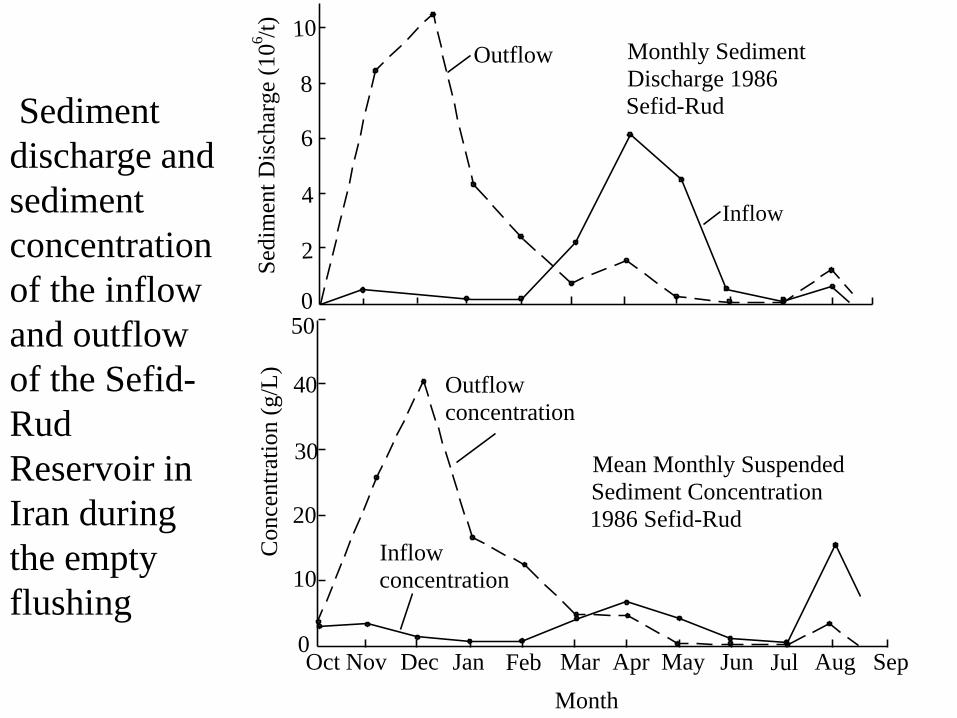
Sefid-Rud Reservoir in Iran is emptied for empty flushing; (after Sharifi Forood &
Mohammad Ghafouiri, 2007)
0
10
20
30
40
500
2
4
6
8
10
Oct Nov Dec Jan Feb Mar Apr May Jun Jul Aug
Co
nce
ntr
atio
n (
g/L
)S
edim
ent
Dis
char
ge
(10
/t)
6
Outflow
Inflow
Monthly Sediment
Discharge 1986
Sefid-Rud
Outflow
concentration
Inflow
concentration
Mean Monthly Suspended
Sediment Concentration
1986 Sefid-Rud
Month
Sep
Sediment
discharge and
sediment
concentration
of the inflow
and outflow
of the Sefid-
Rud
Reservoir in
Iran during
the empty
flushing
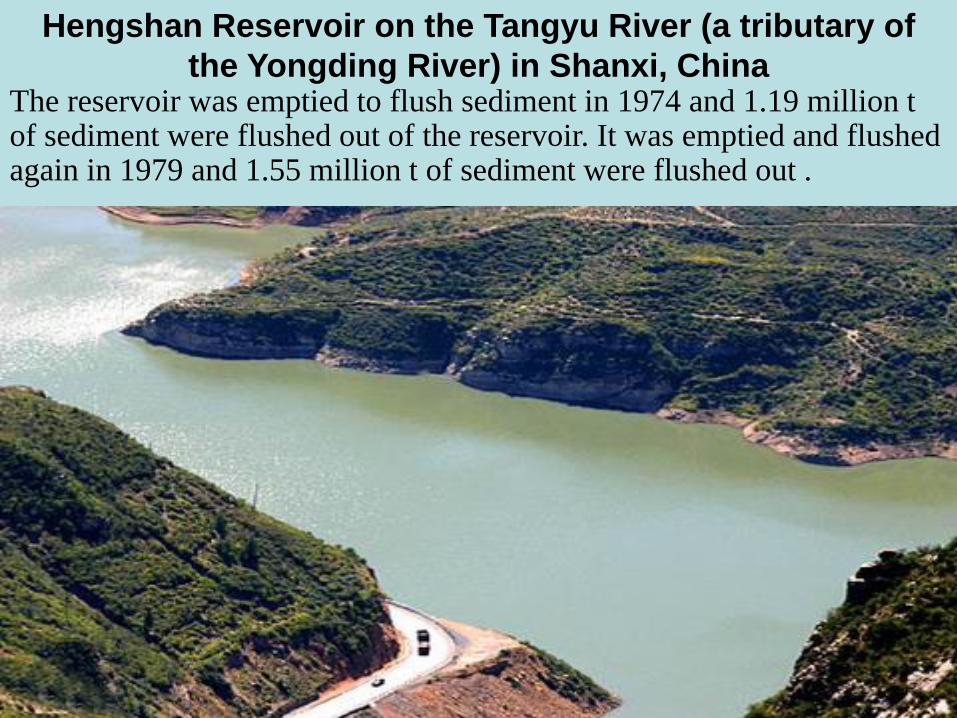
Hengshan Reservoir on the Tangyu River (a tributary of
the Yongding River) in Shanxi, China The reservoir was emptied to flush sediment in 1974 and 1.19 million t of sediment were flushed out of the reservoir. It was emptied and flushed again in 1979 and 1.55 million t of sediment were flushed out .
0.0
0.5
1.0
1.5
0 10 20 30 40
t (hr)
Q (
m3/s
)
0
300
600
900
1200
S (
kg/m
3)
Q
S
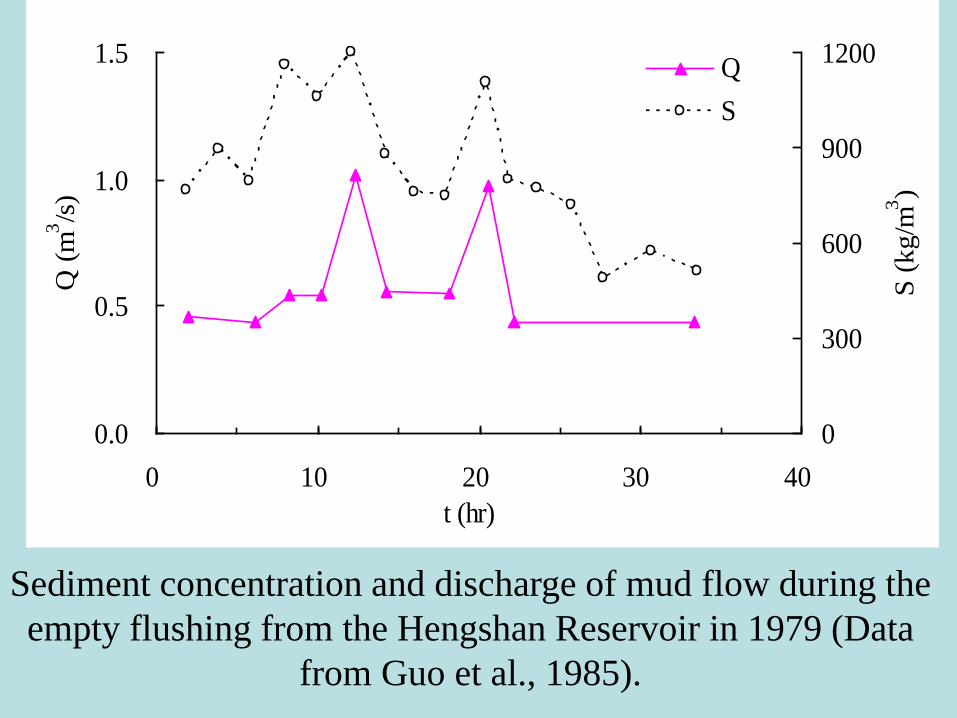
Sediment concentration and discharge of mud flow during the
empty flushing from the Hengshan Reservoir in 1979 (Data
from Guo et al., 1985).
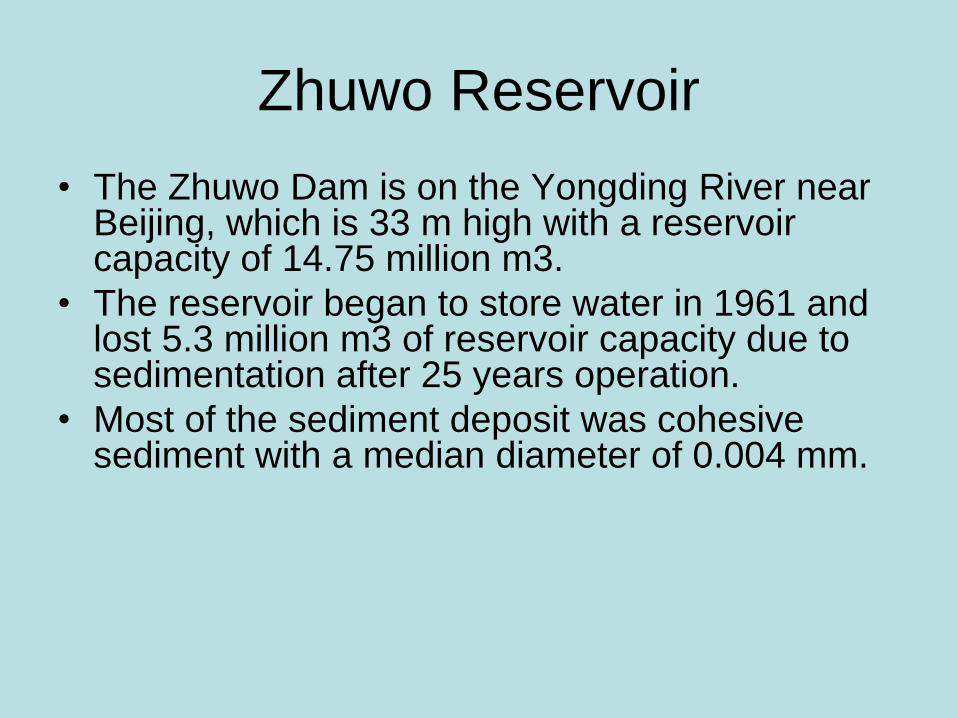
Zhuwo Reservoir
• The Zhuwo Dam is on the Yongding River near Beijing, which is 33 m high with a reservoir capacity of 14.75 million m3.
• The reservoir began to store water in 1961 and lost 5.3 million m3 of reservoir capacity due to sedimentation after 25 years operation.
• Most of the sediment deposit was cohesive sediment with a median diameter of 0.004 mm.
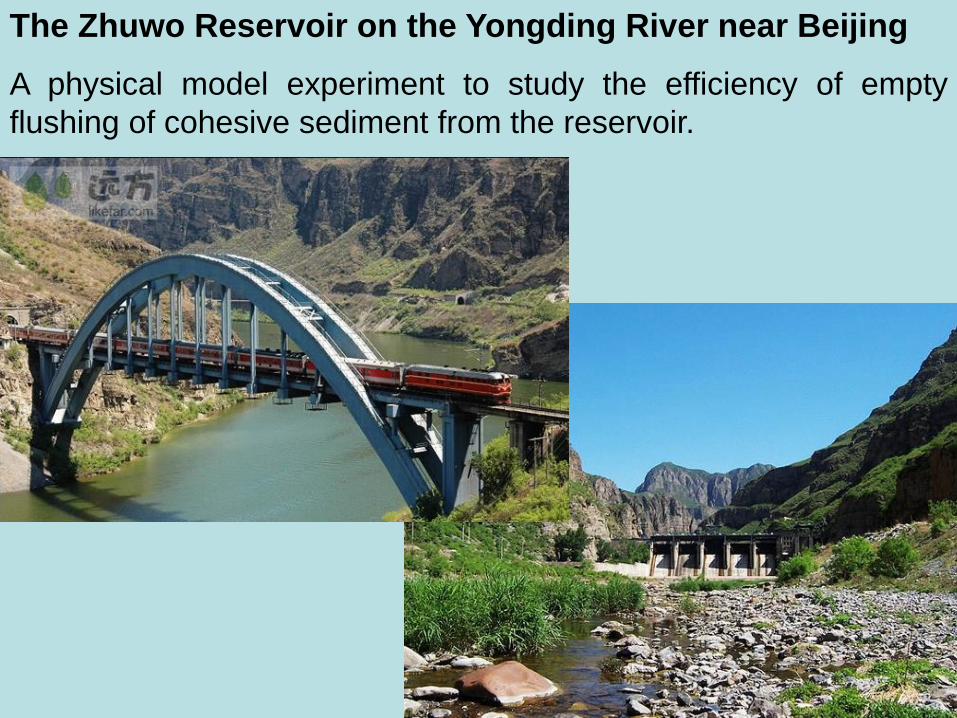
The Zhuwo Reservoir on the Yongding River near Beijing
A physical model experiment to study the efficiency of empty
flushing of cohesive sediment from the reservoir.
0
4
8
12
16
0 2 4 6 8t (hr)
Q (
m3/s
)
0
200
400
600
800
S (
kg/m
3)
Q
S
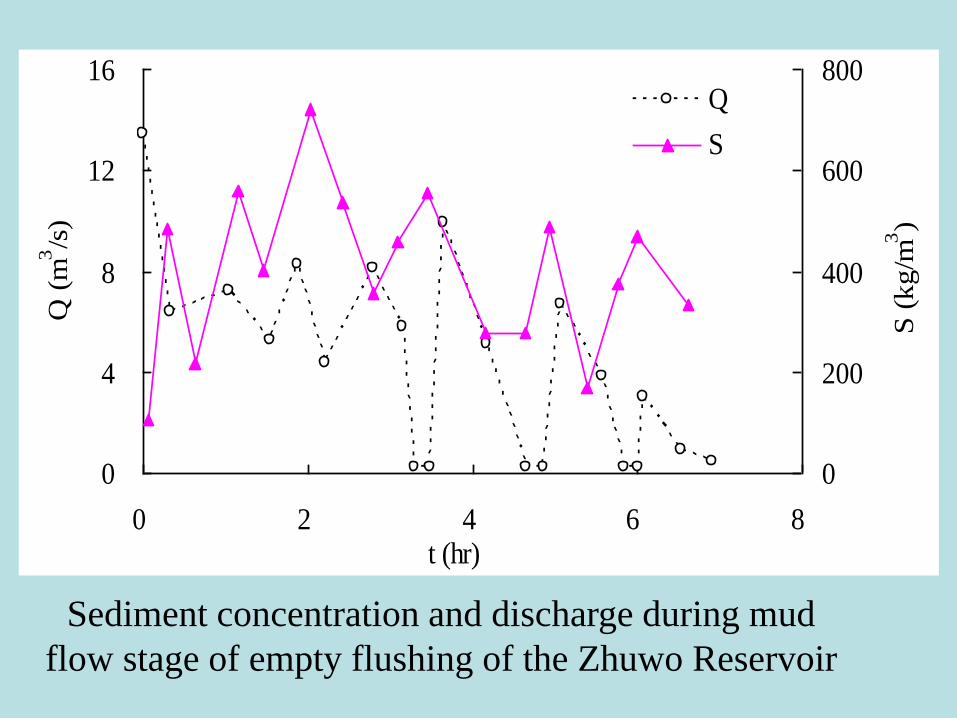
Sediment concentration and discharge during mud
flow stage of empty flushing of the Zhuwo Reservoir
0
40
80
120
160
200
0 10 20 30 40
t (hr)
S (
kg/m
3)
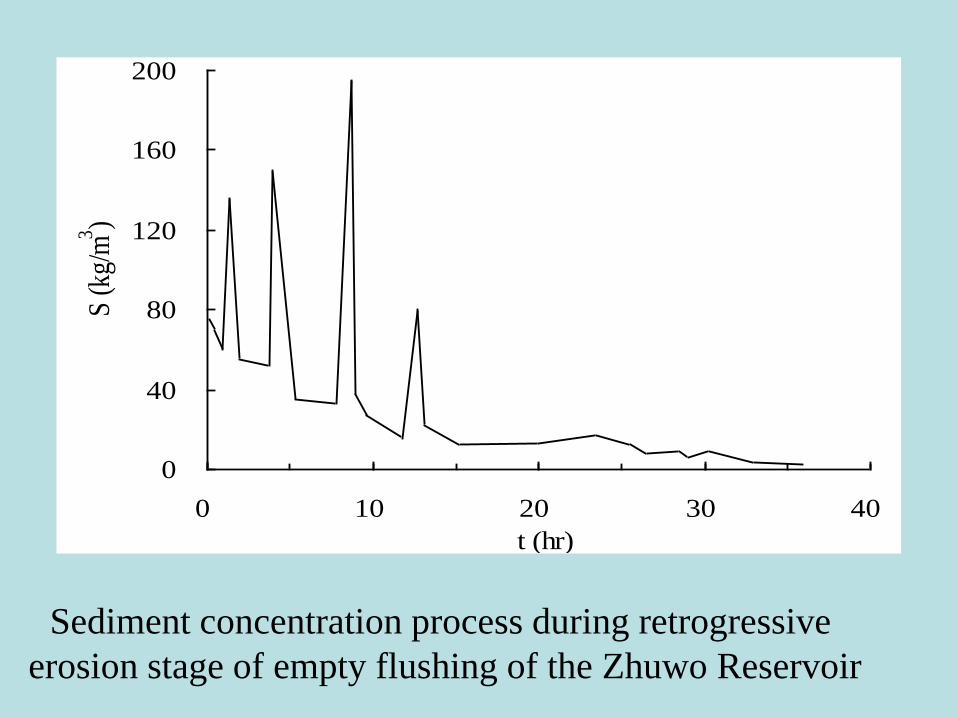
Sediment concentration process during retrogressive
erosion stage of empty flushing of the Zhuwo Reservoir
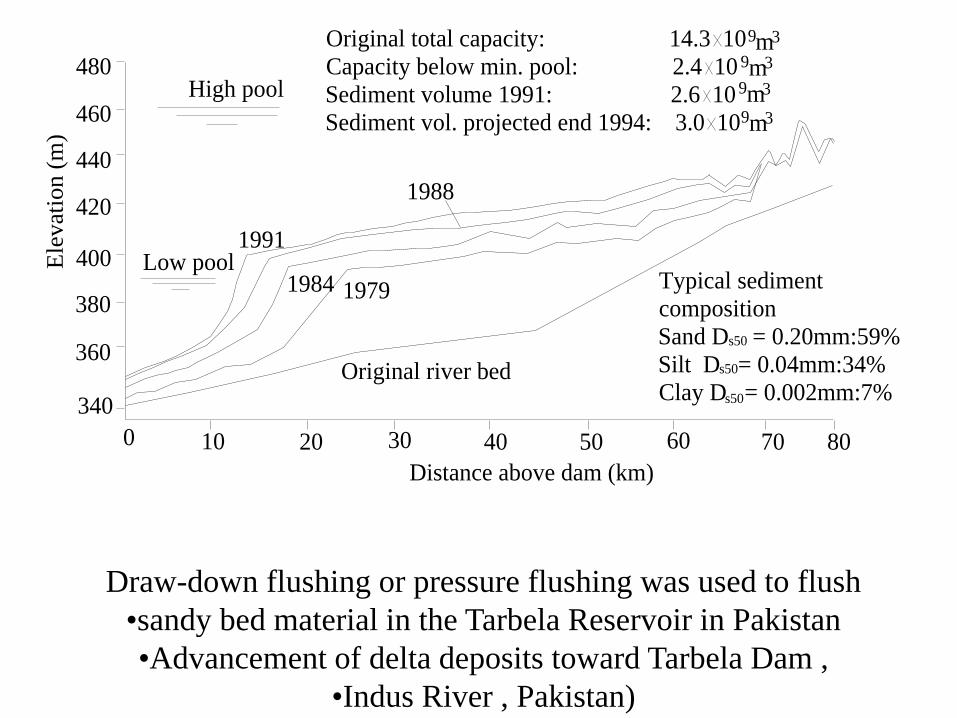
(2) Drawdown Flushing
• Drawdown flushing involves reservoir drawdown by opening a low-level outlet to temporarily establish riverine flow along the impounded reach, eroding a channel through the deposits and flushing the eroded sediment through the outlet.
• Sediment from the upper portion of the Liujiaxia reservoir was transported towards the dam during draw down, but only material in the scour hole in front of the outlets can be flushed out.
Distance above dam (km)
0 20 30 40 50 60 7010 80
340
360
380
400
420
440
460
480E
levati
on (
m)
Original river bed
1979
Original total capacity: 14.3 10
Capacity below min. pool: 2.4 10
Sediment volume 1991: 2.6 10
Sediment vol. projected end 1994: 3.0 10
Typical sediment
composition
Sand D = 0.20mm:59%
Silt D = 0.04mm:34%
Clay D = 0.002mm:7%
9 3m9 3m9 3m9 3m
1984
1991
1988
High pool
Low pool
s50
s50
s50
Draw-down flushing or pressure flushing was used to flush
•sandy bed material in the Tarbela Reservoir in Pakistan
•Advancement of delta deposits toward Tarbela Dam ,
•Indus River , Pakistan)
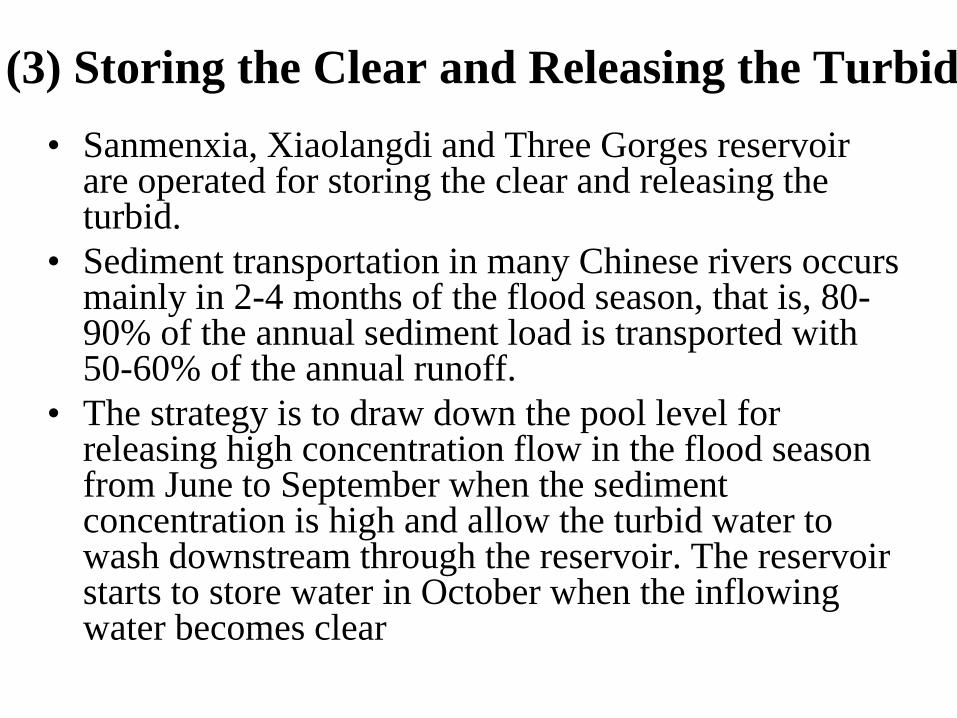
(3) Storing the Clear and Releasing the Turbid
• Sanmenxia, Xiaolangdi and Three Gorges reservoir are operated for storing the clear and releasing the turbid.
• Sediment transportation in many Chinese rivers occurs mainly in 2-4 months of the flood season, that is, 80-90% of the annual sediment load is transported with 50-60% of the annual runoff.
• The strategy is to draw down the pool level for releasing high concentration flow in the flood season from June to September when the sediment concentration is high and allow the turbid water to wash downstream through the reservoir. The reservoir starts to store water in October when the inflowing water becomes clear
Cuntan Station in 2007
0
20
40
60
80
1 2 3 4 5 6 7 8 9 10 11 12
Month
Mo
nth
ly r
un
off
(bil
lio
n m
3)
0
20
40
60
80
Mo
nth
ly s
ed
imen
t
load
(m
illi
on
to
n)Monthly runoff
Monthly sediment load
Yichang Station in 2007
0
30
60
90
1 2 3 4 5 6 7 8 9 10 11 12
Month
Mo
nth
ly r
un
off
(bil
lio
n m
3)
0
8
16
24
Mo
nth
ly s
ed
imen
t
load
(m
illi
on
to
n)Monthly runoff
Monthly sediment load
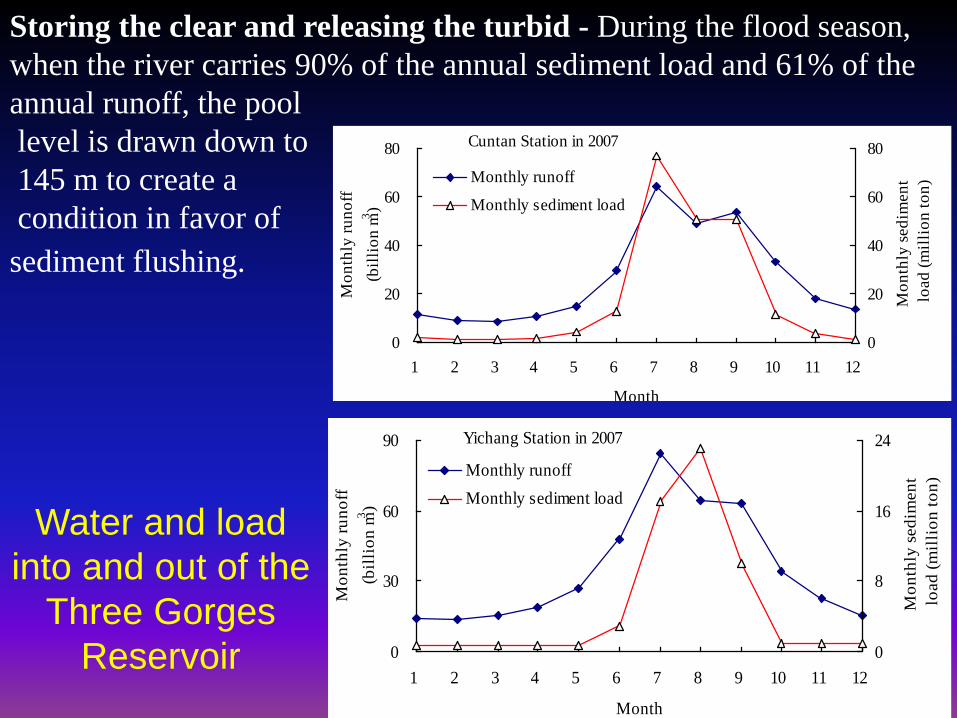
Storing the clear and releasing the turbid - During the flood season,
when the river carries 90% of the annual sediment load and 61% of the
annual runoff, the pool
level is drawn down to
145 m to create a
condition in favor of
sediment flushing.
Water and load
into and out of the
Three Gorges
Reservoir
Cross section No.34 (5.6km upstream of the dam)
-50
0
50
100
150
200
-1000 -500 0 500 1000 1500
Distance from the left bank (m)
Ele
vati
on
(m
)
March 2003
Oct 2005
Oct 2006
Oct 2007
Cross section No. 205 (356km upstream of the dam)
100
120
140
160
180
200
220
240
-200 300 800 1300
Distance from the left bank (m)
ele
vati
on
(m
) Mar 2003
Oct 2005
Oct 2006
Oct 2007
Chonggqing
YichangTGP Dam
S34
S113
S205
0 25 50km
Cross section No.113 (160.1 km upstream of the dam)
0
50
100
150
200
250
0 500 1000 1500 2000 2500
Distance from the left bank (m)E
lev
ati
on
(m
)
Mar 2003 Oct 2005
Oct 2006 Oct 2007
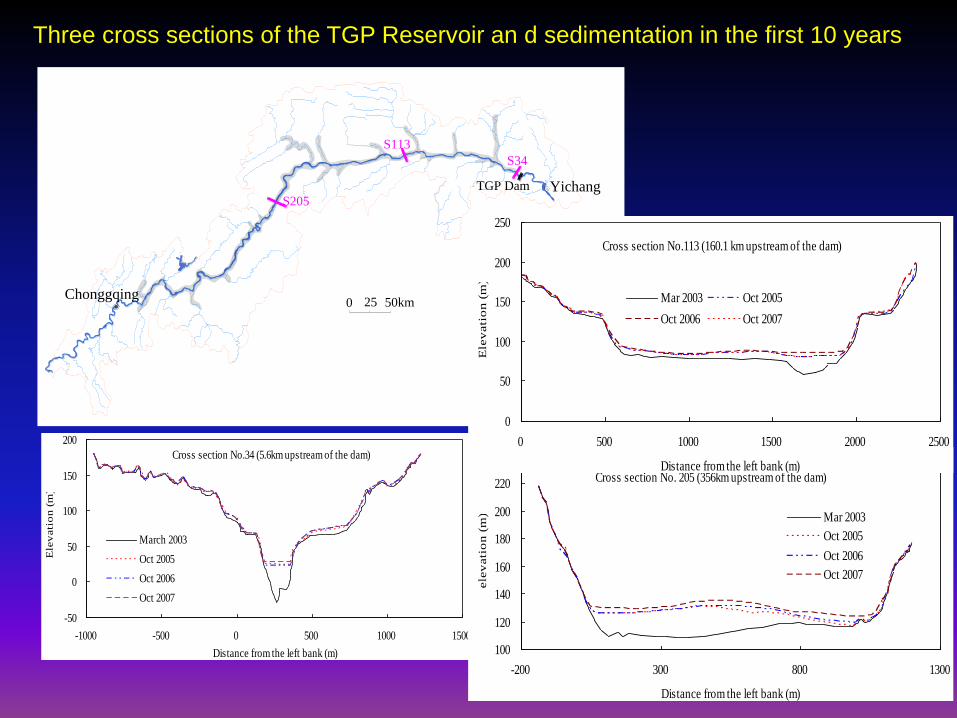
Three cross sections of the TGP Reservoir an d sedimentation in the first 10 years
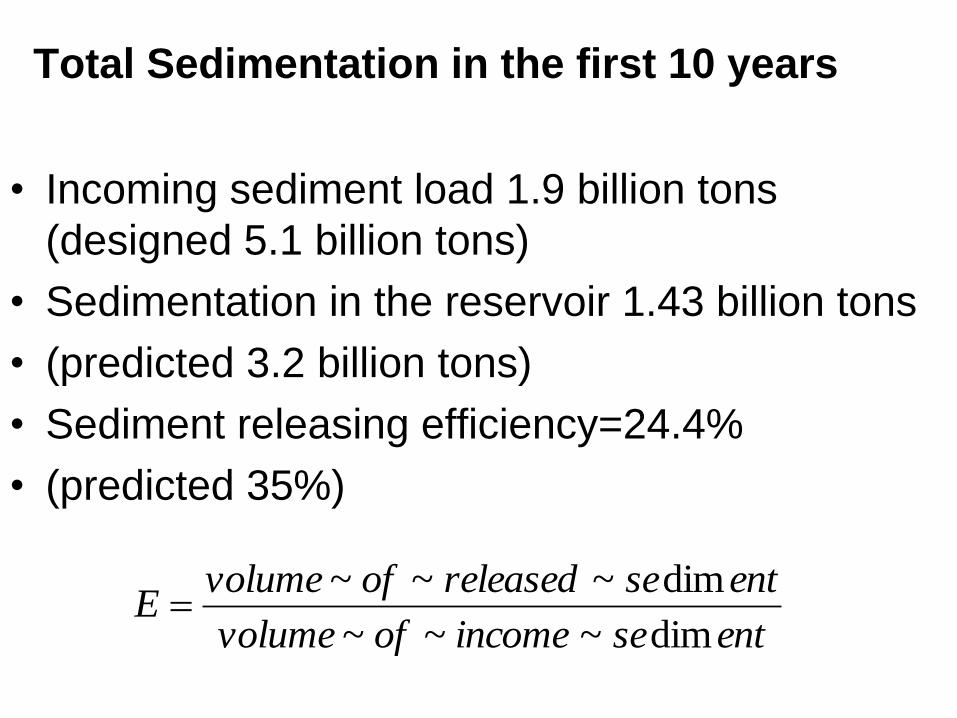
Total Sedimentation in the first 10 years
• Incoming sediment load 1.9 billion tons
(designed 5.1 billion tons)
• Sedimentation in the reservoir 1.43 billion tons
• (predicted 3.2 billion tons)
• Sediment releasing efficiency=24.4%
• (predicted 35%)
entseincomeofvolume
entsereleasedofvolumeE
dim~~~
dim~~~
(4) Mining and Dredging
• Mining has become an important factor affecting reservoir sedimentation since the 1990s
• Dredging has for a long time been used for small reservoir sedimentation management.
• Various dredgers have been used: dredge boat; dipper dredger; hauling scraper; excavator, bulldozer; trailer dredger and agitating with jets and transporting with current to the downstream of the reservoir.
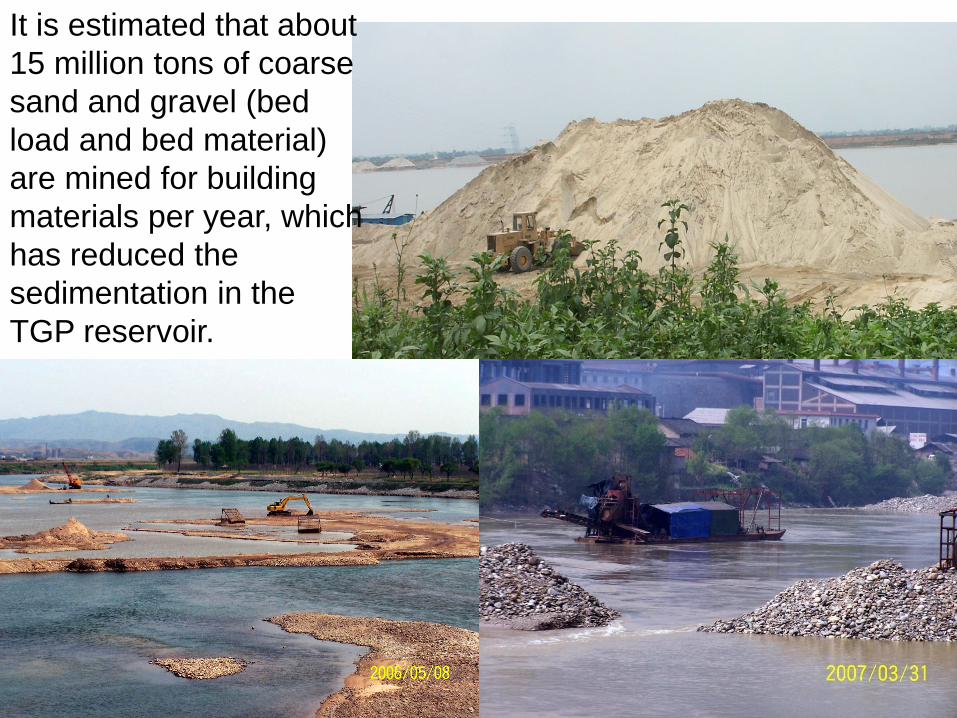
It is estimated that about
15 million tons of coarse
sand and gravel (bed
load and bed material)
are mined for building
materials per year, which
has reduced the
sedimentation in the
TGP reservoir.
0
100
200
300
400
1996 1997 1998 1999 2000 2001 2002 2003
Year
Sedi
men
t sco
ured
(104 m
3 )
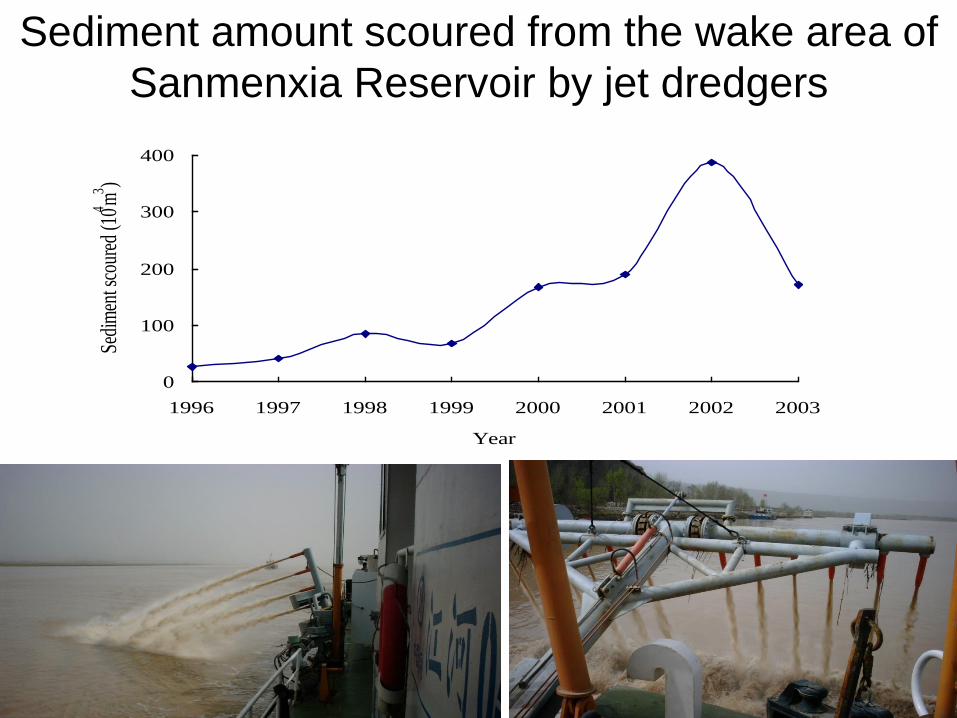
Sediment amount scoured from the wake area of
Sanmenxia Reservoir by jet dredgers
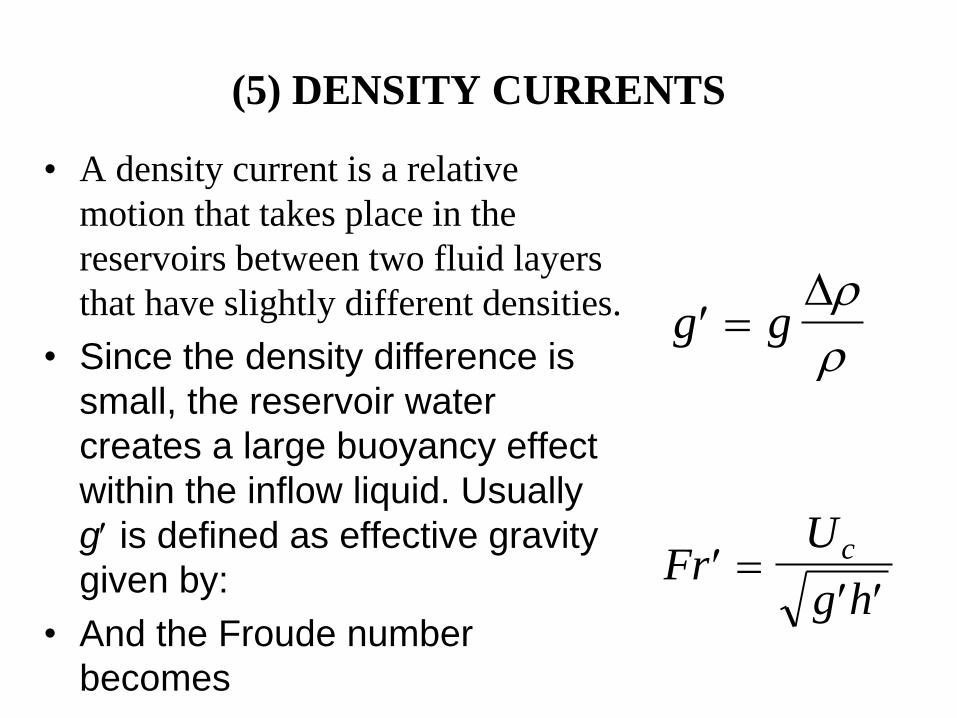
(5) DENSITY CURRENTS
• A density current is a relative
motion that takes place in the
reservoirs between two fluid layers
that have slightly different densities.
• Since the density difference is
small, the reservoir water
creates a large buoyancy effect
within the inflow liquid. Usually
g is defined as effective gravity
given by:
• And the Froude number
becomes
g g
FrU
g h
c
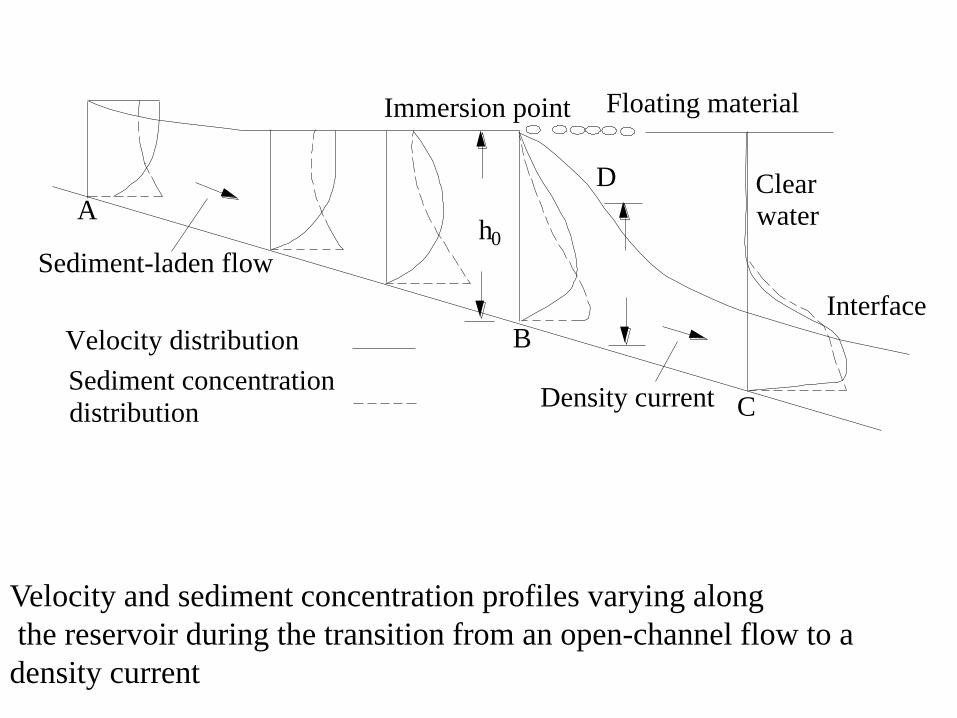
Velocity distribution
Sediment concentration
distributionDensity current
A
B
C
Clear water
Floating materialImmersion point
Sediment-laden flow
Interface
D
h0
Velocity and sediment concentration profiles varying along
the reservoir during the transition from an open-channel flow to a
density current
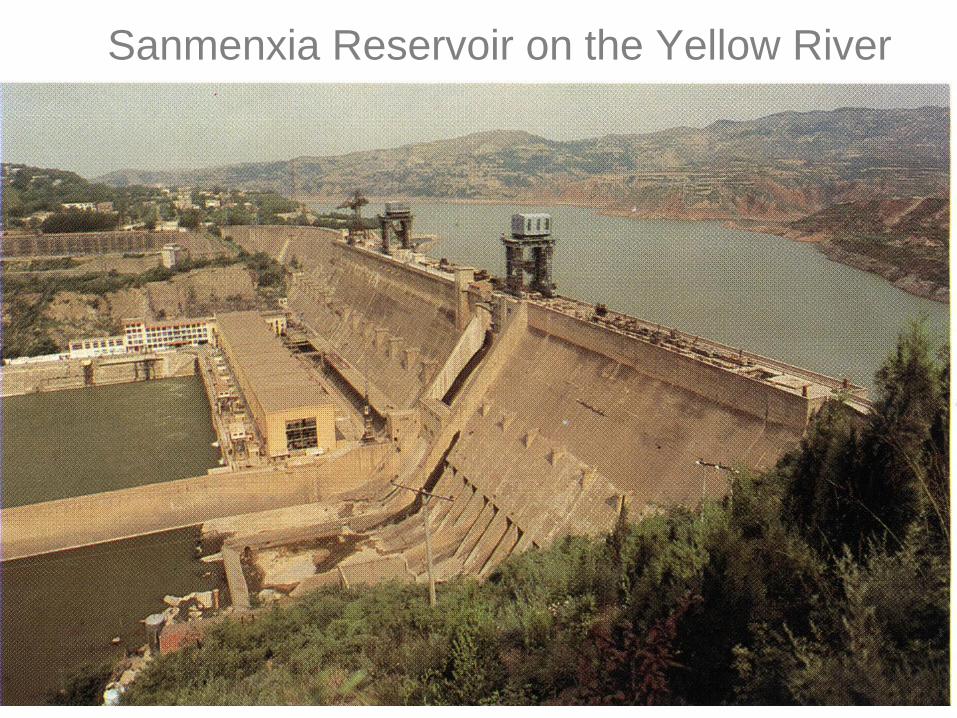
Sanmenxia Reservoir on the Yellow River
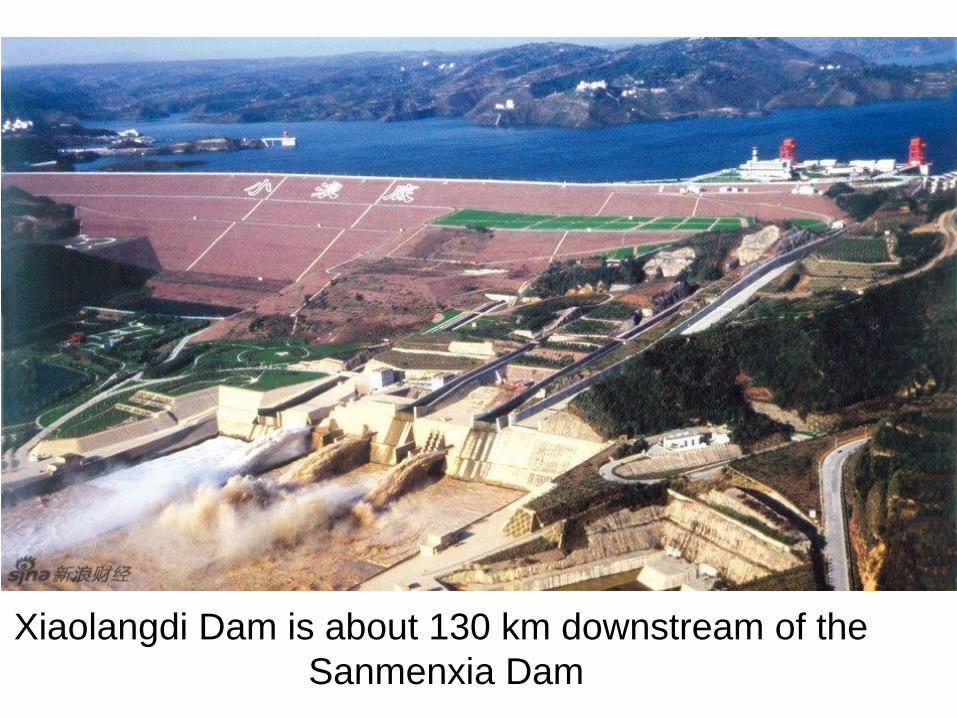
Xiaolangdi Dam is about 130 km downstream of the
Sanmenxia Dam
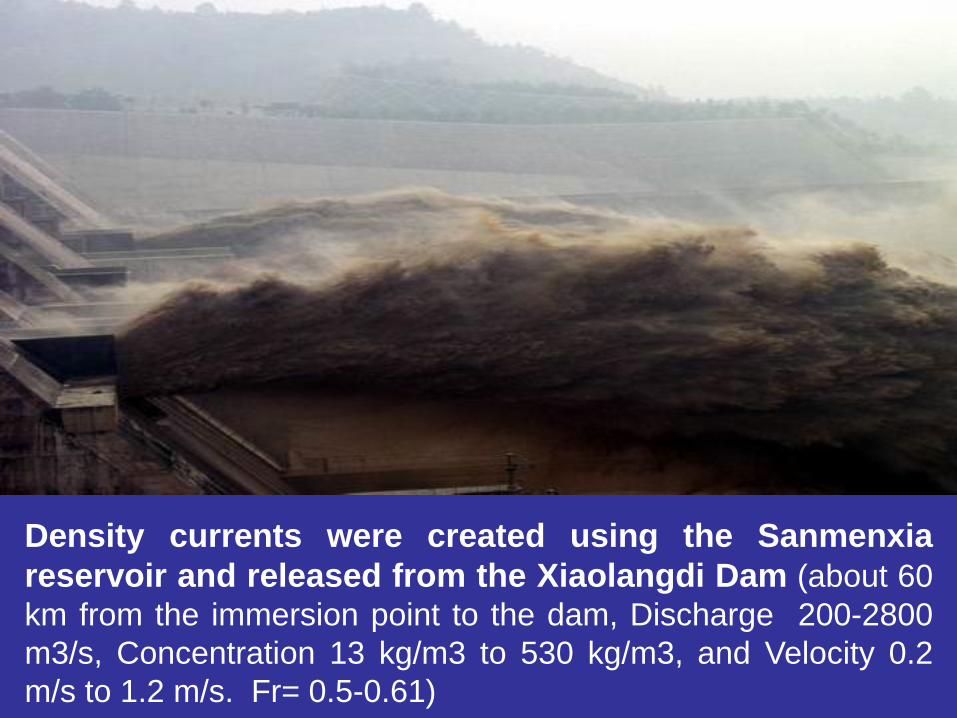
Density currents were created using the Sanmenxia
reservoir and released from the Xiaolangdi Dam (about 60
km from the immersion point to the dam, Discharge 200-2800
m3/s, Concentration 13 kg/m3 to 530 kg/m3, and Velocity 0.2
m/s to 1.2 m/s. Fr= 0.5-0.61)
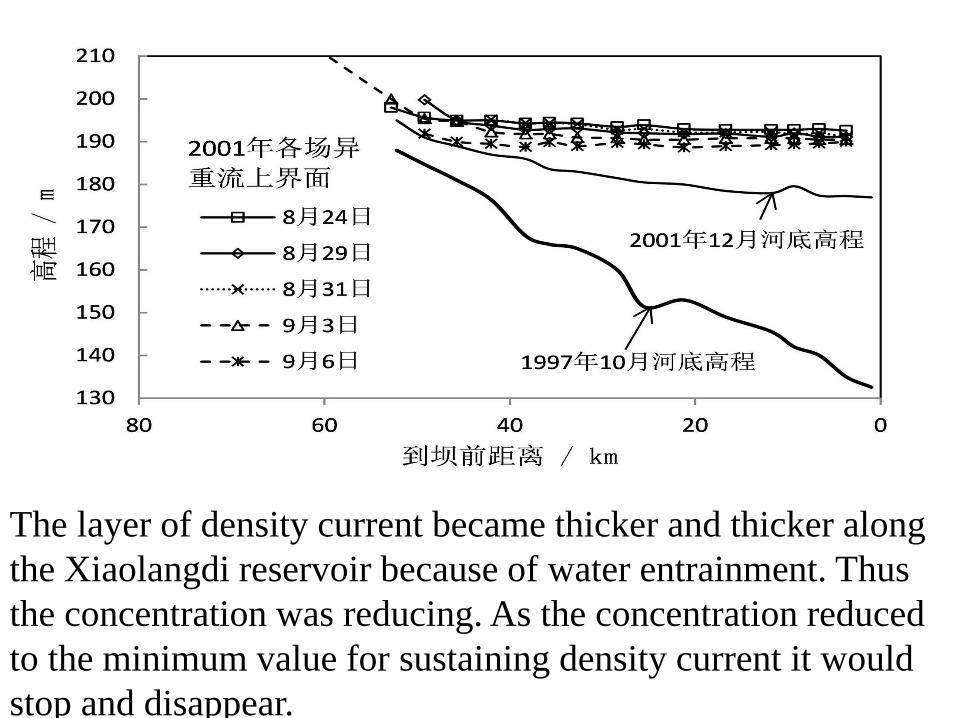
The layer of density current became thicker and thicker along
the Xiaolangdi reservoir because of water entrainment. Thus
the concentration was reducing. As the concentration reduced
to the minimum value for sustaining density current it would
stop and disappear.
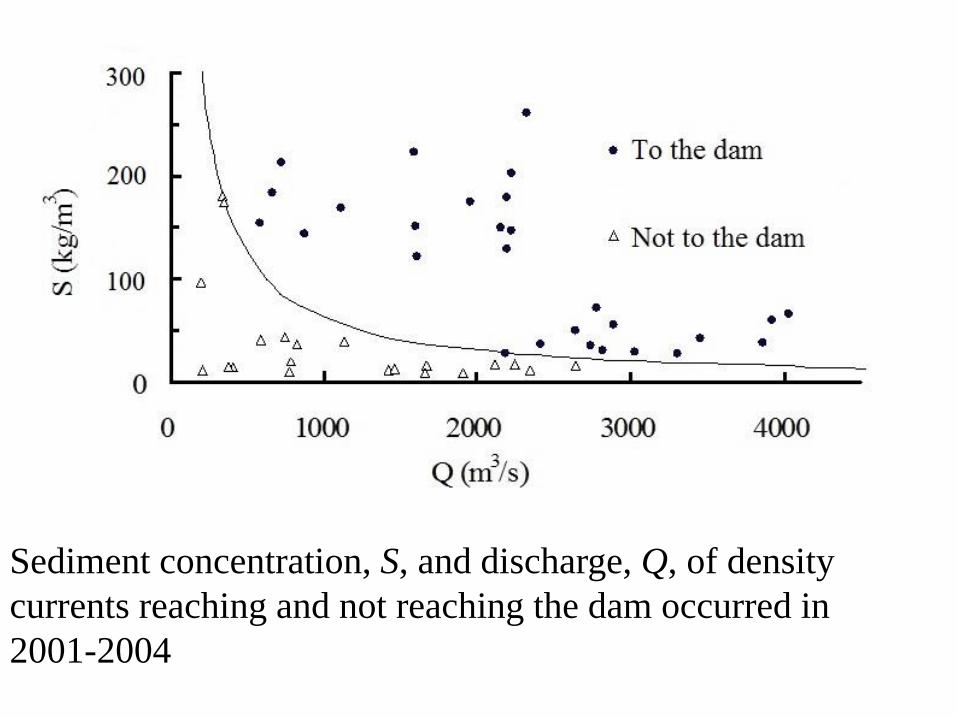
Sediment concentration, S, and discharge, Q, of density
currents reaching and not reaching the dam occurred in
2001-2004
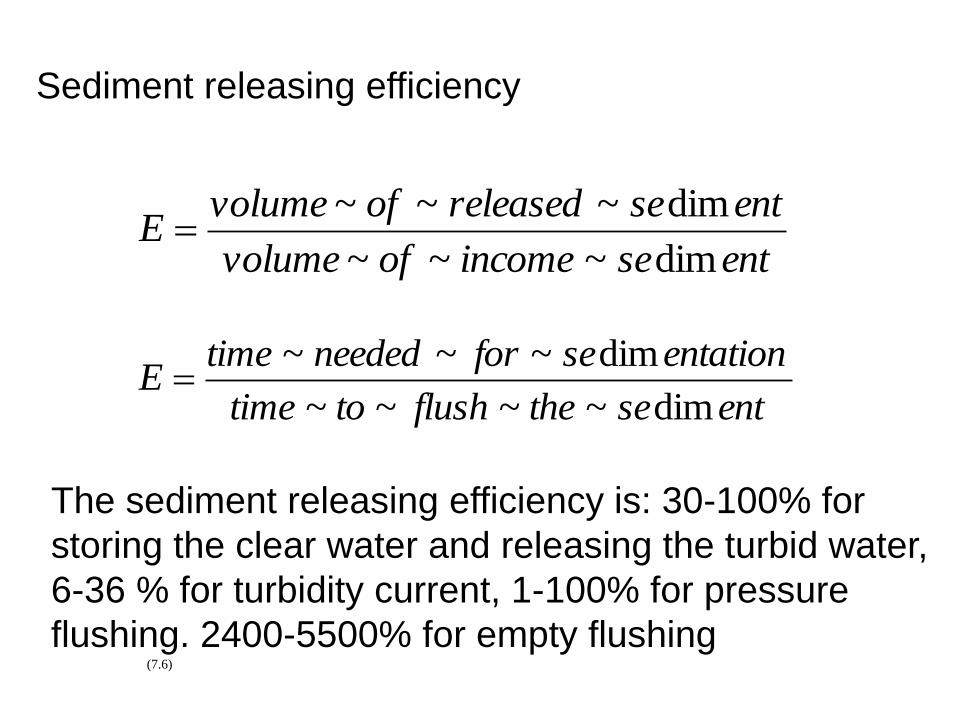
entseincomeofvolume
entsereleasedofvolumeE
dim~~~
dim~~~
entsetheflushtotime
entationseforneededtimeE
dim~~~~
dim~~~
The sediment releasing efficiency is: 30-100% for
storing the clear water and releasing the turbid water,
6-36 % for turbidity current, 1-100% for pressure
flushing. 2400-5500% for empty flushing (7.6)
Sediment releasing efficiency
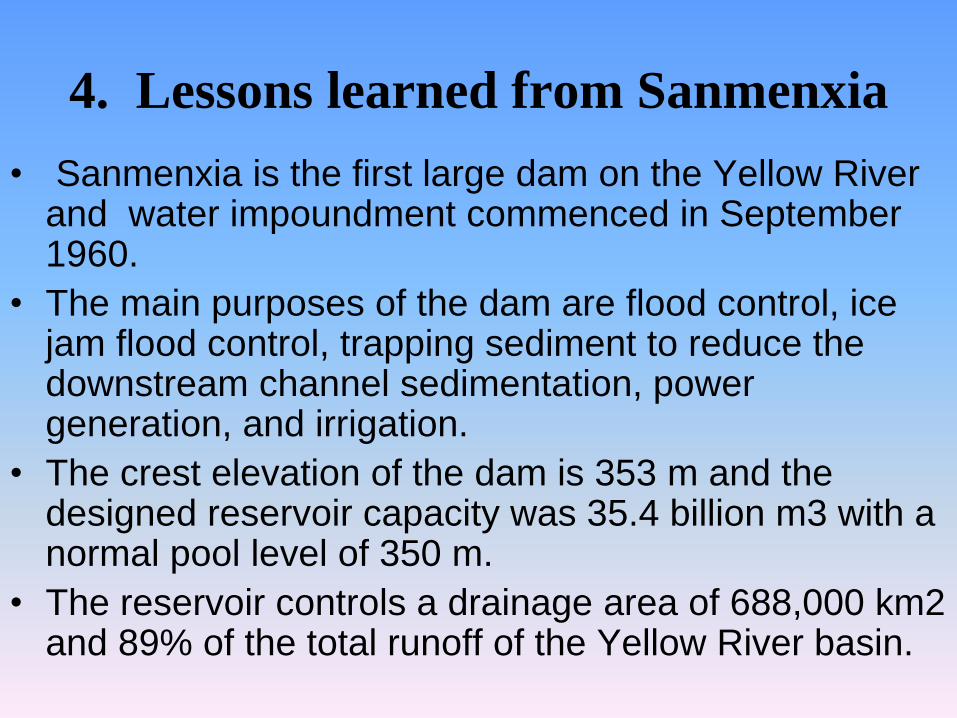
4. Lessons learned from Sanmenxia
• Sanmenxia is the first large dam on the Yellow River and water impoundment commenced in September 1960.
• The main purposes of the dam are flood control, ice jam flood control, trapping sediment to reduce the downstream channel sedimentation, power generation, and irrigation.
• The crest elevation of the dam is 353 m and the designed reservoir capacity was 35.4 billion m3 with a normal pool level of 350 m.
• The reservoir controls a drainage area of 688,000 km2 and 89% of the total runoff of the Yellow River basin.
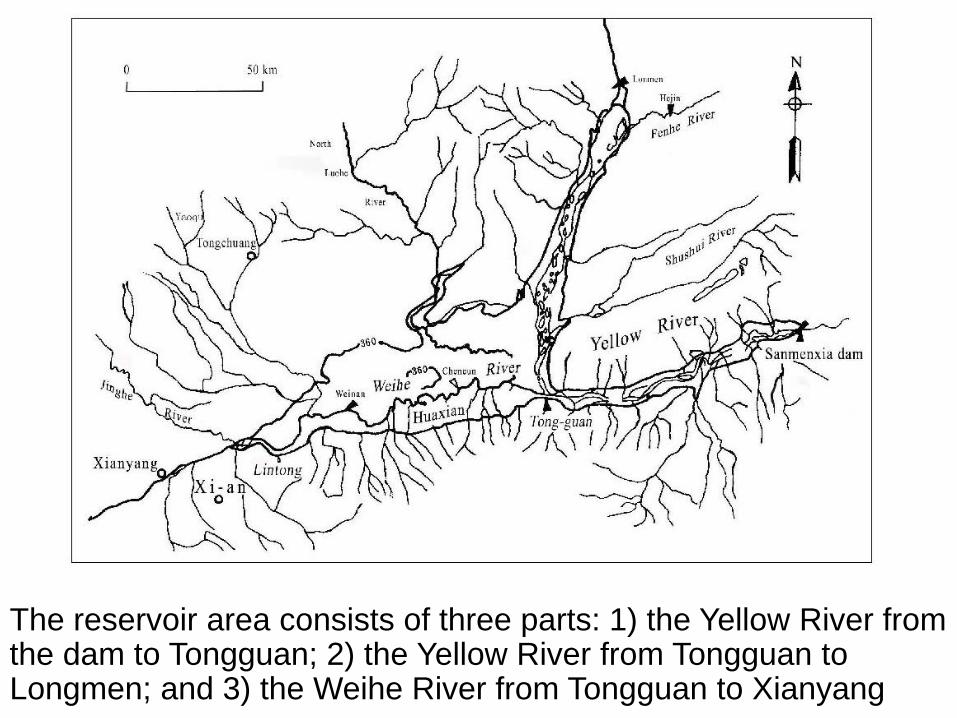
The reservoir area consists of three parts: 1) the Yellow River from the dam to Tongguan; 2) the Yellow River from Tongguan to Longmen; and 3) the Weihe River from Tongguan to Xianyang
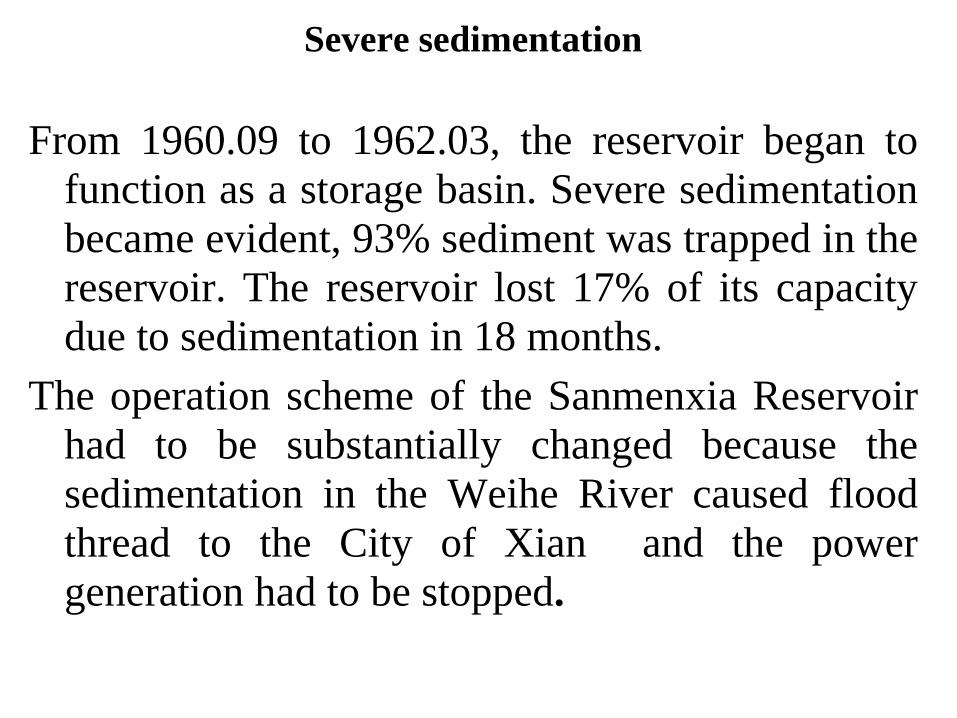
Severe sedimentation
From 1960.09 to 1962.03, the reservoir began to
function as a storage basin. Severe sedimentation
became evident, 93% sediment was trapped in the
reservoir. The reservoir lost 17% of its capacity
due to sedimentation in 18 months.
The operation scheme of the Sanmenxia Reservoir
had to be substantially changed because the
sedimentation in the Weihe River caused flood
thread to the City of Xian and the power
generation had to be stopped.
0.0
0.5
1.0
1.5
2.0
2.5
3.0
3.5
4.0
1955 1960 1965 1970 1975 1980 1985 1990 1995 2000 2005
Time (year)
Accu
mu
late
d d
ep
osi
tio
n (
109
m3)
Tongguan to dam
Longmen to Tongguan
Lower Wei River
(a)
0
1
2
3
4
5
6
7
1960 1965 1970 1975 1980 1985 1990 1995
Time (year)
Rese
rvo
ir s
tora
ge c
ap
acit
y (
109
m3)
Elevation < 330 m
Elevation < 323 m
(b)
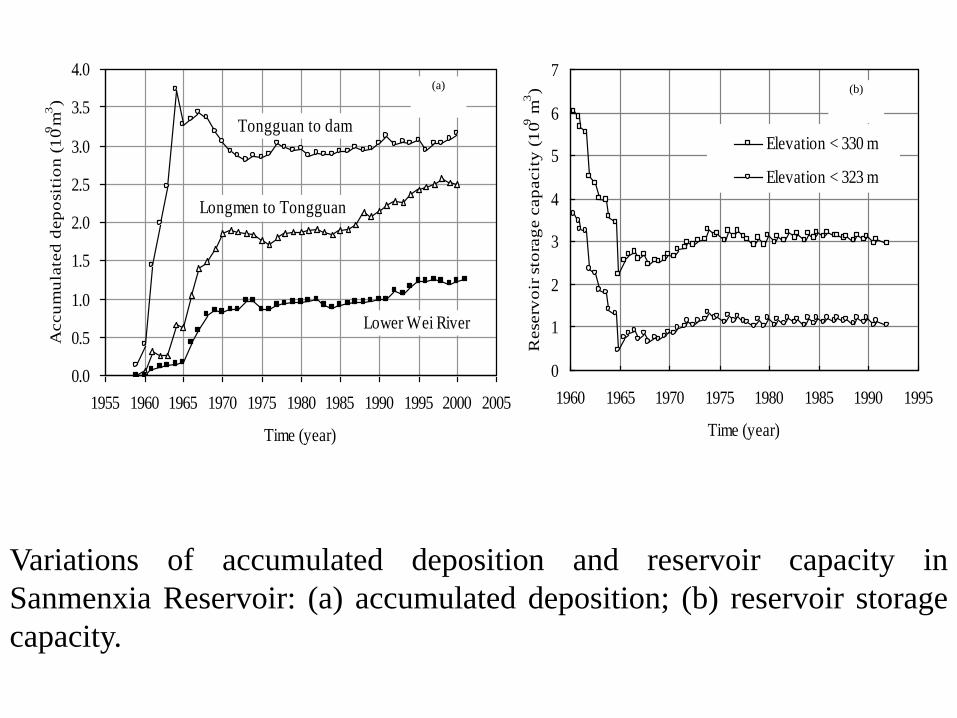
Variations of accumulated deposition and reservoir capacity in
Sanmenxia Reservoir: (a) accumulated deposition; (b) reservoir storage
capacity.
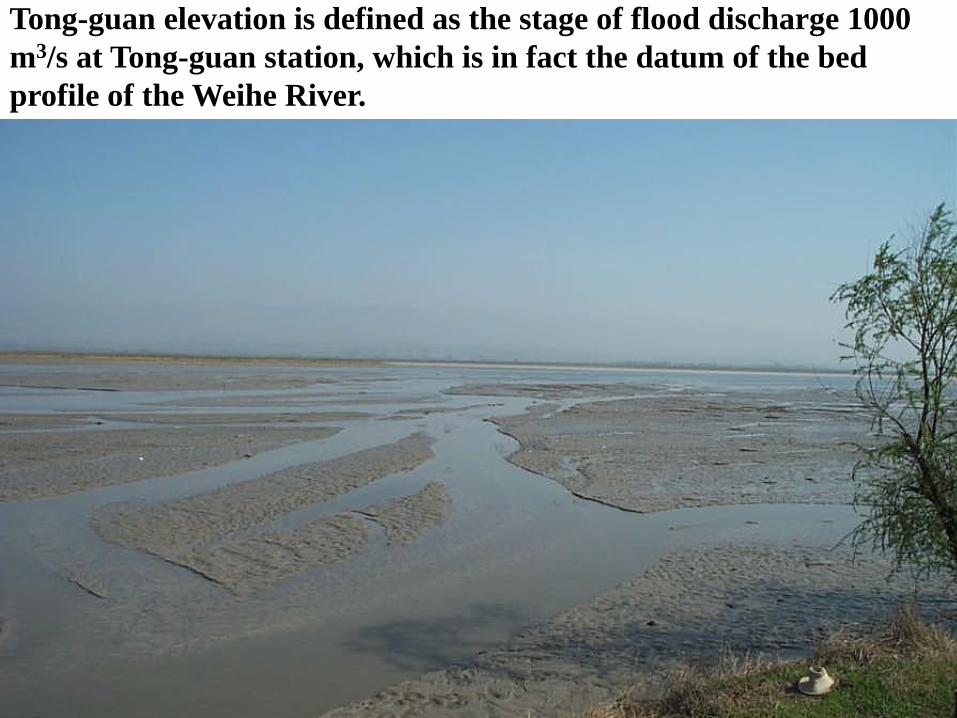
Tong-guan elevation is defined as the stage of flood discharge 1000
m3/s at Tong-guan station, which is in fact the datum of the bed
profile of the Weihe River.
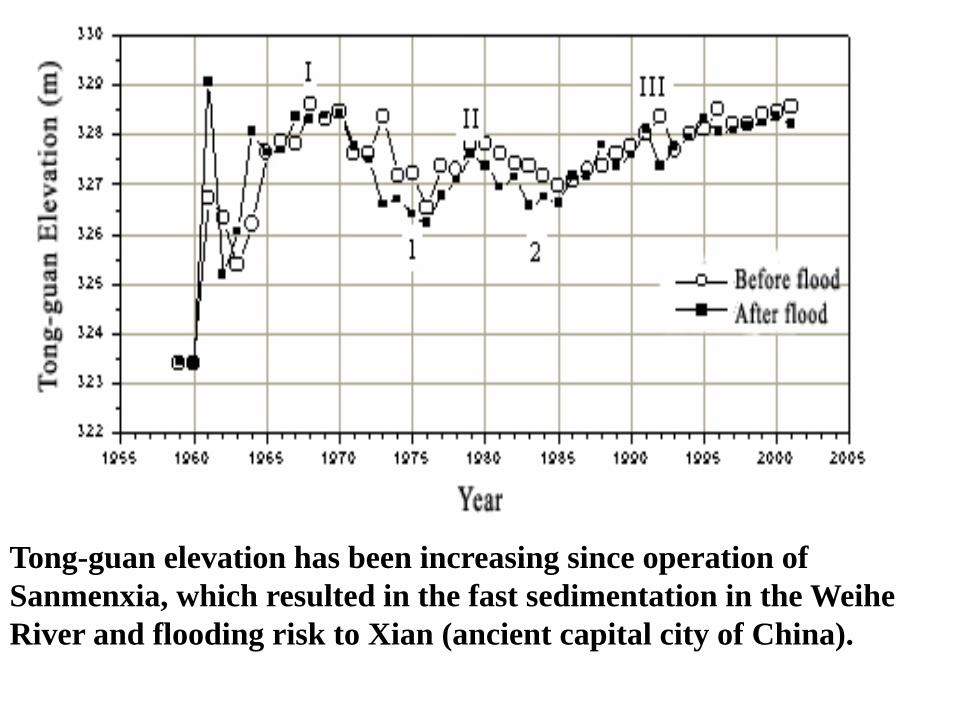
Tong-guan elevation has been increasing since operation of
Sanmenxia, which resulted in the fast sedimentation in the Weihe
River and flooding risk to Xian (ancient capital city of China).
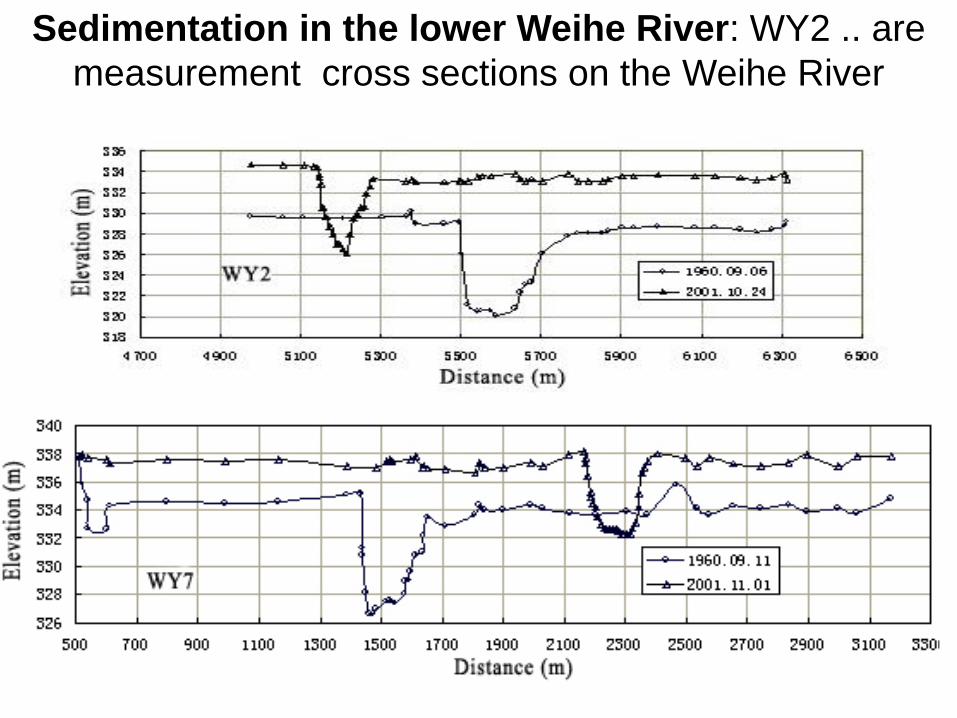
Sedimentation in the lower Weihe River: WY2 .. are
measurement cross sections on the Weihe River
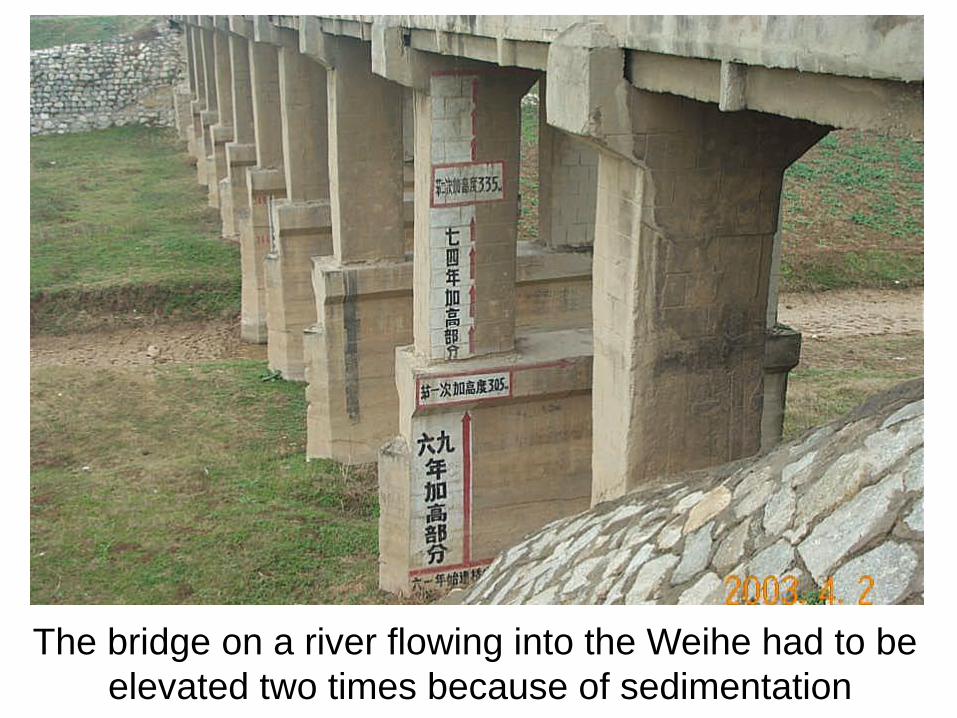
The bridge on a river flowing into the Weihe had to be
elevated two times because of sedimentation
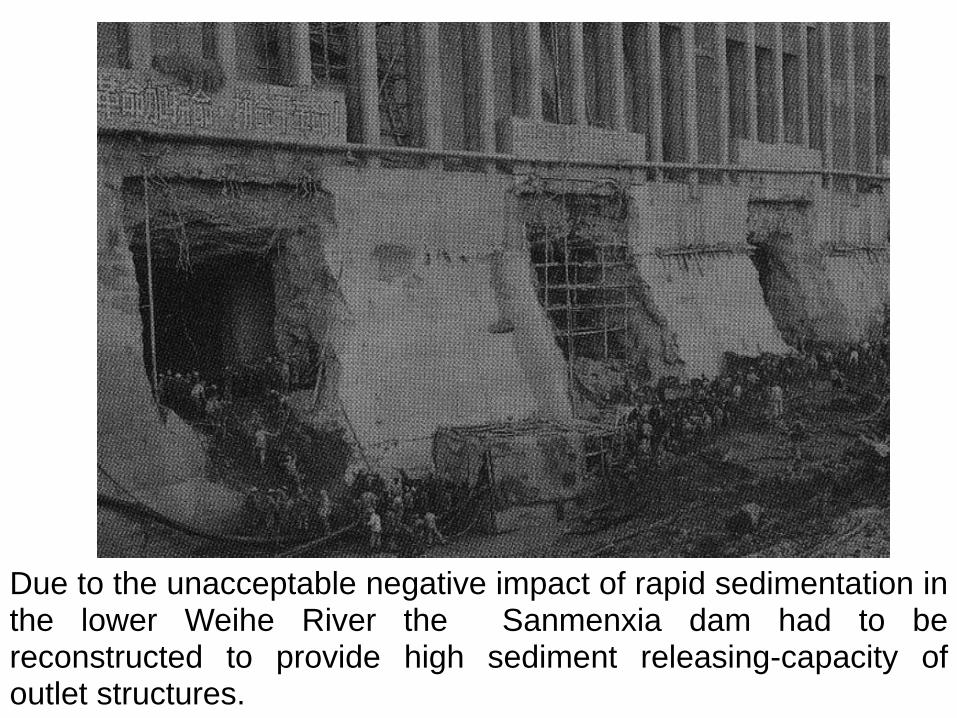
Due to the unacceptable negative impact of rapid sedimentation inthe lower Weihe River the Sanmenxia dam had to bereconstructed to provide high sediment releasing-capacity ofoutlet structures.
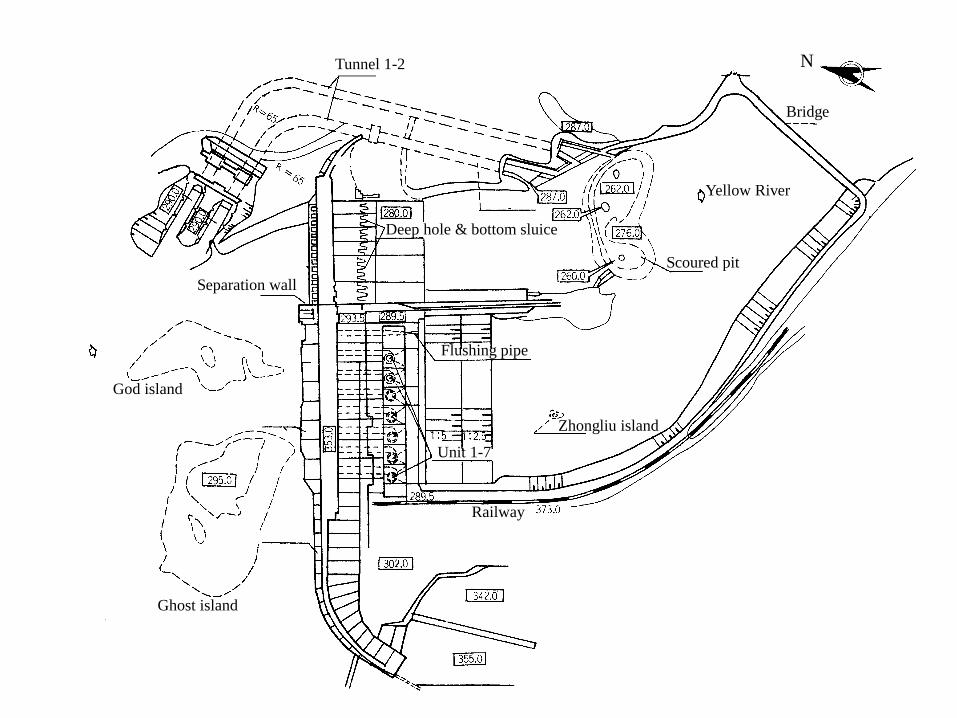
Tunnel 1-2
Ghost island
God island
N
Bridge
Railway
Separation wall
Yellow River
Zhongliu island
Flushing pipe
Unit 1-7
Scoured pit
Deep hole & bottom sluice
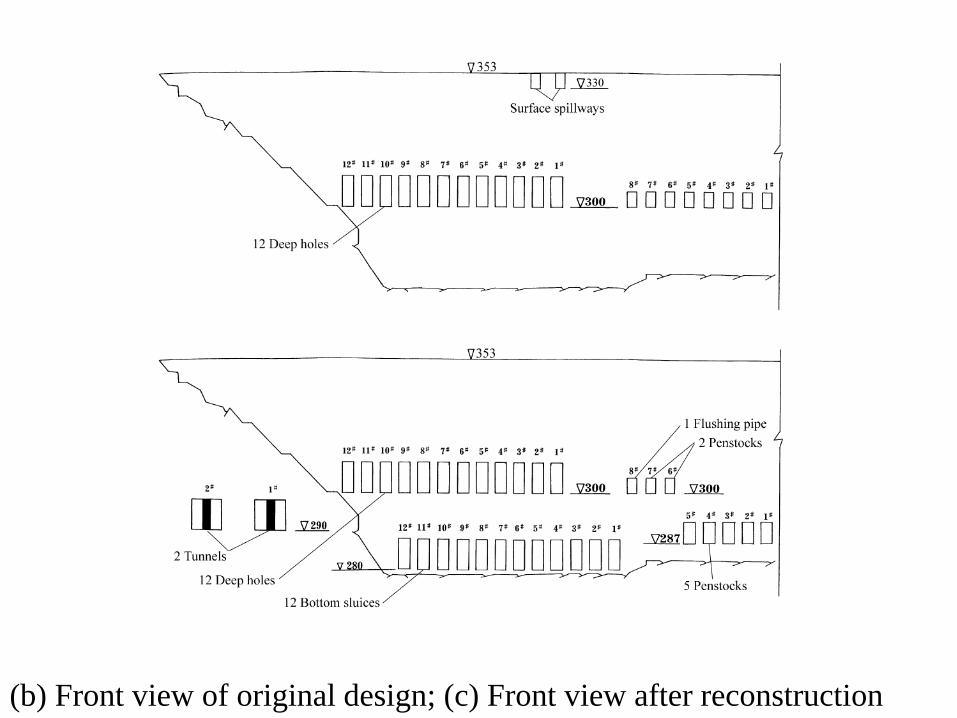
(b) Front view of original design; (c) Front view after reconstruction
295
300
305
310
315
320
325
330
335
0 50 100 150 200 250 300 350
Time (day)
Ele
vatio
n (m
) kk
11 12 1 2 3 4 5 6 7 8 9 10
1974-2001
1960-1961
1963-1973
month
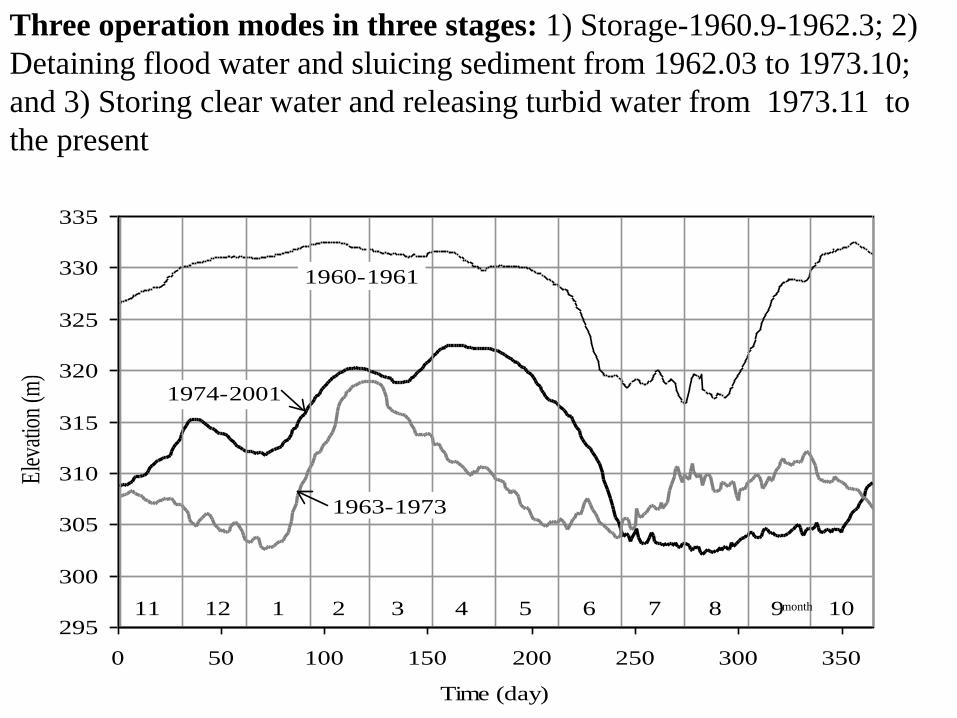
Three operation modes in three stages: 1) Storage-1960.9-1962.3; 2)
Detaining flood water and sluicing sediment from 1962.03 to 1973.10;
and 3) Storing clear water and releasing turbid water from 1973.11 to
the present
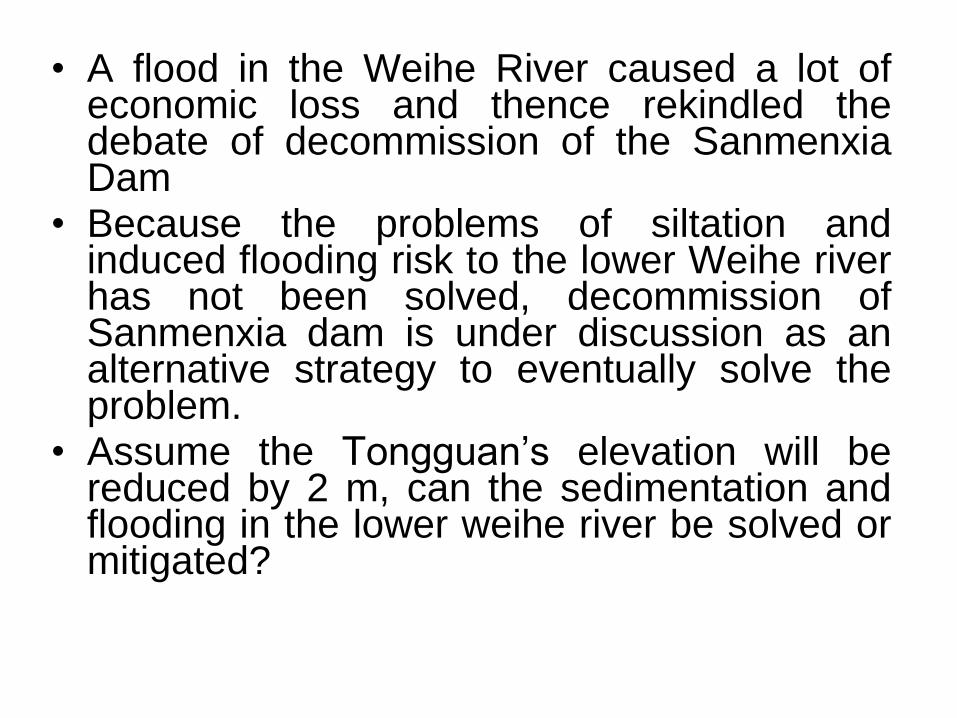
• A flood in the Weihe River caused a lot ofeconomic loss and thence rekindled thedebate of decommission of the SanmenxiaDam
• Because the problems of siltation andinduced flooding risk to the lower Weihe riverhas not been solved, decommission ofSanmenxia dam is under discussion as analternative strategy to eventually solve theproblem.
• Assume the Tongguan’s elevation will bereduced by 2 m, can the sedimentation andflooding in the lower weihe river be solved ormitigated?
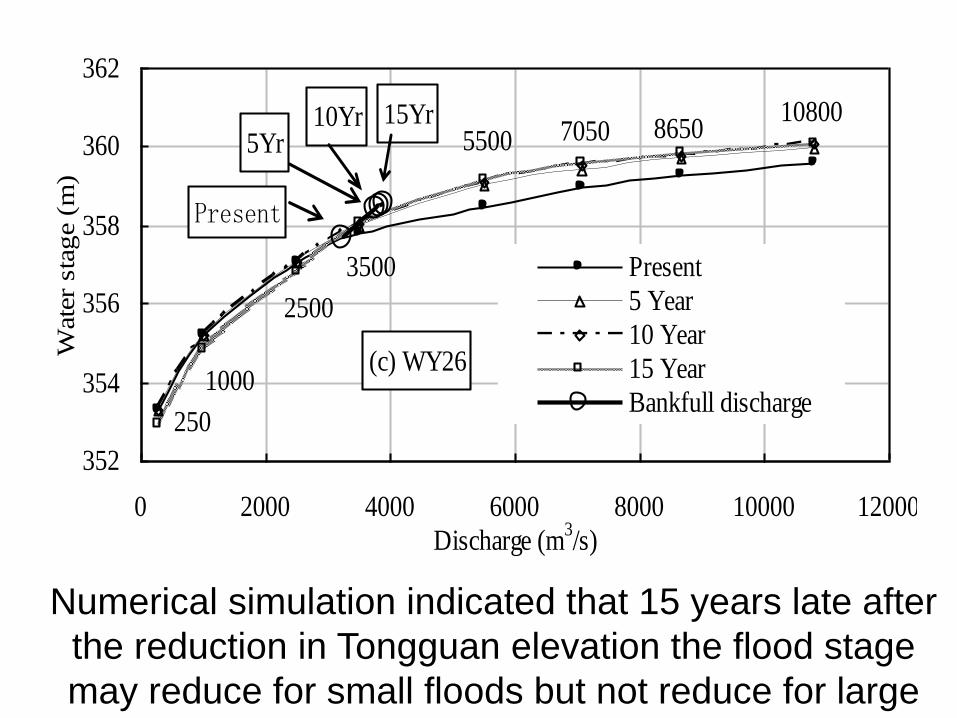
(c) WY26
250
1000
2500
5500
3500
10800865070505Yr
10Yr
Present
15Yr
352
354
356
358
360
362
0 2000 4000 6000 8000 10000 12000
Discharge (m3/s)
Wate
r sta
ge (
m)
Present
5 Year
10 Year
15 Year
Bankfull discharge
Numerical simulation indicated that 15 years late after
the reduction in Tongguan elevation the flood stage
may reduce for small floods but not reduce for large
floods
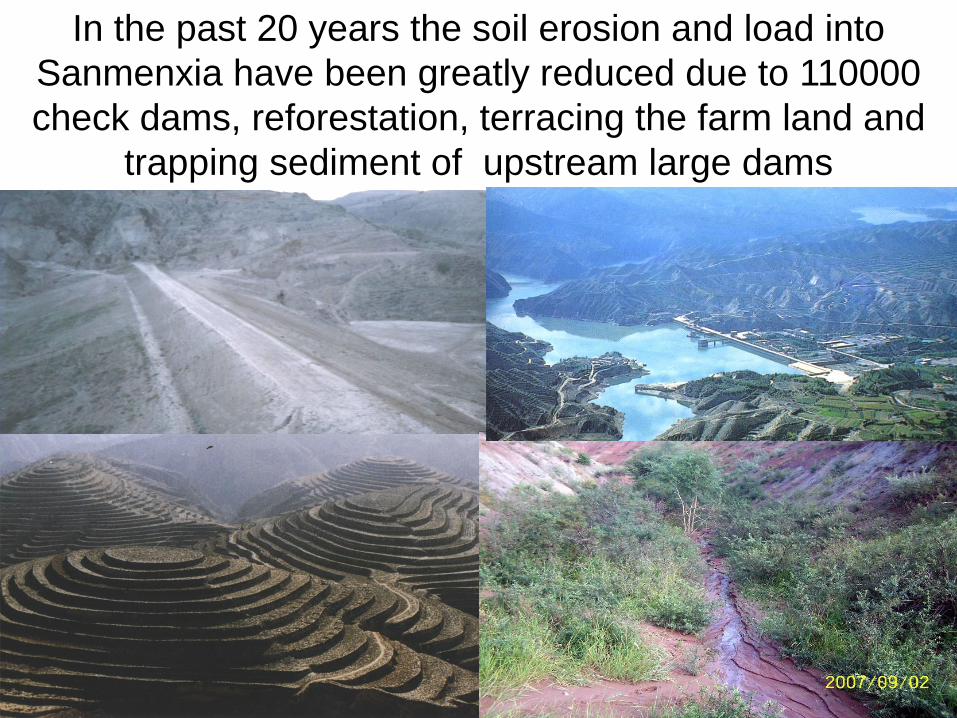
In the past 20 years the soil erosion and load into
Sanmenxia have been greatly reduced due to 110000
check dams, reforestation, terracing the farm land and
trapping sediment of upstream large dams
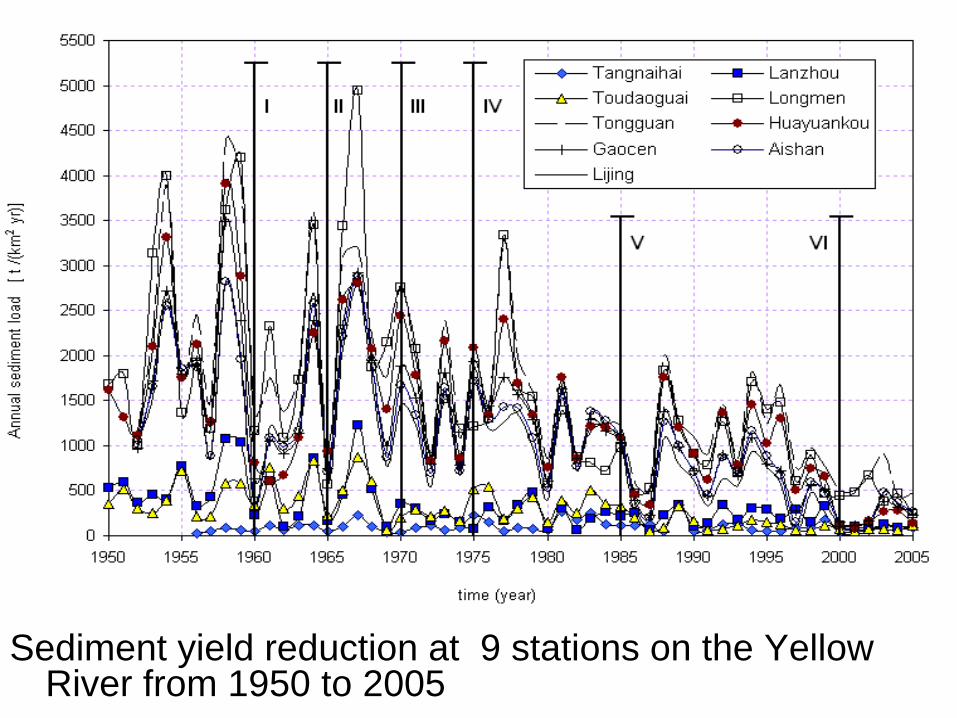
Sediment yield reduction at 9 stations on the Yellow River from 1950 to 2005
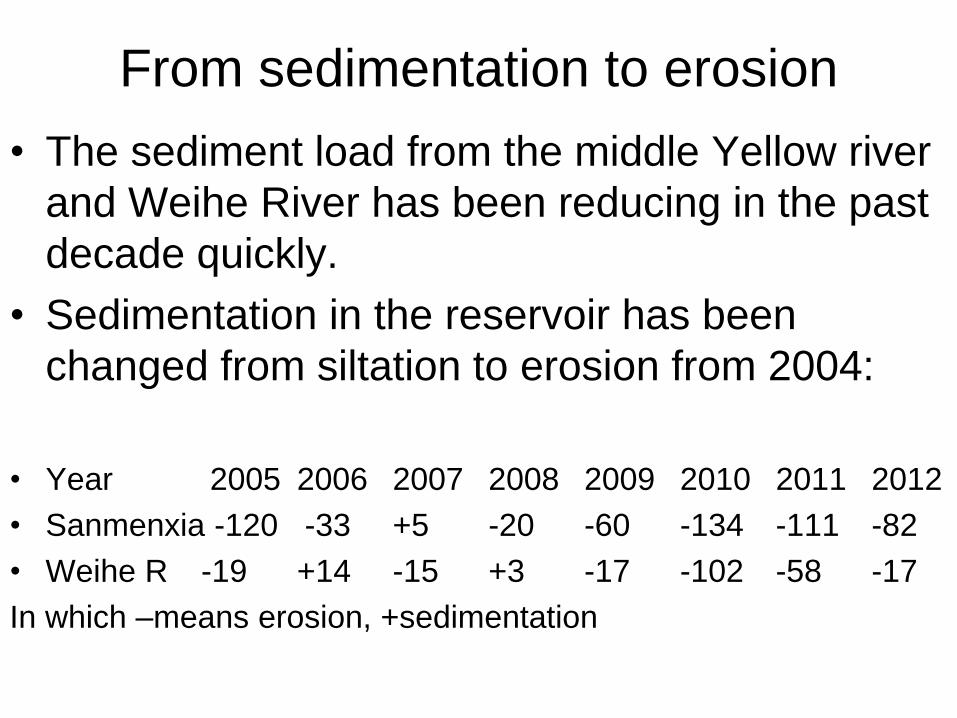
From sedimentation to erosion
• The sediment load from the middle Yellow river
and Weihe River has been reducing in the past
decade quickly.
• Sedimentation in the reservoir has been
changed from siltation to erosion from 2004:
• Year 2005 2006 2007 2008 2009 2010 2011 2012
• Sanmenxia -120 -33 +5 -20 -60 -134 -111 -82
• Weihe R -19 +14 -15 +3 -17 -102 -58 -17
In which –means erosion, +sedimentation
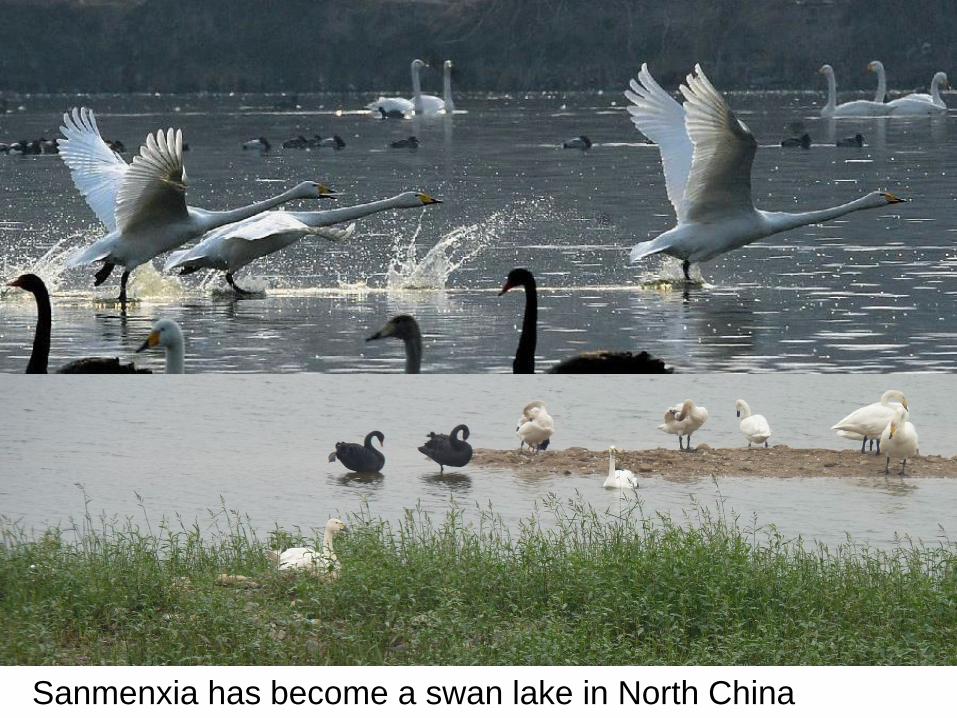
Sanmenxia has become a swan lake in North China
Future of Sanmenxia
Sanmenxia has become the swan lake of
Chine. More than 20000 white and black
swans spent 6 months in the reservoir.
Great sediment reduction make it possible to
operated the reservoir at higher level.
It is possible for the reservoir capacity to be
restored and the operation mode may be
adjusted to achieve its planned benefit.
Conclusions 1
• Soil erosion reduction is the essential strategy
for reservoir sedimentation control.
• For a reservoir watershed there are two
possibilities: C-status- vegetation developing
and erosion reducing and A-status - vegetation
deteriorating and erosion increasing.
• Human may change the reservoir watershed
from A-status into C-status.
Conclusions 2• Reservoir sedimentation may be controlled by
applying the strategies of storing the clear and releasing the turbid; releasing density currents; flushing and dredging.
• The sediment releasing efficiency is:
30-100% for storing the clear and releasing the turbid; 6-20 % for density current; 2400-5500% for empty flushing.
• Storing the clear and releasing the turbid is the best strategy to control reservoir sedimentation while achieving hydro-power benefit and maintain ecological stability.