Embed Size (px)
Citation preview
VOLUME 10 NOM OR 2 SEPTEMBER 2011 ISSN 1412-3789
M B
MANAJEMEN BISNIS BERKALA ILMIAH
Terakreditasi dengan SK Dikti No.: 51/Dikti/Kep/2010
J.E. Sutanto Christian Yohandoyo
M. lrhas Effendi
Suyanto
Apriani Dorkas Rambu Atahau Supatmi
Boge Triatmanto
Maria Patricia Gautama Jony Oktavian Haryanto
Grace T. Pontoh
Rudy Aryanto
B. Linggar Yekti Nugraheni
Jilly Jo Haryanto Andy Susilo Lukito Budi
Perbandingan Harapan Konsumen Merek Sepeda Motor Suzuki dan Honda dalam Aspek Produk, Harga, Saluran Distribusi dan Promosi
Elemen Intangible Organisasi dan Kinerja Organisasi :. Kajian Empiris Resource Based Views pada Organisasi Pemerintahan Daerah
Foreign Ownership, Productivity, and Economic Crisis
The Effect of Board Diversity on Financial Performance of Employer's Pension Fund
Pemberdayaan Sumber Daya Manusia, Resiliensi Organisasi dan Kinerja Organisasi pada lndustri Jasa
The Effect of Consumer Factors and Store Image Which Is Moderated by PLB Image Towards PLB Purchase Intention
Examining A Model of Information Technology Acceptance by Users of Enterprise Resource Planning
Factor Analysis to Guest Satisfaction Qifferentiated by Income Segment
The Effect of Negative Earnings Towards Value Relevance of Accounting Numbers
Student Parent Perception Towards Consumer Based Brand Equity
TIM PE~YUNTil\G MANAJEMEN & BISNIS
BERKA LA ILMIAH
Ketua Penyunting Putu Anom Mahadwartha
PcnyuntinJ?; Pclaksana Siti Rahayu
Sckrctaris Tim Pcnyunting Erna Andajani
Anggota Tim Pcnyunting Liliana Inggrit Wijaya
Dudi A nandya Dcddy Marciano Elsye Tandelilin
Werner R. Murhadi Christina Rahardja Honantha
Bobby Wijanarko
Alamat Tim Penyunting Gcdung EC., lantai I. Jurusan Mana,Jemen
Fakultas Risnis dan Ekonomika, Umversitas Surabaya Jl. Raya Kali Rungkut, Surabaya 60293
Phone. 1 62 31 298-1139; 298-1199 Fax. +62 31 298-1131; 298-1129
Email: manajemcn __ [email protected] [email protected]
J .E. Sutanto Chri<aian Yohandoyo
M. lrhas Effendi
Suyanto
Apriani Dorkas Rambu Atahau Supatmi
Rogc Triatmanto
Maria Patricia Gautama Jony Oktavian Haryanto
Grace T. Pontoh
Rudy Aryanto
R. Linggar Yekti Nugrahcni
Jilly Jo Haryanto Andy Susilo Lukito Budi
DAFTAR lSI
Pcrhandingan Harapan Konsumcn Merck Sepeda Motor Suzuki dan Jlonda dalam Aspek Produk. Harga, Saluran Distribusi dan Promosi Elcmcn ln!angihlc Organisasi dan Kinc~ja Organisa.si: Kajian Empiris Resource Based Vinvs pada Organisast Pemcrintahan Dacrah
Foreign Ownership, Productivity, and Economic Crisis
The Effect of Board Diversity on Pinancial Performance of Employer's Pension Fund
Pcmberdayaan Sumher Daya Manusia, Resiliensi Organisasi dan Kincrja Organisasi pada lndustri Jasa The Effect of Consumer factors and Store Image Which Is Moderated hy PLB Image Towards PI ,B Purchase Intention
Examining A Model of Information Technology Acceptance hy Users of Enterprise Resource Planning
Factor Analysis to Guest Satisfaction Differentiated by Income Segment
The Effect of Negative Earnings Towards Value Relevance of Accounting Nun1bcrs
Student Parent Perception Towards Consumer Rased Brand Equity
143-155
I 56-176
177-191
192-200
201-216
217-231
232-242
243-25 I
252-265
266-276
Ucapan Terima Kasih
Tim Penyunting MABIS menyampaikan terima kasih sebesar-besarnya kepada para Mitra Bebestari. Bantuan para Mitra Bebestari sangat bermanfaat dalam menjaga dan mendorong peningkatan kualitas artikel ilrniah pada setiap penerbitan MABIS. Mitra Bebertari yang membantu MABIS dalam proses review scbanyak 44 orang. Mitra Bebestari MABIS berasal dari institusi pendidikan dan bisnis di Indonesia, Hongkong Inggris, dan Amerika Serikat, bergelar Doktor dan Guru besar. Proses review yang cukup selektif membuat tingkat penerimaan MABIS saat tcrbitan ini dibuat mencapai angka perbandingan 1:3. Hal ini semata-mata demi menjaga kualitas berkala ilmiah ini.
Ucapan terima kasih khususnya disampaikan kepada Mitra Bebestari yang membantu proses seleksi artikel untuk terbitan kali ini. Para Mitra Bebestari yang membantu proses review edisi ini adalh:
I. Joniarto Parung (Universitas Surabaya) 2. lin Mayasari (Universitas Paramadina) 3. Dudi Anandya (Universitas Surabaya) 4. Andi Ilham Said (PPM Jakarta) 5. Fitri lsmiyanti (Universitas Airlangga) 6. Werner Ria Murhadi (Universitas Surabaya) 7. Suci Paramitasari Syahlani (Universitas Gajah Mada) 8. Heru Kurnianto (Universitas Muhammadyah) 9 . Noerrnijati (Universitas Brawijaya) I 0. Putu A nom M (Universitas Surabaya) 11. Deddy Marciano (Universitas Surabaya) 12. Moses L. Singgih (Institut Teknologi Sepuluh Nopember Surabaya) 13. Mamduh M Hanafi (Universitas Gajah Mada) 14. Hartono (Universitas Sebelas Maret) 15. Asnan Furinto (Bina Nusantara) 16. Iyus Wiadi (Universitas Paramadina)
KEBIJAKAN TIM PENYUNTING DAN PEDOMAN PENULISAN
KEBIJAKAN TIM PENYUNTING Manajemen & Bisni- (MABIS) adalah berkala ilmiah atau jumal terakreditasi dengan SK
Dikti No: 5l/Dikti/Kep/2010, 5 luli, 2010. Tujuan utama dari berkala ilmiah ini untuk mengembangkan ilmu pengetahuan dan praktik dibidang Manajemen dan Bisnis. Selain itu jumal MABIS akan menjadi wadah desiminasi hasil penelitian para peneliti, akademisi, dan praktisi. Dewan Redaksi MABIS men gun dang periset, akademisi, praktisi, dan pemerhati bidang Manajemen dan Bisnis untuk mengirimkan artikel empirik maupun normatif. Melalui MABIS maka para peneliti, akademisi, praktisi, dan pemerhati bidang Manajemen dan Bisnis dapat menyebarluaskan ide, pendapat maupun temuan ilmiah dengan komunitas masyarakat Manajemen dan Bisnis. MABIS merupakan jembatan penghubung antara praktik dan teori dibidang Manajemen dan Bisnis.
MABIS diperkuat oleh para mitra bestari dari dalam dan luar negeri sehingga menjamin kualitas terbitan, dan mendukung semangat globalisasi dalam pengembangan ilmu pengetahuan dan praktik Manajcmen dan Bisnis. MABIS terbit sejak 2002, dan dipublikasikan dua kali dalam satu tahun (Maret dan September) dan berisikan sepuluh artikel empirik atau normatif. Hal ini akan menjamin artikel yang dipublikasikan selalu terbarukan dalam isu, argumen, analisis maupun data. Proses review adalah Blind Review, dengan Peer Group Review.
Artikel dapat dikirimkan ke alamat Tim Penyunting dalam bentuk hardcopy dan softcopy serta dilampirkan riwayat hidup penulis. Artikel dalam bahasa Inggris lebih diutamakan setelah memperhatikan kualitas artikel. Artikel belum pemah dipublikasikan pacta jumal ilmiah lainnya. Artikel haruslah artikel empirik (lebih diutamakan) atau normatif dibidang Manajemen dan Bisnis. Khusus untuk artikel normatif, penulis harus mencantumkan proposisi dan argumen serta rencana penelitian untuk pembuktian proposisi tersebut. Tim penyunting berhak merevisi gaya selingkung sesuai aturan penulisan jumal ilmiah dan kaidah bahasa yang baik dan benar dengan catatan perubahan terse but tidak mengubah maksud ataupun kualitas artikel. Detail instruksi penulisan terdapat pada pedoman penulisan. Proses berlangganan MABIS dilakukan dengan mengirimkan permohonan berlangganan. Ketentuan berlangganan sebagai berikut: 1. Versi Hardcopy: Rp50.000,-/nomor 2. Berlangganan selama 1 tahun: RplOO.OOO,-/tahun untuk 2 nomoi. 3. Permohonan berlangganan (sesuai dengan isian pada form berlangganan) dapat dikirim
ke kantor MABIS melalui email, telepon, ataupun fax. 4. Selanjutnya transfer dana berlangganan ke:
BCA (Bank Central Asia) KCU Darmo, Surabaya a/n Dudi Anandya, No. Rekening : 0885491168
5. Permohonan akan diproses 3 hari kerja setelah transfer dana dikonfirmasi.
PEDOMAN UMUM 1. Paper dijamin keasliannya oleh penulis dan tidak pemah dipublikasikan sebelumnya. 2. Paper haruslah empirik (lebih diprioritaskan) atau normatif dengan proposisi dan rencana
penelitiannya. Paper dengan bahasa Inggris lebih diutamakan. 3. Proses review dilaksanakan secara blind-review dengan peer group review. 4. Fee penyerahan (submission): Rp250.000; tidak dapat dikembalikan 5. Fee publikasi: Rp500.000
PEDOMAN PENULISAN
I. Page setup: marjin atas 2,5em; bawah 2,5em; kiri 2,25em, dan kanan 2,25em 2. Ukuran kertas: A4. 3. Font standar adalah Times New Roman (TNR) dengan ukuran 12pt. 4. Ukuran font Judul artikel adalah TNR 14pt. 5. Judul untuk Sub-bagian, dan sub-sub-bagian, ditentukan oleh penulis. 6. Sete lahjudul diikuti dengan nama penulis (tanpa gelar) dengan TNR 12pt 7. Dibawah nama penulis, dieantumkan instansi, dan alamat email penulis, dengan TNR ~ 1 pt. 8. lnden untuk paragraf adalah I em dan I spasi. 9. Total halaman tidak melebihi 25 halaman, termasuk daftar pustaka, dan apendiks (jika ada). I 0. Abstrak dalam dua bahasa yaitu lnggris dan Indonesia. Abstrak Bahasa Inggris lebih dahulu baru
kemudian abstrak bahasa Indonesia. Tulisan abstrak di eetak miring. II. Kata kunei atau keywords menyesuaikan dengan bahasa dalam isi artikel. Misalnya artikel dalam
bahasa Indonesia, maka kata kunei dan keywords dalam bahasa Indonesia, demikian sebaliknya. 12. Gunakan penomoran Arab untuk sub-bagian, dan sub-sub-bagian, misalnya: I. Latar Belakang
atau untuk sub-sub-bagian misalnya 1.1. Tu juan Penelitian. 13. Contoh tabel sebagai berikut:
Table 1. Judul Tabel Times New Roman 12pt, center, cetak tebal,' penomoran Arab dan Berurutan dengan Tabellainnya.
Tabel dapat berisikan catatan tabel, yang· biasanya berisi keterangan singkat tabel, dengan inden sesuai Iebar tabel. Font yang digunakan Times New Roman I I pt.
No Variabel 1 Ukuran Font 2 Ketentuan garis tabel
Nilai Font standard untuk isi label adalah maksimum 10 pt Times New Roman Tidak disarankan menggunakan garis batas vertikal, atau membuat terlalu banyak garis horisontal
Sumber: discbutkan sumber label, inden sesuai batas kiri tabel, dengan font adalah I 0 pt Times New Roman
14. Tabel hams dapat direvisi sehingga tidak disarankan menggunakan tabel dengan cara langsung copy dan paste dari hasil perhitungan statistik atau tabel dalam format object. Tabel sebaiknya ditulis kembali dan diisi data yang sesuai dengan pembahasan artikel.
15. Tabel tidak menggunakan wama. Bila tabel hams berwama, maka gunakanlah gradasi wama gray.
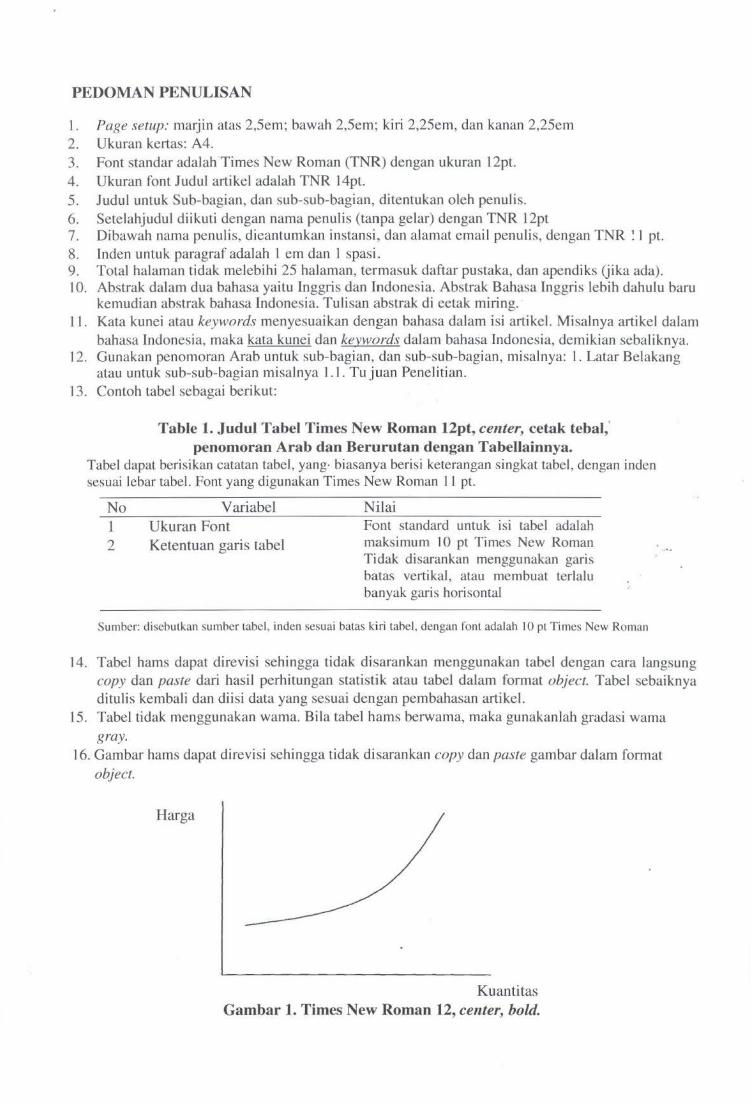
16. Gambar hams dapat direvisi sehingga tidak disarankan copy dan paste gambar dalam format object.
Harga
Kuantitas Gambar 1. Times New Roman 12, center, bold.
17. Gam bar secara keseluruhan menggunakan rata tengah ( aligment center). Gam bar tidak menggunakan wama. Bila gambar harus berwarna, maka gunakanlah gradasi wama gray. Judul gambar dengan penomoran Arab berurutan sesuai urutan gambar dalam artikel dan diletakan setelah gambar. Sumber gambar disebutkan pada bagian isi yang menjelaskan gambar tersebut. Font dalam gambar adalah Times New Roman dengan ukuran maksimum 11 pt.
18. Bila dirasakan perlu, maka catatan kaki (footnote) menggunakan penomoran Arab, berurutan, dan dengan Times New Roman font 9 pt.
19. Rujukan untuk artikel pada bagian isi artikel, contoh: Morek, Shleifer, dan Vishny (1988), atau (Morek, Shleifer, dan Vishny, 1988), a tau Morek et al. ( 1988), atau (Morek et al., 1988). Rujukan untuk working paper sarna dengan rujukan untuk artikel.
20. Rujukan untuk buku (buku teks) pada bagian isi artikel, contoh: Hair, Anderson, Tatham, dan Black ( 1995: 150), atau (Hair, Anderson, Tatham, dan Black, 1995: 150), atau Hair et al. (1995: 150), atau (Hair et al., 1995: 150).
21. Penulisan daftar pustaka dengan inden lcm setelah baris 1 dan tanpa nomor. Font adalah Times new roman 12 point, dengan urutan sesuai abjad. Daftar pustaka harus merujuk pada artikel terbitan terbaru, dengan usia terbit tidak lebih dari 10 tahun, kecuali untuk artikel yang bersifat seminal.
22. Bila penulis artikel yang dirujuk lebih dari satu, maka untuk penulis pertama dimulai dengan nama belakang, dan nama depan dan atau nama tengah dalam singkatan, dan untuk penulis kedua dan seterusnya nama depan dan atau tengah menggunakan singkatan, diikuti dengan nama belakang. Contoh daftar pustaka untuk artikel: Morek, R., A. Shleifer, dan R. Vishny, 1988, Management Ownership and Market Valuation:
An Empirical Analysis, Journal of Financial Economics 20,293-315. Contoh daftar pustaka untuk working paper/tesis/disertasi: Lins, K., 1999, Equity Ownership and Firm Value in Emerging Markets, Working Paper
tidak dipublikasikan, University of North Carolina. Lins, K., 1999, Equity Ownership and Firm Value in Emerging Markets, Tesis tidak
dipublikasikan, University of North Carolina. Contoh daftar pustaka untuk buku teks: Hair, J.F., R.E. Anderson, R.L. Tatham, dan W.e. Black, 1995, Multivariate Data Analysis,
· New Jersey: Prentice-Hall International, Inc. Contoh daftar pustaka untuk website bila terdapat pengarang:
Hair, 1M., 2006, Multinational Company Mutual Fund, http://www.infovesta.com/MF !index.j sp. Contoh daftar pustaka untuk website bila tidak terdapat pengarang: www.infovesta.com. 2006, http://www.infovesta.com/MF /index.jsp.
23. Bila terdapat rumus, maka tidak diperlukan penomoran rumus. Rumus atau karakter yang unik, diketik dengan menggunakan font symbol 12 pt. Misalnya: D, D, dan lainnya. Bila memungkinkan rumus dapat diketik dengan bantuan Microsoft Equation.
24. Penulis dapat mencantumkan Ucapan Terima Kasih atau Acknowledgement sebelum Daftar Pustaka.
25. Penulis disarankan merujuk pada 2 atau lebih artikel terbitan MABIS sebelumnya. 26. Mohon cantumkan Daftar Riwayat Hidup singkat pada bagian akhir artikel, dengan
keharusan untuk mencantumkan nomor teleponlhandphone, email, dan alamat korespondensi. Untuk contoh format artikel sesuai pedoman penulisan MABIS dapat diperoleh dengan menghubungi kantor Tim Penyunting melalui telepon, fax atau email MABIS: [email protected] atau manajemen _ bisnis @yahoo.com.
\ Manajemen & Bisnis, Volume I 0, Nomor 2, September ~.v •.
FOREIGN OWNERSHIP, PRODUCTIVITY, AND ECONOMIC CRISIS
Suyanto Faculty of Business and Economics, Universitas Surabaya, email : [email protected]. id
Abstract This paper evaluates the productivity benefit from the present of fore ign ownership in manufacturing firms. The productivity benefit is analysed for the period before crisis ( 1988-1996) and the period crisis onwards ( I 997-2000). Using the methodology of stochastic production frontier, the results show that fore ign ownership generates positive productivity benefit to local manufacturing firms, both during the before cri sis period and during the crisis onwards period. An interesting result emerges when comparing the two periods. Although positive spillover benefits ex ist in both periods, the coefficient of FDI Spillovers is larger during the period of crisis onwards, suggesting that the productivity benefit increase after economic crisis. These findings support an argument by Taki i (2007) that economic crisis has positive impact on the productiv ity spi llovers of FDI.
Keywords: Foreign ownership, productivity benefits, manufacturing, economic crisis.
Abstrak Tulisan ini mengevaluasi manfaat produktivitas dari kehadiran Penanaman Modal Asing (PMA) dalam perusahaan-perusahaan manufaktur. Manfaat produktivitas ini dianalisis untuk periode sebelum krisis (1988-1 996) dan periode krisis dan setelahnya ( 1997-2000). Dengan mengaplikasikan metodologi Stochastic Production Frontier, hasil yang diperoleh memperlihatkan bahwa kepern ilikan asing menghasi lkan pengaruh produktivitas positif terhadap perusahaan-perusahaan manufaktur , baik periode sebelum krisis dan periode krisis dan setelahnya. Hal menarik muncul ketika hasil dari kedua periode tersebut dibandingkan. Meskipun pada kedua periode terdapat manfaat rembesan positif dari kehadiran kepemilikan asing, pengaruh rembesan ini lebih besar pada periode krisis dan sete lahnya, yang menerangkan bahwa manfaat produktivitas meningkat setelah krisis ekonomi. Penemuan ini mendukung pendapat yang di kernukakan oleh Takii (2007) bahwa krisis ekonomi memiliki dampak positif pada produktivitas rembesan dari PMA.
Kata kunci: Foreign ownership, productivity benefits, manufacturing, economic crisis.
JEL Classification: F21, F23
1. Introduction It has been long argued in the literature that foreign ownership will generate posltlve
benefits to local fi rms. The benefits can either direct, which take the forms of new capital and new fund for financing saving-investment gap, or indirect, in the forms of new knowledge that increase producti vi ty of local firms. Although the direct benefits has widely believe been valuable for host economies, the preferential policies toward foreign direct investment (FDI) rest in the common argument that FDI generates externalities in the forms of new knowledge, including modem technology, advanced managerial expertise, and scale-efficiency knowledge (Blomstrom, 1986; Blomstrom and Kokko, 1998; Liu, 2008). These externalities are mainly due to foreign subsidiaries being unable to internal ize the new transferred knowledge from their
177
, I
I.
Suyanto
parent companies, and this transferred knowledge spills over to domestic firms, rai sing productivity.
A large number of empirical studies have been conducted to evaluate the productivity benefits of foreign investment. Caves (1974), Globerman (1979), Driffield (2001 ), and Girma and Gorg (2007) show that positive productivity benefi ts exist in developed countries, such as Australia and UK. Blomstrom ( 1986), Kokko (1996), Javorc ik (2004), and Kugler (2006) demonstrate that positive productivity benefits exist in developing countries, such as Mexico, Lithuania, and Colombia. In Indonesia, Blomstrom and Sjoholm (1999), Sjoholm (1999a, 1999b), Taki (2005), and Blalock and Gertler (2008) do the similar tests and conclude positive productivi ty spillovers in manufacturing firms. All these studies examine the producti vity spillovers for a specific country at a spec ific time period. What less visible is these studies, particularl y those on Indonesia, do not take into account economic shocks in examining the producti vity spillover. This present study extends the literature by including economic crisis into the analysis of productivity spillovers.
The rest of this paper proceeded as follows: ( 1) a brief literature review is presen ted, (2) it is followed by the model, (3) the data'>et is discussed, (4) the empirical results is presented, and (5) concluding remarks are given the last section.
2. Literature Review The literature on the spillover effects of foreign ownership on local firm productivity can be trace back to the seminal dissertation of Hymer ( 1960). Based on this dissertation, theoretical literature ex tends the analysis of productivity benefit~ through various channels of spi llover effects. Findlay (1978) demonstrates that foreign investments play an important role in motivating domestic f irms to increase their product1vities through technological improvements. Das ( 1987) presents a model showing that a foreign presence in an economy generates spillover effects for domestic firms through increases in efficiency. Kaufmann ( 1997) and Fosfuri et al. (200 I) introduce models of productivity spi llovers through labour mobili ty. Rodriguez-Clare (1996) points out that productiv ity benefits from foreign investment can be transferred through suppliers or industrial linkages.
Empirical literature grows following the theoretical literature. The pioneering papers in this field are Caves (1974), Globerman (1979), and Blomstrom and Persson (1983). Following these three papers, the empirical studies then develop in the various directions with various methodology and dataset. However, the results of the empirical studies are di verse, whereas some stud ies demonstrate positive productivity spi llovers and some others show no spillovers or even negative spillovers. Todo and Miyamoto (2006) and Suyanto et al. (2009) are two empirical studies that support the positive producti vity spillovers, while Ai tken and Harrison ( 1999) and Djankov and Hoekman (2000) find negative spillover effects of FDI. The mix evidence reflects that an empirical study that uses a new methodology and takes into account some specific mediating factor, such as economic shock, is expected to contribute in the literature.
Empirical studies on productivity benefits in lndonesia manufacturing fi rms have been conducted by some researchers. Blomstrom and Sjoholm ( 1999), Sjoholm (1999a; 1999b), Takii (2005), Blalock and Gertler (2008), and Suyanto et al. (2009) are among them. Blomstrom and Sjoholm (1999) and Sjoholm (1999a; 1999b) utilize cross-sectional data and OLS regression to estimate the productivity benefits. Takii (2005) and Blalock and Gertler (2008) apply panel data and OLS regression. Only Suyanto et al. (2009) and Suyanto and Salim (2010) that applies a stochastic frontier method to examine the productivity benefits. The chief advantage of the stocha~tic frontier method if compared to the classical regression is that the former take into account the disturbance variable, which is separated into two components (inefficiency term and stocha'>tic term). A more detailed discussion on the stochastic frontier method is presented in the second part of the following section.
178
Manajemen & Bisnis, Volume 10, Nomor 2, September 2011
3. Research Method 3.1. Re..-,earch Questions and Hypotheses Development It is widely believed that multinational compan ies (MNCs) possess superior knowledge than local companies. Although multinational companies may have disadvantages in the forms of access to local resources and experience in serving local markets, they could win a competition with local counterparts through superiority in knowledge, advancement in technology, and enhancement in efficiency. Caves ( 1971) argues that superior knowledge of multinationals is accumulated through long-term experiences, manifesting in learning by doing, development of economic-scales of production, and research and development (R&D). This superior knowledge enriches production capacities of MNCs, and hence enables these companies to produce in large scale and low prices. Wang and Bloomstrom ( 1992) state that the advancement in technology allows MNCs maintaining a technology gap wi th local companies. The existence of MNCs in local markets does indeed create a "demonstration" effect and enables local companies to imitate MNCs' technology. However, according to Glass and Saggi (2002), the imitated technology is less up-dated, as MNCs might prevent the leakage of the most-up-dated technology. An implication of thi s action, MNCs have more advanced technology than their local counterparts. Aitken and Harrison (1999) put forward an argument that superiority of MNCs is reflected on the enhancement in efficiency from time to time. Large-scale productions allow MNCs to spread fixed costs over a large amount of output, and hence the marginal cost.;; of MNCs are lower than those of local companies. The low marginal costs enable MNCs to "steal" market share from local companies.
Based on these related literature, the current study try to test whether an argument of the knowledge superiority is applied in the Indones ian manufacturing industry, by putting forward a research question that: "Dv MNCs pusses superior knowledge than Localfirms?". To quantify the superior knowledge, efficiency measure is used as a proxy. The corresponding hypothesis is:
Hypothesis 1: MNCs are more efficient than local firms.
If hypothesis I is true, there is a possibi lity that the superior knowledge of MNCs might spill over local firms and increa'!es thei r efficiencies (Wang and Blomstrom, 1992; Kokko, 1996). The process of spillovers takes place when MNCs transfer knowledge to their subsidiaries in host countries, and the transferred knowledge has a certain public goods' quali ty that allow local firms to take benefits via non-market mechanisms (Suyanto et al., 2009). These knowledge spillovers can channelled through imitation, hiring labour whose previously trained by MNCs, competition, and vertical linkages (an excellent review on these four channels is provided by Gorg and Greenaway, 2004).
A number of empirical studies have been conducted to test the spillover effects of MNCs. The notably among them are Caves (1974), Globerman (1979), and Blomstrom and Persson ( 1983). These three groundbreaking studies attract scholars' attention to investigate in more detail the spillover effects. Both cross-sectional and panel-data studies have extensively conducted to test the spillover effects, and the results are mixed. Some studies show positive knowledge spillovers (such as, Javorcik (2004) for Lithuania, Gorg and Strobl (2005) for Ghana, Tomohara and Yokota (2006) for Thailand, Kugler (2006) for Colombia, Liang (2007) for China, and Suyanto and Salim (20 I 0) for Indonesia), some others find no spillover effect (such as Haddad and Harrison ( 1993) for Morocco, Kathuria (2000) for lndia, and Konings (200 I) for Poland), and some studies discover negative knowledge spillovers (Aitken and Harrison ( 1999) for Venezuela, Djankov and Hockman (2000) for the Czech Republic, and Thangavelu and Pattnayak (2006) for lndia). Thus, there is no universal consensus regarding the relationship between FDI and knowledge spillovers.
179
Suyanto
To shade the light on the debate, this current study empirically investigates the spillover effects of FDl in order to answer question that: " is there any positive spillover effects from foreign investments to local firms?". A corresponding hypothesis is proposed:
Hypothesis 2: There is a positive productivity effect from the presence of foreign investment.
There is an argument that shocks in the economic environment, such as economic crises, might affect the signs and magnitude of FDI spillovers on domestic productivity. A few recent studies have taken into account this fac tor in investigating FDI spillovers (see for example, Takii, 2007 and Suyanto, 201 0). While these studies pointed out the importance of the economic environment, very limited empirical studies have been conducted in addressing this factor. As a contribution to the research in this field, this study examines whether the economic crisis in 2007 influences the sign and magnitude of FDI spillovers. The corresponding research question is that: "Is there any d~fferences in sign or in magnitude of FDI spillovers between the period before crisis and the period crisis onwards?". The hypothesis to test the research question is:
Hypothesis 3: There is a di fference in the magnitude of producti vity effect between period before crisis and period crisis onwards.
3.2. Method of Research To test the three hypotheses above, thi s paper employs the time-varying stochastic production frontier (SPF) for panel data proposed by Battese and Coell i (1995). This method is a one-stage method that estimates the production function simultaneously with an ineffic iency function using a Maximum Likelihood (ML) method of estimation. The results from a one-stage method, such as Battese and Coelli 's model, has been demonstrated in the literature to provide more efficient and consistent estimates than those from a two-stage method (see Kumbhakar et al., 199 1; Wang and Schmidt, 2002 for excellent discussions on the superiority of one-stage method).
The Battese and Coelli ( 1995) model can be wri tten in fo llowing equations:
( I)
(2)
where Yit denotes the scalar output of firm i (i= l , 2, ... , N) at timet (t=l,2, ... ,T), Xi1 is a (Jxk) vector of inputs used by firm i at time t, P is a (kxl) vector of unknown parameters to be estimated; the v;1 is a random error; u;1 is the technical inefficiency effect; Zi1 is a ( lxm) vector of observable non-stochastic explanatory variables affect ing technical inefficiency for firm i at time t, ()denotes a (mxl) vector of unknown parameters of the inefficiency effect to be estimated; w is an unobservable random error.
Equation (1) represents t~e production frontier of an output given some input factors. Equation (2) represents the inefficiency function. These two equations are estimated simultaneously using a computer program FRONTIER4.1 provided in Coell i, ( 1996). This program follows a three-step procedure in estimating the parameters in Equations (1) and (2). In the first step, ordinary least squared (OLS) is used to estimate the stochastic production function. All parameters fJ obtained are consistent, except for the intercept a. In the second step, a twophase grid search of y is conducted, with fJ parameters (except the intercept) set to OLS values and the intercept a and d parameters are adjusted using the corrected ordinary least squared formula, as explained in Coelli (1995). All other parameters (jl, fl, and c5) are set to zero during the grid search. In the third step, the final ML estimates are obtained using the Davidon-Fletcher-
180
Suyanto
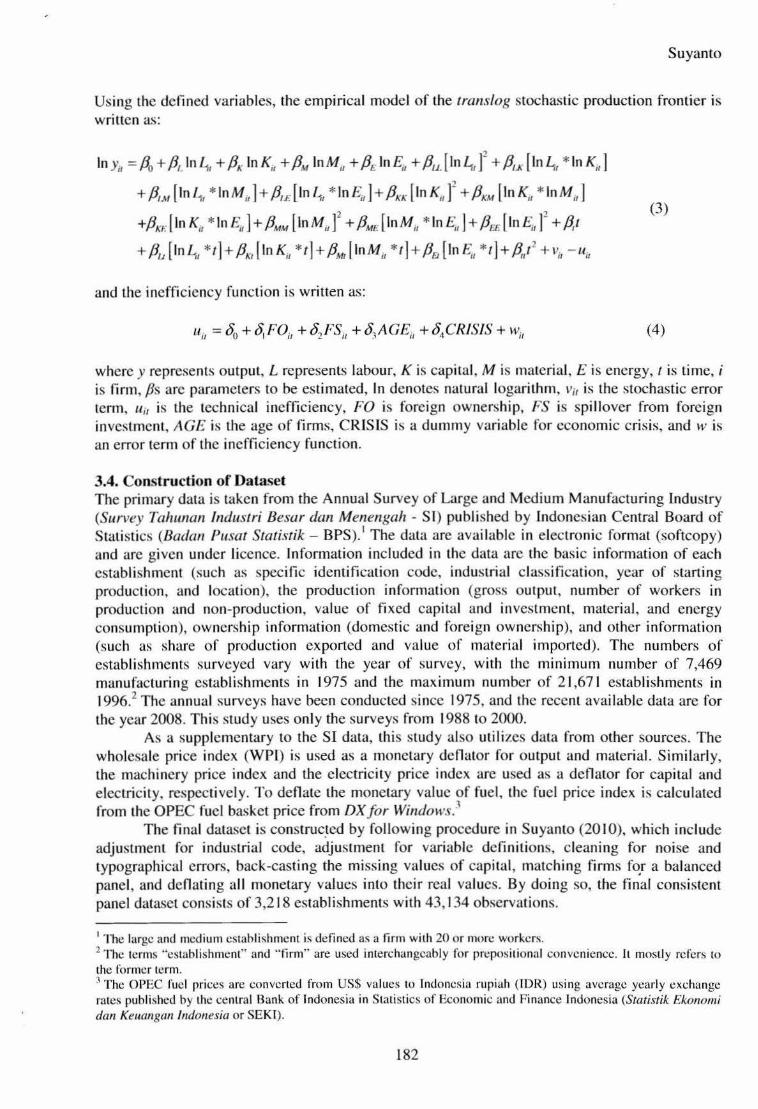
Using the defined variables, the empirical model of the translog stochastic production f rontier is written as:
In Y,, = {J0 + {J1_1n L,, + {JK InK;, + {JM In M;, + {J£ In E;, + fJu [In L,, )2 + fit..x [ In 4, * In K1, ]
+ {JIM [ In 4, *lnM1, ]+ fit£ [1n 4, * In E,, ]+ {JKK [ InK,, ]2 + PxM [In K,* In Mil ]
+flx~-: [ In K;, * In £1,] + {JMM [ In M;, ]2 + {JME ( Ln M;, * In E,, ] + fJu [ In £1, ]
2 + {J,t
+ Pu [ In 4, * t] + Px, (InK;, * t] + fJM, [ In M1, * t] + Pe (In £,, * t) + /3,/ + v;, - u;,
and the inefficiency function is written as:
(3)
(4)
where y represents output, L represents labour, K is capital, M is material, E is energy, 1 is time, i is firm, fJs arc parameters to be estimated, In denotes natural logarithm, v;, is the stochastic error term, u;, is the technical inefficiency, FO is foreign ownership, FS is spillover from foreign investment, AGE is the age of firms, CRISI S is a dummy variable for economic crisis, and w is an error term of the ineffi ciency function.
3.4. Construction of Dataset The primary data is taken from the Annual Survey of Large and Medium M anufactu ring Industry (Survey Tahunan lnduslri Besar dan Menengah - Sl) published by Indonesian Central Board of Statistics (Badan Pusat Statistik - BPS).1 The data are available in electronic format (softcopy) and are given under licence. Information included in the data are the basic information of each establ ishment (such as speci fic identification code, industrial classi fication, year of starting production, and location), the production information (gross output, number of workers in production and non-production, value of f ixed capi ta l and investment, material, and energy consumption), ownership information (domestic and foreign ownership), and other information (such as share of production exported and value of material imported). The numbers of establishments surveyed vary with the year of survey, with the minimum number of 7,469 manufacturing establishments in 1975 and the maximum number of 2 1,67 1 establishments in 1996.2 The annual surveys have been conducted since 1975, and the recent available data are for the year 2008. This study uses only the surveys from 1988 to 2000.
As a supplementary to the SI data, this study also util izes data from other sources. The wholesale price index (WPI) is used as a monetary deOator for output and material. Similarly, the machinery price index and the electricity price index are used as a denator for capital and electricity, respecti vely. To deflate the monetary value of fuel, the fuel price index is calculated from the OPEC fuel basket price from DXfor Windows.3
The fi nal dataset is construc~ed by following procedure in Suyanto (20 I 0), which i nclude adjustment for industrial code, adjustment for variable defini tions, cleaning for noise and typographical errors, back-cast ing the missing values of capi tal , match ing fi rms f~r a balanced panel, and deOating all monetary values into their real values. By doing so, the final consistent panel data<;et consists of 3,218 establishments with 43, 134 observations.
1 The large and medium establishment is defined as a fi rm with 20 or more workers. 2 The terms "establ ishment'' and ·' firm'" are used interchangeably for preposit ional convenience. Jt mostly re fers to the former term. 3 The OPEC fuel prices are converted from US$ values to Indonesia rupiah (TDR) using average yearly exchange rates published by the central Bank of Indonesia in Statistics of Economic and Finance I ndonesia (Statistik Ekonomi dan Keuangan Indonesia or SEKI).
182
Manajemen & Bisnis, Volume 10, Nomor 2, September 2011
4. Results and Discussion 4.1. Productivity Benefits from Foreign Investment The tirst step in the stochastic production frontier method is to test the appropriateness of the chosen model. The translog model, as specified in Equation (3), is tested against four other models: Cobb-Douglas frontier, Hick-Neutral Technology frontier, No Technology Progress frontier and No-inefficiency models. The null hypothesis for testing Cobb-Douglas frontier,
given the tram-Log model, is f3u. = fJLK = /3~-,w = fJLE = fJKK = fJKM = fJK£ = fJ.wM = flMt:: = flroro = 0.
Alternative ly, the null hypothesis for testing Hick-Neutral Technology is A~ = fJKJ = fJMI = j]F., = 0. The null hypotheses for testi ng the No Technology Progress and the
no-inefficiency model are /3, = /3,, = Pu = PKr = fJMI =Pee = 0 and r =5o = ~ = ... = 06 = 0 ,
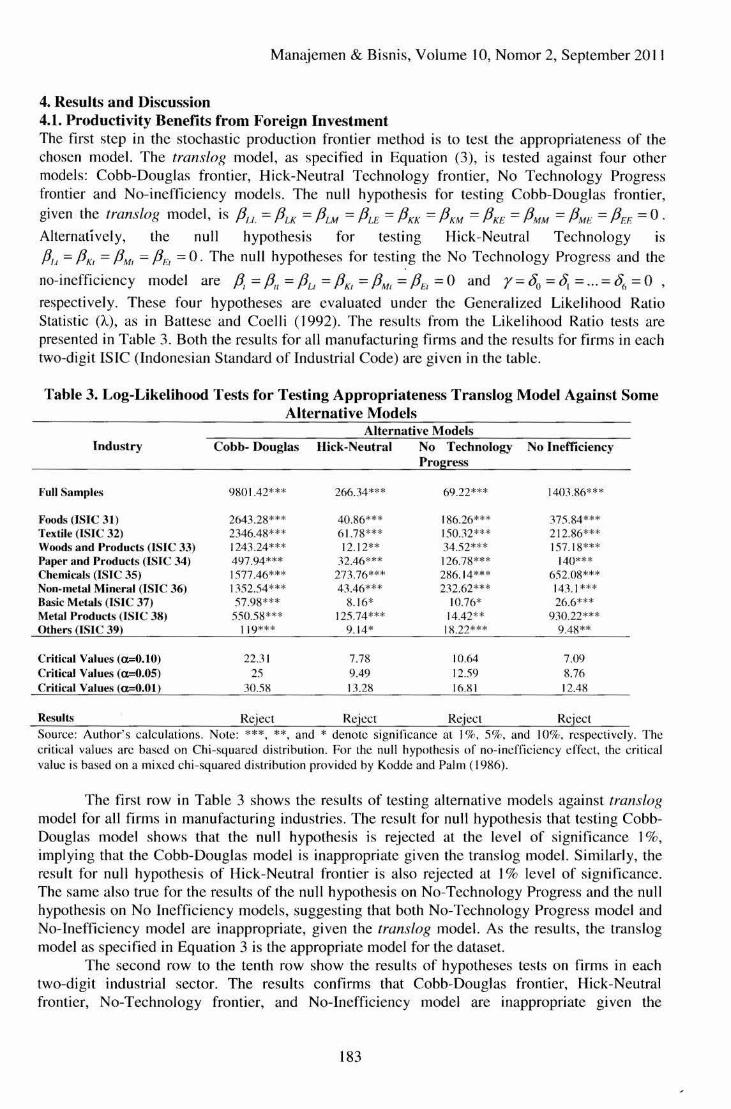
respecti vely. These four hypotheses are evaluated under the Generalized Like lihood Ratio Statistic (A.), as in Battese and Coelli (J 992). The results from the Likelihood Ratio tests are presented in Table 3. Both the resu lts for all manufacturing firms and the results for firms in each two-digit ISIC (Indonesian Standard of Industrial Code) are given in the table.
Table 3. Log-Likelihood Tests for Testing Appropriateness Translog Mode) Against Some Alternative Models
Alternative Models Industr y Cobb- Douglas Hick-Neutral No Technology No .Inefficiency
Pro ress
Full Sampll>s 9801.42*** 266.34*** 69.22*** 140:t86***
Foods (ISIC 31) 2643.28*** 40.86*"'* 186.26*** 375.84*** Textile (ISIC 32) 2346.48*** 61.78*** 150.32*** 212.86*** Woods and Products (ISIC 33) 1243.24*** 12. 12** 34.52*** 157.18*** Paper and Products (ISIC 34) 497.94*** 32.46*** 126.78*** 140*** Chemicals (ISIC 35) 1577.46*** 273.76*** 286. 14*** 652.08*** Non-metal Mineral (ISIC 36) 1352.54*** 4:l .46*** 232.62*** 14:U *** Basic Metals (JSIC 37) 57.98*** 8. 16* 10.76* 26.6*** Metal Products (ISIC 38) 550.58*** 125.74*** 14.42** 930.22*** Others (ISIC 39) 119*** 9. 14* IX.22*** 9.4X**
Critical Values ( a.--6.10) 22.3 1 7.78 10.64 7.09 Critical Values (a=O.OS) 25 9.49 12.59 8.76 Critical Values (a.--6.01) 30.58 13.28 1681 12.48
Results Reject Reject Reject Reject Source: Auth01·'s calculations. Note: ** * , **,and * denote signifi cance at 1%, 5%, and 10%, respectively. T he critical values arc based on Chi-squared distribution. For the null hypothesi s of no-inefficiency effect, the critical value is based on a mixed chi-squared distribution provided by Kodde and Palm ( 19K6).
The first row in Table 3 shows the results of testing alternative models against translog model for all firms in manufacturing industries. The result for null hypothesis that testing CobbDouglas model shows that the null hypothesis is rejected at the level of significance I%, implying that the Cobb-Douglas model is inappropriate given the translog model. Similarly, the result for null hypothesis of Hick-Neutral frontier is also rejected at I% level of significance. The same also true for the resu lts of the null hypothesis on No-Technology Progress and the null hypothes is on No Ineffic iency models, suggesting that both No-Technology Progress model and No-Inefficiency model are inappropriate, given the translog model. As the results, the translog model as specified in Equation 3 is the appropri ate model for the dataset.
The second row to the tenth row show the results of hypotheses tests on fi rms in each two-digit industri al sector. The results confirms that Cobb-Douglas frontier, Hick-Neutral frontier, No-Technology frontier, and No-Inefficiency model are inappropriate given the
183
Suyanto
translog model. Unlike the results for the full salllples that significant at the I% level, the results for firms in the two-digit industries have signi ficance that ranging from I% to 10%. Nevertheless, the results lead to the same conclusion that the translog model is the appropriate ntodel for the data.
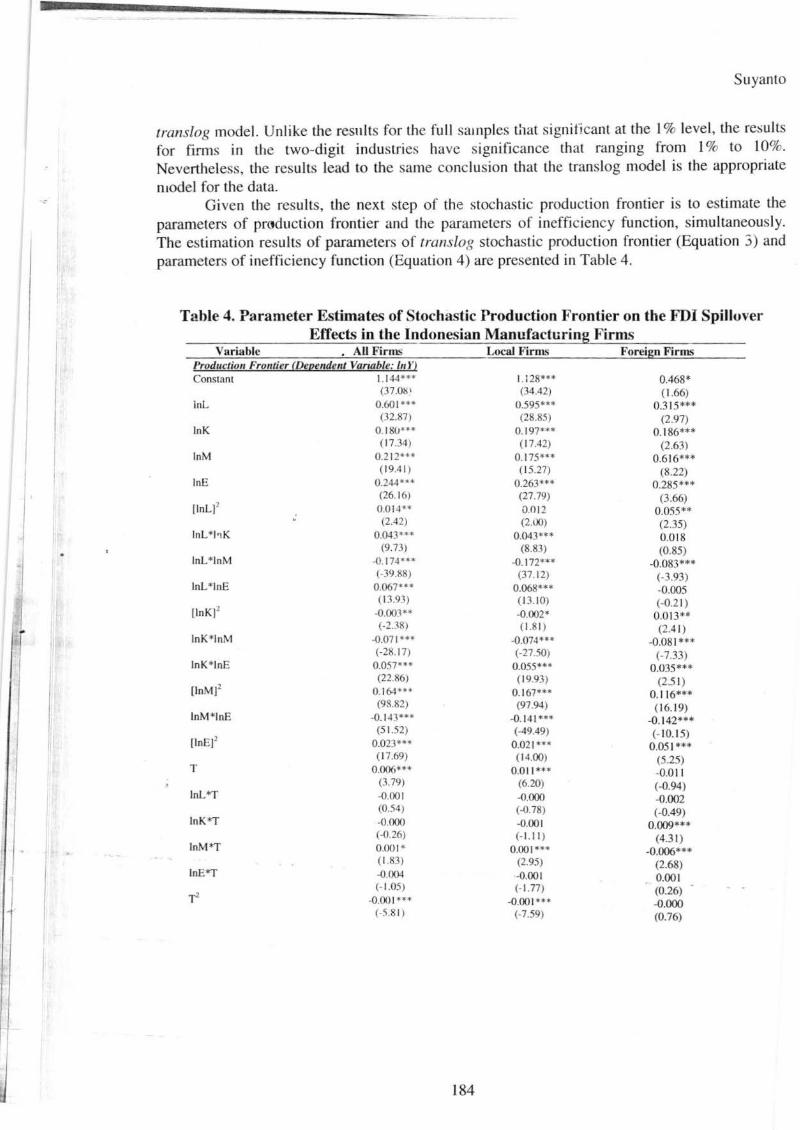
Given the results, the next step of the stochastic production frontier is to estimate the parameters of pmduction frontier and the parameters of ineffi ciency function, simultaneously. The estimation results of parameters of translog stochastic production frontier (Equation 3) and parameters of ineffi ciency function (Equation 4) are presented in Table 4.
Table 4. Parameter Estimates of Stochastic Production Frontier on the FDI Spillover _ ______ E=ff:.::e...:..cts=-.:i=n:_t:=h:..::e-=I=ndonesian Manufacturing Firms
Variable • All Firms LocaJ Firms Foreign Firms Production Frontier (Def!.endent Varwble: In Y) Constant 1.1 44•** U 28*** 0.468*
(37.0~\ (34 .42) ( 1.66) lnL 0.601 *** 0.595*** 0 .3 15***
(32.87) (28.85) (2.97) InK 0. 180*** 0.197*** 0 .186***
(17.34) ( 17.42) (2.63) lnM 0.2 12U* 0. 175*** 0.6 16 ***
( 19.4 1) ( 15.27) (8.22) lnE 0.244*** 0.263*** 0 .285***
(26.16) (27.79) (3.66) [lnLf 0.01-t** 0.0 12 0.055**
(2.42) (2.00) (2.35) lnL*I•1 K 0.043** .. 0.043*** 0 .0 18
(9.73) (8.83) (0.85) lnL*InM -0. 174*** -0.172*** -0.083***
(-39.88) (37. 12) (-3.93) lnL*InE 0.067*** 0.068*** -0.005
(13.93) ( 13.10) (-0.21) [lnK]2 -0.003** -0.002* 0.0 13**
(-2.38) ( 1.81) (2.4 1) lnK*InM -0.071 *** -0.074*** -0.08 1 ***
(-28.17) (-27.50) (-7.33) lnK*InE 0.057*** 0.055*** 0.035***
(22.86) ( 19.93) (2.5 1) [lnMj2 0. 164U* 0.167*** 0. 116***
(93.82) (97.94) ( 16. 19) lnM*InE -0. 143*** -0.141 *** -0.142***
[lnE]2 (51.52) (-49.49) (- 10.15)
0.023*** 0.021 *** 0.05 1 *** (1 7.69) (14.00) (5.25)
T 0.006*** 0.01 1 *** -0.0 11 (3.79) (6.20) (-0.94)
lnL*T -0.00 1 -0.000 -0.002 (0.54) (-0.78) (-0.49)
lnK*T -0.000 -0.001 0.009*** (-0.26) (-1. 11 ) (4.3 1)
lnM*T 0.00 1* 0.001 *** -0 .006*** ( 1.83) (2.95) (2.68)
lnE*T -0.004 -0.00 1 0.001
r (-1.05) (- 1. 77) (0.26)
-0.00 1*** -0.00 1 *** -0.000 (-5.81) (-7.59) (0.76)
184

Manajemen & Bisnis, Volume 10, Nomor 2, September 20 11
Table 4., Continued ...
Inefficiency Function (Dependent Varinble: u )
Variahle All Firms Constant 0.078***
(2 1.59)
FO -0.008*** (-6.56)
FS -0.126*** (-88.00)
AGE 0.002*** • (3.30)
CRISIS 0.0 15*** (6.9 1)
Sigma-squared 0.033*** ( 195.31)
Gamma 0.005*** (20 .78)
Local Firms 0.053*** (23.54)
·0.150*** (-6.56)
0 .0003*** (2.10)
0.007*** (10.31)
0.031 *** (142.70) 0. 137*** ( 18.23)
Foreign Firms 0.222*** ( 13.93)
-0.261*** (- 14.59) 0.00002 (0 .07) 0 .004 (0.28)
0 .047*** (37.90)
0.009*** (5.60)
Source: Author 's Calculation using the model speci fied in equation (3) and (4 ). Notes: The !-statistics are in pare nthesis. *** denotes I% Sig nificance le ·.-cJ. ** denotes 5% Sig nificance level. and * denotes I 0% s ignificance level.
There are three groups of estimation results that presented in Table 4. The first group, which is presented i:1 the ~econd column of the table, is the estimation results for the total sample of firms. The second group, that presented in the third c\:llumn, i the results for the local firms only. The third group, which is in the last column of the table, is the results for the fore ign firms only.
Starting from the estimation results of the first group, it is found that the first degree input variables (lnL, InK, lnM, and Ln£) have positi ve signs, as in economic theory. These results suggest that the input variables have a pos itive effect on output. The second degree variables, both the interacting variables between inputs and the interacting vari ables between input ~nd time, also have expected s igns and are stati stically significant.
Moving to the inefficiency function (the lower part of Table 4), the estimated coeffici ents of FO (which take the value of one if the firm is a foreign-ovmed firm and zero if the firm i. a domestic firm) are negative and highly significant at the I % level, suggesting that fore ign-owned ftrms are, on average, less inefficient th<:n dontestic firms, k~eping othe r variables con tant. This result supports the mainstream premise that foreign fiims generally possess more updated knowledge and have more experience in serving markets, so that they are more effi c ient than domestic firms.
As expected, the coefficient of FS has a negative s ign and is statisticall y signifi cant at the 1% level, meaning that the presence cf FDI reduces inefficiency of firms in the same fi ve-digit industries. Although this study uses a longer time period by inc luding the period of cri sis, the findings are in line with Blalock and Gertler (2008) and Tak.ii (2005) on the ground that FDI c::.t the industrial level generates positive spillovers to firms in the same industries .
With regard to variables not associated with foreign ownership, the coefficient of Age is positive and statistically signific<:nt. This is not a surprise since the impact of age to firms' efficiencies is still a matter of debate in the literature. An olde r firm could have a P.igher efficiency due to knowledge accumulation through learning experience, while a younger firm might be more effi cient because of possessing up-dated knowledge. Nevertheless, the result is consistent with findings in Lund va l! and Battese (2000) for Kenya and Kathuria (200 I ) for India. Similarly, the coefficients of crisis al so show positive and s ignificant e ffects on ineffi ciency. This den.onstrates the argume!"lt in literature that the economic cris is might r~duce effic iency of firms (for example, Tak.ii, 2007).
When the samples of firms are divided into local firms and domestic firms, and the estimations of tochastic fro ntier are performed into these two groups of samples, the re ults are almost similar as the results for the total samples. There are some interesting findings emerge.
185
Suyanto
The first rtotable finding is that the estimated coefficients of FS are negative and significant for both the mode l for only local firms and the model for only foreign firms. The implication of these findings is that the entry of forei gn firms in the domestic market reduces inefficiency of local firms as well as other foreign firms. This is in lin~ with the argument th3t foreign firms brings pos itive externalities to local firms and other foreign firms, as the presence of new foreign firms force domestic firms and the existed foreign firms to increase their efficiency.
The second impressive finding is that the magnitudt- of spillover effects from new foreign firms on other foreign firms is greater than the magnitud~ of the spillover effects from new foreign firms on !ocaJ firms. This is reflected from the higher coefficient of FS for the model of samples of only foreign firms (the last colu;nn of Table 5) if compared to those of FS for the model of samples of only local firms (the second last column of Table 5). The indirect implication is that the reduction of inefficiency of foreign firms is larger than the reduction of inefficiency of local firms, when new foreign firms enter the domestic market. This could be explained by the argument that foreign firms are more ready for competition with new foreign firms if compared with the local firms.
The third interesting finding is that the Age variable is found to be insignificant for sample of onl y foreign firms, suggesting that older foreign firms does not have significant di fferent irt effi ciency compared to younger ones. This could be true because older and younger foreign firms have up-dated and homogenous technologica l advancement.
The last notable finding is that the estimated coeffi cient of Crisis has a positive sign for both the sample of only local firms and the sample of only foreign firm~. However, it is insignificant for the s&mple of only foreign firms while it is significant for the sample of only local firms. These findings suggest that economic crisis increase inefficiency of local firms, but give no signrficant effect on ineffi c iency of foreign firms.
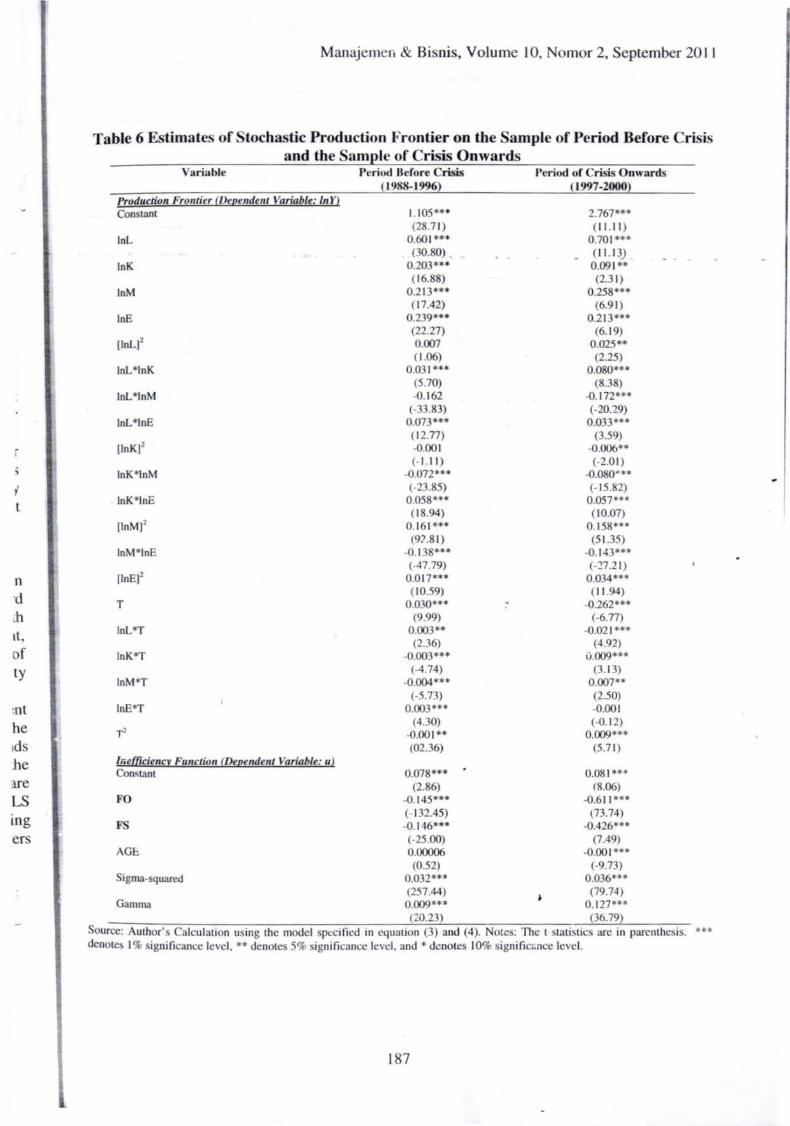
4.2. Productivity Spillovers Before and After the Economic Crisis This study takes into account the economic crisis by estimating Equations (3) and (4) on observations before the economic cri sis ( 1988-1996) and those from the economic cris is onward ( 1997-2000). The estimated parameters for these two periods are presented on Table 6. For both periods, the coefficients of spillover variables are negatiYe and statistically significant, suggesting positive FDI spillovers. Comparing the resul ts for the two periods, the coefficients of FS are larger for the crisis period. These results suggest that there are positive productivity spillovers, and the magnitude of spillovers increased after the economic crisis.
Although this current stl!dy applies a different methodology, the f:ndi:1g !s consistent with the previous studies in Indonesia in that FDI generates positive spillover during the economic crisis (for example, Takii 2007). However. unlike Tak ii (2007), the current study finds that the magnitude of horizontal spillovers increased during the crisis. The differences in the method of estimations, the measure of FDI spillovers, and the measure of productivity are perhaps the reasons for the differences in findings. While Taki i uses a panel data OLS estimation, measures FDI spillovers using the share of labour, and caJculates productivity using value added, the preseot study employs a stochastic production frontier, measures FDI spillovers using the share of output, and calculates productivity using gross outputs, respectively. ·
186
'I t
n ·d .h tt,
of ty
:nt
he td S
.he 3Ie
LS ing er
M anajemcn & Bisnis, Volume 10, Nomor 2, September 2011
Table 6 Estimates of Stochastic Production Frontier on the Sample of Period Before Crisis and the ample of Crisis Onwards
Variable
Production Frontier (Dependent Variable: ln Y) Constant
lnL
InK
lnM
JnE
lnL*lnK
JnL*InM
lnL*lnE
lnK*InM
lnK*InE
lnM*InE
T
lnL*T
lnK*T
lnM*T
lnE*T
lr.efficiency Function (Dependent Variable: u ) Con~tant
FO
FS
AGL:.
Sigma-squared
Gamma
Period Before Crisis ( 1988-J 996)
1.105*** (28.7 1)
0.601*** (30.80)
0.200*** ( 16.88)
0.213*** (17.42)
0.239*** (22.27) 0.007 (1.06)
0.03 1 *** (5.70) -0. 162
( -33.83) 0.073*** (12.77) -0.001 (- I. II)
-0.072*** ( -23.85)
0.058*** (18.94)
0.16 1*** (9?.8 1)
-0.138*** (-47.79) 0.017*** ( 10.59)
0.030••• (9.99)
0.003** (2.36)
-0.003*** (-4.74)
-0.004*** (-5.73)
0.003*** (4.30)
-0.001** (02.36)
Period or Crisis Onwards (1997-2000)
2.767*** ( II. II )
0.701*** ( 11.13) 0.091** (2.3 1)
0.258*** (6.9 1)
0.213*** (6. 19)
0.025•• (2.25)
o.o8o••• (8.38)
-0.172••• (-20.29) 0.033***
(3.59) -0.006** (-2.01)
-0.080"'** (- 15.82) 0.057••• (10.07)
0. 158*** (51.35)
-0.143*** (<!7 .21)
0.034*** ( 11.94)
-0.262*** (-6.77)
-0.021*** (4.92)
v.009*** (3.13)
0.007•• (2.50) -0.001 (-0. 12)
0.009*** (5.71)
0.078*** 0.081 *** (2.86) (8.06)
-0.145*** -0.6 11 *** (- 132.45) 03.74) -0.146*** -0.426••• (-25.00) (7.49) 0.00006 -0.001*** (0.52) (-9.73)
0.032··· 0.036••• (257.44) (79.74) 0.009*** 0.127*** (10.23) (36.79)
Source: Author' s Calculation using the model specified in equation (3) and (4). Note : The t tatistic are in parenthesis. denote~. I% ignilicance level, **denotes 5% significance level, and *denotes 10% signilic::nce level.
187
***
Suyanto
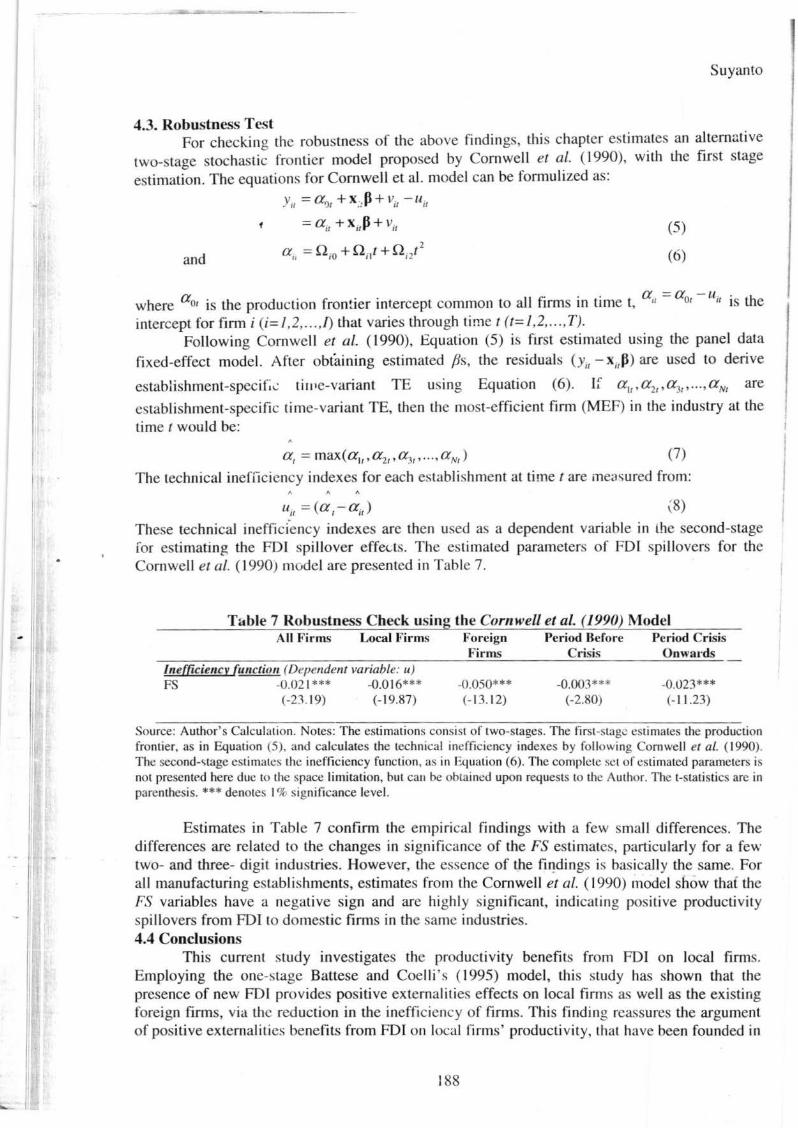
4.3. Robustness Test For checkino the robustness of the above findings, this chapter estimates an altem<lti ve
b .
two-stage stochastic frontier model proposed by Cornwell et al. ( 1990), wtth the first stage estimation. The equations for Cornwell et al. model can be formuli zed as :
y, = a9, + x.-:P + v;, - u;,
and a = Q .o + Q .,t+Q .2t 2
II I I I
(5)
(6)
where ao, is the production fron~ier intercept common to all firms in time t, a , = ao, - u;, is the intercept for firm i (i= 1,2, ... ,J) that varies through timet (t=1,2, ... , T).
Following Cornwell et al. (l990), Equation (5) is first estimated using the panel data
fixed-effect model. After obtaining estimated fJs, the residuals (y,, - X;, P) are used to derive
establishment-spec ie ..: ti111e-variant TE using Equation (6). If a,,,a2,,a3,, ... ,aN, are
establishment-specific time-variant TE, then the most-efficient firm (MEF) in the industry at the timet would be:
a,= max(a,,,a2,,a3, , ... ,aN,) (7)
The technical inefficiency indexes for each establishment at time t are meas ured from:
u;, = (a,- a;,) (8)
These technical ineffici-ency indexes are then used as a dependent variable in lhe second-stage for estimating the FDI spillover effet-ts. The estimated parameters of FDr spillovers for the Cornwell et at. ( 1990) mode l are presented in Table 7 .
Table 7 Robustness Check using the Cornwell et al. (1990) Model All Firms Local Firms
Inefticiellcy (u11ction ( Dependellt variable: u) FS -0.02 1 *** -0.0 16***
(-23. 19) (-1 9.87)
Foreign Firms
-0.050*** (-13. 12)
Period Before Crisis
-0.003*** (-2.80)
Period Crisis Onwar·ds
-0.023*** (-11.23)
Source: Author's Calculation. Notes: The estimations consist of two-stages. The first-stage estimates the production frontier, as in Equation (5), and calculates the technical inefficiency indexes by following Corn well et at. ( 1990). The second-c;tage estimates the inefficiency function, as in Equation (6). The complete set of estimated parameters is not present~d here due to the space limitation, but cau be obtained upon requests to the Author. The t-statistics are in parenthesis. *** denotes I% s ignificance level.
Estimates in Table 7 confirm the empirical findings with a few small differences. The differences are related to the changes in significance of the FS estimates, particularly for a few two- and three- digit industries. However, the essence of the fif!dings is bas icall y the same. For all manufacturing establishments, estimates from the Cornwell et al. ( 1990) model show thai the FS variables have a negati ve sign and are highly significant, indicating positive productivity spillovers from FDlto do mestic firms in the same industries. 4.4 Conclusions
This current study investigates the productivity benefits from FDI on local firms. Employing the one-stage Battese and Coe lli 's ( 1995) model, this study has shown that the presence of new FDI provides positive externali ties effects on local finns as well as the existing foreign firms, via the reduction in the ineffic iency of firms. This finding reassures the argument of positive externalities benefits from FDI on local firms' productivity, that have been founded in
188
e e
on 0). ; is : in
'he ew ror the lity
ms. the
Ling 1ent din
Manajemen & Bisnis, Volume 10, Nomor 2, September 20 11
some earlier studies, such as Takii (2005), Blalock and Gertler (2008), and Suyanto et al. (2009). It is al o found that during both the period of before crisis and the period of crisis onwards, FDI reduces inefficiency of local firms. The magnitude of the e ffect is more profound during the economic crisis, suggesting that the presence of FDI during the period of crisis onwards has a greater impact on the reduction of inefficiency of firms compared to those during the period before crisis. These findings ensure the ex istence of productivity spillovers from FDI on local firms , which can be in the forms of competition that rises the efficiency of local firms, employing labours whose prev ious ly trained by foreign firms, and adoption of new technology.
Findings of this study have two important -policy implications. Firstly, the finding of positive productivity effects from FDI on local firms suggests that the government should provide incentives to FDI. Foreign investment that generates productivity benefit to local firms should be encouraged, in a purpose to reduce the ir.efficiency of local firms. Secondly, findings that FDI generates productivity benefits to local firms in both the period of before cris is and the period of crisis onwards :;uggest the importance of FDI either before or after cri sis. As the magnitude of FDI effects on firms ' productivity is greater for the period of cris is onwards, further incentives should be provided to attract more fore ign investments in the future.
References
Aitken , B. 1., and A. E. Harri son, 1999, Do Domestic Firms Benefit from Direct Foreign Investment? Evidence from Venezuela, The American Economic Review 89 (3), 605-618.
Battese, G. E., and T. J . Coelli , 1992, Frontier Production Function, Technical Effi ciency and Panel Data: With Application to Paddy Farm'"'rs in India, Journal of Productivity Analysis 3 (1-2), 153-169.
Battese, G. E. , and T. J. Coelli , 1995, A Model for Technical Inefficiency Effects in a Stochastic Frontier Production Function for Panel Data , Empirical Economics 20 (2), 325-332.
Blalock, G., and P. J. Gertl er, 2008, Welfare Gain fro m For~ ign Direct Inve tment through Technology Transfer to Local Suppliers, Journal of international Economics 74 (2), 402-421.
Blomstrom, M., 1986, Foreign Investment and Productive Efficiency: th~:: Case of Mexico, Journal of Industrial Economics 35 ( I), 97- 11 2.
Blomstrom, M., and A. Kok.ko, 1998, Multinational Corporation and Spillovers. Journal of Economic Surveys 12 (2), 247-277.
Blom;:;trom, M., and H. Persson, 1983, Foreign lnvestment and Spi llover Efficiency in an Underdeveloped Economy: Evidence from the Mexican Manufacturing Industry, World Development 11 (6), 493-50 I. .
Blomstrom, M., and F. Sjoholm, 1999, Technology Transfer and Spillovers: Does Local Participation with Multinationals Matter?, European Economic Review, 43 (4-6), 9 15-923.
Caves, R. E., 1971, International Corporations: The Industrial Economic.s of Fore ign Inve tment, Economica 38 (149), 1-27.
Caves, R. E., 1974, Multinationa l Firms, Comretition aud Productivity in Host Country Markets, Economica 4 1 ( 162), 176- 193. •
Coelli , T. J., 1995, Estimators and Hypothesis Tests for A Stochastic : A Monte Carlo Analysis, Journal of Productivity Analysis, 6 (3) , 247-268.
Coelli, T. J ., 1996, A Guide to Frontier Version 4.1. A Computer PrJgram for Stochastic Frontier Production and Cost Function Estimation, CEPA Working Paper No. 07/96, University of New England.
Das, S., 1987, Externalities and Technology Transfer through Multinati onal Corporations, Journal of interna:ional Economics 22 ( l -2), 171 -182.
189
r. l
Suyanto
Djankov, S., and B. Hoekman, 2000, Foreign InvestmePt and Productivity Growth in Czech Enterprises, World 13ank Economic Review, 14 ( I), 49-64.
Driffield , N., 200 I, The Impact on Domestic Productivity of Inward Investment in the UK, Manchester School, 69 ( I), I 03-119.
Findlay, R. , 1978, Relative Backwardness, Direct Foreign Investment, and the Transfer of Technologc': A Simple Dynamic Model, Quarterly Journal of Economics, 92 ( I), 1- 16.
Fosfuri, A., M. Motta, and T. Ronde, 200 I, Foreign Direct Investment and Spillovers through Worker 'Mobility, Journal of internatirmal Economics, 53 ( I), 205-222.
Girma, S., and H . Gorg, 2007, MultinationaJ's Productivity Advantage: Scale or Technology, Economic Inquiry, 42 (2), 350-362.
Glass, A., and K. Saggi, 2002, Multinational Firm and Technology Transfer, Scandinavian Journal of Economics, I 04 (4), 495-514.
Globerman, S ., 1979, f'oreig!l Direct Investment and 'Spillover' Efficiency Benefits in Canadian Manufacturing Industries. The Canadian Journal of Economics, 12 (1): 42-56.
Gorg, H., and D. Greenaway, 2004, Ml': h Ado about Nothing? Do Domestic Firms Really Benefit from Foreign Direct Investment? The World Bank Research Observer, 19 (2), 17 1- 197.
Gorg, H., and E. Strobl , 2005, Spi llovers from Foreign Firms through Wuiker Mobi li ty: An Empirical Investi gation, Scandinavian Journal of Economics I 07 (4), 693-739.
Haddad, M., and A. E. Harrison, I 993, Are there Positive Spillovers from Foreign Direct Investme nt? Evidence fmm Panel Data for Morocco, Journal of Development Economics, 42.:(1), 51 -74.
Hymer, S . H., 1960, The Internationa l Operations of National Firms: A Study of Direct Foreign Investment, PhD Dissertation, MIT Mass.: Publisheci by MIT Press 1976.
Javorc ik, B. S., 2004, Does Foreign Direct Investment Increase the Productivity of Domestic Firms? ln Search of Spillovers through Backward Linkages, American Economic Review, 94 (3), 605-627.
Kathuri a, V ., 2000, Productivity Spillovers from Technology Transfer to Indian Manufacturing Firms, Journal of International Development I 2 (2), 343-369.
Kathuri a, V., 2001, Foreign Fi rms, Techno logy Transfer and Knowledge Spillovers to Indian Manufacturing Firn1s: A S to~hastic Frontier Ana lys is, Applied Economics 33 (5), 625-642.
Kaufman n, L. , 1997 , A Model Spi llovers throtJgh Labour Recruitment, International Economic Journal II (3), 13-34.
Kodde, D. A., and F. C. Palm, I 986, Wald Criteria for Jointly Testing Equa lity and Inequality Restrictions, Econometrica 54 (5), 1243- 1248.
Kokko, A., 1996, Productivity Spillovers from competition between Local Firms and Foreign Affiliates, Journal of International Development 8 (4), 517-530.
Konings, J ., 200 I , The Effects of Foreign Direct Investment on Domestic Firms. Economics of Transition 9 (3): 6 19-633.
Kugler, M., 2006, Spillovers from Foreign Direct Investment: Within or between industries?. Journal of Development Economics, 80 (2), 444-477.
Kumbhakar, S . C. , S. Ghosh, and J . T. McGuckin, I 99 I, A Generali zed Production Frontie1 Approach for Estimating Determinants of Inefficiency in US Da iry Farms, Journal oJ Business and Economic Statistics 9 (3), 279-286.
Liang, F. H., 2007, Does Foreign Direct Investment improve the Producti vities of Domestic Firms? Technology Spillovers within and between Industries, Haas Berkeley WorkinJ Paper, http://facu It y. haas. berkeley .edu/fenl iang/research/spillover/FD lspi llover.pd (accessed July 20, 2007).
190
f
..
'· n
.n
ly .),
ct nt
~n
tic w,
ng
ian ~5 -
nic
lity
agn
s of
es?,
1tier •l of
king ·.pdf
Manajemen & Bisnis, Volume 10, Nomor 2, September 20 II
Liu, z., 2008, Foreign Direct Investment and Technology Spillovers: Theory and Evidence, Journal of Development Economics 85 ( 1-2), 176- 193.
LundvaJI, K., and G. E. Battese, 2000, Firm Size, Age and Efficiency: Evidence from Kenyan Manufacturing Firms, Journal of Development Studies 36 (3), 146- 163.
Rodriguez-Clare, A., 1996, Multinationals, Linkages, and Economic Development, American Economic Review 86 ( 4 ), 852-872.
Sjoholm, F., 1999a, Technology Gap, Competition, and Spillovers fro m Foreign Direct Investment: Evidence from Establishment Data, Journal of Development Studies, 36 ( 1 ), 53-73.
Sjoholm, F.,- f999b~Productivity Growth in Indonesia: The Role of Regiona l Characteristics and Direct Foreign Investment, Economic Development and Cultural Change, 47 (3), 559-
584. Suyanto, R. A. Salim, and H. Bloch, 2009, Does Foreign Direct Investme nt Lead to Productivity
Spillovers? Firm Level Evidence from Indonesia, World Development, 37( 12): 186 I -187 1.
Suyanto, 2010, Fore ign Direct Investment, Spillover Effects, and Producti vity Growth in Indonesian Manufacturing Industries, PhD Thesis Unpublished , School of Economics and Finance, Curtin Uni versity of Techno logy.
Suyanto and R. A. Salim, 20 I 0, Sources of Productivity Gains from FDI in Indonesia: Is it Efficiency Improvement or Technological Frogress?, The Developing Economies, 48(4), 450-472.
Takii, S. , 2005, Productivity Spil lovers and Characteristics of Foreign Multinational Plants in Indonesian Manufacturing 1990-95, Journal of Development Economics, 76 (2), 521-542.
Takii, S ., 2007, Do FDI Spillovers Vary Among Home Economies?: Evidence from Indonesian Manufacturing, Kitakyushu , Japan: The International Center for the Study of East Asian Development.
Thangavelu , S . M., and S. S. Pattnayak, 2006, Linkages and Spillovers from Foreign Ownership in the Indian Pharmaceutical Firms, SCAPE Working PaP.er Series, No. 2006/05.
Todo, Y., and K. Miyamoto, 2006, Knowledge Spillovers from Foreign Direct !:westment and the Role of R&D Activities: Evidence from Indones ia, Economic Development and Cultural Change 55 ( 1 ), 173-200.
Tomohara, A., and K. Yokota, 2006, Does Foreign Direct Investment Benefit Domestic Companies via Increased Productivity: Horizontal, Backward, and Forward Linkages, ICSEAD Working Paper Series. http://www.icsead.or.jpnpublicationlworkingpp/wp2006/2006-07.pdf.
Wang, J . Y. , and M. Blomstrom, 1992, Foreign Investment and Technology Transfer: A Simple Model, European Economic Review 36 ( I ), 137- 155.
Wang, H. 1. , and P. Schmidt, 2002, One-Step and T~o-Step Estimation of the Effects of Exogenous Variables on Technical Efficiency Leve l, Journal of Producrivity Analysis 18 (2), 129-144.
19 1