Embed Size (px)
Citation preview


Mata Kuliah di S2 PJ: 1. SIG 1: Basisdata dan IDS 2. Analisis Spasial 3. Pemodelan Spasial
Mata Kuliah Pemodelan Spasial:
S1 Fak. Geografi UGM
SIG 2 (Lanjut)
S2 PJ Fak. Geografi UGM
SIG 2: Pemodelan Spasial
S2 MTG UPN
Analisis Spasial : SIG
North Carolina State University
Geospatial Analysis and Modeling
SKKNI BIDANG IG


The GIS Levels at Geog …
GIS 1: Fundamentals of GIS, data structures and
operations
GIS 2: GIS modeling, raster based approaches, concepts
and techniques of modeling for complex spatial
problems
GIS 3: GIS programming, developing and implementing
new functionality and methods for GIS and spatial
modeling
http://www.colorado.edu/geography/class_homepages/geog_4203_s08/

Regardless of where your primary tech interests lie, having a solid understanding of today's most relied-upon computer science languages and programs is essential.
https://interestingengineering.com/this-70-hour-computer-science-bundle-will-teach-you-the-fundamentals-of-programming?utm_source=Facebook&utm_medium=Facebook_Ads&utm_campaign=Prospecting_Auto_BoostedPost_ComputerScience_A_SaleID%3D3707_4.2.2018

BEDA: 1.SIG 1: Basisdata dan IDS 2.Analisis Spasial 3.Pemodelan Spasial

1. SIG 1: Basisdata dan IDS

Spatial Data Infrastructure (SDI)
Technology, policies, criteria, standards and people necessary to promote geospatial
data sharing throughout all levels of government, the private and nonprofit sectors,
and academia. It provides a base or structure of practices and relationships among
data producers and users that facilitates data sharing and use. It is a set of actions
and new ways of accessing, sharing and using geographic data that enables far
more comprehensive analysis of data to help decision-makers chose the best
course(s) of action.
(Federal Geographic Data Committee (FGDC) http://www.fgdc.gov/nsdi/nsdi.html,
accessed July 12, 2006)
Geographic Information Systems (GIS)
Information systems that manage, manipulate and analyze spatial data. (Theobald,
2005, p. 2). Generic GIS can be viewed as a number of specialized spatial routines
laid over a standard relational data base management system. (Goodchild, 1985)
(Current GIS increasingly rely on object oriented technology.)
Zorica Nedović-Budić and Nama Raj Budhathoki

2. Analisis Spasial

• Data Capture – The input of data into a GIS can be achieved through many different methods of
gathering. For example, aerial photography, scanning, digitizing, GPS or global positioning system is just a few of the ways a GIS user could obtain data.
• Data Storage – Some data is stored such as a map in a drawer, while others, such as digital data, can
be as a hardcopy, stored on CD or on your hard drive.
• Data Manipulation – The digital geographical data can be edited, this allows for many attribute to be added,
edited, or deleted to the specification of the project.
• Query And Analysis – GIS was used widely in decision making process for the new commission districts. We
use population data to help establish an equal representation of population to area for each district.
• Visualization – This represents the ability to display your data, your maps, and information.
GIS Functions

Spatial analysis is how we understand our world—mapping where things
are, how they relate, what it all means, and what actions to take.
From computational analysis of geographic patterns to finding optimum
routes, site selection, and advanced predictive modeling, spatial analysis
is at the very heart of geographic information system (GIS) technology.
www.esri.com/products/arcgis-capabilities/spatial-analysis
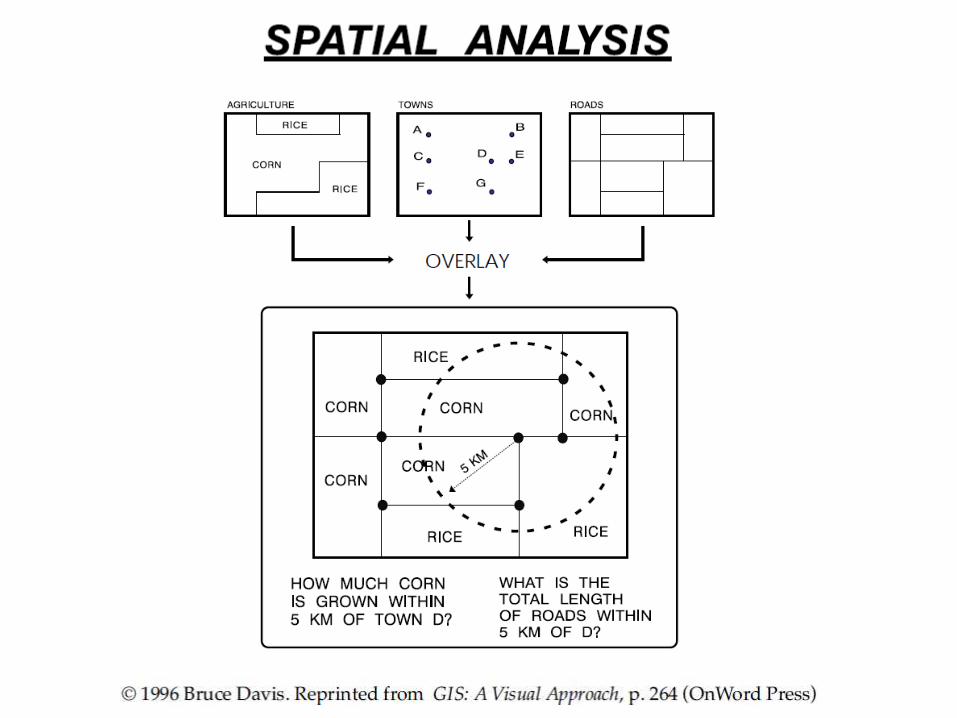
Spatial analysis
The process of examining the locations, attributes, and relationships
of features in spatial data through overlay and other analytical
techniques in order to address a question or gain useful knowledge.
Spatial analysis extracts or creates new information from spatial
data.
GIS Dictionary, ESRI

The true value of GIS lies in their ability to analyze spatial data using
the techniques of spatial analysis. Spatial analysis provides the value-
added products from existing datasets‖
Goodchild, 1988
Spatial analysis
Spatial analysis is a set of techniques for analyzing spatial data.
Goodchild (et al.) 1987/1992
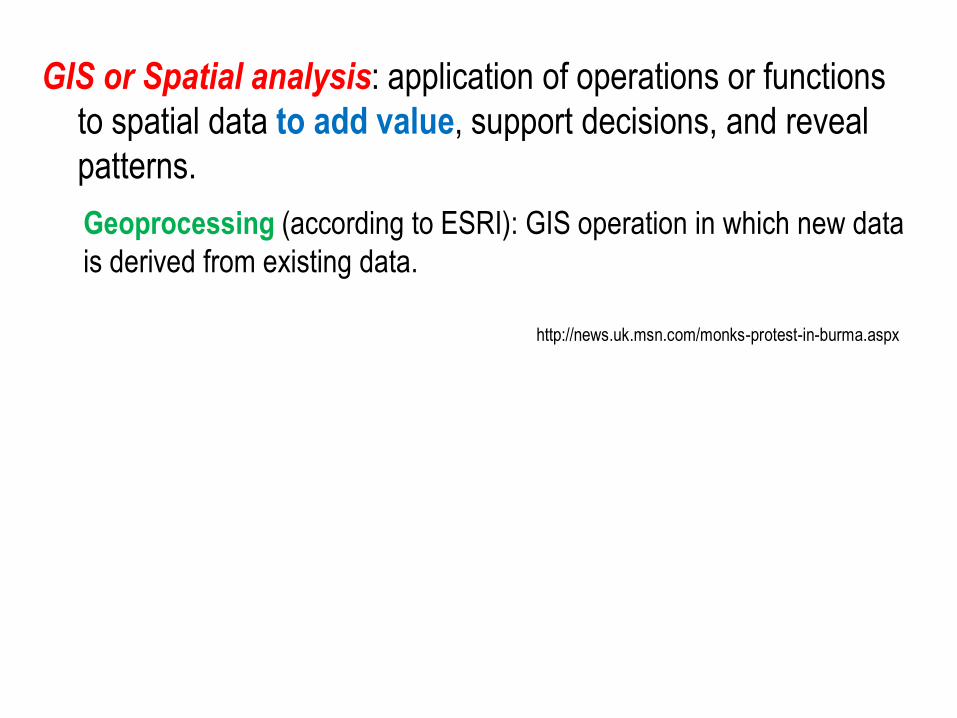
GIS or Spatial analysis: application of operations or functions
to spatial data to add value, support decisions, and reveal
patterns.
Geoprocessing (according to ESRI): GIS operation in which new data
is derived from existing data.
http://news.uk.msn.com/monks-protest-in-burma.aspx

Spatial analysis: Way in which we turn raw data into useful
information – A set of techniques whose results are dependent on the locations of
the objects being analyzed
– Variety of methods
– Powerful computers
– Intelligent users
Christine Erlien
• Some methods are highly mathematical.
• All effective spatial analysis requires an intelligent user, not just a
powerful computer.
• ―Spatial analysis is best seen as a collaboration between the
computer and the human, in which both play vital roles.‖
(Geographic Information Systems and Science, Wiley, 2001)
More about spatial analysis…

• Spatial analysis the crux of GIS because it includes all of the
transformations, manipulations, and methods that can be applied to
geographic data to add value to them, to support decisions, and to
reveal patterns and anomalies that are not immediately obvious
o Spatial analysis is the process by which we turn raw data
into useful information,
Examples:
John Snow map of cholera
http://dusk.geo.orst.edu/gis/465lec.html
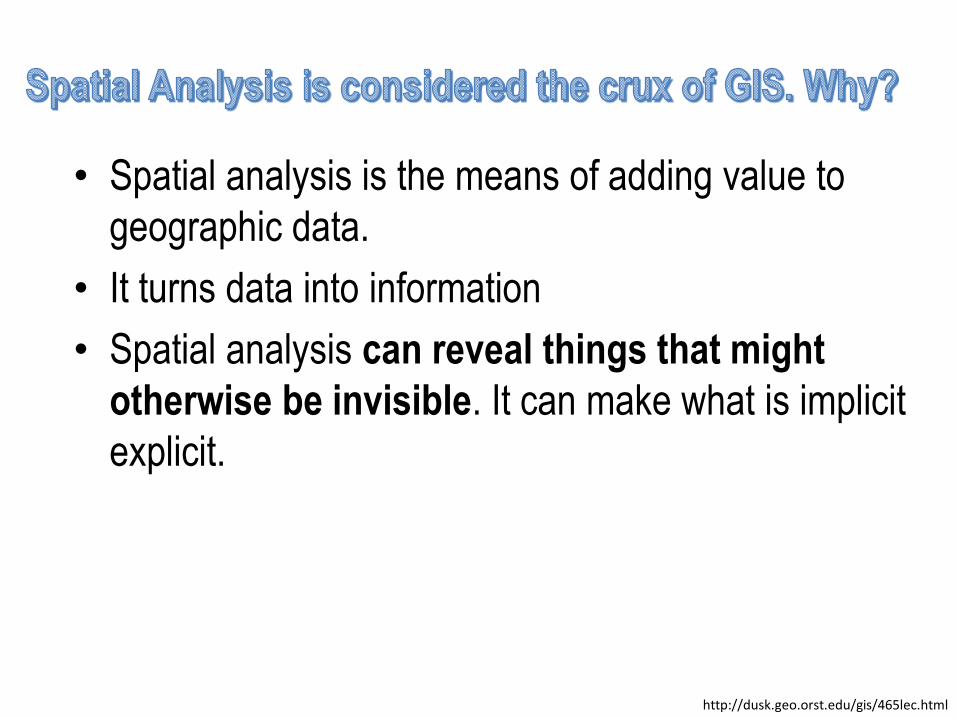
• Spatial analysis is the means of adding value to
geographic data.
• It turns data into information
• Spatial analysis can reveal things that might
otherwise be invisible. It can make what is implicit
explicit.
http://dusk.geo.orst.edu/gis/465lec.html

Pada tahun 1854, Dr. John Snow menghadapi permasalahan bencana kolera yang terjadi di distrik Soho,
London.
Secara teori ada 2 kemungkinan penyebab penularan penyakit kolera disana, yaitu:
1. yang paling populer masyarakat disana percaya bahwa kolera disebabkan kontaminasi udara kotor
dari areal bekas pekuburan kuno di pusat kota.
2. pendapat Dr. John Snow yang memperhatikan kemungkinan pemakaian air dari sumur-sumur yang
ada di kota tersebut.
Dr John Snow
(Source: John Snow, Inc.
www.jsi.com)
A modern replica of the pump that led
Snow to the inference that drinking
water transmitted cholera, located in
what is now Broadwick Street in Soho,
London
(Source: John Snow Inc. www.jsi.com)

Kemudian Dr. John Snow menarik garis-garis hubungan antara korban dengan kedekatan ke
lokasi pekuburan dan sumur.
Akhirnya, terungkap di atas peta sebuah pola yang sangat kuat menggambarkan hubungan antara korban dengan sumber air sumur yang diduga terkontaminasi.
Setelah menutup sumur tersebut pasien berkurang drastis, setelah diteliti, ternyata saluran kotoran rumah yang
ditanam 22 kaki telah bocor memasuki sumber air permukaan sedangkan sumur digali hanya selisih 6 kaki saja
(28 kaki) menyebabkan air yang terambil adalah bagian yang terkontaminasi.

Density of cholera deaths using a 100 m kernel density function


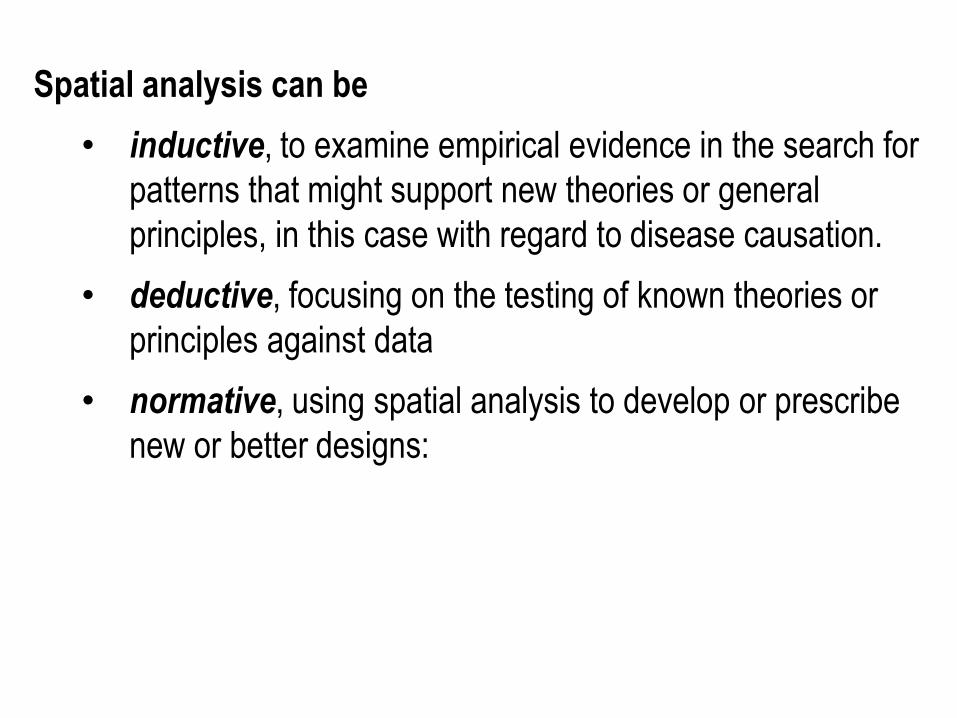
Spatial analysis can be
• inductive, to examine empirical evidence in the search for
patterns that might support new theories or general
principles, in this case with regard to disease causation.
• deductive, focusing on the testing of known theories or
principles against data
• normative, using spatial analysis to develop or prescribe
new or better designs:

Zonasi Sekolah
http://jogja.tribunnews.com/2018/02/26/sistem-zonasi-di-kota-yogyakarta-berlaku-mulai-tahun-ajaran-2018-2019

Tujuan Sistem zonasi :
agar tidak ada lagi sekolah favorit tertentu melainkan semua sekolah
menjadi sekolah favorit
PPDB berdasarkan sistem zonasi tersebut berdasarkan pada Peraturan Menteri
Pendidikan dan Kebudayaan Republik Indonesia nomor 17 tahun 2017 tentang
Penerimaan Peserta Didik Baru pada Taman Kanak-Kanak, SekolahDasar, Sekolah
Menengah Pertama, Sekolah Menengah Atas, Sekolah Menengah Kejuruan, atau Bentuk
Lain yang Sederajat.
Pada pasal 15 ayat (1) disebutkan bahwa skolah yang diselenggarakan oleh pemerintah daerah
wajib menerima calon peserta didik yang berdomisili pada radius zona terdekat dari sekolah paling
sedikit sebesar 90 persen dari total jumlah keseluruhan peserta didik yang diterima.
Selanjutnya pada ayat (5) disebutkan sekolah yang diselenggarakan oleh pemerintah daerah dapat
menerima calon peserta didik melalui jalur prestasi yang berdomisili diluar radius zona terdekat dari
sekolah paling banyak 5 persen dari total jumlah keseluruhan peserta didik yang diterima.
Jalur bagi calon peserta didik yang berdomisili di luar zona terdekat dari sekolah dengan alasan
khusus meliputi perpindahan domisili orangtua/wali peserta didik atau terjadi bencana alam/sosial,
paling banyak 5 persen dari otal jumlah keseluruhan peserta didik yang diterima

1. Dinas Pendidikan Kota Yogyakarta telah melakukan pengukuran jarak melalui
udara berbasis RW.
2. Pertimbangannya memang zonasi, tapi nilai ujian sekolah juga jadi pertimbangan
untuk masuk sekolah negeri. Kalau jaraknya sama, yang bersaing adalah nilainya
3. Terkait sebaran sekolah yang tidak merata, yakni SMP Negeri yang lebih banyak di
sisi utara, menurutnya bukanlah jadi masalah.Pasalnya setiap anak diberikan
keleluasaan untuk memilih SMP Negeri sesuai dengan prioritas pilihannya
maksimal di 16 sekolah.
4. kuota untuk siswa dalam daerah sebesar 90 persen, termasuk siswa KMS juga ikut
dalam kuota tersebut.
5. Sementara 5 persen jalur khusus misalkan orang tuanya merupakan pejabat yang
harus dinas di daerah yang berbeda dan 5 persen lain siswa dari luar daerah.
6. Jumlah SMP Negeri di Kota Yogyakarta adalah 16 sekolah, sementara jumlah SD
Negeri yang ada 89 sekolah dengan potensi lulusan SD sekitar 7.000 siswa.
Edy Heri Suasana (Kepala Dinas Pendidikan Kota
Yogyakarta), Senin, 26 Februari 2018 13:33

Data:
1. Agihan Lokasi Sekolah
2. Daya Tampung Sekolah
3. Peta administrasi dg unit tekecil RW
4. Peta Jaringan Jalan
5. Peta Penduduk
Analisis
1. Buffer
2. EUCLIDEAN DISTANCE
3. density analysis
4. Service Area
5. Cluster and Outlier Analysis (Anselin Local Moran's I)
6. Spatial Metrics
7. Thiessen
8. Hexagon/tessellation

Spatial analysis has something to do with deriving
information from data using the spatial context of the
problem and the data (e.g. their distributions or patterns)
It is exactly this - space - which makes it different

Spatial analysis is a type of geographical analysis
which seeks to explain patterns of human behavior
and its spatial expression in terms of mathematics
and geometry, that is, locational analysis.

james-eaton, 2014

Physical Geography
• Where and why natural forces occur
Human Geography
• Where and why human activities occur

The 3 “W’s” of Geography •What is where •Why is it there •Why do I care


http://jogja.tribunnews.com/2016/01/13/pasar-sentolo-belum-layak-jadi-percontohan?page=1

The connection between the terrain and features of the battlefield landscape and the military tactics employed by army commanders has been formalized by U.S. Armed Forces in a military terrain analysis process
known as OCOKA. The system is an acronym that stands for: O – Observation and Fields of Fire; C – Cover and Concealment; O – Obstacles; K – Key Terrain; A – Avenues of Approach
The OCOKA process is founded on the principle that ―terrain has a direct impact on selecting objectives; location, movement, and control of forces; effectiveness of weapons and other systems; and protective
measures


1. Search (thematic search, search by region)
2. Location analysis (buffer, corridor, overlay)
3. Terrain analysis (slope/aspect, drainage network)
4. Flow analysis (connectivity, shortest path)
5. Distribution (nearest neighbor, proximity, change
detection)
6. Spatial analysis/statistics (pattern, centrality, similarity,
topology)
7. Measurements (distance, perimeter, shape, adjacency,
direction)

1. Data Retrieval
2. Map Generalization
3. Map Abstractions
4. Map Sheet Manipulation
5. Buffer Generation
6. Polgygon Overlay And Dissolve
7. Grid Cell Analysis
8. Measurement
9. Digital Terrain Analysis
10. Output Techniques
3. Pemodelan Spasial


Modeling • Models allow planners to experiment with 'what-if' scenarios. • Models can be used for dynamic simulation, providing decision
makers with dramatic visualizations of alternative futures.
Groundwater vulnerability model in an
area of Ohio, USA. The model
combines GIS layers representing that
affect the groundwater, and displays the
results as a map of vulnerability ratings
Any model forecast should be accompanied by a realistic measure of uncertainty.

• Spatial data manipulation – The basic functions of any GIS (e.g. data projection).
• Spatial data analysis – Descriptive and exploratory functions using maps (e.g.
overlays).
• Spatial statistical analysis – Uses statistical methods to determine if spatial data are
“typical” or “unexpected” relative to a statistical model.
• Spatial modelling – Constructing models to predict spatial outcomes.
© J.M. Piwowar

Model merupakan representasi dari beberapa bagian dunia nyata, hal ini
dikarenakan representasi dari sebuah model memiliki karakteristik yang sama
dengan dunia nyata dalam SIG model yang biasa digunakan adalah peta, peta
merupakan representasi miniatur dari beberapa bagian yang ada di dunia nyata
(de by, 2004).
Model yang direlasikan dengan koordinat geografi dinamakan model spasial.
Sedangkan Proses untuk memanipulasi dan menganalisis data spasial
atau data geografis untuk menghasilkan informasi yang berguna untuk
memecahkan masalah yang kompleks dinamakan Pemodelan Spasial.
Skidmore (2002) mengatakan bahwa berdasarkan terminologi model yang
ditemukan dalam SIG model disini merupakan model logic (deduktif dan
induktif) dan model berdasarkan pada pengolahanya (deterministik dan
stokastik) sebagaimana pada tabel taksonomi sebuah model.
Model

Rin Brigg, 2008

Sumber : Skidmore (2002)

Model deduktif
Model deduktif menarik kesimpulan yang spesifik (yang menghasilkan proporsi baru) dari
sebuah set yang umum. Dengan kata lain model deduktif berasal dari kebenaran kebanaran
umum untuk menghasilkan sebuah kesimpulan yang lebih spesifik.
Model induktif
Logika argument induktif dianggap identic dengan metode alam, fisik dan ilmu-ilmu social.
Argument induktif memperoleh kesimpulan dan fakta tertentu dari fakta fakta tertentu yang
muncul sebagai bukti dari suatu kesimpulan. Dengan kata lain serangkaian fakta dapat
digunakan untuk memperoleh atau membuktikan pernyataan umum.
Model deterministik
Model deterministik memiliki output yang tetap untuk masukan yang spesifik. Model
deterministik berasal secara empiris dari pengukuran plot lapangan, meskipun aturan
ataupun pengetahuan dapat dirumuskan dalam sistem pakar dan secara konsisten akan
menghasilkan output yang diberikan untuk masukan yang spesifik. Model deterministic bisa
merupakan model induktif maupun deduktif
Model Stokasitik
Inti dari sebuah model stokastik adalah jika input data atau parameter model bervariasi
secara acak dan outputnya juga bervariasi. Model stokasik semakin sering digunakan dalam
sebuah pemodelan seperti model jaringan saraf umumnya dilakukan dengan menggunakan
backpropagation (BP).

1. Spatial Autocorrelation
2. Geographically Weighted Regression
3. Spatial Metrics
4. Voronoi Method
5. Multi-criteria Decision Making and Analytical Hierarchy
Process
6. Fuzzy Logic
7. Cellular Automata
8. Artificial Neural Network
9. Weight of Evidence
10. Markov Chain
11. Agent Based Model

• Model: penyederhanaan deskripsi realitas
• Pemodelan: bisa dianggap sebagai proses
• Model Spasial (= Model SIG) menjelaskan sifat dasar dan proses
untuk satu set fitur spasial
• Pemodelan Spasial adalah Gambaran matematis tentang struktur
dari sebuah fenomena spasial, untuk keperluan prediksi/evaluasi.
Disusun berdasarkan pengetahuan spesifik tentang suatu
fenomena spasial, biasanya berupa kombinasi dari beberapa operasi
spasial terhadap sekumpulan data spasial.
• Tujuannya mempelajari objek atau fenomena spasial di dunia nyata

Model adalah abstraksi dari realitas dengan hanya memusatkan perhatian pada
beberapa sifat dari kehidupan sebenarnya (Simamarta, 1983). Sebagai contoh
adalah model pesawat, model rumah (maket) dsb.
Model Spasial adalah model yang menggambarkan sifat dasar dan atau proses
untuk satu set fitur spasial (Bolstad, 2013). Sebagai contoh adalah peta
penggunaan lahan, peta administrasi, peta rawan longsor, globe dsb.
Pemodelan Spasial adalah suatu proses yang dilakukan untuk membangun
model spasial. Lebih menekankan pada prosesnya. Sebagai contoh adalah
pemodelan tsunami dengan bantuan SIG, pembuatan peta rawan bencana
tsunami dsb.
Analisis Spasial adalah sekumpulan metode; perspektif: alat analisis pada
kerangka spasial (Longley et al., 2005). Hal ini mencakup Queries,
Measurements, Transformations, Descriptive Summaries, Optimization dan
Hypothesis. Sebagai contoh adalah buffer, overlay polygon, spatial interpolation
dsb.

Modeling
• In the field of GIS, modelling provide
understanding of the way the world works with
sufficient precision and accuracy to allow
prediction and confident decision-making.
• Modeling concern the way in which analyses are
carried out using standard functionality
64 Spatial Analysis and Modelling by Tadele
Feyssa, Wollega University
Einstein said "as far as models represent
reality the are in-precise and as far as they
are precise they do not represent reality" (source unknown)

Pemodelan merupakan elemen kunci pada kebanyakan DSS
Current trends
Multidimensional analysis (modeling) A modeling method that involves data analysis in several dimensions
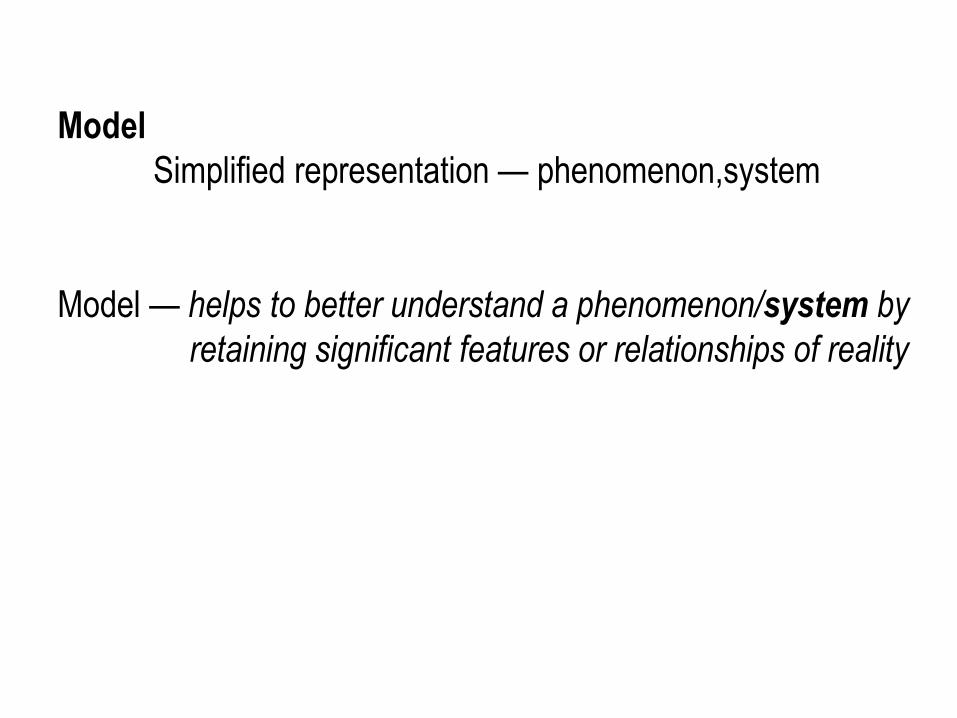
Model
Simplified representation — phenomenon,system
Model — helps to better understand a phenomenon/system by
retaining significant features or relationships of reality


The benefits of models
• Model manipulation is much easier than manipulating a
real system
• Models enable the compression of time
• The cost of modeling analysis is much lower
• The cost of making mistakes during a trial-and-error
experiment is much lower when models are used than
with real systems
• With modeling, a manager can estimate the risks
resulting from specific actions within the uncertainty of
the business environment
• Mathematical models enable the analysis of a very large
number of possible solutions.

Analytical procedures applied with GIS. It is the set of
procedures that simulates real-world conditions within a GIS
using the spatial relationships of geographic features. http://www.webopedia.com/TERM/S/spatial_modeling.html
spatial modeling
A methodology or set of analytical procedures used to derive
information about spatial relationships between geographic
phenomena. http://support.esri.com/en/knowledgebase/GISDictionary/term/spatial%20modeling

Briggs Henan University 2010 72
Spatial Analysis: successive levels of sophistication
1. Spatial data description: classic GIS capabilities – Spatial queries & measurement, – buffering, map layer overlay
2. Exploratory Spatial Data Analysis (ESDA): – searching for patterns and possible explanations – GeoVisualization through data graphing and mapping – Descriptive spatial statistics
3. Spatial statistical analysis and hypothesis testing – Are data “to be expected” or are they “unexpected”
relative to some statistical model, usually of a random process
4. Spatial modeling or prediction – Constructing models (of processes) to predict spatial
outcomes (patterns)

http://www.innovativegis.com/basis/mapanalysis/Topic4/Topic4.htm

There are three types of data analysis:
• Descriptive (business intelligence and data mining)
• Predictive (forecasting)
• Prescriptive (optimization and simulation)
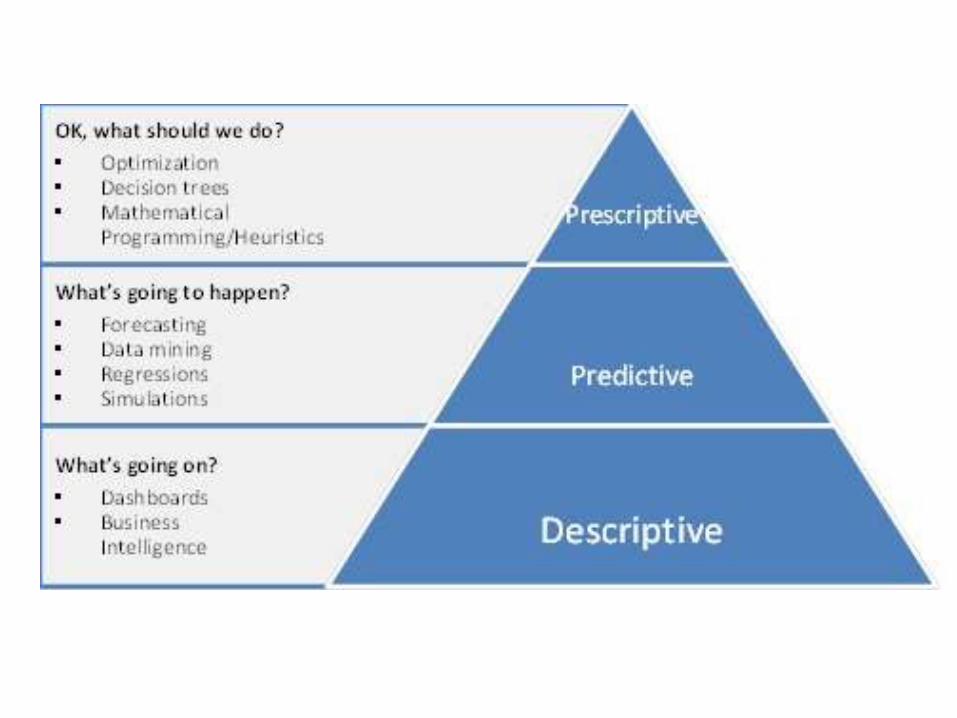

Descriptive Analytics - What is going on?
• Descriptive analytics deals with organizing, manipulating, visualizing, and describing actual data.
• descriptive analytics is synonymous with business intelligence. It also includes dashboards, reports, and
advanced visualizations.
Predictive Analytics – What will happen?
• Predictive analytics deals with predicting unknown data based on actual data and other knowledge.
• Predictive analytics is generally performed using statistical methods such as regressions and simulations,
probabilistic models, and increasingly data mining or machine learning techniques.
Prescriptive Analytics – OK, what should we do?
• Prescriptive analytics deals with prescribing optimal or near-optimal business actions based on actual
and/or predicted data.
• This is the elusive answer to the ―so what?‖
• It is not about predicting what will happen, it is about deciding what should be done.
• Prescriptive analytics is primarily the realm of optimization and mathematical programming (MP) which
includes linear programming (LP), integer programming (IP), non-linear programming (NLP), constraint
programming (CP) etc. It also includes heuristic algorithms for sub-optimal solutions, and simulation based
and stochastic optimization.
• Additionally, decision trees, what-if analyses, and scenario planning are less sophisticated forms of
prescriptive analytics.

What is a model? • A simplification of nature.
• A representation of a set of objects and their
relationships.
• A model is a way of describing something that cannot
be directly observed.
• A model is a way of communicating complex ideas.
Gary L., 2006

Definition of “Model”
• Simplified, idealized representation of a part of the real world
• Learning Tool
• Experimental Tool
• Constantly tested by comparison with the real world
• Useful insofar as they explain or simulate the real world
Michael Piasecki, 2014

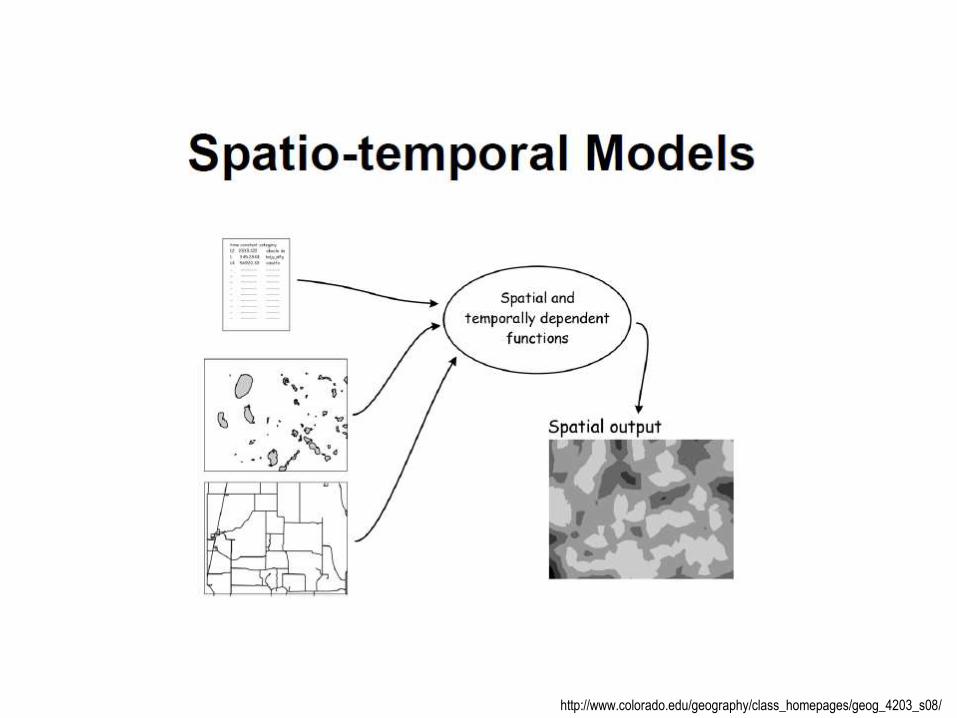
What do Spatial Models Do? • Using spatial data
• Making use of combined functional capabilities such
as analytical tools for spatial and non-spatial
computation, GIS and programming languages
• The focus is on the meaning of the model - modeling
is more than just applying analytical tools
• Representing meaningful features, events and
processes in geographical space
http://www.colorado.edu/geography/class_homepages/geog_4203_s08/

Lauren Bennett, Flora Vale

1. Pose a question (explore, frame, scope) 2. Model and compute (Assemble a logical sequence of GIS
operations to derive new information) 3. explore and interpret results (map, summarize, graph,
compare) 4. Decide (Make decisions, document your results, determine
next steps) 5. Share your results (communicate as useful maps and
information products, tell your story)
Lauren Bennett, Flora Vale

GIS Modeling
• Representation Modeling
• Exploratory Data Analysis
• Environmental Modeling
Environmental Risk Assessment
Atmospheric Modeling
Soil Erosion Modeling
Hydrological
o Topographic Modeling
o Watershed Analysis
o Dynamic Modeling
• Land‐water interactions
• Habitat Modeling
• Human‐Environment Modeling
Land Suitability Modeling
Land‐use/land‐cover change
o Economic models (Walker)
o Agent‐based models
Archaeological Modeling
Decision‐Support Systems
o Land allocation
o Agroforestry (Ellis)
• Business/Economic Modeling – Thrall
• Emergency Management
Michael Piasecki, 2014

Example Areas Where Challenging to Make Effective
Decisions
• Computer systems operation
• Corporate strategy (e.g. project launching)
• Corporate operations (e.g. ordering policy,based on
inventory & past orders)
• Municipal planning
• Managing an industrial or power plant
• Road network planning
• Project management

Models come in many, many flavors
• Analysis Models – Step‐by‐step description of how problems are solved.
• Representation models – images, dioramas, wind‐tunnel models, flow
channels, sand tables, maps, globes.
• Conceptual models ‐ no numerical values or formulas
• Theoretical models ‐ with numerical values or formula
• Empirical models ‐ based on observations, but the mechanism may be
unknown. o Statistical, e.g. Regression Models
o Rule‐based Models
o Models based on many measurements (e.g. USLE, RUSLE)
• Physical‐mathematical models ‐ based on physical laws, first principles
• Stochastic models ‐ bases on the concept of randomness and
probability: Random numbers simulate variation.
Michael Piasecki, 2014

KLASIFIKASI MODEL
Bahan Ajar Kuliah Simulasi dan Permodelan Jurusan Teknik Informatika UII
Tipe Klasifikasi Tipe Model
Fungsi Deskriptif (kondisi nyata )
Prediktif (meramalkan)
Normatif ( seharusnya )
Struktur / Morfologi Ikon Analog Simbolik
Waktu Statik Dinamik
Aspek Informasi Deterministik (pasti/tentu)
Probabilistik (tidak pasti/tidak tentu)
Tingkat Generalisasi Umum Khusus
Interaksi dgn lingkungan Terbuka Tertutup
Tingkat Kuantifikasi Kualitatif Kuantitatif
Dimensi 2 dimensi 3 dimensi 85

Michael Piasecki, 2014

Michael Piasecki, 2014

Maybe we understand more if we look at some taxonomies of operators for spatial analysis such as…
http://www.colorado.edu/geography/class_homepages/geog_4203_s08/

http://www.colorado.edu/geography/class_homepages/geog_4203_s08/

http://www.colorado.edu/geography/class_homepages/geog_4203_s08/

http://www.colorado.edu/geography/class_homepages/geog_4203_s08/
Does it help? • As you can see there are (as expected) many different
approaches to build a taxonomy
• You have seen three of them: one based on category of
technique, one based on the conceptual model and
one based on the data model used
• What most of them have in common is: They include
most of the (functional) operations in a GIS, somehow
• Let‘s look at some examples

http://www.colorado.edu/geography/class_homepages/geog_4203_s08/

http://www.colorado.edu/geography/class_homepages/geog_4203_s08/

http://www.colorado.edu/geography/class_homepages/geog_4203_s08/

http://www.colorado.edu/geography/class_homepages/geog_4203_s08/
So maybe it’s rather: How to use SA? • The three examples gave you an impression in which
contexts SA can be used (and this comes along with
Openshaw and Goodchild & Longley in Longley et al. 2005
• Explore / describe spatial patterns and relationships
(exploratory/descriptive approach)
• Testing hypotheses regarding spatial patterns and
relationships (explanatory/confirmatory approach)
• Simple analysis for criteria evaluation


http://www.colorado.edu/geography/class_homepages/geog_4203_s08/
What is a Spatial Model • Spatial models (at some places GIS models) might describe
basic properties and processes for a set of spatial features
• The aim is to study spatial objects or phenomena in the real
world
• As you can imagine we also find dozens of definitions and many
different classification schemes - we will look at three of them

http://www.colorado.edu/geography/class_homepages/geog_4203_s08/

http://www.colorado.edu/geography/class_homepages/geog_4203_s08/
http://www.colorado.edu/geography/class_homepages/geog_4203_s08/


http://www.colorado.edu/geography/class_homepages/geog_4203_s08/
Spatial and GIS Models II
(Goodchild 2003)
• Data models: Entities and fields as conceptual models
• Static modeling: taking inputs to transform them into outputs
using sets of tools and functions
• Dynamic modeling: iterative, sets of initial conditions, apply
transformations to obtain a series of predictions at time intervals

http://www.colorado.edu/geography/class_homepages/geog_4203_s08/
Spatial and GIS Models III (DeMers 2005)
• Based on purpose
descriptive - passive, description of the study area
prescriptive - active, imposing best solution
• Based on methodology
stochastic - based on statistical probabilities
deterministic - based on known functional linkages and interactions
• Based on logic
inductive - general models based on ind. data
deductive - from general to specific using known factors and relationships


http://www.colorado.edu/geography/class_homepages/geog_4203_s08/
So what about Spatial Modeling …? • ‗Modeling‘ per se is one of the most overloaded terms anywhere
• Reason enough to think about what exactly we think of by referring
to spatial modeling
• Generally, a model is a (simplified) description of reality (static
reproduction, conceptual description)
• Modeling can (or should) be considered as a process …

http://www.colorado.edu/geography/class_homepages/geog_4203_s08/
Modeling Process and its Components Prior to carrying out the modeling process it is helpful to find answers to four questions
(DeMers 1,5):
• What is the model to tell us (explaining, predicting relationships or consequences /
evaluating situations for resource uses,…)? Or simply: Do we understand what the
problem is?
• What type of data do I need?
• How to create a design to put the model together?
• How to apply existing tools, carefully and appropriately to derive meaningful
models?
• Validation and verification as important steps are touched later

http://www.colorado.edu/geography/class_homepages/geog_4203_s08/
What is GIS Modeling? • GIS Modeling is a PROCESS
• Need of a way to ―think spatially‖
• How to represent (abstract) our world in a GIS?
• What are the visible or functional patterns
• What are the spatial relationships between representations in
the geographic space?
• What can these relationships tell us and how can we
combine/measure/examine them to derive meaningful models?
• As always, a structure is helpful!!

Karakteristik dari model adalah: 1. mampu menggambarkan sistem nyata secara rinci, 2. mampu menerangkan bentuk-bentuk interaksi elemen
dengan jelas, dan 3. mampu meramalkan kondisi-kondisi di masa datang
secara realitas.

Modeling
• Models are used in many different ways, from simulations of how the world works, to evaluations of planning scenarios, to the creation of indicators of suitability or vulnerability
• Model is a simplification of reality in be viewed as a model.
Tadele Feyssa, Wollega University

Modeling
• In the field of GIS, modelling provide understanding of the way the world works with sufficient precision and accuracy to allow prediction and confident decision-making.
• Modeling concern the way in which analyses are carried out using standard functionality
Tadele Feyssa, Wollega University

Modeling
• One of many uses of GIS analysis tools is to build models.
• A model is a simplified representation of a phenomena or a system.
• A model helps us better understand a phenomenon or a system by retaining the significant features and relationships of reality.
Tadele Feyssa, Wollega University

https://www.feat.nl/examples/slope_stab/slope_stab.html
FS Safety factor for slope stability
h Thickness of cover soil perpendicular to the slope (m)
β Slope inclination angle (o)
δ Geomembrane-soil interface friction angle (o)
c Geomembrane-soil interface adhesion (kPa)
γ Total unit weight of the cover soil (kN/m3)
ug LFG pressure (kPa)
where:
SLOPE STABILITY

http://www.landfilldesign.com/cgi-bin/gasstability.pl?cover_soil_thick=1&slope=60&geomem_angle=22&geomem_adhes=0&cover_soil_weight=16&lfg_press=2


Washington Mudslide: How it Really Happened
3/28/2014 12:12PM A mixture of heavy rain and soft soil created a recipe for disaster in Oso, Wash. WSJ's Jason Bellini
reports. Photo: Next Media Animation.

http://www.mdpi.com/2073-4441/5/1/262/htm
Flow diagram of P-index calculations using ArcView model builder

Sistem adalah proses, penggunaan kata system bisa di deskripsikan sebagai ide atau
konstruksi.
Model proses paling sederhana dari sebuah system didasarkan pada input, output, dan
system itu sendiri-yang ditampilkan sebagai proses.
Scott (1996) mengatakan sistem terdiri dari unsur-unsur seperti: masukan (input) ,
pengolahan (processing) , serta keluaran (output).
Ciri pokok sistem menurut Gapspert ada empat, yaitu:
1. sistem itu beroperasi dalam suatu lingkungan,
2. terdiri atas unsur-unsur,
3. ditandai dengan saling berhubungan dan
4. mempunyai satu fungsi atau tujuan utama.
Model sistem

Sistem adalah kumpulan obyek yang saling berinteraksi dan bekerja sama untuk mencapai tujuan logis dalam suatu lingkungan yang kompleks.
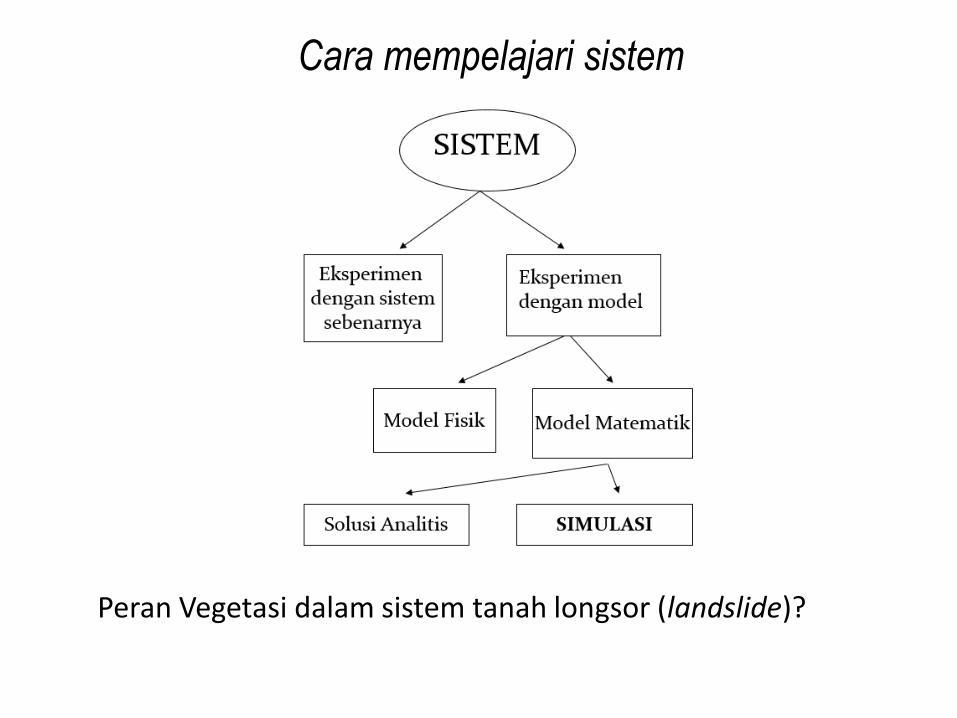
Cara mempelajari sistem
Peran Vegetasi dalam sistem tanah longsor (landslide)?


• Step 1. Stating the problem.
– What is the goal?
• Step 2. Breaking the problem down.
– What are the objectives.
– What are the objects and their interactions (process
model).
– What datasets (data model and presentation model)
will be needed

• Step 3. Exploring the datasets
– What is contained in the datasets
– what relationships between the datasets
• Step 4. Performing analysis (spatial analysis)
– Which tools to run the process models and build a overall
model
• Step 5. Verifying the model’s result
– Does any thing in the model need to be changed?
– If yes, go back to step 4
• Step 6. Implementing the result

Michael Piasecki, 2014


Michael Piasecki, 2014

Michael Piasecki, 2014

Michael Piasecki, 2014

Michael Piasecki, 2014

Michael Piasecki, 2014

Michael Piasecki, 2014
Michael Piasecki, 2014

Michael Piasecki, 2014

Michael Piasecki, 2014

Michael Piasecki, 2014

Finding the suitable forest land for harvesting
Criteria: • Can harvest with in 300 ft . of roads • Can’t harvest with in 500 ft. of streams
Required datasets: • Roads • Streams • Forest


Spatial multi-criteria decision analysis for safe school site selection


Air Pollution Index (API) reading
Bukhari , Z., Rodzi A. M., Noordin A. Spatial and Numerical
Modeling Laboratory, Institute of Advanced Technology,
Universiti Putra Malaysia 43400 Serdang, Selangor, Malaysia, 2010


This problem is a good example of multi-criteria decision problem. Criteria include:
– Religion
– Beauty
– Wealth
– Family status
– Family relationship
– Education
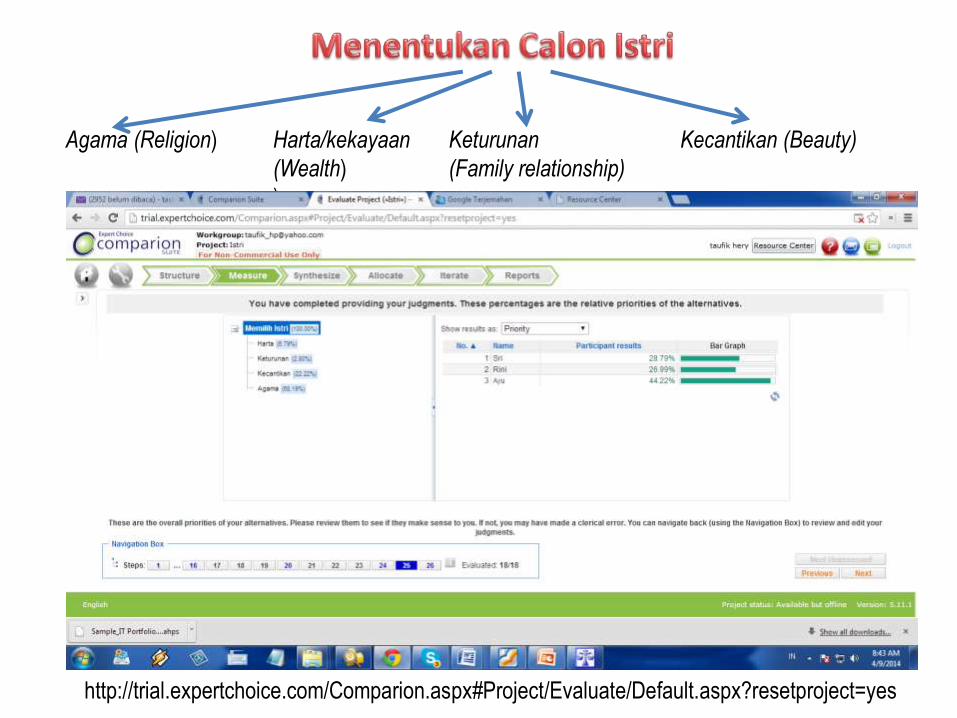
Agama (Religion) Harta/kekayaan
(Wealth)
)
Keturunan
(Family relationship)
Kecantikan (Beauty)
http://trial.expertchoice.com/Comparion.aspx#Project/Evaluate/Default.aspx?resetproject=yes


Schematic illustration of a multi-objective, multi-criteria evaluation system, under the main objective
heading of slope stability analysis and with several possible outcomes (or environmental states)


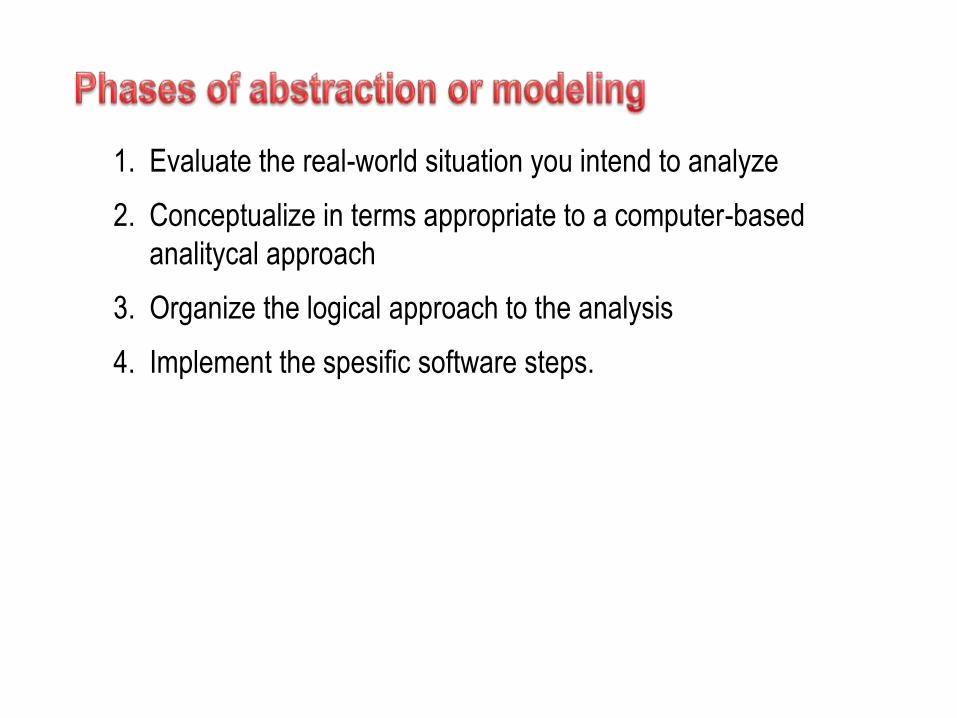
1. Evaluate the real-world situation you intend to analyze
2. Conceptualize in terms appropriate to a computer-based
analitycal approach
3. Organize the logical approach to the analysis
4. Implement the spesific software steps.

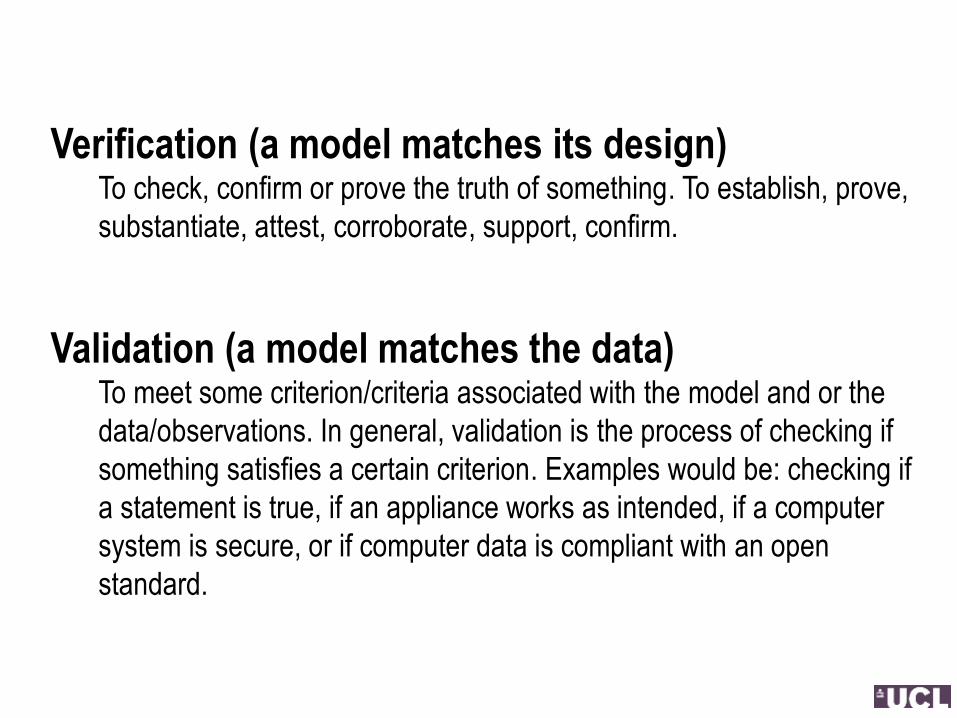
Verification (a model matches its design) To check, confirm or prove the truth of something. To establish, prove,
substantiate, attest, corroborate, support, confirm.
Validation (a model matches the data) To meet some criterion/criteria associated with the model and or the
data/observations. In general, validation is the process of checking if
something satisfies a certain criterion. Examples would be: checking if
a statement is true, if an appliance works as intended, if a computer
system is secure, or if computer data is compliant with an open
standard.
Calibration and Estimation Calibration is the generic process of validation and verification.
Estimation is the process or method of generating a precise estimate
of some parameter characterising the model.
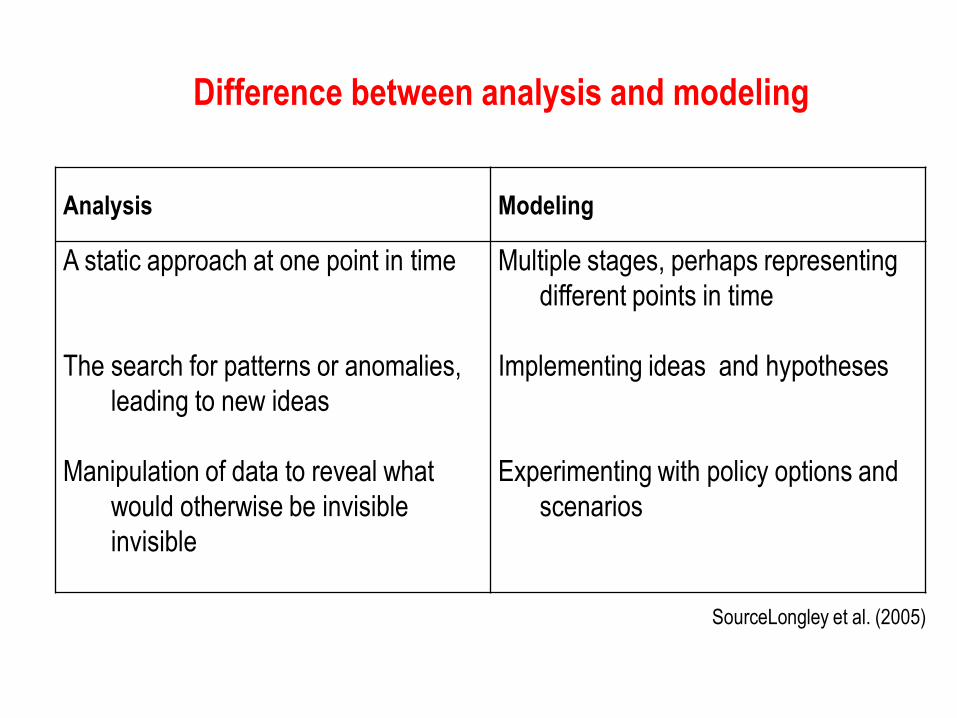
Difference between analysis and modeling
Analysis Modeling
A static approach at one point in time
The search for patterns or anomalies,
leading to new ideas
Manipulation of data to reveal what
would otherwise be invisible
invisible
Multiple stages, perhaps representing
different points in time
Implementing ideas and hypotheses
Experimenting with policy options and
scenarios
SourceLongley et al. (2005)


One large model that could be broken into four submodels and one main model

The smaller submodels can be added to a main model and connected to a final process

Wind Prospecting model scheme

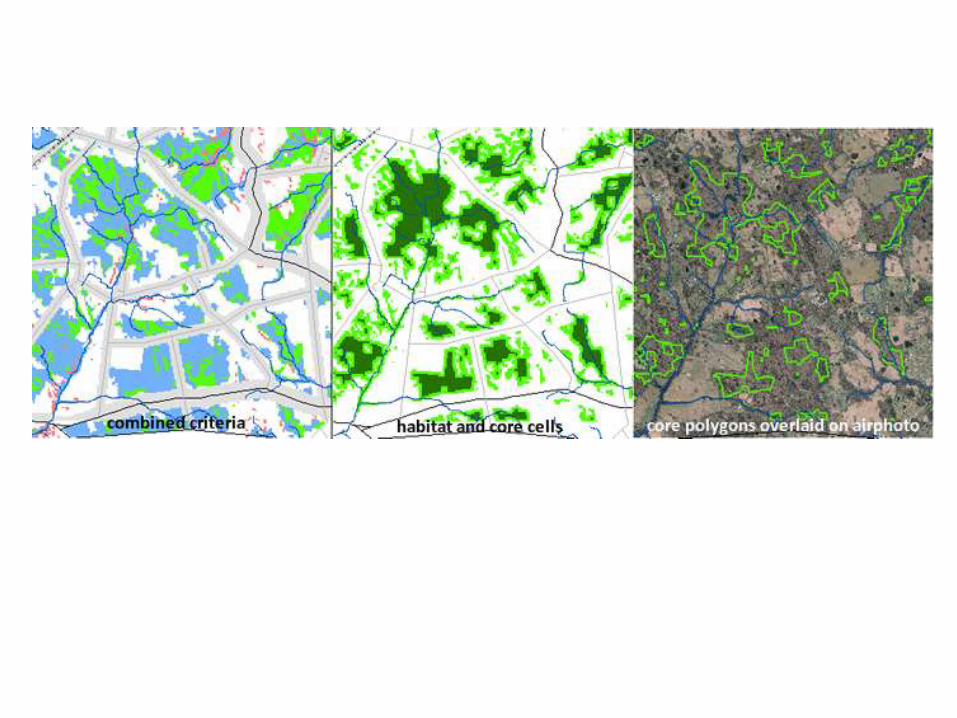
Habitat Analysis
To identify prime habitat areas for the endangered pickled strumpet (Trollopensis bibulosa) in New
Castle County
Field biologists have given you the following habitat criteria:
1. slope of 2 degrees or less, and
2. either freshwater wetland (LULC1=6) with elevation > 16 feet or
forest (LULC1=4) within 250 meters of streams, and
3. at least 200 meters from primary roads (select CFCC categories up to A36 plus A63 highway on-off
ramps) and
at least 100 meters from all other roads (switch the selection) and
at least 100 meters from all rail lines.
https://sites.google.com/a/udel.edu/apec480-s15/a2

The final lab of this course will be to create a mine suitability model for Trempealeau County, Wisconsin.
As has been previously stated in the labs, Trempealeau County, located in western Wisconsin located in
a region very popular for frac sand mining. We will be looking specifically at the lower half of the county.
This is primarily done so the geoprocessing processing takes a shorter amount of time.
Two models will be used: one to show where sand mining is suitable and the other to show where sand
mining is risky. This index determines where it would be best to develop frac sand mines in Trempealeau
County (figure 1). The goal is to create a final map which depicts the best locations for sand mining with
minimal impacts to the environment and humans.
http://emilymoothartgeography337.blogspot.co.id/

Objectives:
Suitability for mining
Generate a spatial data layer to meet the criteria for:
1. Geology
2. Land Cover (suitable and non-suitable)
3. Proximity to Rail Terminal
4. Slope
5. Water-table depth
6. Then combine the criteria to develop a suitability index model
Risk for mining
Generate a spatial data layer to measure impacts to:
1. Streams
2. Prime farmland
3. Residential and populated areas
4. Schools
5. Wildlife areas
6. Then combine the factors into a risk model
7. Examine the results in proximity to prime recreational areas

Methods and Results:
The work flow seen below (figure 2) developed the first suitability model. Some of the input feature classes that
were originally vector needed to be changed from a feature to raster, this was done using the 'Feature to Raster'
tool. The 'Euclidean Distance' tool created a distance to closest source raster. This tool basically serves as a
'Buffer' tool within raster. The 'Reclassify' tool was then run to rank the distance of the nominal variable as being
suitable, or not suitable for frac sand mine location. The raster calculator was used to add the reclassified feature
classes, which resulted in a suitability index.
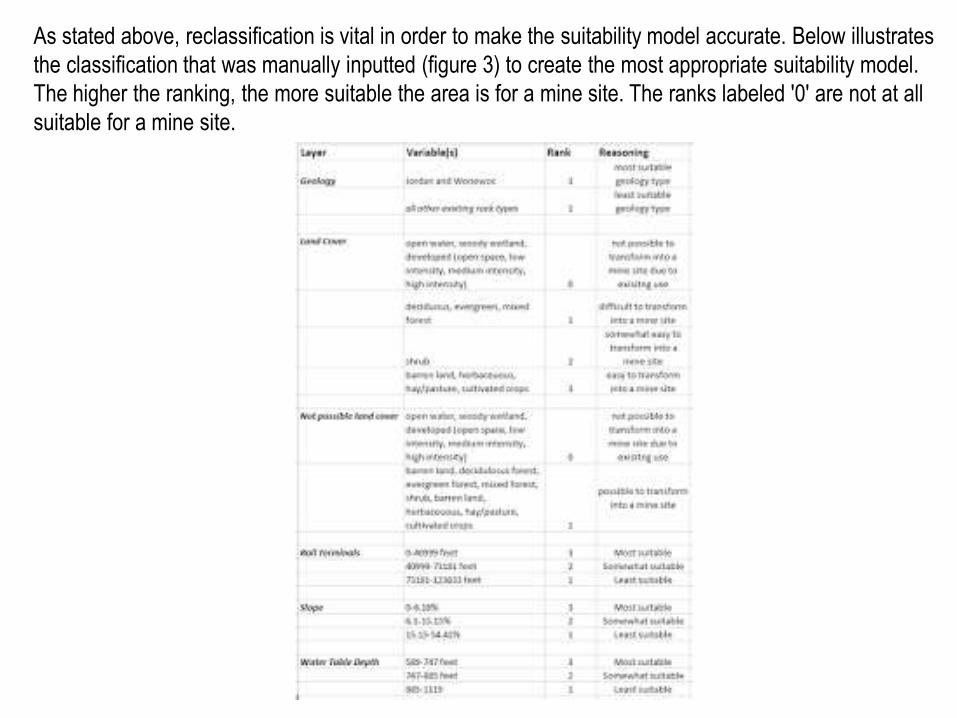
As stated above, reclassification is vital in order to make the suitability model accurate. Below illustrates
the classification that was manually inputted (figure 3) to create the most appropriate suitability model.
The higher the ranking, the more suitable the area is for a mine site. The ranks labeled '0' are not at all
suitable for a mine site.

The individual maps that were created from the reclassification are seen below (figure 4). The green
areas on the maps were manually ranked the highest in the reclassification tool. The center top map
(figure 4) was calculated using the 'Raster Calculator' tool to 'add up' the rasters.

A very similar workflow was used on the impact model. The feature classes in the model include
streams, prime farmland, residential areas, schools, and wildlife areas. The workflow can be seen
below (figure 5).

The specific reclassification ranks that were assigned to the features (figure 6). Unlike the suitability
model, a high rank was given to features that are the most impactful to the environment and people.
Below illustrates the classification that was manually inputted (figure 6) to create the most appropriate
impact model. The distances are all ranked similarly because the closer the mine is to the feature (ie
streams and prime farmland), the more impacted the feature is.


An additional analysis piece that was used during the lab was a weighted impact model. This was done through Py
Scripter to determine a weighted index model using features of the previous impact model, with specific weight on
the residential area, thus making that specific feature more 'important'. A weight of '1.5' was used to emphasize
residential areas. The script for the lab can be seen here. A comparative map was created to show the difference
between the weighted and regular impact models (figure 8).

Another added component that was included for this lab was using the viewshed tool. This tool takes
an observation point and calculates the estimated area that can be seen from the observation point
using a digital elevation model (DEM).

The final set in completing the overall suitability model was using the raster calculator tool to 'add up'
the calculated impact and calculated suitability features. The workflow can be seen below (figure 11).
Its related map is also below (figure 12)

Conclusion:
As frac sand mining will likely become more popular as demand for the sand increases, it is important to
develop accurate and relevant suitability models. Without the proper use of this GIS technology, there could be
many implications that could leave the environment, people, and mining resources in jeopardy. Not only that,
but the specific mining company that would hypothetically use our suitability model could lose millions of dollars
from developing a mine on unsuitable land.
Discussion:
One of the most challenging components of creating the suitability model was creating a logical ranking for the
reclassification. It is very easy to develop a random numbering system, but to make the project more accurate,
it is important to consider logical breaks when reclassifying rasters. This takes someone who has a relatively
expansive knowledge of the subject and how it should be applied in the real world.
Through trial and error throughout this lab, it is apparent that it is very easy to 'sway' the data depending on how
the rasters are reclassified, however, it is very important to take time and consider the implications of a
miscalculated impact or suitability model.
I personally really enjoyed this lab because it is extremely relevant to the real world and used a large number of
the tools that I have gained over my two formal GIS courses. It is labs like this that get me excited to be able to
use GIS as a took to make important environmental decisions in the future.

Source:
Bureau of Transportation Statistics. (n.d.). Rail terminals feature class. Retrieved December 6,
2015,
from http://www.rita.dot.gov/bts/sites/rita.dot.gov.bts/files/subject_areas/geographic_information
_services/index.html
Land Records. (n.d.). Trempealeau County Land Records. Geodatabase. Retrieved December
6, 2015, from http://www.tremplocounty.com/landrecords/
United States Geological Survey, National Map Viewer. National Land Cover Database (NLCD)
raster and DEM. (n.d). Retrieved December 6, 2015, from http://nationalmap.gov/viewer.html
Wisconsin Geological and Natural History Survey (GNHS). Water table contours. GIS data.
(n.d). Retrieved December 6, 2015, from http://wgnhs.uwex.edu/map-data/gis-data/
Wisconsin Geological and Natural History Survey (WGNHS). B.A. Brown, 1988. Bedrock
Geology of Wisconsin, West-Central Sheet, WGNHS Map 104. Digitizing by Beatriz Vidru
Linhares, University of Wisconsin Eau Claire (UWEC). Retrieved from UWEC GIS resources.
http://emilymoothartgeography337.blogspot.co.id/