Embed Size (px)
Citation preview

Materials Science & Engineering A 660 (2016) 172–180
Contents lists available at ScienceDirect
Materials Science & Engineering A
http://d0921-50
n CorrE-m1 Fo
versity
journal homepage: www.elsevier.com/locate/msea
Developing a phenomenological equation to predict yield strengthfrom composition and microstructure in β processed Ti-6Al-4V
I. Ghamarian a,1, B. Hayes b, P. Samimi a,1, B.A. Welk c, H.L. Fraser c, P.C. Collins a,n,1
a Department of Materials Science and Engineering, Iowa State University, Ames, IA 50011, USAb Department of Materials Science and Engineering, University of North Texas, Denton, TX 76203, USAc Department of Materials Science and Engineering, The Ohio State University, Columbus, OH 43210, USA
a r t i c l e i n f o
Article history:Received 18 November 2015Received in revised form13 February 2016Accepted 16 February 2016Available online 17 February 2016
Keywords:Artificial neural networksGenetic algorithmsMonte Carlo simulationsTitanium alloysPhenomenological equationYield strength
x.doi.org/10.1016/j.msea.2016.02.05293/& 2016 Elsevier B.V. All rights reserved.
esponding author.ail address: [email protected] (P.C. Collins).rmerly with the Department of Materials Scof North Texas, Denton, TX 76203, USA.
a b s t r a c t
A constituent-based phenomenological equation to predict yield strength values from quantified mea-surements of the microstructure and composition of β processed Ti-6Al-4V alloy was developed via theintegration of artificial neural networks and genetic algorithms. It is shown that the solid solutionstrengthening contributes the most to the yield strength (�80% of the value), while the intrinsic yieldstrength of the two phases and microstructure have lower effects (�10% for both terms). Similarities anddifferences between the proposed equation and the previously established phenomenological equationfor the yield strength prediction of the αþβ processed Ti-6Al-4V alloys are discussed. While the twoequations are very similar in terms of the intrinsic yield strength of the two constituent phases, the solidsolution strengthening terms and the ‘Hall-Petch’-like effect from the alpha lath, there is a pronounceddifference in the role of the basketweave factor in strengthening. Finally, Monte Carlo simulations wereapplied to the proposed phenomenological equation to determine the effect of measurement un-certainties on the estimated yield strength values.
& 2016 Elsevier B.V. All rights reserved.
1. Introduction
The establishment of phenomenological equations which isable to predict the mechanical properties of various metallic ma-terials given their composition and microstructure has long beensought. For instance, various phenomenological hardening ruleshave been established to explain the plastic behavior of crystals[1–4]. Unfortunately, there are some difficulties which hinder thedevelopment of phenomenological equations in multi-component,multi-phase engineering alloys. The first and the most importantone is generating a large high-fidelity database which guaranteesthat all the most influential parameters involved in a phenomenonare taken into account. As an example, in the case of solid solutionstrengthening of titanium alloys, the contribution of aluminum,oxygen, iron, etc. in strengthening must be considered [5]. Thenext problem is related to the complex relationship which mayexist between parameters and their synergistic effects on theoutput. In this case, it is almost impossible in the laboratory scaleto change only one parameter (e.g., aluminum content) and keepall the other parameters (e.g., colony scale factor) fixed at a
ience and Engineering, Uni-
constant value to reveal the effect of each parameter on the output(e.g., yield strength in titanium alloys).
A novel method to overcome the second problem and thusderive phenomenological equations was developed via the in-tegration of artificial neural networks (ANN), genetic algorithms(GA) and Monte Carlo (MC) simulations. This method was appliedsuccessfully to predict the yield strength of αþβ processed Ti-6Al-4V (weight percent) alloy with the maximum error in the pre-diction of yield strength of 4% [6]. The developed phenomen-ological equation is a function of both compositional variables (i.e.,the concentration of oxygen, aluminum, iron, and vanadium) aswell as microstructural variables (i.e., lath thickness, meanequiaxed alpha size, the volume fraction of equiaxed alpha, andthe total volume fraction of the alpha phase). This integrated effortbuilds upon previous discrete efforts involving both artificialneural networks and genetic algorithms. Notably, artificial neuralnetworks have been used extensively in determining the me-chanical properties and the kinetics of the phase transformation oftitanium [7–13], nickel [14] and steel [15–20]. Genetic algorithmhas also been used broadly in materials science [21–24] to opti-mize parameters involved in a phenomenon [25,26] and also mi-crostructural evolutions [27,28]. In some cases, GA has been in-tegrated with ANN to optimize the results of a developed neuralnetwork model [29–31]. For instance, the heat treatment processof 7175 aluminum alloy was optimized according to the desired

Fig. 1. SEM micrographs of a β processed colony microstructure is shown.
I. Ghamarian et al. / Materials Science & Engineering A 660 (2016) 172–180 173
final properties via the integration of ANN and GA [32].In order to achieve the desired microstructures (and mechan-
ical properties), αþβ titanium alloys are subjected to variousthermomechanical processes. The characteristics of the micro-structures of these alloys can be categorized as originating fromeither β or αþβ processing depending upon the temperature atwhich the thermomechanical processing is applied. If the ther-momechanical processing is conducted above the beta transustemperature, the temperature at which beta phase (bcc crystalstructure) transforms to alpha phase (hcp crystal structure), theevolved microstructure is called β processed. Slow cooling rates ofthe β processed alloys result in colony microstructure in whichWidmanstatten lath-like precipitates of alpha phase are arrangedparallel to each other. A scanning electron microscope (SEM) im-age of a furnace-cooled β processed alloy is shown in Fig. 1. In thisfigure, the darker features are α laths and the brighter features areβ ribs. High cooling rates results in the formation of a basketweavemicrostructure.
While the softest microstructure in the αþβ processed alloy isequiaxed alpha particles and the hardest one is basketweave mi-crostructure, the softer microstructure in the β processed alloys isthe colony microstructure and the harder one is the basketweavemicrostructure. Colony size, alpha lath thickness and the interfaceof the α laths and β ribs are considered to be the microstructuralparameters that most significantly affect the mechanical proper-ties of β processed titanium alloys [33]. Notably, the contributionof prior beta grain size on the yield strength is deceptive. Kar et al.believe that the role of beta grain size should not be consideredindividually. It is deemed that in the larger beta grain sizes bas-ketweave microstructure forms in the middle of the grains whilein the smaller beta grain sizes only colony microstructure forms.As a result, yield strength reduces via beta grain size refinement[34]. From the crystallographic point of view, the Burgers or-ientation relationship (i.e., (0001)α||(110)β and [2 ̅ ̅1 10]α||[ 1̅1 1̅]β) issatisfied between α laths and β ribs. This orientation relationshipresults in the easy activation of dislocation glide (slip transmission[35]) through the interface of α laths and β ribs [35], so long as theneighboring α lath shares a common crystallographic orientation(i.e., is in the same colony). As a result, yield strength is expected
to be inversely proportional to the size (percentage) of colonies.Also, it has been previously reported that yield strength is in-versely proportional to the lath thickness in both αþβ [13] and β[34] processed titanium alloys. This is due to the fact that in thelarger α laths, dislocations can move a longer distance withoutencountering any interfacial barrier.
In this work, initially an artificial neural network model wasdeveloped to capture the effect of the most influential variables(both compositional and microstructural variables) on the yieldstrength of β processed Ti-6Al-4V alloy. A proposed phenomen-ological equation (very similar in many terms to the αþβ pro-cessed phenomenological equation of [6]) was optimized usinggenetic algorithms, and then used to predict the yield strength of βprocessed Ti-6Al-4V alloy. Importantly, the differences betweenthe separately optimized β and αþβ processed equations arediscussed. Lastly, Monte Carlo simulations were used to study theeffect of uncertainties in the input measurements (e.g., aluminumcontent, etc.) on the yield strength of the equation developed forthe β processed αþβ titanium alloys.
2. Methods
2.1. Experimental techniques
Nine compositionally different titanium alloys were made inthe range of Ti-6Al-4V alloy (all compositions in weight percent).These alloys capture the extremes of the specification range. Thesystematic variation in the important elements, which weremeasured by Timet using inductively coupled plasma (ICP), are asfollow:
Al: 4.76–6.55; V: 3.3–4.45; O: 0.07–0.20; Fe: 0.11–0.41.To exclude the effect of texture variation on the yield strength
in this study, all the samples included in the database were cutfrom the same radius of round billets. It should be noted althoughtexture can affect the yield strength remarkably, it is not con-sidered as an input variable in the phenomenological equationdeveloped in this study due to the limited number of availablesamples. However, it is worth noting that there are statisticalmethods to reveal the effect of texture on the mechanical prop-erties. While not a part of this effort, such methods can be appliedto the phenomenological equation developed in this study to im-prove the accuracy of yield strength predictions via consideringthe effect of texture on the mechanical properties.
All the samples were elongated uniaxially, sectioned, and pre-pared for microscopy analyses by conventional metallographicmethods. Samples were characterized by an optical microscope aswell as a FEI FEG Sirion scanning electron microscope (SEM) op-erating in backscattered electron imaging mode at 15 kV with a3 nm spatial resolution. The input variables in the phenomen-ological equation are the volume fraction of total alpha, percent ofcolony, α-lath thickness and the concentrations of aluminum, va-nadium, iron and oxygen. The microstructural features werequantified using stereological methods described elsewhere [36].The output of the phenomenological equation is yield strength.
2.2. Computational approach
Artificial neural networks, genetic algorithms and Monte Carlosimulations were integrated to derive a phenomenological equa-tion to predict the yield strength of αþβ titanium alloys from adataset containing the aforementioned variables (Fig. 2). The in-tegration method and the way that the phenomenological equa-tion is derived are explained in detail in another publication [6]. Inbrief, the database was divided into two parts containing twothirds of the database (called the training dataset) to create the

Fig. 2. Schematic of the integration approach is shown (adopted from [6]).
Fig. 3. Yield strength values estimated by the developed ANN committee model arein close agreement with the measured yield strength values for the training andtesting datasets.
I. Ghamarian et al. / Materials Science & Engineering A 660 (2016) 172–180174
ANN model and one third of the database (called the testing da-taset) to evaluate the ANN model. A committee model was de-veloped, using Bayesian neural network code developed by DavidMackay [37,38], from the best three models among 1500 proposedANN models. Also, virtual experiments were conducted in whichall the variables were constant at their average values and onlyone variable was changing from its minimum value to its max-imum value. Such virtual experiments were conducted in order toreveal the individual effect of each variable on the output (e.g.,yield strength) via applying the developed ANN committee modelto the virtual datasets. Unfortunately, the ANN model is not aphenomenological model; i.e., it is only a summation of somehyperbolic tangent functions and it cannot be interpreted based onphysical metallurgy principles.
Genetic algorithms, as an optimization tool to find the globalextrema, was used in this study to derive a phenomenologicalequation from the original dataset. Initially, a phenomenologicalequation that incorporates known physical dependencies is pro-posed to predict the yield strength. For example, in a single-phasematerial where the microstructural features do not impact theattending mechanical properties, one might assumed that the totalyield strength is the summation of the intrinsic yield strength andany solid solution strengthening that may be present. In the Ti-6Al-4V discussed here, such terms would include the intrinsicyield strength values of the alpha and beta phases as well as solidsolution strengthening (SSS) due to the presence of Al and O in thealpha phase and V and Fe in the beta phase (Eq. (1)),
σ σ σ σ σ( ) = ( * ) + ( * ) + +
*( + ) + *(( ) + ( ) ) + ( )
α α β β α β
α β α β
MPa F F
F A C A C F A C A C SSS SSS 1
ys V V
V Al Aln
O On
V V Vn n
Fe Fen n n
0 0 0 0
Al O V Fe1 2 3
where σX0 , FV
X and CYare the intrinsic yield strength of phase X,volume fraction of phase X and the concentration of Y element,respectively. Finding the optimum precursors and powers of Eq.(1) (i.e., A and n) leads to predicting the yield strength based uponthe dataset inputs (e.g., Al content, etc.) within an acceptable levelof accuracy. This precursor/power optimization can be conductedusing GA. The proposed equation can be modified in a trial anderror process; i.e., dropping some terms if their contributions to
the yield strength are negligible or adding some new terms tomake the predictions more accurate. In this paper, this process iscalled the equation-construction process, and includes descriptorsof the microstructural features in addition to the terms givenabove. Also, the optimized equation can be evaluated throughcomparing the results of ANN virtual experiments with the yieldstrength values estimated by the optimized equation for the vir-tual datasets.
Finally, Monte Carlo simulations were applied to study the ef-fect of uncertainties in the input measurements on the output (i.e.,yield strength). The average of the standard deviation of eachmeasurement (e.g., lath thickness) was assigned as the uncertaintyvalue of the measurement for that variable. In this study, themaximum deviation of the yield strength from the value estimatedby GA was determined through a 3000-iteration Monte Carlo si-mulation for each variable.
3. Results and discussion
3.1. The proposed equation
Initially, the ANN model was developed using the original da-taset. The established committee model was able to estimate theyield strength of the raw data with the maximum error of 3% withrespect to the measured yield strength values (Fig. 3). The ANNcommittee model provided the opportunity to independentlystudy the effect of each variable (e.g., Al content) on the yieldstrength via conducting virtual experiments. To derive the phe-nomenological equation through the integration of ANN and GA, itwas assumed ‘primarily’ that the previously proposed equation forthe yield strength prediction of αþβ processed Ti-6Al-4V alloy [6]is valid with a minor correction which is the elimination of theextraneous equiaxed alpha term from the equation. The proposedequation for estimating the yield strength of αþβ processed Ti-6Al-4V alloy is presented in Eq. (2),

Fig. 4. The GA-developed phenomenological equation estimated the yield strengthof the raw database with the maximum error of 5%.
I. Ghamarian et al. / Materials Science & Engineering A 660 (2016) 172–180 175
σ σ σ( ) = ( * ) + ( * ) +
−
*( * + * )
+ ( )
*(( * ) + ( * ) )
+
( )
_ * _ * +
− ( )
( − _ )* * _ * *( ) +
− ( )
( − _ )* − * *
( )
α α β β
α
β
α α
α α
α
−
−
MPa F F
F A C A C
F A C A C
k F Equiaxedsize
FColony
k LW RT
FColony
B SSS
Two
phase composite of intrinsic strength
Solid solution strengthening hcp alpha
Potential synergistic solid solution strenghening
bcc beta
Hall
Petch effect equiaxed alpha particles
1100
Hall
Petch effect alpha lath
1100
100Basketweave factor 2
ys V V
V Al Aln
O On
V V Vn n
Fe Fen n n
yequiaxed
Vequiaxed n
Vequiaxed
ylath n n
Vequiaxed
0 0
Al O
V Fe1 2 3
4
5 5
where σ X0 is the intrinsic yield strength value of phase X, FV
X isthe volume fraction of X, AX is the precursor used in the solidsolution strengthening term of element X, CX is the concentrationof element X, nX is a power, ky
X is the Hall-Petch constant asso-ciated with X, LW is the width of an alpha lath,Bis a constant usedin the basketweave factor term and SSS is the solid solutionstrengthening of the alpha and beta phases. Notably, RT representsrib thickness which can be determined based on stereologicalmethods following Eq. (3) [6],
= *( − ( − _ )) ( )α αRT Lathwidth F F1 3V Vequiaxed
where αFV is the total volume fraction of the alpha phase whichforms colony, basketweave and equiaxed alpha microstructures.
The capability of the modified equation to predict the yieldstrength of the β processed Ti-6Al-4V alloy was evaluated in twoways, namely (1) comparing the measured yield strength valueswith the GA predicted values for the raw database and (2) com-paring the virtual experiment results of the ANN model with theGA predicted values. To cover all the aspects of the strengtheningmechanisms in the β processed alloy and increase the accuracy ofthe yield strength estimations by the phenomenological equation,some new terms were added during the equation-constructionprocess. Based on the results of the current study, Eq. (4) wasproposed which represents all the most influential terms involvedin the strengthening of the β processed Ti-6Al-4V alloy,
σ σ σ σ σ( ) = ( * ) + ( * ) + +
*( * + * ) +
*(( * ) + ( * ) ) +
* * *( * − ) +
− ( )
* *( − ) +
− * * +
* *( )
α α β β α β
α α
β β
α
α
α
α
−
MPa F F
F A C A C
F A C A C
PCB LW LW
FF
C LWF
F
ColonyD SSS
EColony
CSF
SSS
SSS
1001
Hall
Petch effect alpha lath
1Constrained beta
100100
Basketweave factor
100Colony scale factor
4
ys V V
V Al Aln
O On
V V Vn n
Fe Fen n n
n V
V
n
V
V
n
n
0 0 0 0
Al O
V Fe1 2 3
4 4
5
6
where B, C, D and E are constants. The remaining parameters arethe same as those introduced in Eq. (2).
There are 20 unknown variables in Eq. (4), specifically σ α0 , σ β
0 ,AAl, nAl, AO, nO, AV, nV, n1, AFe, nFe, n2, n3, B, n4, C, n5, D, E and n6.Considering the two mentioned evaluation methods, GA de-termined all these unknown variables in a way that the developedphenomenological equation estimates the yield strength values ofthe raw data with the maximum error of 5% with respect to themeasured values (Fig. 4). The developed phenomenological equa-tions for the αþβ [6] and β processed Ti-6Al-4V alloys are pre-sented in Table 1. As stated previously, the phenomenologicalequation derived for the β processed Ti-6Al-4V alloy was eval-uated via comparing the ANN and GA virtual experiment results.There is a nice consistency between the virtual experiment resultsof the hyperbolic tangent functions (ANN approach) and thephenomenological equation (GA approach) for all the variablesexcept vanadium (Fig. 5 and Fig. 6). The discrepancy exists for thecase of vanadium is due to the fact that in the developed phe-nomenological equation the contribution of vanadium to the totalyield strength is considered only in the solid solution strength-ening. However, vanadium plays a significant role in the formationof basketweave microstructure [39]. Unfortunately, the lattercontribution cannot be captured via the currently proposed phe-nomenological equation as the nature of the contribution isdifferent.
In the last step of integrated approach, MC method was appliedto the phenomenological equation to study the effect of mea-surement uncertainties on the yield strength values. The MC re-sults associated with the compositional and microstructural vari-ables are depicted in Fig. 7 and Fig. 8, respectively. Interestingly,the MC method shows that it is possible to interpret the differencebetween GA and ANN predicted yield strengths as effectively zero,and consequently indicates that GA and ANN delineate the samemulti-variable model with two different representations (e.g.,phenomenological and hyperbolic tangent), only by slightlychanging the measured values within the range of their mea-surement error as presented by ‘Applying MC to GA-ANN’ lines inFig. 7 and Fig. 8. As an example, the variation of the Al contentwithin the measurement error (i.e., new Al content¼measured Alcontent±measurement error) results in a range of yield strengthvalues estimated by the developed phenomenological equation.‘Applying MC to GA-ANN’ line indicates the minimum differencebetween the yield strength value predicted by the ANN model and

Table 1Comparison of the β processed equation with the αþβ processed equation.
Parameters β processed equation α β+ processed equation
σ σ+α β0 0 ( * ) + ( * )α βF F89 45V V ( * ) + ( * )α βF F89 45V V
αSSS *( + )αF C C145 764V Al O0.667 0.667 *( * + * )αF C C149.5 745V Al O
0.667 0.667
βSSS *(( ) + ( ) )βF C C45 237V V Fe0.7 0.5 0.7 0.5 2 *(( * ) + ( * ) )βF C C34 245V V Fe
0.765 0.5 0.765 0.5 2.15
−Hall Petch effect of
equiaxed alpha particles
Not applicable _* *α −F Equiaxedsize110 Vequiaxed 0.5
−Hall Petch effect of
alpha lath
* * *( * )α
α− −
LW LW145PC FVFV100
0.5 1 0.5 _( − )* * * *α −F LW RT1 180Vequiaxed Colony
1000.13 0.13
βConstrained *( * )α
α−
LW460FV
FV
1 1 Negligible contribution
Basketweave factor * *− SSS0.26Colony100100
_( − )* * *α −F SSS1 0.2Vequiaxed Colony100
100
Colony scale factor * * −CSF18 Colony100
0.45 −
Fig. 5. Compositional virtual dependencies of (a) aluminum (b) vanadium (c) iron and (d) oxygen are depicted.
I. Ghamarian et al. / Materials Science & Engineering A 660 (2016) 172–180176
all of these estimated yield strength values, Fig. 7(a). Also, to in-dicate the range of yield strength variation via considering themeasurement errors, the maximum difference between the valuespredicted by the phenomenological equation with and withoutapplying the MC method was added to the values estimated by thephenomenological equation for the raw database without con-sidering the measurement uncertainties. These new values were
called ‘GAplus’. Similarly, ‘GAminus’ was made via subtracting themaximum difference value from the yield strength values pre-dicted by the phenomenological equation. To show the maximumrange of yield strength discrepancies between ANN and the phe-nomenological equation, ‘GAplus’ and ‘GAminus’ were subtractedfrom the ANN predicted values as shown in Fig. 7 and Fig. 8.Analogous to ‘GAplus’, the error bar values determined by the

Fig. 6. Microstructural virtual dependencies of (a) volume fraction of total alpha(b) percent colony and (c) lath thickness are shown.
I. Ghamarian et al. / Materials Science & Engineering A 660 (2016) 172–180 177
Bayesian neural network code (presented in Fig. 5 and Fig. 6) wereadded to the ANN predicted yield strength values. The new valueswere called ‘ANNplus’. Similarly, the error bar values were sub-tracted from the ANN predicted values and they were called‘ANNminus’. The difference between the values predicted by thephenomenological equations and ‘ANNplus’ as well as ‘ANNminus’are presented in Fig. 7 and Fig. 8.
The sensitivity analyses of the contribution of the micro-structural and compositional variables on the total yield strengthof the β processed Ti-6Al-4V are given in Table 2. Similar to thephenomenological equation developed for the αþβ processedalloys, the compositional variables have a major contribution inthe total yield strength.
3.2. Similarities between β and αþβ processed phenomenologicalequations
Interestingly, the intrinsic yield strength values of alpha phase(89 MPa) and beta phase (45 MPa) in both equations are exactlythe same which result in alike contribution in the total yieldstrength (Fig. 9). This is an important observation, as it shows thatthe optimization routines conducted on both databases indicatesthe same intrinsic strength of the material. It also suggests thatthere is little difference in either texture or Taylor (work) hard-ening. These terms, though not included in these efforts, would be‘remainders’ attached to the intrinsic yield strength terms. Theprecursors and powers of the solid solution strengthening of Al, O,V and Fe are very similar in the both equations. The dissimilaritiesin the solid solution strengthening terms of these two equationsresult in �13 MPa (i.e., less than 2% of the total yield strength)difference in the calculated contribution of Al in solid solutionstrengthening. Analogously, the difference between the contribu-tions of O, V and Fe in the solid solution strengthening term of thetwo equations is less than 0.7%, 0.2% and 0.5% of the total yieldstrength, respectively. The small difference in the contribution ofthe solid solution strengthening in the total yield strength isshown in Fig. 9, along with the contribution of the other terms. Forthe case of microstructure effect on the yield strength, since bas-ketweave microstructure is the hardest microstructure in bothαþβ and β processed titanium alloys, it is expected to have similarterms in αþβ and β processed equations, though yielding isdominated by the weakest features. In reality, equiaxed alphamicrostructure does not form in the β processed titanium alloys,therefore the basketweave factor term of the β processed equationis only a simplified version of the αþβ processed equation. Asshown in Fig. 9, the contributions of the Hall-Petch alpha lath termin the strengthening of αþβ and β processed Ti-6Al-4V alloys isalmost equivalent. An extensive discussion on the contribution ofthe intrinsic yield strength, the solid solution strengthening andbasketweave factor on the total yield strength of the αþβ pro-cessed titanium alloys is given elsewhere [6]. Some of the mostsalient points are mentioned briefly.
– In a multi-phase material, a rule of mixtures incorporating phasefractions (Fv) may be adopted
– The yield strength of a well-annealed elementally pure titaniumhas been reported as 78.45 MPa [40]. This value does not includeany potential texture terms. The values for the individual slipsystems range from 49 MPa to 110 MPa [41]. The value reportedin [40] and that determined in the previous study and here (i.e.,89 MPa) are consistent with this previous data.
– Since beta phase titanium is not stable at room temperature, noexperimental value is available in the literature. However, sincethe number of slip systems in bcc crystal structure is more thanhcp crystal structure, a lower value of the yield strength for thebeta phase in comparison to the alpha phase is expected.

Fig. 7. Monte Carlo results for (a) aluminum (b) vanadium (c) iron and (d) oxygen are presented.
I. Ghamarian et al. / Materials Science & Engineering A 660 (2016) 172–180178
– Experimental observations about the strengthening effect ofsolute atoms in titanium revealed that the order of strength-ening contribution is O4Fe4Al4V [5], the same as deter-mined previously and shown here.
– The postulated forms for solid solution strengthening are dif-ferent for the alpha and beta phases. Alpha phase has only onesubstitutional atom (Al) and one interstitial atom (O), resultingin a simple additive term. However, beta phase has two sub-stitutional atoms (V and Fe), requiring that possible synergisticeffects to be considered. The model developed in [6] demon-strated that it was unlikely V and Fe behaved in a synergisticmanner.
– The values calculated for the strengthening contributions of Aland O elements are consistent with the experimental data ob-tained by Williams et al. [42].
3.3. Differences between β and αþβ processed phenomenologicalequations
As stated previously, the expected microstructures of the αþβprocessed alloys are equiaxed alpha, colony and basketweave mi-crostructures. In this case, equiaxed alpha and basketweave mi-crostructures are the softest and hardest ones, respectively.
However, in the β processed samples equiaxed alpha microstructuredoes not exist. Thus, the Hall-Petch strengthening of equiaxed alphagrains is a vestige and thus is eliminated in the β processed equa-tion. Another difference between the two equations arises from theeffect of beta rib thickness on the yield strength. As the beta ribsbecome increasingly constrained by the neighboring alpha laths astheir thickness decreases, the strength does increase. Initially, theconstrained beta strengthening term was a part of the αþβ pro-cessed equation. GA assigned a negligible contribution to this term– as the deformation is dominated by the equiaxed α particles.However, GA revealed that this term has around 2.4% contributionin the total yield strength of β processed Ti-6Al-4V alloy as depictedin Fig. 9. The final difference between the microstructures is thepresence of the basketweave microstructure. The basketweave mi-crostructure can be described as the interweaving of multiple alphalath variants whereas the colony microstructure can be described asparallel and adjacent alpha laths of the same variant. This differenceresults in a difference in strength, owing to hindered slip trans-mission arguments. The basketweave microstructure is generallyobserved to be stronger than the colony microstructure. Given theabsence of equiaxed alpha particles and the increased volumefraction of basketweave in the complete dataset, it is not surprisingthat the basketweave term plays a more important role in the βprocessed equation.
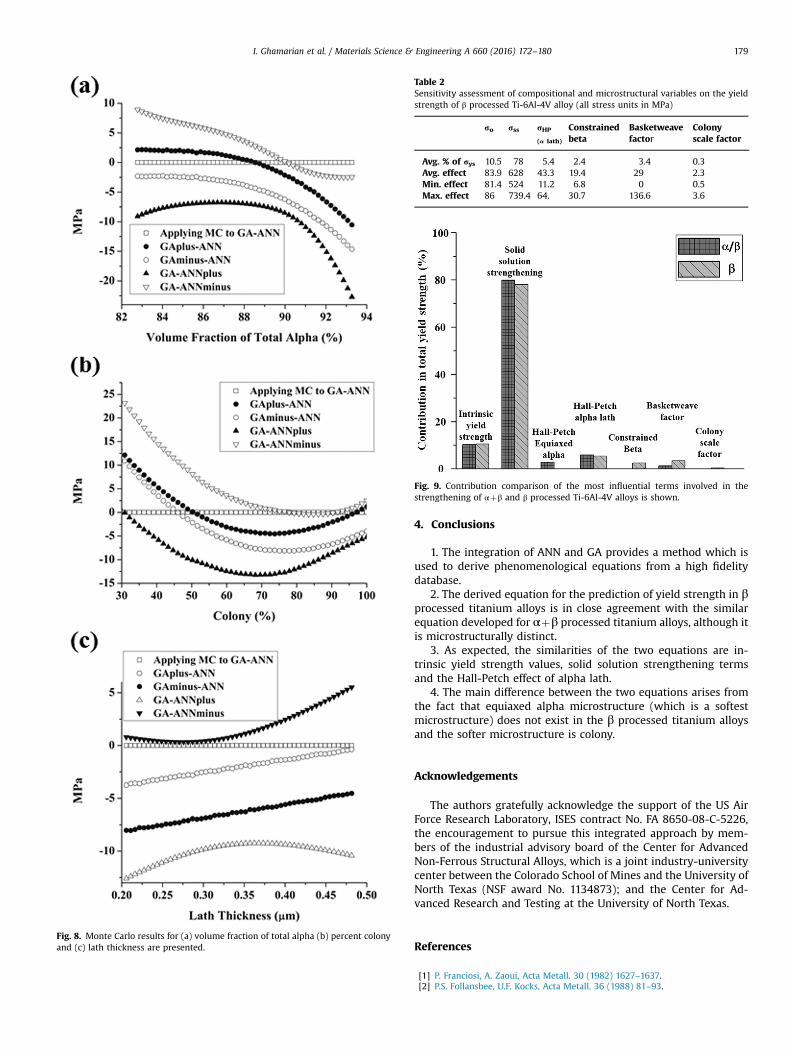
Fig. 8. Monte Carlo results for (a) volume fraction of total alpha (b) percent colonyand (c) lath thickness are presented.
Table 2Sensitivity assessment of compositional and microstructural variables on the yieldstrength of β processed Ti-6Al-4V alloy (all stress units in MPa)
ro rss rHP
(α lath)
Constrainedbeta
Basketweavefactor
Colonyscale factor
Avg. % of rys 10.5 78 5.4 2.4 3.4 0.3Avg. effect 83.9 628 43.3 19.4 29 2.3Min. effect 81.4 524 11.2 6.8 0 0.5Max. effect 86 739.4 64. 30.7 136.6 3.6
Fig. 9. Contribution comparison of the most influential terms involved in thestrengthening of αþβ and β processed Ti-6Al-4V alloys is shown.
I. Ghamarian et al. / Materials Science & Engineering A 660 (2016) 172–180 179
4. Conclusions
1. The integration of ANN and GA provides a method which isused to derive phenomenological equations from a high fidelitydatabase.
2. The derived equation for the prediction of yield strength in βprocessed titanium alloys is in close agreement with the similarequation developed for αþβ processed titanium alloys, although itis microstructurally distinct.
3. As expected, the similarities of the two equations are in-trinsic yield strength values, solid solution strengthening termsand the Hall-Petch effect of alpha lath.
4. The main difference between the two equations arises fromthe fact that equiaxed alpha microstructure (which is a softestmicrostructure) does not exist in the β processed titanium alloysand the softer microstructure is colony.
Acknowledgements
The authors gratefully acknowledge the support of the US AirForce Research Laboratory, ISES contract No. FA 8650-08-C-5226,the encouragement to pursue this integrated approach by mem-bers of the industrial advisory board of the Center for AdvancedNon-Ferrous Structural Alloys, which is a joint industry-universitycenter between the Colorado School of Mines and the University ofNorth Texas (NSF award No. 1134873); and the Center for Ad-vanced Research and Testing at the University of North Texas.
References
[1] P. Franciosi, A. Zaoui, Acta Metall. 30 (1982) 1627–1637.[2] P.S. Follansbee, U.F. Kocks, Acta Metall. 36 (1988) 81–93.

I. Ghamarian et al. / Materials Science & Engineering A 660 (2016) 172–180180
[3] Q. Qin, J.L. Bassani, J. Mech. Phys. Solids 40 (1992) 813–833.[4] M. Kothari, L. Anand, J. Mech. Phys. Solids 46 (1998) 51–83.[5] S. Ankem, G. Scarr, I. Caplan, in: Proceedings of the Sixth World Conference on
Titanium. I, 1988, pp. 265–268.[6] I. Ghamarian, P. Samimi, V. Dixit, P.C. Collins, Metall. Mater. Trans. A 46 (2015)
5021–5037.[7] S. Malinov, W. Sha, Z. Guo, Mater. Sci. Eng. A 283 (2000) 1–10.[8] Z. Sun, H. Yang, Z. Tang, Comput. Mater. Sci. 50 (2010) 308–318.[9] Z. Sun, X. Wang, J. Zhang, H. Yang, Mater. Sci. Eng. A 591 (2014) 18–25.[10] S. Malinov, W. Sha, J. McKeown, Comput. Mater. Sci. 21 (2001) 375–394.[11] S. Malinov, W. Sha, P. Markovsky, J. Alloy. Compd. 348 (2003) 110–118.[12] A. Fotovati, T. Goswami, Mater. Des. 25 (2004) 547–554.[13] P.C. Collins, S. Koduri, B. Welk, J. Tiley, H.L. Fraser, Metall. Mater. Trans. A 44
(2013) 1441–1453.[14] Y. Yoo, C. Jo, C. Jones, Mater. Sci. Eng. A 336 (2002) 22–29.[15] H. Bhadeshia, ISIJ Int. 41 (2001) 626–640.[16] K. Genel, Int. J. Fatigue 26 (2004) 1027–1035.[17] P. Artymiak, L. Bukowski, J. Feliks, S. Narberhaus, H. Zenner, Fatigue Fract. Eng.
Mater. Struct. 22 (1999) 723–728.[18] M. Yescas, Int. J. Cast Met. Res. 15 (2003) 513–521.[19] T. Cool, H. Bhadeshia, D. MacKay, Mater. Sci. Eng. A 223 (1997) 186–200.[20] H. Bhadeshia, D. MacKay, L.-E. Svensson, Mater. Sci. Technol. 11 (1995)
1046–1051.[21] W. Paszkowicz, Mater. Manuf. Process. 24 (2009) 174–197.[22] E. Alabort, D. Putman, R.C. Reed, Acta Mater. 95 (2015) 428–442.[23] F. Cioffi, J.I. Hidalgo, R. Fernández, T. Pirling, B. Fernández, D. Gesto, I. Puente
Orench, P. Rey, G. González-Doncel, Acta Mater. 74 (2014) 189–199.
[24] T. Skippon, C. Mareau, M.R. Daymond, J. Appl. Cryst. 45 (2012) 627–643.[25] R.B. Kasat, A.K. Ray, S.K. Gupta, Mater. Manuf. Process. 18 (2003) 523–532.[26] C. Santos, J. Spim, A. Garcia, Eng. Appl. Artif. Intell. 16 (2003) 511–527.[27] A.J. Kulkarni, K. Krishnamurthy, S. Deshmukh, R. Mishra, Mater. Sci. Eng. A 372
(2004) 213–220.[28] A.L.-S. Chua, N.A. Benedek, L. Chen, M.W. Finnis, A.P. Sutton, Nat. Mater. 9
(2010) 418–422.[29] Z. Fu, J. Mo, L. Chen, W. Chen, Mater. Des. 31 (2010) 267–277.[30] S. Anijdan, A. Bahrami, H. Hosseini, A. Shafyei, Mater. Des. 27 (2006) 605–609.[31] K. Somashekhar, N. Ramachandran, J. Mathew, Mater. Manuf. Process. 25
(2010) 467–475.[32] R. Song, Q. Zhang, Mater. Sci. Eng.: C 17 (2001) 133–137.[33] G. Lutjering, J. Albrecht, O. Ivasishin, Titanium '95 2 (1995) 1163–1170.[34] S. Kar, T. Searles, E. Lee, G. Viswanathan, H. Fraser, J. Tiley, R. Banerjee, Met.
Mater. Trans. A 37 (2006) 559–566.[35] S. Suri, G. Viswanathan, T. Neeraj, D.-H. Hou, M. Mills, Acta Mater. 47 (1999)
1019–1034.[36] J. Tiley, T. Searles, E. Lee, S. Kar, R. Banerjee, J. Russ, H. Fraser, Mater. Sci. Eng. A
372 (2004) 191–198.[37] D.J. Mackay, pH. D. thesis, California Institute of Technology, 1992.[38] D.J. MacKay, Neural Comput. 4 (1992) 448–472.[39] P. Collins, S. Connors, R. Banerjee, H. Fraser, Proc. Ti-2003 Sci. Technol. 3
(2003) 1389–1396.[40] M.A. Meyers, K.K. Chawla, Mechanical Behavior of Materials, Cambridge Uni-
versity Press, Cambridge, 2009.[41] E. Anderson, D. Jillson, S. Dunbar, Trans. AIME 197 (1953) 1191–1197.[42] J. Williams, R. Baggerly, N. Paton, Metall. Mater. Trans. A 33 (2002) 837–850.


![Shape coexistence in Ho · Shape coexistence in 153Ho ... (SD) bands [1, 3, 4] are observed. The observations indicate that these nuclei are very soft against shape changes. The features](https://img.pdfslide.tips/doc/110x75/60e28e71d240867f0c7c4f38/shape-coexistence-in-ho-shape-coexistence-in-153ho-sd-bands-1-3-4-are.jpg)


![Darker Music Talks Bologna notes [16.04.14]](https://img.pdfslide.tips/doc/110x75/5453d331b1af9f84228b47be/darker-music-talks-bologna-notes-160414.jpg)