Embed Size (px)
Citation preview

Matlab Graphics
1.Graphics Object
(a) figure object (b) Axes object
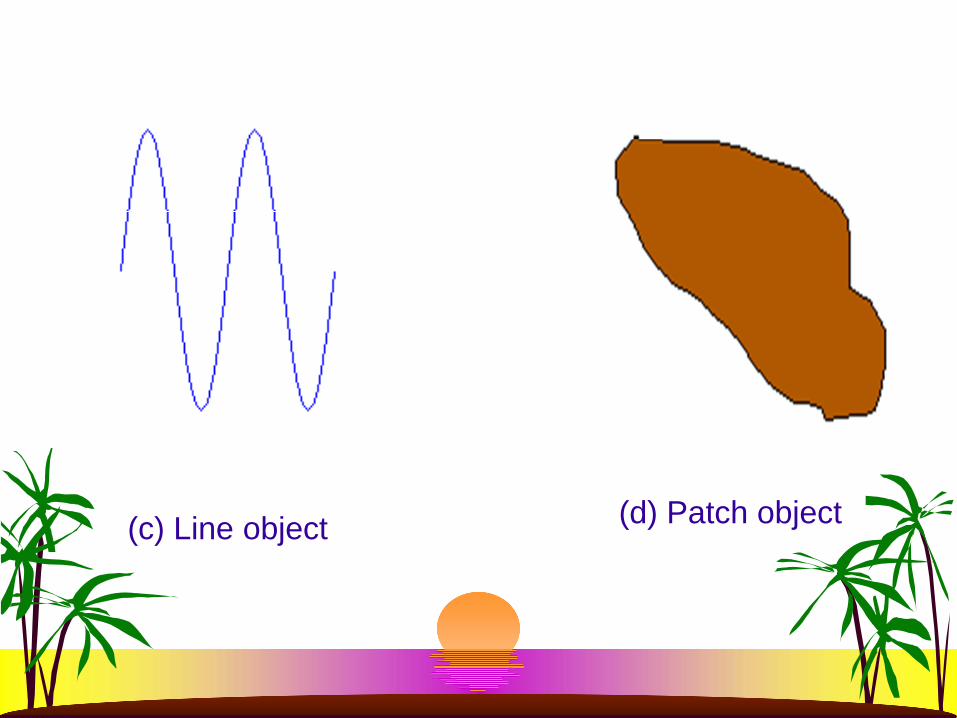
(c) Line object (d) Patch object
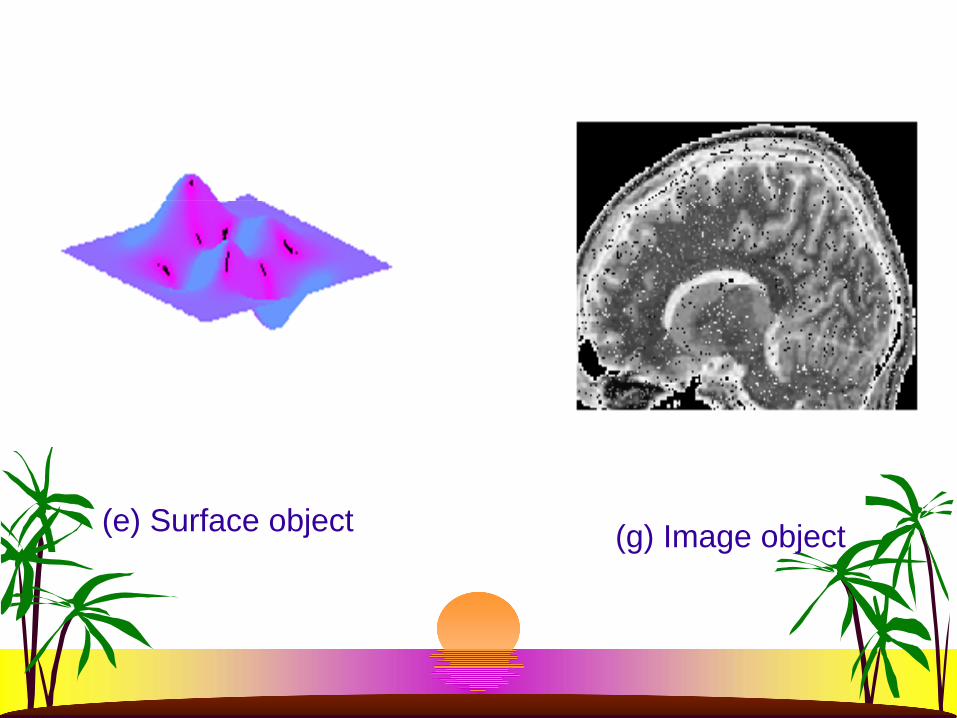
(e) Surface object (g) Image object
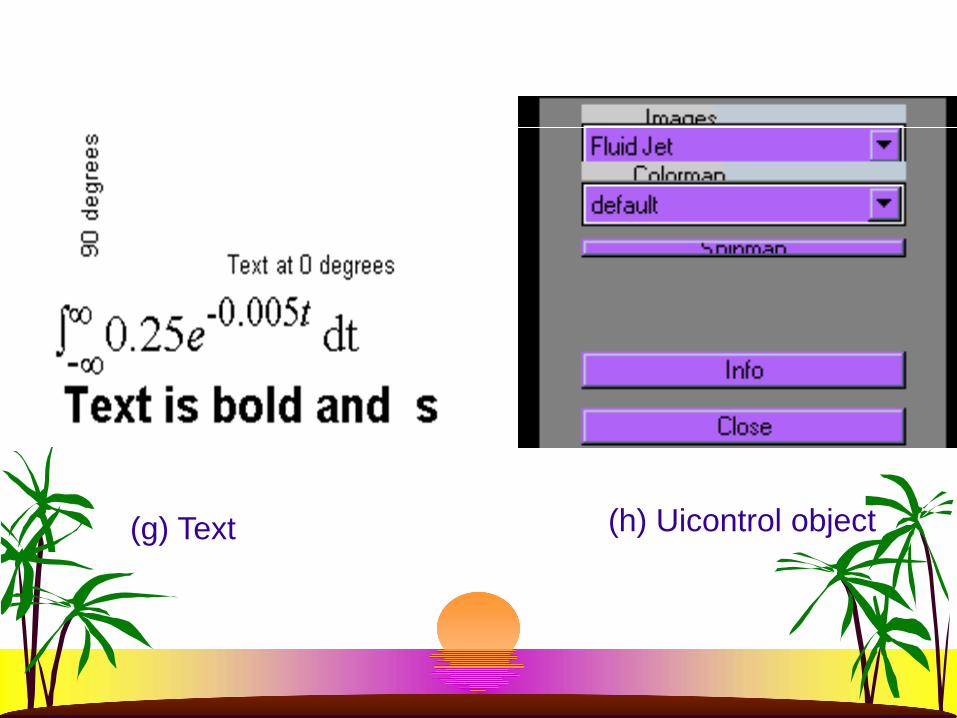
(g) Text (h) Uicontrol object
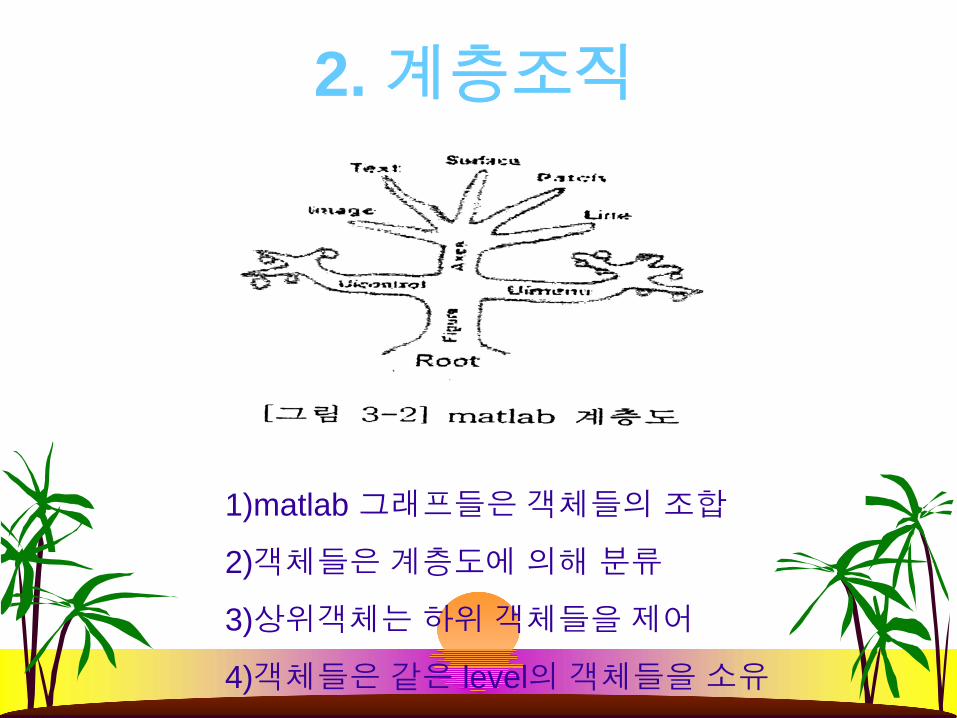
2. 계층조직
1)matlab 그래프들은객체들의조합
2)객체들은계층도에의해분류
3)상위객체는하위객체들을제어
4)객체들은같은 level의객체들을소유
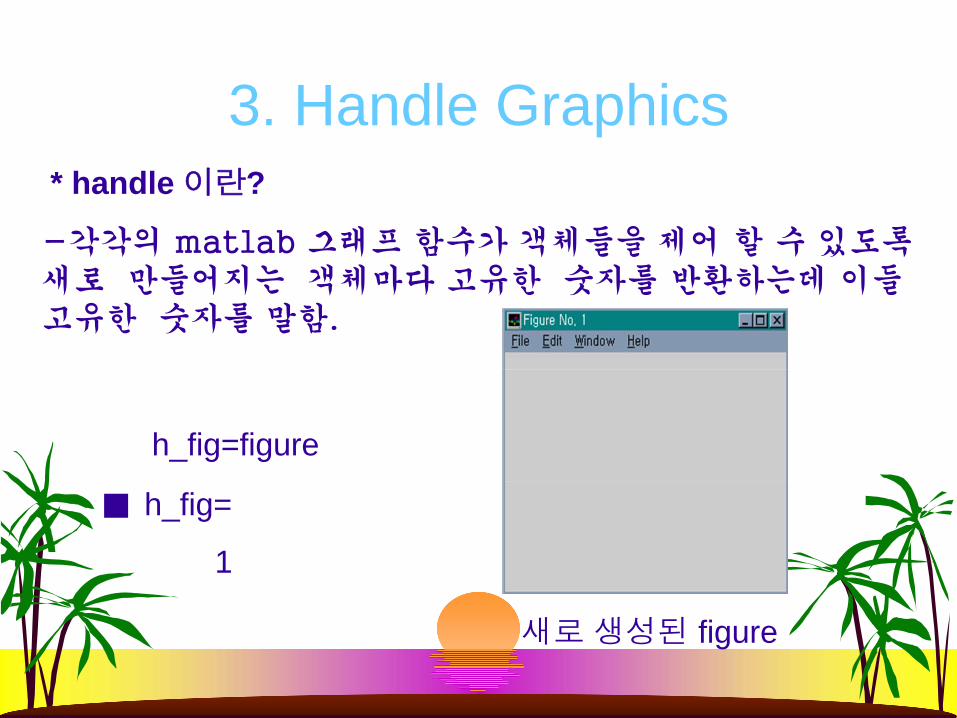
3. Handle Graphics* handle 이란?
-각각의 matlab 그래프 함수가 객체들을 제어 할 수 있도록새로 만들어지는 객체마다 고유한 숫자를 반환하는데 이들고유한 숫자를 말함.
h_fig=figure
h_fig=
1
새로생성된 figure
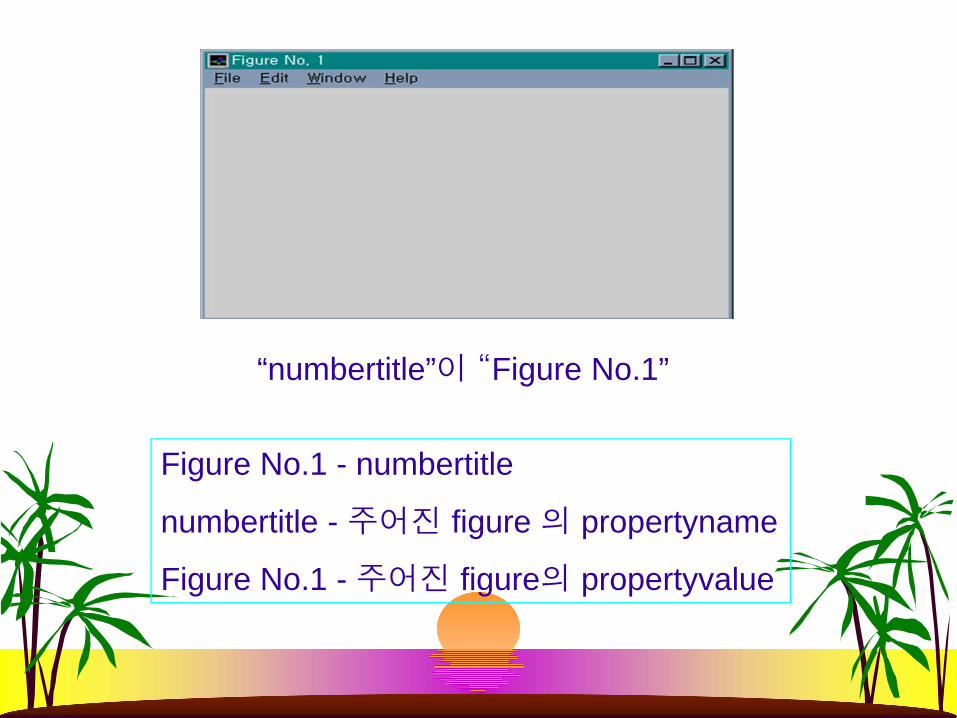
“numbertitle”이 “Figure No.1”
Figure No.1 - numbertitle
numbertitle -주어진 figure 의 propertyname
Figure No.1 -주어진 figure의 propertyvalue
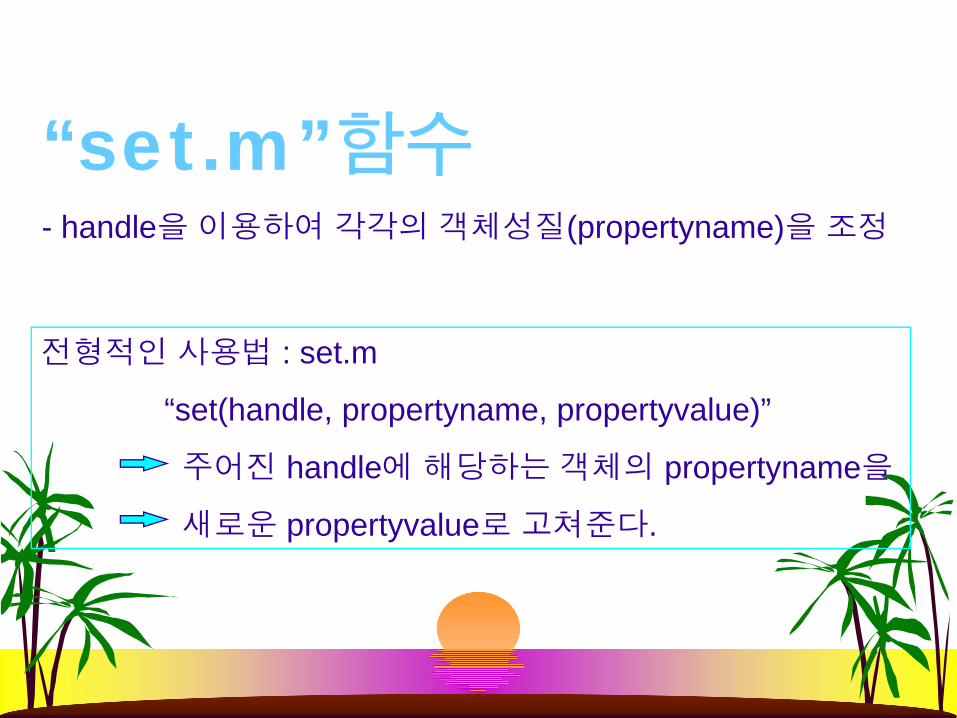
“set.m”함수- handle을이용하여각각의객체성질(propertyname)을조정
전형적인사용법 : set.m
“set(handle, propertyname, propertyvalue)”
주어진 handle에해당하는객체의 propertyname을
새로운 propertyvalue로고쳐준다.
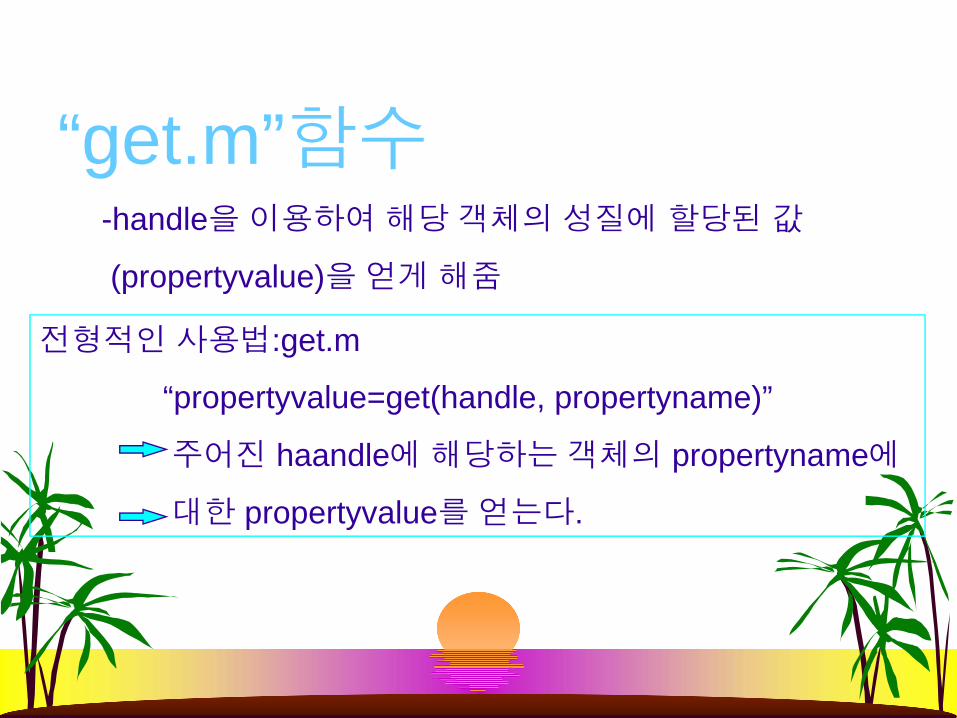
“get.m”함수-handle을이용하여해당객체의성질에할당된값
(propertyvalue)을얻게해줌
전형적인사용법:get.m
“propertyvalue=get(handle, propertyname)”
주어진 haandle에해당하는객체의 propertyname에
대한 propertyvalue를얻는다.
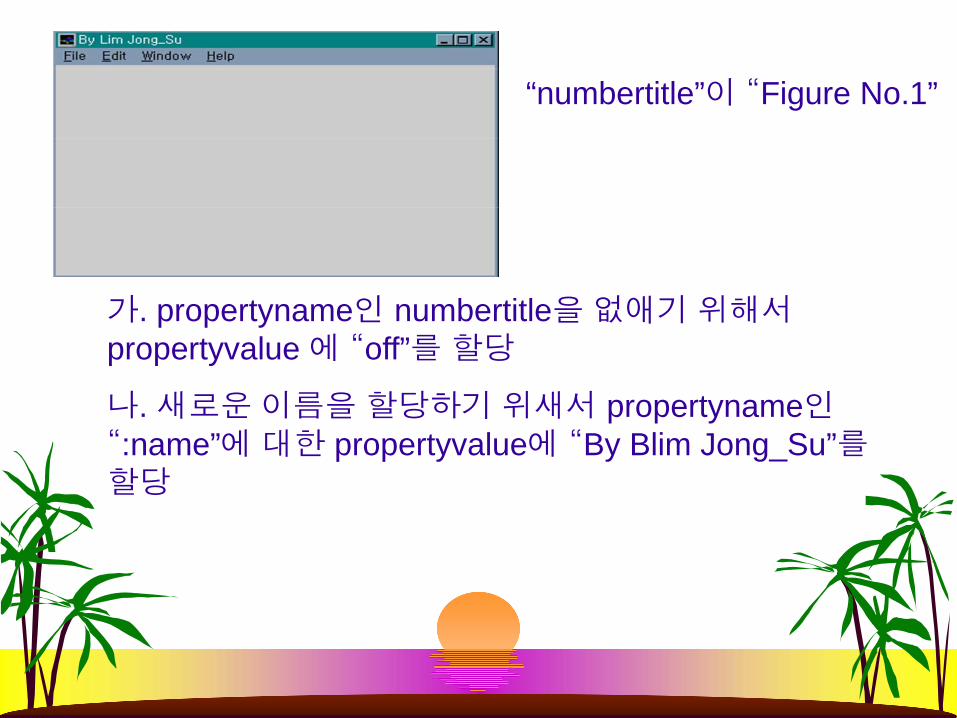
“numbertitle”이 “Figure No.1”
가. propertyname인 numbertitle을없애기위해서propertyvalue 에 “off”를할당
나. 새로운이름을할당하기위새서 propertyname인“:name”에대한 propertyvalue에 “By Blim Jong_Su”를할당
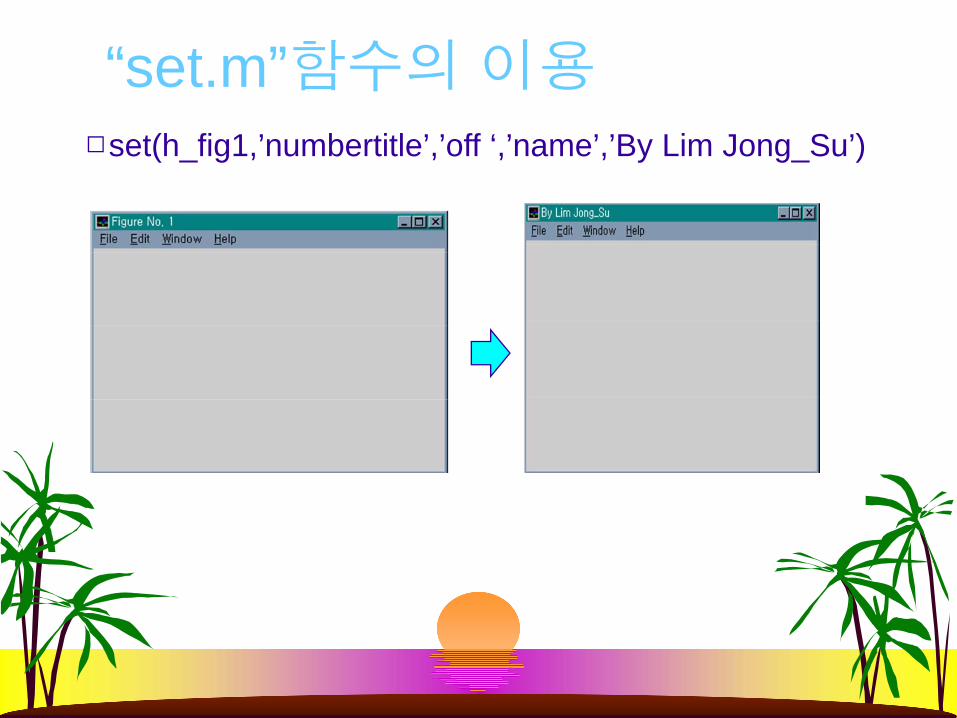
“set.m”함수의이용set(h_fig1,’numbertitle’,’off ‘,’name’,’By Lim Jong_Su’)
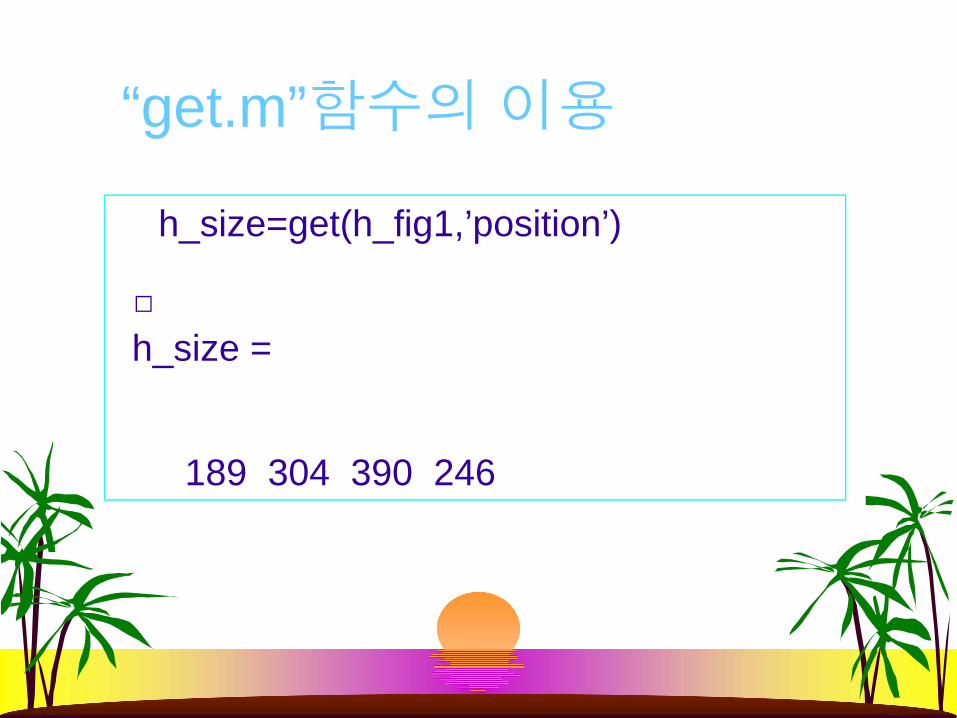
“get.m”함수의이용
h_size=get(h_fig1,’position’)
h_size =
189 304 390 246
Matlab graphics
Low_level function : text.mHigh_level function : plot.m
axis.m
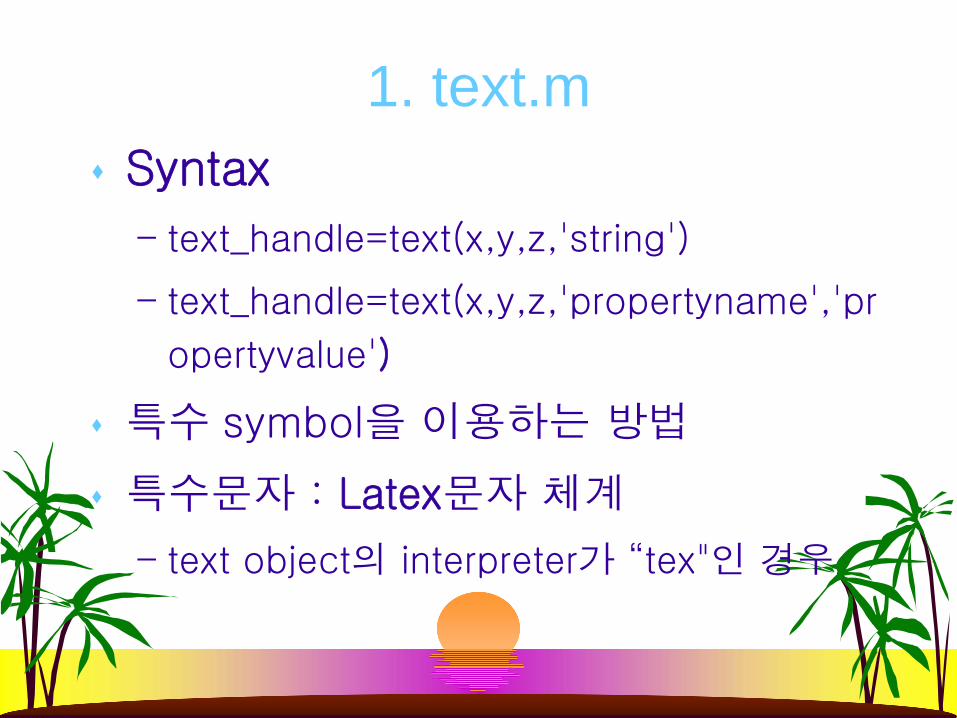
1. text.m Syntax
– text_handle=text(x,y,z,'string')
– text_handle=text(x,y,z,'propertyname','pr
opertyvalue')
특수 symbol을 이용하는 방법
특수문자 : Latex문자 체계
– text object의 interpreter가 “tex"인 경우
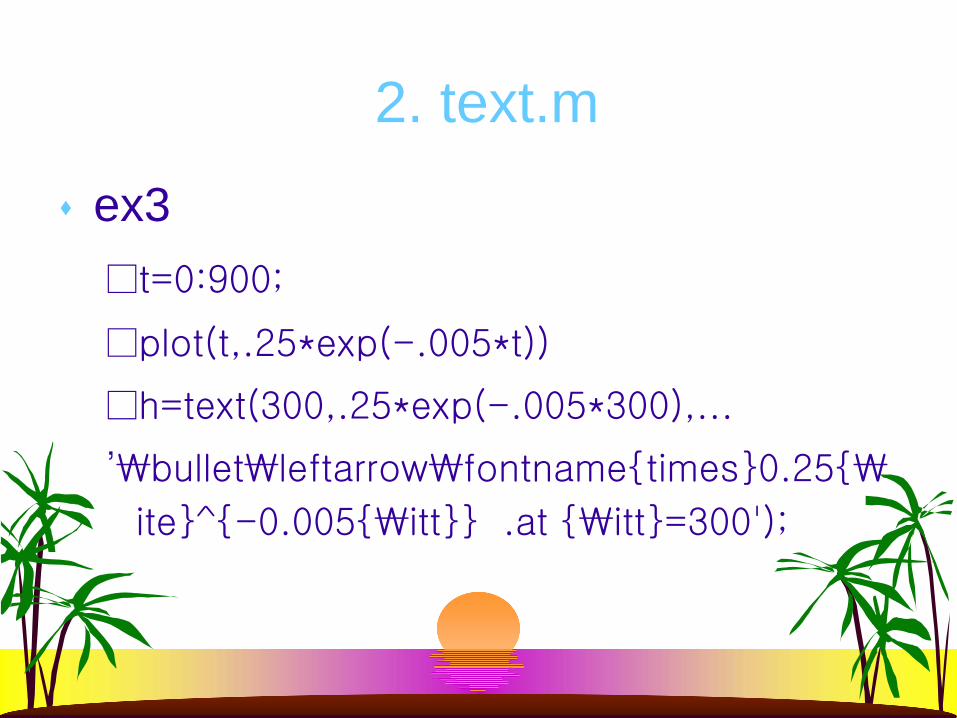
2. text.m
ex3□t=0:900;
□plot(t,.25*exp(-.005*t))
□h=text(300,.25*exp(-.005*300),...
’₩bullet₩leftarrow₩fontname{times}0.25{₩
ite}^{-0.005{₩itt}} .at {₩itt}=300');
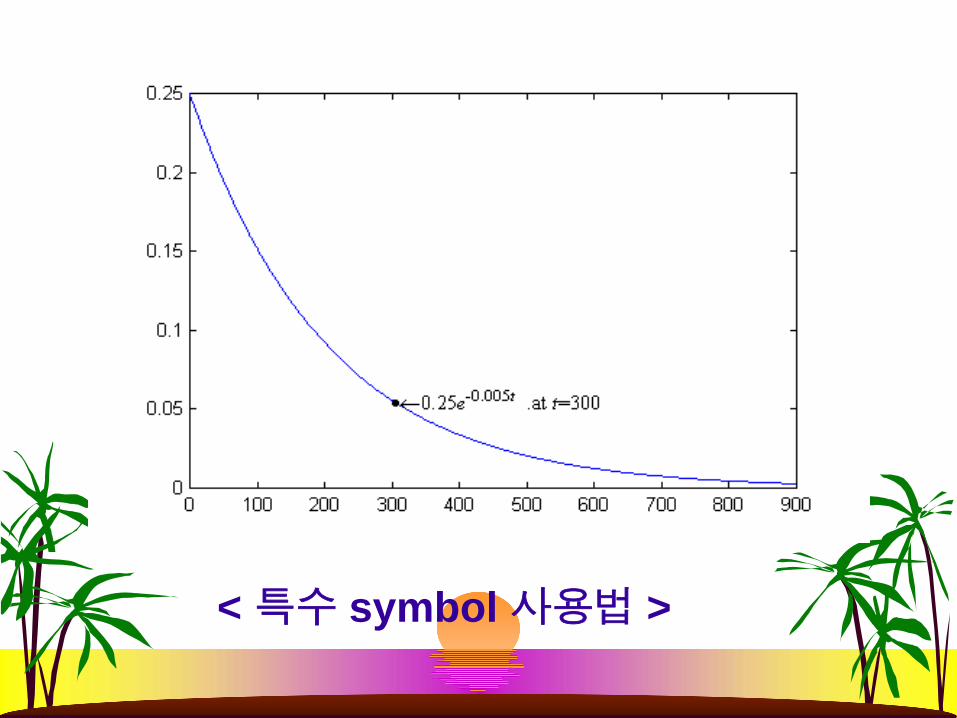
< 특수 symbol 사용법 >
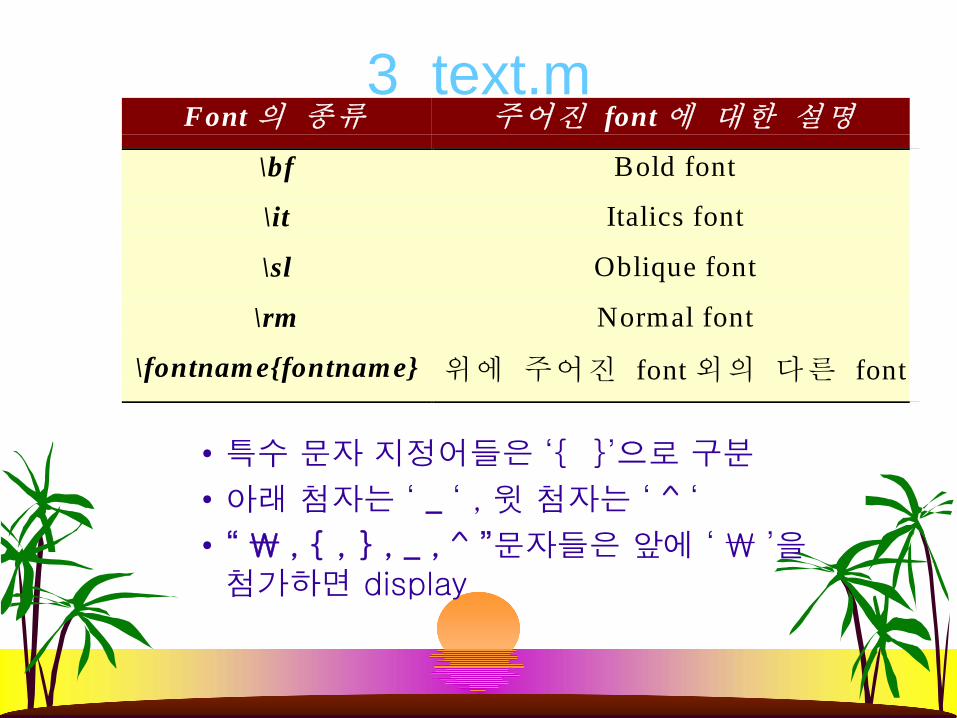
3 text.m
• 특수 문자 지정어들은 ‘{ }’으로 구분
• 아래 첨자는 ‘ _ ‘ , 윗 첨자는 ‘ ^ ‘
• “ ₩ , { , } , _ , ^ ”문자들은 앞에 ‘ ₩ ’을첨가하면 display
Font의 종류 주어진 font에 대한 설명
\bf Bold font
\it Italics font
\sl Oblique font
\rm Normal font
\fontname{fontname} 위에 주어진 font 외의 다른 font
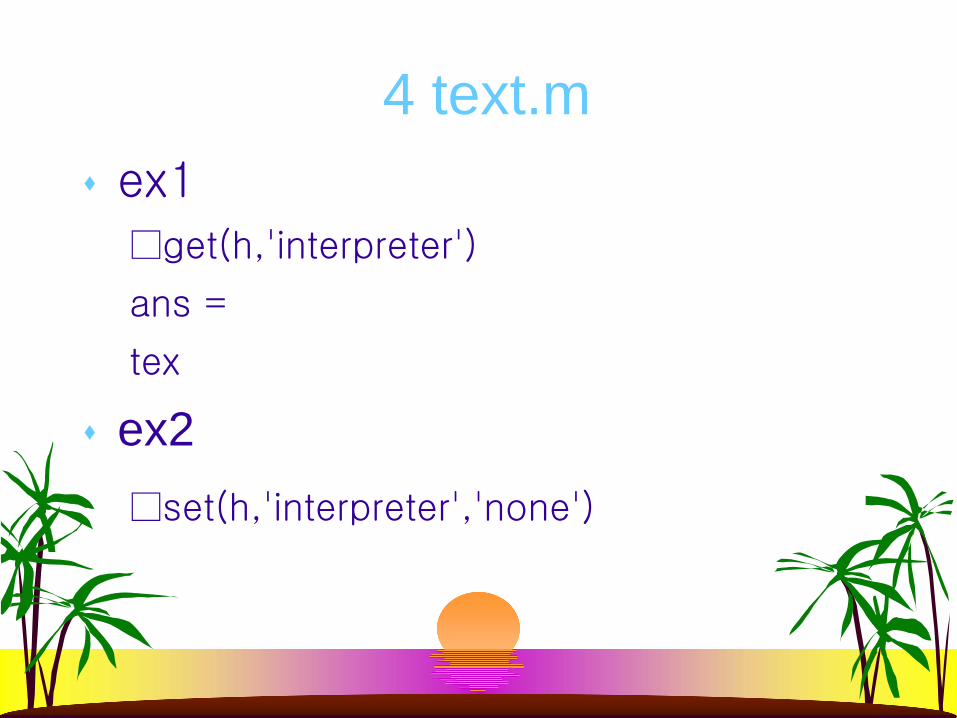
4 text.mex1
□get(h,'interpreter')
ans =
tex
ex2□set(h,'interpreter','none')
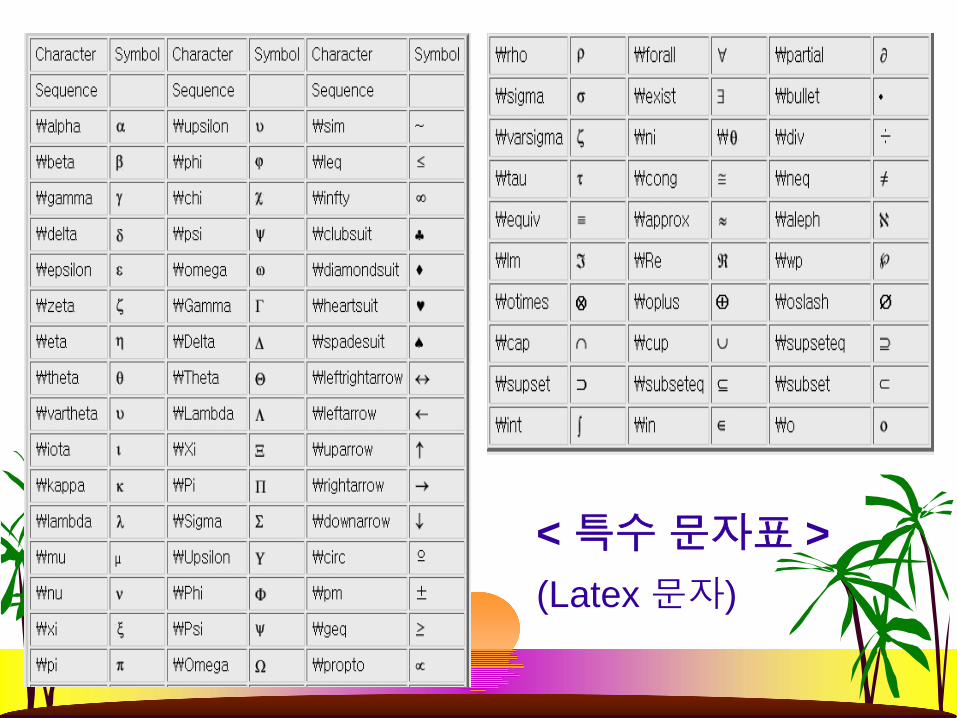
< 특수문자표 >(Latex 문자)
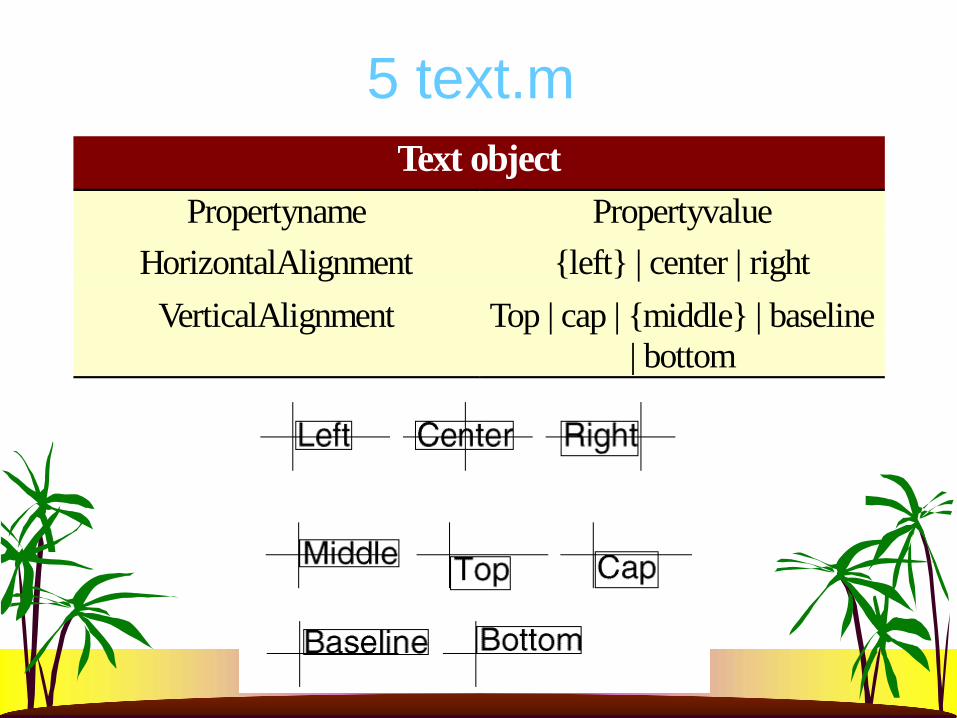
5 text.m Text object
Propertyname PropertyvalueHorizontalAlignment {left} | center | right
VerticalAlignment Top | cap | {middle} | baseline| bottom
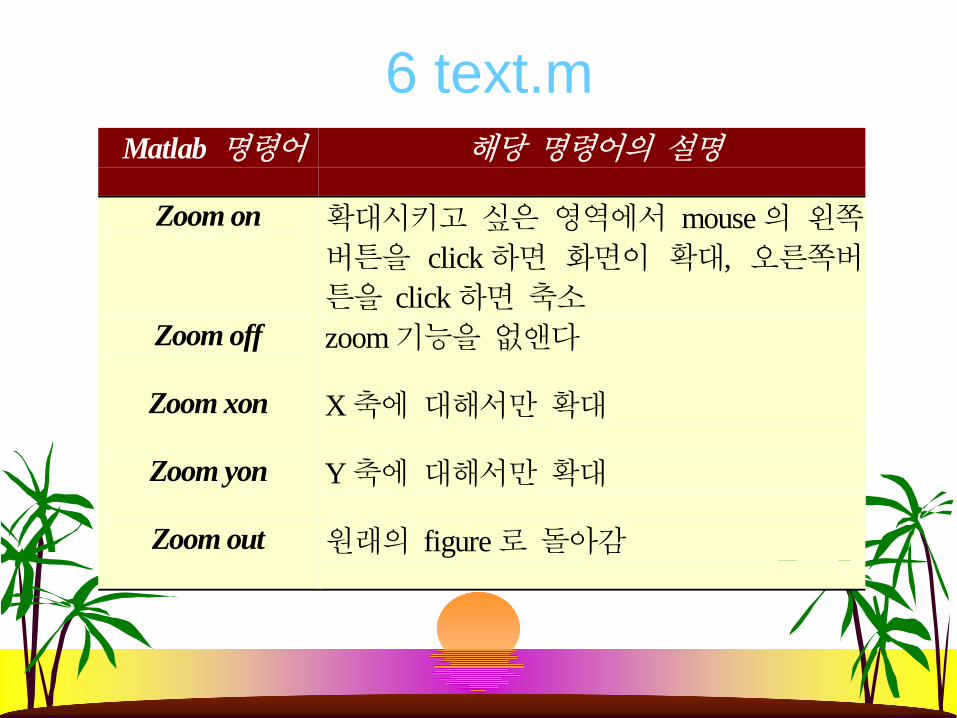
6 text.m Matlab 명령어 해당 명령어의 설명
Zoom on 확대시키고 싶은 영역에서 mouse의 왼쪽버튼을 click하면 화면이 확대, 오른쪽버튼을 click하면 축소
Zoom off zoom기능을 없앤다
Zoom xon X축에 대해서만 확대
Zoom yon Y축에 대해서만 확대
Zoom out 원래의 figure로 돌아감
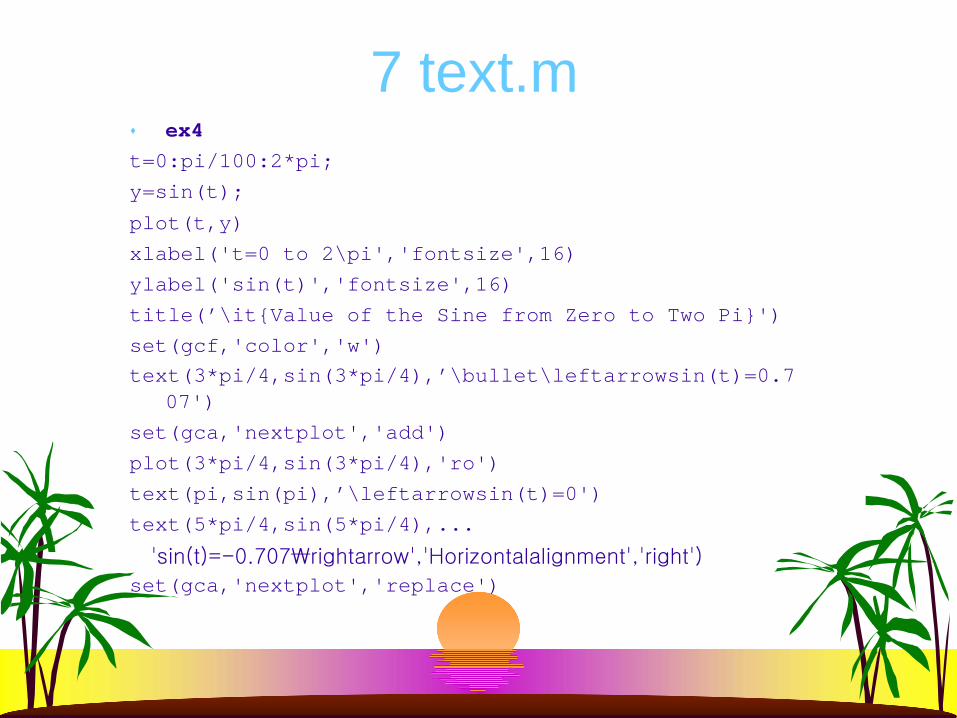
7 text.m ex4
t=0:pi/100:2*pi;y=sin(t);
plot(t,y)xlabel('t=0 to 2\pi','fontsize',16)ylabel('sin(t)','fontsize',16)title(’\it{Value of the Sine from Zero to Two Pi}')set(gcf,'color','w')text(3*pi/4,sin(3*pi/4),’\bullet\leftarrowsin(t)=0.7
07')set(gca,'nextplot','add')plot(3*pi/4,sin(3*pi/4),'ro')text(pi,sin(pi),’\leftarrowsin(t)=0')text(5*pi/4,sin(5*pi/4),...
'sin(t)=-0.707₩rightarrow','Horizontalalignment','right')
set(gca,'nextplot','replace')
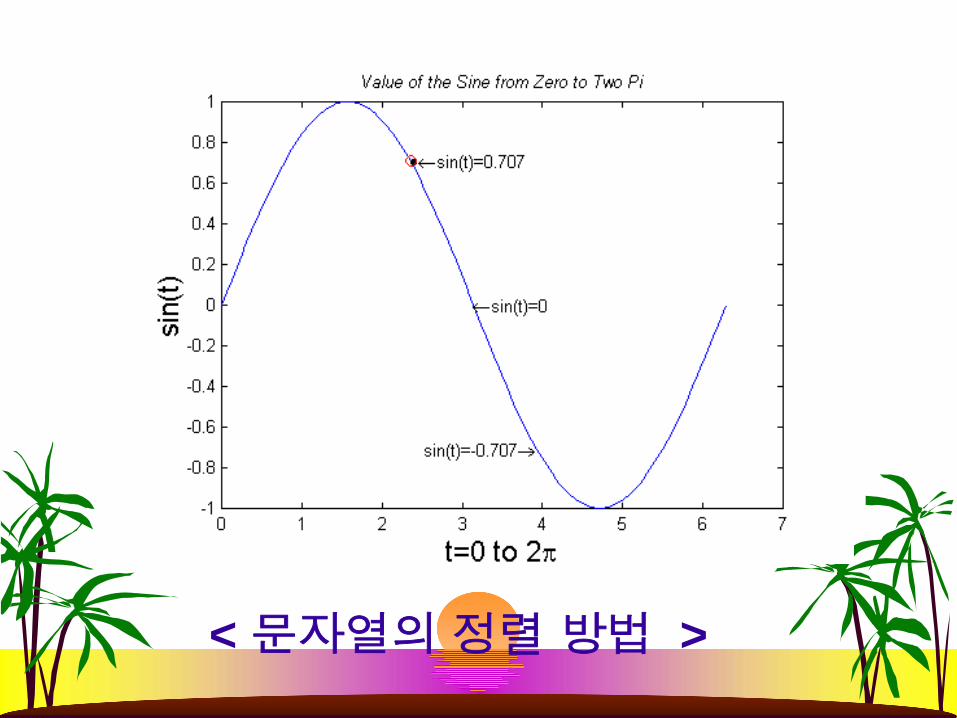
< 문자열의정렬방법 >
8 text.m – figure Object, Axes Object처럼 상위 Level의 default
property value를 바꾸었다면 , set(gca,'next-plot’,'replace') 와 같 이 , 다 시 default
propertyvalue로 환원
– 환원해 주지 않으면, 앞으로 만들어지는 모든 Axes
Object의 하위 Level과 같은 Axes level의 함수들은
동일한 화면에 그림들을 그려 주기 때문
High_level function
High_level function
– 데이터를화면에 display하기 위해 사용되는 함수
– Low_level functions처럼 데이터를 display하는데,
필요한 여러 가지 propertyname
/propertyvalue를 묻지 않고, 자동으로 좌표의
크기 조절(axis scaling)과 선의 색(Line
color)등을 설정
1 Plot.m Syntax
– plot(Y)
– plot(X1,Y1,...)
– plot(X1,Y1,LineSpec,...)
– plot(...,'PropertyName',PropertyValue,...)
– h = plot(...)

2 Plot.m
Ex5□ X=(1:10; 0.7*[1:10]; 0.5*[1:10];
0.25*[1:10])';
□plot(X)
□xlabel('x axis','fontsize',15)
□ylabel('y axis','fontsize',15)
□title(‘₩bf{''plot.m''함수의이용법}','fontsize',15)
2 Plot.m
Ex5□ X=(1:10; 0.7*[1:10]; 0.5*[1:10];
0.25*[1:10])';
□plot(X)
□xlabel('x axis','fontsize',15)
□ylabel('y axis','fontsize',15)
□title(‘₩bf{''plot.m''함수의이용법}','fontsize',15)
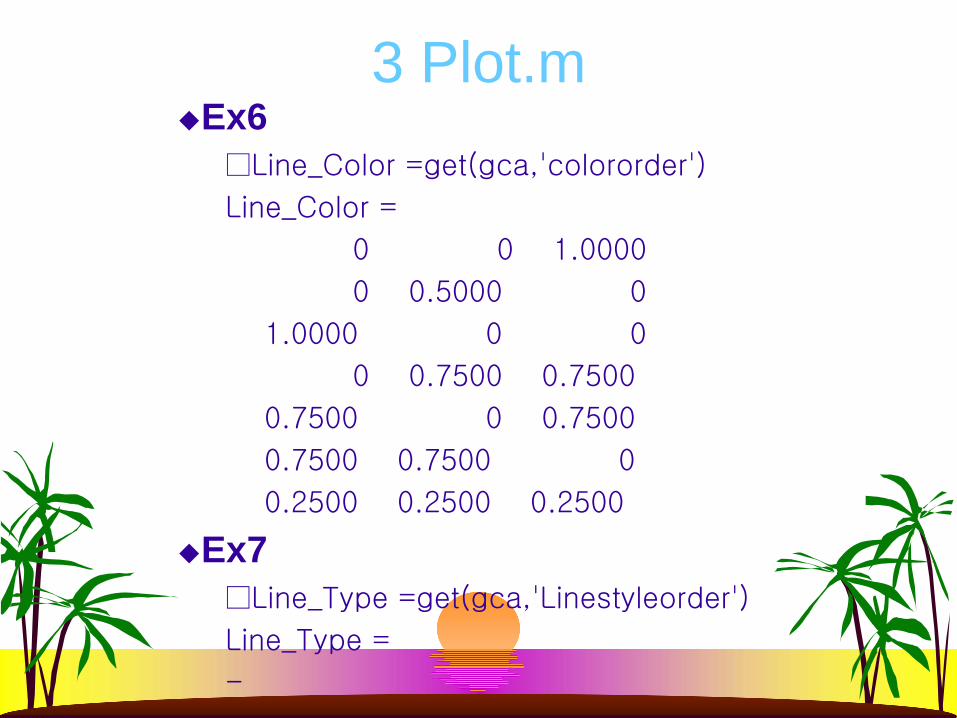
3 Plot.m Ex6□Line_Color =get(gca,'colororder')
Line_Color =
0 0 1.0000
0 0.5000 0
1.0000 0 0
0 0.7500 0.7500
0.7500 0 0.7500
0.7500 0.7500 0
0.2500 0.2500 0.2500
Ex7□Line_Type =get(gca,'Linestyleorder')
Line_Type =
-
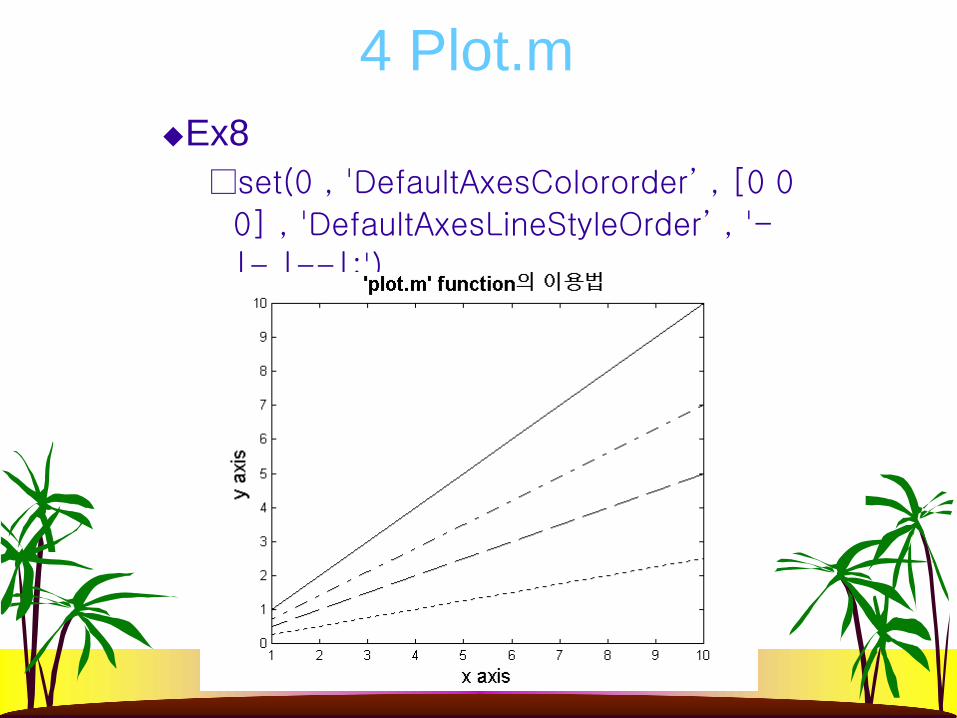
4 Plot.m Ex8□set(0 , 'DefaultAxesColororder’ , [0 0
0] , 'DefaultAxesLineStyleOrder’ , '-
|-.|--|:')
1 Axis.m syntax– axis([xmin xmax ymin ymax zmin zmax])
ex9□t=-5:1/100:5;
□y=1./((t-0.3).^2+0.01)+1./((t-0.9).^2+0.04)-6; %y는 humps function.
□plot(t,y)
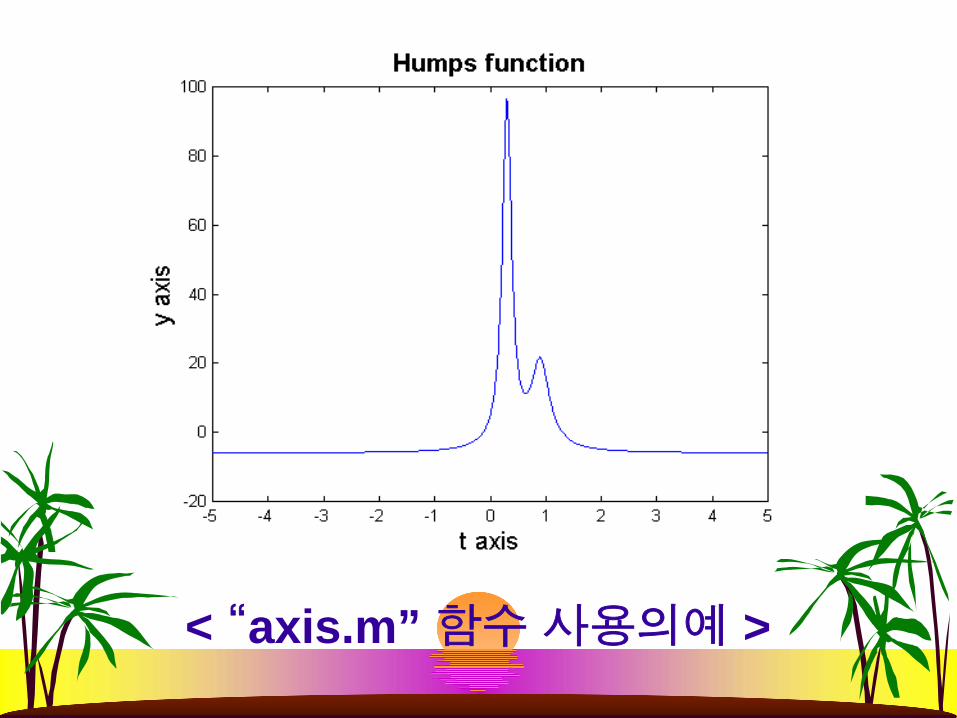
< “axis.m” 함수사용의예 >
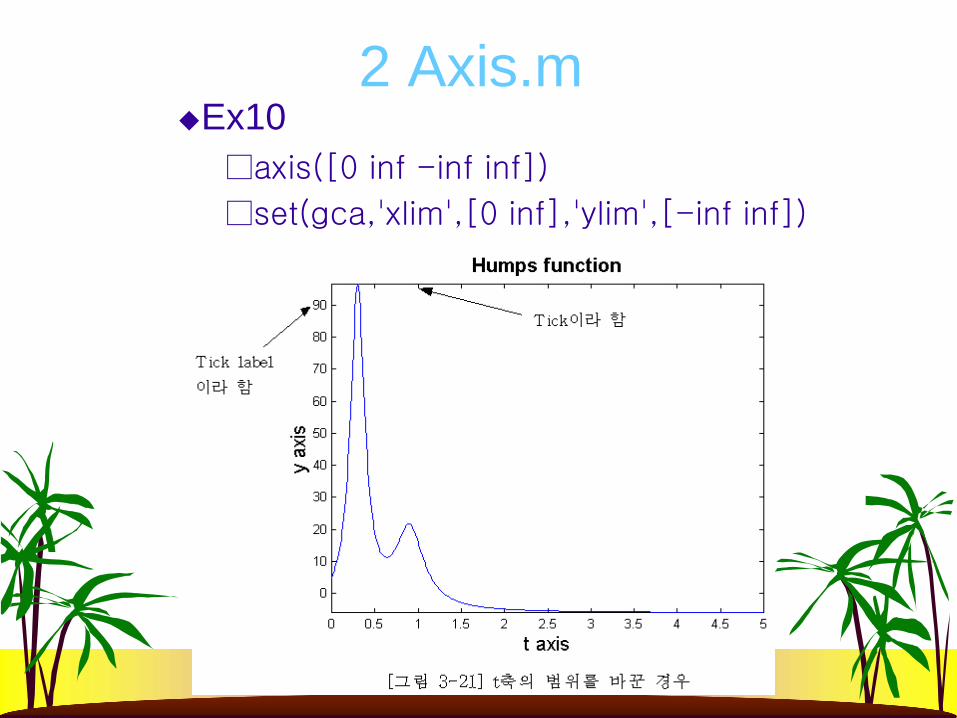
2 Axis.m Ex10□axis([0 inf -inf inf])
□set(gca,'xlim',[0 inf],'ylim',[-inf inf])
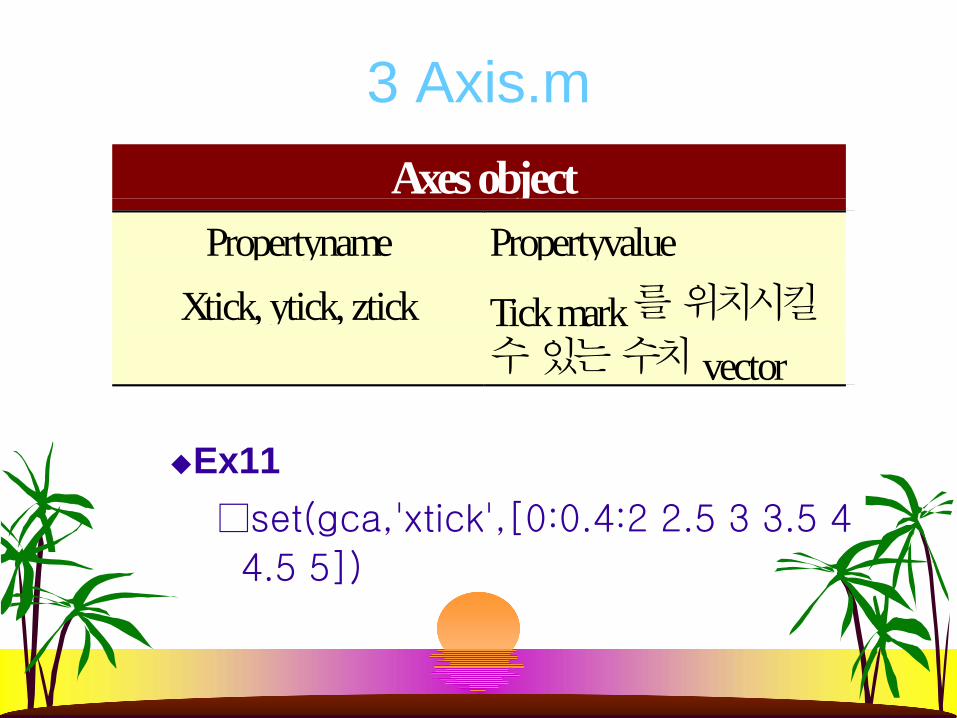
3 Axis.m
Ex11□set(gca,'xtick',[0:0.4:2 2.5 3 3.5 4
4.5 5])
Axes objectPropertyname Propertyvalue
Xtick, ytick, ztick Tick mark를 위치시킬수 있는 수치 vector
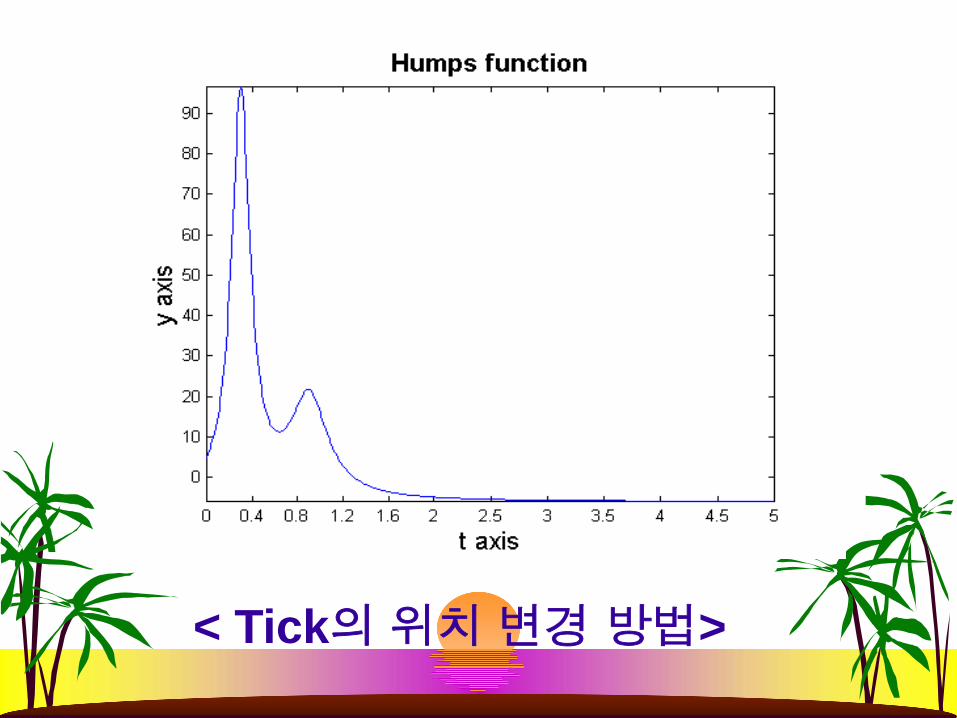
< Tick의위치변경방법>
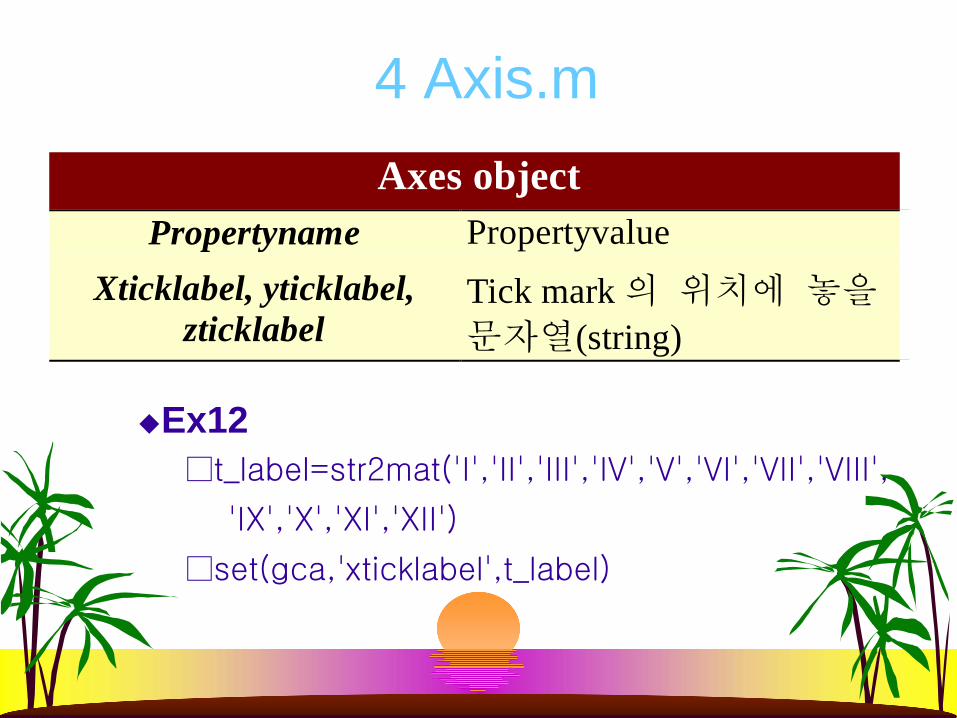
4 Axis.m
Ex12□t_label=str2mat('I','II','III','IV','V','VI','VII','VIII',
'IX','X','XI','XII')
□set(gca,'xticklabel',t_label)
Axes objectPropertyname Propertyvalue
Xticklabel, yticklabel,zticklabel
Tick mark의 위치에 놓을문자열(string)
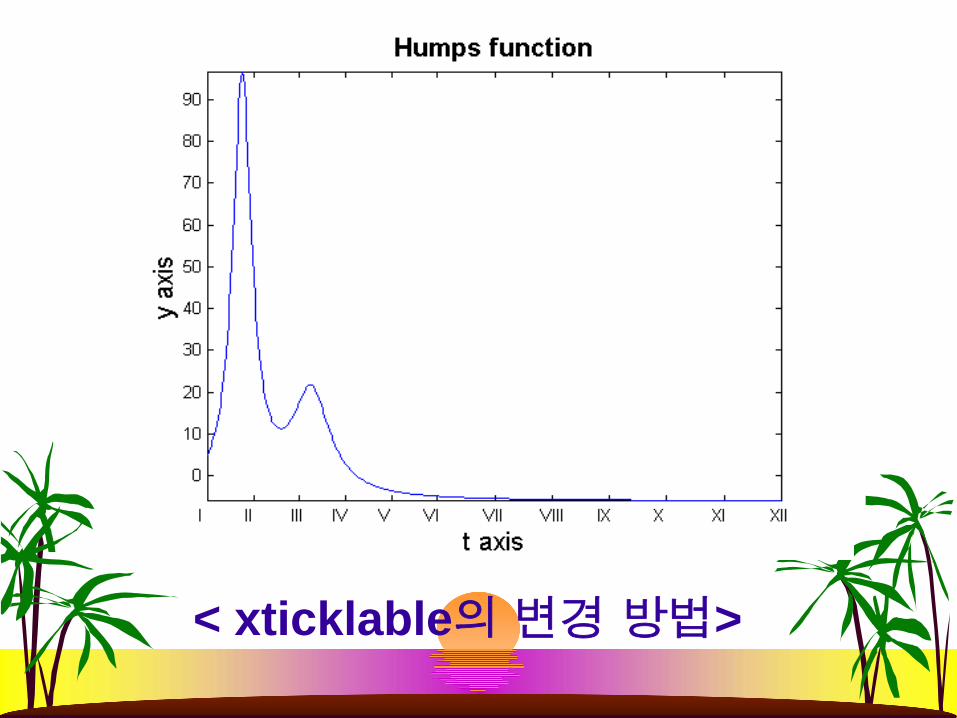
< xticklable의변경방법>
Grid
xgrid, ygrid, zgrid gridlinestylegrid ongrid offhold onhold off
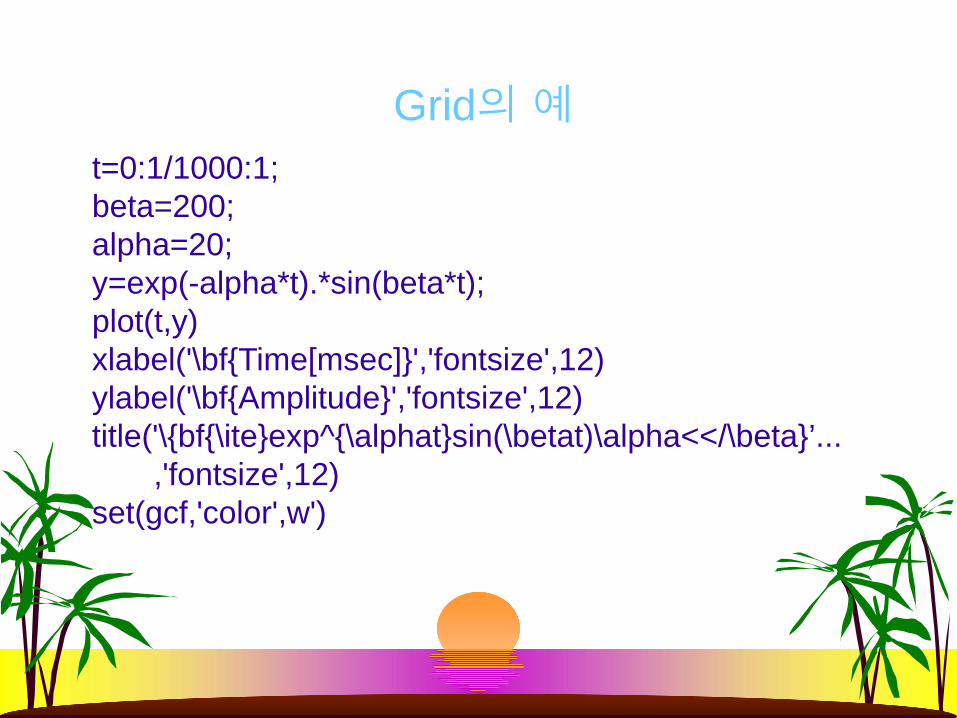
t=0:1/1000:1;beta=200;alpha=20;y=exp(-alpha*t).*sin(beta*t);plot(t,y)xlabel('\bf{Time[msec]}','fontsize',12)ylabel('\bf{Amplitude}','fontsize',12)title('\{bf{\ite}exp^{\alphat}sin(\betat)\alpha<</\beta}’...
,'fontsize',12)set(gcf,'color',w')
Grid의예
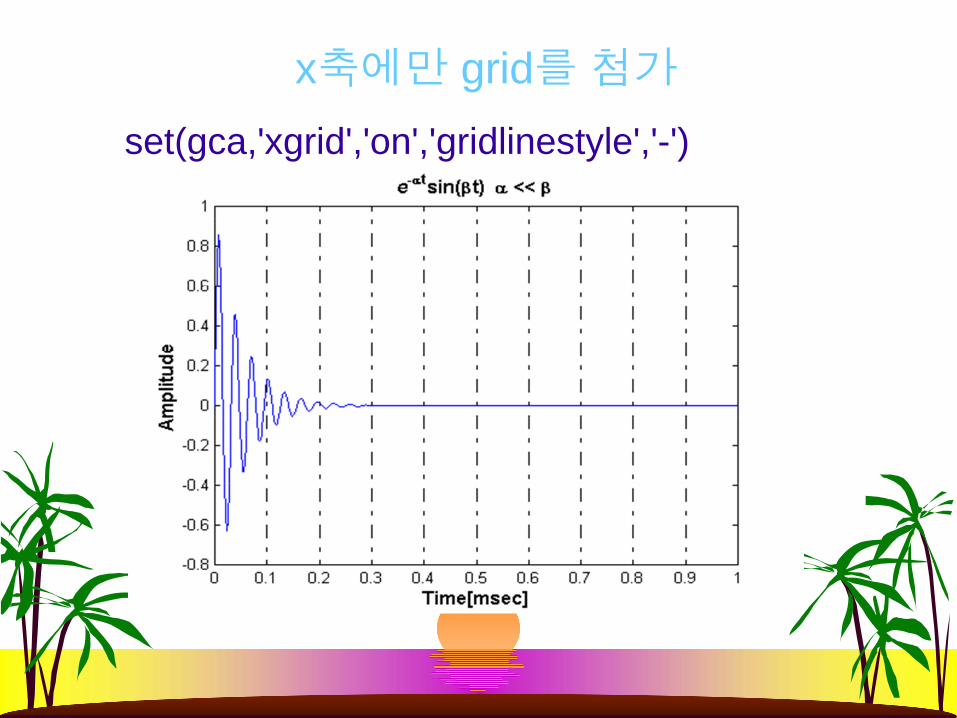
set(gca,'xgrid','on','gridlinestyle','-')
x축에만 grid를첨가
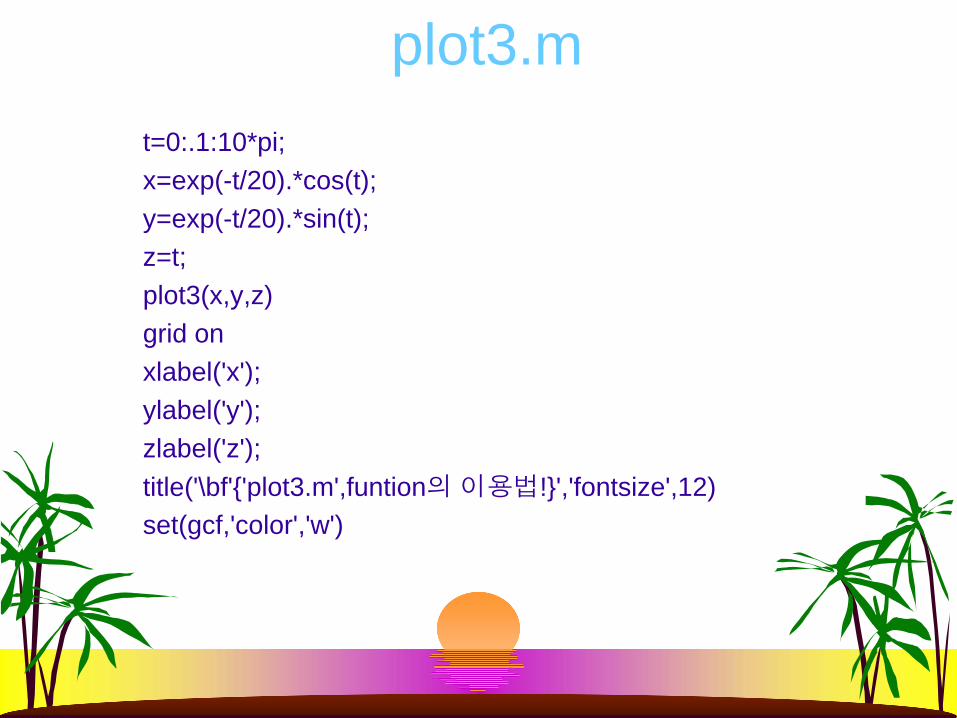
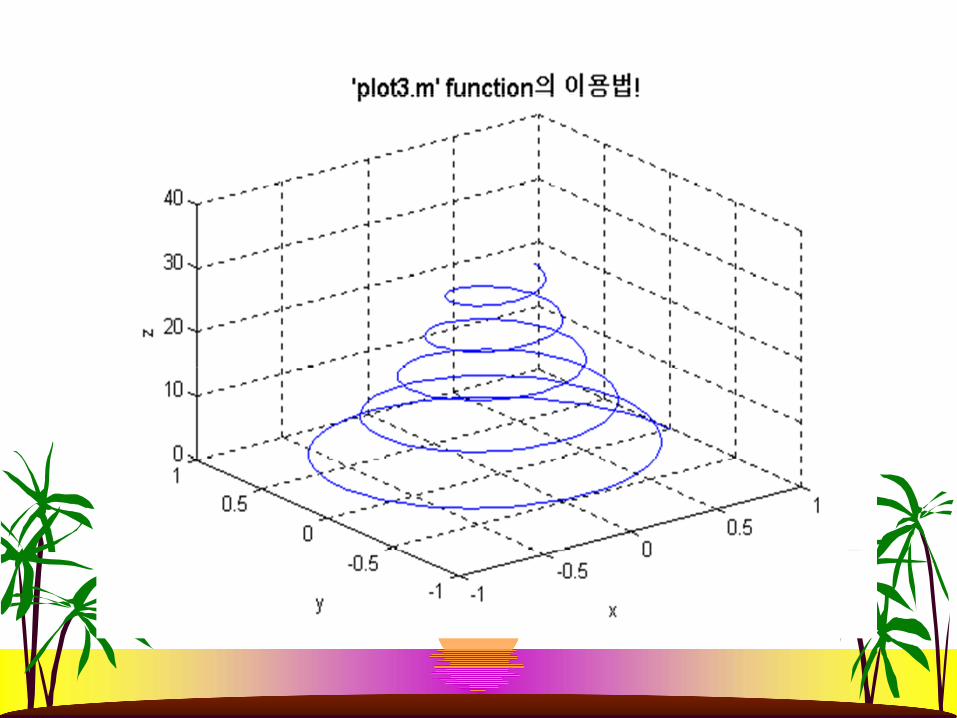
plot3.m t=0:.1:10*pi;x=exp(-t/20).*cos(t);y=exp(-t/20).*sin(t);z=t;plot3(x,y,z)grid onxlabel('x');ylabel('y');zlabel('z');title('\bf'{'plot3.m',funtion의이용법!}','fontsize',12)set(gcf,'color','w')
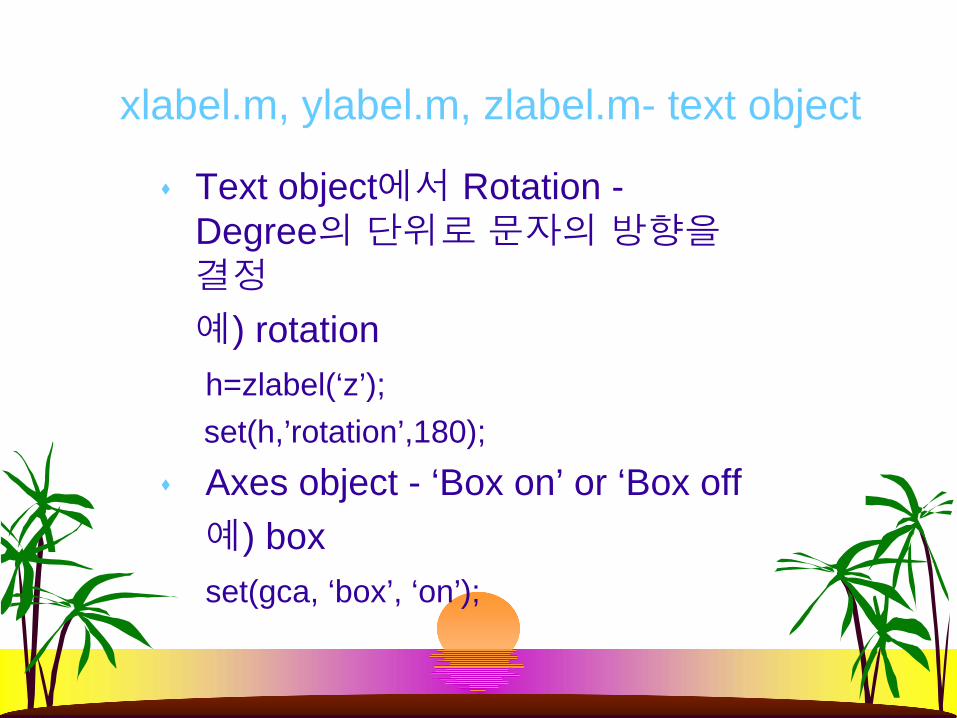
xlabel.m, ylabel.m, zlabel.m- text object
Text object에서 Rotation -Degree의단위로문자의방향을결정
예) rotationh=zlabel(‘z’);set(h,’rotation’,180);Axes object - ‘Box on’ or ‘Box off예) boxset(gca, ‘box’, ‘on’);
contour.m
3차원데이타에대한등고선사용방법
[c, h]=contour(z)[c, h]=contour(z, n)[c, h]=contour(z, v)[c, h]=contour(x, y, z)[c, h]=contour(....., LineSpec)
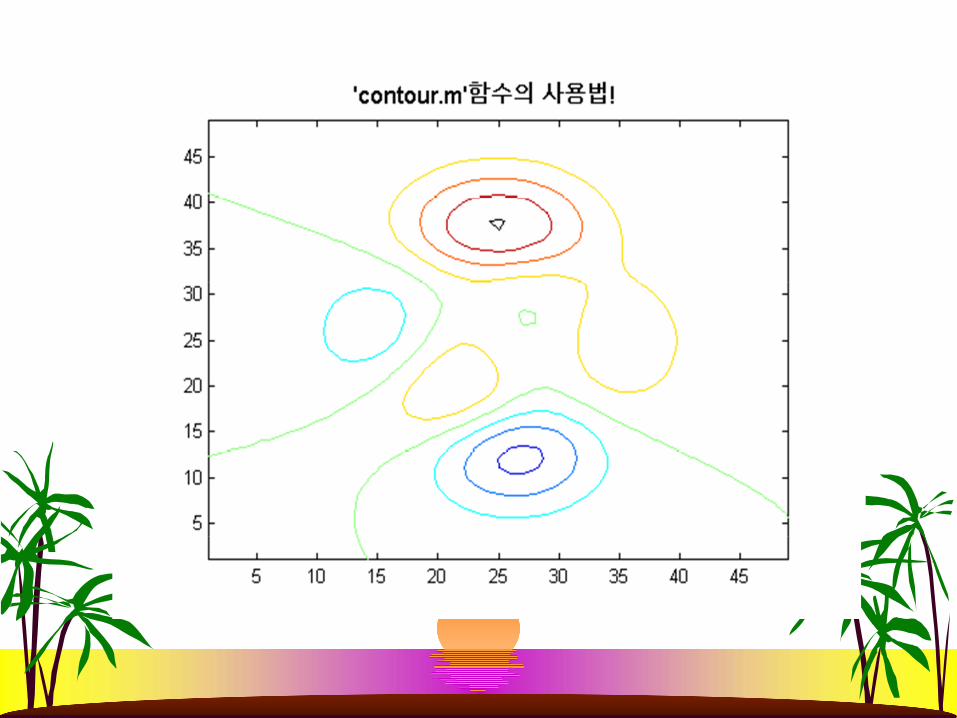
contour.m의예
z =peaks; %matlab이제공하는 sample함수[c, h]=contour(z);set(gcf, ‘color’, ‘w’)title(‘\bf{‘‘contour.m’’ 함수의사용법! }’,‘fontsize’,12)
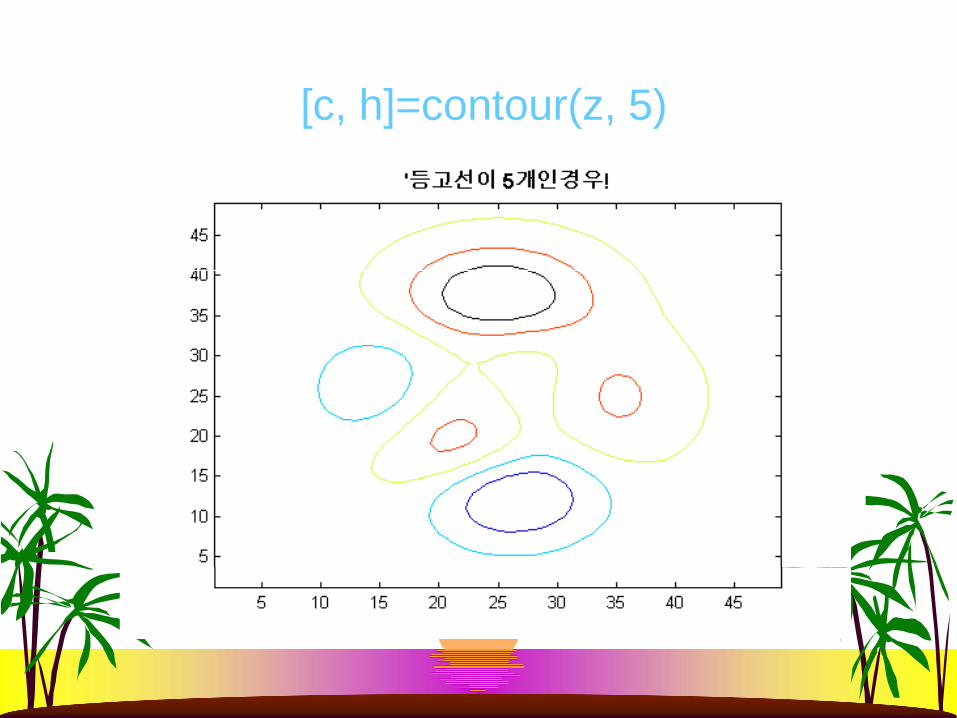
[c, h]=contour(z, 5)
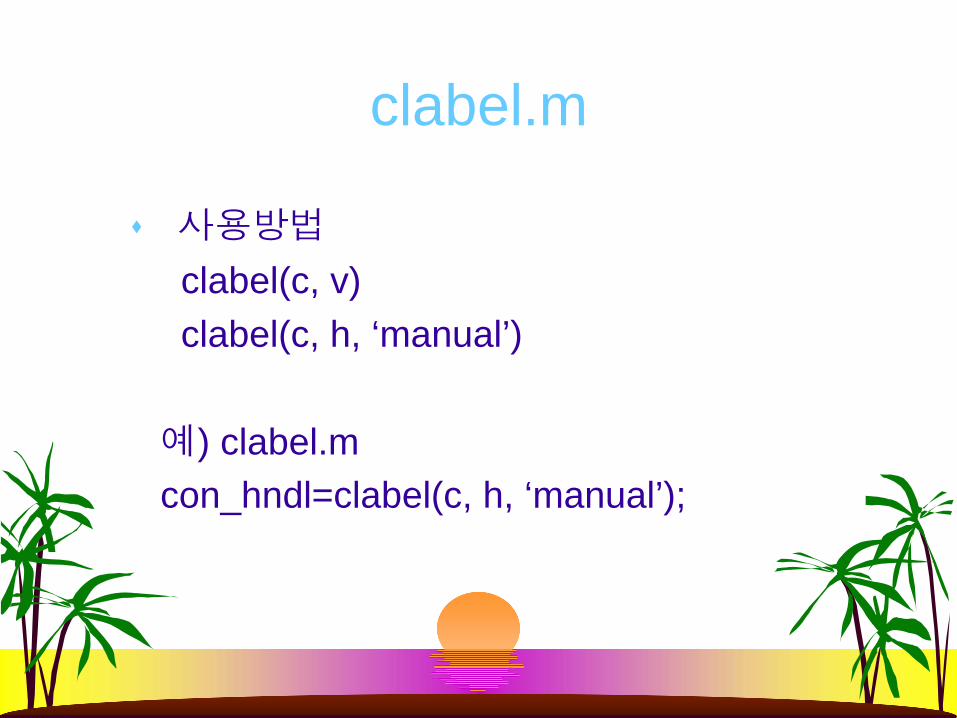
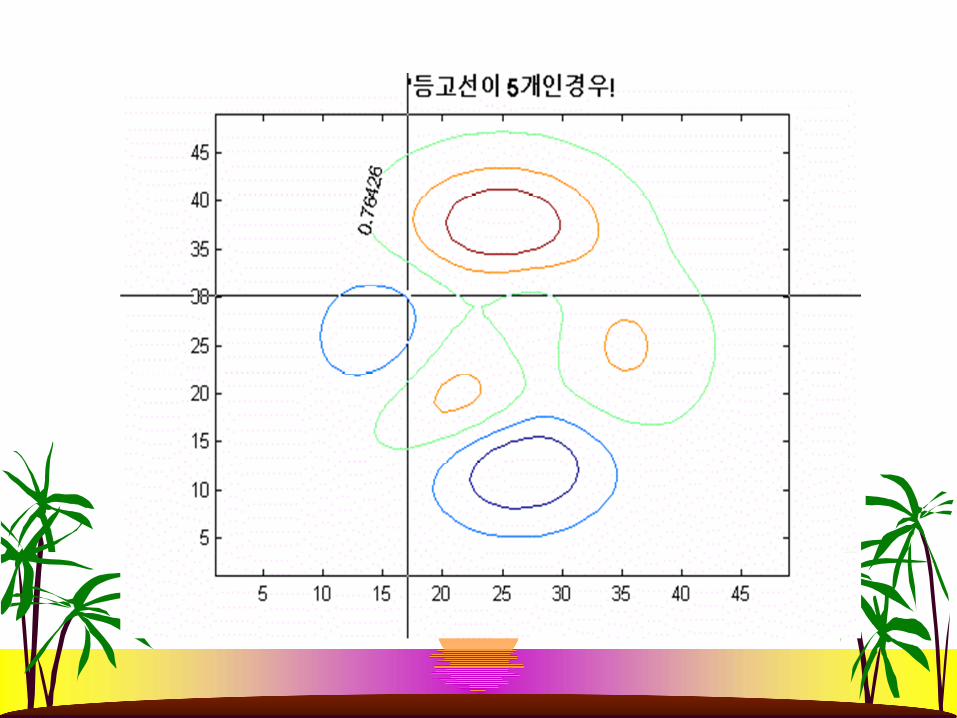
clabel.m
사용방법
clabel(c, v)clabel(c, h, ‘manual’)
예) clabel.mcon_hndl=clabel(c, h, ‘manual’);
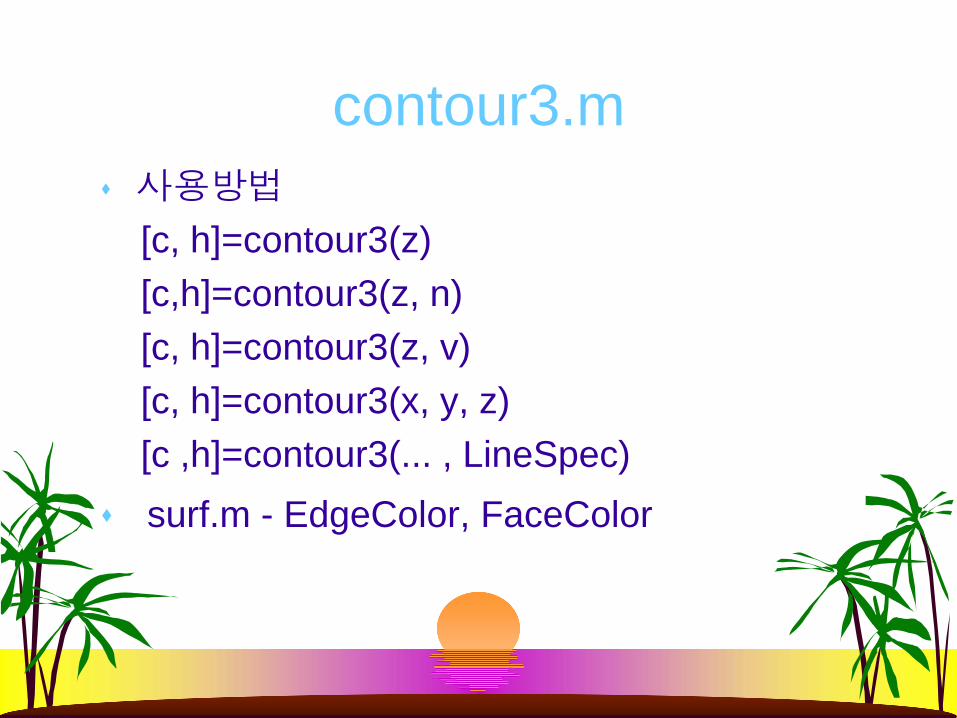
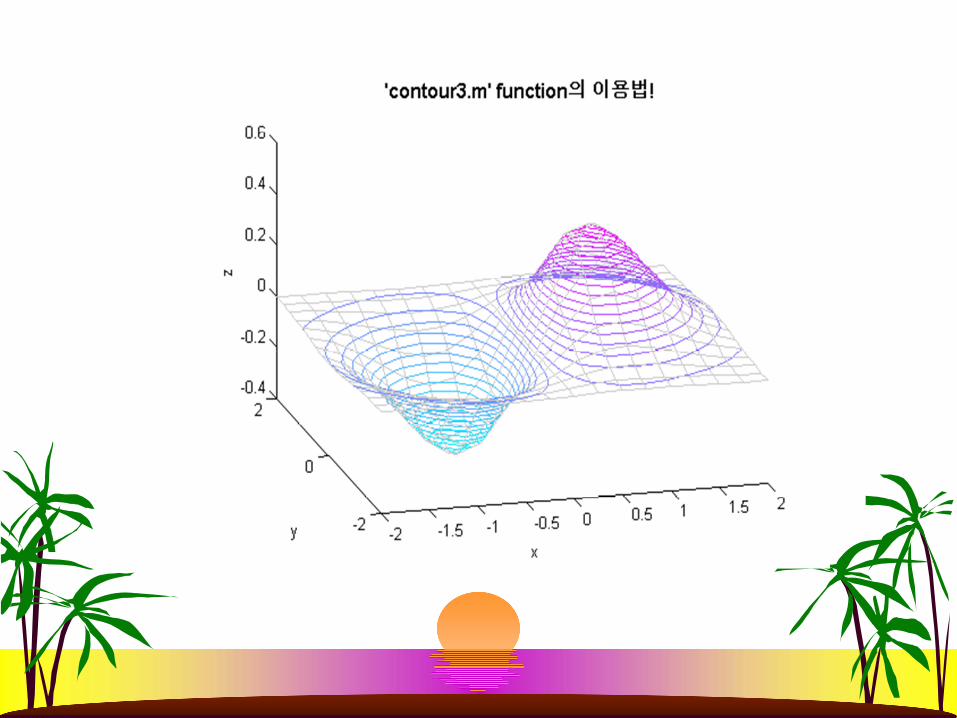
contour3.m사용방법
[c, h]=contour3(z)[c,h]=contour3(z, n)[c, h]=contour3(z, v)[c, h]=contour3(x, y, z)[c ,h]=contour3(... , LineSpec)surf.m - EdgeColor, FaceColor
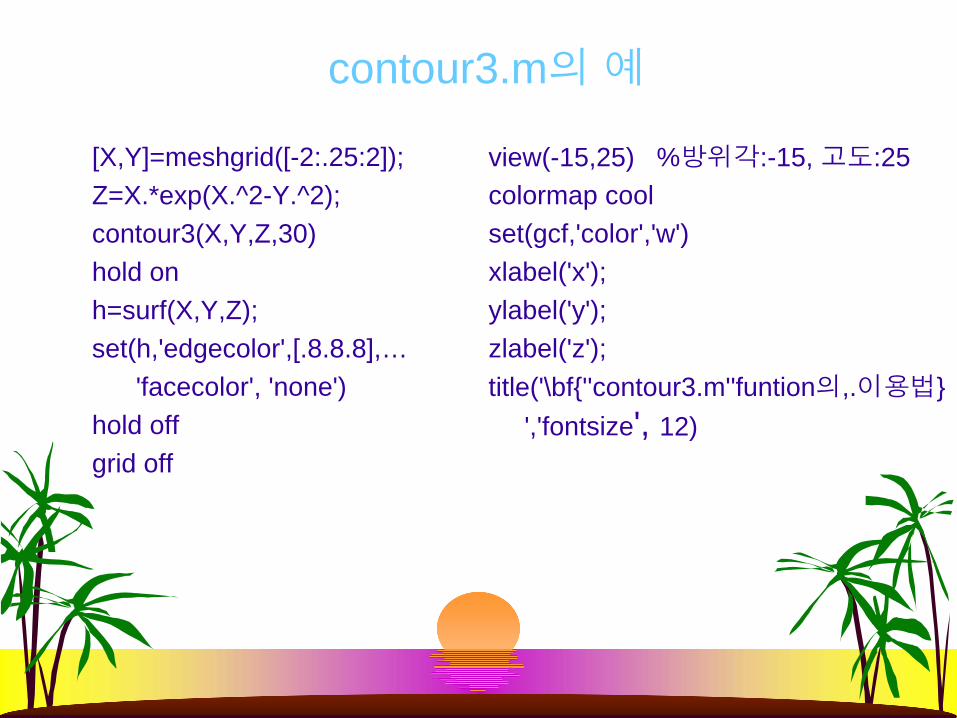
contour3.m의예
[X,Y]=meshgrid([-2:.25:2]);Z=X.*exp(X.^2-Y.^2);contour3(X,Y,Z,30)hold on h=surf(X,Y,Z);set(h,'edgecolor',[.8.8.8],…
'facecolor', 'none')hold off grid off
view(-15,25) %방위각:-15, 고도:25colormap coolset(gcf,'color','w')xlabel('x');ylabel('y');zlabel('z');title('\bf{''contour3.m''funtion의,.이용법}
','fontsize', 12)