Embed Size (px)
Citation preview
Matt Alfano & Brittany Masi
Frito Lay Replenishment Manager:
Jeff Arndt
Senior Design Spring 2010
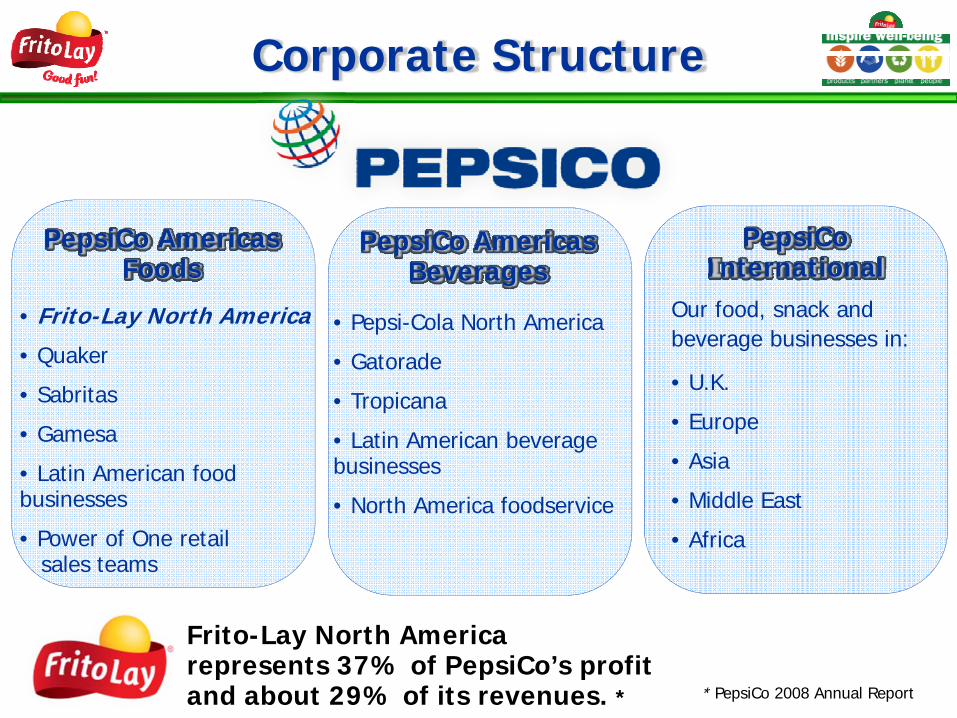
Corporate Structure
PepsiCo Americas Foods
PepsiCo Americas Beverages
PepsiCo International
• Frito-Lay North America
• Quaker
• Sabritas
• Gamesa
• Latin American food businesses
• Power of One retail sales teams
• Pepsi-Cola North America
• Gatorade
• Tropicana
• Latin American beverage businesses
• North America foodservice
Our food, snack and beverage businesses in:
• U.K.
• Europe
• Asia
• Middle East
• Africa
Frito-Lay North America represents 37% of PepsiCo’s profit and about 29% of its revenues. * * PepsiCo 2008 Annual Report
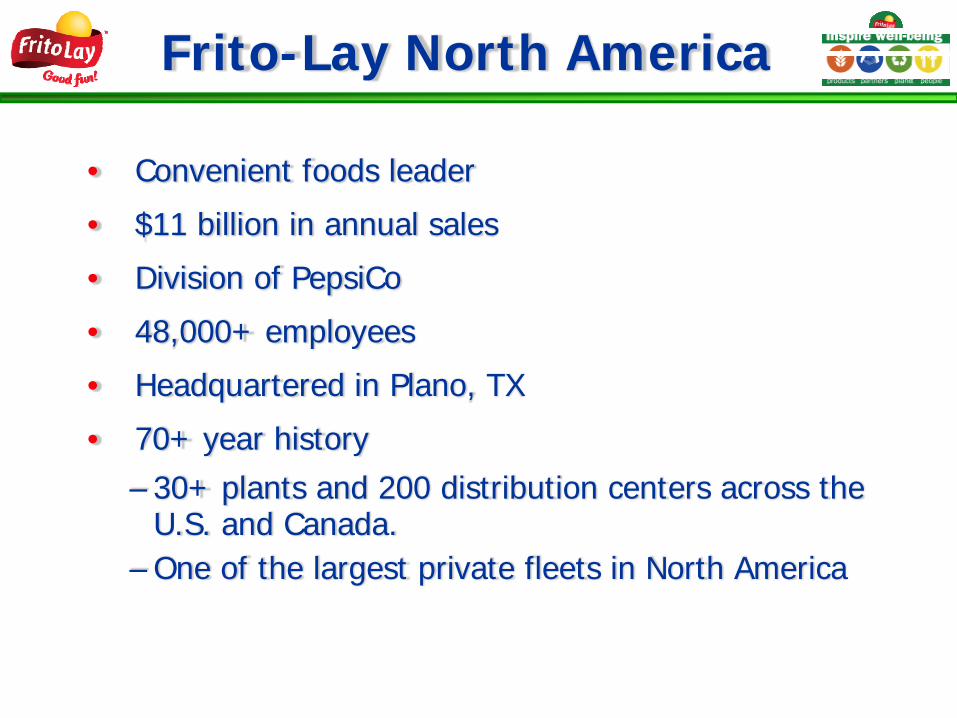
• Convenient foods leader
• $11 billion in annual sales
• Division of PepsiCo
• 48,000+ employees
• Headquartered in Plano, TX
• 70+ year history– 30+ plants and 200 distribution centers across the
U.S. and Canada.– One of the largest private fleets in North America
Frito-Lay North America
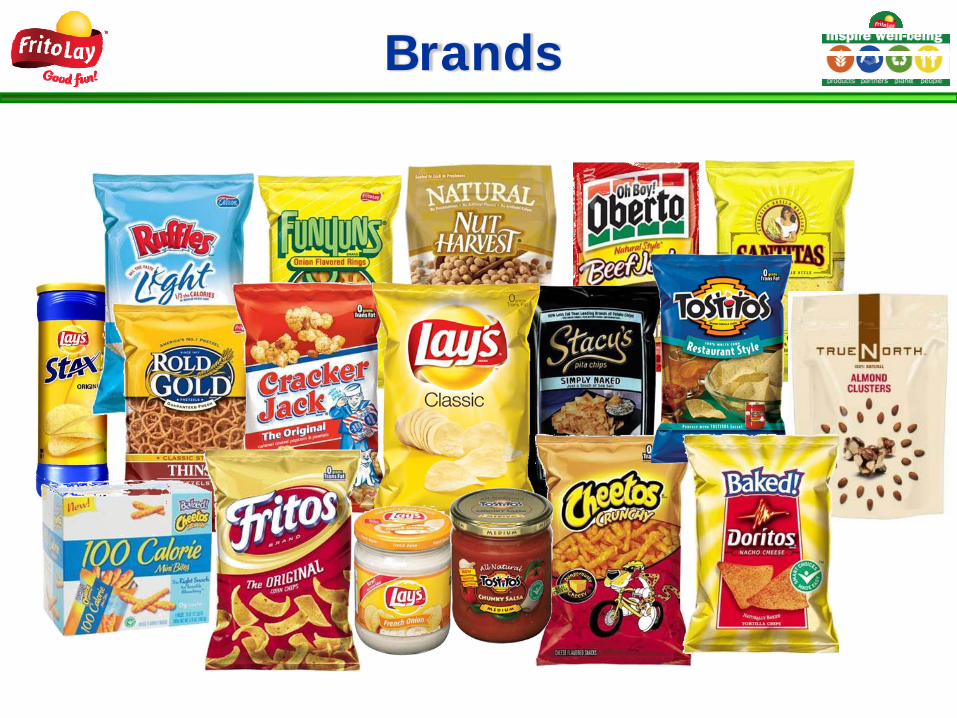
Brands
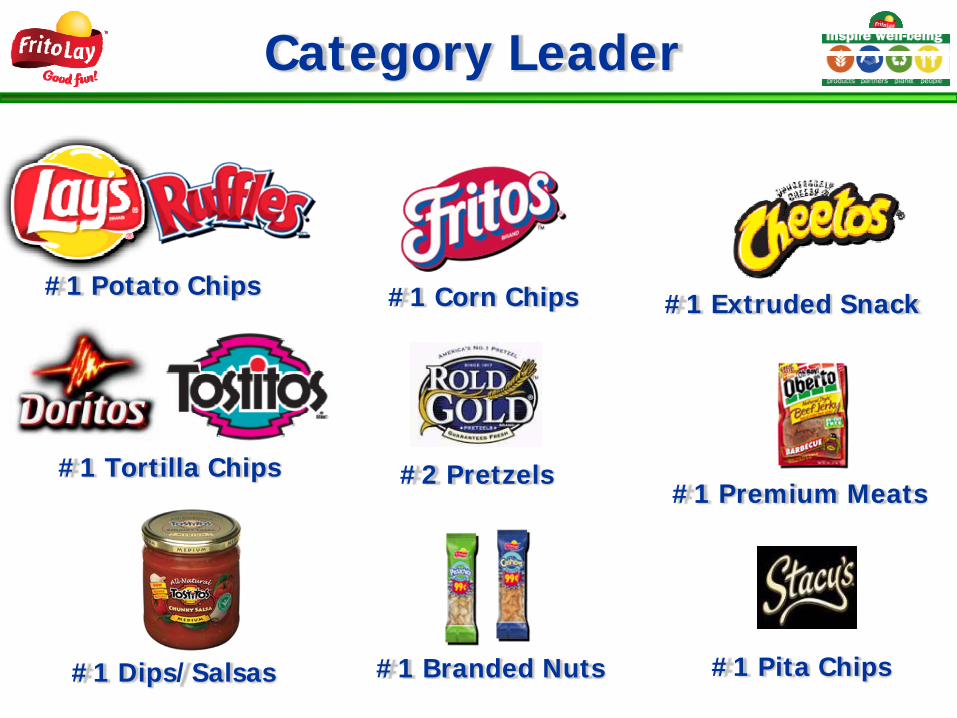
#1 Dips/Salsas #1 Branded Nuts
#1 Premium Meats
#1 Pita Chips
#1 Corn Chips
#1 Tortilla Chips
#1 Potato Chips#1 Extruded Snack
#2 Pretzels
Category Leader
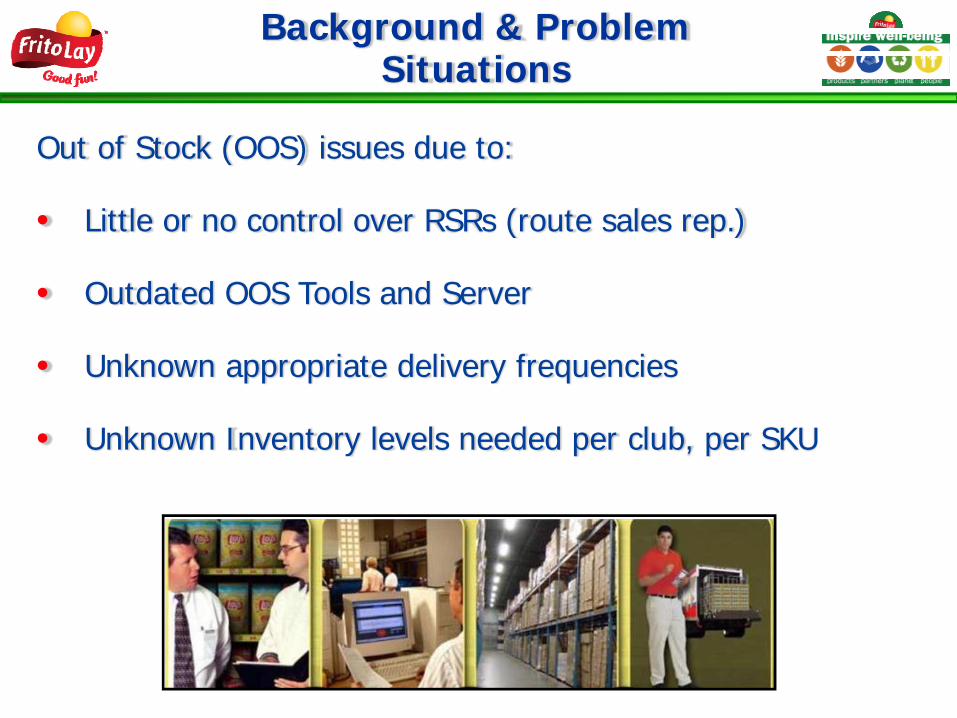
Out of Stock (OOS) issues due to:
• Little or no control over RSRs (route sales rep.)
• Outdated OOS Tools and Server
• Unknown appropriate delivery frequencies
• Unknown Inventory levels needed per club, per SKU
Background & Problem Situations
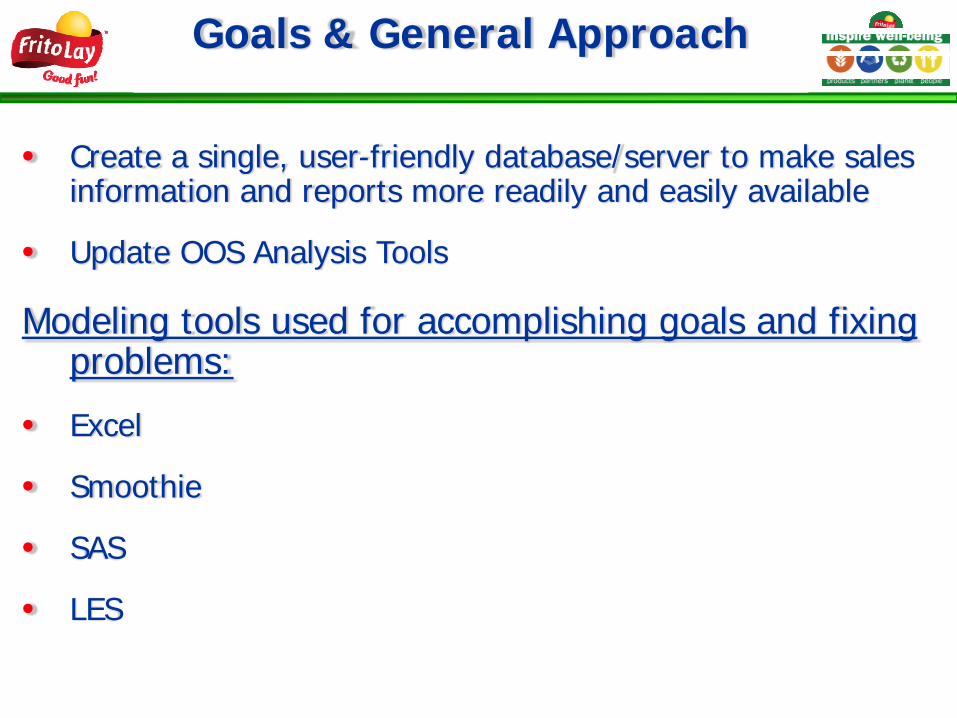
Goals & General Approach
• Create a single, user-friendly database/server to make sales information and reports more readily and easily available
• Update OOS Analysis Tools
Modeling tools used for accomplishing goals and fixing problems:
• Excel
• Smoothie
• SAS
• LES
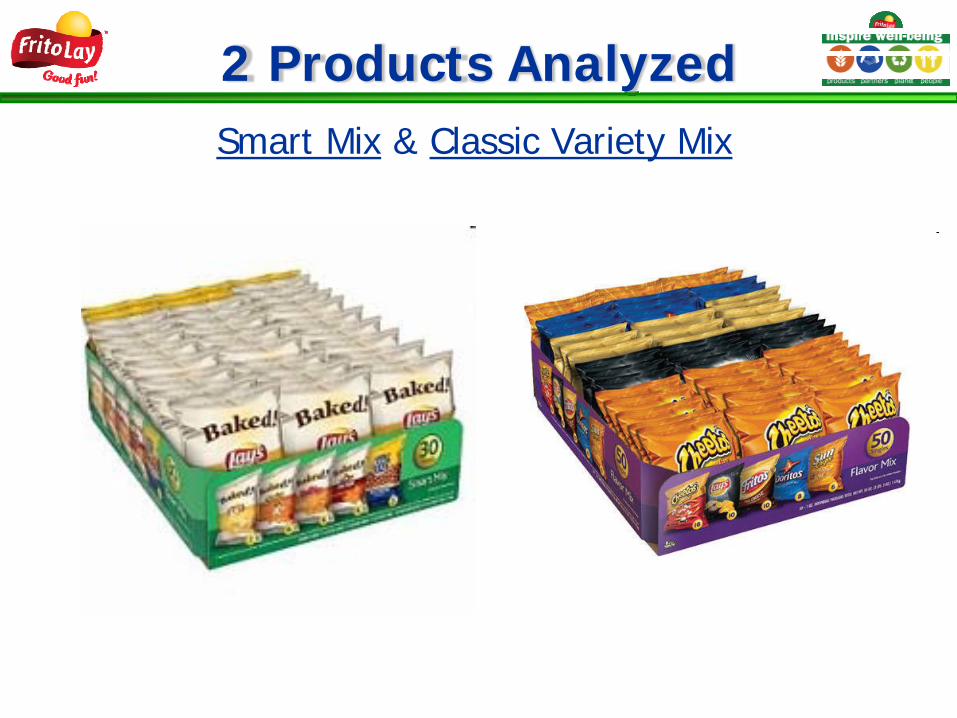
2 Products AnalyzedSmart Mix & Classic Variety Mix
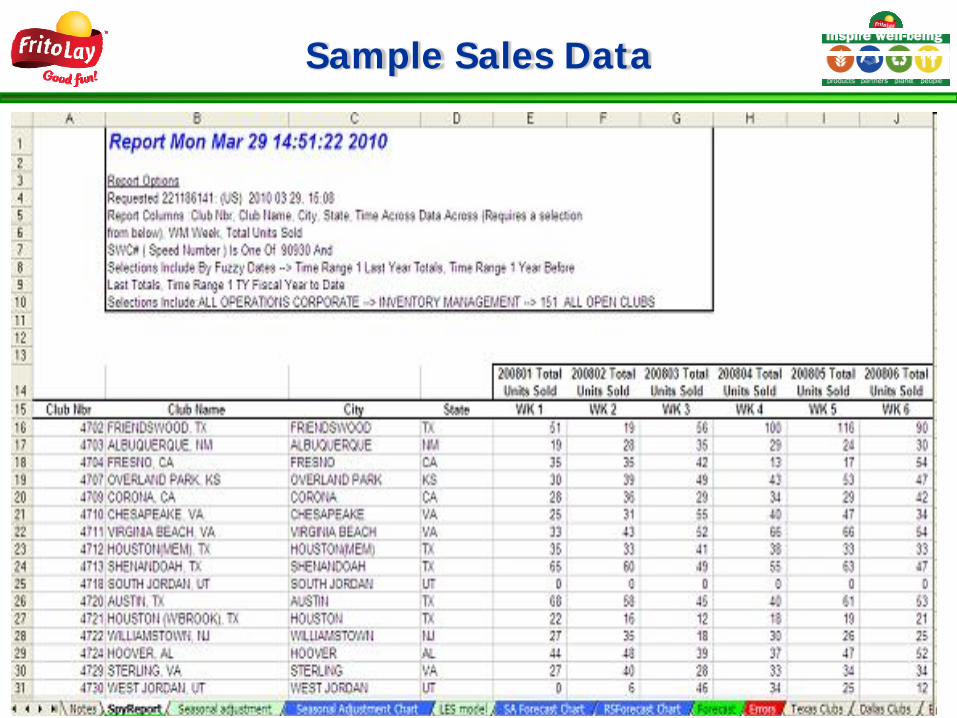
Sample Sales Data
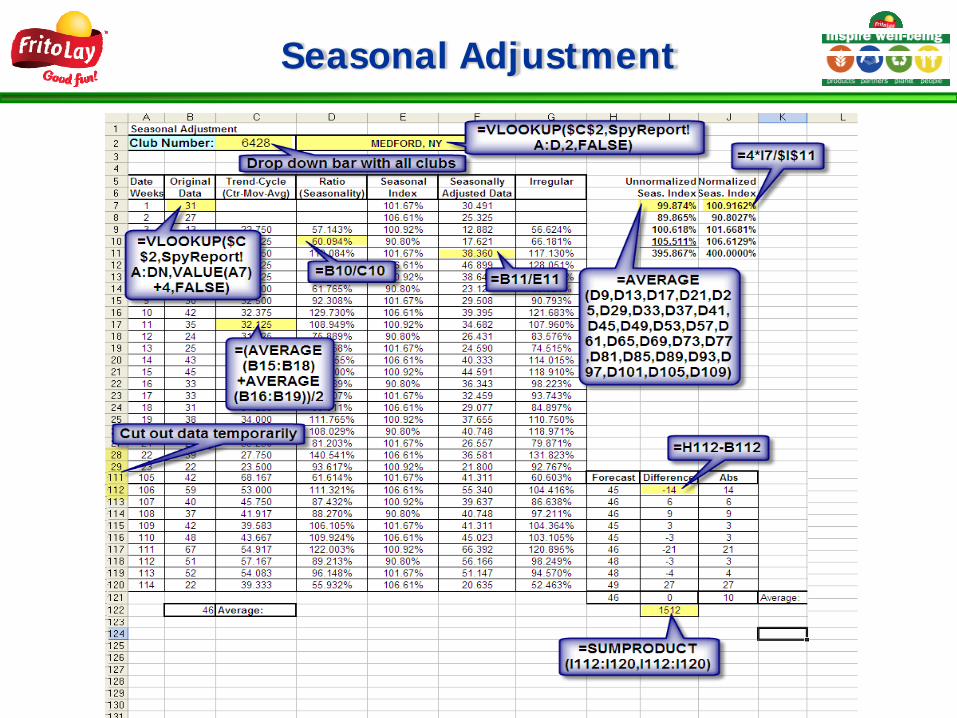
Seasonal Adjustment
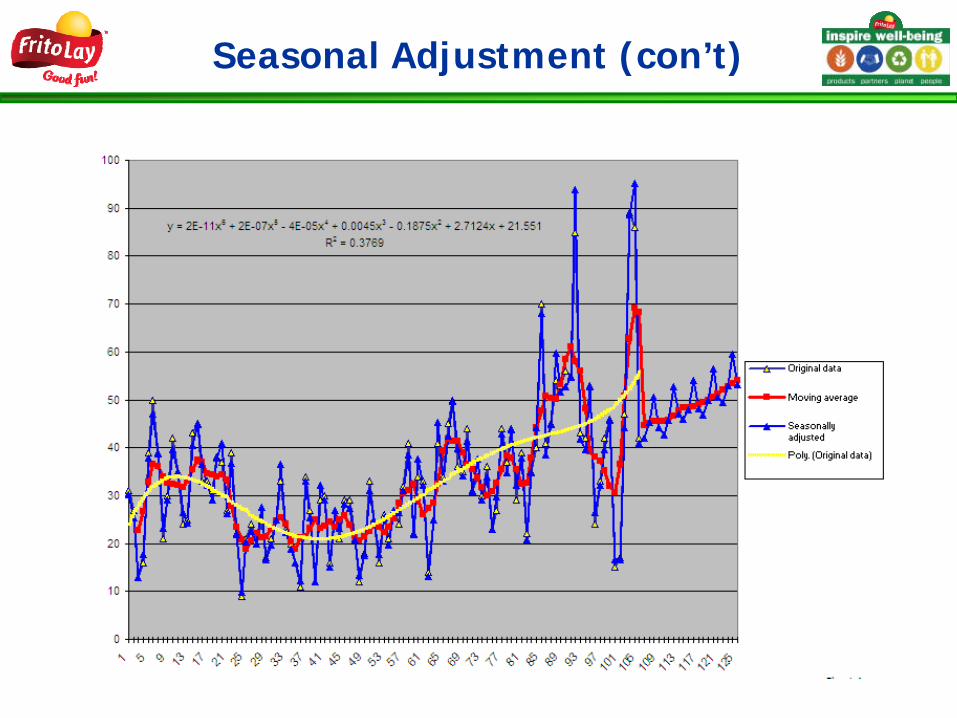
Seasonal Adjustment (con’t)
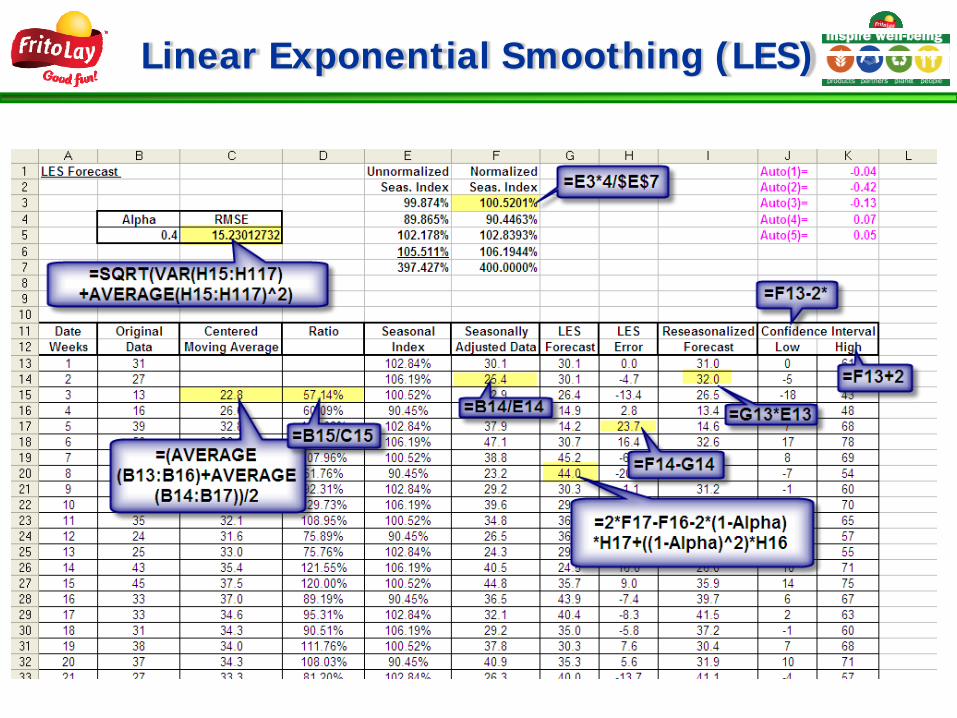
Linear Exponential Smoothing (LES)
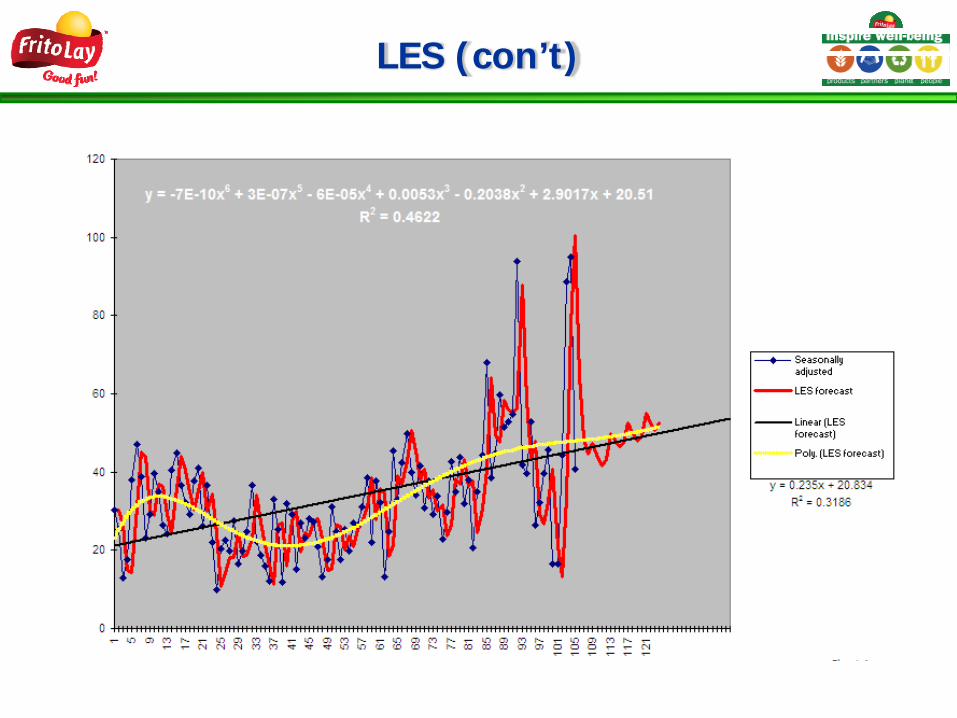
LES (con’t)
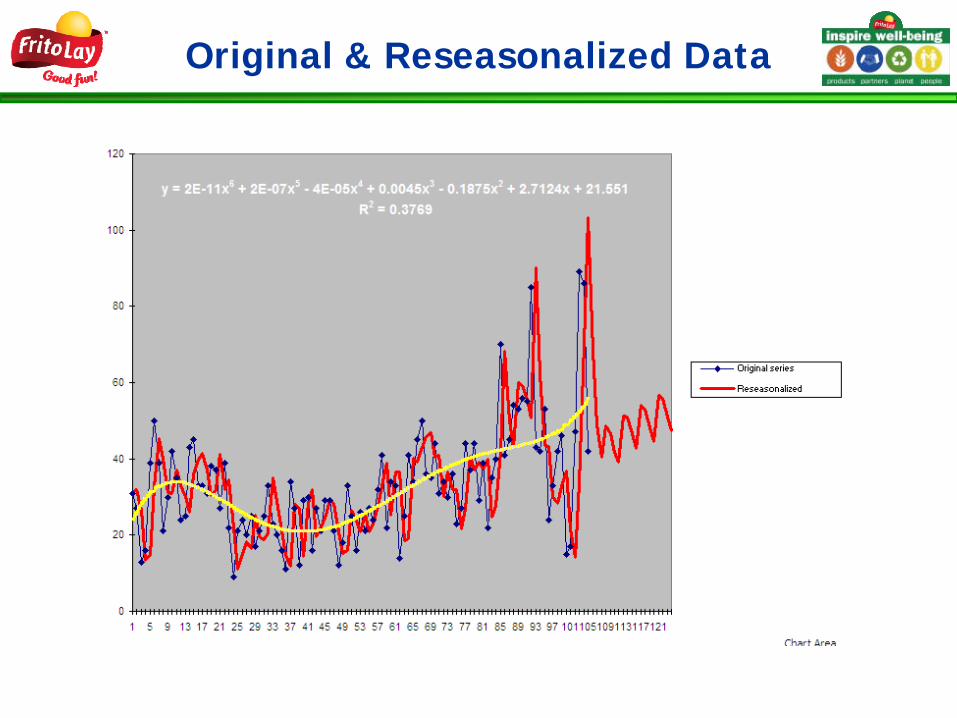
Original & Reseasonalized Data
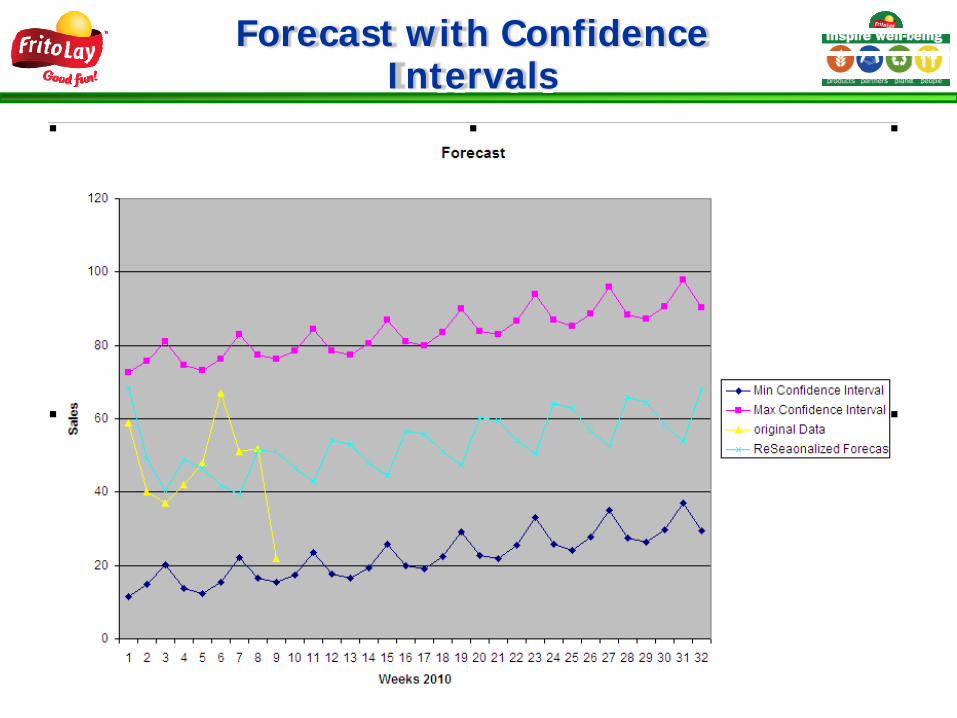
Forecast with Confidence Intervals
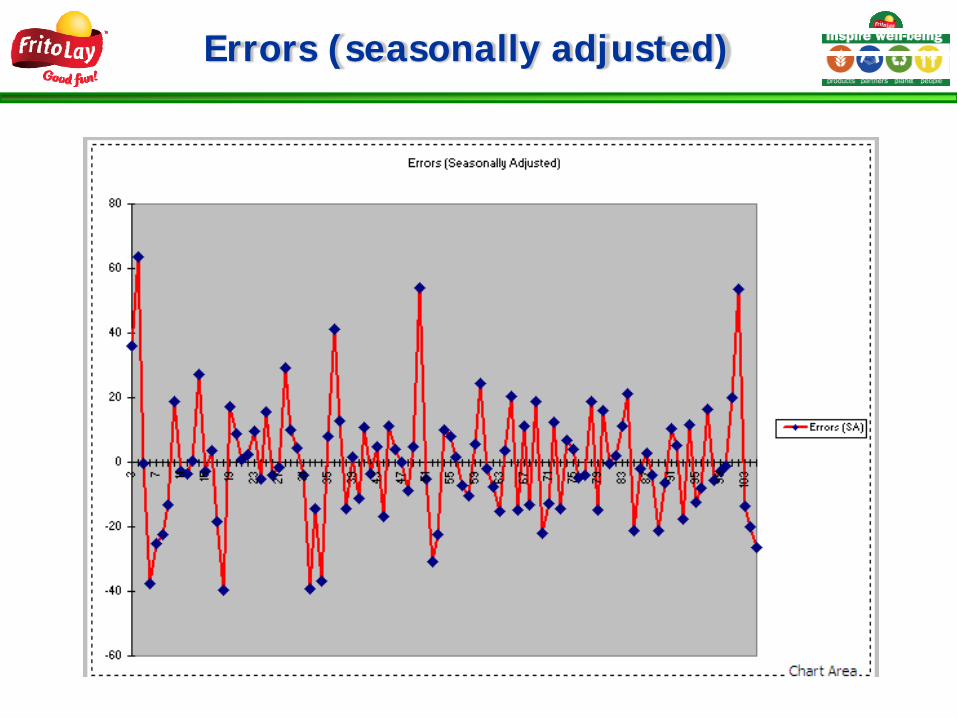
Errors (seasonally adjusted)
Analysis Summary
• We created multiple tools for analyzing sales data and creating forecasts for every Sam’s Club nationwide
• These forecasts analyze two high volume and high demand products and give:
– - Seasonal adjustments along with LES (linear exponential smoothing) models
– - two week future forecasts with confidence intervals to measure the accuracy of those forecasts
– - centered moving averages, seasonal indices, root mean squared errors, and ratio to moving averages
Managerial Interpretation
Sam’s Club representatives, RSRs and RSMs (regional sales managers) will be able to access needed, time sensitive sales information and generate reports and forecasts more easily.
Appropriate inventory levels per Club, per SKU can be established, along with proper delivery frequencies.
This will allow Frito Lay to avoid the hassle of OOS fines and gain a bit more control over the information gathering process, which is crucial when it comes to forecasting sales and maintaining moving inventory.
Conclusions & Critiques
• User Friendly!!!
• Update your software!!!
• Keep sales records of at least 5 previous years (currently 3) for more accurate forecasts and analysis
• Replace/change minimum inventory levels for appropriate SKUs (currently 11 units for every product)