Embed Size (px)
Citation preview
Matveev, M. Y., Belnoue, J. P. H., Nixon-Pearson, O. J., Ivanov, D. S.,Long, A. C., Hallett, S. R., & Jones, I. A. (2019). A numerical study ofvariability in the manufacturing process of thick composite parts.Composite Structures, 208, 23-32.https://doi.org/10.1016/j.compstruct.2018.09.092
Peer reviewed versionLicense (if available):CC BY-NC-NDLink to published version (if available):10.1016/j.compstruct.2018.09.092
Link to publication record in Explore Bristol ResearchPDF-document
This is the accepted author manuscript (AAM). The final published version (version of record) is available onlinevia Elsevier at https://doi.org/10.1016/j.compstruct.2018.09.092 . Please refer to any applicable terms of use ofthe publisher.
University of Bristol - Explore Bristol ResearchGeneral rights
This document is made available in accordance with publisher policies. Please cite only thepublished version using the reference above. Full terms of use are available:http://www.bristol.ac.uk/red/research-policy/pure/user-guides/ebr-terms/
1
A numerical study of variability in the manufacturing process of thick composite parts
M. Y. Matveeva, J. P.-H. Belnoueb, O. J. Nixon-Pearsonb, D. S. Ivanovb, A. C. Longa, S. R.
Hallettb, I. A. Jonesa
a) Composites Research Group, Faculty of Engineering, University of Nottingham,
Nottingham, United Kingdom;
b) Bristol Composite Institute (ACCIS) Advanced Composites Centre for Innovation and
Science), University of Bristol, University Walk, Bristol, United Kingdom
Abstract
Consolidation of a prepreg layup to a target thickness is critical in order to achieve the required
fibre volume fraction and dimensions in a composite part. Experiments show that different
processing conditions lead to different levels of compaction and variability in the thickness.
This paper presents an analysis of processing conditions and their effects on consolidation of
thick composite components. A model that accounts for both percolation and squeezing flow
is employed to study two toughened prepreg systems – IM7/8552 and IMA/M21. This paper
analyses the significance of the process parameters on the thickness of prepregs and its
variability. The analysis of different layups and processing conditions suggests several
strategies to control target thickness and its variability. The IMA/M21 prepreg system was
found to have lower variability due to its toughening mechanism. The presented results provide
a better understanding of the composite manufacturing and can be used to provide an informed
choice in design for manufacture of composite structures.
Keywords: process simulation; prepregs; variability
1. Introduction
Increasing effort to reduce the cost and design time of composite components has resulted
in adopting digital manufacturing, where each stage of the process, e.g. draping [1] or resin
infusion [2], is simulated numerically. Simulation of the manufacturing processes makes it
2
possible to predict the final geometry of a part, its performance and to optimise the
manufacturing strategy to mitigate possible defects such as wrinkles [3]. Modelling of the
consolidation process predicts the final thickness of the part and can help to predict possible
defects arising from non-uniform compaction e.g. ply waviness or out of tolerance. Previously,
such predictions were focused on predicting the final shape and thickness of the various
composite parts e.g. corner parts [4-6]. However, some of the defects have a stochastic nature
[7] i.e. their location and severity is not predetermined only by the geometry or processing
conditions but arise from the stochastic nature of material properties and variations in
conditions. In the light of these uncertainties, even manufacturing of a flat laminate can result
in an inconsistent thickness between the trials, which can particularly be an issue for thick
laminates. The tolerance on the final thickness of a laminate for industrial applications can be
as tight as ±0.3 mm on a part of any thickness. Such tolerance means that the coefficient of
variation of thickness of a 20 mm laminate should be as small as 0.5%. The problem of reducing
the variation of the thickness is discussed and analysed in this paper.
Difficulties with deviation of the as-manufactured thickness from the value set by design
is currently resolved by shimming, which increases parts weight, or adding sacrificial plies and
then machining to the target value, which gives additional costs to the manufacturing. Defects
related to the prepreg compaction can also arise when a composite part is manufactured using
two rigid tools. First, an over-thick lay-up can prevent tooling closure or tool stand-off
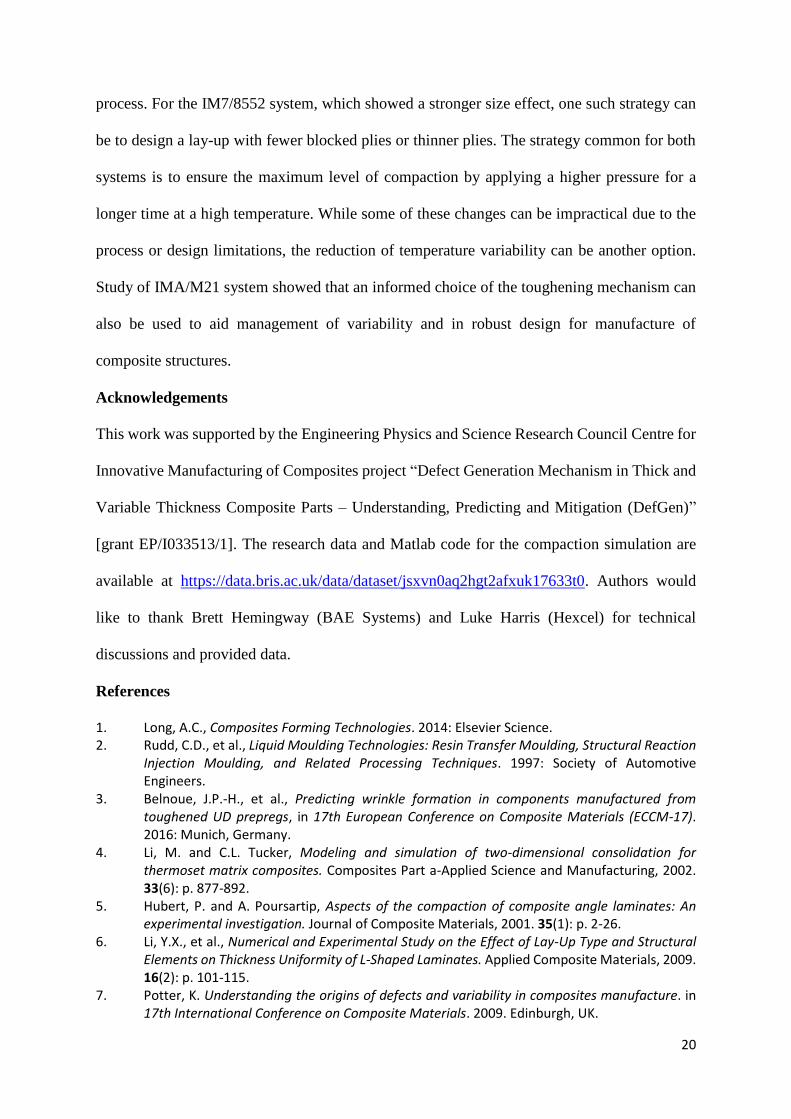
preventing full consolidation of parts of the laminate. Second, manufacturing of a tapered
laminate can generate moderate waviness, even when a suitable design of tool geometry is
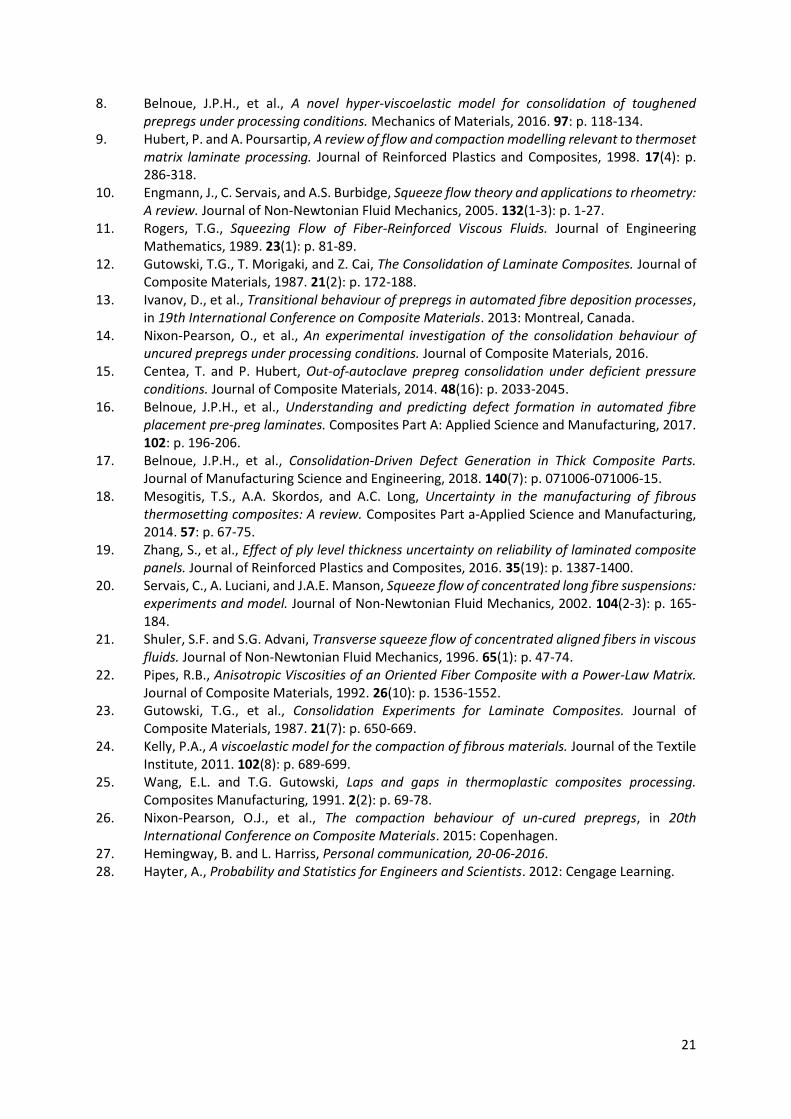
chosen as shown in Figure 1. In the case of an over-thick lay-up, if the design is implemented
in the absence of accurate data or models of compressibility of the prepregs, then the thicker
part of a tapered laminate generates severe wrinkles as shown in Figure 2. These examples
show that predicting the thickness to which the laminate can be compacted is important for
3
avoiding defects in composite manufacturing. More precise manufacturing can help to reduce
or completely avoid these difficulties.
This paper employs the hyper-viscoelastic consolidation model recently presented by
Belnoue et al. [8] to investigate the effect of material and geometric uncertainties on the final
thickness of thick, flat laminates. This validated consolidation model makes it possible to take
into consideration the geometric and material parameters as well as a range of processing
conditions. The results are presented in the form of several case studies each illustrating one
possible strategy to improve the dimensional tolerance of thick laminates.
As highlighted in two separate review papers by Hubert and Poursartip [9] and Engmann
et al. [10] respectively, traditional numerical analysis for composite processing is based on
either the assumption that, under compaction, the system of resin and fibres deforms as a
homogenous medium, where the viscous resin moves the fibres, or that the resin is so thin that
it can flow through the stationary fibre bed. The first assumption is usually made in the case
where the resin is a thermoplastic and this is modelled using squeezing flow theories [11]. The
second assumption, on the other hand, is usually made in the case of thermoset resins and is
mathematically represented through bleeding flow theories such as Darcy’s law [12]. However,
studying the consolidation and cure of composite precursors laid over female and male L-
shaped tools, Hubert and Poursatip [5] suggested that in the case of modern thermoset systems
where thermoplastic is added to the base resin in order to improve the mechanical properties
of the finished part, both squeezing and bleeding flow co-exist. Based on these observations
and on new experimental data produced by Ivanov et al. [13] and Nixon-Pearson et al. [14],
Belnoue et al. [8] have recently proposed a new phenomenological model for toughened
prepreg systems that was shown to be able to account for both flow regimes concurrently, and
was robust enough to make accurate thickness predictions for a wide range of process
parameters.
4
In the last 20 years or so, consolidation models have been used for the prediction of the
final geometry of parts formed around a tool where some non-uniform thickness was expected
due to non-uniform pressure distribution (e.g. a corner region in L-shape parts). These studies
(e.g. [5, 6, 15]) were mainly concerned with prediction and experimental evaluation of the
final shape of the specimen, especially corner parts, and were able to detect the effect of lay-
up on the shape or the effect of processing conditions on thickness of flat laminates. The latest
research [3, 16, 17] has shown that more advanced models can predict geometry of complex
shape specimens.
Having an ability to model complex geometries and processing conditions, it becomes
important also to incorporate uncertainties into the modelling strategy. A review of possible
uncertainties arising in the manufacturing of composites was given by Mesogitis et al. [18]. It
describes uncertainty in draping, permeability and curing stages of manufacturing. In most
cases modelling was focused on predicting the variability in the homogenised properties e.g.
permeability, based on the variability in meso-scale architecture. Effect of ply thickness on
mechanical properties and its relation to variability of the laminate thickness was studied by
Zhang et al. [19]. The study showed that laminate failure probability is affected by ply thickness
variability. However, studies relating the distribution of the ply thickness to the manufacturing
process or to the variability in laminate thickness are rarer. The aim of this paper is to
understand the processing conditions that can be used to control the variability of ply and
laminate thicknesses.
The paper gives a brief description of the consolidation experiments [14], observed
physical phenomena and consolidation model [8] in Section 2. A parametric study in Section
3 ranks processing parameters by their impact on the cured ply thickness. Section 4 presents
analysis of available and new experimental data and numerical stochastic modelling based on
Monte Carlo simulations using the realistic material model. Several case studies, including
5
various layups and representative processing conditions, are considered in order to illustrate
which parameters have higher significant on the consolidation of the prepregs. The paper
provides a new insight into the ways the processing strategy can be adjusted to reduce
variability in thickness of thick laminates.
2. Development of the consolidation model
2.1. Brief summary of experimental programme
Two aerospace grade toughened prepreg systems from Hexcel® were investigated, namely
IM7/8552 (nominal cured ply thickness of 0.131 mm) and IMA/M21 (nominal cured ply
thickness of 0.184 mm). The toughening strategy of the prepregs differs: the two base resin are
very similar “second generation” epoxies but in IMA/M21 an extra fraction of thermoplastic
particles is added, which forms an interlayer between the plies. The particles comprising the
interlayer have characteristic dimensions ranging from 15 µm to 25 µm that are larger in size
than the inter-fibre distance and so they cannot enter the fibre bed. This interlayer, together
with the greater viscosity and thickness of IMA/M21 plies, prevents merging of adjacent plies.
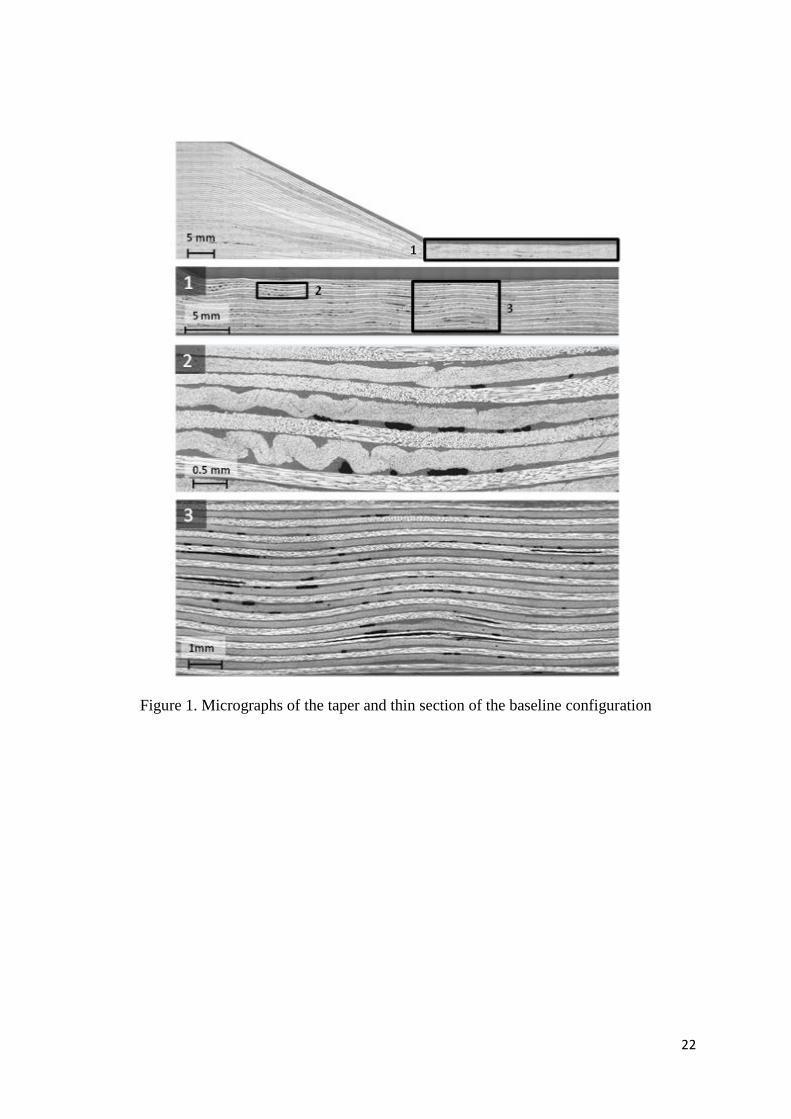
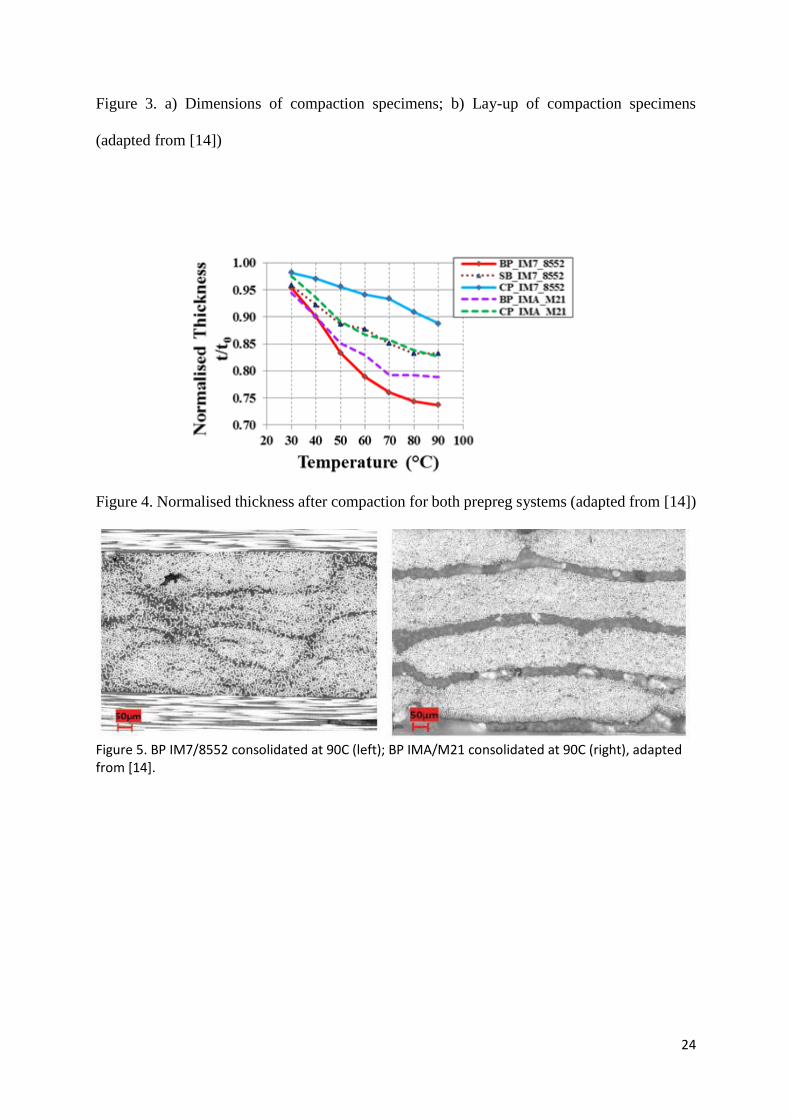
A series of the compaction tests was conducted on cruciform samples in [14], as shown in
Figure 3. Two in-plane dimensions of the central zone (15×15 mm and 30×30 mm) and three
stacking sequences of 16 plies, cross-ply (CP) – [90/0]8, semi-blocked ply (SB) – [902/02]4,
blocked ply (BP) – [904/04], were considered. The specimens were loaded in two compaction
regimes: a slow monotonic loading, and a ramp-dwell regime where the fast application of load
was followed by long dwell at a constant load. The final load of 60 N was achieved in 1200
seconds for baseline specimens in both regimes. The initial load for the ramp-dwell programme
was 20 N and the final load was achieved in several steps with 10 N increment. The initial load
for the scale-up specimens was set to 80 N and the increment step of 40 N was applied.
Experiments were performed over a range of temperatures from 30°C to 90°C with 10°C steps
for the samples with various thickness-to-width ratio of the ply blocks (in the CP, SB and BP
6
configurations in-plane dimensions are kept constant as the ply block thickness is increased).
The effect of the temperature and thickness-to-width ratio is shown in Figure 4. The
experiments revealed that both prepreg systems have a certain compaction limit (i.e. the
thickness at which further compaction is minor and only possible at loads much greater than
available in conventional manufacturing). Differences in toughening strategies translated into
a difference in the compaction limits, with IMA/M21 having a thicker compaction limit than
the IM7/8552 system, in other words IMA/M21 system is less compactable. The observations
showed that the thermoplastic interlayer in IMA/M21 was effectively separating the plies of
the same orientation and to some extent preventing them from merging as shown in Figure 5.
The test matrix for the experiments along with the detailed discussion of the experimental
findings can be found in the original paper by Nixon-Pearson et al. [14].
2.2. A brief description of the material model
The experimental program briefly summarized in the previous section highlighted the
following properties for toughened prepreg under processing conditions:
the presence of strong size effects, similar to those observed in thermoplastic-based
systems [20-22], with wide and thick prepreg pieces being a lot more compressible than
thin and wide tapes;
the existence of a compaction limit where further evolution of thickness is hardly possible
at further increase of temperature and pressure. This is similar to what is normally observed
in thermoset-based prepreg [23];
the co-existence of squeezing and bleeding flows as already observed by Hubert and
Poursatip [5].
From a modelling perspective being able to take account of squeezing and bleeding flow
simultaneously is challenging. Traditionally, squeezing flow theories are based on the
assumption that the apparent viscosity of the system made of the resin and the fibres can be
7
multiplicatively decomposed into a strain dependent (i.e. elastic) term and a strain rate (i.e.
viscous) dependent term. On the other hand, Darcy’s law, which is usually used to describe
bleeding flow, uses an additive decomposition of the same terms. The incompatibility between
the two assumptions makes it difficult to build a theory where the two types of flow coexist.
However, studying the viscoelastic response of short fibres impregnated with low viscosity
resins, Kelly [24] suggested that bleeding flow could also be modelled using a multiplicative
superposition of an elastic and a viscous term. Recently, Belnoue et al. [8] have seen this as an
opportunity to build a model for toughened prepreg under processing conditions which can
capture the effects of both squeezing and bleeding flow. This section provides a brief summary
of the main equations and assumptions made in the model used throughout this paper. A full
description of the model can be found in Belnoue et al. [8] where all the equations and
underlying assumptions are explained at length.
Belnoue et al.’s [8] framework is based on the multiplicative decomposition of the
apparent viscosity of the prepreg tape (𝜂𝑎𝑝𝑝), into a strain and a strain-rate dependent term
called 𝜂𝑠𝑡𝑟𝑎𝑖𝑛 and 𝜂𝑟𝑎𝑡𝑒 respectively:
𝜎 = 𝜂𝑎𝑝𝑝(𝜀, 𝜀̇)𝜀̇ = 𝜂𝑠𝑡𝑟𝑎𝑖𝑛(𝜀)𝜂𝑟𝑎𝑡𝑒(𝜀̇)𝜀̇ , (1)
In eqn. (1), 𝜎 is the Cauchy stress, 𝜀 = ln (ℎ ℎ0)⁄ is the Hencky measure of strain and 𝜀̇ = ℎ̇ ℎ⁄
is the strain rate with ℎ0 and ℎ being respectively the initial and current thickness of the prepreg
piece under consideration. In order to have the ability to capture potential shear thinning (as
observed in [13]) or shear thickening effects, the strain-rate dependent term is assumed to
follow a power-law [21, 22, 25] and is defined as:
𝜂𝑟𝑎𝑡𝑒(𝜀̇) = 𝑒�̅�(−𝜀̇)𝑎 , (2)
where 𝑎 and �̅� are material parameters, which can be derived from the set of compaction
experiments described in the previous section. These parameters describe the viscosity of the
resin present in the system.
8
It is then assumed that at low temperature and low pressure, the system follows
squeezing flow theories (this ensures that the size effects observed experimentally are captured
properly). The existence of locking, which has been mentioned in the past by a number of
researchers, is postulated. Upon locking, the fibre bed reaches a configuration that is such that
it cannot deform in-plane (transverse to the fibres and transverse to the loading direction). This
marks the point in time when the flow mechanism switches from squeezing to bleeding. To
ensure a smooth transition between the two mechanisms and to ease the convergence of the
numerical solution, bleeding was mathematically represented as squeezing along the fibres (i.e.
Stokes flow at the micro-scale was assumed).
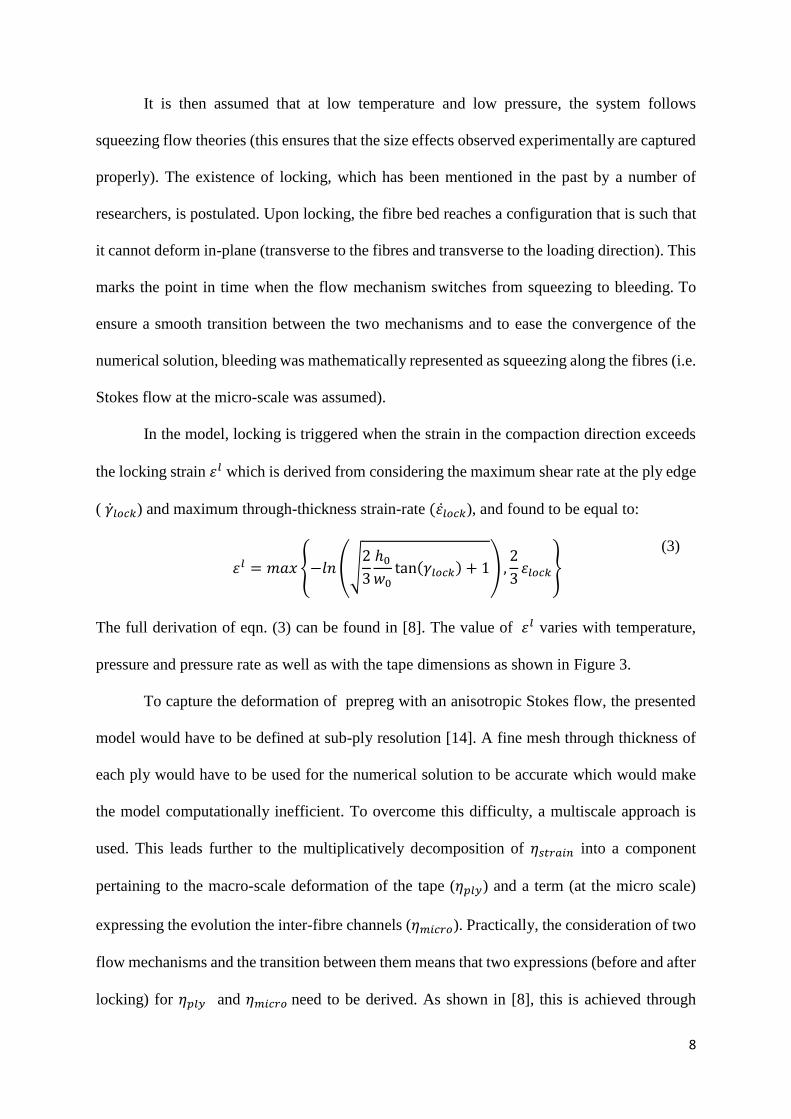
In the model, locking is triggered when the strain in the compaction direction exceeds
the locking strain 𝜀𝑙 which is derived from considering the maximum shear rate at the ply edge
( �̇�𝑙𝑜𝑐𝑘) and maximum through-thickness strain-rate (𝜀�̇�𝑜𝑐𝑘), and found to be equal to:
𝜀𝑙 = 𝑚𝑎𝑥 {−𝑙𝑛 (√2
3
ℎ0
𝑤0tan(𝛾𝑙𝑜𝑐𝑘) + 1) ,
2
3𝜀𝑙𝑜𝑐𝑘}
(3)
The full derivation of eqn. (3) can be found in [8]. The value of 𝜀𝑙 varies with temperature,
pressure and pressure rate as well as with the tape dimensions as shown in Figure 3.
To capture the deformation of prepreg with an anisotropic Stokes flow, the presented
model would have to be defined at sub-ply resolution [14]. A fine mesh through thickness of
each ply would have to be used for the numerical solution to be accurate which would make
the model computationally inefficient. To overcome this difficulty, a multiscale approach is
used. This leads further to the multiplicatively decomposition of 𝜂𝑠𝑡𝑟𝑎𝑖𝑛 into a component
pertaining to the macro-scale deformation of the tape (𝜂𝑝𝑙𝑦) and a term (at the micro scale)
expressing the evolution the inter-fibre channels (𝜂𝑚𝑖𝑐𝑟𝑜). Practically, the consideration of two
flow mechanisms and the transition between them means that two expressions (before and after
locking) for 𝜂𝑝𝑙𝑦 and 𝜂𝑚𝑖𝑐𝑟𝑜 need to be derived. As shown in [8], this is achieved through
9
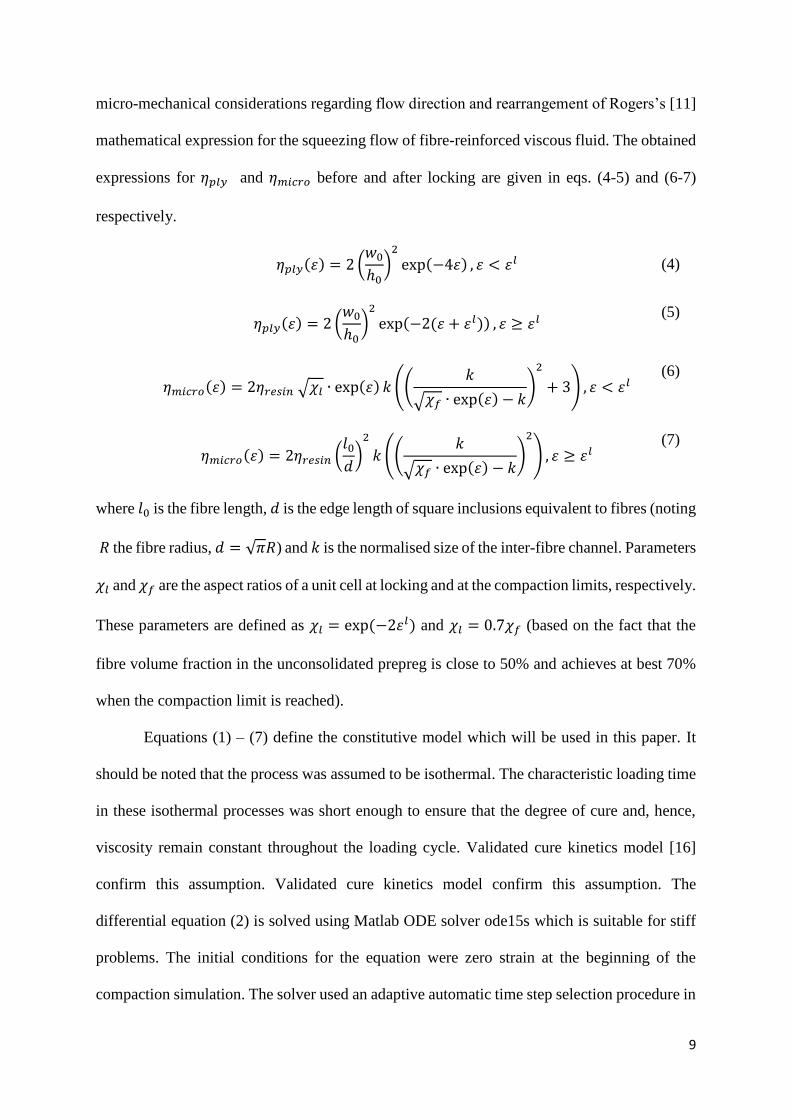
micro-mechanical considerations regarding flow direction and rearrangement of Rogers’s [11]
mathematical expression for the squeezing flow of fibre-reinforced viscous fluid. The obtained
expressions for 𝜂𝑝𝑙𝑦 and 𝜂𝑚𝑖𝑐𝑟𝑜 before and after locking are given in eqs. (4-5) and (6-7)
respectively.
𝜂𝑝𝑙𝑦(𝜀) = 2 (𝑤0
ℎ0)
2
exp(−4𝜀) , 𝜀 < 𝜀𝑙 (4)
𝜂𝑝𝑙𝑦(𝜀) = 2 (
𝑤0
ℎ0)
2
exp(−2(𝜀 + 𝜀𝑙)) , 𝜀 ≥ 𝜀𝑙 (5)
𝜂𝑚𝑖𝑐𝑟𝑜(𝜀) = 2𝜂𝑟𝑒𝑠𝑖𝑛 √𝜒𝑙 ∙ exp(𝜀) 𝑘 ((
𝑘
√𝜒𝑓 ∙ exp(𝜀) − 𝑘)
2
+ 3) , 𝜀 < 𝜀𝑙 (6)
𝜂𝑚𝑖𝑐𝑟𝑜(𝜀) = 2𝜂𝑟𝑒𝑠𝑖𝑛 (
𝑙0
𝑑)
2
𝑘 ((𝑘
√𝜒𝑓 ∙ exp(𝜀) − 𝑘)
2
) , 𝜀 ≥ 𝜀𝑙 (7)
where 𝑙0 is the fibre length, 𝑑 is the edge length of square inclusions equivalent to fibres (noting
𝑅 the fibre radius, 𝑑 = √𝜋𝑅) and 𝑘 is the normalised size of the inter-fibre channel. Parameters
𝜒𝑙 and 𝜒𝑓 are the aspect ratios of a unit cell at locking and at the compaction limits, respectively.
These parameters are defined as 𝜒𝑙 = exp (−2𝜀𝑙) and 𝜒𝑙 = 0.7𝜒𝑓 (based on the fact that the
fibre volume fraction in the unconsolidated prepreg is close to 50% and achieves at best 70%
when the compaction limit is reached).
Equations (1) – (7) define the constitutive model which will be used in this paper. It
should be noted that the process was assumed to be isothermal. The characteristic loading time
in these isothermal processes was short enough to ensure that the degree of cure and, hence,
viscosity remain constant throughout the loading cycle. Validated cure kinetics model [16]
confirm this assumption. Validated cure kinetics model confirm this assumption. The
differential equation (2) is solved using Matlab ODE solver ode15s which is suitable for stiff
problems. The initial conditions for the equation were zero strain at the beginning of the
compaction simulation. The solver used an adaptive automatic time step selection procedure in
10
order to achieve the set tolerance of 10-6. A further investigation of the time step selection
showed that using a maximum time step of 0.1 s gives the results within 0.1% of the results
obtained with the automatic time stepping but requires a much longer solution time. The model
has only seven input variables: two material parameters 𝑎 and �̅�, parameter 𝑘 which controls
the fibre volume fraction, the fibre radius 𝑅, and three geometric parameters, namely initial ply
width, 𝑤0, fibre length, 𝑙0, and ply thickness, ℎ0. Values of parameter �̅� in squeezing and
bleeding flow are denoted as 𝑏𝑠𝑞𝑢𝑒𝑒𝑧𝑖𝑛𝑔 and 𝑏𝑏𝑙𝑒𝑒𝑑𝑖𝑛𝑔. As demonstrated by Belnoue et al. [8],
three parameters, 𝑎, �̅� and 𝑘, can be extracted from the compaction experiments by fitting the
present model to the compaction curves. For the two material systems considered here, these
parameters were extracted using CP data only and validated against compaction curves for BP
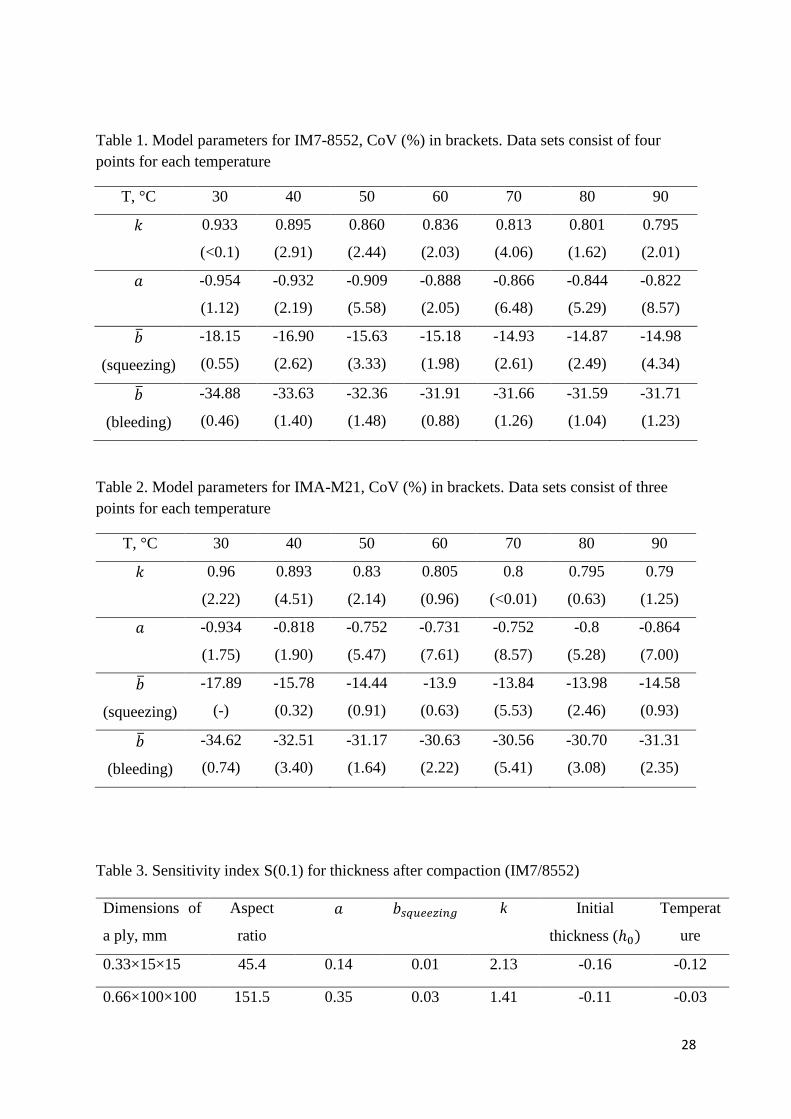
specimens [8]. The obtained values are given in Table 1 and 2 respectively. Results of several
compaction tests were analysed to obtain variability of the parameters, which was described in
terms of coefficient of variation (CoV), equal to ratio of standard deviation and mean value.
Confidence intervals for the parameters can be calculated using this information and Student’s
t-distribution.
It was assumed that a further increase in temperature does not lead to the evolution of the
parameters and they remain to be equal to the parameter values at 90°C. The values of the
parameters for arbitrary temperatures were found by linear interpolation between available data
points. The interpolation was coded in Matlab and the model parameters were treated as
continuous functions of temperature. The compaction limit for laminates with an aspect ratio
larger than 600 was set to 4% which corresponds to amount of voids observed in the prepregs
in the least compacted state [26]. The degree of cure was assumed to be negligible during the
consolidation stage.
3. Parametric study
3.1. Parametric study of the material model
11
The model described in the previous section was implemented in Matlab as the numerical
solution of an ordinary differential equation and used to assess the effect of model parameter
variations. This made it possible to rank these parameters by their importance and to reduce
the number of parameters used in the Monte Carlo analysis performed later in this paper.
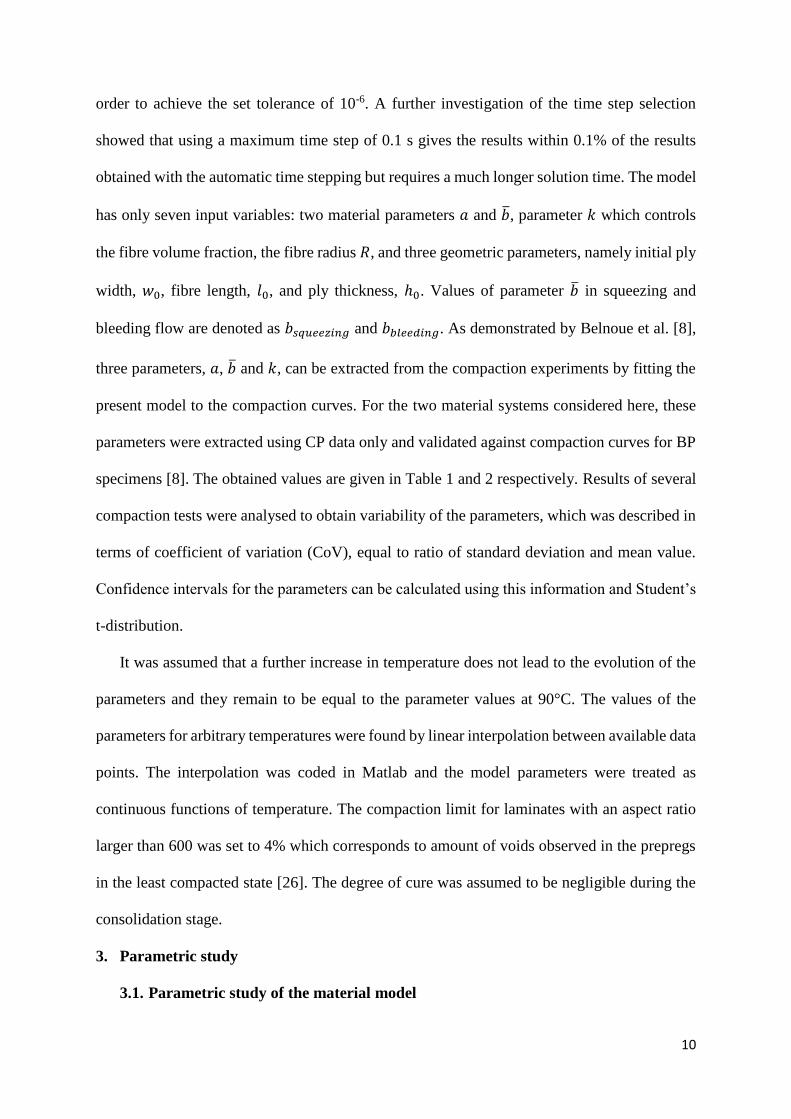
Parametric studies are carried out by varying one parameter at a time. The sensitivity index
was calculated as follows:
𝑆(𝑝, ∆𝑝) =
ℎ(𝑝 + ∆𝑝) − ℎ(𝑝 − ∆𝑝)
ℎ0∙
𝑝
(𝑝 + ∆𝑝 − (𝑝 − ∆𝑝))
=ℎ(𝑝 + ∆𝑝) − ℎ(𝑝 − ∆𝑝)
2(∆𝑝/𝑝)ℎ0
(8)
where 𝑝 is the parameter which is varied, ℎ(𝑝) is the thicknesses after compaction with
parameter value 𝑝.
The parametric studies were run for two different parameter variations – small, with
10% of the nominal value of a parameter, and large, with 50% variation. The baseline
parameters and processing conditions were set to IM7/8552 at 70°C with pressure increase
applied linearly from 0 bar to 7 bar over 1,000 s followed by a hold stage of 10,000 s. The
sensitivity indices for small variations of material parameters are reported in Table 3. A positive
sensitivity index means that the final thickness increases with an increase in the absolute value
of a parameter. A negative value corresponds to a decrease in thickness. The effects of three of
the parameters, namely fibre radius R, fibre length L and viscosity parameter 𝑏𝑏𝑙𝑒𝑒𝑑𝑖𝑛𝑔, are
negligible on consolidation of prepreg plies of any aspect ratios and are not given in the Table
3. The other parameters show significant effects on the consolidation with the parameter k
having the highest impact for most of the cases. The aspect ratio of the plies, i.e. their width to
thickness ratio, has a significant effect on the final thickness after compaction since squeezing
flow is less important and such plies have very low compaction limit (4%). For plies with a
12
large aspect ratio, the viscosity parameter has a greater effect on the final thickness while
temperature exhibits the opposite trend.
The sensitivity indices for large variations of geometric and processing parameters are
given in Table 4. The baseline parameters and processing conditions were the same as above.
It can be seen that change of the ramp rate and dwell time within 50% does not have a
significant effect on the thickness after compaction. The dwell time and ramp time becomes
significant only when they vary more than 10 times. The effect of pressure increases with the
increase of aspect ratio while the effect of temperature declines. The effect of the pressure is
also relatively low owing to the long duration of the dwell stage at which the material is already
compacted to some intermediate limit.
Three parameters, namely, fibre radius, R, fibre length, 𝑙0, and viscosity parameter
𝑏𝑏𝑙𝑒𝑒𝑑𝑖𝑛𝑔, are excluded from the further analysis. The other model parameters remain relevant
for the rest of the paper. The material parameters for IMA/M21 do not differ significantly and
the sensitivity of the model for this prepreg is similar.
4. Variability modelling of simple layups
4.1. Variability of the model parameters
The mean values and CoVs provided in Table 1 and 2 were obtained using small sets
of data. Therefore, a distribution fitted to these data had low statistical significance.
Nevertheless, in the absence of additional data it was assumed that the parameters can be
described by a normal distribution. CoVs across all the available data points for all the
temperatures were averaged and given in Table 5.
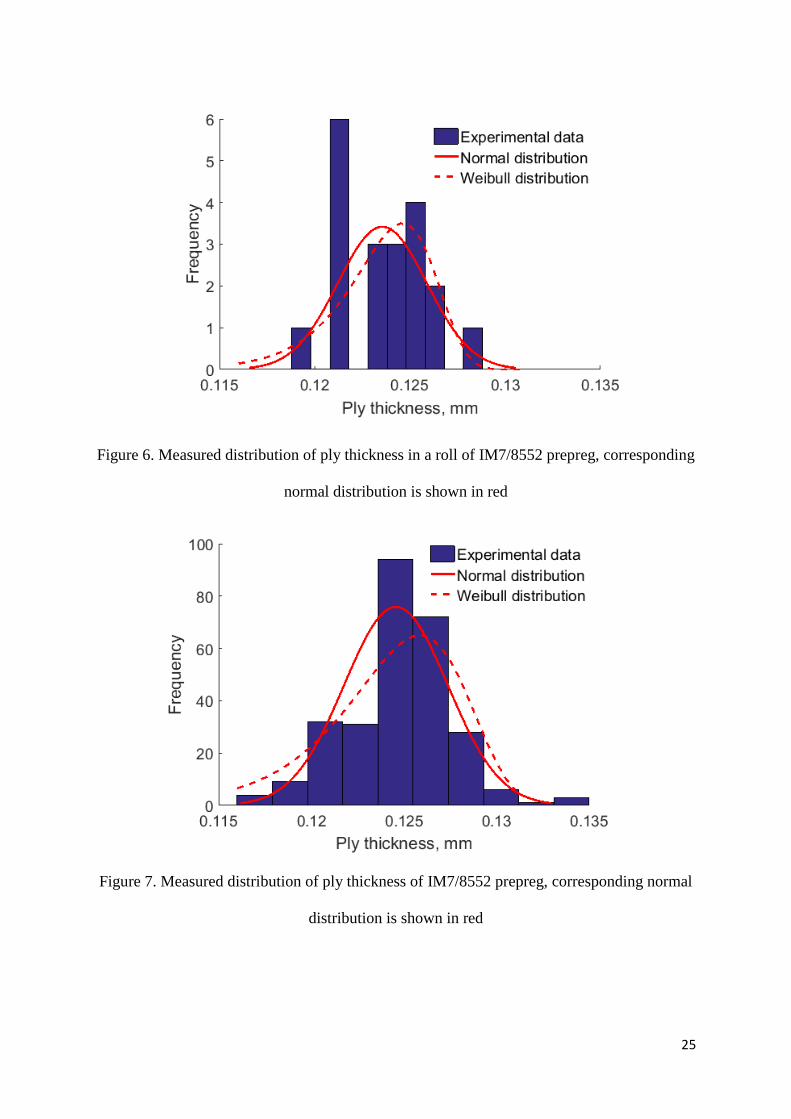
The data on the cured ply thickness of IM7/8552 prepregs were provided by the pre-
preg manufacturer (Hexcel) and BAE Systems [27]. The cured ply thickness was measured for
each roll of prepreg using 20 samples (280 measurements in total). Distributions of thickness
from individual rolls were close to the normal distribution (Kolmogorov-Smirnov test and Chi-
13
Squared goodness of fit test [28] did not reject the null hypothesis) as shown in Figure 6.
Student’s t-test could not reject the hypothesis that each of the mean values of the thickness in
a roll come from the same normal distribution. Therefore it will be assumed that the thickness
of a ply can be described by a single normal distribution with a mean of 0.125 mm and standard
deviation of 2.8×10⁻³ mm (CoV = 2.2%). The distribution of the ply thicknesses for all the
measured samples is given in Figure 7. Weibull distributions have also been fitted to the
experimental data in order to investigate applicability of alternative distributions. It can be
argued that the Weibull distributions capture slight asymmetry of the histogram of the
experimental data but at the same time the right-tail of the Weibull distribution does not match
the experimental data well and might lead to unrealistically low predictions of the ply thickness.
Since all the parameters depend on the process temperature, then for each random
temperature the mean values of the material parameters were interpolated using the data given
in Table 1 and 2. However, variability of the material parameters was assumed to be
independent from the variability of temperature. It was found in this study that the experimental
data show that the viscosity parameters 𝑎 and 𝑏𝑠𝑞𝑢𝑒𝑒𝑧𝑖𝑛𝑔 are positively correlated. Parameter
𝑏𝑠𝑞𝑢𝑒𝑒𝑧𝑖𝑛𝑔 was simulated as a dependent variable of 𝑎 with correlation coefficient of 0.95. All
other material parameters were assumed to be independent of each other. The process
parameters, namely ramp time, dwell time, pressure and temperature, were assumed to be
distributed normally and to have a CoV of 10%.
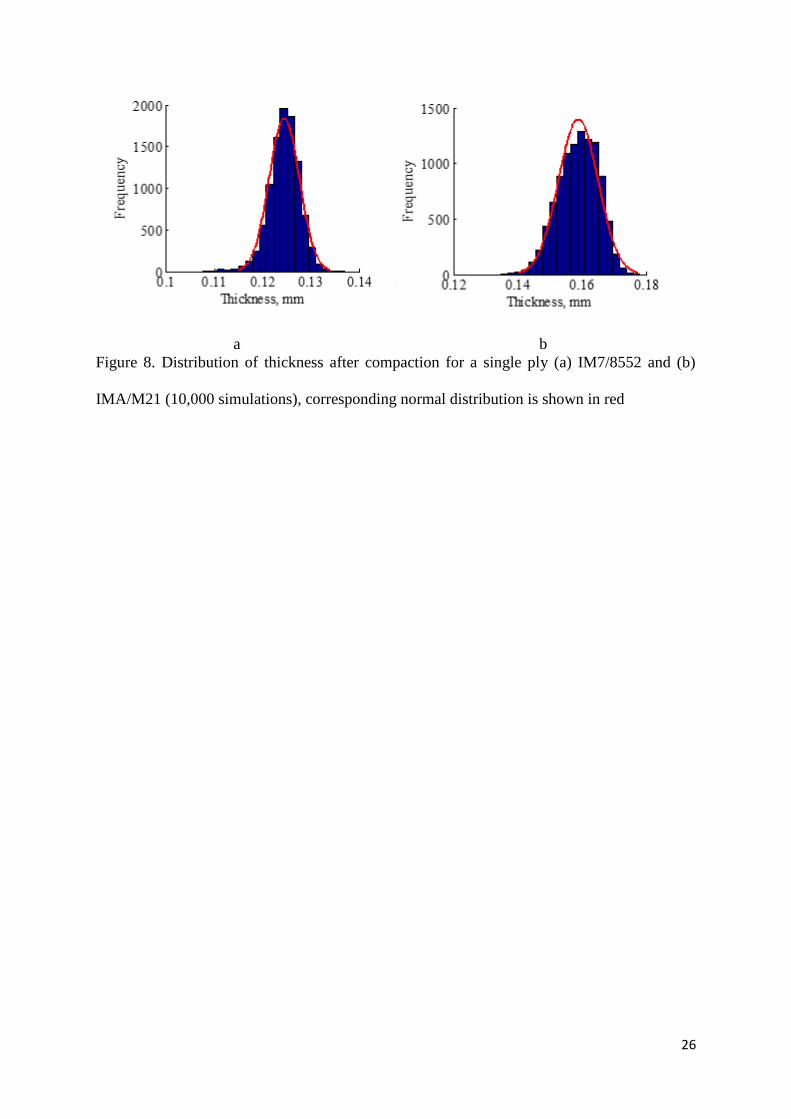
The Monte Carlo method was employed for the consolidation model with parameters
given in Table 1 and 5. The baseline parameters were selected for one ply of IM7/8552 with
dimensions of 100×100 mm at 70°C, with pressure increased linearly from 0 to 7 bar over
1,000 s followed by a 10,000 s holding stage. The distribution of the thickness of an individual
ply with random properties is given in Figure 8. The mean value of the thickness after
compaction was found to be just 1% lower than the mean value of initial thickness. It shows
14
that a single ply with large in-plane dimensions does not deform significantly. However, the
distribution of the thickness does not follow a normal distribution assumed for initial thickness
and is skewed towards the higher values. The CoV of the distribution was found to be 3.2%
which is slightly higher than the variability of initial thickness of single ply. It is worth
mentioning that with no variability in temperature the thickness variability has CoV of 2.9%.
Assuming the same baseline processing parameters for IMA/M21 prepreg system, the
thickness variability was obtained. It was found that the thickness variability is higher than for
IM7/8552 system and its CoV is equal to 4.6%. The higher CoV is related to the higher aspect
ratio of IMA/M21 plies and hence ability to accommodate higher levels of compaction. In
addition, the thickness distribution for IMA/M21 is slightly skewed towards higher values.
4.2. Compaction modelling of various layups
An arbitrary layup can be modelled with the presented model, accounting for any
number of layers and their arrangement. The case studies presented below highlight the effect
of the stacking sequence on the variability of the thickness of thick laminates. The variability
was incorporated into the model by assigning random properties to every layer, assuming that
they are independent from each other. This assumption of independence for the ply thickness
is based on the experimental observations of the ply thickness within a batch and between
batches. Although the assumption of independence of other properties is based on a small data
set, it is impossible at present to draw any other assumptions without a further investigation.
In a model with no variability the layers of the same orientation blocked together are
assumed to behave as a single layer of a larger thickness i.e. with a larger aspect ratio. In a
model with variability the blocked layers cannot be viewed as a single layer because of their
different material properties and possibly variable orientation. However, it is assumed that the
size effect still plays the same role and can be represented by assigning higher aspect ratio to
the blocked plies keeping other parameters random in every other layer.
15
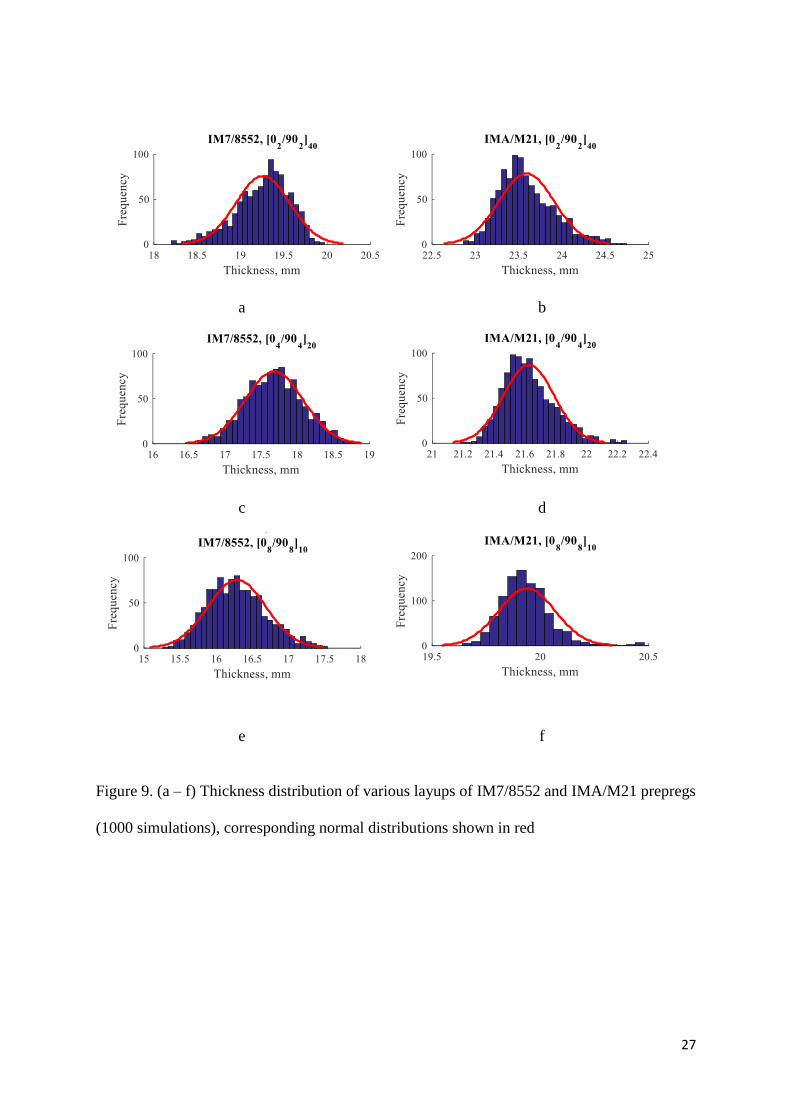
The numerical studies were performed on three IM7/8552 layups – [0°2/90°2]40,
[0°4/90°4]20 and [0°8/90°8]10. The processing conditions were identical for all the layups:
temperature 70 °C and pressure linearly increased from 0 to 7 bar over 1,000 s followed by a
holding stage of 10,000 s. All the layers are assumed to have equal temperature and the process
is assumed to be isothermal. The Monte Carlo method as described above was applied to the
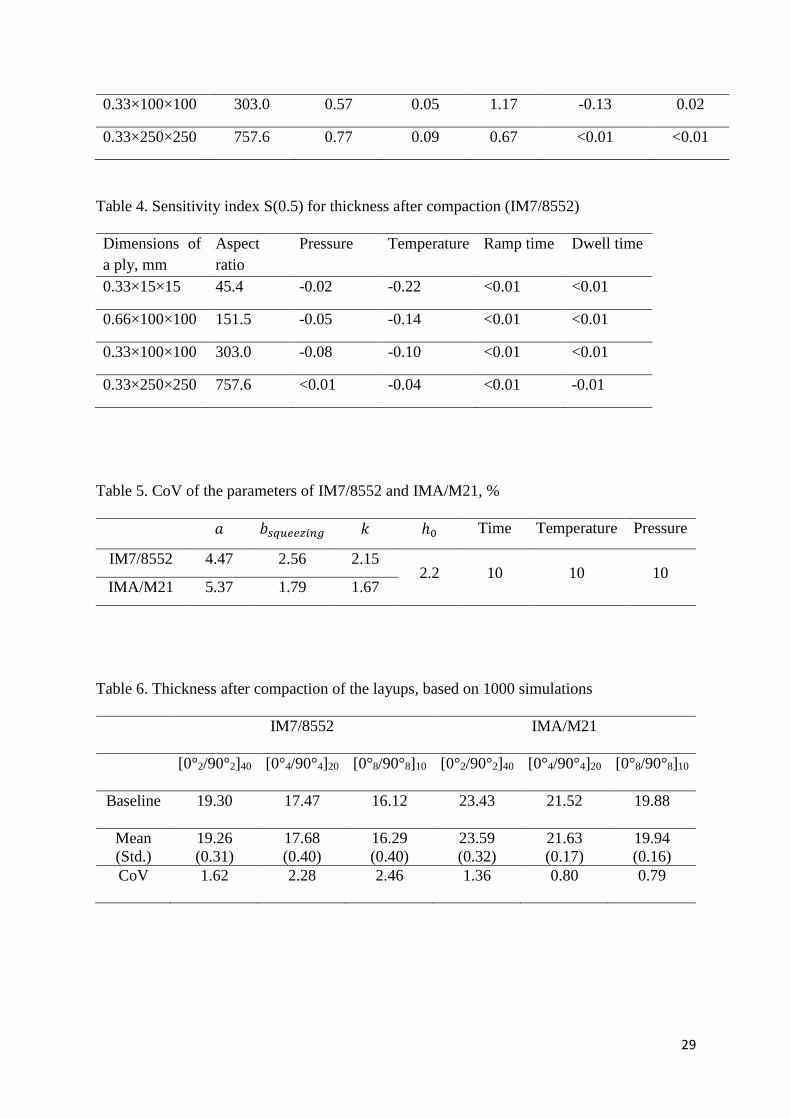
models of the layup. The results of the modelling are given in Table 6. It can be seen that the
variability of the cross-ply laminate with no blocked plies is the lowest due to the lowest size
effect. The variability increases with increasing number of blocked plies as a result of the size
effect combined with variability of properties. The distribution of thickness after compaction
of these thick prepreg layups is shown in Figure 9. It can be seen that an increase in the number
of blocked plies results in a transition from a right-skewed to a left-skewed distribution. It can
be noted that the distribution with fewer blocked plies is similar to distribution for single plies.
The same case studies with the same baseline processing parameters were performed
for the IMA/M21 prepreg system. The results of the modelling are given in Table 6. Despite
the parameters of both prepreg systems being quite similar, the variability of both systems is
very different. First of all, the overall thickness CoV was 1.5-3.5 times lower than for the
IM7/8552 system for all the presented cases. More important, thickness variability does not
increase with an increase in the number of blocked plies. This behaviour corresponds to
experimental observations, which proved that size effect is less important in the IMA/M21
prepreg system. The less pronounced size effect was then explained by the toughening strategy
of the IMA/M21 system where the toughening particles prevent the plies merging together to
some extent. In turn, this translates to the model for which the aspect ratio of the layers is less
important. The second reason for the lower effect of blocked plies was the shape of distribution
of the single ply thickness. Since the distribution for IMA/M21 is close to normal then the
distribution of the total thickness haa properties of a sum of normal distributions, for which the
16
variability decreases with the number of terms. In contrast, the distribution for IM7/8552 has a
distinctive tail which would result in skewing the total thickness distribution, leading to a larger
CoV.
4.3. Compaction modelling under various processing conditions
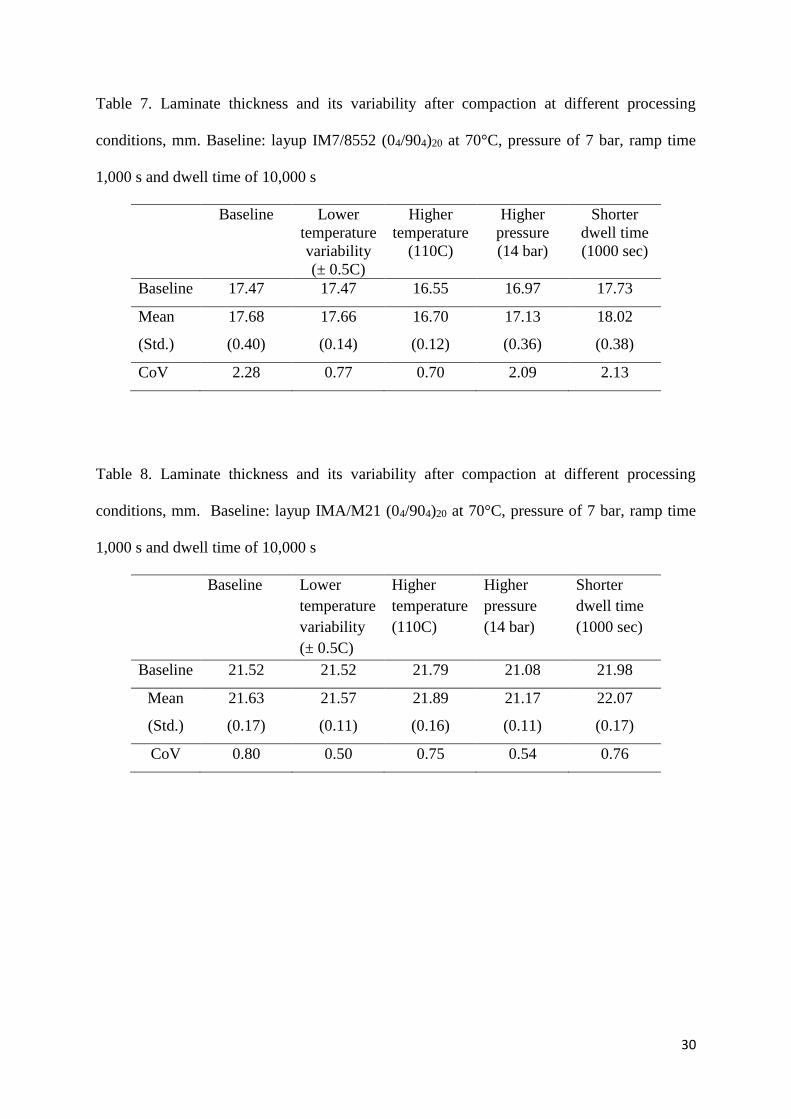
Finally, several processing conditions are modelled in this section in order to investigate
their effect on the variability of thickness after compaction. An IM7/8552 laminate with a
[0°4/90°4]20 layup from the previous section was considered as a baseline and processing
parameters were changed one by one. The variability of the parameters had the same relative
values as in the previous sections. Four additional regimes were modelled: lower temperature
variability (±0.5 °C), higher temperature (110 C), higher pressure (14 bar) and shorter dwell
time (1,000 sec).
The Monte Carlo method was applied to study the variability in the selected cases and
the results are given in Tables 7 and 8. Results for IM7/8552 and IMA/M21 showed a very
similar response to the changes in processing parameters. It was found that the processing
conditions that result in higher compaction tend to lead to lower variability in the thickness. It
can be explained as follows: higher levels of compaction mean that more plies reached their
compaction limit, which depends on fewer variables, while an intermediate compaction stage
depends on a larger set of parameters. Very low variability predicted for the case of high
temperature is due to the assumption of the material parameters being independent of
temperature when it is higher than 90C.
5. Discussion
The case studies used in this paper represent the simplest geometries of flat thick prepreg
layups. Therefore, consolidation of these layups does not result in any changes of the geometry
except thickness reduction, which makes the thickness after compaction the main parameter to
study. The parametric studies showed that the parameter related to the fibre volume fraction
17
has the highest impact on the thickness after compaction for plies with low aspect ratio (width
to thickness ratio below ≈ 500 i.e. feature size larger than 60 mm for an individual ply). The
second most important parameter of the model is the apparent viscosity, the effect of which
increases with an increase in the aspect ratio. An increase in either of these parameters (i.e.
having a higher initial fibre volume fraction or more viscous prepreg) results in lower
compaction levels. Among other parameters, the processing temperature has the greatest effect,
resulting in higher compaction for higher temperature values. Finally, the higher initial
thickness also results in higher compaction levels, which represents the size effect. These
simple observations agree well with an understanding of the physics of prepreg compaction
and are confirmed by experimental observations. In particular, the plies with high fibre volume
fraction (or low initial thickness) have a thicker compaction limit i.e. reach full compaction
earlier.
The Monte Carlo method was used to study the stochastic effect of the parameters’
distributions on the thickness after compaction. In the absence of large experimental data sets,
all the parameters were assumed to follow normal distributions with mean and standard
deviations measured experimentally. It was found that IM7/8552 has a higher CoV than
IMA/M21.
The difference between the two prepreg systems becomes more apparent when a thick
laminate is considered. Several case studies were performed to illustrate the effect of the layup
and processing parameters. Using the Monte Carlo simulations and assuming that each of the
laminates is compacted under isothermal conditions, laminates with various number of blocked
plies were modelled. These simulations showed that the IM7/8552 prepreg system exhibits a
notable size effect. Not only did the final thickness of the laminate decrease with an increase
in the number of blocked plies, but also the variability of the thickness increased. The former
effect is in line with the experiments, which indicated that blocked plies of IM7/8552 prepreg
18
tend to behave like a single ply and hence compact more, because of the higher thickness-to-
width ratio. The higher aspect ratio and asymmetric distribution of a single ply thickness
resulted in a higher scatter of the thicknesses of individual plies and consequently higher
variability of the laminate thickness. The IMA/M21 system exhibited similar trends in terms
of the overall thickness due to the size effect. However, predicted variability of the thickness
of IMA/M21 laminates was up to 3.5 times lower than for the IM7/8552 system. The difference
between the systems is twofold: toughening strategy and behaviour of a single ply under
compaction. The difference between toughening strategies (see above), governs the behaviour
of blocked plies as was observed in experiments [14]. In particular, the layer of toughening
particles in the IMA/M21 system lowered the size effect of blocked plies by effectively
preventing merging of the plies. At the same time, simulations on a single ply model showed
that thickness can be described by a normal distribution in case of IMA/M21 system, resulting
in lower variability of laminate thickness as the result of a ply thickness distribution with no
extreme values. It should be noted that the amount of data used to derive the CoV of the
material parameters is not significant enough to select the type of distribution reliably and so
the choice of the normal distribution is only a first approximation for the data. However, the
CoV of the material parameters was found to be relatively small and therefore the intervals of
the thickness variations (or the maximum and minimum of the obtained thickness distributions)
found in this paper will be still applicable to data that might follow some other distribution. It
thus makes the comparison between the materials and load cases applicable to a wider range
of distributions.
The compaction model made it possible to study the effect of processing parameters on the
variability of the final thickness. The case study on a selected layup showed that generally
increase of compaction pressure also leads to a decrease in variability. This decrease is due to
the plies reaching or approaching the compaction limit, which is a function of the ply geometry
19
and fibre volume fraction only. Therefore, the variability of other properties becomes
insignificant when the plies finally reach their compaction limit. Two other efficient ways of
reducing the thickness variability of thick laminates both rely on temperature control. It has
been found that the behaviour of both prepreg systems remains unchanged with increase of
temperature above 90 °C. On the other hand, elevated temperature can be undesirable because
of excessively fast curing leading to temperature overshoot during the curing. The second
option for temperature control suggests that decreasing the temperature variability can greatly
decrease variability of the thickness. However, this option needs further investigations and non-
isothermal modelling of the compaction. These findings outline the possible strategies for
reducing the variability of laminate thickness after compaction.
Further effort should focus on considering uncertainties related to the curing process and
including them into a coupled cure-compaction model. Such model would then be able to offer
additional insights into the ways to control the manufacturing processes.
6. Conclusions
The realistic compaction model proposed by Belnoue et al. [8] was used for the first time
in the analysis of variability in the consolidation of thick laminates made from two toughened
prepreg systems. The difference between the systems, captured by the experiments on smaller
specimens, manifested itself in a difference in the compaction modelling of thick laminates. It
was found that the toughening mechanism in IMA/M21 reduce the size effect when the plies
are blocked together and, as a result, reduces the variability for certain lay-up configurations.
It is envisaged that the size effect will play a significant role in consolidation of AFP layups
where the narrow tapes have a higher thickness to width aspect ratio.
The case study of various processing conditions provided novel results regarding the effects
of processing parameters on consolidation and their significance for manufacturing
highlighting some possible strategies to reduce the variability by design of the lay-up and the
20
process. For the IM7/8552 system, which showed a stronger size effect, one such strategy can
be to design a lay-up with fewer blocked plies or thinner plies. The strategy common for both
systems is to ensure the maximum level of compaction by applying a higher pressure for a
longer time at a high temperature. While some of these changes can be impractical due to the
process or design limitations, the reduction of temperature variability can be another option.
Study of IMA/M21 system showed that an informed choice of the toughening mechanism can
also be used to aid management of variability and in robust design for manufacture of
composite structures.
Acknowledgements
This work was supported by the Engineering Physics and Science Research Council Centre for
Innovative Manufacturing of Composites project “Defect Generation Mechanism in Thick and
Variable Thickness Composite Parts – Understanding, Predicting and Mitigation (DefGen)”
[grant EP/I033513/1]. The research data and Matlab code for the compaction simulation are
available at https://data.bris.ac.uk/data/dataset/jsxvn0aq2hgt2afxuk17633t0. Authors would
like to thank Brett Hemingway (BAE Systems) and Luke Harris (Hexcel) for technical
discussions and provided data.
References
1. Long, A.C., Composites Forming Technologies. 2014: Elsevier Science. 2. Rudd, C.D., et al., Liquid Moulding Technologies: Resin Transfer Moulding, Structural Reaction
Injection Moulding, and Related Processing Techniques. 1997: Society of Automotive Engineers.
3. Belnoue, J.P.-H., et al., Predicting wrinkle formation in components manufactured from toughened UD prepregs, in 17th European Conference on Composite Materials (ECCM-17). 2016: Munich, Germany.
4. Li, M. and C.L. Tucker, Modeling and simulation of two-dimensional consolidation for thermoset matrix composites. Composites Part a-Applied Science and Manufacturing, 2002. 33(6): p. 877-892.
5. Hubert, P. and A. Poursartip, Aspects of the compaction of composite angle laminates: An experimental investigation. Journal of Composite Materials, 2001. 35(1): p. 2-26.
6. Li, Y.X., et al., Numerical and Experimental Study on the Effect of Lay-Up Type and Structural Elements on Thickness Uniformity of L-Shaped Laminates. Applied Composite Materials, 2009. 16(2): p. 101-115.
7. Potter, K. Understanding the origins of defects and variability in composites manufacture. in 17th International Conference on Composite Materials. 2009. Edinburgh, UK.
21
8. Belnoue, J.P.H., et al., A novel hyper-viscoelastic model for consolidation of toughened prepregs under processing conditions. Mechanics of Materials, 2016. 97: p. 118-134.
9. Hubert, P. and A. Poursartip, A review of flow and compaction modelling relevant to thermoset matrix laminate processing. Journal of Reinforced Plastics and Composites, 1998. 17(4): p. 286-318.
10. Engmann, J., C. Servais, and A.S. Burbidge, Squeeze flow theory and applications to rheometry: A review. Journal of Non-Newtonian Fluid Mechanics, 2005. 132(1-3): p. 1-27.
11. Rogers, T.G., Squeezing Flow of Fiber-Reinforced Viscous Fluids. Journal of Engineering Mathematics, 1989. 23(1): p. 81-89.
12. Gutowski, T.G., T. Morigaki, and Z. Cai, The Consolidation of Laminate Composites. Journal of Composite Materials, 1987. 21(2): p. 172-188.
13. Ivanov, D., et al., Transitional behaviour of prepregs in automated fibre deposition processes, in 19th International Conference on Composite Materials. 2013: Montreal, Canada.
14. Nixon-Pearson, O., et al., An experimental investigation of the consolidation behaviour of uncured prepregs under processing conditions. Journal of Composite Materials, 2016.
15. Centea, T. and P. Hubert, Out-of-autoclave prepreg consolidation under deficient pressure conditions. Journal of Composite Materials, 2014. 48(16): p. 2033-2045.
16. Belnoue, J.P.H., et al., Understanding and predicting defect formation in automated fibre placement pre-preg laminates. Composites Part A: Applied Science and Manufacturing, 2017. 102: p. 196-206.
17. Belnoue, J.P.H., et al., Consolidation-Driven Defect Generation in Thick Composite Parts. Journal of Manufacturing Science and Engineering, 2018. 140(7): p. 071006-071006-15.
18. Mesogitis, T.S., A.A. Skordos, and A.C. Long, Uncertainty in the manufacturing of fibrous thermosetting composites: A review. Composites Part a-Applied Science and Manufacturing, 2014. 57: p. 67-75.
19. Zhang, S., et al., Effect of ply level thickness uncertainty on reliability of laminated composite panels. Journal of Reinforced Plastics and Composites, 2016. 35(19): p. 1387-1400.
20. Servais, C., A. Luciani, and J.A.E. Manson, Squeeze flow of concentrated long fibre suspensions: experiments and model. Journal of Non-Newtonian Fluid Mechanics, 2002. 104(2-3): p. 165-184.
21. Shuler, S.F. and S.G. Advani, Transverse squeeze flow of concentrated aligned fibers in viscous fluids. Journal of Non-Newtonian Fluid Mechanics, 1996. 65(1): p. 47-74.
22. Pipes, R.B., Anisotropic Viscosities of an Oriented Fiber Composite with a Power-Law Matrix. Journal of Composite Materials, 1992. 26(10): p. 1536-1552.
23. Gutowski, T.G., et al., Consolidation Experiments for Laminate Composites. Journal of Composite Materials, 1987. 21(7): p. 650-669.
24. Kelly, P.A., A viscoelastic model for the compaction of fibrous materials. Journal of the Textile Institute, 2011. 102(8): p. 689-699.
25. Wang, E.L. and T.G. Gutowski, Laps and gaps in thermoplastic composites processing. Composites Manufacturing, 1991. 2(2): p. 69-78.
26. Nixon-Pearson, O.J., et al., The compaction behaviour of un-cured prepregs, in 20th International Conference on Composite Materials. 2015: Copenhagen.
27. Hemingway, B. and L. Harriss, Personal communication, 20-06-2016. 28. Hayter, A., Probability and Statistics for Engineers and Scientists. 2012: Cengage Learning.
22
Figure 1. Micrographs of the taper and thin section of the baseline configuration
23
Figure 2. Micrographs of the taper and thin section of +5% over-thick configuration
a b
24
Figure 3. a) Dimensions of compaction specimens; b) Lay-up of compaction specimens
(adapted from [14])
Figure 4. Normalised thickness after compaction for both prepreg systems (adapted from [14])
Figure 5. BP IM7/8552 consolidated at 90C (left); BP IMA/M21 consolidated at 90C (right), adapted from [14].
25
Figure 6. Measured distribution of ply thickness in a roll of IM7/8552 prepreg, corresponding
normal distribution is shown in red
Figure 7. Measured distribution of ply thickness of IM7/8552 prepreg, corresponding normal
distribution is shown in red
26
a b
Figure 8. Distribution of thickness after compaction for a single ply (a) IM7/8552 and (b)
IMA/M21 (10,000 simulations), corresponding normal distribution is shown in red
27
a b
c d
e f
Figure 9. (a – f) Thickness distribution of various layups of IM7/8552 and IMA/M21 prepregs
(1000 simulations), corresponding normal distributions shown in red
28
Table 1. Model parameters for IM7-8552, CoV (%) in brackets. Data sets consist of four
points for each temperature
T, °C 30 40 50 60 70 80 90
𝑘 0.933
(<0.1)
0.895
(2.91)
0.860
(2.44)
0.836
(2.03)
0.813
(4.06)
0.801
(1.62)
0.795
(2.01)
𝑎 -0.954
(1.12)
-0.932
(2.19)
-0.909
(5.58)
-0.888
(2.05)
-0.866
(6.48)
-0.844
(5.29)
-0.822
(8.57)
�̅�
(squeezing)
-18.15
(0.55)
-16.90
(2.62)
-15.63
(3.33)
-15.18
(1.98)
-14.93
(2.61)
-14.87
(2.49)
-14.98
(4.34)
�̅�
(bleeding)
-34.88
(0.46)
-33.63
(1.40)
-32.36
(1.48)
-31.91
(0.88)
-31.66
(1.26)
-31.59
(1.04)
-31.71
(1.23)
Table 2. Model parameters for IMA-M21, CoV (%) in brackets. Data sets consist of three
points for each temperature
T, °C 30 40 50 60 70 80 90
𝑘 0.96
(2.22)
0.893
(4.51)
0.83
(2.14)
0.805
(0.96)
0.8
(<0.01)
0.795
(0.63)
0.79
(1.25)
𝑎 -0.934
(1.75)
-0.818
(1.90)
-0.752
(5.47)
-0.731
(7.61)
-0.752
(8.57)
-0.8
(5.28)
-0.864
(7.00)
�̅�
(squeezing)
-17.89
(-)
-15.78
(0.32)
-14.44
(0.91)
-13.9
(0.63)
-13.84
(5.53)
-13.98
(2.46)
-14.58
(0.93)
�̅�
(bleeding)
-34.62
(0.74)
-32.51
(3.40)
-31.17
(1.64)
-30.63
(2.22)
-30.56
(5.41)
-30.70
(3.08)
-31.31
(2.35)
Table 3. Sensitivity index S(0.1) for thickness after compaction (IM7/8552)
Dimensions of
a ply, mm
Aspect
ratio
𝑎 𝑏𝑠𝑞𝑢𝑒𝑒𝑧𝑖𝑛𝑔 k Initial
thickness (ℎ0)
Temperat
ure
0.33×15×15 45.4 0.14 0.01 2.13 -0.16 -0.12
0.66×100×100 151.5 0.35 0.03 1.41 -0.11 -0.03
29
0.33×100×100 303.0 0.57 0.05 1.17 -0.13 0.02
0.33×250×250 757.6 0.77 0.09 0.67 <0.01 <0.01
Table 4. Sensitivity index S(0.5) for thickness after compaction (IM7/8552)
Dimensions of
a ply, mm
Aspect
ratio
Pressure Temperature Ramp time Dwell time
0.33×15×15 45.4 -0.02 -0.22 <0.01 <0.01
0.66×100×100 151.5 -0.05 -0.14 <0.01 <0.01
0.33×100×100 303.0 -0.08 -0.10 <0.01 <0.01
0.33×250×250 757.6 <0.01 -0.04 <0.01 -0.01
Table 5. CoV of the parameters of IM7/8552 and IMA/M21, %
𝑎 𝑏𝑠𝑞𝑢𝑒𝑒𝑧𝑖𝑛𝑔 𝑘 ℎ0 Time Temperature Pressure
IM7/8552 4.47 2.56 2.15 2.2 10 10 10
IMA/M21 5.37 1.79 1.67
Table 6. Thickness after compaction of the layups, based on 1000 simulations
IM7/8552 IMA/M21
[0°2/90°2]40 [0°4/90°4]20 [0°8/90°8]10 [0°2/90°2]40 [0°4/90°4]20 [0°8/90°8]10
Baseline 19.30 17.47 16.12 23.43 21.52 19.88
Mean
(Std.)
19.26
(0.31)
17.68
(0.40)
16.29
(0.40)
23.59
(0.32)
21.63
(0.17)
19.94
(0.16)
CoV 1.62 2.28 2.46 1.36 0.80 0.79
30
Table 7. Laminate thickness and its variability after compaction at different processing
conditions, mm. Baseline: layup IM7/8552 (04/904)20 at 70°C, pressure of 7 bar, ramp time
1,000 s and dwell time of 10,000 s
Baseline
Lower
temperature
variability
(± 0.5C)
Higher
temperature
(110C)
Higher
pressure
(14 bar)
Shorter
dwell time
(1000 sec)
Baseline 17.47 17.47 16.55 16.97 17.73
Mean
(Std.)
17.68
(0.40)
17.66
(0.14)
16.70
(0.12)
17.13
(0.36)
18.02
(0.38)
CoV 2.28 0.77 0.70 2.09 2.13
Table 8. Laminate thickness and its variability after compaction at different processing
conditions, mm. Baseline: layup IMA/M21 (04/904)20 at 70°C, pressure of 7 bar, ramp time
1,000 s and dwell time of 10,000 s
Baseline
Lower
temperature
variability
(± 0.5C)
Higher
temperature
(110C)
Higher
pressure
(14 bar)
Shorter
dwell time
(1000 sec)
Baseline 21.52 21.52 21.79 21.08 21.98
Mean
(Std.)
21.63
(0.17)
21.57
(0.11)
21.89
(0.16)
21.17
(0.11)
22.07
(0.17)
CoV 0.80 0.50 0.75 0.54 0.76


![Apsotw 2[1]Matt Nixon](https://img.pdfslide.tips/doc/110x75/577d296b1a28ab4e1ea6bc4d/apsotw-21matt-nixon.jpg)