Embed Size (px)
Citation preview

Maxcom Telecomunicaciones, S.A.B de C.V.
Fourth Quarter 2017 Results

Contents
Earnings Results Summary and Relevant Events
Commercial Business Unit
Wholesale Business Unit
Residential Business Unit
Consolidated Revenue
Cost, Expenses and Other Items
o Network Operation Cost and SG & A
o EBITDA & Operating Income (Loss)
o Comprehensive Financing Result
o Taxes
o Net Income (Loss)
o CAPEX
o Indebtedness
o Stockholders’ Equity
Exhibits – Non-Audited Financial Statements
3
Fourth Quarter 2017 Results
During this quarter, the revenue composition started to
show an important shift with the commercial business
revenue taking the heaviest weight in the revenue
composition, taking the shift away from wholesale,
compared to the previous year. Commercial revenue as
a percentage of total revenue for this quarter reached
48%, compared with only 27% during 4Q16.
As already mentioned during the previous quarter,
Maxcom made a capital increase in the amount of
Ps.154.2 million through the issuance of 25,700,000
shares. Maxcom received a total amount of Ps.98 million
during 3Q17, and the remaining Ps.56.2 million during
the beginning of 4Q17. This capital inflow strengthened
the cash position at the end of year.
As a subsequent event, at the Ordinary General
Shareholders' Meeting held on January 16, 2018
shareholders approved the accumulated losses
absorption of Ps. 6,327 million through a paid in capital
reduction. In accordance with accounting standards, the
Company recorded this effect in 2017.
The most important investment was made during the
last quarter with a total amount of US1.4 million, the
purpose of this was the reinforce of the backbone
network trhoughout the Gulf route, in order to increase
transport capacity.
TO TA L
REV ENUES
Ps.448 million
+2%. vs 3Q17
NE TWORK
OP ERA TION
COS T
Ps.251 million
-52%. vs 4Q16
G ROSS PRO FIT
Ps.197 million
+86%. vs 4Q16
E B ITDA
Ps.89 million
+20% vs 4Q16
NE T LOSS
Ps.188 million
-86% vs 4Q16
Earnings Results Summary and Relevant Events
Maxcom´s quarterly results reflect an important change
in trend. Even though the revenue showed a decrease
of 29% against 4Q16 as a consequence of the wind
down process of the residential business unit which is
still in execution, the EBITDA Margin increased during
this quarter from 12% in 4Q16 to 20% a year later. On a
sequential basis, the revenue increased by 2.3% and
was mainly supported by the growth in the commercial
business unit.
Residential17%
Commercial48%
Wholesale35%
WEIGHT (%) 4Q17
Maxcom´s
4Q17 Performance
629
448
51 43
(276)
100
400
700
4Q16 Residential Commercial Wholesale 4Q17

4
Fourth Quarter 2017 Results
Item 4Q17 3Q17 % var
Total Revenues 448 438 2%
EBITDA 89 74 20%
EBITDA margin (%) 20% 17%
Net income (loss) (188) (77) (144%)
Net margin (%) (42%) (18%)
Cash and financial instruments 1 618 566 9%
CAPEX 55 52 6%
Debt 2 2,299 2,174 6%
Net debt / LTM EBITDA (X) 5.3 5.3 -
Customers 80,917 90,775 (11%)
Commercial 1,495 1,577 (5%)
Residential 79,422 89,198 (11%)
RGUs 3 294,536 316,216 (7%)1
Includes long- term restricted cash.
2 Debt is considered at face value and includes interest payable as of the end of the period
3 Revenue generating units
MAXCOM TELECOMUNICACIONES, S.A.B. DE C.V. AND SUBSIDIARIES
FINANCIAL AND OPERATING HIGHLIGHTS
Figures in millions of pesos, except operating data
Commercial Business Unit
The growth in the segment reflects the strategy and
initiatives the Company has put in place to
consolidate focus in this business unit. As a result,
commercial revenue weight within the revenue mix
increased from 27% in 4Q16 to 48% in 4Q17.
During the 4Q17, revenue reached Ps.213 million,
representing an increase of 25% in comparison with
Ps.170 million recorded during 4Q16.
On a cumulative basis, for the twelve months ended
on December 31, 2017, revenue from the
commercial business was Ps.756 million,
representing an increase of 13% compared to
Ps.671 million recorded in the same period of 2016.
Those results are due to improvements in cross-
selling and up-selling strategies, as well as the
introduction of new products and services.
170 199 213
26
38
43
-
5
10
15
20
25
30
35
40
45
50
0
50
100
150
200
250
4Q16 3Q17 4Q17
AR
PC
(Th
ou
san
d P
eso
s)
Rev
enu
e(M
illi
on
Pes
os)
Revenue ARPC
On a sequential basis, revenue grew Ps.14 million
or 7% from 4Q17 compared to 3Q17.
Commercial business average revenue per
customer (“ARPC”) during 4Q17 was Ps. 43
thousand pesos, 65% higher than the Ps.26
thousand pesos recorded in 4Q16 and 13% above
when compared to the figure recorded in 3Q17.
5
Fourth Quarter 2017 Results
Ps.
Wholesale Business Unit
As part of an already mentioned strategy of reducing Company’s participation within this business unit, revenue
during this quarter decreased to Ps.156 million, a significant decrease of 64% when compared to the same
period in 2016.
For the twelve months ended on December 31, 2017, wholesale revenue was Ps. 1,132 million, an 8%
decrease against the Ps.1,231 million recorded in the same period of the previous year.
Going forward, Maxcom will continue to reduce its revenue stream coming for the termination of international
traffic troughout its long distance network.
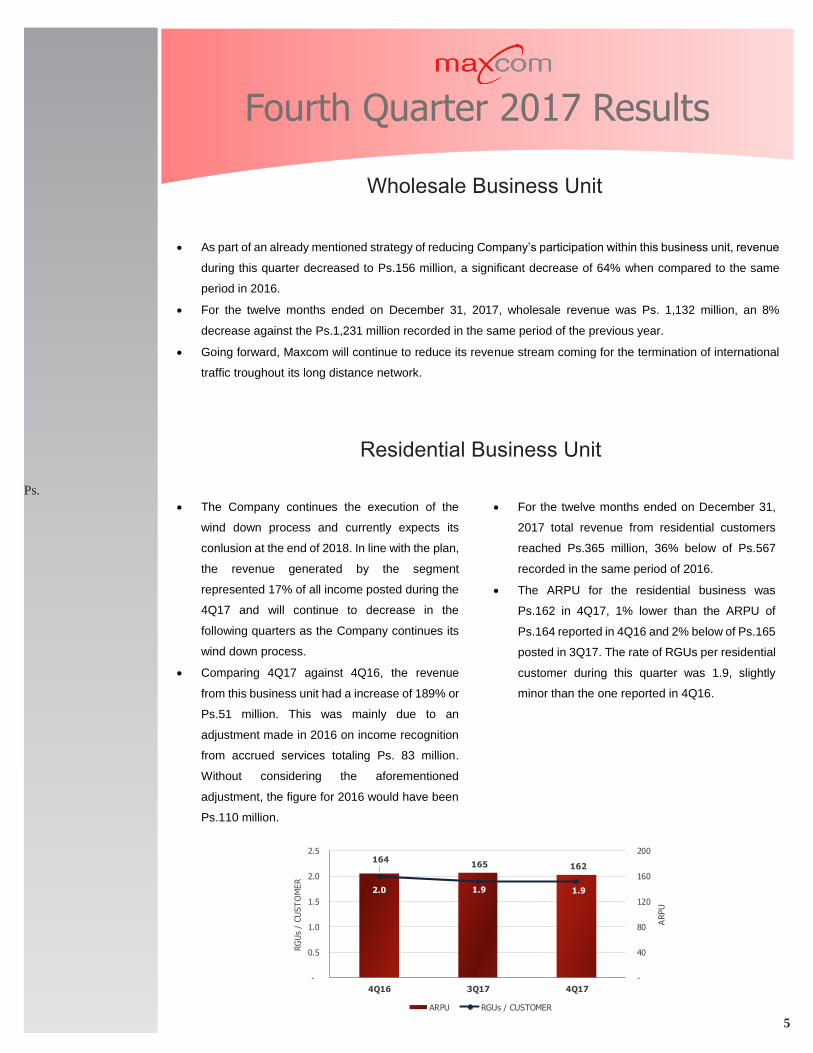
Residential Business Unit
164 165 162
2.0 1.9 1.9
-
40
80
120
160
200
-
0.5
1.0
1.5
2.0
2.5
4Q16 3Q17 4Q17
ARPU
RG
Us
/ CU
ST
OM
ER
ARPU RGUs / CUSTOMER
The Company continues the execution of the
wind down process and currently expects its
conlusion at the end of 2018. In line with the plan,
the revenue generated by the segment
represented 17% of all income posted during the
4Q17 and will continue to decrease in the
following quarters as the Company continues its
wind down process.
Comparing 4Q17 against 4Q16, the revenue
from this business unit had a increase of 189% or
Ps.51 million. This was mainly due to an
adjustment made in 2016 on income recognition
from accrued services totaling Ps. 83 million.
Without considering the aforementioned
adjustment, the figure for 2016 would have been
Ps.110 million.
For the twelve months ended on December 31,
2017 total revenue from residential customers
reached Ps.365 million, 36% below of Ps.567
recorded in the same period of 2016.
The ARPU for the residential business was
Ps.162 in 4Q17, 1% lower than the ARPU of
Ps.164 reported in 4Q16 and 2% below of Ps.165
posted in 3Q17. The rate of RGUs per residential
customer during this quarter was 1.9, slightly
minor than the one reported in 4Q16.

6
Fourth Quarter 2017 Results
Consolidated Revenue
On a consolidated basis, total revenue reported
in 4Q17 amounted to Ps.448 million, a decrease
of 29% when compared to 4Q16.
Notwithstanding, the reduction is due to the
decrease of the revenue from wholesale
operations. This has also resulted in a higher
EBITDA margin, as we will show later on.
Sequentially, the revenue registered an increase
of 2% compared to 3Q17, mainly supported by a
consistent commercial revenue increase.
For the twelve months ended December 31,
2017, revenue reached Ps.2,256 million, which
represents a decrease of 9% compared to the
Ps.2,469 million recorded in the same period of
2016.
12M17 % 12M16 %
Commercial Ps. 756 34% Ps. 671 27%
Wholesale 1,132 50% 1,231 51%
Residential 365 16% 567 23%
Others 3 - 0 -
Total Ps. 2,256 100% Ps. 2,469 100%
170 432 27 0199 148 89 2213 156 78 10
50
100
150
200
250
300
350
400
450
Commercial Wholesale Residential Others
4Q16 3Q17 4Q17
Cost, Expenses and Other Items
Network Operation Cost
Network operation costs in 4Q17 decreased 52%
to reach Ps.251 million, compared to the Ps.523
million reported in 4Q16.
For 2017, operation costs had a decrease of
10%, from Ps.1,643 million to Ps.1,485 million,
mainly explained by the decrease in traffic
termination of the wholesale business and the
reduction in the residential segment operating
structure.
Due to this cost reductions and other efficiencies,
gross profit increased from 17% in 4Q16 to 44%
in 4Q17. The improvement is due by the change
in revenue mix and initiatives to increase the
profitability per customer in the commercial
business.
For the twelve months ended on December 31,
2017 the gross margin was 34%, above the 33%
registered in the same period of 2016.
SG & A
During the 4Q17 the Company reported total
SG&A expenses of Ps.108 million, 243% higher
than the Ps.31 million in 4Q16. It is worth
mentioning that the figure of 2016 was diminished
in Ps.83 million by the adjustment of income
recognition from accrued services, without this
adjustment the expense would have been Ps.115
million.
For the twelve-month ended December 31, 2017,
the expenses decreased 5% to Ps.452 million
compared to the Ps.478 incurred in the same
period of 2016. Without considering the
aforementioned adjustment, the figure for 2016
would have been Ps.561 million and the
reduction 19%.

7
Fourth Quarter 2017 Results
Operating Income (Loss)
The Company recorded an operating loss of Ps.2 million in 4Q17, lower than the operating loss of Ps.1,197
million reported in the same period of 2016.
For the twelve months ended December 31, 2017, the Company reported operating income of Ps.7 million that
compares favorably against an operating loss of Ps.1,561 million recorded in the same period in 2016. The
variation is explained by the recorded asset impairment made to the residential segment in 4Q16, generating
most of the loss over that period.
Comprehensive Financing Result
During 4Q17, the Company recorded a comprehensive financing loss of Ps.187 million, an increase of Ps.29
million when compared to the loss of Ps.158 million recorded in the same period of 2016. This result is mainly
explained by the depreciation which has had the mexican peso, yielding a higher foreign exchange loss in the
quarter.
For the twelve months ended December 31, 2017, comprehensive financing loss was Ps.22 million compared
to the net loss of Ps.550 million recorded in the same period of 2016. The variation is mainly explained by the
appreciation of the peso maintained during the first half of the year, with a significant profit from foreign
exchange. On the other hand, it has an accelerated amortization of the issuance expenses associated with the
portion of the USD $ 13.1 million repurchased from Step-Up Senior Notes 2020, as well as by the increase in
interest paid.
4Q17 4Q16 DPs. D%
Interest Expense 38 44 (6) (14%)
Interest (Income) (21) (6) (15) 226%
Valuation Effects – Net 14 9 5 45%
Exchange Rate (Gain) Loss – Net 156 111 45 40%
Total 187 158 29 17%
EBITDA
The multiple efforts to increase operating efficiency and drive a higher recurrent revenue base are reflected in
the EBITDA margin, which increased from 12% in 4Q16 to 20% in 4Q17. EBITDA for 4Q17 was Ps.89 million,
Ps.15 million higher than the Ps.74 million registered in the same period of the previous year.
Excluding the effect of the wholesale operation, EBITDA for 4Q17 was Ps.77 million, higher than the Ps.26
million recorded in the same period of the previous year. The EBITDA margin for 4Q17 was 26%, above the
13% reported in 4Q16.
For the twelve months ended December 31, 2017, an EBITDA of Ps.318 million was reported, representing a
decrease of 9% compared to Ps.348 million reported in 2016, while the EBITDA margin was 14%, in line with
the margin posted in 2016.
Sequentially, EBITDA was Ps.15 million or 20% higher than the amount reported in 3Q17.
74 83 72 74 89
12% 11% 11%
17%
20%13%
15% 15%
21%
26%
-
22
44
66
88
110
4Q16 1Q17 2Q17 3Q17 4Q17
0%
6%
12%
18%
24%
30%
EBIT
DA
(M
illio
ns)
EBIT
DA
Marg
in
EBITDA & EBITDA Margin
EBITDA EBITDA MARGIN EBITDA MARGIN WITHOUT WHOLESALE

8
Fourth Quarter 2017 Results
Taxes
In 4Q17 the Company did not recorded any taxes.
Net Income (Loss)
During 4Q17 the Company posted a net loss of Ps.188 million, compared to a net loss of Ps.1,363 million
recorded in the same period of 2016 and a net loss of Ps.77 million posted in 3Q17. It is worth to mention that
the net loss of the period derives mainly from the foreing exchange loss and the payment of interests.
For the twelve months ended December 31, 2017, the Company recorded a net loss of Ps.16 million in
comparison with a net loss of Ps.2,118 million recorded in the same period of 2016, consequence of all non-
cash records made on the 4Q16.
Excluding losses from Celmax, Maxcom generated a net profit of Ps. 2 million for the year.
Capital Expenditures
Capital expenditures during the quarter totaled Ps.55 million, a decrease of Ps.52 million when compared to
4Q16. Capital expenditures for the quarter were primarily used to develop last-mile connectivity for business
customers and increase network capacity.
For the twelve months ended December 31, 2017, capital expenditures reached Ps.230 million, an increase of
92% when compared to Ps.120 million recorded in the same period of 2016. It is important to mention that
during 3Q16 Maxcom recorded write–offs associated to the sale of customers to Megacable, affecting the
variation of capex and giving an effect of lower investment for the year. Excluding this effect the amount would
have been Ps.484 million, resulting in a decrease of 52% in capital expenditures from 2016 to 2017.
The cash inflows derived from the capital increase and the improvement in the collection, strenghthen our cash
position at the end of the year. It is importan mentioning, that the figure presented in the next table does not
consider the restricted cash. Including this amount the all cash position of the Company is Ps.618 million.
Fourth Quarter Fourth Quarter
of 2017 of 2016
Operating Activities 72 276
CAPEX (55) (107)
Financing Activities 30 (4)
Increase (Decrease) in Cash and Financial
Instruments 47 165
Cash and Financial Instruments at Beginning
of Period 538 672
Cash and Financial Instruments at End of
Period 585 837
Twelve Months Ended Twelve Months Ended
December 31, 2017 December 31, 2016
Operating Activities (126) 330
CAPEX (230) (120)
Financing Activities 104 (168)
Increase (Decrease) in Cash and Financial
Instruments (252) 42
Cash and Financial Instruments at Beginning
of Period 837 795
Cash and Financial Instruments at End of
Period 585 837
Millions of Pesos
Millions of Pesos

9
Fourth Quarter 2017 Results
Indebtedness
At December 31, 2017, the Company reported indebtedness of Ps.2,299 million (debt is valued at face value
and includes interest payable at period end). The Company's leverage ratio measured by the Debt to EBITDA
ratio was 7.22 times, while the Net Debt to EBITDA ratio stood at 5.28 times (last twelve months EBITDA is
used in these calculations).
Maxcom Financial Liabilities at December 31, 2017
Face Value
Figures in Millions Pesos Dollars Total Pesos1 Due date Rate
Step-Up Senior Notes 2020 - 112.4 2,209.4 June, 2020 6%, 7% y 8%2
Bancomext 82.5 - 82.5 September, 2020 9.86%3
Total financial debt 82.5 112.4 2,291.9
1 Considers the FIX exchange rate at December 31, 2017: Ps$19.6629 per dollar
3 This loan was signed on October 2015 at 9.86% fixed interest rate
2 The Step-Up Senior Notes bear interest (i) from the date of issuance (October 2013) until June 14, 2016, at the annual fixed rate of 6% per
annum, (ii) from June 15, 2016 until June 14, 2018, at the annual fixed rate of 7% per annum, and (iii) from June 15, 2018 until the maturity date, at
the annual fixed rate of 8% per annum; have a maturity date of June 15, 2020
Net Debt/LTM EBITDA 5.28 5.30 4.80
4Q17 2Q173Q17
As of December 31, the Company entered into cross-currency swaps to cover the interests of the Step-Up
Senior Notes 2020 for a notional amount of USD$70 million maturing on June 15, 2020.
Stockholders’ Equity
At the end of 4Q17, the Company reported stockholders' equity of Ps.1,021 million, an increase of 29%
compared to Ps.790 million at the end of the previous year. This is mainly due to the results of the year and
the increase in the capital stock of Celmax Móvil and Maxcom, respectively.
Capital Structure
4Q17 4Q16
Subscribed and paid shares 140,710,530 115,010,530
10
Fourth Quarter 2017 Results
About MAXCOM
MAXCOM Telecomunicaciones, S.A.B. de C.V., headquartered in Mexico City, is a facilities-based
telecommunications provider using a “smart-build” approach to deliver “last-mile” connectivity to enterprises and
residential customers in the Mexican territory. MAXCOM launched its commercial operations in May 1999 and is
currently offering local and long distance telephony services; wired, wireless and cellular data transmission; IP-
based TV services and value-added services in Mexico City metropolitan area, Monterrey, Puebla, Querétaro,
León, Guadalajara, San Luis Potosí, Tehuacán and Toluca, and on a selected basis in several cities in Mexico. The
information contained in this press release is the exclusive responsibility of Maxcom Telecomunicaciones, S.A.B.
de C.V. and has not been reviewed by the Mexican National Banking and Securities Commission (CNBV) or any
other authority. The registration of the securities described in this press release before the National Registry of
Securities (Registro Nacional de Valores) held by the CNBV, shall it be the case, does not imply any certification
as to the investment quality of the securities or of Maxcom’s solvency. The trading of these securities by an investor
will be made under such investor’s own responsibility.
This document may include forward-looking statements that are subject to risks, uncertainties and other factors
which could cause real results, performance or achievements to be materially different from any future results,
performance or achievements expressed or implied by such forward-looking statements. Words such as “estimate,”
“project,” “plan,” “believe,” “expect,” “anticipate,” “intend,” and similar expressions may identify such forward-looking
statements. Maxcom cautions readers that any forward-looking statement in this press release or made by the
Company’s management involves risks and uncertainties that may change based on various important factors not
under Maxcom’s control. These forward-looking statements represent Maxcom’s judgment as of the date of this
press release. Maxcom disclaims any intent or obligation to update these forward-looking statements.
Unless otherwise specified, all references to “USD$” are to United States dollars and references to “Ps.” are to
Mexican pesos. Amounts presented in this annual report may not add up or may be slightly inconsistent due to
rounding.
For more information contact:
Rodrigo Wright
México, D.F., México
(52 55) 4770-1170

11
Fourth Quarter 2017 Results
As of December 31, As of December 31,
2017 2016 Var $ Var %
ASSETS:
CURRENT ASSETS:
Cash and financial instruments 585,271Ps. 837,608Ps. (252,337)Ps. (30%)
585,271 837,608 (252,337) (30%)
Accounts receivable:
Customers, net of allowance 253,674 264,178 (10,504) (4%)
Recoverable value added tax 110,502 40,206 70,296 175%
Other sundry debtors 14,857 25,708 (10,851) (42%)
379,033 330,092 48,941 15%
Inventory 3,404 1,514 1,890 125%
Prepaid expenses 37,153 27,006 10,147 38%
Total current assets 1,004,861 1,196,220 (191,359) (16%)
Telephone network systems and equipment, net 2,338,606 2,359,302 (20,696) (1%)
Intangible assets, net 264,307 221,111 43,196 20%
Long-term restricted cash 33,145 24,508 8,637 35%
Financial instruments - 20,040 (20,040) (100%)
Deposits in guarantee 8,804 11,236 (2,432) (22%)
Deferred taxes 12,921 12,921 - -
Other assets 2,151 2,151 - -
Total assets 3,664,795Ps. 3,847,489Ps. (182,694)Ps. (5%)
LIABILITIES
CURRENT LIABILITIES:
Bank loans 30,000Ps. 30,000Ps. -Ps. -
Interest payable 6,801 7,954 (1,153) (14%)
Accounts payable and accrued expenses 317,642 392,767 (75,125) (19%)
Customer deposits 2,157 2,484 (327) (13%)
Derivative financial instruments 4,784 - 4,784 -
Other taxes payable 8,674 36,246 (27,572) (76%)
Total current liabilities 370,058 469,451 (99,393) -
LONG-TERM LIABILITIES:
Step-up senior notes 2,089,402 2,375,670 (286,268) (12%)
Bank loans 52,500 82,500 (30,000) (36%)
Deferred income 35,010 46,976 (11,966) (25%)
Labor obligations 1,898 2,241 (343) (15%)
Other long-term liabilities 95,038 80,347 14,691 18%
Long-term liabilities 2,273,848 2,587,734 (313,886) (12%)
Total liabilities 2,643,906Ps. 3,057,185Ps. (413,279)Ps. (14%)
SHAREHOLDERS' EQUITY
Capital stock 1,455,066Ps. 7,628,698Ps. (6,173,632)Ps. (81%)
Additional paid-in capital 50,170 41,113 9,057 22%
Accumulated losses (592,919) (4,802,595) 4,209,676 (88%)
Net income (loss) for the period 2,272 (2,118,156) 2,120,428 (100%)
Other comprehensive income 9,496 41,244 (31,748) (77%)
Controlling interest 924,085 790,304 133,781 17%
Non-controlling interest 96,804 - 96,804 -
Total shareholders' equity 1,020,889Ps. 790,304Ps. 230,585Ps. 29%
Total liabitilies and shareholders' equity 3,664,795Ps. 3,847,489Ps. (182,694)Ps. (5%)
MAXCOM TELECOMUNICACIONES, S.A.B. DE C.V. AND SUBSIDIARIES
UNAUDITED CONSOLIDATED STATEMENT OF FINANCIAL POSITION (IFRS)
Thousands of Mexican Pesos (''Ps.'')

12
Fourth Quarter 2017 Results
2017 % 2016 % $ var % var 2017 % 2016 % $ var % var
TOTAL REVENUES 447,989Ps. 100% 628,960Ps. 100% (180,971)Ps. (29%) 2,255,580Ps. 100% 2,468,933Ps. 100% (213,353)Ps. (9%)
Network operating services 198,061 44% 463,365 74% (265,304) (57%) 1,273,893 56% 1,436,274 58% (162,381) (11%)
Technical expenses 49,758 11% 52,369 8% (2,611) (5%) 202,993 9% 194,259 8% 8,734 4%
Installation expenses 3,153 1% 7,292 1% (4,139) (57%) 8,051 0% 12,624 1% (4,573) (36%)
Network operation cost 250,972 56% 523,026 83% (272,054) (52%) 1,484,937 66% 1,643,157 67% (158,220) (10%)
GROSS PROFIT 197,017 44% 105,934 17% 91,083 86% 770,643 34% 825,776 33% (55,133) (7%)
Selling, general and administrative expenses 107,957 24% 31,444 5% 76,513 243% 452,474 20% 477,679 19% (25,205) (5%)
EBITDA 89,060 20% 74,490 12% 14,570 20% 318,169 14% 348,097 14% (29,928) (9%)
Depreciation and amortization 52,564 82,673 (30,109) (36%) 210,341 366,460 (156,119) (43%)
Other (income) expense 38,634 142,515 (103,881) (73%) 101,174 496,156 (394,982) (80%)
Restructuring - - - - - - - -
Reorganization - - - - - - - -
Impairment - 1,046,252 - - - 1,046,252 - -
Operating income (loss) (2,138) (1,196,950) 1,194,812 (100%) 6,654 (1,560,771) 1,567,425 (100%)
Comprehensive (income) cost of financing:
Interest expense 38,031 44,184 (6,153) (14%) 174,165 168,398 5,767 3%
Interest (income) loss, net (21,044) (6,453) (14,591) 226% (122,388) (23,302) (99,086) 425%
Valuation effects, net 13,710 9,471 4,239 45% 72,788 (23,072) 95,860 (415%)
Exchange (income) loss, net 155,656 111,448 44,208 40% (102,644) 428,375 (531,019) (124%)
186,353 158,650 27,703 17% 21,921 550,399 (528,478) (96%)
INCOME (LOSS) BEFORE TAXES (188,491) (1,355,600) 1,167,109 (86%) (15,267) (2,111,170) 2,095,903 (99%)
Taxes:
Income taxes - 13,317 (13,317) (100%) 657 13,317 (12,660) (95%)
Deferred taxes - (6,331) 6,331 (100%) - (6,331) 6,331 (100%)
Total taxes - 6,986 (6,986) (100%) 657 6,986 (6,329) (91%)
NET INCOME (LOSS) (188,491)Ps. (1,362,586)Ps. 1,174,095Ps. (86%) (15,924)Ps. (2,118,156)Ps. 2,102,232Ps. (99%)
Other comprehensive result 14,494 (1,084) 15,578 (1,437%) (31,748) 8,802 (40,550) (461%)
COMPREHENSIVE NET INCOME (LOSS) (173,997)Ps. (1,363,670)Ps. 1,189,673Ps. (87%) (47,672)Ps. (2,109,354)Ps. 2,061,682Ps. (98%)
Controlling interest (184,411) (1,362,586) 1,178,175 (86%) 2,272 (2,118,156) 2,120,428 (100%)
Non-controlling interest (4,080) - (4,080) - (18,196) - (18,196) -
NET INCOME (LOSS) (188,491)Ps. (1,362,586)Ps. 1,174,095Ps. (86%) (15,924)Ps. (2,118,156)Ps. 2,102,232Ps. (99%)
Average basic shares 121,214 111,940 - - 121,214 111,940 0 0
Average diluted shares 121,214 111,940 - - 121,214 111,940 0 0
Earnings per basic share (1.52) (4.12) 0 0 0.02 (6.75) 0 0
Earnings per diluted share (1.52) (4.12) 0 0 0.02 (6.75) 0 0
12 months ended December 313 months ended December 31 vs 3M 2016 vs 12M 2016
MAXCOM TELECOMUNICACIONES, S.A.B. DE C.V. AND SUBSIDIARIES
UNAUDITED CONSOLIDATED STATEMENT OF COMPREHENSIVE INCOME (IFRS)
Thousands of Mexican Pesos (''Ps.'')

13
Fourth Quarter 2017 Results
Additional Other Total
Capital paid-in Accumulated comprehensive Controlling Non-controlling shareholders'
stock capital losses income interest interest equity
Balances as of December 31, 2015 7,528,698Ps. 41,113Ps. (4,802,595)Ps. 32,442Ps. 2,799,658Ps. -Ps. 2,799,658Ps.
Increase in capital stock 100,000 - - - 100,000 - 100,000
Comprehensive net loss - - (2,118,156) 8,802 (2,109,354) - (2,109,354)
Balances as of December 31, 2016 7,628,698Ps. 41,113Ps. (6,920,751)Ps. 41,244Ps. 790,304Ps. -Ps. 790,304Ps.
Additional Other Total
Capital paid-in Accumulated comprehensive Controlling Non-controlling shareholders'
stock capital losses income interest interest equity
Balances as of December 31, 2016 7,628,698Ps. 41,113Ps. (6,920,751)Ps. 41,244Ps. 790,304Ps. -Ps. 790,304Ps.
Increase of non-controlling interest - - - - - 115,000 115,000
Increase in capital stock 154,200 - - - 154,200 - 154,200
Stock option plan - 9,057 - - 9,057 - 9,057
Restitution of accumulated losses (6,327,832) - 6,327,832 - - - -
Comprehensive net income - - 2,272 (31,748) (29,476) (18,196) (47,672)
Balances as of December 31, 2017 1,455,066Ps. 50,170Ps. (590,647)Ps. 9,496Ps. 924,085Ps. 96,804Ps. 1,020,889Ps.
MAXCOM TELECOMUNICACIONES, S.A.B. DE C.V. AND SUBSIDIARIES
UNAUDITED CONSOLIDATED STATEMENT OF CHANGES IN SHAREHOLDERS' EQUITY (IFRS)
Thousands of Mexican Pesos (''Ps.'')

14
Fourth Quarter 2017 Results
Important notice: In compliance with provision 4.033.01 and other applicable provisions of the internal regulations of the Mexican Stock Exchange (“MSE”), regarding the “Independent Analyst”, Maxcom
Telecomunicaciones S.A.B. de C.V. attests that its share, which is listed on the MSE (Maxcom A) and on the OTCQX (MXMTY), is being covered by more than two financial institutions, thus the Company
will not request nor has requested registration to the program “Independent Analyst”, likewise Maxcom complies with all applicable regulations of the MSE and the National Banking and Securities Commission.
2017 2016 $ var % var 2017 2016 $ var % var
Operating Activities:
Income (loss) before taxes (188,491)Ps. (1,355,600)Ps. 1,167,109Ps. (86%) (15,267)Ps. (2,111,169)Ps. 2,095,902Ps. (99%)
Items not requiring the use of cash 204,963 1,252,092 (1,047,129) (84%) 69,159 2,045,992 (1,976,833) (97%)
Cash flow form income (loss) before taxes 16,472 (103,508) 119,980 (116%) 53,892 (65,177) 119,069 (183%)
Cash flow from:
Accounts receivable 10,785 298,366 (287,581) (96%) (7,519) 98,515 (106,034) (108%)
Inventory (2,040) 23,108 (25,148) (109%) (1,890) 27,663 (29,553) (107%)
Accounts payable 31,039 25,050 5,989 24% (75,124) 20,305 (95,429) (470%)
Other assets and liabilities 15,858 32,913 (17,055) (52%) (95,766) 248,721 (344,487) (139%)
Cash flow from operating activities 55,642 379,437 (323,795) (85%) (180,299) 395,204 (575,503) (146%)
Net cash flow from operating activities 72,114 275,929 (203,815) (74%) (126,407) 330,027 (456,434) (138%)
Investing Activities:
Telephone network systems and equipment, net (54,829) (106,685) 51,856 (49%) (230,170) (119,902) (110,268) 92%
Net cash flow used in investing activities (54,829) (106,685) 51,856 (49%) (230,170) (119,902) (110,268) 92%
Financing Activities:
Bank loans (7,500) (7,500) - - (30,000) (30,000) - -
Senior notes (13,659) 14,506 (28,165) (194%) (126,323) (228,692) 102,369 (45%)
Increase of non-controlling interest - - - - 115,000 - 115,000 -
Capital stock 56,153 - 56,153 - 154,200 100,000 54,200 54%
Other financing activities (4,790) (10,825) 6,035 (56%) (8,637) (9,123) 486 (5%)
Net cash flow from financing activities 30,204 (3,819) 34,023 (891%) 104,240 (167,815) 272,055 (162%)
Increase (decrease) in cash and financial instruments 47,489 165,425 (117,936) (71%) (252,337) 42,310 (294,647) (696%)
Cash and financial instruments at beginning of period 537,782 672,185 (134,403) (20%) 837,608 795,298 42,310 5%
Cash and financial instruments at end of period 585,271Ps. 837,610Ps. (252,339)Ps. (30%) 585,271Ps. 837,608Ps. (252,337)Ps. (30%)
MAXCOM TELECOMUNICACIONES, S.A.B. DE C.V. AND SUBSIDIARIES
UNAUDITED CONSOLIDATED STATEMENT OF CASH FLOW (IFRS)
Thousands of Mexican Pesos (''Ps.'')
vs 3M 2016 vs 12M 201612 months ended December 313 months ended December 31