Embed Size (px)
Citation preview
May 27, 2015
CIP Overview
What is the Arlington County CIP?
• Ten year plan for investment in Arlington’s physical assets totaling $2.7 billion
• Capital investments generally have useful life of three or more years, minimum $100k value, and extend the usability of an asset
• Covers all areas of infrastructure• Largely driven by service delivery demands
• Balanced between “maintaining what we have” and new investments
• CIP is flexible and can be adjusted based on changing circumstances• Bond referenda authorization is firm
• Financially sustainable & maintain County’s triple-AAA bond ratings
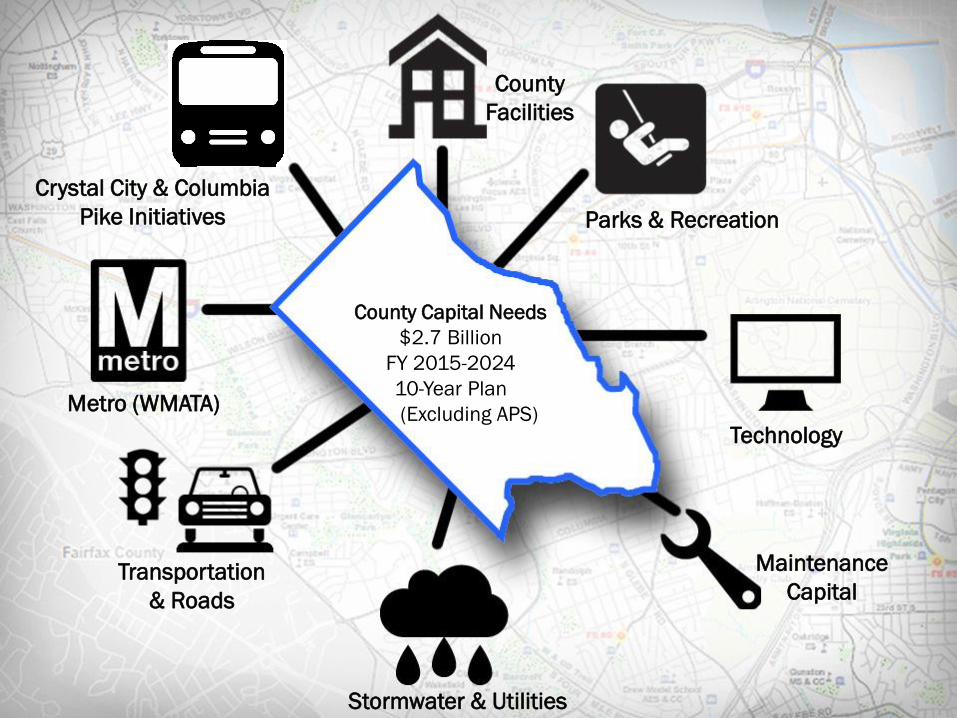
County Capital Needs
$2.7 Billion
FY 2015-2024
10-Year Plan
(Excluding APS)
County
Facilities
Stormwater & Utilities
Technology
Metro (WMATA)
Crystal City & Columbia
Pike Initiatives
Transportation
& Roads
Maintenance
Capital
Parks & Recreation
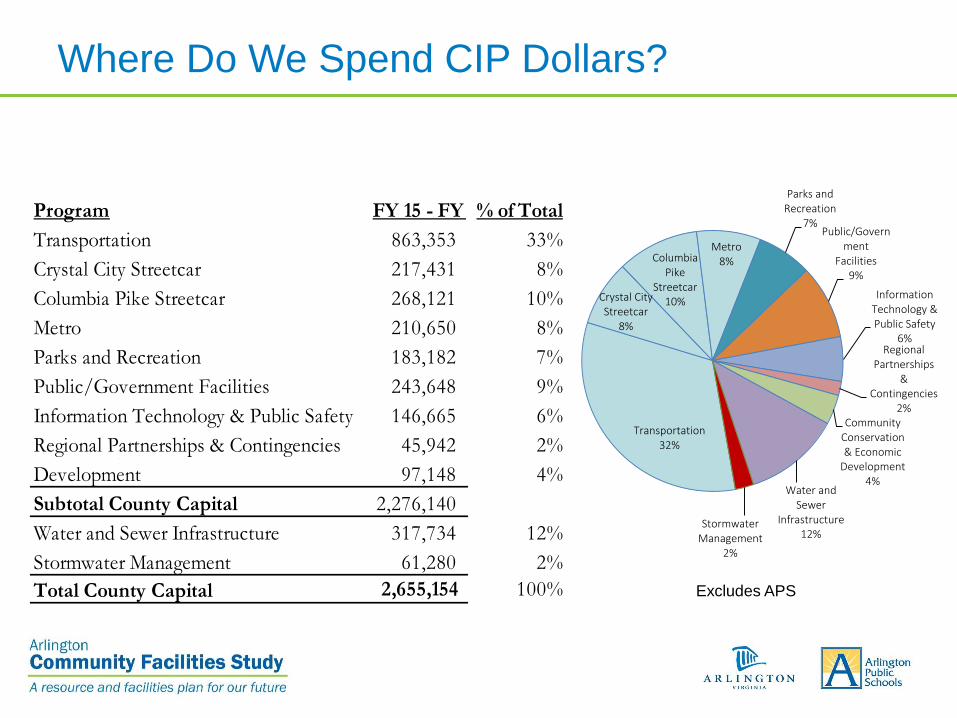
Where Do We Spend CIP Dollars?
Excludes APS
Program FY 15 - FY % of Total
Transportation 863,353 33%
Crystal City Streetcar 217,431 8%
Columbia Pike Streetcar 268,121 10%
Metro 210,650 8%
Parks and Recreation 183,182 7%
Public/Government Facilities 243,648 9%
Information Technology & Public Safety 146,665 6%
Regional Partnerships & Contingencies 45,942 2%Community Conservation & Economic
Development 97,148 4%
Subtotal County Capital 2,276,140
Water and Sewer Infrastructure 317,734 12%
Stormwater Management 61,280 2%
Total County Capital 2,655,154 100%
Transportation32%
Crystal City Streetcar
8%
Columbia Pike
Streetcar10%
Metro8%
Parks and Recreation
7%Public/Govern
ment Facilities
9%
Information Technology & Public Safety
6%Regional
Partnerships &
Contingencies2%
Community Conservation & Economic
Development4%
Water and Sewer
Infrastructure12%
Stormwater Management
2%
CIP Funds Investments In Service Delivery
• Livable neighborhoods
• Safe community
• Helping those in need
• Environmental sustainability
• Core infrastructure
• Economic competitiveness
• Robust quality of life
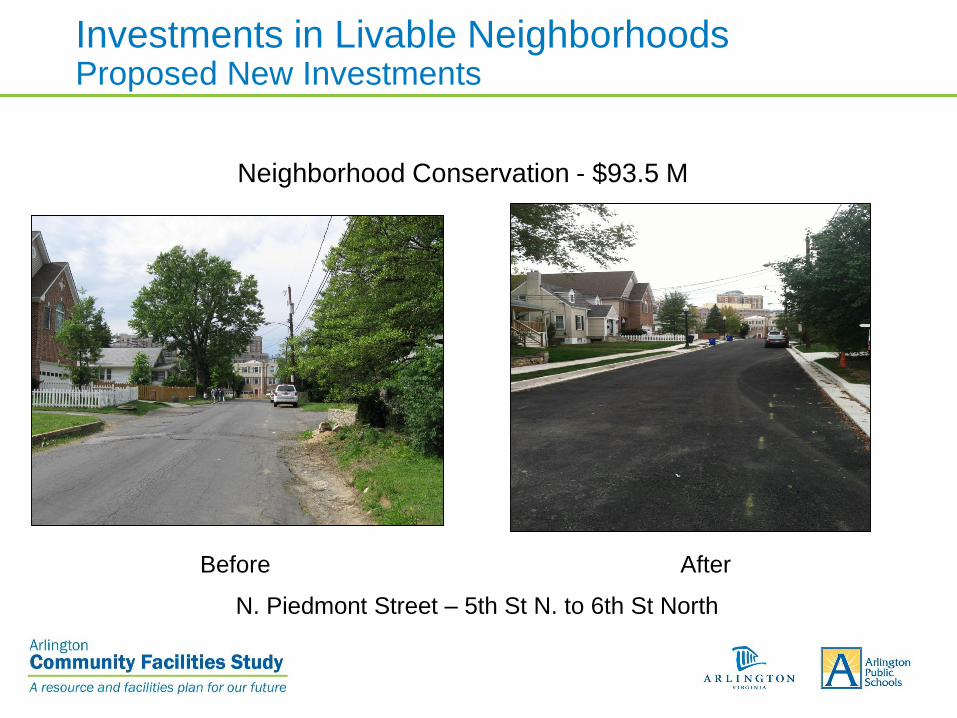
Investments in Livable NeighborhoodsProposed New Investments
Neighborhood Conservation - $93.5 M
N. Piedmont Street – 5th St N. to 6th St North
Before After
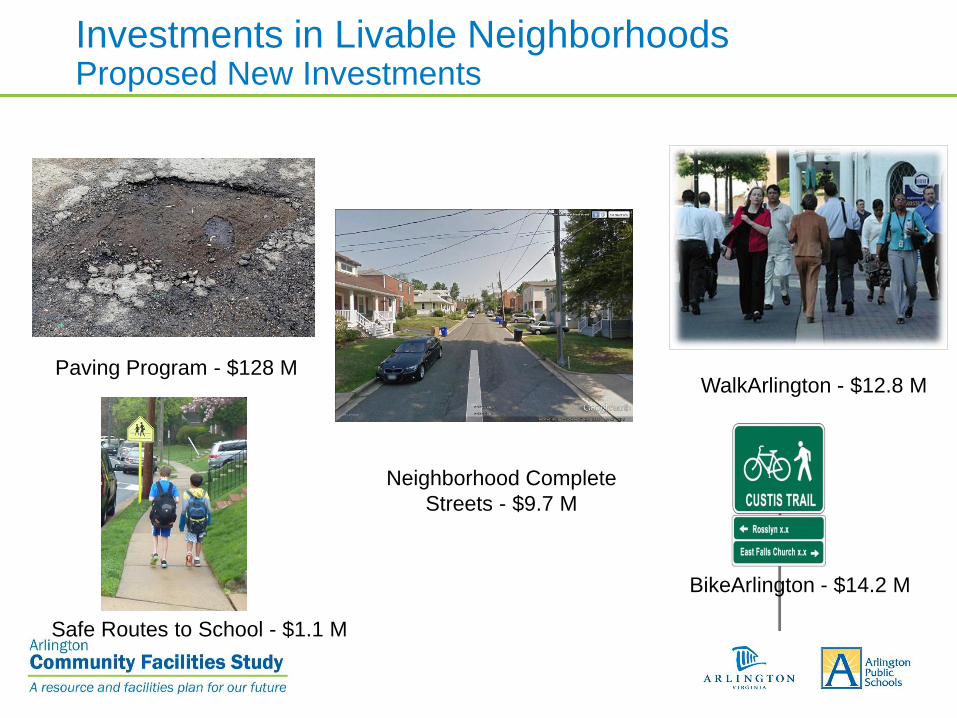
Investments in Livable NeighborhoodsProposed New Investments
Paving Program - $128 MWalkArlington - $12.8 M
Safe Routes to School - $1.1 M
BikeArlington - $14.2 M
Neighborhood Complete
Streets - $9.7 M
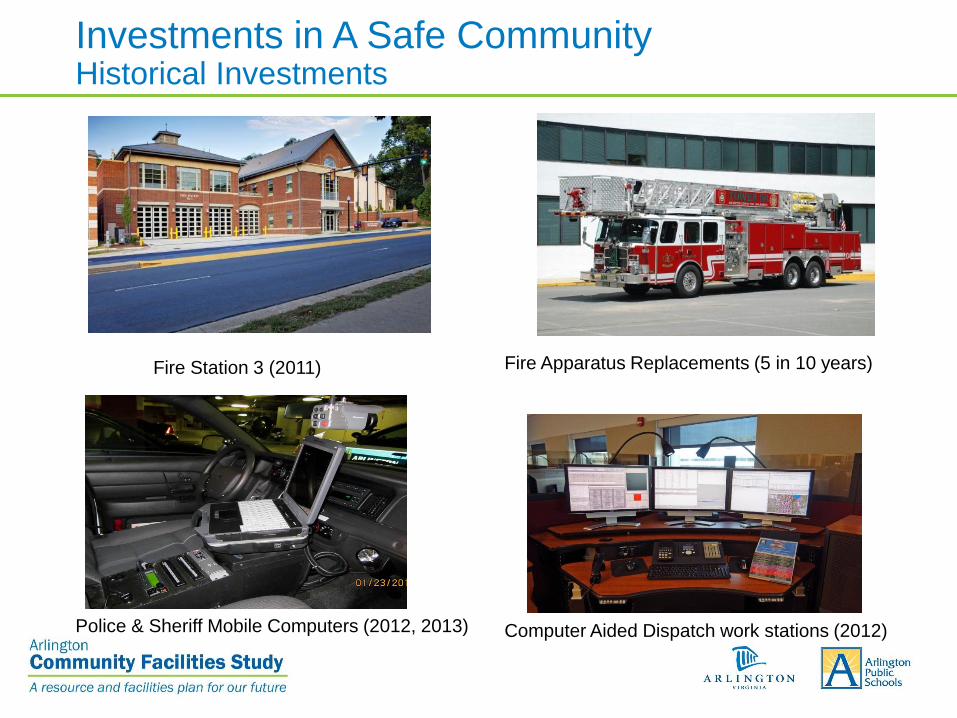
Investments in A Safe CommunityHistorical Investments
Fire Station 3 (2011)
Computer Aided Dispatch work stations (2012)
Fire Apparatus Replacements (5 in 10 years)
Police & Sheriff Mobile Computers (2012, 2013)
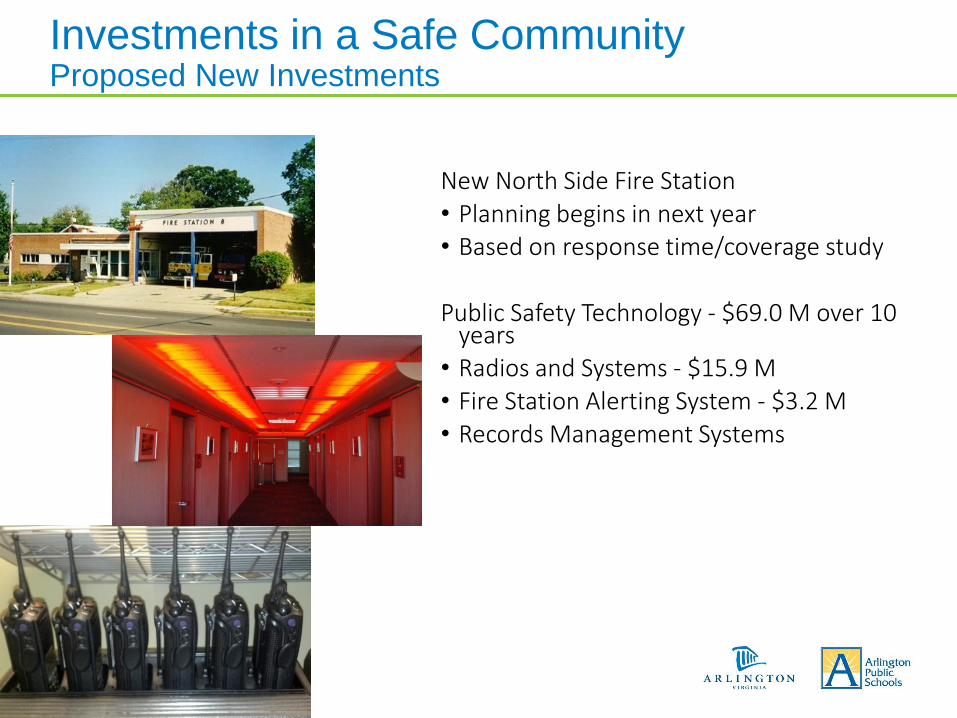
Investments in a Safe CommunityProposed New Investments
New North Side Fire Station • Planning begins in next year• Based on response time/coverage study
Public Safety Technology - $69.0 M over 10 years
• Radios and Systems - $15.9 M• Fire Station Alerting System - $3.2 M• Records Management Systems
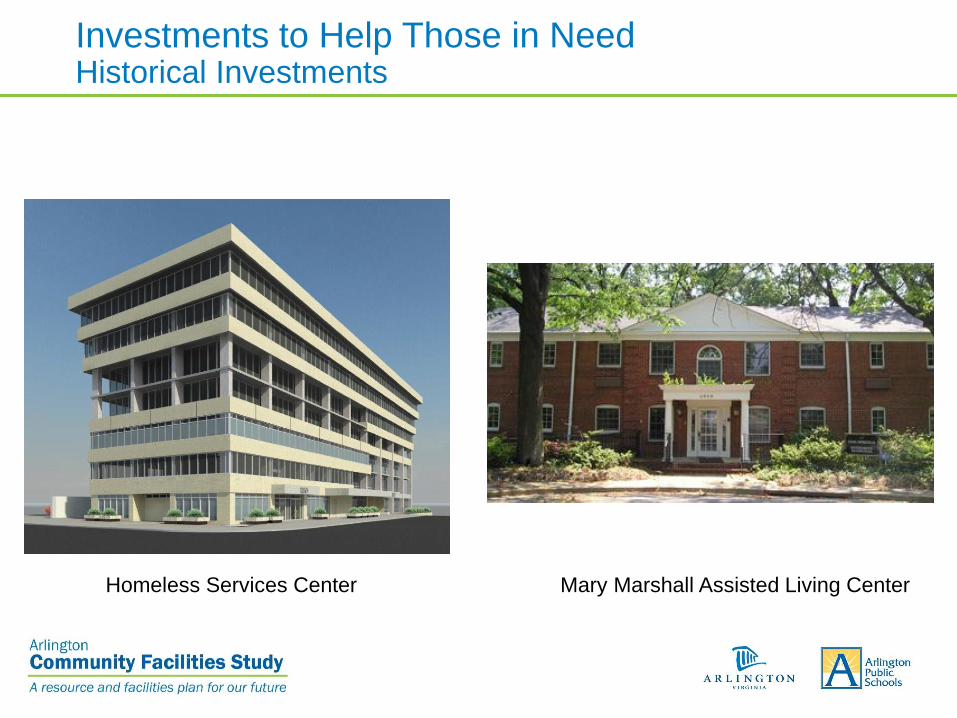
Homeless Services Center Mary Marshall Assisted Living Center
Investments to Help Those in NeedHistorical Investments
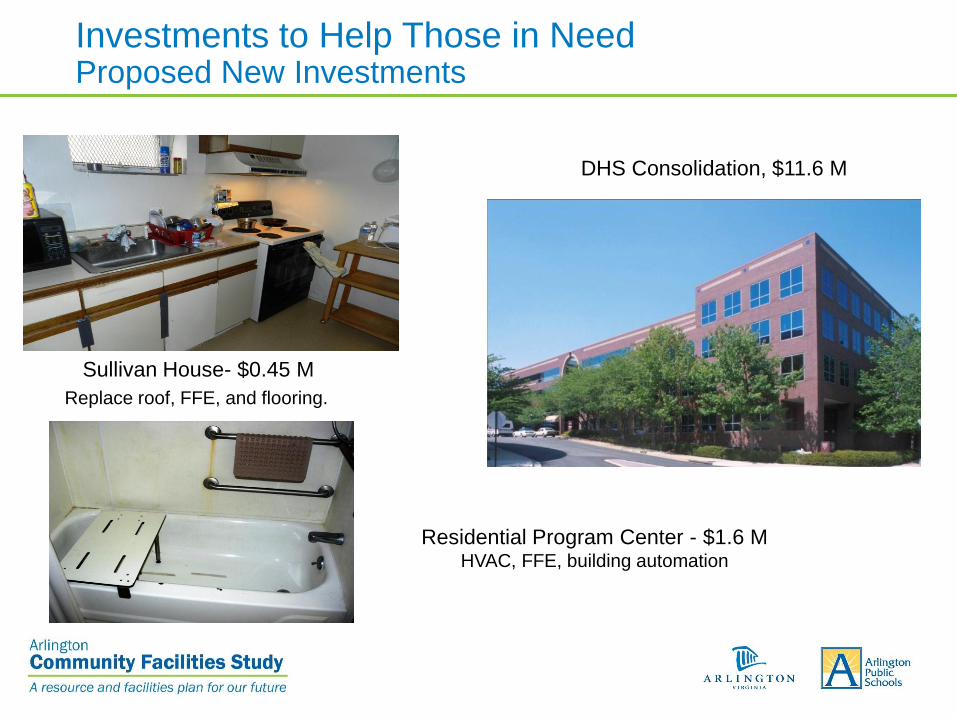
Sullivan House- $0.45 M
Replace roof, FFE, and flooring.
Residential Program Center - $1.6 M HVAC, FFE, building automation
DHS Consolidation, $11.6 M
Investments to Help Those in NeedProposed New Investments
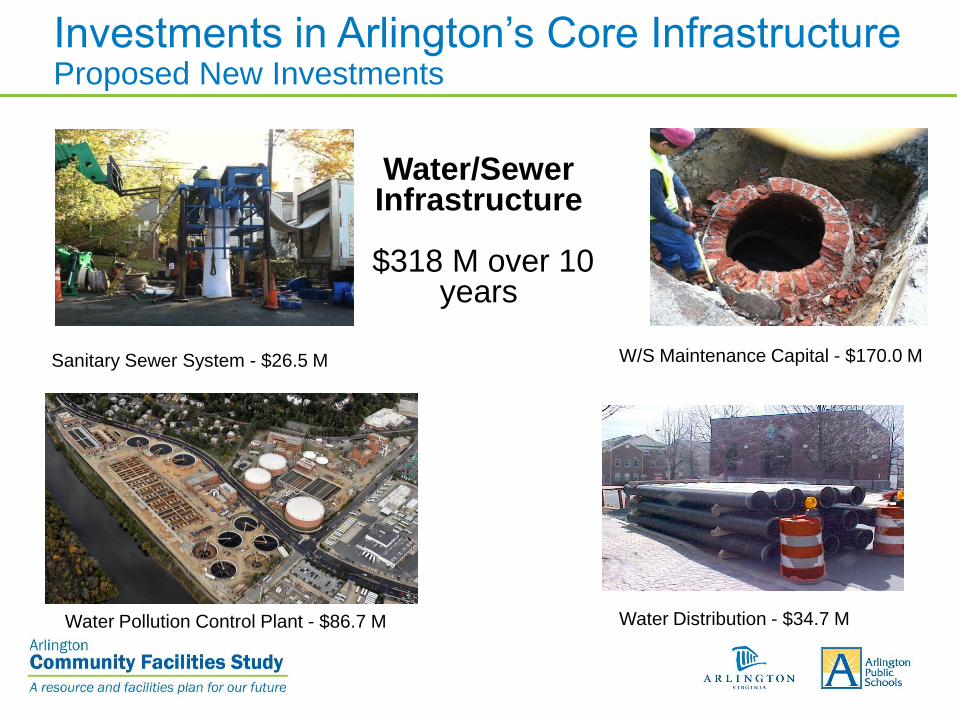
Investments in Arlington’s Core InfrastructureProposed New Investments
Water Distribution - $34.7 M
Water/Sewer Infrastructure
$318 M over 10 years
Water Pollution Control Plant - $86.7 M
W/S Maintenance Capital - $170.0 MSanitary Sewer System - $26.5 M
Investments in Service DeliveryProposed New Investments
Investments in Enterprise IT - $72.2 M over 10 years
• IT infrastructure - $44.7 M • Incl. Wireless Sustainment and Expansion
• System maintenance/improvements – $16.8 M• ACE/CAPP (Payment System)
• Security - $5.5 M
Investments in Operations
• Trades Center parking structure
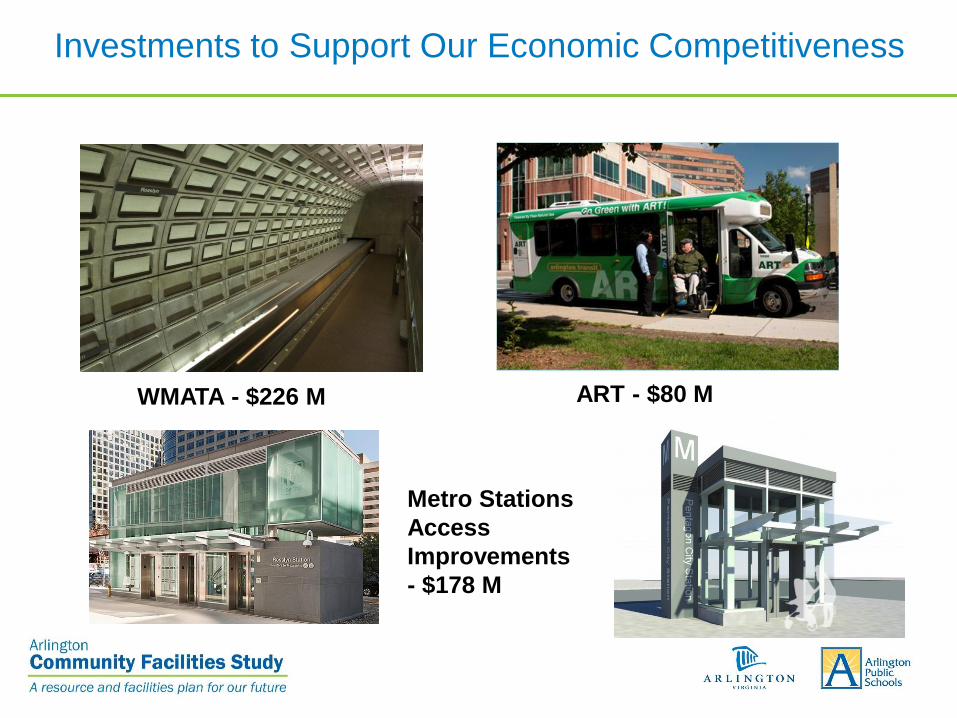
Investments to Support Our Economic Competitiveness
WMATA - $226 M
Metro Stations
Access
Improvements
- $178 M
ART - $80 M
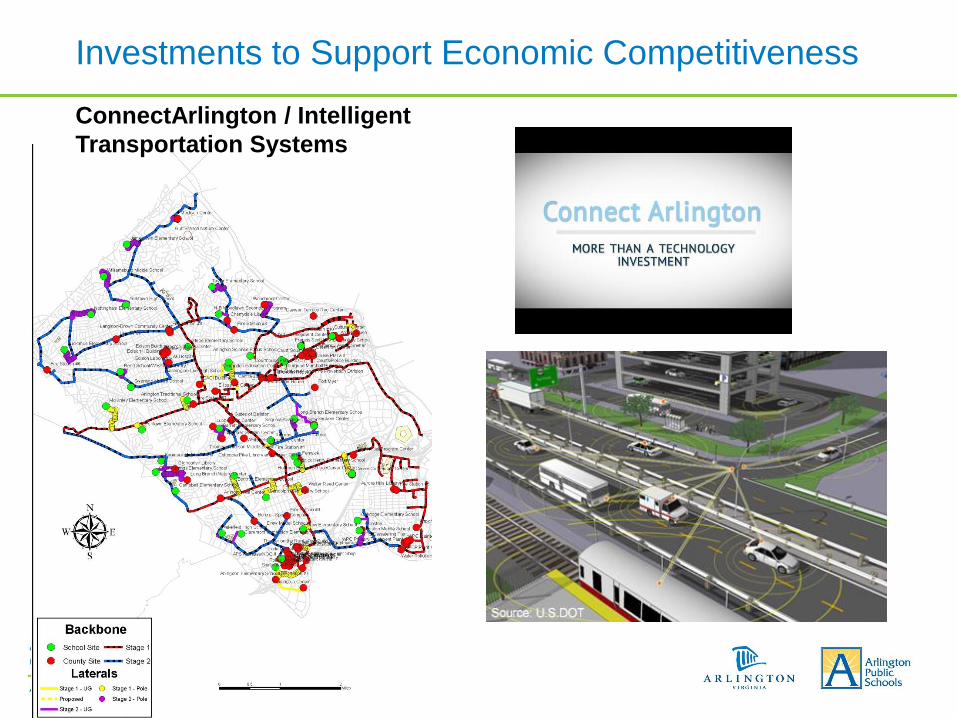
Investments to Support Economic Competitiveness
ConnectArlington / Intelligent
Transportation Systems
How Do We Pay for the CIP?
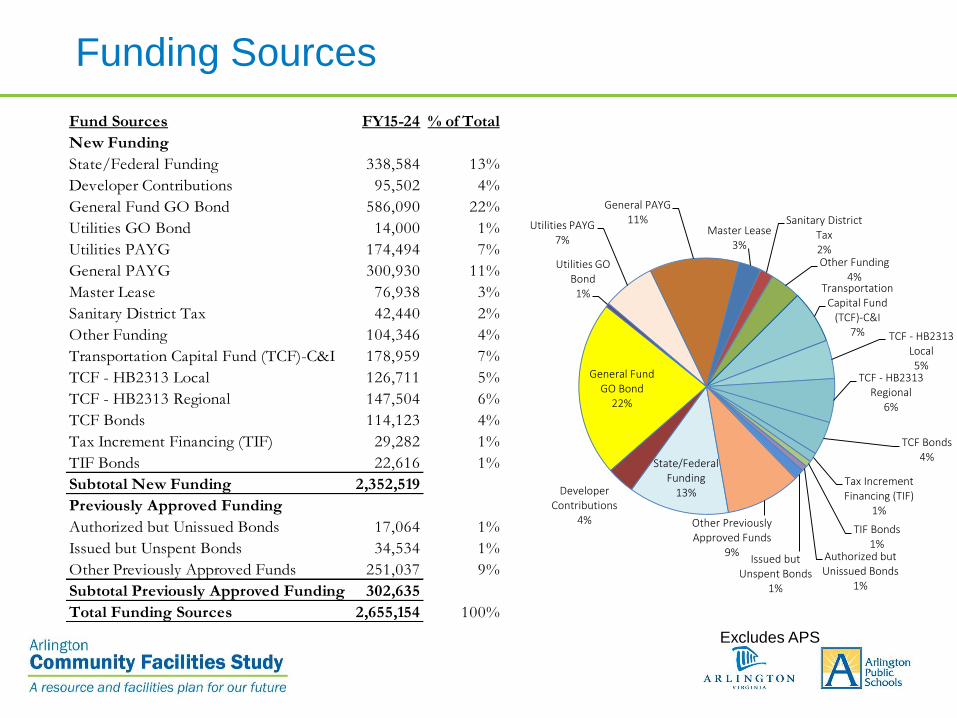
Funding Sources
Fund Sources FY15-24 % of Total
New Funding
State/Federal Funding 338,584 13%
Developer Contributions 95,502 4%
General Fund GO Bond 586,090 22%
Utilities GO Bond 14,000 1%
Utilities PAYG 174,494 7%
General PAYG 300,930 11%
Master Lease 76,938 3%
Sanitary District Tax 42,440 2%
Other Funding 104,346 4%
Transportation Capital Fund (TCF)-C&I 178,959 7%
TCF - HB2313 Local 126,711 5%
TCF - HB2313 Regional 147,504 6%
TCF Bonds 114,123 4%
Tax Increment Financing (TIF) 29,282 1%
TIF Bonds 22,616 1%
Subtotal New Funding 2,352,519
Previously Approved Funding
Authorized but Unissued Bonds 17,064 1%
Issued but Unspent Bonds 34,534 1%
Other Previously Approved Funds 251,037 9%
Subtotal Previously Approved Funding 302,635
Total Funding Sources 2,655,154 100%
State/Federal Funding
13%Developer Contributions
4%
General Fund GO Bond
22%
Utilities GO Bond1%
Utilities PAYG7%
General PAYG11%
Master Lease3%
Sanitary District Tax2%Other Funding
4%Transportation
Capital Fund (TCF)-C&I
7% TCF - HB2313 Local5%
TCF - HB2313 Regional
6%
TCF Bonds4%
Tax Increment Financing (TIF)
1%
TIF Bonds1%
Authorized but Unissued Bonds
1%
Issued but Unspent Bonds
1%
Other Previously Approved Funds
9%
Excludes APS
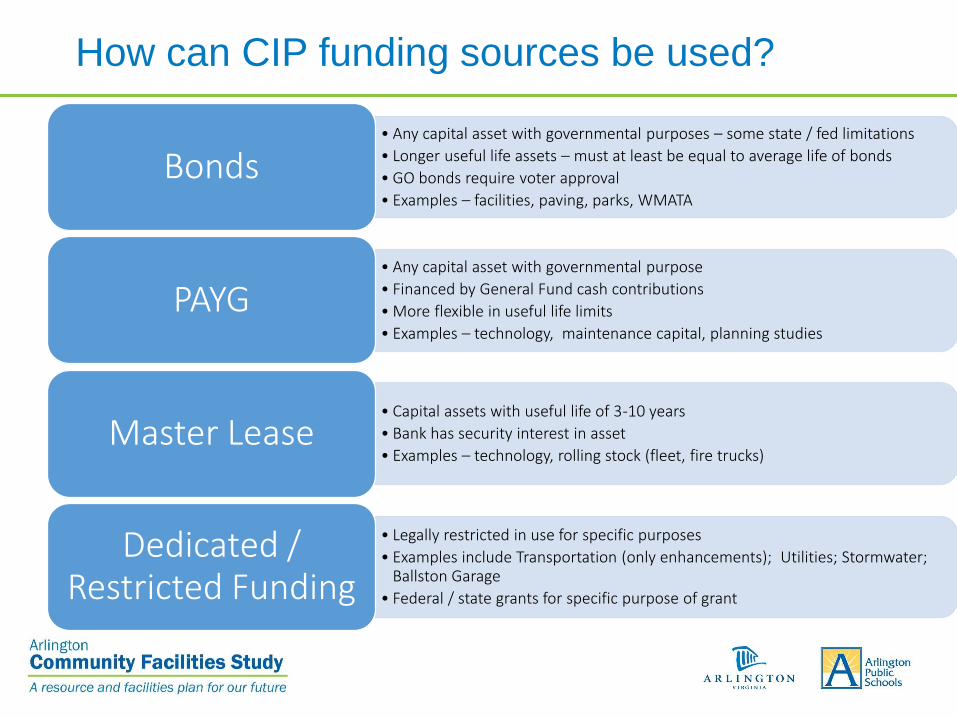
How can CIP funding sources be used?
• Any capital asset with governmental purposes – some state / fed limitations
• Longer useful life assets – must at least be equal to average life of bonds
• GO bonds require voter approval
• Examples – facilities, paving, parks, WMATA
Bonds
• Any capital asset with governmental purpose
• Financed by General Fund cash contributions
• More flexible in useful life limits
• Examples – technology, maintenance capital, planning studies
PAYG
• Capital assets with useful life of 3-10 years
• Bank has security interest in asset
• Examples – technology, rolling stock (fleet, fire trucks)Master Lease
• Legally restricted in use for specific purposes
• Examples include Transportation (only enhancements); Utilities; Stormwater; Ballston Garage
• Federal / state grants for specific purpose of grant
Dedicated / Restricted Funding
ABC’s of General Obligation (GO) Bonds
• Primary financing source used by County for major general government infrastructure
• In Virginia, GO bonds issued by counties require voter approval• Cannot reallocate between referenda questions
• Carry full faith and credit of Arlington County
• Lowest cost of capital available, especially given Arlington’s bond ratings• Generally interest is tax-exempt to the investor
• Arlington’s GO bonds typically have 20 year maturity
• Limited by debt capacity guidelines
Debt Capacity Guidelines & Best Practices
• Formally in place since 2002; re-confirmed by the County Board in July 2014
• Serve as guidance for debt affordability
• Considered best practice in public finance and an essential practice by the bond rating agencies
• County’s debt capacity guidelines are very similar to other triple-Aaa’s in the region and in line with rating agency criteria
• All ratios measure affordability against key “wealth” indicators of the County
• Rating agencies consider County & Schools as “one” for debt capacity & guideline compliance
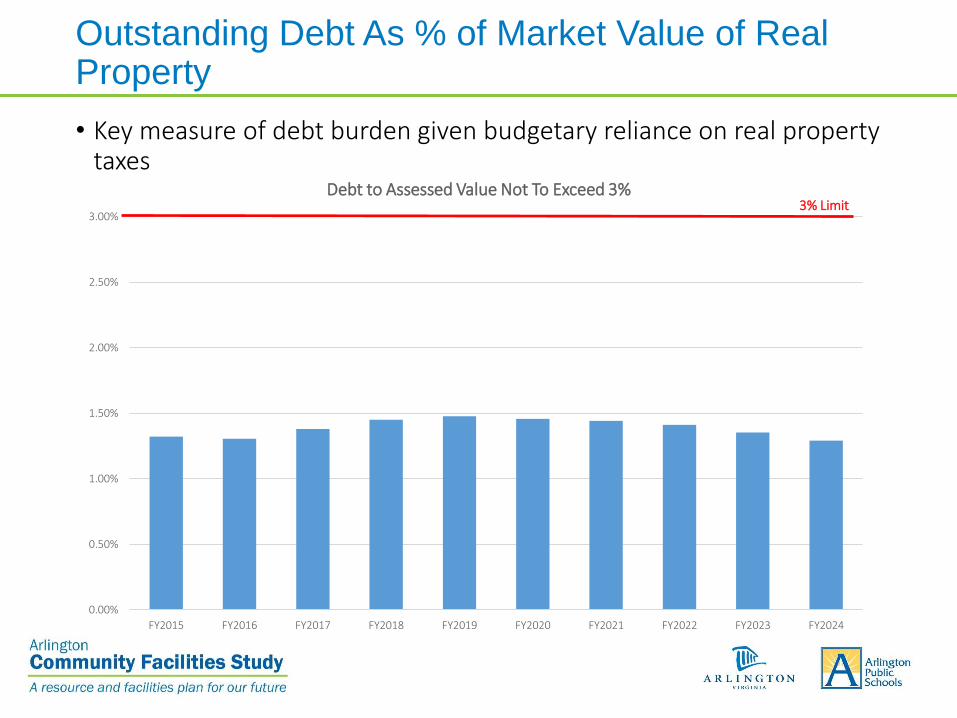
Outstanding Debt As % of Market Value of Real Property
• Key measure of debt burden given budgetary reliance on real property taxes
0.00%
0.50%
1.00%
1.50%
2.00%
2.50%
3.00%
FY2015 FY2016 FY2017 FY2018 FY2019 FY2020 FY2021 FY2022 FY2023 FY2024
Debt to Assessed Value Not To Exceed 3%3% Limit
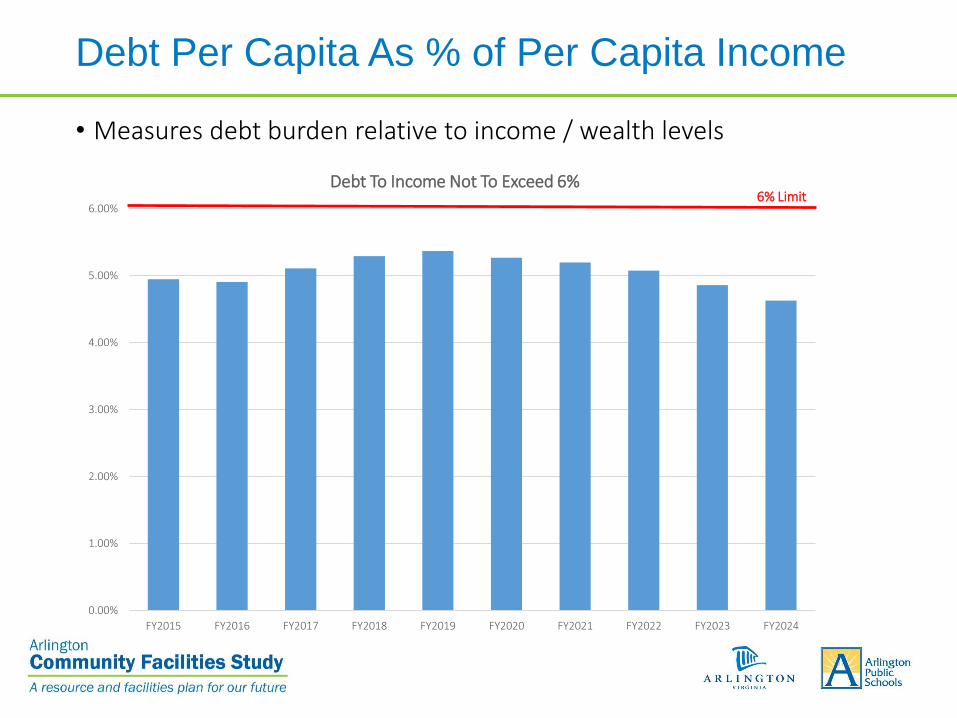
Debt Per Capita As % of Per Capita Income
• Measures debt burden relative to income / wealth levels
0.00%
1.00%
2.00%
3.00%
4.00%
5.00%
6.00%
FY2015 FY2016 FY2017 FY2018 FY2019 FY2020 FY2021 FY2022 FY2023 FY2024
Debt To Income Not To Exceed 6%6% Limit
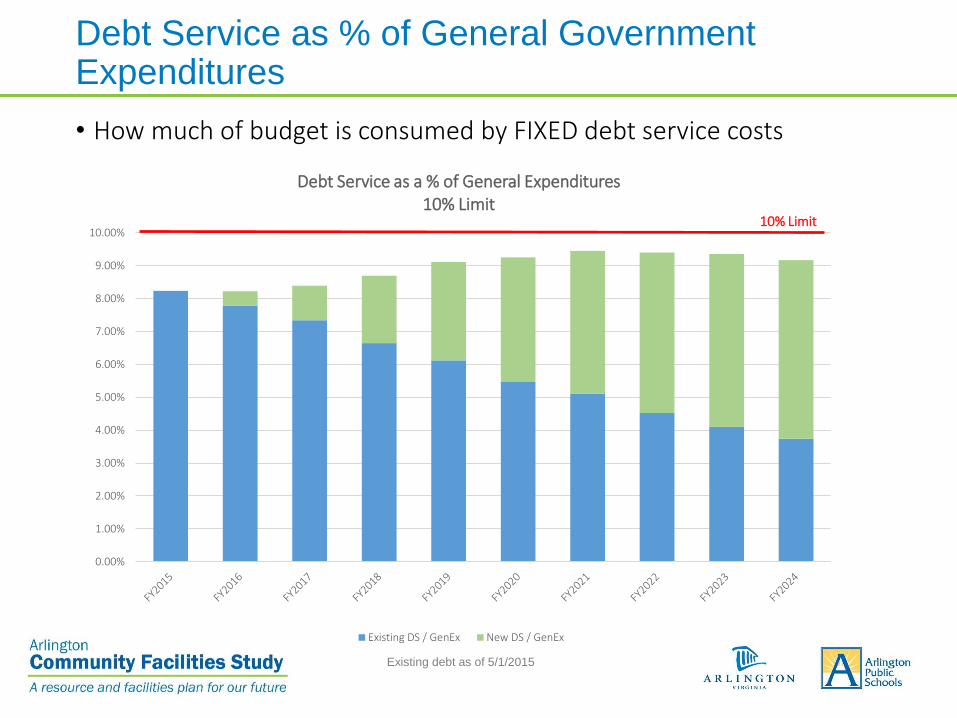
Debt Service as % of General Government Expenditures
• How much of budget is consumed by FIXED debt service costs
0.00%
1.00%
2.00%
3.00%
4.00%
5.00%
6.00%
7.00%
8.00%
9.00%
10.00%
Debt Service as a % of General Expenditures10% Limit
Existing DS / GenEx New DS / GenEx
10% Limit
Existing debt as of 5/1/2015
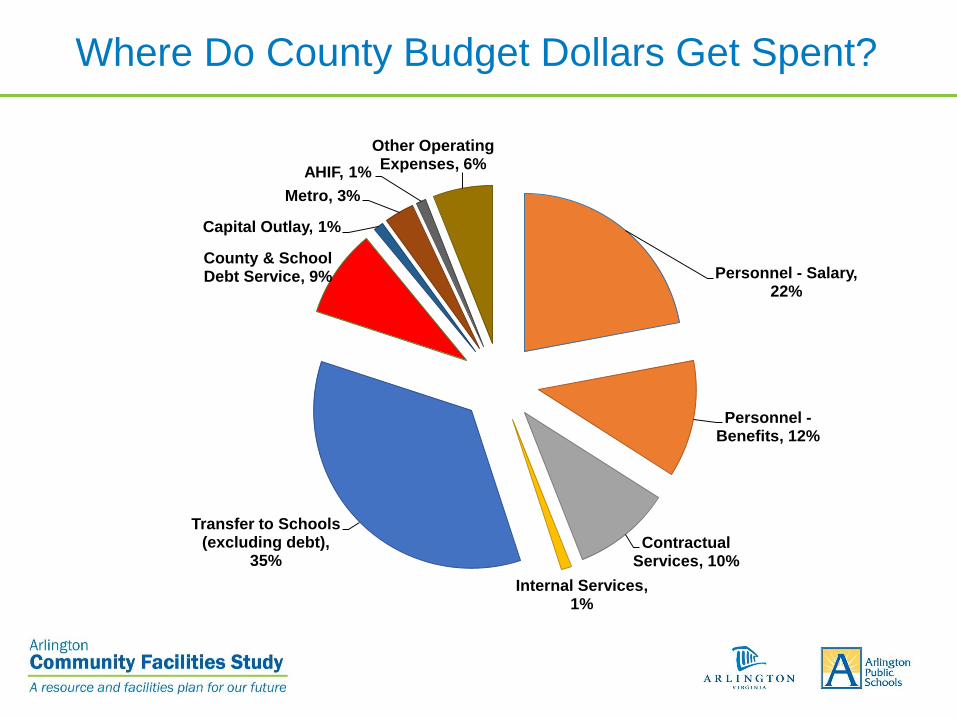
Where Do County Budget Dollars Get Spent?
Personnel - Salary, 22%
Personnel -Benefits, 12%
Contractual Services, 10%
Internal Services, 1%
Transfer to Schools (excluding debt),
35%
County & School Debt Service, 9%
Capital Outlay, 1%
Metro, 3%
AHIF, 1%
Other Operating Expenses, 6%
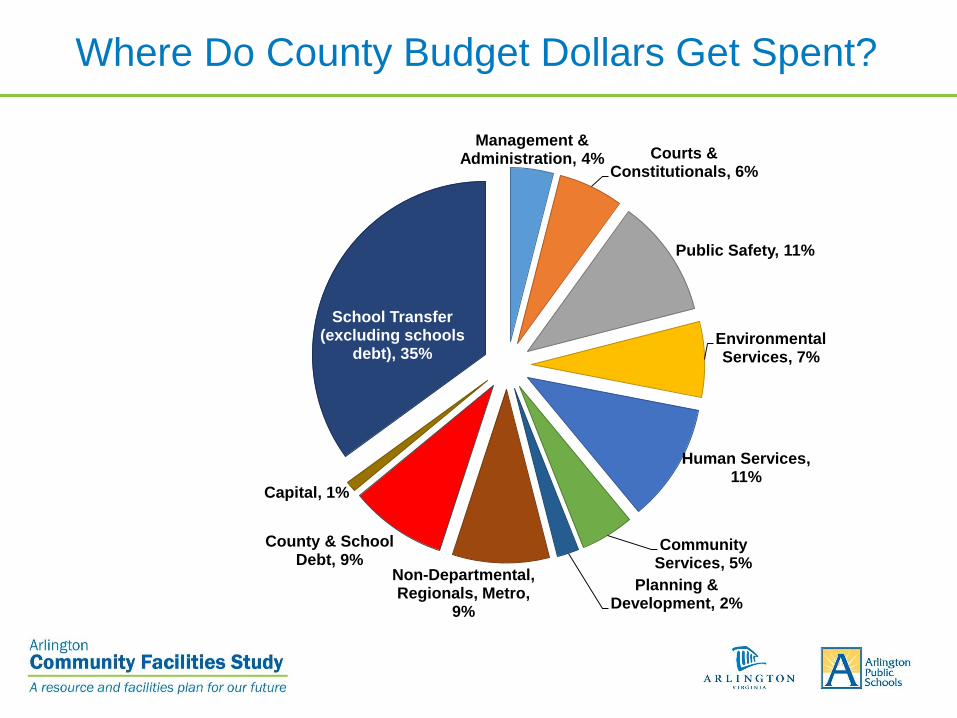
Where Do County Budget Dollars Get Spent?
Management & Administration, 4% Courts &
Constitutionals, 6%
Public Safety, 11%
Environmental Services, 7%
Human Services, 11%
Community Services, 5%
Planning & Development, 2%
Non-Departmental, Regionals, Metro,
9%
County & School Debt, 9%
Capital, 1%
School Transfer (excluding schools
debt), 35%
Future County Budget Pressures In Addition to Debt / Capital Reinvestment
• WMATA’s needs – both operating & capital
• Health care
• Compensation competitiveness
• Impacts of population growth on services
• Specific service delivery needs:• Public safety staffing
• Economic development
• New innovations and services – technology; environmental sustainability
Other Public Finance Best Practices
• Formal debt management policies – in addition to debt affordability measures
• Variable rate debt & derivatives guidance
• Amortization guidance
• Reserve and pension policies
• Multi-year financial plans that integrate CIP, operating impacts of new projects, and other operating budget pressures
• Capital project budget & scope management practices
Other Public Finance Tools
• Revenue Bonds• Lower bond ratings than GO bonds and thus higher interest rates
• Issued for specific projects
• Often require a conduit issuer (Industrial Development Authority, state entity)
• Typically paid for and secured by project revenues (e.g., water-sewer revenues; parking revenues)
• Occasionally County has issued for general government purposes with repayment from General Fund
• Where GO bonds are not permitted or when timing does not allow for referendum
• Will count against debt capacity in this case
• Moral obligation bonds – where County provides credit support to a project
• Tax increment financing & special district tools
CIP Inputs and Process
CIP Process Background
• Biennial process• Aligns with schedule of bond referenda for even-numbered calendar years
which corresponds to the bond sale in odd-number fiscal years.
• Ten year time horizon• Reflects longer-term nature of major infrastructure projects
• Shifted from six year horizon in 2013
• Planning document – can and will change based on changing conditions
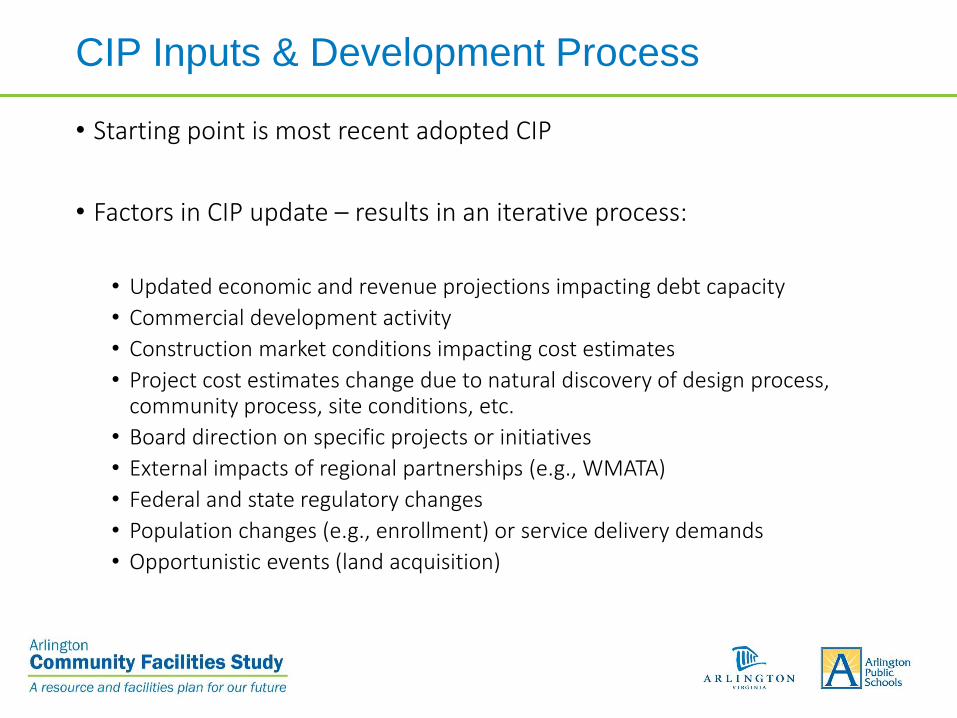
CIP Inputs & Development Process
• Starting point is most recent adopted CIP
• Factors in CIP update – results in an iterative process:
• Updated economic and revenue projections impacting debt capacity
• Commercial development activity
• Construction market conditions impacting cost estimates
• Project cost estimates change due to natural discovery of design process, community process, site conditions, etc.
• Board direction on specific projects or initiatives
• External impacts of regional partnerships (e.g., WMATA)
• Federal and state regulatory changes
• Population changes (e.g., enrollment) or service delivery demands
• Opportunistic events (land acquisition)
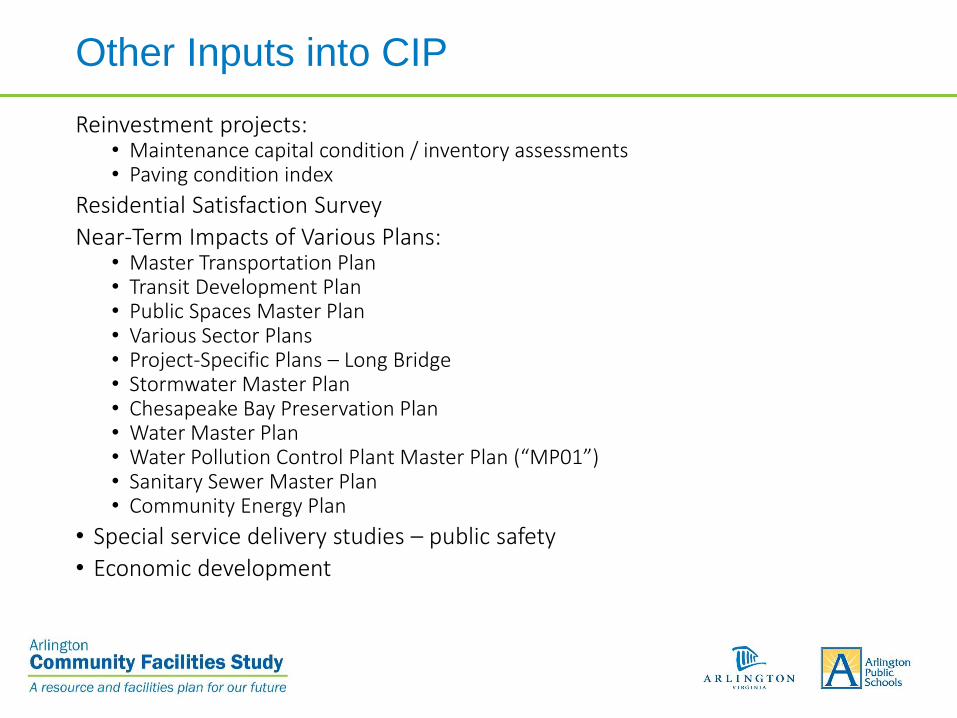
Other Inputs into CIP
Reinvestment projects:• Maintenance capital condition / inventory assessments• Paving condition index
Residential Satisfaction Survey
Near-Term Impacts of Various Plans:• Master Transportation Plan• Transit Development Plan• Public Spaces Master Plan• Various Sector Plans • Project-Specific Plans – Long Bridge• Stormwater Master Plan• Chesapeake Bay Preservation Plan• Water Master Plan• Water Pollution Control Plant Master Plan (“MP01”)• Sanitary Sewer Master Plan• Community Energy Plan
• Special service delivery studies – public safety
• Economic development
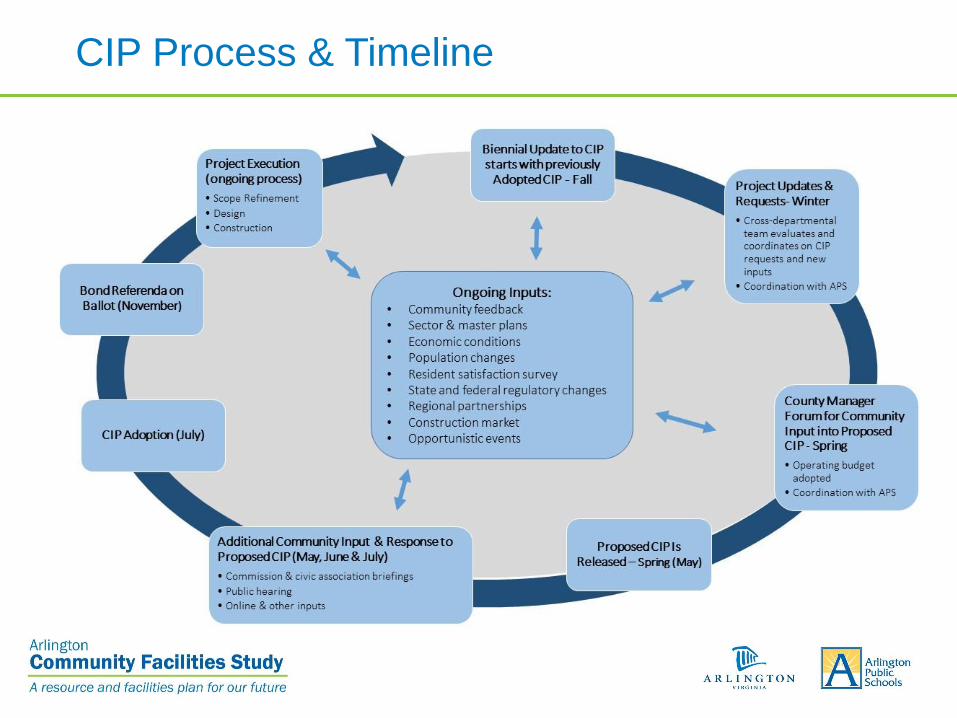
CIP Process & Timeline
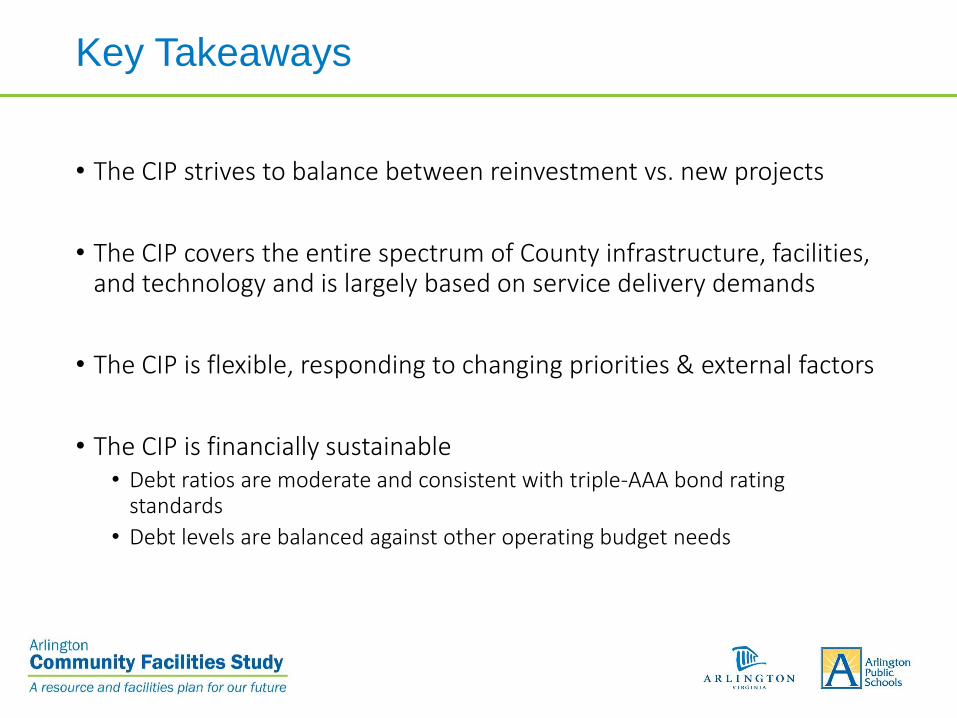
Key Takeaways
• The CIP strives to balance between reinvestment vs. new projects
• The CIP covers the entire spectrum of County infrastructure, facilities, and technology and is largely based on service delivery demands
• The CIP is flexible, responding to changing priorities & external factors
• The CIP is financially sustainable• Debt ratios are moderate and consistent with triple-AAA bond rating
standards
• Debt levels are balanced against other operating budget needs
Questions?