Embed Size (px)
Citation preview
T. Nakano and H. Kubo Japan Atomic Energy Agency
Acknowledge to J. Yanagibayashi at Kyoto Univ.
A. Sasaki at JAEA
Measurement of W44+ and W45+ density ratio in JT-60U
2P3/2
W45+ :3d104s
W46+ :3d10
2P1/2 (2.24 eV) 電離
励起
(電子衝突)
(イオン衝突)
自然放出
=
!
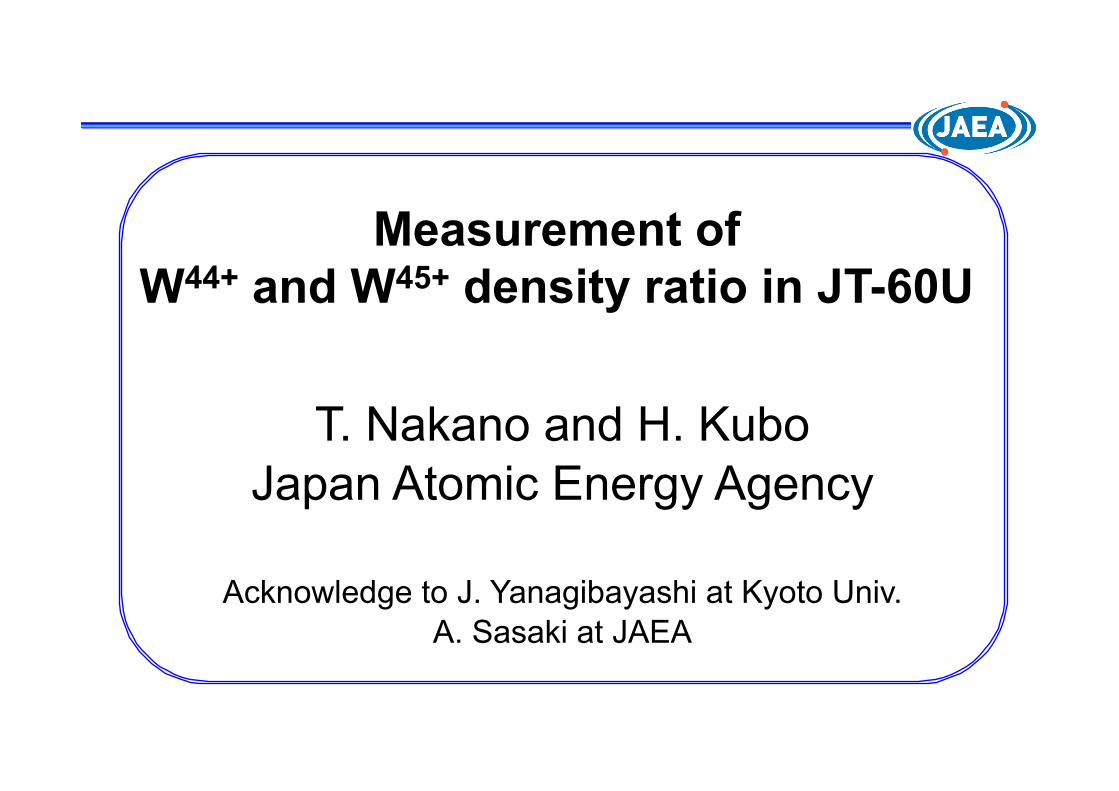
AFDnD + Fene + A + neS1/ 2
nDCD + neCe( )nAr9+ + neSenAr8+[ ]
!
"1/ 2#3 / 2
A=1
03 s
-1
F D
CD
F e
Ce
Se
S1/
2
FD CD Fe Ce
Se
S1/2
Colonal model is valid
10-19
10-18
10-17
10-16
10-15
10-14
Ra
te c
oeffic
ient (
m3 / s
)
103
104
Te ( eV )
Ionization: W45+
(4p) -> W46+
Excitation: W45+
(4p) -> n=4 or n=5
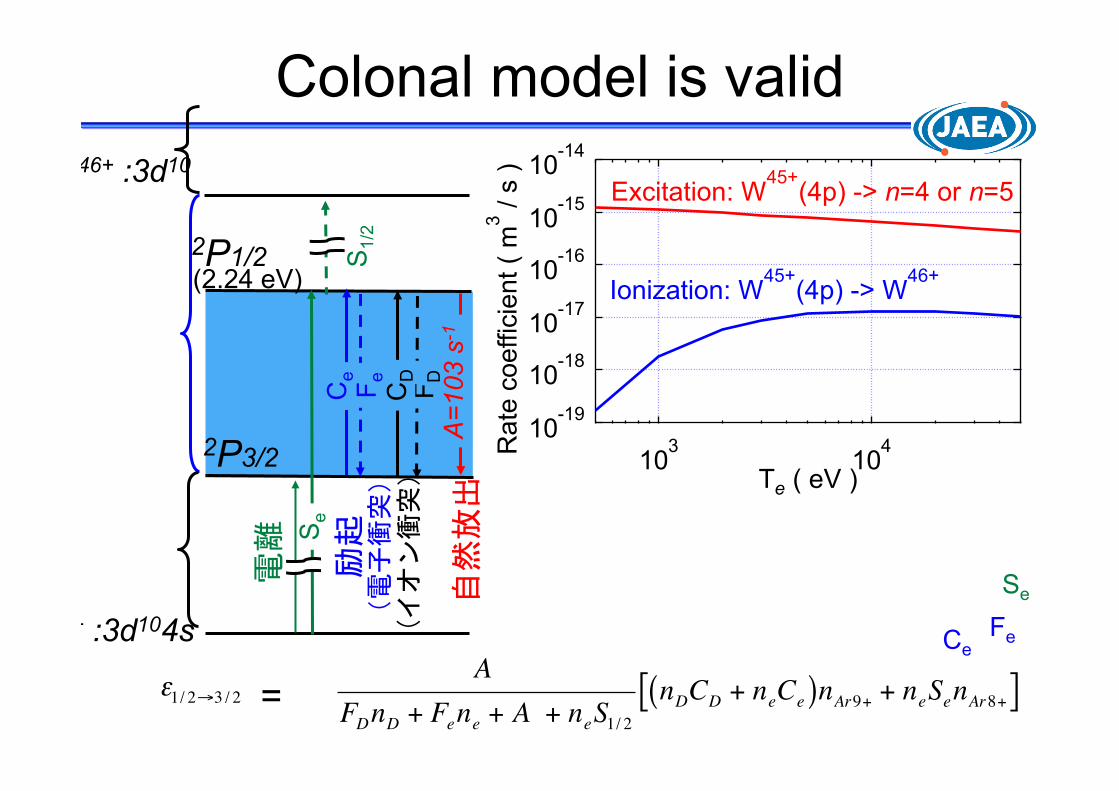
Tungsten as a plasma-facing component Merit : high melting point => compatible with high temp. plasma
: low hydrogen (T) retention => safety, economy : low sputtering yield => long lifetime
Demerit : high Z (74) => highly radiative( allowable nW/ne < 10-5) => accumulation in the core plasma*)
Highly charged W ions from a view point of atomic physics Atomic structure, CI, QED, ,,, Interface between atomic physics and fusion research spectral data ( wavelength, A coeff. ) W density collisional data (ioniz./recomb coeff.) ( W charge state distribution )
ITER
W
*) T. Nakano et al., Nucl. Fusion 49 (2009) 115024.
High temp. plasma of JT-60U ( > 10 keV ) can produce highly charged W ions ( > 60+). Studies of atomic physics are possible, contributing to plasma physics.
Introduction: Atomic Physics and Fusion Research
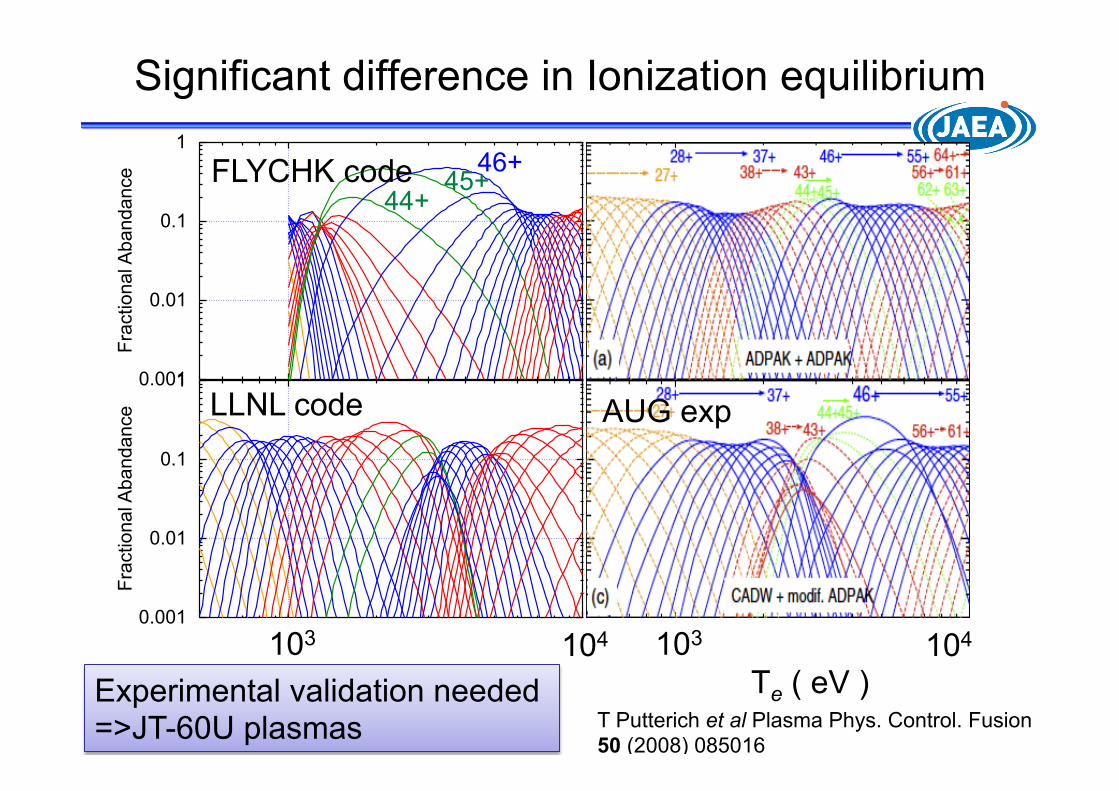
Significant difference in Ionization equilibrium
0.001
0.01
0.1
1F
ractio
na
l A
ba
nd
an
ce
0.001
0.01
0.1
1
Fra
ctio
na
l Ab
an
da
nce
103
104
Te ( eV ) Te ( eV ) Te ( eV )
103 104 103 104
FLYCHK code
LLNL code
T Putterich et al Plasma Phys. Control. Fusion 50 (2008) 085016
Experimental validation needed =>JT-60U plasmas
44+ 45+
46+
AUG exp
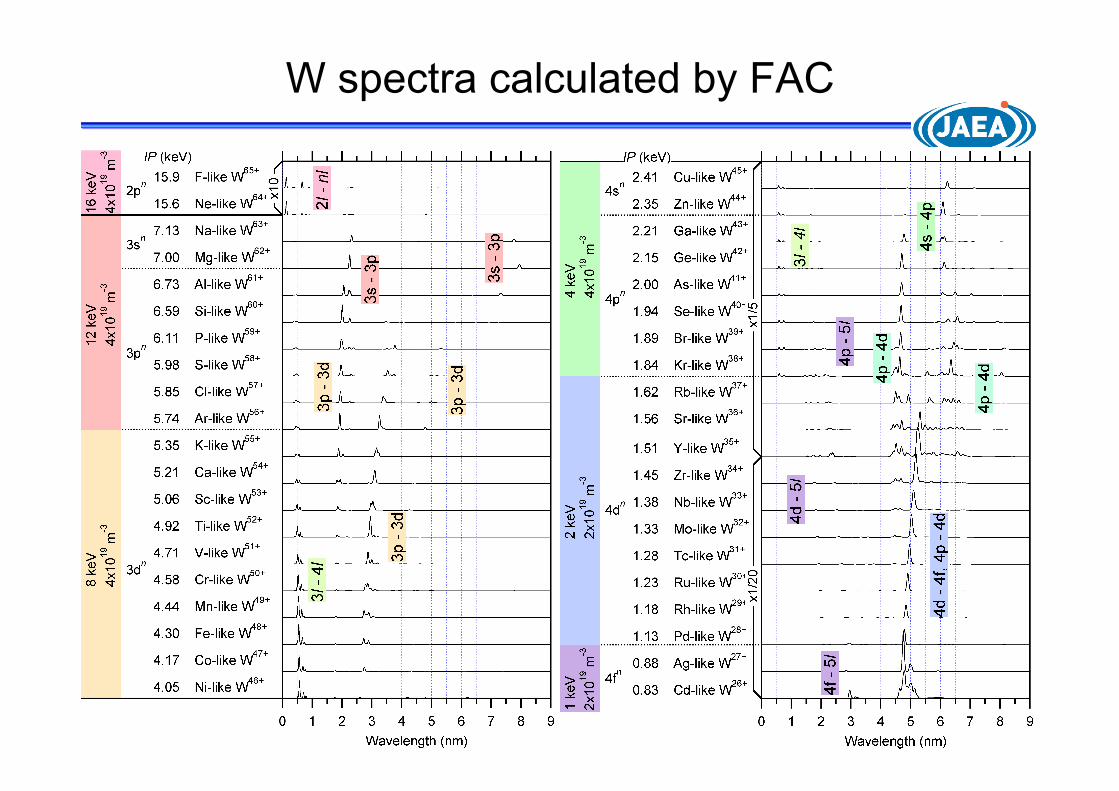
W spectra calculated by FAC
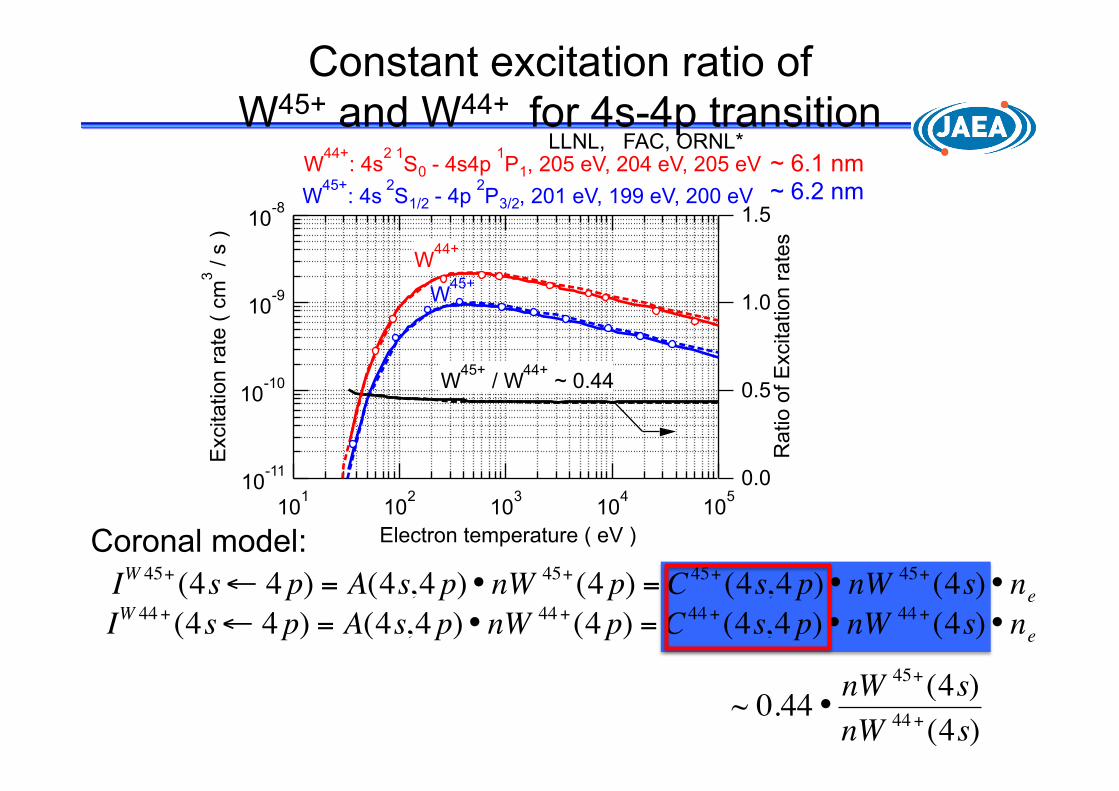
Constant excitation ratio of W45+ and W44+ for 4s-4p transition
!
IW 44+(4s" 4 p) = A(4s,4 p)• nW 44+(4 p) = C44+(4s,4 p)• nW 44+(4s)• ne
!
IW 45+(4s" 4 p) = A(4s,4 p)• nW 45+(4 p) = C45+(4s,4 p)• nW 45+(4s)• ne
!
~ 0.44 •nW 45+(4s)nW 44+(4s)
Coronal model:
~ 6.1 nm ~ 6.2 nm
10-11
10-10
10-9
10-8
Excitation r
ate
( c
m3 / s
)
101
102
103
104
105
Electron temperature ( eV )
1.5
1.0
0.5
0.0
Ra
tio o
f E
xcitation r
ate
s
W44+
: 4s2 1
S0 - 4s4p 1P1, 205 eV, 204 eV, 205 eV
W45+
: 4s 2
S1/2 - 4p 2P3/2, 201 eV, 199 eV, 200 eV
W44+
W45+
W45+
/ W44+
~ 0.44
LLNL, FAC, ORNL*
10-11
10-10
10-9
10-8
Excitation r
ate
( c
m3 / s
)
101
102
103
104
105
Electron temperature ( eV )
1.5
1.0
0.5
0.0
Ratio o
f E
xcitation r
ate
s
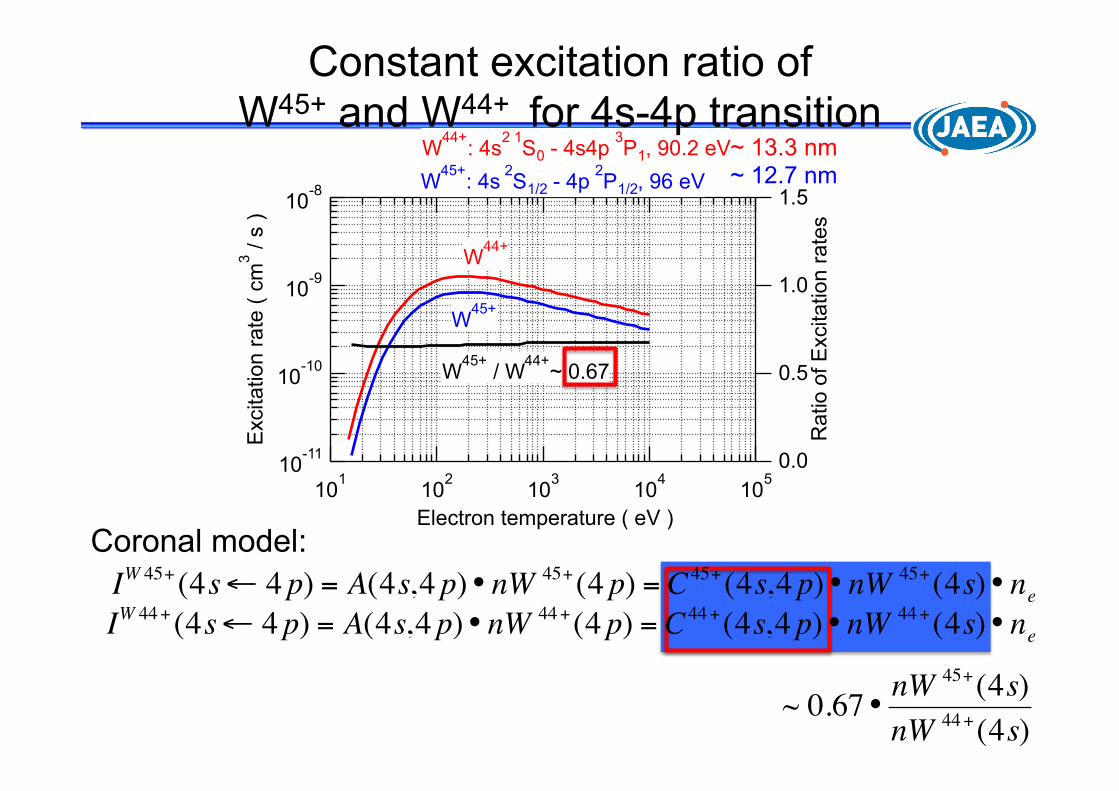
W44+
: 4s2 1
S0 - 4s4p 3P1, 90.2 eV
W45+
: 4s 2
S1/2 - 4p 2P1/2, 96 eV
W44+
W45+
W45+
/ W44+
~ 0.67
Constant excitation ratio of W45+ and W44+ for 4s-4p transition
!
IW 44+(4s" 4 p) = A(4s,4 p)• nW 44+(4 p) = C44+(4s,4 p)• nW 44+(4s)• ne
!
IW 45+(4s" 4 p) = A(4s,4 p)• nW 45+(4 p) = C45+(4s,4 p)• nW 45+(4s)• ne
!
~ 0.67•nW 45+(4s)nW 44+(4s)
Coronal model:
~ 13.3 nm ~ 12.7 nm
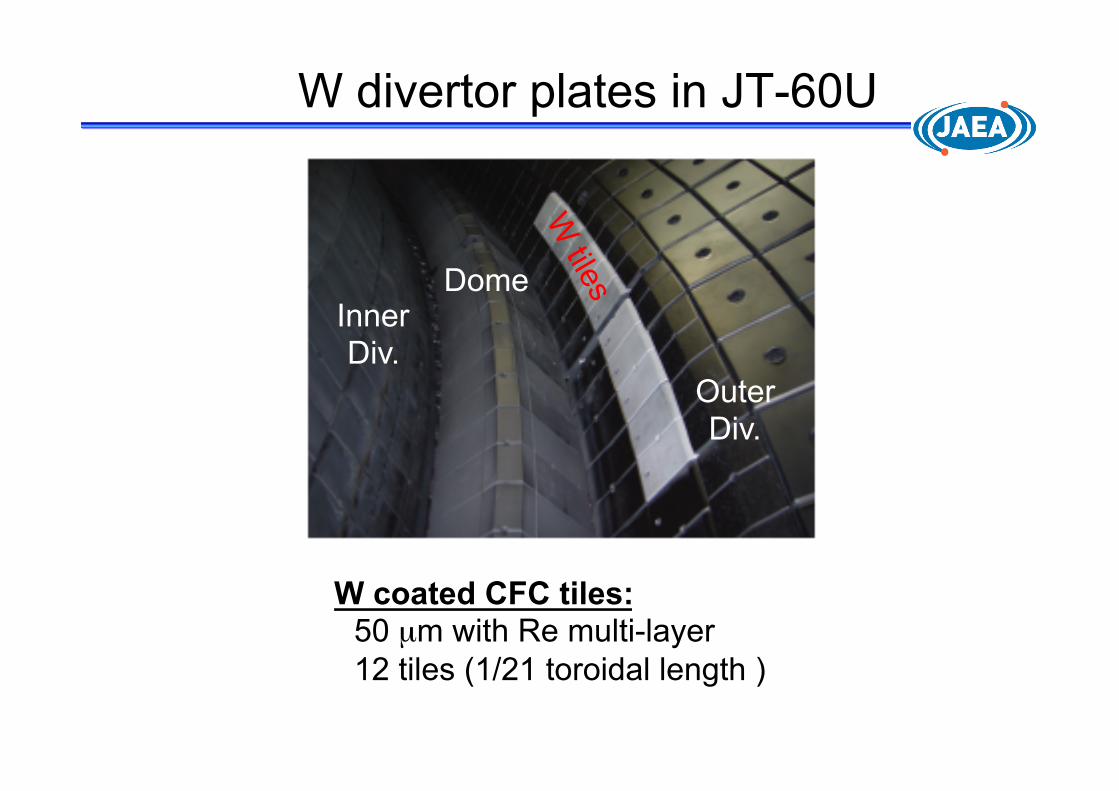
W divertor plates in JT-60U
W coated CFC tiles: 50 µm with Re multi-layer 12 tiles (1/21 toroidal length )
Dome Inner Div.
Outer Div.
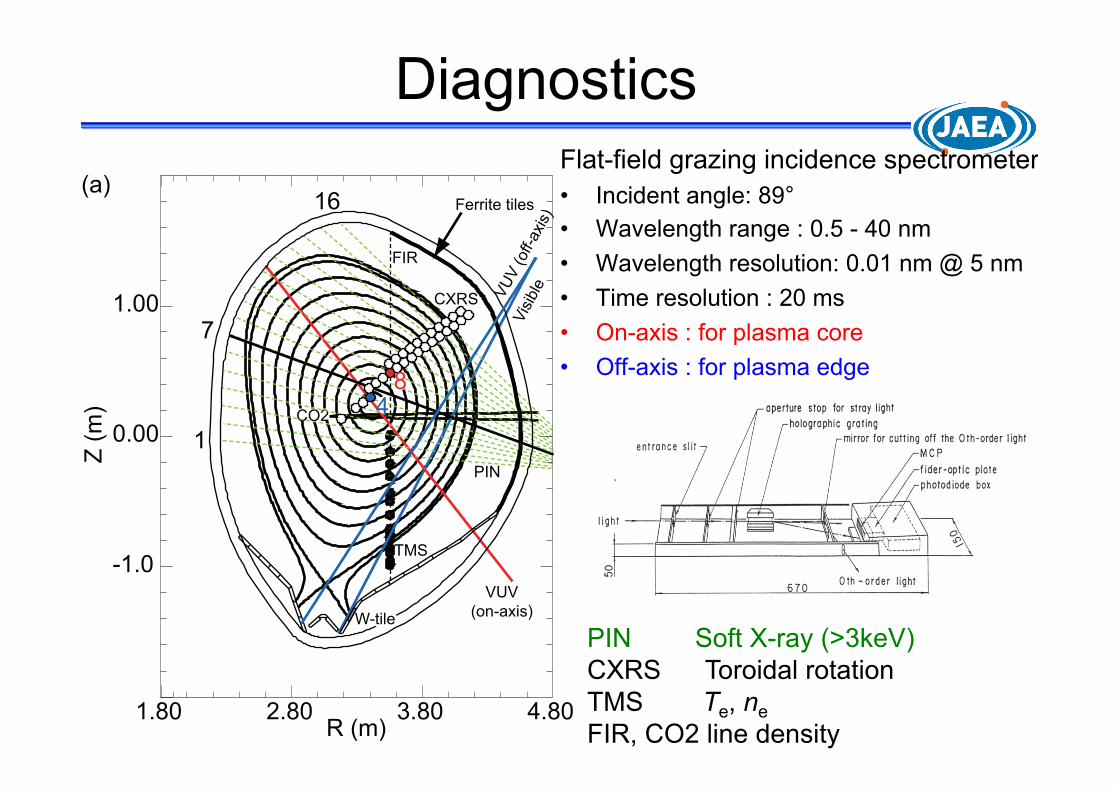
Diagnostics Flat-field grazing incidence spectrometer • Incident angle: 89° • Wavelength range : 0.5 - 40 nm • Wavelength resolution: 0.01 nm @ 5 nm • Time resolution : 20 ms • On-axis : for plasma core • Off-axis : for plasma edge
TMS
CO2
FIR
Visib
le
VUV(on-axis)
VUV
(off-
axis)
16
7
1PIN
48
CXRS
1.80 2.80 3.80 4.80R (m)
-1.0
0.00
1.00
Z (m
)
W-tile
(a)Ferrite tiles
PIN Soft X-ray (>3keV) CXRS Toroidal rotation TMS Te, ne FIR, CO2 line density
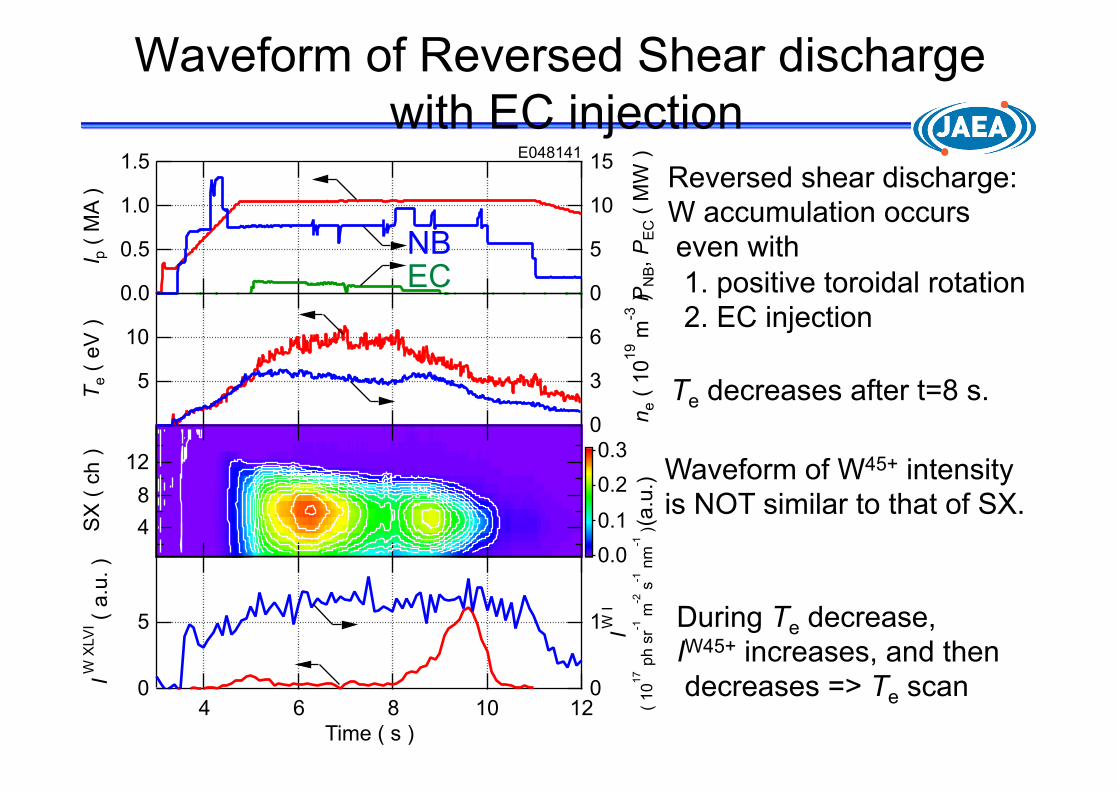
Waveform of Reversed Shear discharge with EC injection
1.5
1.0
0.5
0.0
I p (
MA
)
15
10
5
0 PN
B, P
EC (
MW
)E048141
12
8
4SX
( c
h ) 0.3
0.2
0.1
0.0
(a.u
.)
10
5
Te (
eV
)
6
3
0 ne (
10
19 m
-3 )
5
0
I W
XLV
I ( a
.u. )
1210864
Time ( s )
1
0
I W I
( 1
017 p
h s
r-1 m
-2 s
-1 n
m-1
)
EC NB
Reversed shear discharge: W accumulation occurs even with 1. positive toroidal rotation 2. EC injection
Te decreases after t=8 s.
Waveform of W45+ intensity is NOT similar to that of SX.
During Te decrease, IW45+ increases, and then decreases => Te scan
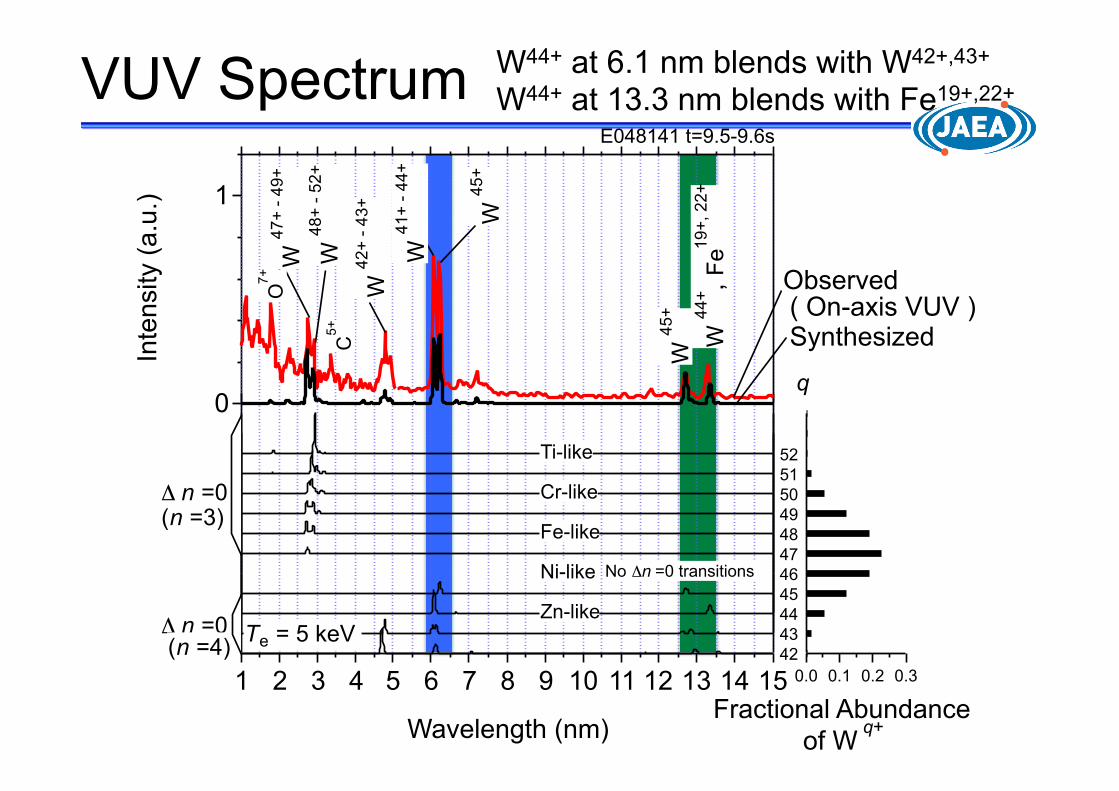
VUV Spectrum
1
0
Inte
nsity (
a.u
.)
151413121110987654321
Wavelength (nm)
0.30.20.10.0
Fractional Abundance
52
51
50
49
48
47
46
45
44
43
42
Ti-like
Cr-like
Fe-like
Zn-like
q
W 4
7+
- 4
9+
W 4
8+
- 5
2+
W 4
5+
W 4
1+
- 4
4+
W 4
2+
- 4
3+
Te = 5 keV
! n =0
! n =0
of W q+
Observed
Synthesized
(n =4)
(n =3)
E048141 t=9.5-9.6s
O7+
C5+
( On-axis VUV )
Ni-like No !n =0 transitions
W 4
5+
W 4
4+,
Fe
19+
, 2
2+
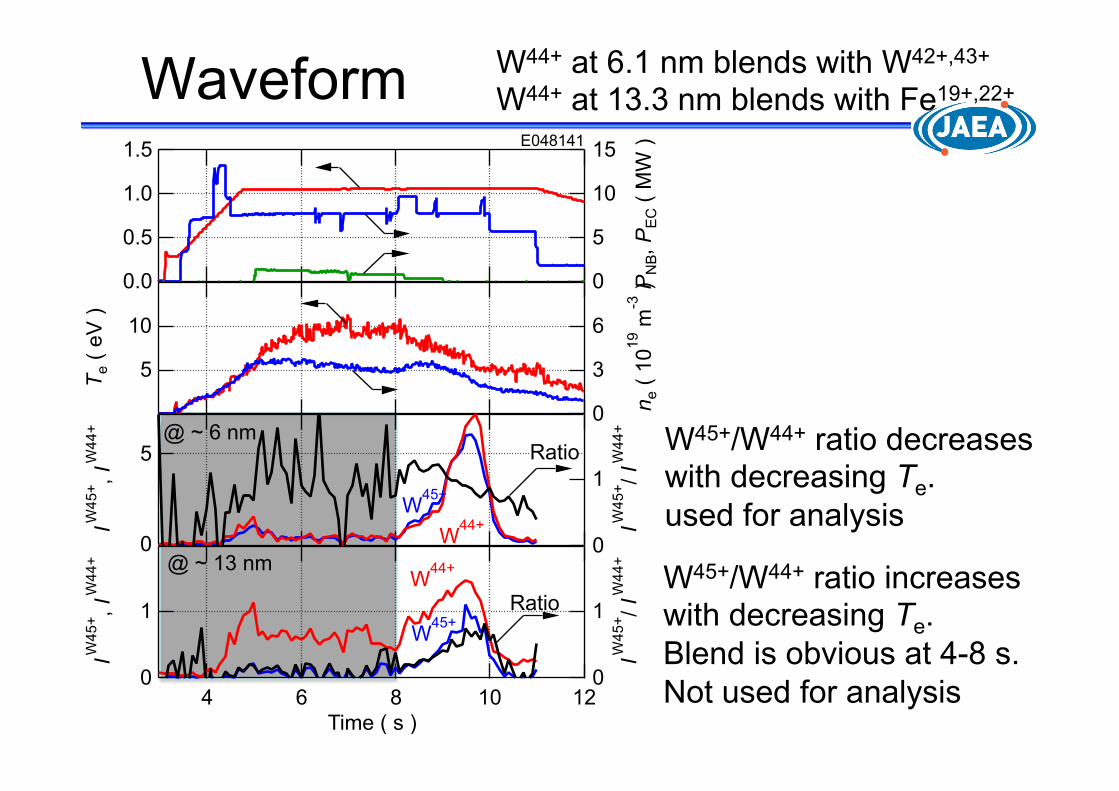
W44+ at 6.1 nm blends with W42+,43+
W44+ at 13.3 nm blends with Fe19+,22+
1.5
1.0
0.5
0.0
I p ( M
A )
15
10
5
0 PN
B, P
EC (
MW
)E048141
Waveform
W45+/W44+ ratio increases with decreasing Te. Blend is obvious at 4-8 s. Not used for analysis
W45+/W44+ ratio decreases with decreasing Te. used for analysis
10
5T e (
eV ) 6
3
0 n e (
1019
m-3
)
5
0
I W45
+ , I W
44+
1
0
I W45
+ / I W
44+
W44+W45+
Ratio @ ~ 6 nm
1
0
I W45
+ , I W
44+
1210864Time ( s )
1
0
I W45
+ / I W
44+
W44+
W45+Ratio
@ ~ 13 nm
W44+ at 6.1 nm blends with W42+,43+
W44+ at 13.3 nm blends with Fe19+,22+
0.001
2
4
0.01
2
4
0.1
2
4
1
W4
4+, W
45
+ fra
ctio
nal A
bandance
103
2 3 4 5 6 7 8 9
104
Electron temperature ( eV )
0.1
1
10
100R
el d
ensity r
atio (
W45
+ / W
44
+ )
LLNL
FLYCHK
ASDEX-U
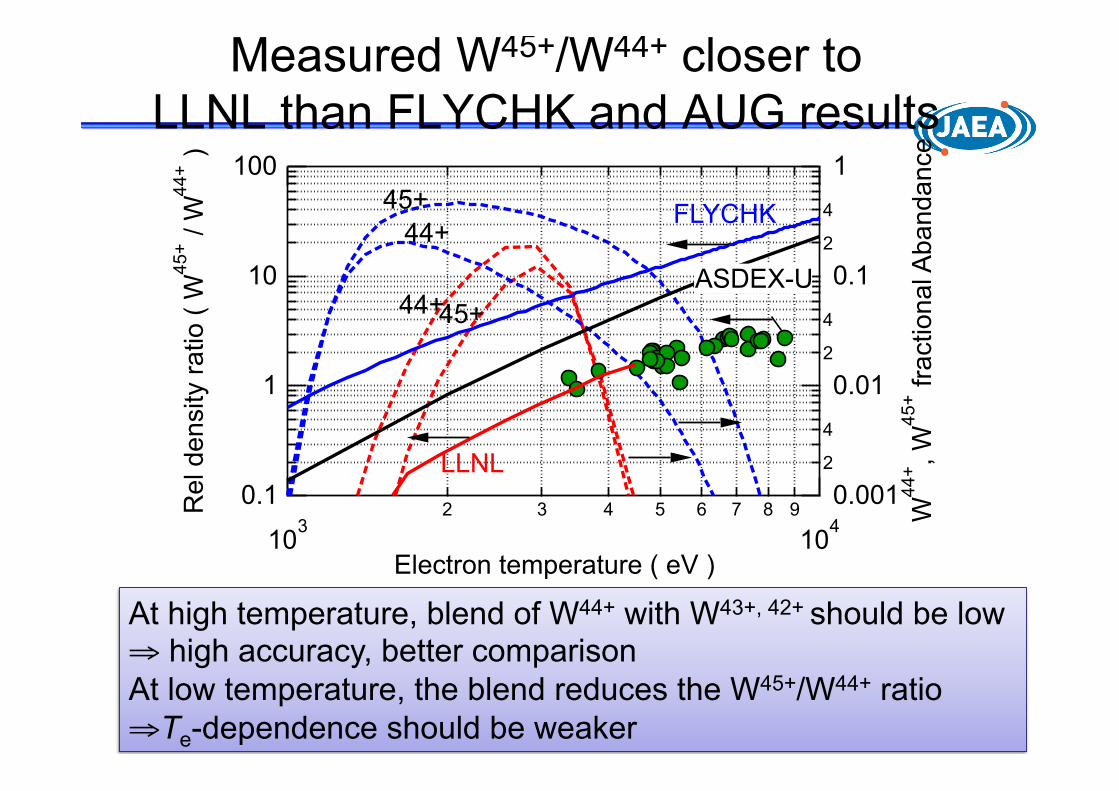
Measured W45+/W44+ closer to LLNL than FLYCHK and AUG results
At high temperature, blend of W44+ with W43+, 42+ should be low ⇒ high accuracy, better comparison At low temperature, the blend reduces the W45+/W44+ ratio ⇒ Te-dependence should be weaker
44+ 45+
45+ 44+
103
2 3 4 5 6 7 8 9
104
Electron temperature ( eV )
0.1
1
10
100R
el d
ensity r
atio (
W45
+ / W
44
+ )
LLNL
FLYCHK
ASDEX-U
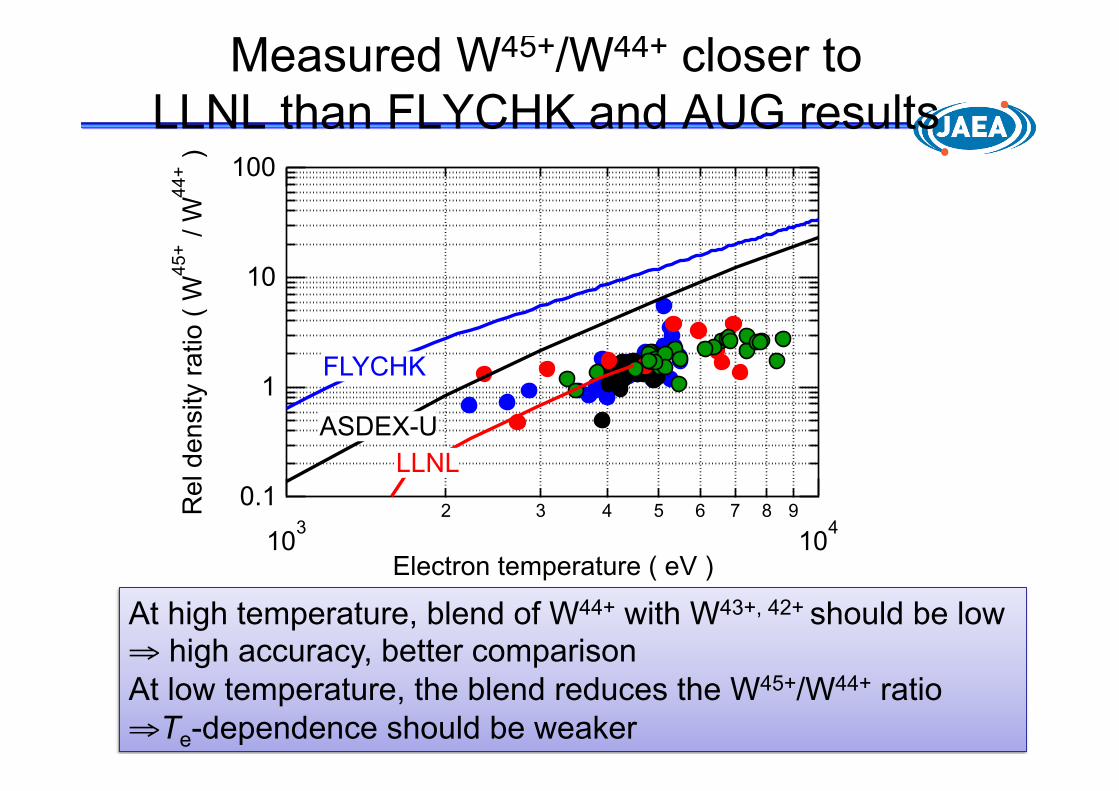
Measured W45+/W44+ closer to LLNL than FLYCHK and AUG results
At high temperature, blend of W44+ with W43+, 42+ should be low ⇒ high accuracy, better comparison At low temperature, the blend reduces the W45+/W44+ ratio ⇒ Te-dependence should be weaker
70
60
50
40
Mean Ion C
harg
e
2015105
Te ( 103 eV )
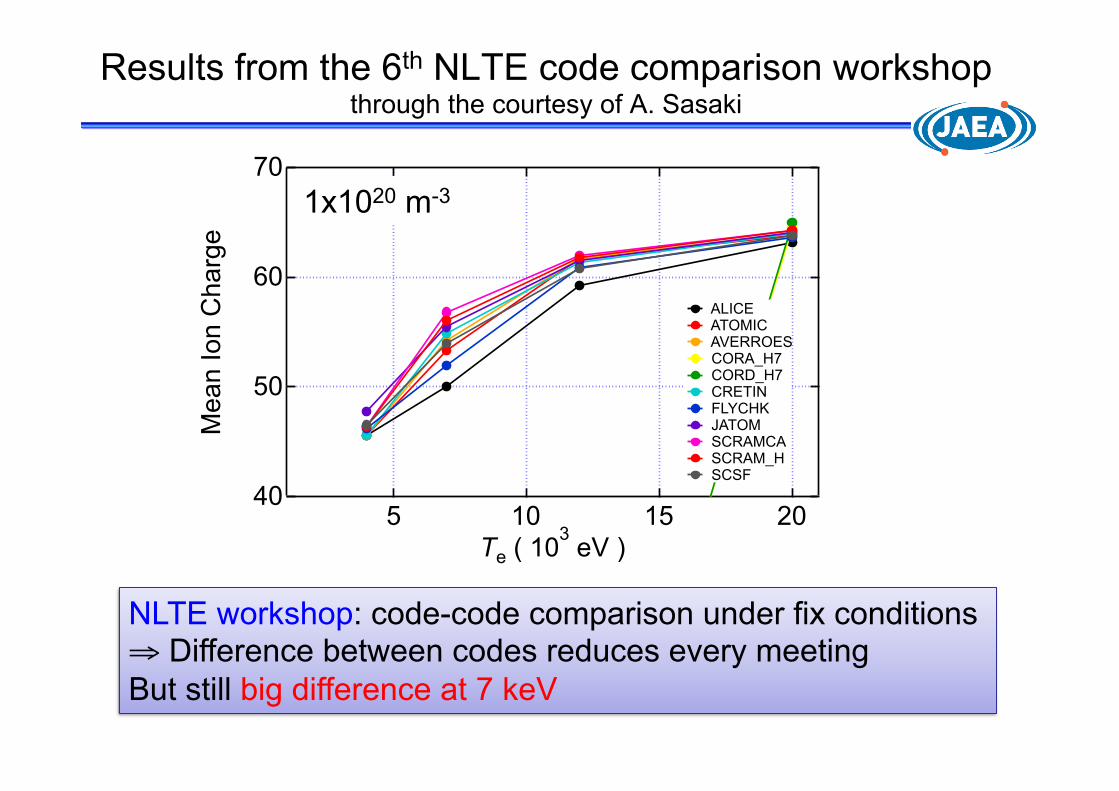
ALICE ATOMIC AVERROES CORA_H7 CORD_H7 CRETIN FLYCHK JATOM SCRAMCA SCRAM_H SCSF
Results from the 6th NLTE code comparison workshop through the courtesy of A. Sasaki
NLTE workshop: code-code comparison under fix conditions ⇒ Difference between codes reduces every meeting But still big difference at 7 keV
1x10²⁰ m-3
103
2 3 4 5 6 7 8 9
104
Electron temperature ( eV )
0.1
1
10
100R
el d
ensity r
atio (
W45
+ / W
44
+ )
LLNL
FLYCHK
ASDEX-U
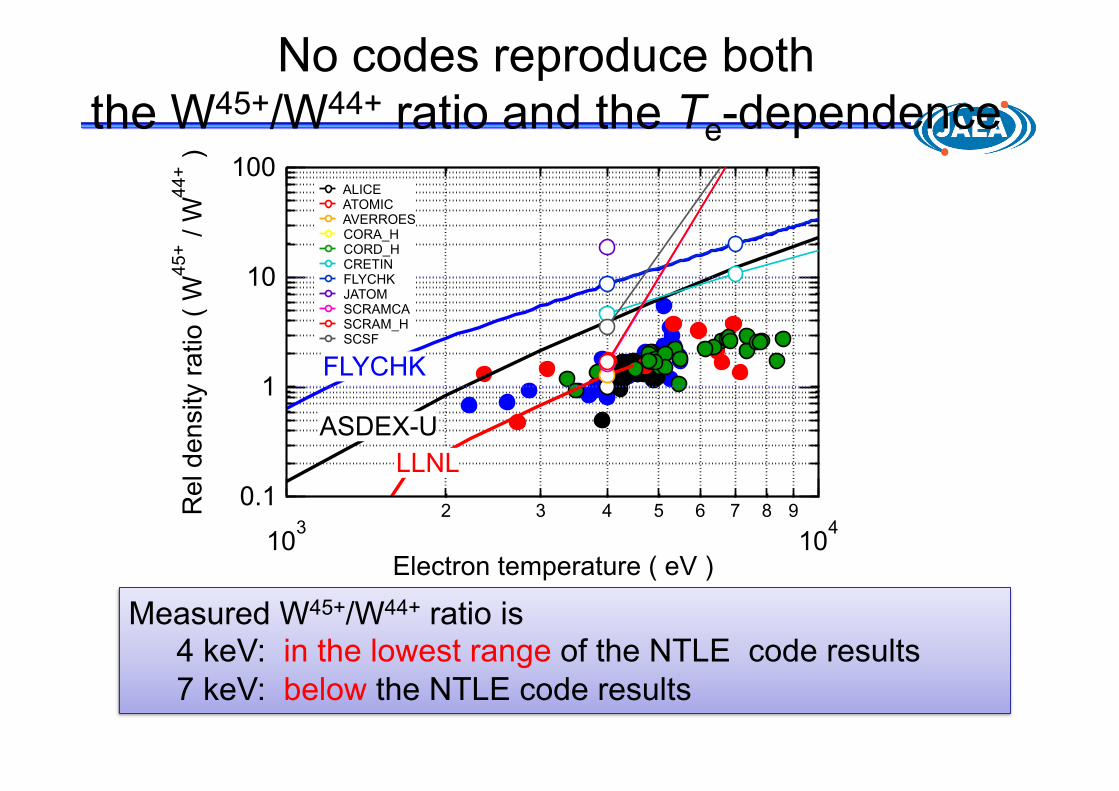
No codes reproduce both the W45+/W44+ ratio and the Te-dependence
Measured W45+/W44+ ratio is 4 keV: in the lowest range of the NTLE code results 7 keV: below the NTLE code results
ALICE ATOMIC AVERROES CORA_H CORD_H CRETIN FLYCHK JATOM SCRAMCA SCRAM_H SCSF
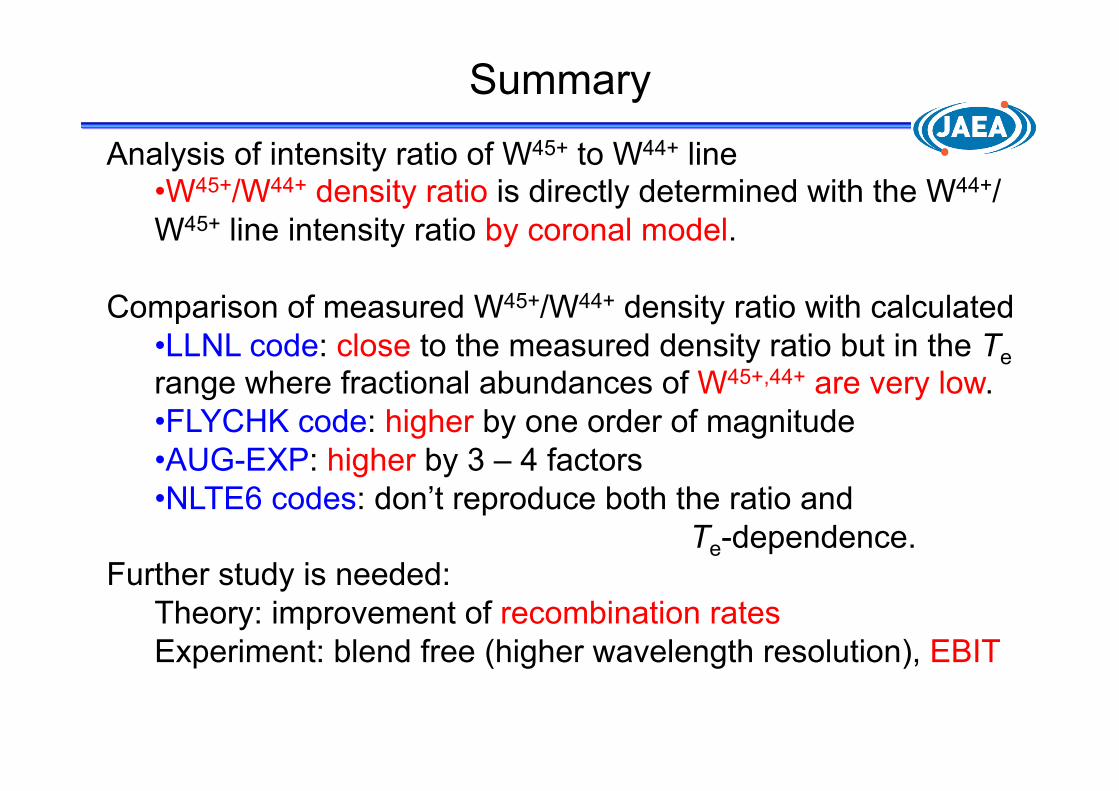
Summary
Analysis of intensity ratio of W45+ to W44+ line • W45+/W44+ density ratio is directly determined with the W44+/W45+ line intensity ratio by coronal model.
Comparison of measured W45+/W44+ density ratio with calculated • LLNL code: close to the measured density ratio but in the Te range where fractional abundances of W45+,44+ are very low. • FLYCHK code: higher by one order of magnitude • AUG-EXP: higher by 3 – 4 factors • NLTE6 codes: don’t reproduce both the ratio and
Te-dependence. Further study is needed:
Theory: improvement of recombination rates Experiment: blend free (higher wavelength resolution), EBIT
Thank you!
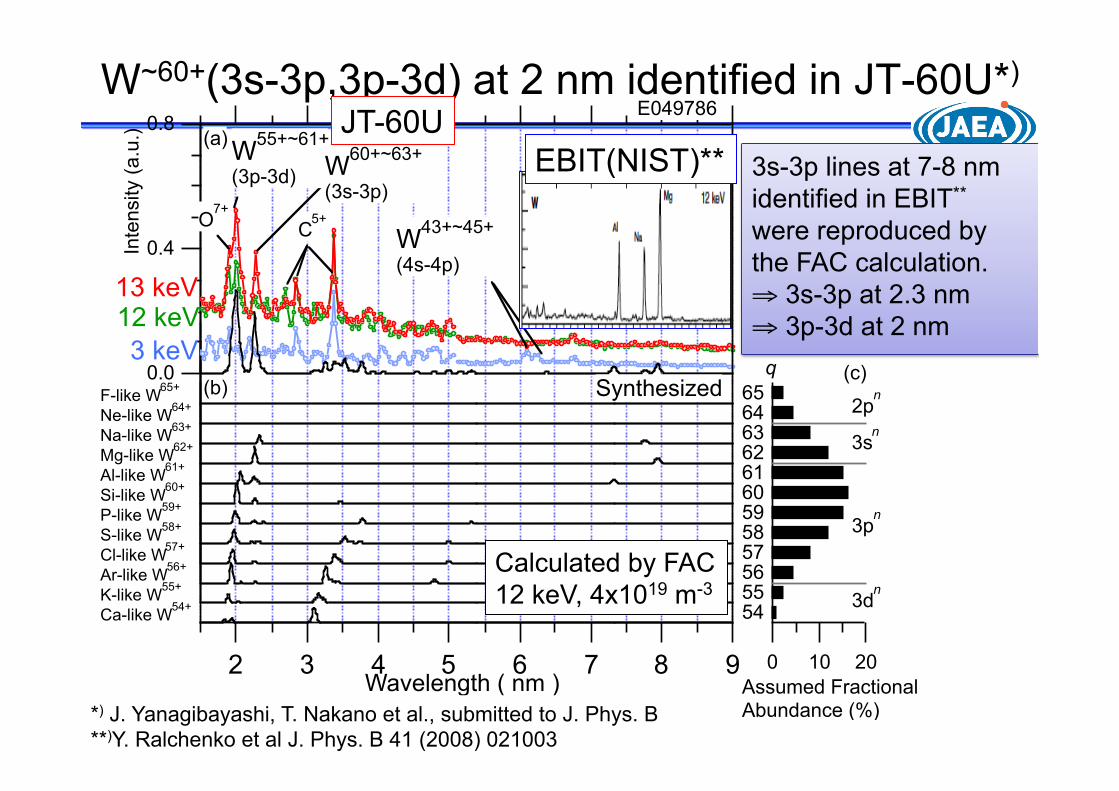
W~60+(3s-3p,3p-3d) at 2 nm identified in JT-60U*)
0.8
0.4
0.0
Inte
nsity
(a.u
.)
98765432Wavelength (nm)
20100
656463626160595857565554
F-like W65+
Ne-like W64+
Na-like W63+
Mg-like W62+
Al-like W61+
Si-like W60+
P-like W59+
S-like W58+
Cl-like W57+
Ar-like W56+
K-like W55+
Ca-like W54+
E049786
q Synthesized
C5+O
7+
W55+~61+
(3p-3d) W60+~63+
(3s-3p)
W43+~45+
(4s-4p)
2pn
3sn
3pn
3dn
(a)
(b)
Assumed FractionalAbundance (%)
(c)3 keV
12 keV13 keV
Calculated by FAC 12 keV, 4x10¹⁹ m-3
JT-60U
Wavelength ( nm ) *) J. Yanagibayashi, T. Nakano et al., submitted to J. Phys. B **)Y. Ralchenko et al J. Phys. B 41 (2008) 021003
EBIT(NIST)** 3s-3p lines at 7-8 nm identified in EBIT** were reproduced by the FAC calculation. ⇒ 3s-3p at 2.3 nm ⇒ 3p-3d at 2 nm
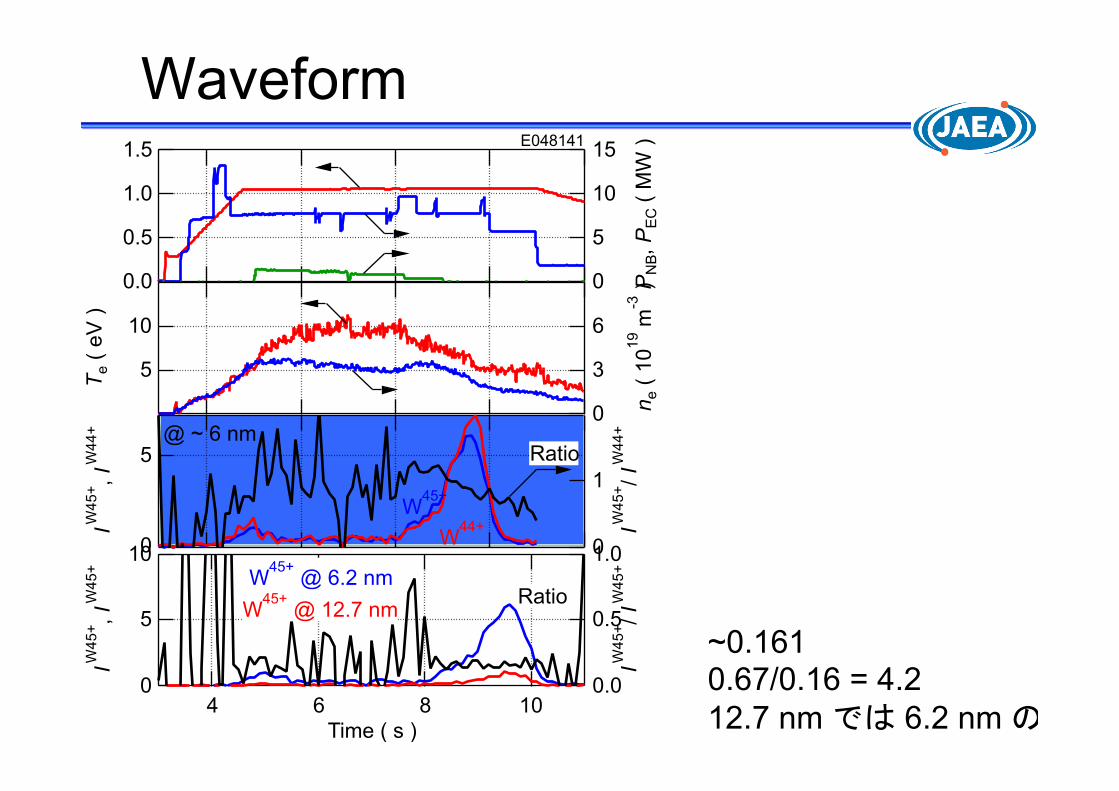
1.5
1.0
0.5
0.0
I p ( M
A )
15
10
5
0 PN
B, P
EC (
MW
)E048141
Waveform
10
5T e (
eV ) 6
3
0 n e (
1019
m-3
)
5
0
I W45
+ , I W
44+
1
0
I W45
+ / I W
44+
W44+W45+
Ratio @ ~ 6 nm
10
5
0
I W45+, I W
45+
10864
Time ( s )
1.0
0.5
0.0
I W45
+/ I W
45+
W45+
@ 6.2 nm
W45+
@ 12.7 nmRatio
~0.161 0.67/0.16 = 4.2 12.7 nm では 6.2 nm の感度の1/4.2と概算される
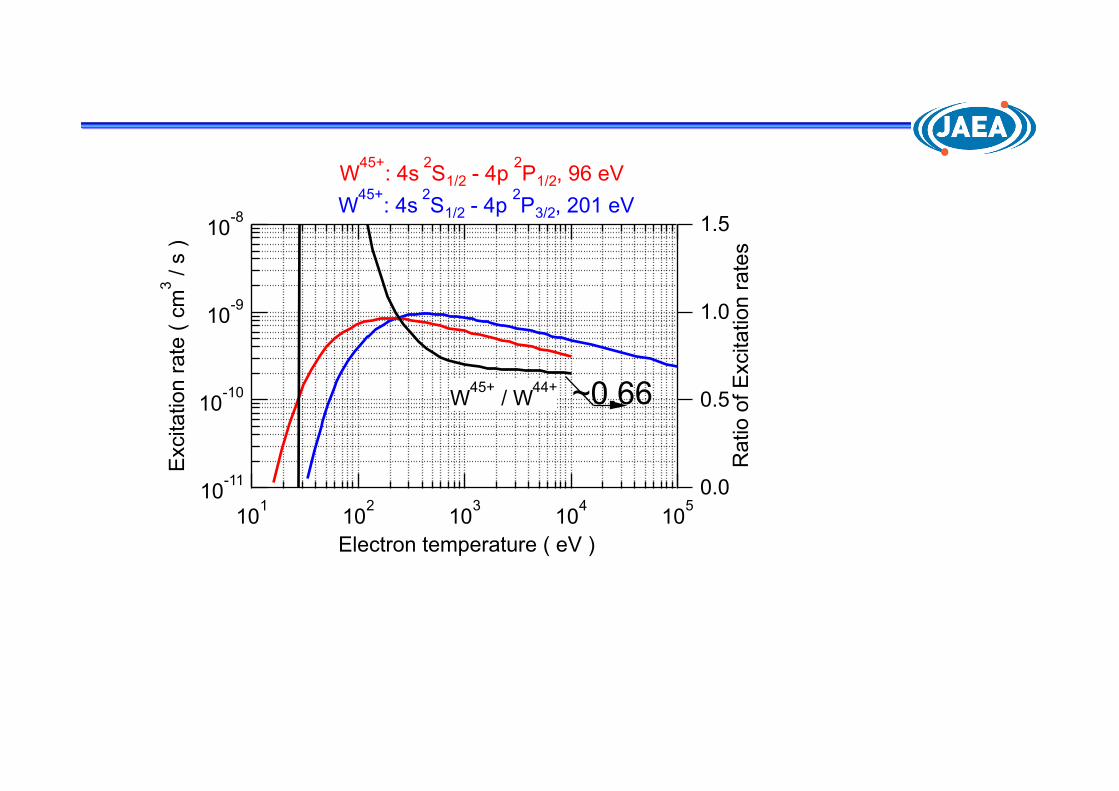
10-11
10-10
10-9
10-8
Exc
itatio
n ra
te (
cm3 /
s )
101 102 103 104 105
Electron temperature ( eV )
1.5
1.0
0.5
0.0
Rat
io o
f Exc
itatio
n ra
tes
W45+: 4s 2S1/2 - 4p 2P1/2, 96 eVW45+: 4s 2S1/2 - 4p 2P3/2, 201 eV
W45+ / W44+ ~0.66