Embed Size (px)
Citation preview

MEASURING INVESTMENT RETURNS II. INVESTMENT INTERACTIONS, OPTIONS AND REMORSE…
Life is too short for regrets, right?
Aswath Damodaran 276

277
Independent investments are the excepGon…
Aswath Damodaran
277
¨ In all of the examples we have used so far, the investments that we have analyzed have stood alone. Thus, our job was a simple one. Assess the expected cash flows on the investment and discount them at the right discount rate.
¨ In the real world, most investments are not independent. Taking an investment can oQen mean rejecGng another investment at one extreme (mutually exclusive) to being locked in to take an investment in the future (pre-‐requisite).
¨ More generally, accepGng an investment can create side costs for a firm’s exisGng investments in some cases and benefits for others.

278
I. Mutually Exclusive Investments
Aswath Damodaran
278
¨ We have looked at how best to assess a stand-‐alone investment and concluded that a good investment will have posiGve NPV and generate accounGng returns (ROC and ROE) and IRR that exceed your costs (capital and equity).
¨ In some cases, though, firms may have to choose between investments because ¤ They are mutually exclusive: Taking one investment makes the other
one redundant because they both serve the same purpose ¤ The firm has limited capital and cannot take every good investment
(i.e., investments with posiGve NPV or high IRR).
¨ Using the two standard discounted cash flow measures, NPV and IRR, can yield different choices when choosing between investments.

279
Comparing Projects with the same (or similar) lives..
Aswath Damodaran
279
¨ When comparing and choosing between investments with the same lives, we can ¤ Compute the accounGng returns (ROC, ROE) of the investments and pick the one with the higher returns
¤ Compute the NPV of the investments and pick the one with the higher NPV
¤ Compute the IRR of the investments and pick the one with the higher IRR
¨ While it is easy to see why accounGng return measures can give different rankings (and choices) than the discounted cash flow approaches, you would expect NPV and IRR to yield consistent results since they are both Gme-‐weighted, incremental cash flow return measures.

280
Case 1: IRR versus NPV
Aswath Damodaran
280
¨ Consider two projects with the following cash flows: Year Project 1 CF Project 2 CF 0 -‐1000 -‐1000 1 800 200 2 1000 300 3 1300 400 4 -‐2200 500

281
Project’s NPV Profile
Aswath Damodaran
281

282
What do we do now?
Aswath Damodaran
282
¨ Project 1 has two internal rates of return. The first is 6.60%, whereas the second is 36.55%. Project 2 has one internal rate of return, about 12.8%.
¨ Why are there two internal rates of return on project 1?
¨ If your cost of capital is 12%, which investment would you accept? a. Project 1 b. Project 2
¨ Explain.

283
Case 2: NPV versus IRR
Aswath Damodaran
283
Cash Flow
Investment
$ 350,000
$ 1,000,000
Project A
Cash Flow
Investment
Project B
NPV = $467,937 IRR= 33.66%
$ 450,000 $ 600,000 $ 750,000
NPV = $1,358,664 IRR=20.88%
$ 10,000,000
$ 3,000,000 $ 3,500,000 $ 4,500,000 $ 5,500,000

284
Which one would you pick?
Aswath Damodaran
284
¨ Assume that you can pick only one of these two projects. Your choice will clearly vary depending upon whether you look at NPV or IRR. You have enough money currently on hand to take either. Which one would you pick? a. Project A. It gives me the bigger bang for the buck and more
margin for error. b. Project B. It creates more dollar value in my business.
¨ If you pick A, what would your biggest concern be?
¨ If you pick B, what would your biggest concern be?

285
Capital RaGoning, Uncertainty and Choosing a Rule
Aswath Damodaran
285
¨ If a business has limited access to capital, has a stream of surplus value projects and faces more uncertainty in its project cash flows, it is much more likely to use IRR as its decision rule. ¤ Small, high-‐growth companies and private businesses are much more likely to use IRR.
¨ If a business has substanGal funds on hand, access to capital, limited surplus value projects, and more certainty on its project cash flows, it is much more likely to use NPV as its decision rule.
¨ As firms go public and grow, they are much more likely to gain from using NPV.

286
The sources of capital raGoning…
Aswath Damodaran
286
Cause Number of firms Percent of total Debt limit imposed by outside agreement 10 10.7 Debt limit placed by management external to firm
3 3.2
Limit placed on borrowing by internal management
65 69.1
Restrictive policy imposed on retained earnings
2 2.1
Maintenance of target EPS or PE ratio 14 14.9
287
An AlternaGve to IRR with Capital RaGoning
Aswath Damodaran
287
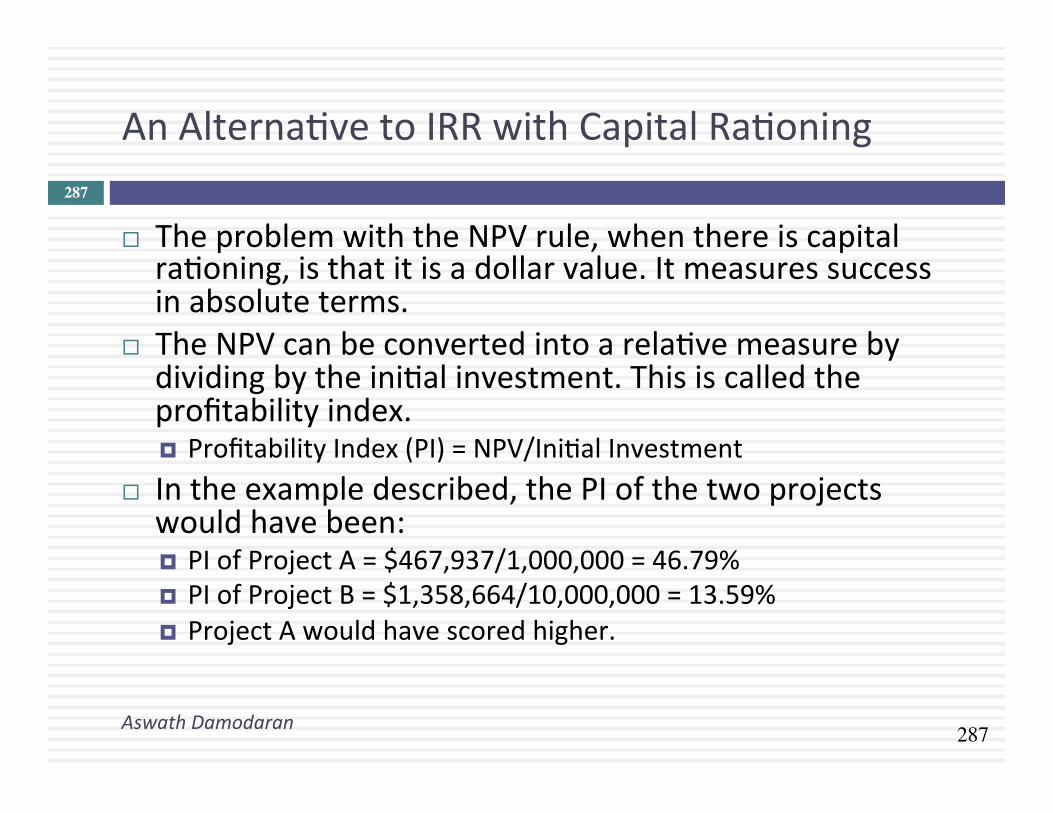
¨ The problem with the NPV rule, when there is capital raGoning, is that it is a dollar value. It measures success in absolute terms.
¨ The NPV can be converted into a relaGve measure by dividing by the iniGal investment. This is called the profitability index. ¤ Profitability Index (PI) = NPV/IniGal Investment
¨ In the example described, the PI of the two projects would have been: ¤ PI of Project A = $467,937/1,000,000 = 46.79% ¤ PI of Project B = $1,358,664/10,000,000 = 13.59% ¤ Project A would have scored higher.

288
Case 3: NPV versus IRR
Aswath Damodaran
288
Cash Flow
Investment
$ 5,000,000
$ 10,000,000
Project A
Cash Flow
Investment
Project B
NPV = $1,191,712 IRR=21.41%
$ 4,000,000 $ 3,200,000 $ 3,000,000
NPV = $1,358,664 IRR=20.88%
$ 10,000,000
$ 3,000,000 $ 3,500,000 $ 4,500,000 $ 5,500,000

289
Why the difference?
Aswath Damodaran
289
¨ These projects are of the same scale. Both the NPV and IRR use Gme-‐weighted cash flows. Yet, the rankings are different. Why?
¨ Which one would you pick? a. Project A. It gives me the bigger bang for the buck and
more margin for error. b. Project B. It creates more dollar value in my business.
290
NPV, IRR and the Reinvestment Rate AssumpGon
Aswath Damodaran
290
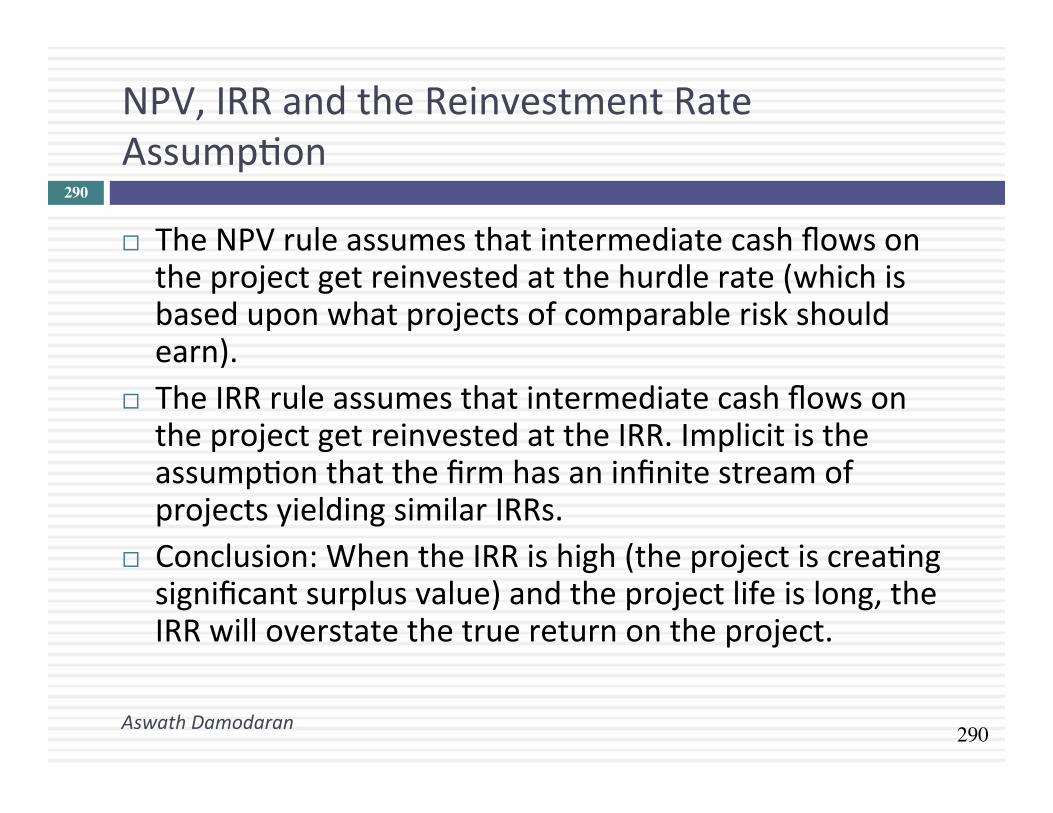
¨ The NPV rule assumes that intermediate cash flows on the project get reinvested at the hurdle rate (which is based upon what projects of comparable risk should earn).
¨ The IRR rule assumes that intermediate cash flows on the project get reinvested at the IRR. Implicit is the assumpGon that the firm has an infinite stream of projects yielding similar IRRs.
¨ Conclusion: When the IRR is high (the project is creaGng significant surplus value) and the project life is long, the IRR will overstate the true return on the project.

291
SoluGon to Reinvestment Rate Problem
Aswath Damodaran
291

292
Why NPV and IRR may differ.. Even if projects have the same lives
Aswath Damodaran
292
¨ A project can have only one NPV, whereas it can have more than one IRR.
¨ The NPV is a dollar surplus value, whereas the IRR is a percentage measure of return. The NPV is therefore likely to be larger for “large scale” projects, while the IRR is higher for “small-‐scale” projects.
¨ The NPV assumes that intermediate cash flows get reinvested at the “hurdle rate”, which is based upon what you can make on investments of comparable risk, while the IRR assumes that intermediate cash flows get reinvested at the “IRR”.

293
Comparing projects with different lives..
Aswath Damodaran
293 Project A
-$1500
$350 $350 $350 $350 $350
-$1000
$400 $400 $400 $400 $400
$350 $350 $350 $350 $350
Project B
NPV of Project A = $ 442 IRR of Project A = 28.7%
NPV of Project B = $ 478 IRR for Project B = 19.4%
Hurdle Rate for Both Projects = 12%

294
Why NPVs cannot be compared.. When projects have different lives.
Aswath Damodaran
294
¨ The net present values of mutually exclusive projects with different lives cannot be compared, since there is a bias towards longer-‐life projects. To compare the NPV, we have to ¤ replicate the projects Gll they have the same life (or) ¤ convert the net present values into annuiGes
¨ The IRR is unaffected by project life. We can choose the project with the higher IRR.

295
SoluGon 1: Project ReplicaGon
Aswath Damodaran
295
Project A: Replicated
-$1500
$350 $350 $350 $350 $350 $350 $350 $350 $350 $350
Project B
-$1000
$400 $400 $400 $400 $400 $400 $400 $400 $400 $400
-$1000 (Replication)
NPV of Project A replicated = $ 693
NPV of Project B= $ 478

296
SoluGon 2: Equivalent AnnuiGes
Aswath Damodaran
296
¨ Equivalent Annuity for 5-‐year project ¤ = $442 * PV(A,12%,5 years) ¤ = $ 122.62
¨ Equivalent Annuity for 10-‐year project ¤ = $478 * PV(A,12%,10 years) ¤ = $ 84.60
297
What would you choose as your investment tool?
Aswath Damodaran
297
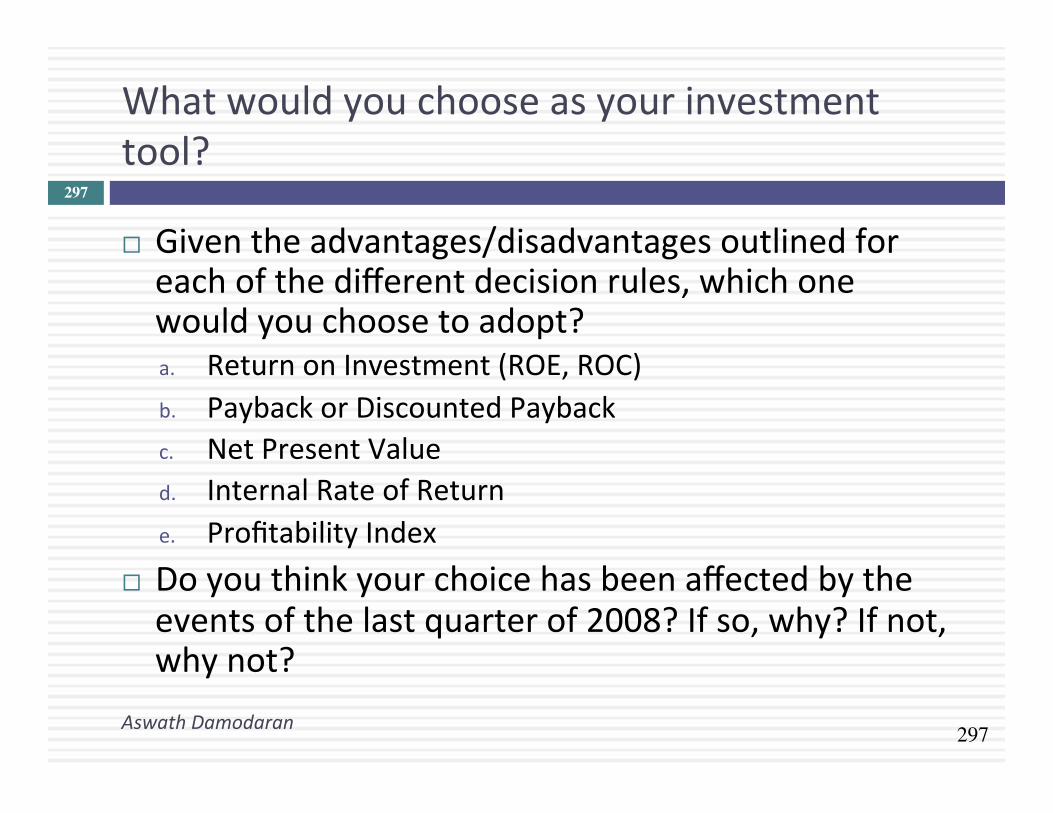
¨ Given the advantages/disadvantages outlined for each of the different decision rules, which one would you choose to adopt? a. Return on Investment (ROE, ROC) b. Payback or Discounted Payback c. Net Present Value d. Internal Rate of Return e. Profitability Index
¨ Do you think your choice has been affected by the events of the last quarter of 2008? If so, why? If not, why not?

298
What firms actually use ..
Aswath Damodaran
298
Decision Rule % of Firms using as primary decision rule in 1976 1986 1998
IRR 53.6% 49.0% 42.0% AccounGng Return 25.0% 8.0% 7.0% NPV 9.8% 21.0% 34.0% Payback Period 8.9% 19.0% 14.0% Profitability Index 2.7% 3.0% 3.0%

299
II. Side Costs and Benefits
Aswath Damodaran
299
¨ Most projects considered by any business create side costs and benefits for that business. ¤ The side costs include the costs created by the use of resources that the business already owns (opportunity costs) and lost revenues for other projects that the firm may have.
¤ The benefits that may not be captured in the tradiGonal capital budgeGng analysis include project synergies (where cash flow benefits may accrue to other projects) and opGons embedded in projects (including the opGons to delay, expand or abandon a project).
¨ The returns on a project should incorporate these costs and benefits.

300
A. Opportunity Cost
Aswath Damodaran
300
¨ An opportunity cost arises when a project uses a resource that may already have been paid for by the firm.
¨ When a resource that is already owned by a firm is being considered for use in a project, this resource has to be priced on its next best alternaGve use, which may be ¤ a sale of the asset, in which case the opportunity cost is the expected proceeds from the sale, net of any capital gains taxes
¤ renGng or leasing the asset out, in which case the opportunity cost is the expected present value of the aQer-‐tax rental or lease revenues.
¤ use elsewhere in the business, in which case the opportunity cost is the cost of replacing it.

301
Case 1: Foregone Sale?
Aswath Damodaran
301
¨ Assume that Disney owns land in Rio already. This land is undeveloped and was acquired several years ago for $ 5 million for a hotel that was never built. It is anGcipated, if this theme park is built, that this land will be used to build the offices for Disney Rio. The land currently can be sold for $ 40 million, though that would create a capital gain (which will be taxed at 20%). In assessing the theme park, which of the following would you do: ¤ Ignore the cost of the land, since Disney owns its already ¤ Use the book value of the land, which is $ 5 million ¤ Use the market value of the land, which is $ 40 million ¤ Other:
302
Case 2: Incremental Cost? An Online Retailing Venture for Bookscape
Aswath Damodaran
302
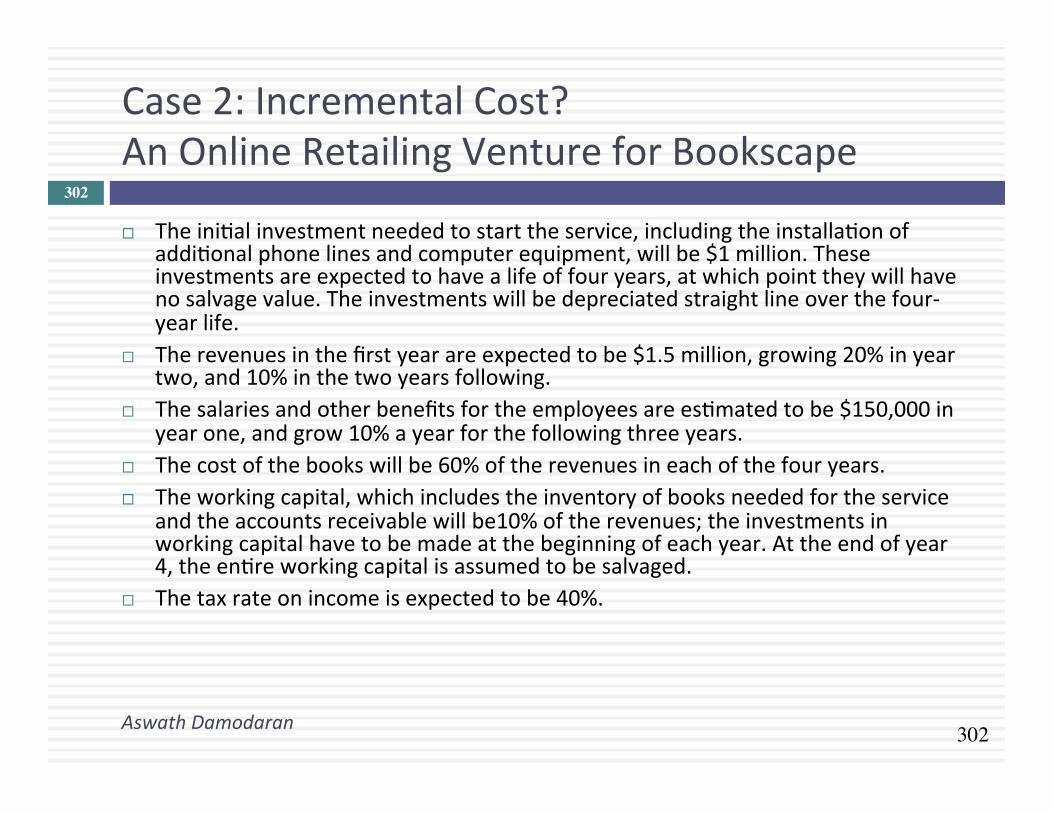
¨ The iniGal investment needed to start the service, including the installaGon of addiGonal phone lines and computer equipment, will be $1 million. These investments are expected to have a life of four years, at which point they will have no salvage value. The investments will be depreciated straight line over the four-‐year life.
¨ The revenues in the first year are expected to be $1.5 million, growing 20% in year two, and 10% in the two years following.
¨ The salaries and other benefits for the employees are esGmated to be $150,000 in year one, and grow 10% a year for the following three years.
¨ The cost of the books will be 60% of the revenues in each of the four years. ¨ The working capital, which includes the inventory of books needed for the service
and the accounts receivable will be10% of the revenues; the investments in working capital have to be made at the beginning of each year. At the end of year 4, the enGre working capital is assumed to be salvaged.
¨ The tax rate on income is expected to be 40%.

303
Cost of capital for investment
Aswath Damodaran
303
¨ We will re-‐esGmate the beta for this online project by looking at publicly traded Internet retailers. ¤ The unlevered total beta of internet retailers is 4.25, and we assume that this project will be funded with the same mix of debt and equity (D/E = 53.47%, Debt/Capital = 34.84%) that Bookscape uses in the rest of the business.
¤ We will assume that Bookscape’s tax rate (40%) and pretax cost of debt (6%) apply to this project.
¨ Cost of capital computaGon ¤ Levered Beta Online Service = 4.25 [1 + (1 – 0.4) (0.5357)] = 5.61 ¤ Cost of Equity Online Service = 3.5% + 5.61 (6%) = 37.18% ¤ Cost of Capital Online Service= 37.18% (0.6516) + 6% (1 – 0.4) (0.3484) = 25.48%

304
Incremental Cash flows on Investment
Aswath Damodaran
304
NPV of investment = -$98,775

305
The side costs…
Aswath Damodaran
305
¨ It is esGmated that the addiGonal business associated with online ordering and the administraGon of the service itself will add to the workload for the current general manager of the bookstore. As a consequence, the salary of the general manager will be increased from $100,000 to $120,000 next year; it is expected to grow 5 percent a year aQer that for the remaining three years of the online venture. AQer the online venture is ended in the fourth year, the manager’s salary will revert back to its old levels.
¨ It is also esGmated that Bookscape Online will uGlize an office that is currently used to store financial records. The records will be moved to a bank vault, which will cost $1000 a year to rent.

306
NPV with side costs…
Aswath Damodaran
306
¨ AddiGonal salary costs
¨ Office Costs
¨ NPV adjusted for side costs= -‐98,775-‐ $29,865 -‐ $1405 = $130,045 ¨ Opportunity costs aggregated into cash flows

307
Case 3: Excess Capacity
Aswath Damodaran
307
¨ In the Aracruz example, assume that the firm will use its exisGng distribuGon system to service the producGon out of the new paper plant. The new plant manager argues that there is no cost associated with using this system, since it has been paid for already and cannot be sold or leased to a compeGtor (and thus has no compeGng current use). Do you agree? a. Yes b. No

308
Case 4: Excess Capacity: A More Complicated Example
Aswath Damodaran
308
¨ Assume that a cereal company has a factory with a capacity to produce 100,000 boxes of cereal and that it expects to uses only 50% of capacity to produce its exisGng product (Bran Banana) next year. This product’s sales are expected to grow 10% a year in the long term and the company has an aQer-‐tax contribuGon margin (Sales price -‐ Variable cost) of $4 a unit.
¨ It is considering introducing a new cereal (Bran Raisin) and plans to use the excess capacity to produce the product. The sales in year 1 are expected to be 30,000 units and grow 5% a year in the long term; the aQer-‐tax contribuGon margin on this product is $5 a unit.
¨ The book value of the factory is $ 1 million. The cost of building a new factory with the same capacity is $1.5 million. The company’s cost of capital is 12%.

309
A Framework for Assessing The Cost of Using Excess Capacity
Aswath Damodaran
309
¨ If I do not add the new product, when will I run out of capacity?
¨ If I add the new product, when will I run out of capacity?
¨ When I run out of capacity, what will I do? ¤ Cut back on producGon: cost is PV of aQer-‐tax cash flows from lost sales
¤ Buy new capacity: cost is difference in PV between earlier & later investment

310
Opportunity Cost of Excess Capacity
Aswath Damodaran
310
Year Old New Old + New Lost ATCF PV(ATCF) 1 50.00% 30.00% 80.00% $0 2 55.00% 31.50% 86.50% $0 3 60.50% 33.08% 93.58% $0 4 66.55% 34.73% 101.28% $5,115 $ 3,251 5 73.21% 36.47% 109.67% $38,681 $ 21,949 6 80.53% 38.29% 118.81% $75,256 $ 38,127 7 88.58% 40.20% 128.78% $115,124 $ 52,076 8 97.44% 42.21% 139.65% $158,595 $ 64,054 9 100% 44.32% 144.32% $177,280 $ 63,929 10 100% 46.54% 146.54% $186,160 $ 59,939
PV(Lost Sales)= $ 303,324
¨ PV (Building Capacity In Year 3 Instead Of Year 8) = 1,500,000/1.123 -‐1,500,000/1.128 = $ 461,846
¨ Opportunity Cost of Excess Capacity = $ 303,324

311
Product and Project CannibalizaGon: A Real Cost?
Aswath Damodaran
311
¨ Assume that in the Disney theme park example, 20% of the revenues at the Rio Disney park are expected to come from people who would have gone to Disney theme parks in the US. In doing the analysis of the park, you would a. Look at only incremental revenues (i.e. 80% of the total revenue) b. Look at total revenues at the park c. Choose an intermediate number
¨ Would your answer be different if you were analyzing whether to introduce a new show on the Disney cable channel on Saturday mornings that is expected to asract 20% of its viewers from ABC (which is also owned by Disney)? a. Yes b. No

312
B. Project Synergies
Aswath Damodaran
312
¨ A project may provide benefits for other projects within the firm. Consider, for instance, a typical Disney animated movie. Assume that it costs $ 50 million to produce and promote. This movie, in addiGon to theatrical revenues, also produces revenues from ¤ the sale of merchandise (stuffed toys, plasGc figures, clothes ..) ¤ increased asendance at the theme parks ¤ stage shows (see “Beauty and the Beast” and the “Lion King”) ¤ television series based upon the movie
¨ In investment analysis, however, these synergies are either leQ unquanGfied and used to jusGfy overriding the results of investment analysis, i.e,, used as jusGficaGon for invesGng in negaGve NPV projects.
¨ If synergies exist and they oQen do, these benefits have to be valued and shown in the iniGal project analysis.

313
Example 1: Adding a Café to a bookstore: Bookscape
Aswath Damodaran
313
¨ Assume that you are considering adding a café to the bookstore. Assume also that based upon the expected revenues and expenses, the café standing alone is expected to have a net present value of -‐$91,097.
¨ The cafe will increase revenues at the book store by $500,000 in year 1, growing at 10% a year for the following 4 years. In addiGon, assume that the pre-‐tax operaGng margin on these sales is 10%.
¨ The net present value of the added benefits is $115,882. Added to the NPV of the standalone Café of -‐$91,097 yields a net present value of $24,785.

314
Case 2: Synergy in a merger..
Aswath Damodaran
314
¨ Earlier, we valued Sensient Technologies for an acquisiGon by Tata Chemicals and esGmated a value of $ 1,559 million for the operaGng assets and $ 1,107 million for the equity in the firm. In esGmaGng this value, though, we treated Sensient Technologies as a stand-‐alone firm.
¨ Assume that Tata Chemicals foresees potenGal synergies in the combinaGon of the two firms, primarily from using its distribuGon and markeGng faciliGes in India to market Sensient’s food addiGve products to India’s rapidly growing processed food industry. ¤ It will take Tata Chemicals approximately 3 years to adapt Sensient’s
products to match the needs of the Indian processed food sector – more spice, less color.
¤ Tata Chemicals will be able to generate Rs 1,500 million in aQer-‐tax operaGng income in year 4 from Sensient’s Indian sales, growing at a rate of 4% a year aQer that in perpetuity from Sensient’s products in India.
315
EsGmaGng the cost of capital to use in valuing synergy..
Aswath Damodaran
315
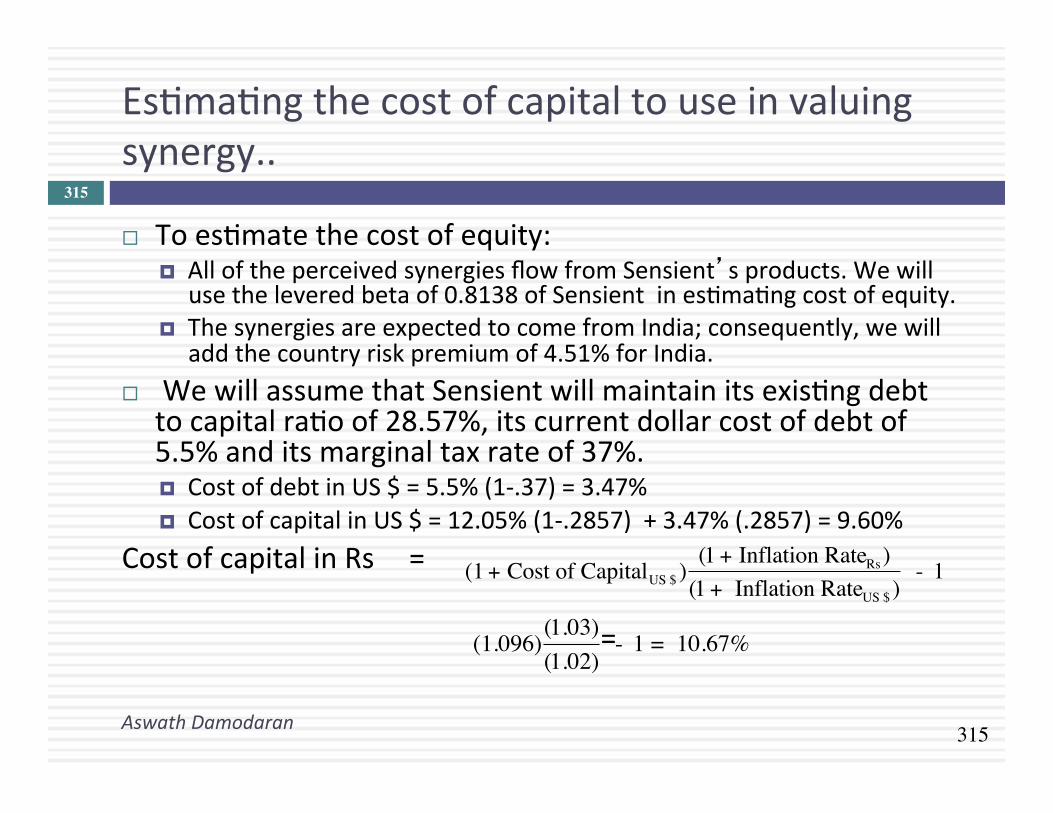
¨ To esGmate the cost of equity: ¤ All of the perceived synergies flow from Sensient’s products. We will
use the levered beta of 0.8138 of Sensient in esGmaGng cost of equity. ¤ The synergies are expected to come from India; consequently, we will
add the country risk premium of 4.51% for India. ¨ We will assume that Sensient will maintain its exisGng debt
to capital raGo of 28.57%, its current dollar cost of debt of 5.5% and its marginal tax rate of 37%. ¤ Cost of debt in US $ = 5.5% (1-‐.37) = 3.47% ¤ Cost of capital in US $ = 12.05% (1-‐.2857) + 3.47% (.2857) = 9.60%
Cost of capital in Rs = =
€
(1 + Cost of CapitalUS $ )(1 + Inflation RateRs)
(1 + Inflation RateUS $ ) - 1
€
(1.096)(1.03)(1.02)
- 1 = 10.67%

316
EsGmaGng the value of synergy… and what Tata can pay for Sensient…
Aswath Damodaran
316
¨ We can now discount the expected cash flows back at the cost of capital to derive the value of synergy: ¤ Value of synergy Year 3 =
¤ Value of synergy today =
¨ Earlier, we esGmated the value of equity in Sensient Technologies, with no synergy, to be $1,107 million. ConverGng the synergy value into dollar terms at the current exchange rate of Rs 47.50/$, the total value that Tata Chemicals can pay for Sensient’s equity: ¤ Value of synergy in US $ = Rs 16,580/47.50 = $ 349 million ¤ Value of Sensient Technologies = $1,107 million + $349 million =
$1,456 million
€
Expected Cash FlowYear 4
(Cost of Capital - g)=
1500(.1067 -.04)
= Rs 22,476 million
€
Value of Synergyyear 3
(1 + Cost of Capital)3 =22,476
(1.1067)3 = Rs 16,580 million

317
III. Project OpGons
Aswath Damodaran
317
¨ One of the limitaGons of tradiGonal investment analysis is that it is staGc and does not do a good job of capturing the opGons embedded in investment. ¤ The first of these opGons is the opGon to delay taking a project, when a firm has exclusive rights to it, unGl a later date.
¤ The second of these opGons is taking one project may allow us to take advantage of other opportuniGes (projects) in the future
¤ The last opGon that is embedded in projects is the opGon to abandon a project, if the cash flows do not measure up.
¨ These opGons all add value to projects and may make a “bad” project (from tradiGonal analysis) into a good one.

318
The OpGon to Delay
Aswath Damodaran
318
¨ When a firm has exclusive rights to a project or product for a specific period, it can delay taking this project or product unGl a later date. A tradiGonal investment analysis just answers the quesGon of whether the project is a “good” one if taken today. The rights to a “bad” project can sGll have value.
Present Value of Expected Cash Flows on Product
PV of Cash Flows
Initial Investment in Project
NPV is positive in this section

319
Insights for Investment Analyses
Aswath Damodaran
319
¨ Having the exclusive rights to a product or project is valuable, even if the product or project is not viable today.
¨ The value of these rights increases with the volaGlity of the underlying business.
¨ The cost of acquiring these rights (by buying them or spending money on development -‐ R&D, for instance) has to be weighed off against these benefits.

320
The OpGon to Expand/Take Other Projects
Aswath Damodaran
320
¨ Taking a project today may allow a firm to consider and take other valuable projects in the future. Thus, even though a project may have a negaGve NPV, it may be a project worth taking if the opGon it provides the firm (to take other projects in the future) has a more-‐than-‐compensaGng value.
Cash Flows on Expansion
PV of Cash Flows from Expansion
Additional Investment to Expand
Firm will not expand in this section
Expansion becomes attractive in this section

321
The OpGon to Abandon
Aswath Damodaran
321
¨ A firm may someGmes have the opGon to abandon a project, if the cash flows do not measure up to expectaGons.
¨ If abandoning the project allows the firm to save itself from further losses, this opGon can make a project more valuable.
Present Value of Expected Cash Flows on Project
PV of Cash Flows from Project
Cost of Abandonment

322
IV. Assessing ExisGng or Past investments…
Aswath Damodaran
322
¨ While much of our discussion has been focused on analyzing new investments, the techniques and principles enunciated apply just as strongly to exisGng investments.
¨ With exisGng investments, we can try to address one of two quesGons: ¤ Post –mortem: We can look back at exisGng investments and see if they have created value for the firm.
¤ What next? We can also use the tools of investment analysis to see whether we should keep, expand or abandon exisGng investments.
323
Analyzing an ExisGng Investment
Aswath Damodaran
323
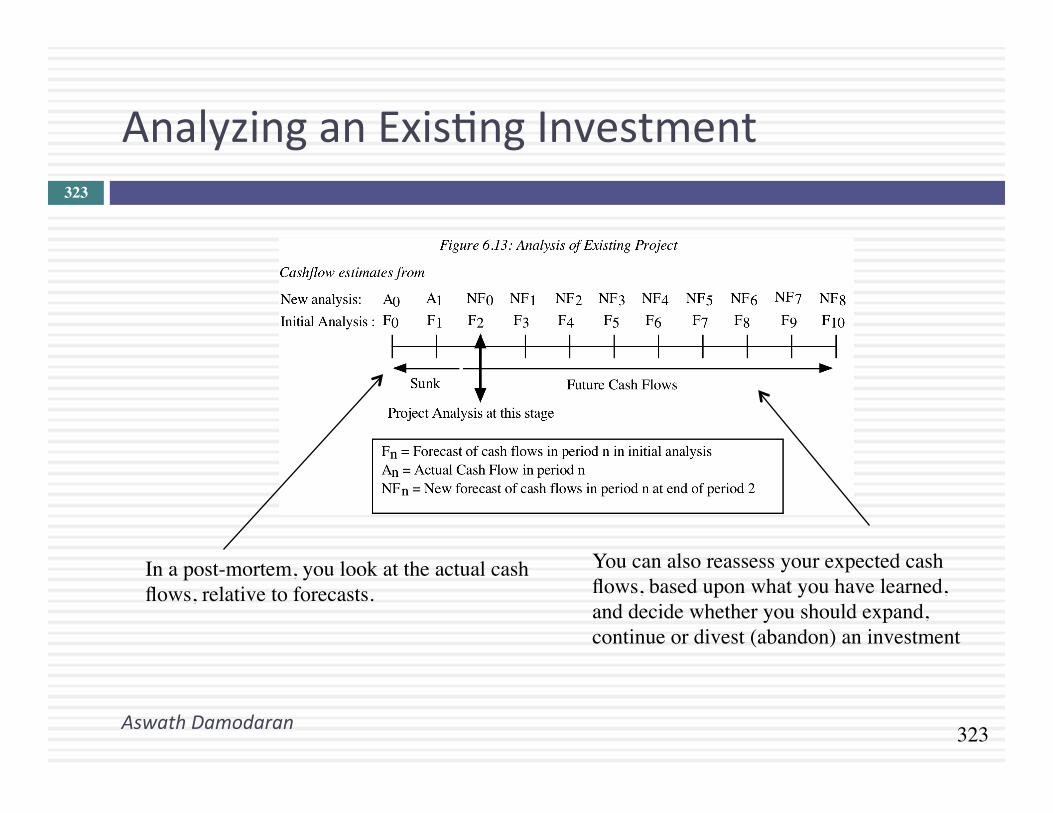
In a post-mortem, you look at the actual cash flows, relative to forecasts.
You can also reassess your expected cash flows, based upon what you have learned, and decide whether you should expand, continue or divest (abandon) an investment

324
a. Post Mortem Analysis
Aswath Damodaran
324
¨ The actual cash flows from an investment can be greater than or less than originally forecast for a number of reasons but all these reasons can be categorized into two groups: ¤ Chance: The nature of risk is that actual outcomes can be different from
expectaGons. Even when forecasts are based upon the best of informaGon, they will invariably be wrong in hindsight because of unexpected shiQs in both macro (inflaGon, interest rates, economic growth) and micro (compeGtors, company) variables.
¤ Bias: If the original forecasts were biased, the actual numbers will be different from expectaGons. The evidence on capital budgeGng is that managers tend to be over-‐opGmisGc about cash flows and the bias is worse with over-‐confident managers.
¨ While it is impossible to tell on an individual project whether chance or bias is to blame, there is a way to tell across projects and across Gme. If chance is the culprit, there should be symmetry in the errors – actuals should be about as likely to beat forecasts as they are to come under forecasts. If bias is the reason, the errors will tend to be in one direcGon.

325
b. What should we do next?
Aswath Damodaran
325
........ Liquidate the project
........ Terminate the project
........ Divest the project
........ ConGnue the project
€
NFn
(1 + r)nt =0
t =n
∑ > 0 > Divestiture Value€
NFn
(1 + r)nt =0
t =n
∑ < Divestiture Value
€
NFn(1+ r)nt=0
t=n
∑ < 0
€
NFn
(1 + r)nt =0
t =n
∑ < Salvage Value

326
Example: Disney California Adventure
Aswath Damodaran
326
¨ Disney opened the Disney California Adventure (DCA) Park in 2001, at a cost of $1.5 billion, with a mix of roller coaster ridesand movie nostalgia. Disney expected about 60% of its visitors to Disneyland to come across to DCA and generate about $ 100 million in annual aQer-‐cash flows for the firm.
¨ By 2008, DCA had not performed up to expectaGons. Of the 15 million people who came to Disneyland in 2007, only 6 million visited California Adventure, and the cash flow averaged out to only $ 50 million between 2001 and 2007.
¨ In early 2008, Disney faced three choices: ¤ Shut down California Adventure and try to recover whatever it can of its iniGal
investment. It is esGmated that the firm recover about $ 500 million of its investment. ¤ ConGnue with the status quo, recognizing that future cash flows will be closer to the
actual values ($ 50 million) than the original projecGons. ¤ Invest about $ 600 million to expand and modify the par, with the intent of increasing
the number of asracGons for families with children, is expected to increase the percentage of Disneyland visitors who come to DCA from 40% to 60% and increase the annual aQer tax cash flow by 60% (from $ 50 million to $ 80 million) at the park.

327
DCA: EvaluaGng the alternaGves…
Aswath Damodaran
327
¨ ConGnuing OperaGon: Assuming the current aQer-‐tax cash flow of $ 50 million will conGnue in perpetuity, growing at the inflaGon rate of 2% and discounGng back at the theme park cost of capital of 6.62% yields a value for conGnuing with the status quo
Value of DCA = ¨ Abandonment: Abandoning this investment currently would allow
Disney to recover only $ 500 million of its original investment. Abandonment value of DCA = $ 500 million
¨ Expansion: The up-‐front cost of $ 600 million will lead to more visitors in the park and an increase in the exisGng cash flows from $ 50 to $ 80 million.
Value of CF from expansion =
€
Expected Cash Flow next year(Cost of capital - g)
=50(1.02)
(.0662 − .02)= $1.103 billion
€
Increase in CF next year(Cost of capital - g)
=30(1.02)
(.0662 − .02)= $662 million

328
First Principles
Aswath Damodaran
328