Embed Size (px)
Citation preview
MECHANICAL STRESSES UPON PHASE TRANSITIONS
Von der Fakultat furMathematik, Informatik und Naturwissenschaften
der Rheinisch-Westfalischen Technischen Hochschule Aachenzur Erlangung des akademischen Grades eines Doktors
der Naturwissenschaften genehmigte Dissertation
vorgelegt voncand.scient.
Tom Peder Leervad Pedersenaus Aarhus, Danemark
Berichter: Universitatsprofessor Dr.rer.nat.Matthias WuttigProf. Dr.Scient. Arne Nylandsted Larsen
Tag der mundlichen Prufung: 6. Juni 2003
Diese Dissertation ist auf den Internetseiten der Hochschulbibliothekonline verfugbar.

Contents
1 Introduction 1
2 Theory of mechanical stresses 3
2.1 Concepts and definitions . . . . . . . . . . . . . . . . . . . . . . . . . . . . . . . 3
2.2 Elastic theory of mechanical stress . . . . . . . . . . . . . . . . . . . . . . . . . . 5
2.2.1 The strain tensor . . . . . . . . . . . . . . . . . . . . . . . . . . . . . . . 5
2.2.2 The components of strain: Geometrical interpretation . . . . . . . . . . . . 7
2.2.3 Stress . . . . . . . . . . . . . . . . . . . . . . . . . . . . . . . . . . . . . 10
2.2.4 Hooke’s law . . . . . . . . . . . . . . . . . . . . . . . . . . . . . . . . . 11
2.2.5 Directional dependence of elastic properties . . . . . . . . . . . . . . . . . 12
2.2.6 Elastic constants . . . . . . . . . . . . . . . . . . . . . . . . . . . . . . . 13
2.3 Substrate bending induced by mechanical stress . . . . . . . . . . . . . . . . . . . 15
2.4 Volume changes and mechanical stress . . . . . . . . . . . . . . . . . . . . . . . . 17
2.5 Thermal stress . . . . . . . . . . . . . . . . . . . . . . . . . . . . . . . . . . . . . 19
2.5.1 Determination of elastic constants by exploiting thermal stresses . . . . . . 20
2.6 Stress relaxation . . . . . . . . . . . . . . . . . . . . . . . . . . . . . . . . . . . . 20
2.7 Plastic deformations in crystalline materials . . . . . . . . . . . . . . . . . . . . . 22
2.8 Creep in crystalline materials . . . . . . . . . . . . . . . . . . . . . . . . . . . . . 26
2.8.1 Creep by dislocation glide . . . . . . . . . . . . . . . . . . . . . . . . . . 28
2.8.2 Nabarro-Herring creep . . . . . . . . . . . . . . . . . . . . . . . . . . . . 28
2.8.3 Coble Creep . . . . . . . . . . . . . . . . . . . . . . . . . . . . . . . . . 29
2.8.4 Viscous flow . . . . . . . . . . . . . . . . . . . . . . . . . . . . . . . . . 29
2.9 Summary . . . . . . . . . . . . . . . . . . . . . . . . . . . . . . . . . . . . . . . 37
i
ii
3 Experimental details 39
3.1 Stress measurement methods . . . . . . . . . . . . . . . . . . . . . . . . . . . . . 39
3.1.1 Diffraction based methods . . . . . . . . . . . . . . . . . . . . . . . . . . 40
3.1.2 Curvature based methods . . . . . . . . . . . . . . . . . . . . . . . . . . . 41
3.1.3 Spectroscopic methods . . . . . . . . . . . . . . . . . . . . . . . . . . . . 41
3.1.4 Comparison . . . . . . . . . . . . . . . . . . . . . . . . . . . . . . . . . . 41
3.2 System 1 - The scanning laser beam system . . . . . . . . . . . . . . . . . . . . . 42
3.3 Measurement types . . . . . . . . . . . . . . . . . . . . . . . . . . . . . . . . . . 45
3.3.1 Deposition stress measurements . . . . . . . . . . . . . . . . . . . . . . . 46
3.3.2 The gas chamber . . . . . . . . . . . . . . . . . . . . . . . . . . . . . . . 46
3.4 The furnace . . . . . . . . . . . . . . . . . . . . . . . . . . . . . . . . . . . . . . 49
3.5 Software . . . . . . . . . . . . . . . . . . . . . . . . . . . . . . . . . . . . . . . . 53
3.6 Characterization of the scanning laser apparatus . . . . . . . . . . . . . . . . . . . 56
3.6.1 Noise of signals . . . . . . . . . . . . . . . . . . . . . . . . . . . . . . . . 59
3.7 System 2 - the two-beam system . . . . . . . . . . . . . . . . . . . . . . . . . . . 63
3.7.1 Calculating stresses using the two-beam system . . . . . . . . . . . . . . . 64
3.8 Appendix: Components of the setup . . . . . . . . . . . . . . . . . . . . . . . . . 68
3.8.1 HeNe Laser . . . . . . . . . . . . . . . . . . . . . . . . . . . . . . . . . . 68
3.8.2 Galvanoscanner . . . . . . . . . . . . . . . . . . . . . . . . . . . . . . . . 68
3.8.3 Position Sensitive Detector (PSD) . . . . . . . . . . . . . . . . . . . . . . 68
3.8.4 Gas chamber . . . . . . . . . . . . . . . . . . . . . . . . . . . . . . . . . 69
3.8.5 Transmission detector . . . . . . . . . . . . . . . . . . . . . . . . . . . . 69
3.8.6 Furnace . . . . . . . . . . . . . . . . . . . . . . . . . . . . . . . . . . . . 69
3.9 Appendix: Geometry of the scanning laser system . . . . . . . . . . . . . . . . . . 70
3.10 Summary . . . . . . . . . . . . . . . . . . . . . . . . . . . . . . . . . . . . . . . 72
4 Supplementary experimental methods 73
4.1 Introduction . . . . . . . . . . . . . . . . . . . . . . . . . . . . . . . . . . . . . . 73
4.2 X-ray measurements . . . . . . . . . . . . . . . . . . . . . . . . . . . . . . . . . 73
4.2.1 Principle . . . . . . . . . . . . . . . . . . . . . . . . . . . . . . . . . . . 74
4.2.2 X-ray reflection . . . . . . . . . . . . . . . . . . . . . . . . . . . . . . . . 75
4.2.3 X-ray diffraction . . . . . . . . . . . . . . . . . . . . . . . . . . . . . . . 75
4.3 Optical spectroscopy . . . . . . . . . . . . . . . . . . . . . . . . . . . . . . . . . 77
4.3.1 Principle . . . . . . . . . . . . . . . . . . . . . . . . . . . . . . . . . . . 79

iii
5 Deposition stresses in transition metal oxides 81
5.1 Introduction . . . . . . . . . . . . . . . . . . . . . . . . . . . . . . . . . . . . . . 81
5.2 Sputter deposition . . . . . . . . . . . . . . . . . . . . . . . . . . . . . . . . . . . 82
5.2.1 Principle of DC-magnetron sputtering . . . . . . . . . . . . . . . . . . . . 82
5.2.2 Sputter systems used . . . . . . . . . . . . . . . . . . . . . . . . . . . . . 85
5.3 Sputter parameters for growth of transition metal oxides . . . . . . . . . . . . . . . 87
5.3.1 Parameters for metallic films . . . . . . . . . . . . . . . . . . . . . . . . . 87
5.3.2 General parameters for sputtering of oxide films . . . . . . . . . . . . . . 87
5.3.3 Sputtering of tungsten oxide . . . . . . . . . . . . . . . . . . . . . . . . . 89
5.3.4 Deposition of titanium oxide . . . . . . . . . . . . . . . . . . . . . . . . 91
5.3.5 Sputtering of other metal oxides . . . . . . . . . . . . . . . . . . . . . . . 91
5.4 Theory of deposition stress . . . . . . . . . . . . . . . . . . . . . . . . . . . . . . 91
5.4.1 Properties of bombarding particles . . . . . . . . . . . . . . . . . . . . . . 91
5.4.2 Tensile stress . . . . . . . . . . . . . . . . . . . . . . . . . . . . . . . . . 98
5.4.3 Transition from tensile to compressive stress . . . . . . . . . . . . . . . . 99
5.4.4 Compressive stress . . . . . . . . . . . . . . . . . . . . . . . . . . . . . . 100
5.5 Results . . . . . . . . . . . . . . . . . . . . . . . . . . . . . . . . . . . . . . . . . 104
5.5.1 General trends . . . . . . . . . . . . . . . . . . . . . . . . . . . . . . . . 104
5.5.2 Behavior of NbOx, TaOx, MoOx and WOx . . . . . . . . . . . . . . . . . . 108
5.5.3 Behavior of ZrOx, HfOx . . . . . . . . . . . . . . . . . . . . . . . . . . . 109
5.5.4 Behavior of TiOx, VOx . . . . . . . . . . . . . . . . . . . . . . . . . . . . 110
5.5.5 Structure formation . . . . . . . . . . . . . . . . . . . . . . . . . . . . . . 110
5.6 Summary . . . . . . . . . . . . . . . . . . . . . . . . . . . . . . . . . . . . . . . 111
6 Switchable Coatings 113
6.1 Suitable materials for switchable coatings . . . . . . . . . . . . . . . . . . . . . . 113
6.2 Principle of operation of switchable coatings . . . . . . . . . . . . . . . . . . . . . 114
6.2.1 Gasochromic switching . . . . . . . . . . . . . . . . . . . . . . . . . . . . 114
6.2.2 Electrochromic switching . . . . . . . . . . . . . . . . . . . . . . . . . . 115
6.2.3 Thermochromic switching . . . . . . . . . . . . . . . . . . . . . . . . . . 116
6.2.4 Photochromic switching . . . . . . . . . . . . . . . . . . . . . . . . . . . 116

iv
6.3 Tungsten oxide . . . . . . . . . . . . . . . . . . . . . . . . . . . . . . . . . . . . 116
6.3.1 The coloration mechanism of tungsten oxide . . . . . . . . . . . . . . . . 117
6.3.2 The absorption in tungsten oxide . . . . . . . . . . . . . . . . . . . . . . . 120
6.4 Gadolinium and rare earths . . . . . . . . . . . . . . . . . . . . . . . . . . . . . . 122
6.5 Magnesium . . . . . . . . . . . . . . . . . . . . . . . . . . . . . . . . . . . . . . 126
6.6 Palladium and platinum . . . . . . . . . . . . . . . . . . . . . . . . . . . . . . . . 127
6.7 General properties of the Pd-H and Pt-H systems . . . . . . . . . . . . . . . . . . 128
6.7.1 Structural properties of the Pd-H and Pt-H systems . . . . . . . . . . . . . 129
6.7.2 Optical properties of the Pd-H and Pt-H systems . . . . . . . . . . . . . . 132
6.8 Thermodynamic considerations . . . . . . . . . . . . . . . . . . . . . . . . . . . . 133
6.8.1 Basic definitions . . . . . . . . . . . . . . . . . . . . . . . . . . . . . . . 133
6.8.2 Gibb’s free energy at arbitrary temperatures . . . . . . . . . . . . . . . . . 134
6.8.3 Gibb’s free energy at arbitrary pressures . . . . . . . . . . . . . . . . . . . 134
6.8.4 Chemical equilibrium . . . . . . . . . . . . . . . . . . . . . . . . . . . . 135
6.8.5 Thermodynamic approach to the switching of WOx, Gd and Mg . . . . . . 135
6.9 Results of mechanical stress measurements . . . . . . . . . . . . . . . . . . . . . 136
6.10 Mechanical properties of catalyst films . . . . . . . . . . . . . . . . . . . . . . . 137
6.10.1 Palladium . . . . . . . . . . . . . . . . . . . . . . . . . . . . . . . . . . . 137
6.10.2 Platinum . . . . . . . . . . . . . . . . . . . . . . . . . . . . . . . . . . . 142
6.11 Comparison of different switchable films . . . . . . . . . . . . . . . . . . . . . . . 143
6.11.1 Tungsten oxide . . . . . . . . . . . . . . . . . . . . . . . . . . . . . . . . 143
6.11.2 Gadolinium . . . . . . . . . . . . . . . . . . . . . . . . . . . . . . . . . . 144
6.11.3 Magnesium . . . . . . . . . . . . . . . . . . . . . . . . . . . . . . . . . . 145
6.11.4 Comparison with elastic theory . . . . . . . . . . . . . . . . . . . . . . . 147
6.11.5 Comparison of the materials studied . . . . . . . . . . . . . . . . . . . . . 149
6.12 Detailed study of tungsten oxide . . . . . . . . . . . . . . . . . . . . . . . . . . . 150
6.12.1 Stresses as a function of the density in WOx films . . . . . . . . . . . . . 151
6.12.2 Stress changes and the models for coloration. . . . . . . . . . . . . . . . . 155
6.13 Summary . . . . . . . . . . . . . . . . . . . . . . . . . . . . . . . . . . . . . . . 159
v
7 Phase change materials 163
7.1 Principle of phase change recording . . . . . . . . . . . . . . . . . . . . . . . . . 165
7.2 Theoretical description of structural phase transitions . . . . . . . . . . . . . . . . 165
7.3 Atomic configuration of glasses . . . . . . . . . . . . . . . . . . . . . . . . . . . 166
7.4 A thermodynamic approach to the formation of glasses . . . . . . . . . . . . . . . 166
7.5 Crystallization . . . . . . . . . . . . . . . . . . . . . . . . . . . . . . . . . . . . . 169
7.6 Materials suited for phase change application . . . . . . . . . . . . . . . . . . . . 173
7.7 Results of stress measurements . . . . . . . . . . . . . . . . . . . . . . . . . . . . 174
7.8 Stress upon crystallization . . . . . . . . . . . . . . . . . . . . . . . . . . . . . . 176
7.8.1 Comparison of phase change materials . . . . . . . . . . . . . . . . . . . 176
7.8.2 Determination of the elastic constant for phase change materials . . . . . . 178
7.8.3 Comparison of the stress changes with elastic theory . . . . . . . . . . . . 180
7.8.4 Crystallization mechanism . . . . . . . . . . . . . . . . . . . . . . . . . . 181
7.9 Viscosity measurements . . . . . . . . . . . . . . . . . . . . . . . . . . . . . . . 183
7.9.1 Results of viscosity measurements . . . . . . . . . . . . . . . . . . . . . . 183
7.9.2 Fitting the viscosity measurements . . . . . . . . . . . . . . . . . . . . . . 188
7.9.3 Determination of the isoconfigurational activation energy . . . . . . . . . . 190
7.10 Summary . . . . . . . . . . . . . . . . . . . . . . . . . . . . . . . . . . . . . . . 192
8 Conclusion 195
References 199

vi
Chapter 1
Introduction
The impact of functional coatings on the performance of many devices, tools and applicationshas been immense in recent years. For example, in microelectronics the use of special thin filmshas led to improvements of electronic devices, hard coatings have improved the performance ofmany tools, and optical coatings have been used to a large extent to improve the performance ofwindows. Additionally, new devices have been invented based on such coatings. The intelligentwindows able to control the transmission of light into buildings, data storage media such as the CDand later the DVD, and water purification devices are known to most people nowadays.
The stability and the lifetime of such devices depend on the stability of the functional coatings.This parameter depends on the mechanical stresses in the films. The most dramatic consequence ofsuch stresses is the cracking or delamination of the films. These processes can lead to a completefailure of the coating, and hence of the functionality of the device in which the coating is active.While such processes occur abruptly, slower stress-induced processes that lead to a degradationof the properties of the films are also possible. Hence the control and the understanding of themechanical stresses in these functional coatings is crucial, and therefore this topic was chosen forthis work. However, as not all functional coatings could be studied, a few groups of materials wereselected for the studies here.
Transition metal oxides such as TiO2, ZrO2, HfO2, V2O5, Nb2O5, Ta2O5, MoO3 and WO3 areamong the most applied coatings today. These oxides have a wide spectrum of possible applica-tions even though their main use is as optical coatings. In fact such thin oxide coatings used onnormal windows can allow a higher transmission of the solar energy into a building and addition-ally allow a high reflectance in the infrared, which helps confine the heat inside the building. Ina cold region, such coated windows help save energy. It is however in the warm regions of theworld that coatings designed to have the opposite properties, i.e to hinder the transmission of so-lar energy into the building, have the biggest impact, as they help save considerable amounts ofenergy used for cooling. Additionally, the transition metal oxides find application also in laser mir-rors, ionic conductors, broadband interference filters [77] as well transparent conductive coatings,hard coatings, etc. One of most exciting topics in recent years has been the photocatalytic andhydrophylic properties of TiO2 which has opened a window of applications such as antibacterialand self-sterilizing coatings, self-cleaning clothes, windows, paint and street coatings, as well asanti-fogging glass, dishwashers, air- and water purification devices, etc.
1

2
Another technology that has entered the market in recent years, are optically switchable win-dows. In such devices that are based on particular metals or metal oxides, an apparently metallicsurface can be made transparent and vice versa. The applications that can be imagined, some whichhave already been realized, include windows with switchable optical properties, rear-view mirrorsthat automatically reduce the intensity of the reflected light as well as displays with improvedcontrast ratios.
Phase change films have won a central position in another field of application of functionalcoatings: optical data storage technology. The principle of optical storage systems utilizes theproperties of the phase change films. The significant difference in optical properties of two dif-ferent physical states of the active material; the amorphous and the crystalline state is exploited.By heating microscopic volumes of the material by use of irradiation, a phase transition betweenthe two states can be carried out. Thereby tiny areas with a reflection that differs from that of thesurrounding matrix are formed, and thus the storage of information is allowed. In data storagemedia such as CD-RW and DVD-RW such phase change coatings are already employed.
These three interesting groups of materials are all applied in situations where it is crucial toguarantee a certain lifetime, meaning that is is highly important to understand their mechanicalstress properties.
In this work, detailed studies of the stresses arising in the three mentioned classes of functionalcoatings are carried out. In the field of transition metal oxides, measurements of the depositionstresses arising in films deposited using the industrially applied DC-sputtering method were carriedout. For optically switchable coatings, in-situ measurements were carried out during the switchingprocess, leading to enhanced understanding of the nature of the behavior of the coatings. Animproved understanding of the magnitude of the stresses involved and the mechanism responsiblefor the switching in certain materials was also realized. Finally, in the field of phase changematerials, measurements of the mechanical stress associated with the phase transitions were carriedout. Additionally, thorough investigations of the stress relaxation mechanisms in the amorphousphase of the phase change films were performed.
However, before the results of these measurements are presented, other important topics aredescribed. To interpret and understand the findings of the measurements, it is necessary to have afundamental understanding of the theory of mechanical stresses in thin films. Hence chapter 2 con-tains a description of the theory of mechanical stresses. The special situations that are encounteredin the experiments are all treated in detail.
It is impossible to apply this theory to measurements of mechanical stresses though, if no ex-perimental setup is available. To allow the investigations presented in this work, it was hencenecessary to construct a system tailored to the projected measurements. This system is describedand characterized in detail in chapter 3.
In chapter 4 a few supplementary methods are presented. These systems were used to measureparameters crucial for the determination of the mechanical stress, most notably the film thickness.
Finally, the results of the studies of the mechanical stresses for each of the material groupsdescribed above is presented in chapters 5 to 7.
Chapter 2
Theory of mechanical stresses
To understand the experimental results of chapters (5) to (7), it is important to comprehend the the-ory of mechanical stresses in thin film. This is the topic of this chapter. In the first section (2.1), asimple model for understanding the terms involved in the description of mechanical stress is given,while a thorough treatment of the theory of mechanical stresses is presented in sections (2.2)-(2.5).In sections (2.6)-(2.8) inelastic effects are treated. Because of its importance in understanding thefindings of chapter 7, the topic of viscous flow is treated thoroughly (section 2.8.4).
2.1 Concepts and definitions
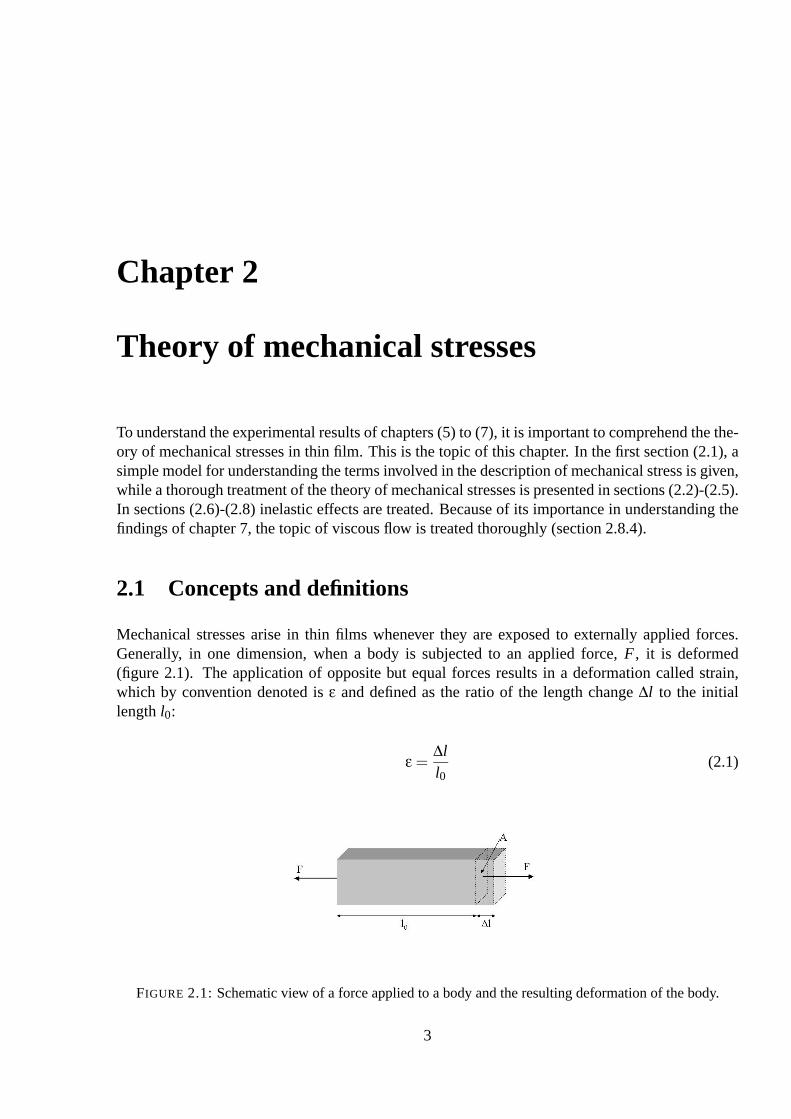
Mechanical stresses arise in thin films whenever they are exposed to externally applied forces.Generally, in one dimension, when a body is subjected to an applied force, F , it is deformed(figure 2.1). The application of opposite but equal forces results in a deformation called strain,which by convention denoted is ε and defined as the ratio of the length change ∆l to the initiallength l0:
ε =∆ll0
(2.1)
FIGURE 2.1: Schematic view of a force applied to a body and the resulting deformation of the body.
3
4
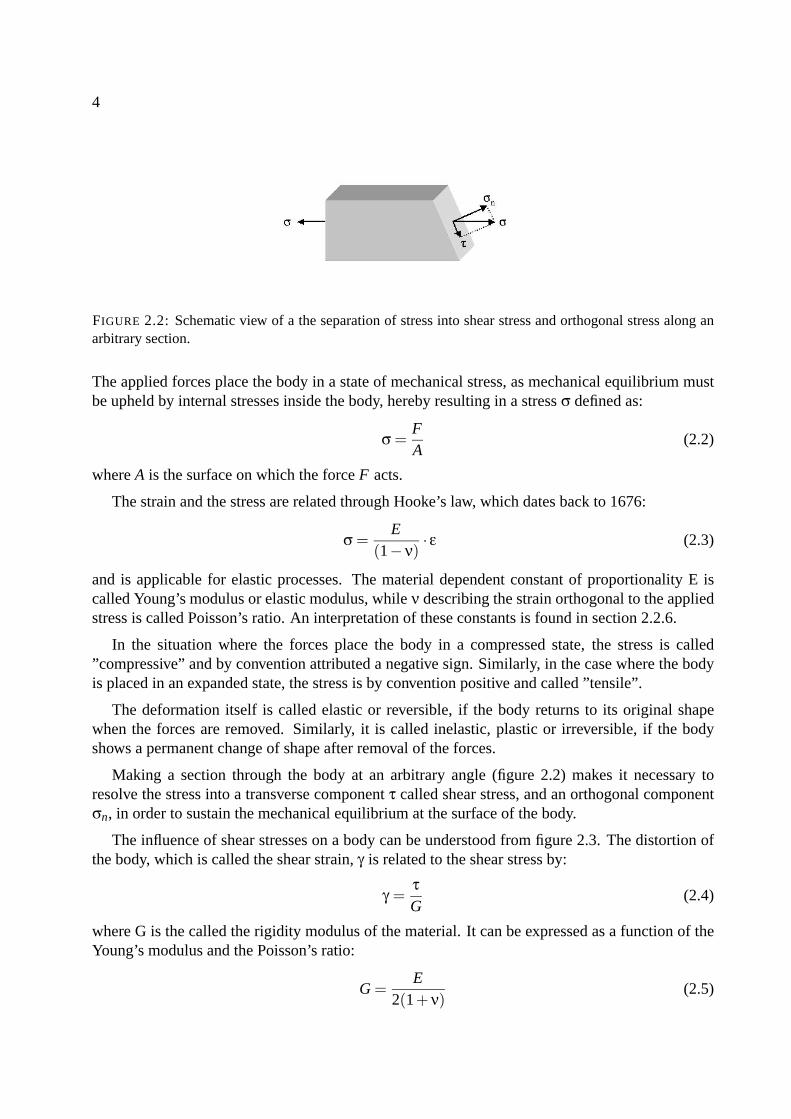
FIGURE 2.2: Schematic view of a the separation of stress into shear stress and orthogonal stress along anarbitrary section.
The applied forces place the body in a state of mechanical stress, as mechanical equilibrium mustbe upheld by internal stresses inside the body, hereby resulting in a stress σ defined as:
σ =FA
(2.2)
where A is the surface on which the force F acts.
The strain and the stress are related through Hooke’s law, which dates back to 1676:
σ =E
(1−ν)· ε (2.3)
and is applicable for elastic processes. The material dependent constant of proportionality E iscalled Young’s modulus or elastic modulus, while ν describing the strain orthogonal to the appliedstress is called Poisson’s ratio. An interpretation of these constants is found in section 2.2.6.
In the situation where the forces place the body in a compressed state, the stress is called”compressive” and by convention attributed a negative sign. Similarly, in the case where the bodyis placed in an expanded state, the stress is by convention positive and called ”tensile”.
The deformation itself is called elastic or reversible, if the body returns to its original shapewhen the forces are removed. Similarly, it is called inelastic, plastic or irreversible, if the bodyshows a permanent change of shape after removal of the forces.
Making a section through the body at an arbitrary angle (figure 2.2) makes it necessary toresolve the stress into a transverse component τ called shear stress, and an orthogonal componentσn, in order to sustain the mechanical equilibrium at the surface of the body.
The influence of shear stresses on a body can be understood from figure 2.3. The distortion ofthe body, which is called the shear strain, γ is related to the shear stress by:
γ =τG
(2.4)
where G is the called the rigidity modulus of the material. It can be expressed as a function of theYoung’s modulus and the Poisson’s ratio:
G =E
2(1+ν)(2.5)

5
FIGURE 2.3: Schematic view of the effects of a shear stress on a body, resulting in a shear strain.
Additionally, the shear strain can be expressed as:
γ =∆ld
(2.6)
where ∆l is the change of length introduced by the shear stress at one side of the sample, and d isthe thickness of the sample as seen in figure 2.3. Hence γ can be interpreted as a change of angleintroduced in the body by the applied shear stress.
2.2 Elastic theory of mechanical stress
As thin films on substrates are three dimensional systems, the simple one-dimensional definitionsfrom section 2.1 do not suffice to describe the state of mechanical stress in a thin film. Additionalcomplications arise if the film or the substrate is anisotropic. Therefore, the description of mechan-ical stress in three dimensions is a rather complex matter. In this section, a thorough treatment ofthe theory of mechanical stress in three dimensions will be given. Even more details can be foundfor instance in references [94], [76] and [119].
2.2.1 The strain tensor
When a body is subjected to an applied force, the relative position of the atoms within it are altered,and the body is said to be strained or deformed. The initial position P of a point in the body canbe described by a set of cartesian coordinates (x1,x2,x3), while the position P’ in the strained bodycan be characterized by the coordinates (x′1,x
′2,x
′3) (figure 2.4).
In the case of a linear transformation
x′i = ai0 + xi +3
∑j=1
(ai jx j) (i = 1,2,3) (2.7)
where the coefficients ai j are constants, the positions of the points P and P’ can be described by
a vector−→A , which has its origin in an arbitrary reference point (x0
1,x02,x
03), and a vector
−→A′ whose
6
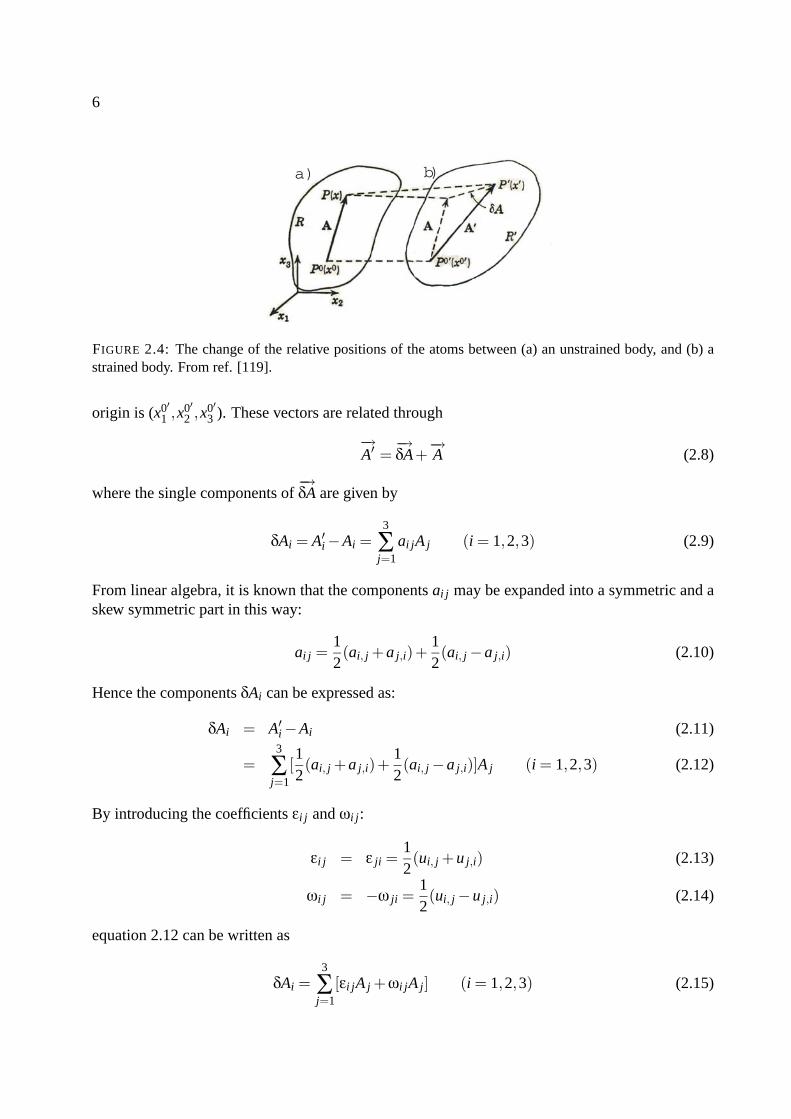
a) b)
FIGURE 2.4: The change of the relative positions of the atoms between (a) an unstrained body, and (b) astrained body. From ref. [119].
origin is (x0′1 ,x0′
2 ,x0′3 ). These vectors are related through
−→A′ =
−→δA+
−→A (2.8)
where the single components of−→δA are given by
δAi = A′i −Ai =
3
∑j=1
ai jA j (i = 1,2,3) (2.9)
From linear algebra, it is known that the components ai j may be expanded into a symmetric and askew symmetric part in this way:
ai j =12(ai, j +a j,i)+
12(ai, j −a j,i) (2.10)
Hence the components δAi can be expressed as:
δAi = A′i −Ai (2.11)
=3
∑j=1
[12(ai, j +a j,i)+
12(ai, j −a j,i)]A j (i = 1,2,3) (2.12)
By introducing the coefficients εi j and ωi j:
εi j = ε ji =12(ui, j +u j,i) (2.13)
ωi j = −ω ji =12(ui, j −u j,i) (2.14)
equation 2.12 can be written as
δAi =3
∑j=1
[εi jA j +ωi jA j] (i = 1,2,3) (2.15)

7
To interpret (2.15), it is useful to consider the implication of a pure translational motion. Such arigid body motion is characterized by the fact that the length of any vector
−→A :
A = |−→A | =√√√√ 3
∑i=1
AiAi (2.16)
is not changed. After an infinitesimal linear transformation like (2.7), the change in length δA canbe expressed as:
AδA =3
∑i=1
[AiδAi] (2.17)
where higher order terms in δAi are neglected. Inserting the expression for δAi, (2.9) one finds:
AδA =3
∑i=1
3
∑j=1
ai jAiA j (2.18)
For pure translation δA must vanish for all values of A1, A2 and A3. Hence the following require-ments must be satisfied:
a11 = 0 (2.19)
a22 = 0 (2.20)
a33 = 0 (2.21)
a12 +a21 = 0 (2.22)
a23 +a32 = 0 (2.23)
a31 +a13 = 0 (2.24)
(2.25)
This means that skew symmetry i.e. ai j = a ji, is a sufficient condition for the transformation to bepure translation.
With this knowledge in hand, an interpretation of equation 2.15 is now possible: The termcontaining the skew symmetric coefficients ωi j corresponds to pure translational motion, whilethe term containing the coefficients εi j represents pure deformation. Hence the coefficients εi j aredefined as the components of the strain tensor ε:
ε =
⎡⎣ε11 ε12 ε13
ε21 ε22 ε23
ε31 ε32 ε33
⎤⎦ (2.26)
2.2.2 The components of strain: Geometrical interpretation
Diagonal elements, εii
At the beginning of this chapter strain was defined as the normalized length increase of a one-dimensional body. By considering the geometrical interpretation of the components of the strain
8
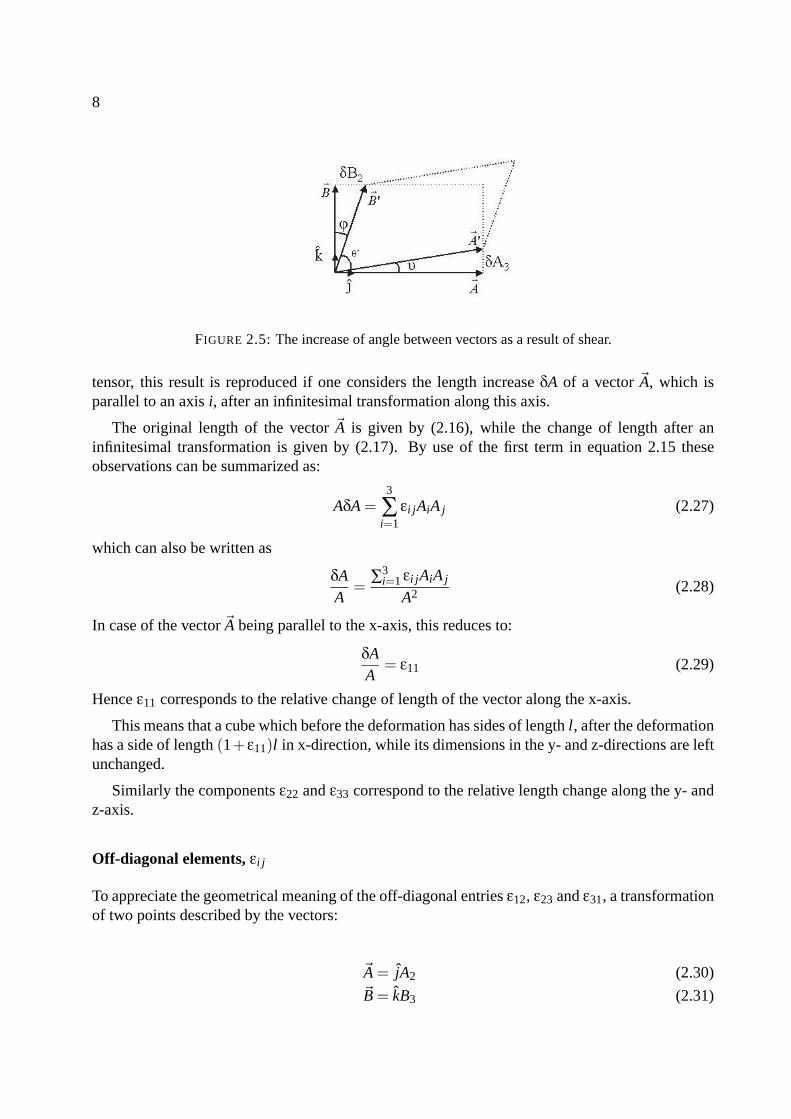
FIGURE 2.5: The increase of angle between vectors as a result of shear.
tensor, this result is reproduced if one considers the length increase δA of a vector A, which isparallel to an axis i, after an infinitesimal transformation along this axis.
The original length of the vector A is given by (2.16), while the change of length after aninfinitesimal transformation is given by (2.17). By use of the first term in equation 2.15 theseobservations can be summarized as:
AδA =3
∑i=1
εi jAiA j (2.27)
which can also be written as
δAA
=∑3
i=1 εi jAiA j
A2 (2.28)
In case of the vector A being parallel to the x-axis, this reduces to:
δAA
= ε11 (2.29)
Hence ε11 corresponds to the relative change of length of the vector along the x-axis.
This means that a cube which before the deformation has sides of length l, after the deformationhas a side of length (1+ε11)l in x-direction, while its dimensions in the y- and z-directions are leftunchanged.
Similarly the components ε22 and ε33 correspond to the relative length change along the y- andz-axis.
Off-diagonal elements, εi j
To appreciate the geometrical meaning of the off-diagonal entries ε12, ε23 and ε31, a transformationof two points described by the vectors:
A = jA2 (2.30)B = kB3 (2.31)
9
can be considered. j and k are the unit vectors in y- and z-direction (figure 2.5). After the defor-mation these vectors become:
A′ = iδA1 + j(A2 +δA2)+ kδA3 (2.32)B′ = iδB1 + jδB2 + k(B3 +δB3) (2.33)
While the angle between A and B is 90, the angle θ′ between A′ and B′ can be calculated from
cosθ′ =A′ ·B′
|A′||B′| (2.34)
=A2δB2 +B3δA3
A2B3(2.35)
=δB2
B3+
δA3
A2(2.36)
where the products of δA and δB have been neglected. This expression can be further reduced, asfrom equation 2.15 one has:
δB2 = ε23B3 (2.37)
δA3 = ε23A2 (2.38)
Inserting (2.37) and (2.38) into equation 2.36 yields:
cosθ′ = 2ε23 (2.39)
If one considers the change of the right angle between A and B (φ = 90 - θ′) it follows that forsmall changes:
cosθ′ = sin(90 −φ) = sinφ = φ = 2ε23 (2.40)
Hence ε23 simply describes the change in the angle between the vectors A and B after the defor-mation (fig. 2.6)
From figure 2.5 it can be seen that for small angles:
ϑ = tanϑ =δA3
A2= ε23 (2.41)
and
ϕ = tanϕ =δB2
B3= ε23 (2.42)
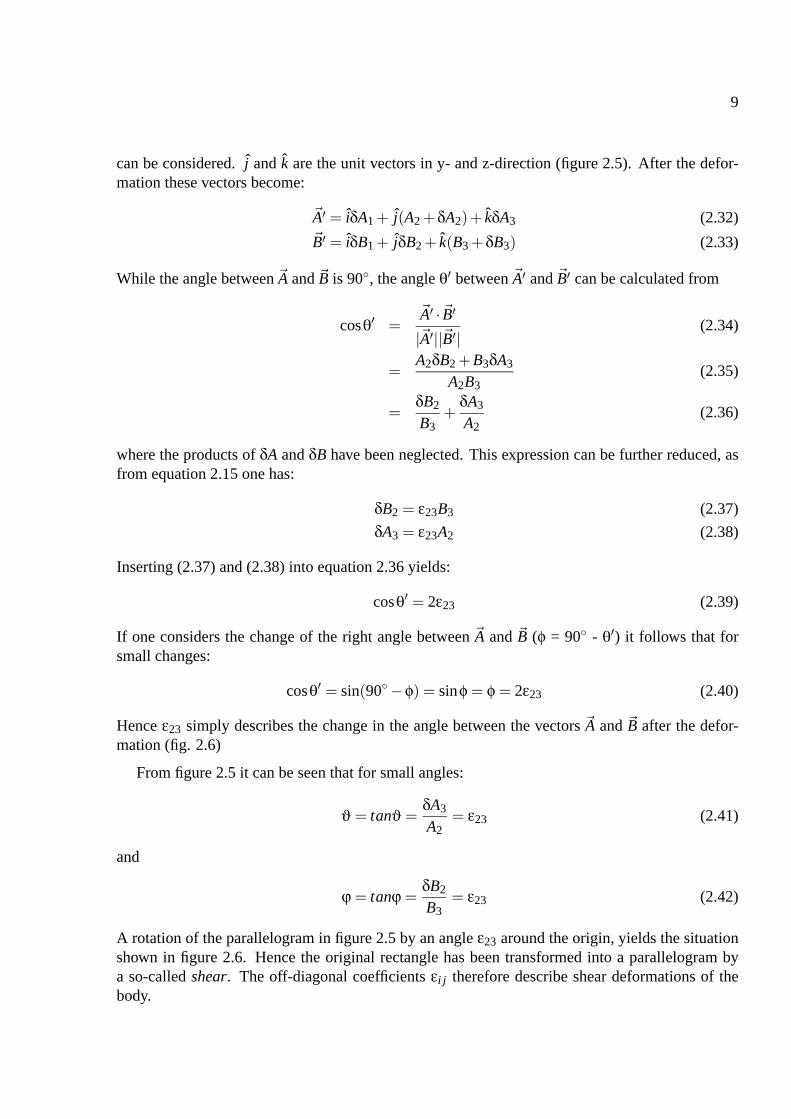
A rotation of the parallelogram in figure 2.5 by an angle ε23 around the origin, yields the situationshown in figure 2.6. Hence the original rectangle has been transformed into a parallelogram bya so-called shear. The off-diagonal coefficients εi j therefore describe shear deformations of thebody.
10
FIGURE 2.6: As a result of shear a rectangular shaped body is transformed into a parallelogram.
To distinguish between the diagonal elements of the strain tensor corresponding to lengthchanges along the primary axis and the off-diagonal components, the shear strains are often de-noted γi j. For the remainder of this work this practice is employed, meaning that the strain tensortakes on the form:
ε =
⎡⎣ε11 γ12 γ13
γ21 ε22 γ23
γ31 γ32 ε33
⎤⎦ (2.43)
2.2.3 Stress
The simple definition of stress given in section 2.1 is not an accurate one when it comes to de-scribing a state of stress in a three-dimensional body. As it was the case for the strain as shown insection 2.2.1, a tensor notation of the stress is useful.
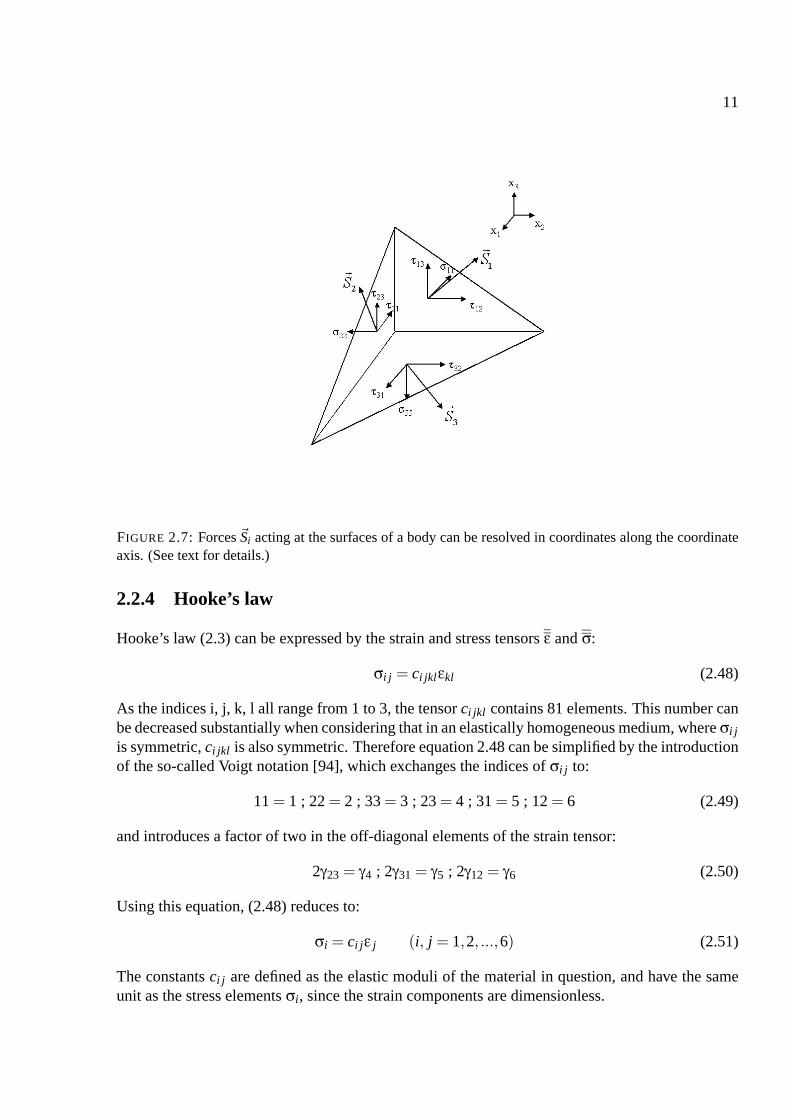
In figure 2.7 a body is shown which is subject to forces Si acting on its surfaces. These surfaceforces are expressed as force per unit area of the surface at which they are acting. i denotes thenormal of the surface. Resolving the components of Si into components along the coordinate axisyields:
Si = e jSi j (2.44)
= e jσi j (2.45)
where the definition
σi j = Si j (2.46)
was introduced. The elements σi j constitute a tensor σ which is called the stress tensor. The indicesi and j refer to the coordinate axis normal to the surface on which S acts and the direction of thecomponents of S, respectively.
In the case of a rhombic body as shown in figure 2.7, it can be seen that the diagonal entries σ11,σ22 and σ33 correspond to normal stresses, while the remaining off-diagonal elements constituteshear stresses. Hence the shear stresses are sometimes denoted τi j. This convention is employedfor the remainder of this work, meaning that the stress tensor takes on the form:
σ =
⎡⎣σ11 τ12 τ13
τ21 σ22 τ23
τ31 τ32 σ33
⎤⎦ (2.47)
11
FIGURE 2.7: Forces Si acting at the surfaces of a body can be resolved in coordinates along the coordinateaxis. (See text for details.)
2.2.4 Hooke’s law
Hooke’s law (2.3) can be expressed by the strain and stress tensors ε and σ:
σi j = ci jklεkl (2.48)
As the indices i, j, k, l all range from 1 to 3, the tensor ci jkl contains 81 elements. This number canbe decreased substantially when considering that in an elastically homogeneous medium, where σi j
is symmetric, ci jkl is also symmetric. Therefore equation 2.48 can be simplified by the introductionof the so-called Voigt notation [94], which exchanges the indices of σi j to:
11 = 1 ; 22 = 2 ; 33 = 3 ; 23 = 4 ; 31 = 5 ; 12 = 6 (2.49)
and introduces a factor of two in the off-diagonal elements of the strain tensor:
2γ23 = γ4 ; 2γ31 = γ5 ; 2γ12 = γ6 (2.50)
Using this equation, (2.48) reduces to:
σi = ci jε j (i, j = 1,2, ...,6) (2.51)
The constants ci j are defined as the elastic moduli of the material in question, and have the sameunit as the stress elements σi, since the strain components are dimensionless.
12
Just as the stresses can be determined from the strains, the strains can be determined from thestresses in similar way by use of the moduli si j :
ε j = si jσi (i, j = 1,2, ...,6) (2.52)
For practical use however, the calculation of the strain and the stress components can be simplifiedby considering the expression of the elastic energy density of a material [4]:
fel =12 ∑
i, jci jεiε j (2.53)
which can be shown to be related to the stress tensor components by [119]:
σi =∂ fel
∂εi(2.54)
This helpful relation will be used in the following section.
2.2.5 Directional dependence of elastic properties
When the symmetry of the considered material increases, the number of independent elastic modulidecreases. For materials possessing a geometrical symmetry determined by their crystal structureetc., a degree of elastic symmetry is also given. Hence their elastic properties are identical alongcertain directions. In this section the structure of the matrix c for some common symmetry caseswill be presented. Details can be found in for instance ref. [94].
A significant simplification of the c tensor is found for materials classified as orthotropic i.e.materials, that have three mutually orthogonal planes of elastic symmetry. If the set of coordinateaxis is chosen such that the coordinate planes coincide with the planes of elastic symmetry, theelastic properties of the material can be characterized by only 9 independent components ci j:
corthotropici j =
⎡⎢⎢⎢⎢⎢⎢⎣
c11 c12 c13 0 0 0c21 c22 c23 0 0 0c31 c32 c33 0 0 00 0 0 c44 0 00 0 0 0 c55 00 0 0 0 0 c66
⎤⎥⎥⎥⎥⎥⎥⎦
(2.55)
This number is even further reduced in the case of a cubic system, where the symmetry leads tojust 3 independent entries:
ccubici j =
⎡⎢⎢⎢⎢⎢⎢⎣
c11 c12 c12 0 0 0c12 c11 c12 0 0 0c12 c12 c11 0 0 00 0 0 c44 0 00 0 0 0 c44 00 0 0 0 0 c44
⎤⎥⎥⎥⎥⎥⎥⎦
(2.56)
13
In the case of elastically isotropic materials, such as an amorphous medium, the c matrix simplifieseven further. The elastic properties of an isotropic medium are independent of the orientation ofthe coordinate axis. Hence the components ci j are invariant to any rotation of these axis. Byapplication of this concept, the c matrix reduces to:
cisotropici j =
⎡⎢⎢⎢⎢⎢⎢⎣
c11 c12 c12 0 0 0c12 c11 c12 0 0 0c12 c12 c11 0 0 00 0 0 1
2(c11 − c12) 0 00 0 0 0 1
2(c11 − c12) 00 0 0 0 0 1
2(c11 − c12)
⎤⎥⎥⎥⎥⎥⎥⎦
(2.57)
where it has been applied that [94]:
c44 =12(c11 − c12) (2.58)
For crystalline materials the ¯c matrix is reduced by the degree of symmetry of the crystal structure.As examples, a cubic system has the non-zero elements shown in equation 2.56, while the non-zeroelements of the hexagonal crystal group are:
chexagonali j =
⎡⎢⎢⎢⎢⎢⎢⎣
c11 c12 c13 0 0 0c12 c11 c13 0 0 0c13 c13 c11 0 0 00 0 0 c44 0 00 0 0 0 c44 00 0 0 0 0 1
2(c11 − c12)
⎤⎥⎥⎥⎥⎥⎥⎦
(2.59)
As opposed to the isotropic case, only c66 = 12(c11 − c12) in the case of hexagonal symmetry.
By use of these matrices, the corresponding elastic energy densities can be calculated usingequation 2.53, and the resulting strains and stresses can be derived from equation 2.54. An exampleis shown in the following section.
2.2.6 Elastic constants
In the case of cubic materials, the elastic energy density can be expressed by use of (2.53):
f cubicel =
12 ∑
i, jci jεiε j
=12
c11(ε21 + ε2
2 + ε23)+ c12(ε1ε2 + ε2ε3 + ε3ε1)+
12
c44(γ24 + γ2
5 + γ26)
The components of the stress tensor σi can now be evaluated from equation 2.54. As an example
14
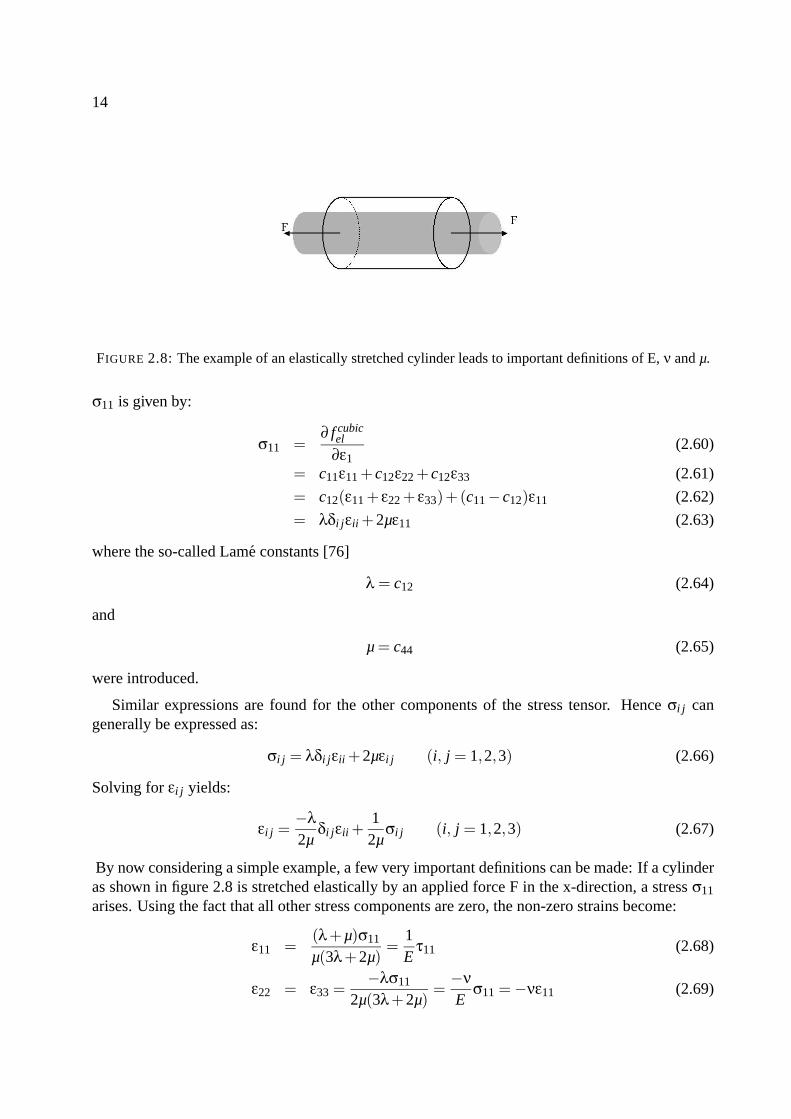
FIGURE 2.8: The example of an elastically stretched cylinder leads to important definitions of E, ν and µ.
σ11 is given by:
σ11 =∂ f cubic
el
∂ε1(2.60)
= c11ε11 + c12ε22 + c12ε33 (2.61)
= c12(ε11 + ε22 + ε33)+(c11 − c12)ε11 (2.62)
= λδi jεii +2µε11 (2.63)
where the so-called Lame constants [76]
λ = c12 (2.64)
and
µ = c44 (2.65)
were introduced.
Similar expressions are found for the other components of the stress tensor. Hence σi j cangenerally be expressed as:
σi j = λδi jεii +2µεi j (i, j = 1,2,3) (2.66)
Solving for εi j yields:
εi j =−λ2µ
δi jεii +12µ
σi j (i, j = 1,2,3) (2.67)
By now considering a simple example, a few very important definitions can be made: If a cylinderas shown in figure 2.8 is stretched elastically by an applied force F in the x-direction, a stress σ11
arises. Using the fact that all other stress components are zero, the non-zero strains become:
ε11 =(λ+µ)σ11
µ(3λ+2µ)=
1E
τ11 (2.68)
ε22 = ε33 =−λσ11
2µ(3λ+2µ)=
−νE
σ11 = −νε11 (2.69)
15
where
E =µ(3λ+2µ)
µ+λ(2.70)
is called the Young’s modulus, and represents the ratio of the stress σ to the the strain ε in a certaindirection. Similarly
ν =λ
2(µ+λ)(2.71)
is called the Poisson’s ratio. From equation 2.69 it can be appreciated, that ν represents the con-traction or expansion of the body perpendicular to the axis of the applied force. By comparisonwith (2.52), it can be found that E and ν can be expressed as:
E =1
s11(2.72)
and
ν = −s12
s11(2.73)
In the case of a pure shear stress however, the only non-zero stress component as an example isσ23. From equation 2.67, the corresponding strain element is then given by:
γ23 =−τ23
2µ(2.74)
As shown in section 2.2.2, the strain γ23 corresponds to an increase of the angle φ in figure 2.6.Hence by applying equation 2.40 µ is given by:
µ =τ23
φ(2.75)
and can thus be interpreted as the ratio of the shear stress to the increase in angle introduced bythe shear stress. Therefore µ (or G as is it sometimes denoted) is called the shear modulus or therigidity modulus.
The three elastic constants, E, ν and µ are extremely important in the determination of stressesas shown below.
2.3 Substrate bending induced by mechanical stress
In a thin film, mechanical stresses can arise because the film is grown on and therefore fixed toa substrate. As it will be explained in detail below, a volume change in the film and heating ofthe sample amongst other processes, will result in stresses as the expansion or contraction of thefilm is constrained by the substrate. During growth so-called deposition stresses can arise. In
16
epitaxial films such stresses can arise as result of lattice mismatch etc., while in the production ofamorphous films stresses can arise as a consequence of a variety of involved processes, which arefurther discussed in chapter 5.4.
One of the most amazing effects of mechanical stresses in thin films is the bending it inducesin the entire sample including the substrate. In this section a derivation of this phenomenon basedon the work of Timoschenko and Woineowsky-Krieger [126] is presented.
Mechanical stress in the thin film will tend to compress or expand the substrate dimensions, asa force corresponding to the mechanical stress in the film:
F = σ ·A (2.76)
will be acting on the surface of the substrate at the interface. Additionally, the force inducesbending moments in the plane along the x- and y-axis of system given by:
Mx = My = Fxr (2.77)
Because of these bending moments, the substrate will bend and attain a given curvature along itsx- and y-axis.
As the mechanical stress in the film σ f gives rise to a force acting on the substrate as describedabove, it works as a shear stress τ on the substrate. In this case the bending moments can becalculated to [96]:
Mx =12
τxwd f ds (2.78)
and
My =12
τyld f ds (2.79)
where l is the length of the sample and w is its width, while the substrate and film thicknesses aredenoted ds and d f , respectively.
The relation between the bending moments and the radii of curvature of the substrate dependson the nature of the substrate. Anisotropy and the resulting directional dependence of the Young’smodulus and the Poisson’s ratio must be considered if anisotropic substrates are used. For sub-strates that are isotropic in the plane, such as ones of orientations hexagonal (0001), cubic (100)and (111), the following expressions are valid [76]:
Mx =Esd3
s w12(1−ν2
s )
(1Rx
−νs1Ry
)(2.80)
and
My =Esd3
s l12(1−ν2
s )
(1Ry
+νs1Rx
)(2.81)
Combining equations (2.78)-(2.81) yields:
σx =Esd2
s
6(1−ν2s )d f
(1Rx
+νs1Ry
)(2.82)
17
and
σy =Esd2
s
6(1−ν2s )d f
(1Ry
+νs1Rx
)(2.83)
These equations link the stress components σx and σy (by convention called in-plane stresses),which work as shear stresses τx and τy on the substrate, to the radii of curvature along the x- and y-axis. For cases where the stress is isotropic i.e. in cases of isotropic films such as in the amorphousand polycrystalline cases, σx equals σy. Therefore the equations (2.82) and (2.83) reduce to
σ = σx = σy =Esd2
s
6(1−νs)d f
1R
(2.84)
Equation 2.84 is known as the Stoney equation [104]. It includes the term (1− νs), which wasnot included by Stoney, as he did not consider the two-dimensional nature of the curvature. Inliterature there is also no consistency regarding this topic. Too often the term E/(1−ν) is referredto as the ”Young’s modulus” even though it is correctly labelled as the ”biaxial modulus”, Y .
Additionally, in experiments one should consider the initial radius of curvature R0 of the sub-strate. Perfectly flat substrates are not common. Hence, for measurements of exact stresses, theStoney equation should include a term related to R0:
σ =Esd2
s
6(1−νs)d f
(1R− 1
R0
)(2.85)
2.4 Volume changes and mechanical stress
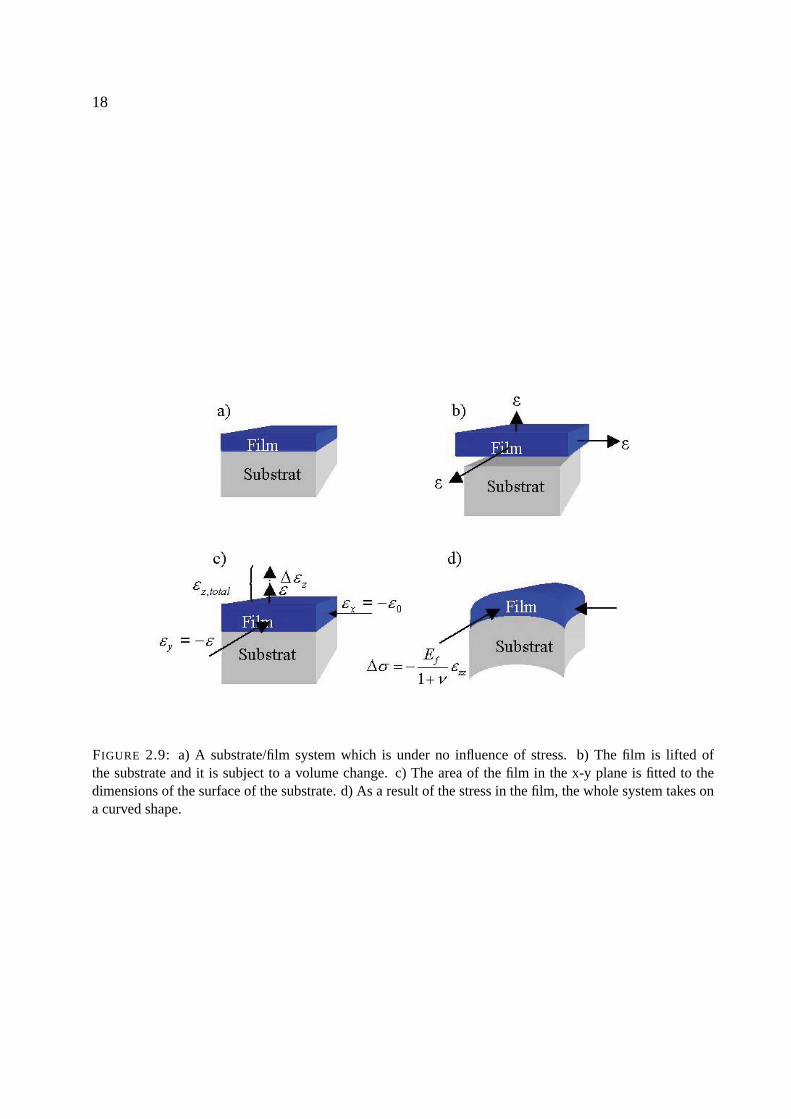
When the film is subject to a volume change, the description of the mechanical stress is simpleas long as the processes involved are elastic. From the following simple ”Gedanken-experiment”[65], a complete set of equations describing such a scenario can be derived.
In figure 2.9.a, a system consisting of a substrate and a film is shown. The film is under noinfluence of stress. The first step in changing this is to remove the film from the substrate andsubject it to a volume change. This volume change corresponds to a strain ε along the three majoraxis (figure 2.9.b):
ε =∆ww0
=∆ll0
=∆dd0
(2.86)
Fixing the expanded film to the substrate is impossible at this stage, as its area does not conformwith the area of the substrate. Therefore the film area must be fitted to the area of the substrate byapplication of an external force in the x-y plane (figure 2.9.c). Hence a strain of
εx = εy = −ε (2.87)
must be induced in the film. Associated with this strain in the x-y plane is an additional strain inthe z direction:
∆εz =2ν
1−νε (2.88)
18
FIGURE 2.9: a) A substrate/film system which is under no influence of stress. b) The film is lifted ofthe substrate and it is subject to a volume change. c) The area of the film in the x-y plane is fitted to thedimensions of the surface of the substrate. d) As a result of the stress in the film, the whole system takes ona curved shape.
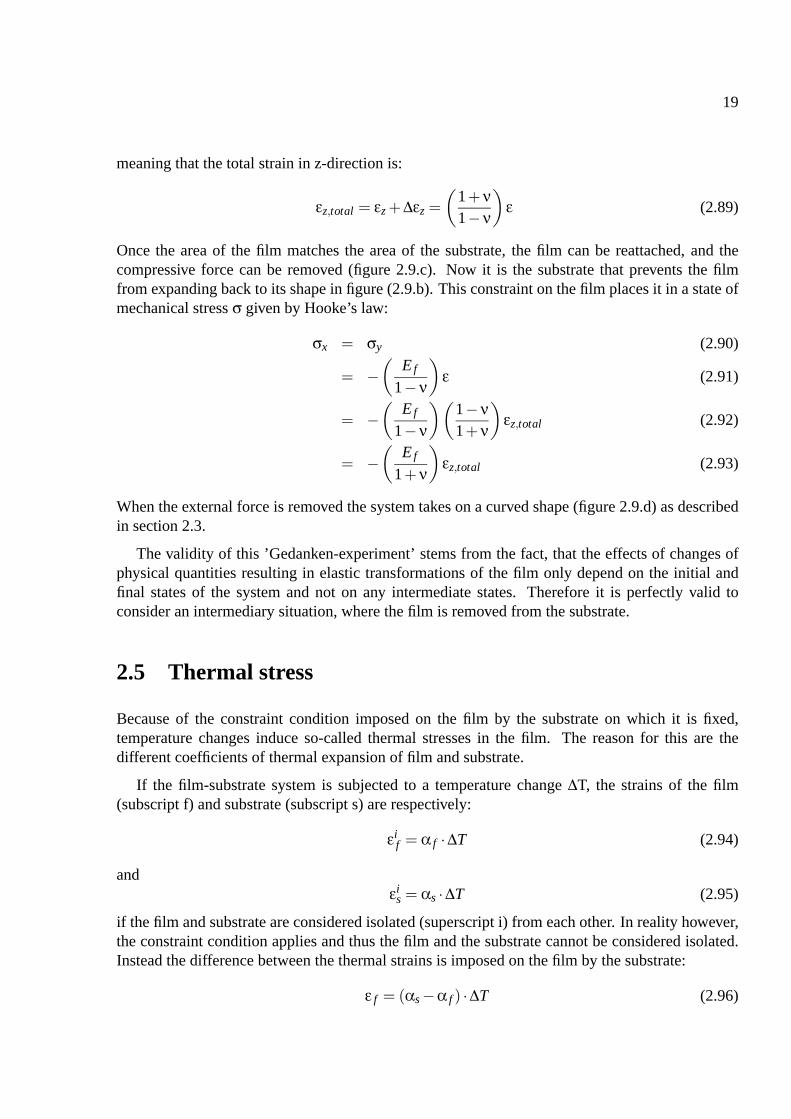
19
meaning that the total strain in z-direction is:
εz,total = εz +∆εz =(
1+ν1−ν
)ε (2.89)
Once the area of the film matches the area of the substrate, the film can be reattached, and thecompressive force can be removed (figure 2.9.c). Now it is the substrate that prevents the filmfrom expanding back to its shape in figure (2.9.b). This constraint on the film places it in a state ofmechanical stress σ given by Hooke’s law:
σx = σy (2.90)
= −(
E f
1−ν
)ε (2.91)
= −(
E f
1−ν
)(1−ν1+ν
)εz,total (2.92)
= −(
E f
1+ν
)εz,total (2.93)
When the external force is removed the system takes on a curved shape (figure 2.9.d) as describedin section 2.3.
The validity of this ’Gedanken-experiment’ stems from the fact, that the effects of changes ofphysical quantities resulting in elastic transformations of the film only depend on the initial andfinal states of the system and not on any intermediate states. Therefore it is perfectly valid toconsider an intermediary situation, where the film is removed from the substrate.
2.5 Thermal stress
Because of the constraint condition imposed on the film by the substrate on which it is fixed,temperature changes induce so-called thermal stresses in the film. The reason for this are thedifferent coefficients of thermal expansion of film and substrate.
If the film-substrate system is subjected to a temperature change ∆T, the strains of the film(subscript f) and substrate (subscript s) are respectively:
εif = α f ·∆T (2.94)
andεi
s = αs ·∆T (2.95)
if the film and substrate are considered isolated (superscript i) from each other. In reality however,the constraint condition applies and thus the film and the substrate cannot be considered isolated.Instead the difference between the thermal strains is imposed on the film by the substrate:
ε f = (αs −α f ) ·∆T (2.96)

20
Associated with this strain is a biaxial stress given by Hooke’s law (2.3):
σ f =E f
1−ν f(αs −α f ) ·∆T = Yf (αs −α f ) ·∆T (2.97)
As the coefficient of thermal expansion can vary significantly between substrate and film, largestresses can be induced by thermal changes. For instance, elevated temperatures during depositionwill result in an introduction of thermal stresses in the film, when it is cooled to room temperatureafter growth.
2.5.1 Determination of elastic constants by exploiting thermal stresses
The nature of the relation describing thermal stresses (equation 2.97) implicates that the biaxialmodulus and the coefficient of thermal expansion of an unknown film can be determined by asimple experiment: If identical films are deposited on two substrates with well-known coefficientsof thermal expansion, measurements of their thermal stress as a function of a given temperaturechange will yield the desired information, as the thermal stresses in the two cases are:
σ f ,s1 =E f
1−ν f(αs1 −α f ) ·∆Ts1 (2.98)
and
σ f ,s2 =E f
1−ν f(αs2 −α f ) ·∆Ts2 (2.99)
Solving the coupled equations yields:
Yf =
(∆σ f ,s1∆Ts2
)−(
∆σ f ,s2∆Ts2
)αs1 −αs2
(2.100a)
α f =αs2 ·
(∆σ f ,s1∆Ts1
)−αs1 ·
(∆σ f ,s2∆Ts2
)(
∆σ f ,s1∆Ts1
)−(
∆σ f ,s2∆Ts2
) (2.100b)
Hence, the elastic constants of an unknown film can be determined without knowledge of itsstructure or identity.
2.6 Stress relaxation
This section treats the topic of irreversible deformations in materials. When the mechanical stressbecomes too large i.e. when it surpasses the material dependent elastic limit (or proportionallimit), the deformation is no longer elastic and reversible. Above this threshold, plastic flow oryielding is observed, and the bonds of the material are broken or irreversibly rearranged. This canbe understood from fig. 2.10. As long as the relation between stress and strain is linear, elastic
21
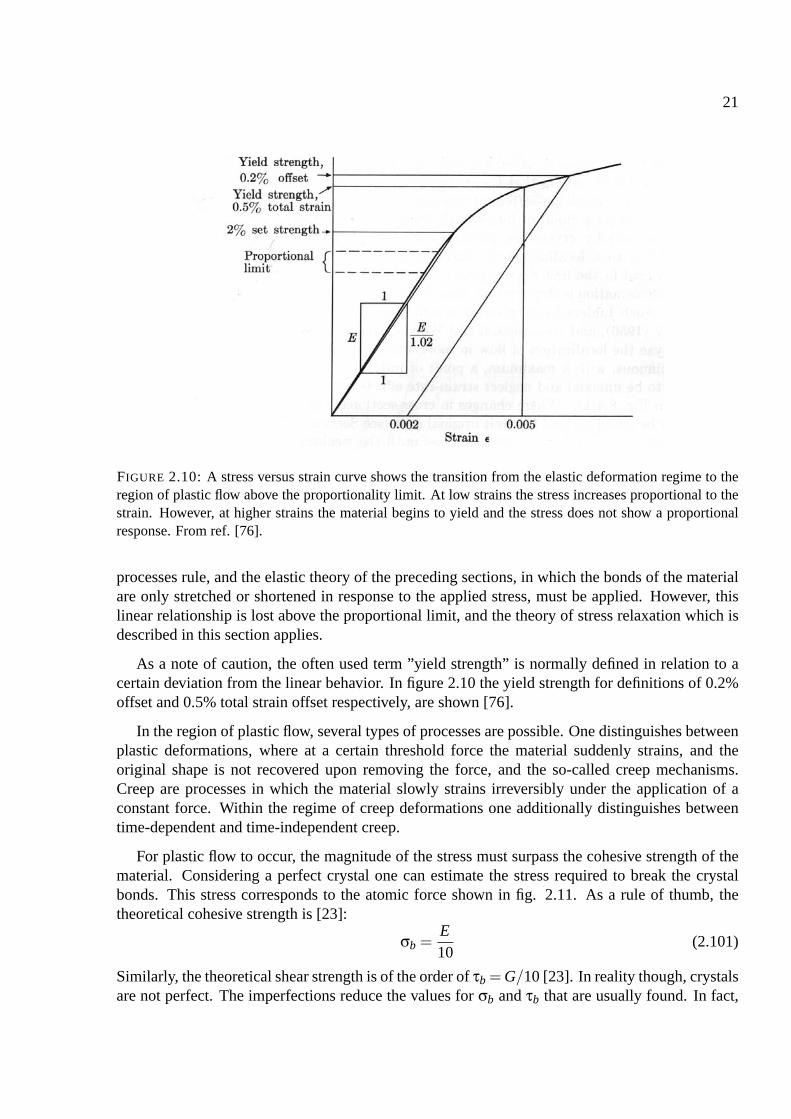
FIGURE 2.10: A stress versus strain curve shows the transition from the elastic deformation regime to theregion of plastic flow above the proportionality limit. At low strains the stress increases proportional to thestrain. However, at higher strains the material begins to yield and the stress does not show a proportionalresponse. From ref. [76].
processes rule, and the elastic theory of the preceding sections, in which the bonds of the materialare only stretched or shortened in response to the applied stress, must be applied. However, thislinear relationship is lost above the proportional limit, and the theory of stress relaxation which isdescribed in this section applies.
As a note of caution, the often used term ”yield strength” is normally defined in relation to acertain deviation from the linear behavior. In figure 2.10 the yield strength for definitions of 0.2%offset and 0.5% total strain offset respectively, are shown [76].
In the region of plastic flow, several types of processes are possible. One distinguishes betweenplastic deformations, where at a certain threshold force the material suddenly strains, and theoriginal shape is not recovered upon removing the force, and the so-called creep mechanisms.Creep are processes in which the material slowly strains irreversibly under the application of aconstant force. Within the regime of creep deformations one additionally distinguishes betweentime-dependent and time-independent creep.
For plastic flow to occur, the magnitude of the stress must surpass the cohesive strength of thematerial. Considering a perfect crystal one can estimate the stress required to break the crystalbonds. This stress corresponds to the atomic force shown in fig. 2.11. As a rule of thumb, thetheoretical cohesive strength is [23]:
σb =E10
(2.101)
Similarly, the theoretical shear strength is of the order of τb = G/10 [23]. In reality though, crystalsare not perfect. The imperfections reduce the values for σb and τb that are usually found. In fact,
22
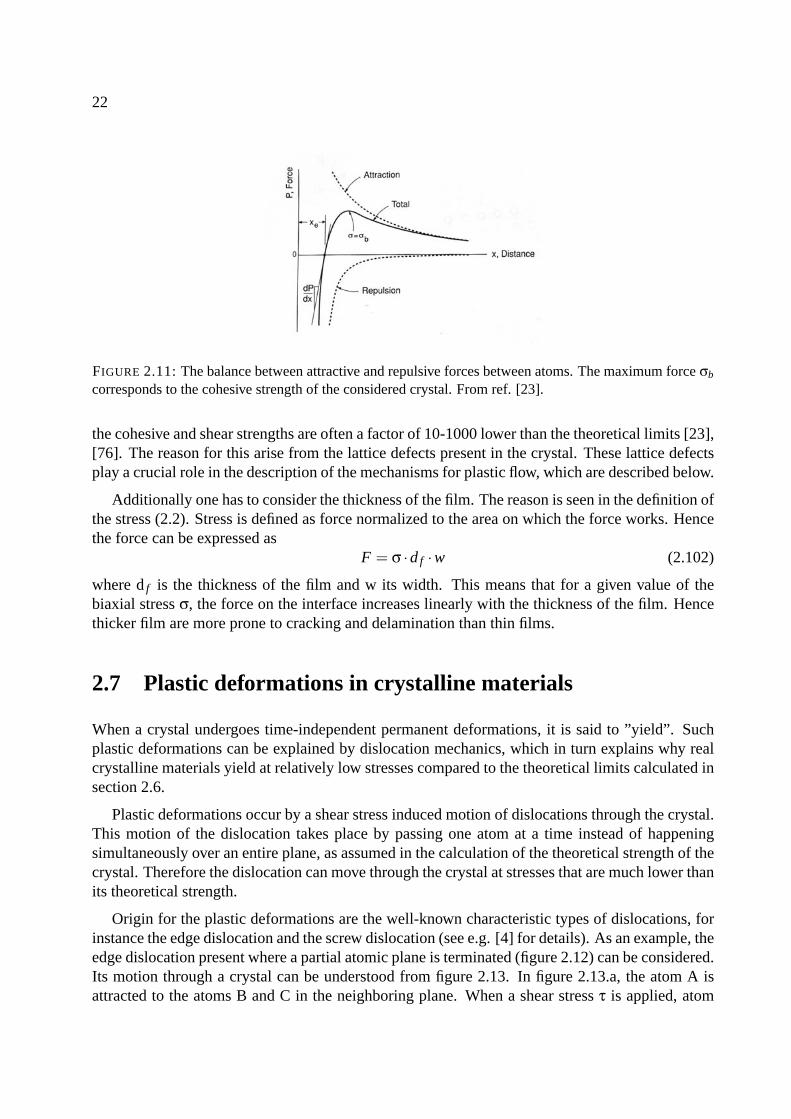
FIGURE 2.11: The balance between attractive and repulsive forces between atoms. The maximum force σb
corresponds to the cohesive strength of the considered crystal. From ref. [23].
the cohesive and shear strengths are often a factor of 10-1000 lower than the theoretical limits [23],[76]. The reason for this arise from the lattice defects present in the crystal. These lattice defectsplay a crucial role in the description of the mechanisms for plastic flow, which are described below.
Additionally one has to consider the thickness of the film. The reason is seen in the definition ofthe stress (2.2). Stress is defined as force normalized to the area on which the force works. Hencethe force can be expressed as
F = σ ·d f ·w (2.102)
where d f is the thickness of the film and w its width. This means that for a given value of thebiaxial stress σ, the force on the interface increases linearly with the thickness of the film. Hencethicker film are more prone to cracking and delamination than thin films.
2.7 Plastic deformations in crystalline materials
When a crystal undergoes time-independent permanent deformations, it is said to ”yield”. Suchplastic deformations can be explained by dislocation mechanics, which in turn explains why realcrystalline materials yield at relatively low stresses compared to the theoretical limits calculated insection 2.6.
Plastic deformations occur by a shear stress induced motion of dislocations through the crystal.This motion of the dislocation takes place by passing one atom at a time instead of happeningsimultaneously over an entire plane, as assumed in the calculation of the theoretical strength of thecrystal. Therefore the dislocation can move through the crystal at stresses that are much lower thanits theoretical strength.
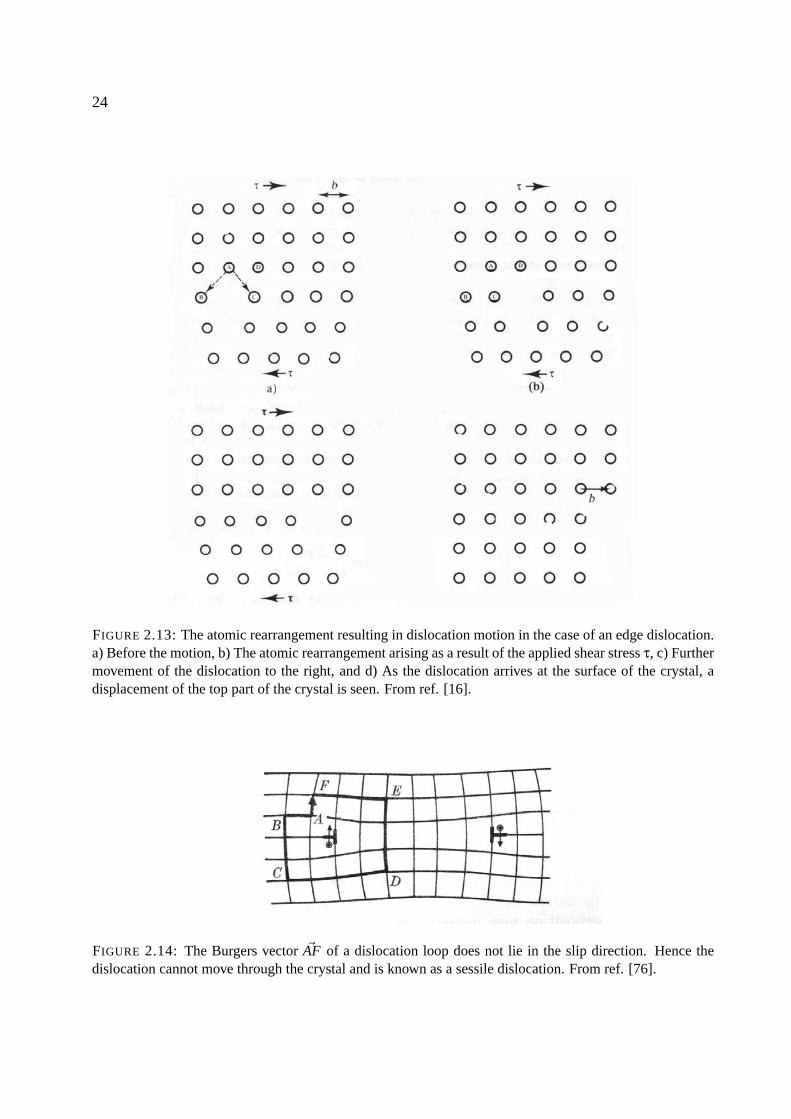
Origin for the plastic deformations are the well-known characteristic types of dislocations, forinstance the edge dislocation and the screw dislocation (see e.g. [4] for details). As an example, theedge dislocation present where a partial atomic plane is terminated (figure 2.12) can be considered.Its motion through a crystal can be understood from figure 2.13. In figure 2.13.a, the atom A isattracted to the atoms B and C in the neighboring plane. When a shear stress τ is applied, atom
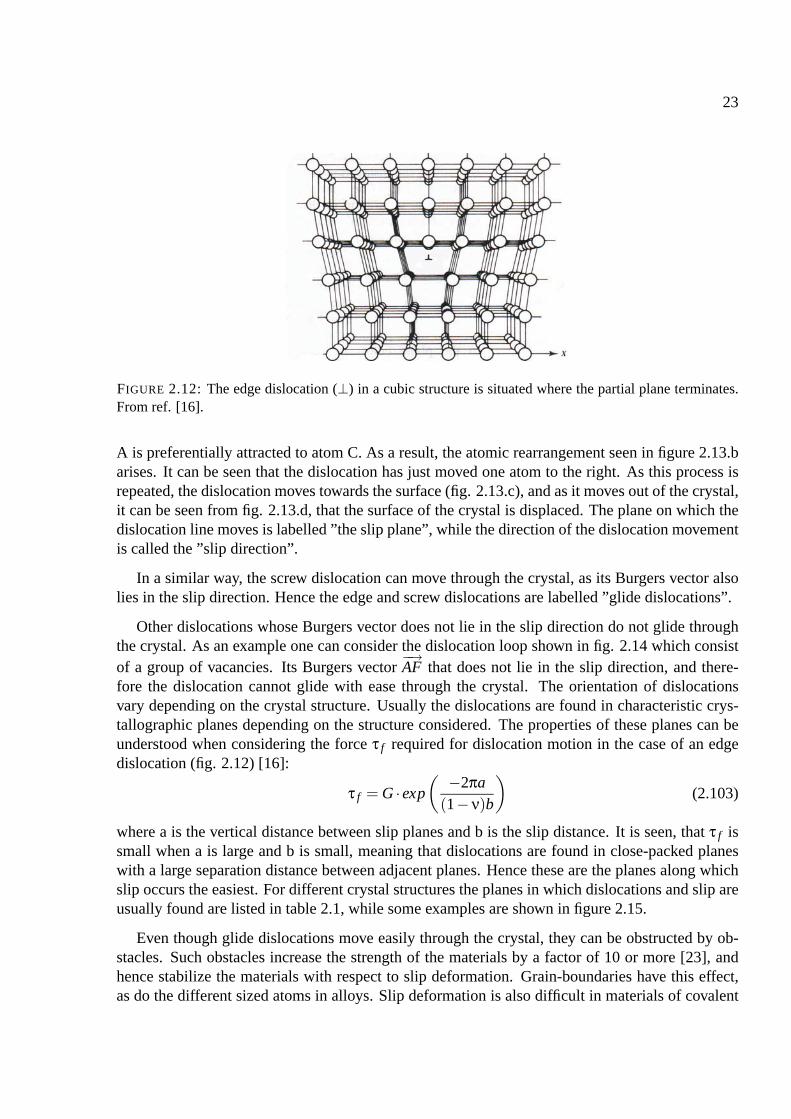
23
FIGURE 2.12: The edge dislocation (⊥) in a cubic structure is situated where the partial plane terminates.From ref. [16].
A is preferentially attracted to atom C. As a result, the atomic rearrangement seen in figure 2.13.barises. It can be seen that the dislocation has just moved one atom to the right. As this process isrepeated, the dislocation moves towards the surface (fig. 2.13.c), and as it moves out of the crystal,it can be seen from fig. 2.13.d, that the surface of the crystal is displaced. The plane on which thedislocation line moves is labelled ”the slip plane”, while the direction of the dislocation movementis called the ”slip direction”.
In a similar way, the screw dislocation can move through the crystal, as its Burgers vector alsolies in the slip direction. Hence the edge and screw dislocations are labelled ”glide dislocations”.
Other dislocations whose Burgers vector does not lie in the slip direction do not glide throughthe crystal. As an example one can consider the dislocation loop shown in fig. 2.14 which consistof a group of vacancies. Its Burgers vector
−→AF that does not lie in the slip direction, and there-
fore the dislocation cannot glide with ease through the crystal. The orientation of dislocationsvary depending on the crystal structure. Usually the dislocations are found in characteristic crys-tallographic planes depending on the structure considered. The properties of these planes can beunderstood when considering the force τ f required for dislocation motion in the case of an edgedislocation (fig. 2.12) [16]:
τ f = G · exp
( −2πa(1−ν)b
)(2.103)
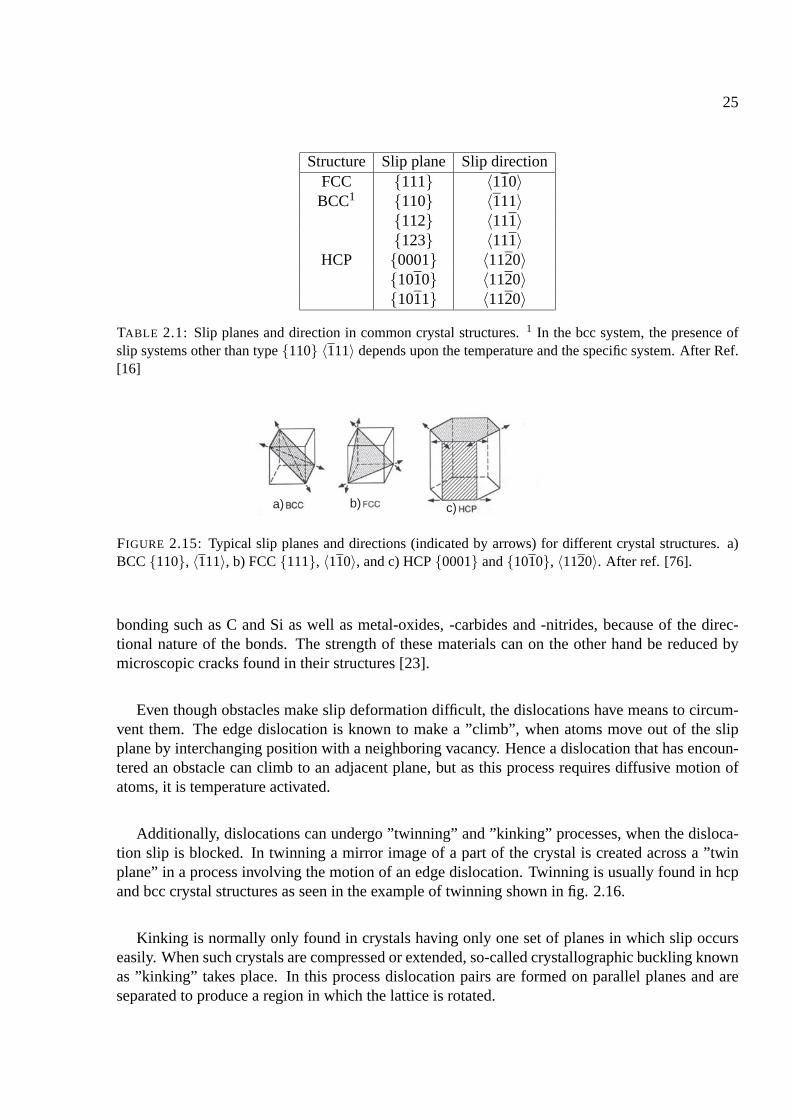
where a is the vertical distance between slip planes and b is the slip distance. It is seen, that τ f issmall when a is large and b is small, meaning that dislocations are found in close-packed planeswith a large separation distance between adjacent planes. Hence these are the planes along whichslip occurs the easiest. For different crystal structures the planes in which dislocations and slip areusually found are listed in table 2.1, while some examples are shown in figure 2.15.
Even though glide dislocations move easily through the crystal, they can be obstructed by ob-stacles. Such obstacles increase the strength of the materials by a factor of 10 or more [23], andhence stabilize the materials with respect to slip deformation. Grain-boundaries have this effect,as do the different sized atoms in alloys. Slip deformation is also difficult in materials of covalent
24
FIGURE 2.13: The atomic rearrangement resulting in dislocation motion in the case of an edge dislocation.a) Before the motion, b) The atomic rearrangement arising as a result of the applied shear stress τ, c) Furthermovement of the dislocation to the right, and d) As the dislocation arrives at the surface of the crystal, adisplacement of the top part of the crystal is seen. From ref. [16].
FIGURE 2.14: The Burgers vector AF of a dislocation loop does not lie in the slip direction. Hence thedislocation cannot move through the crystal and is known as a sessile dislocation. From ref. [76].
25
Structure Slip plane Slip directionFCC 111 〈110〉
BCC1 110 〈111〉112 〈111〉123 〈111〉
HCP 0001 〈1120〉1010 〈1120〉1011 〈1120〉
TABLE 2.1: Slip planes and direction in common crystal structures. 1 In the bcc system, the presence ofslip systems other than type 110 〈111〉 depends upon the temperature and the specific system. After Ref.[16]
c)b)a)
FIGURE 2.15: Typical slip planes and directions (indicated by arrows) for different crystal structures. a)BCC 110, 〈111〉, b) FCC 111, 〈110〉, and c) HCP 0001 and 1010, 〈1120〉. After ref. [76].
bonding such as C and Si as well as metal-oxides, -carbides and -nitrides, because of the direc-tional nature of the bonds. The strength of these materials can on the other hand be reduced bymicroscopic cracks found in their structures [23].
Even though obstacles make slip deformation difficult, the dislocations have means to circum-vent them. The edge dislocation is known to make a ”climb”, when atoms move out of the slipplane by interchanging position with a neighboring vacancy. Hence a dislocation that has encoun-tered an obstacle can climb to an adjacent plane, but as this process requires diffusive motion ofatoms, it is temperature activated.
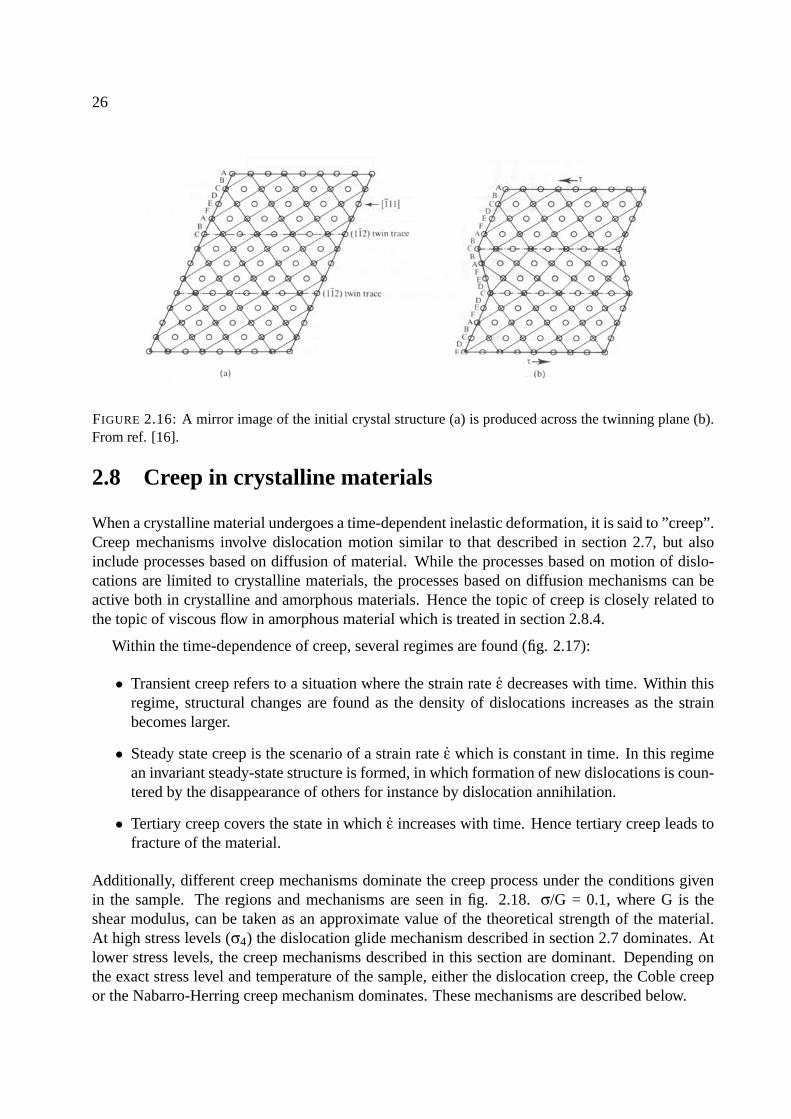
Additionally, dislocations can undergo ”twinning” and ”kinking” processes, when the disloca-tion slip is blocked. In twinning a mirror image of a part of the crystal is created across a ”twinplane” in a process involving the motion of an edge dislocation. Twinning is usually found in hcpand bcc crystal structures as seen in the example of twinning shown in fig. 2.16.
Kinking is normally only found in crystals having only one set of planes in which slip occurseasily. When such crystals are compressed or extended, so-called crystallographic buckling knownas ”kinking” takes place. In this process dislocation pairs are formed on parallel planes and areseparated to produce a region in which the lattice is rotated.
26
FIGURE 2.16: A mirror image of the initial crystal structure (a) is produced across the twinning plane (b).From ref. [16].
2.8 Creep in crystalline materials
When a crystalline material undergoes a time-dependent inelastic deformation, it is said to ”creep”.Creep mechanisms involve dislocation motion similar to that described in section 2.7, but alsoinclude processes based on diffusion of material. While the processes based on motion of dislo-cations are limited to crystalline materials, the processes based on diffusion mechanisms can beactive both in crystalline and amorphous materials. Hence the topic of creep is closely related tothe topic of viscous flow in amorphous material which is treated in section 2.8.4.
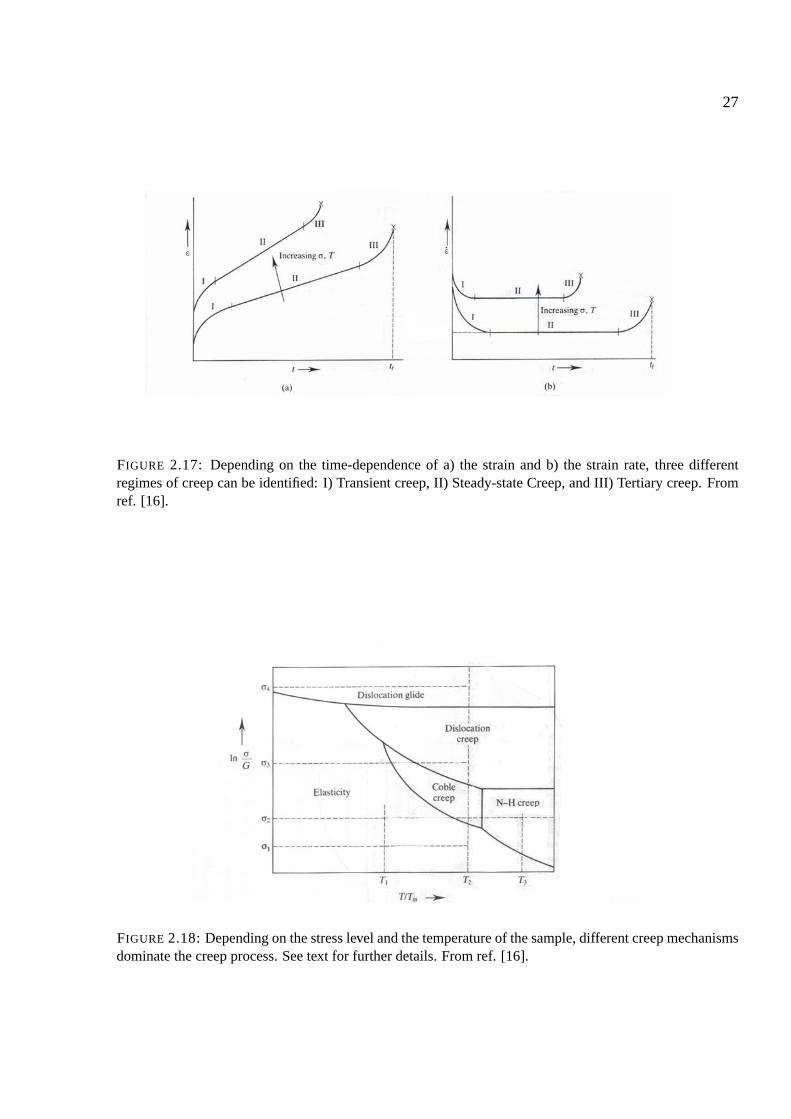
Within the time-dependence of creep, several regimes are found (fig. 2.17):
• Transient creep refers to a situation where the strain rate ε decreases with time. Within thisregime, structural changes are found as the density of dislocations increases as the strainbecomes larger.
• Steady state creep is the scenario of a strain rate ε which is constant in time. In this regimean invariant steady-state structure is formed, in which formation of new dislocations is coun-tered by the disappearance of others for instance by dislocation annihilation.
• Tertiary creep covers the state in which ε increases with time. Hence tertiary creep leads tofracture of the material.
Additionally, different creep mechanisms dominate the creep process under the conditions givenin the sample. The regions and mechanisms are seen in fig. 2.18. σ/G = 0.1, where G is theshear modulus, can be taken as an approximate value of the theoretical strength of the material.At high stress levels (σ4) the dislocation glide mechanism described in section 2.7 dominates. Atlower stress levels, the creep mechanisms described in this section are dominant. Depending onthe exact stress level and temperature of the sample, either the dislocation creep, the Coble creepor the Nabarro-Herring creep mechanism dominates. These mechanisms are described below.
27
FIGURE 2.17: Depending on the time-dependence of a) the strain and b) the strain rate, three differentregimes of creep can be identified: I) Transient creep, II) Steady-state Creep, and III) Tertiary creep. Fromref. [16].
FIGURE 2.18: Depending on the stress level and the temperature of the sample, different creep mechanismsdominate the creep process. See text for further details. From ref. [16].
28
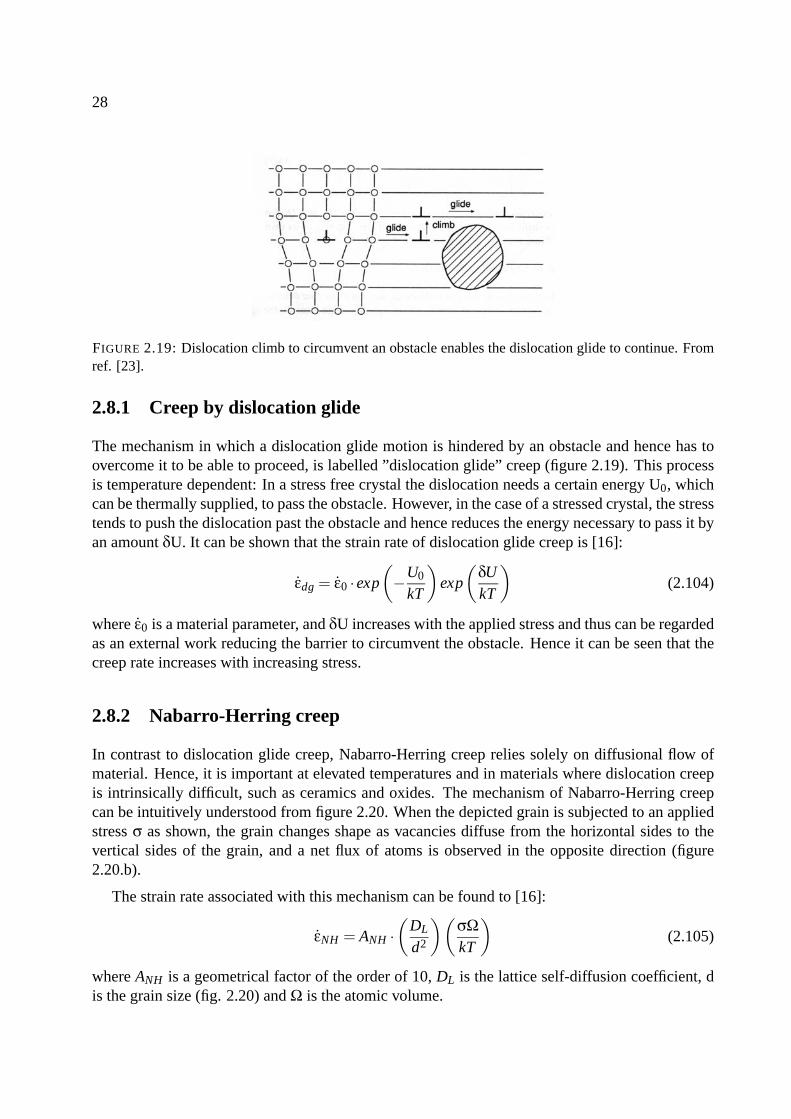
FIGURE 2.19: Dislocation climb to circumvent an obstacle enables the dislocation glide to continue. Fromref. [23].
2.8.1 Creep by dislocation glide
The mechanism in which a dislocation glide motion is hindered by an obstacle and hence has toovercome it to be able to proceed, is labelled ”dislocation glide” creep (figure 2.19). This processis temperature dependent: In a stress free crystal the dislocation needs a certain energy U0, whichcan be thermally supplied, to pass the obstacle. However, in the case of a stressed crystal, the stresstends to push the dislocation past the obstacle and hence reduces the energy necessary to pass it byan amount δU. It can be shown that the strain rate of dislocation glide creep is [16]:
εdg = ε0 · exp
(−U0
kT
)exp
(δUkT
)(2.104)
where ε0 is a material parameter, and δU increases with the applied stress and thus can be regardedas an external work reducing the barrier to circumvent the obstacle. Hence it can be seen that thecreep rate increases with increasing stress.
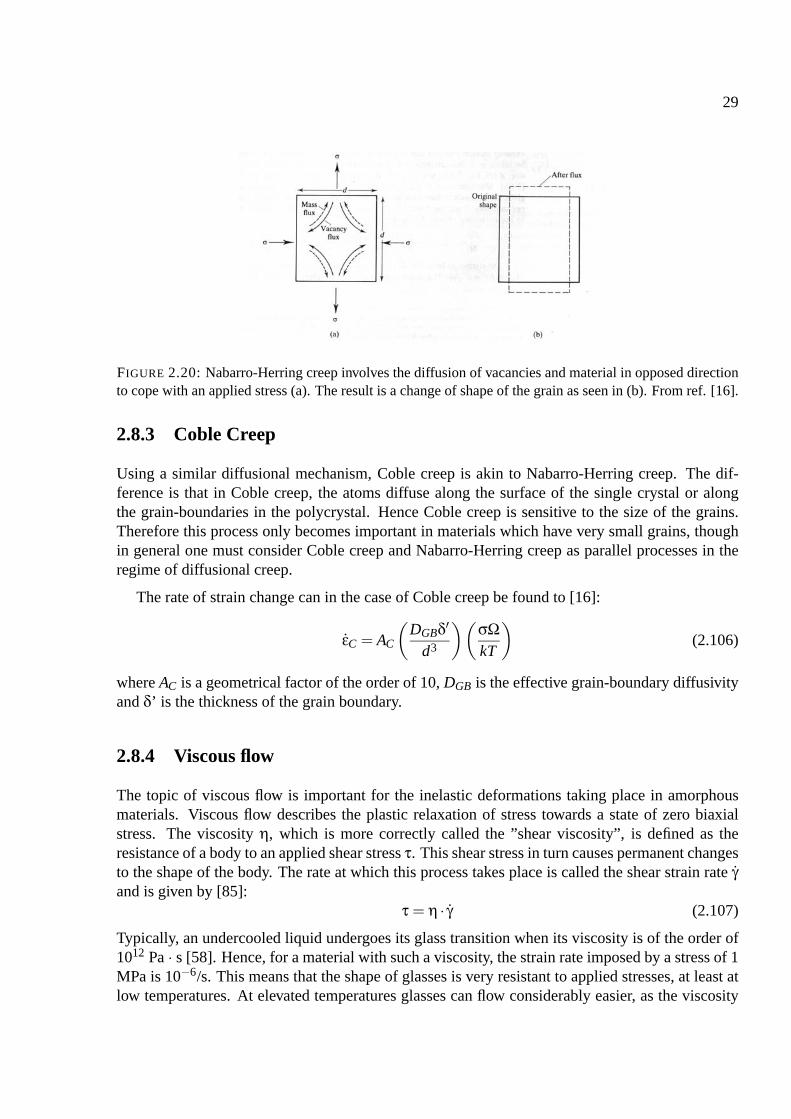
2.8.2 Nabarro-Herring creep
In contrast to dislocation glide creep, Nabarro-Herring creep relies solely on diffusional flow ofmaterial. Hence, it is important at elevated temperatures and in materials where dislocation creepis intrinsically difficult, such as ceramics and oxides. The mechanism of Nabarro-Herring creepcan be intuitively understood from figure 2.20. When the depicted grain is subjected to an appliedstress σ as shown, the grain changes shape as vacancies diffuse from the horizontal sides to thevertical sides of the grain, and a net flux of atoms is observed in the opposite direction (figure2.20.b).
The strain rate associated with this mechanism can be found to [16]:
εNH = ANH ·(
DL
d2
)(σΩkT
)(2.105)
where ANH is a geometrical factor of the order of 10, DL is the lattice self-diffusion coefficient, dis the grain size (fig. 2.20) and Ω is the atomic volume.
29
FIGURE 2.20: Nabarro-Herring creep involves the diffusion of vacancies and material in opposed directionto cope with an applied stress (a). The result is a change of shape of the grain as seen in (b). From ref. [16].
2.8.3 Coble Creep
Using a similar diffusional mechanism, Coble creep is akin to Nabarro-Herring creep. The dif-ference is that in Coble creep, the atoms diffuse along the surface of the single crystal or alongthe grain-boundaries in the polycrystal. Hence Coble creep is sensitive to the size of the grains.Therefore this process only becomes important in materials which have very small grains, thoughin general one must consider Coble creep and Nabarro-Herring creep as parallel processes in theregime of diffusional creep.
The rate of strain change can in the case of Coble creep be found to [16]:
εC = AC
(DGBδ′
d3
)(σΩkT
)(2.106)
where AC is a geometrical factor of the order of 10, DGB is the effective grain-boundary diffusivityand δ’ is the thickness of the grain boundary.
2.8.4 Viscous flow
The topic of viscous flow is important for the inelastic deformations taking place in amorphousmaterials. Viscous flow describes the plastic relaxation of stress towards a state of zero biaxialstress. The viscosity η, which is more correctly called the ”shear viscosity”, is defined as theresistance of a body to an applied shear stress τ. This shear stress in turn causes permanent changesto the shape of the body. The rate at which this process takes place is called the shear strain rate γand is given by [85]:
τ = η · γ (2.107)
Typically, an undercooled liquid undergoes its glass transition when its viscosity is of the order of1012 Pa · s [58]. Hence, for a material with such a viscosity, the strain rate imposed by a stress of 1MPa is 10−6/s. This means that the shape of glasses is very resistant to applied stresses, at least atlow temperatures. At elevated temperatures glasses can flow considerably easier, as the viscosity
30
changes by several orders of magnitude upon heating. The viscosity itself can vary drasticallybetween different materials. Examples of viscosities are (at 25C): 0.890 mPa·s (Water), 1.526mPa·s (Hg) and 809 mPa·s (Triethanolamine) [17].
Relation between stress and viscosity
As thin films are fixed to a substrate, they are constrained by its dimension. This means that thetotal biaxial strain, irrelevant of the history of the film with respect to stress relaxation, is a constantof time:
εtotal = εelastic + εplastic = const (2.108)
orεtotal = εelastic + εplastic = 0 (2.109)
where εelastic is the elastic strain and εplastic is the plastic strain.
While the elastic contribution can be expressed using Hooke’s law (equation 2.3):
εelastic =σYf
(2.110)
the derivation of the the plastic contribution is not as simple. As viscous flow occurs when shearstresses are acting on the film, the choice of the coordinate basis must be considered, as the sizeof the shear stresses depend on the basis (section 2.2.3). It is even possible to choose a basis forwhich the off-diagonal entries of the stress tensor vanish. As it is clear that viscous flow mustbe independent of this choice of basis, the approach of equivalent stresses, σeq and strains, εeq assuggested by von Mise [76] is taken. Here σeq is shown to introduce an equivalent plastic strainrate εeq. The equivalent stresses and strains do not depend on the choice of basis:
σeq =
√12[(σ22 −σ33)2 +(σ33 −σ11)2 +(σ11 −σ22)2]+3(τ2
23 + τ213 + τ2
12) (2.111a)
εeq =
√29[(ε22 − ε33)2 +(ε33 − ε11)2 +(ε11 − ε22)2]+
13(γ2
23 + γ213 + γ2
12) (2.111b)
If one considers two special cases i.e. the case of pure biaxial stress and the case of pure shear stressrespectively, a relation between the biaxial stress, the biaxial plastic strain rate and the viscositycan be found.
1) Biaxial stress. The scenario of pure biaxial stress is characterized by a biaxial stress
σ = σ11 = σ22,
and a biaxial plastic strain rate
εplastic = ε11 = ε22
with ε33 = −2εplastic.
All other entries of the stress tensor σ and the strain tensor ε are zero.
31
When inserting these values, the equivalent stress and strain compute to
σeq = σ
and
εeq = 2εplastic.
2) Shear stress. In the case of pure shear stress, τ = τ12 can be characterized by a shear strainγ = γ12, while the other components of σ and ε are zero. In this case, the equations (2.111)yield
σeq =√
3τ
and
εeq = γ√3.
By use of these two scenarios and equation 2.107, a relation between viscosity and the equivalentstress and plastic strain rates can be found:
η =τγ=
σeq
3εeq=
σ6εplastic
(2.112)
which can be rearranged to give the important relation:
εplastic =σ6η
(2.113)
From combining equations (2.109), (2.110) and (2.113), a description of viscous flow in the caseof an applied biaxial stress at a constant temperature is found:
σ6η
+σYf
= 0 (2.114)
The time-dependence of the viscosity can now be found by substituting the Stoney equation (2.85)into (2.114):
η(t) = −Yf
6κ(t)−κ(0)
κ(t)(2.115)
where κ=1/R is the curvature of the sample.
Temperature dependence of the viscosity
The viscosity has a dramatic dependence on the temperature. The characteristics of this behavioris shown in figure 2.21. Not shown is that upon crystallization of the liquid at the melting temper-ature Tm, the viscosity increases abruptly and discontinuously by several orders of magnitude. Incontrast, in the case of an undercooled liquid the viscosity increases continuously. This behaviorin the liquid and undercooled liquid phases can be approximated by the Fulcher-Vogel equation[36],[122],[137]:
32
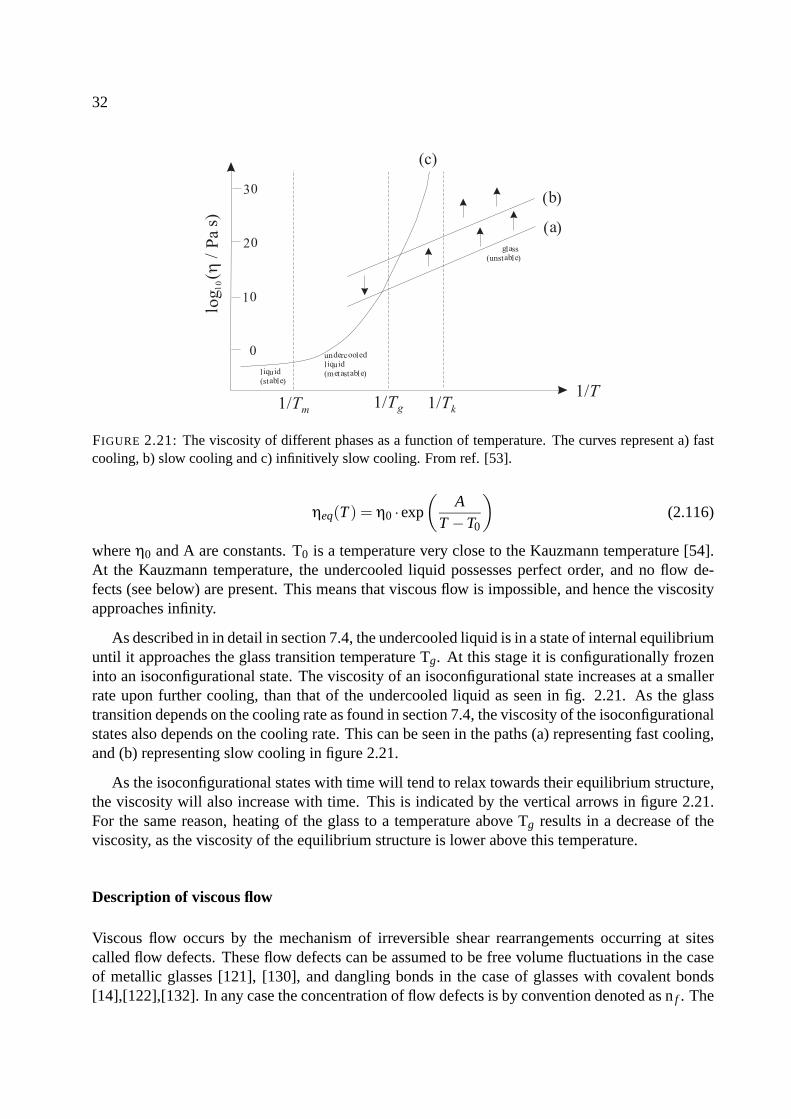
FIGURE 2.21: The viscosity of different phases as a function of temperature. The curves represent a) fastcooling, b) slow cooling and c) infinitively slow cooling. From ref. [53].
ηeq(T ) = η0 · exp
(A
T −T0
)(2.116)
where η0 and A are constants. T0 is a temperature very close to the Kauzmann temperature [54].At the Kauzmann temperature, the undercooled liquid possesses perfect order, and no flow de-fects (see below) are present. This means that viscous flow is impossible, and hence the viscosityapproaches infinity.
As described in in detail in section 7.4, the undercooled liquid is in a state of internal equilibriumuntil it approaches the glass transition temperature Tg. At this stage it is configurationally frozeninto an isoconfigurational state. The viscosity of an isoconfigurational state increases at a smallerrate upon further cooling, than that of the undercooled liquid as seen in fig. 2.21. As the glasstransition depends on the cooling rate as found in section 7.4, the viscosity of the isoconfigurationalstates also depends on the cooling rate. This can be seen in the paths (a) representing fast cooling,and (b) representing slow cooling in figure 2.21.
As the isoconfigurational states with time will tend to relax towards their equilibrium structure,the viscosity will also increase with time. This is indicated by the vertical arrows in figure 2.21.For the same reason, heating of the glass to a temperature above Tg results in a decrease of theviscosity, as the viscosity of the equilibrium structure is lower above this temperature.
Description of viscous flow
Viscous flow occurs by the mechanism of irreversible shear rearrangements occurring at sitescalled flow defects. These flow defects can be assumed to be free volume fluctuations in the caseof metallic glasses [121], [130], and dangling bonds in the case of glasses with covalent bonds[14],[122],[132]. In any case the concentration of flow defects is by convention denoted as n f . The
33
strain rate induced by an applied shear stress can be expressed by [129], [138] [121]:
γ = ω f · γ0 ·V0 ·n f (2.117)
Here ω f is the jump frequency for a flow defect under the influence of the stress, γ0 is the localshear strain induced by the rearrangement of one defect, and V0 is the volume of a defect.
The jump frequency ω f can be expressed as [121]:
ω f = k( f ) ·β(τ) (2.118)
where k( f ) is the thermally activated jump rate in the situation where no stress is applied i.e. in asituation where the defect jumps at equal rates between a unstrained and a strained position. β(τ)represents the biasing of the jump into the strained position in the presence of a stress τ. In a stressfree situation k( f ) can be expressed as:
k f = k0f · exp
(−∆Gb
kBT
)(2.119)
where k0f is called the attempt frequency, and ∆Gb is the activation energy barrier for motion.
However, in the situation of an applied stress, the energy barriers ∆Gb for forward and backwarddefect jumps are not equal. From rate theory, ω f can be expressed as the difference between theforward and backward rates, which both have an exponential dependence on the energy barrier,hence resulting in a sinh dependence for ω f [43], [138]:
ω f = k f · sinh
(γ0 ·V0 · τ
kBT
)(2.120)
Here, the activation energy was expressed as a function of V0 and γ0 as defined in equation 2.117.
Combining equations (2.117), (2.120) and (2.119) yields:
γ = k f · γ0 ·V0 ·n f · sinh
(γ0 ·V0 · τ
kBT
)= k f · γ0 ·V0 ·n f · γ0 ·V0 · τ
kBT(2.121)
where the last equality is true for small shear stresses, in which case the sinh function can beapproximated by a Taylor series.
From a comparison of equations (2.107) and (2.121), it becomes evident that the viscosity isindependent of the shear stress itself, as it can be expressed as:
η =kBT
(γ0 ·V0)2 · k f ·n f(2.122)
This regime of small shear stresses, where the viscosity does not depend on the shear stress, islabelled the ”region of Newtonian viscous flow”. As every isoconfigurational state has a specificflow defect concentration, which in the Newtonian case is constant, the temperature dependenceof the viscosity can be given by:
η =kBT
(γ0 ·V0)2 · k0f ·n f
· exp
(Qiso
kBT
)(2.123)
where the isoconfigurational activation energy Qiso was introduced as a measure for the activationenergy. Hence the slope of the viscosity of the isoconfigurational states in figure 2.21 is justQiso/kB.
34
Modelling viscous flow
In the theory of structural relaxation in glasses, simple models have been proposed for the case ofa decrease in the concentration of flow defects. This decrease can be induced by several processes;normally one distinguishes between flow defect annihilation involving either one or two defects.The interaction between two flow defects can be interpreted as the recombination of two danglingbonds in the case of covalent glasses and the recombination of two free volume fluctuations in thecase of metallic glasses. Depending on the number of flow defects involved in the annihilationprocess, the resulting decrease in the flow defect concentration can be expressed by [102], [121],[130], [148]:
n f ,u = −kr,u · (n f −neq) (2.124a)
n f ,b = −kr,b · (n f −neq)2 (2.124b)
n f ,i = −kr,i ·n f (n f −neq) (2.124c)
First order terms in n f describe annihilation of defects at the site of a single defect, while quadraticterms in n f describe flow defect annihilation by the interaction of two defects. Therefore, equation(2.124a) is said to be based on unimolecular (subscript u) and equation (2.124b) on bimolecular(subscript b) relaxation kinetics. The combination of the two (equation 2.124c) is based on acombination of the two annihilation processes i.e. intermediate (subscript i) kinetics.
The rate equation constants kr are assumed to have the following dependence on temperature:
kr = k0r · exp
(−Qrel
kBT
)(2.125)
Time dependence of the viscosity at temperatures well below Tg
At a fixed temperature well below the glass transition temperature, the concentration of flow de-fects is generally orders of magnitudes larger than the concentration of flow defects of the equilib-rium structure n f ,eq at this temperature. Hence
(n f −n f ,eq) ≈ n f . (2.126)
Using this approximation, the relations (2.124) describing the flow defect concentration reduce to
n f ,u = −kr,u ·n f (2.127a)
in the case of unimolecular relaxation kinetics, and
n f ,b = −kr,b ·n2f . (2.127b)
for bimolecular relaxation kinetics. Solving the differential equations (2.127a) and (2.127b) yieldsthe following time-dependence of n f in the two cases:
n f ,u(t) = n f (0) · exp(−kr,ut) (2.128a)
35
and
n f ,b(t) =n f (0)
1+n f (0)krt(2.128b)
where the constant n f (0) describes the flow defect concentration at t = 0.
Using equation 2.122, the following expressions of the viscosity as a function of time at constanttemperature can be obtained:
η(t) = η0 · exp(kr,ut) (2.129a)
for the unimolecular model, and
η(t) = η0 +n0η0kr,bt = η0 + kbt (2.129b)
in the bimolecular case, wherekb = n0η0kr,b = constant (2.130)
Hence, unimolecular relaxation kinetics predict a viscosity that increases exponentially with time,while a linear increase of the viscosity as a function of time is characteristic for bimolecular relax-ation kinetics at a constant temperature well below Tg.
Time dependence of the viscosity at T close to Tg
At temperatures close to the glass transition temperature, the approximation (2.126) no longer ap-plies, as n f is of the same order as n f ,eq in this regime. Hence the differential equations (2.124)must be solved. This results in the following expressions for unimolecular, bimolecular and inter-mediate relaxation kinetics, respectively:
n f ,u(t) = n f ,eq +(n0 −n f ,eq) · exp(−kr,ut) (2.131a)
n f ,b(t) =n0 + kr,bn f ,eq(n0 −n f ,eq) · t
1+ kr,b(n0 −n f ,eq) · t (2.131b)
n f ,i(t) =n0n f ,eq
n0 +(n f ,eq −n0) · exp(−kr,in f ,eqt)(2.131c)
Using equation 2.122, the expressions for the time-dependence of the viscosity now become:
ηu(t) =η f ,eq
1+(
η f ,eqη0
−1)· exp(−kr,ut)
(2.132a)
ηb(t) =
(η f ,eq−η0
η f ,eq
)· kr,bt +η0
1+(
η f ,eq−η0
η2f ,eq
)· kr,bt
(2.132b)
ηi(t) = η f ,eq − (η f ,eq −η0) · exp
(− kr,i
η f ,eqt
)(2.132c)

36
where the equilibrium viscosity ηeq is described by the Fulcher-Vogel-equation (2.116).
The temperature dependence of the rate equation constants k in equation 2.132 can be computedusing equations (2.123), (2.125), ( 2.122) and (2.130):
k =kBT
(ε0 ·V0)2 ·k0
r
k0f
· exp
(Qrate
kBT
)(2.133)
whereQrate = Qiso −Qrel (2.134)
Hence the rate equation constants show an Arrhenius dependence on temperature.
Using the expressions (2.131) and (2.132) for the viscosity, the stress evolution as a function oftime at a fixed temperature can be calculated using equation 2.114 in each of the situations:
• Constant viscosity
In the case where the viscosity does not depend on time, solving equation 2.114 yields:
σ(t) = σ0 · exp
(−Yf
6ηt
)(2.135a)
or
ln
(σ(t)σ0
)= −Yf
6ηt (2.135b)
where σ0 is the initial stress at t = 0. In this case ln(
σ(t)σ0
)will decrease linearly with time.
• Viscosity behavior as found far from equilibrium
Using the expressions (2.129) for the time-dependence of the viscosity as found at temperaturesfar below Tg i.e. far away from equilibrium, the solutions of equation 2.114 become:
a) unimolecular relaxation kinetics far away from equilibrium:
ln
(σ(t)σ0
)= − Yf
6kr,uη0[1− exp(−kr,ut)] (2.136a)
b) bimolecular relaxation kinetics far away from equilibrium:
ln
(σ(t)σ0
)= − Yf
6kr,bln
(1+
kr,b
η0t
)(2.136b)
• Viscosity behavior as found close to equilibrium.
The time-dependence of the viscosity as found at temperatures close to Tg (equations 2.132) inducethe following solutions of equation 2.114:
37
a) unimolecular relaxation kinetics close to equilibrium:
ln
(σ(t)σ0
)= − Yf
6η f ,eq
(t +
η f ,eq −η0
kr,uη0· [1− exp(−kr,ut)]
)(2.137a)
b) bimolecular relaxation kinetics close to equilibrium:
ln
(σ(t)σ0
)= −Yf
6·(
1kr,b
· ln[
1+(
1η0
− 1η f ,eq
)· kr,bt
]+
tη f ,eq
)(2.137b)
c) intermediate relaxation kinetics close to equilibrium:
ln
(σ(t)σ0
)= − Yf
6kr,i· ln(
1+[
exp
(kr,i
η f ,eqt
)−1
]· η f ,eq
η0
)(2.137c)
2.9 Summary
In the description of mechanical stress one distinguishes between elastic and inelastic behavior.In elastic processes, the original shape of a strained body is recovered when the strain-inducingmechanical stress is removed. This is not the case for inelastic behavior, where the deformationsinduced by the mechanical stresses are not reversible. Hence the changes to the shape of the bodyare permanent in this regime.
In the elastic regime it is possible to describe the situation of volume changes of a thin filmdeposited on a substrate. This allows a prediction of the mechanical stresses expected for such aprocess. Hence this description allows a comparison between experimentally measured stressesupon volume changes and theoretical predictions. In this work, this is exploited in the case ofphase change materials as described in chapter 7 and for optically switchable film (chapter 6).
Elastic theory also describes thermal stresses arising in thin films that are subjected to tempera-ture changes. It was shown (section 2.5) how this feature can be exploited to determine the elasticconstants of materials for which these are not already known. This is an interesting application ofthe elastic theory, and in this work such determination of elastic constants was carried out for thephase change materials (chapter 7).
In the inelastic regime, mechanical stress can be relieved by several processes. The processesinvolved depend on the structure of the film i.e dislocation glide and creep mechanisms in crys-talline materials and viscous flow mechanisms in amorphous films. During the course of this worksuch processes were observed quite often, and specific findings are described for optically switch-able coatings in chapter 6 and for phase change films in chapter 7.

38
Chapter 3
Experimental details
The theoretical description of mechanical stress in thin films presented in the preceding chapterdescribed many interesting situations in which mechanical stresses can be exploited to gather in-formation on the properties and nature of thin films. However, the theory does not allow any directstatements on such properties. Such conclusions can be only be made with the help of experimen-tal measurements of mechanical stresses. As a experimental setup was not available at the start ofthis work, one had to constructed.
The decision on the method on which such stress measurements should be based is not quitesimple, though. There are a variety of methods available for measurements of mechanical stressesin thin films. Each has its advantages and drawbacks, which should be considered before selectingthe method suitable for a given experiment. Certain methods offer a large versatility and can beapplied in many situations. Others are only applicable in special scenarios, but on the other handmight offer superior properties for such particular cases. In this chapter, a brief comparison of themost widespread methods for stress measurements is given in section 3.1. Then in sections (3.2) -(3.6), the setup chosen for the measurements presented in this work is characterized and describedin detail. Finally, in section 3.7 a second system having a special application is presented.
3.1 Stress measurement methods
The methods of measuring mechanical stresses in thin films are many and can seem difficult tocomprehend for non-specialists in the field. However, even though they sometimes carry quiteadventurous names such as ”wafer curvature method”, ”nano-indentation” and ”critically refractedlongitudinal wave method”, they only describe simple approaches to measurement of mechanicalstresses. In this section the principle of the most widespread methods will be briefly presentedalong with their advantages and drawbacks.
39
40
3.1.1 Diffraction based methods
All methods based on diffraction in the thin film exploit that the interplanar spacing dhkl can bedetermined via the Bragg equation:
2dhklsinθ = λ (3.1)
From the change in lattice spacing compared to the stress-free value dhkl,0, the strain can be deter-mined by use of:
ε =∆d
dhkl,0(3.2)
= −cotθ0∆θ (3.3)
where ∆θ is the change in the Bragg scattering angle, θ0.
To characterize the stress state in a given thin film, it is necessary to know the complete stresstensor. However, as seen in chapter 2.2.5, this tensor is dramatically simplified in cases of highsymmetry. Indeed, in cases where only in-plane biaxial stress is measured, it is only necessary todetermine the in-plane strain, ε11. In this case the biaxial stress is given by Hooke’s law:
σ11 =Ehkl
1−νhklε11 (3.4)
A number of methods make use of diffraction to measure mechanical stresses. These include X-raydiffraction also employing synchrotron radiation, and electron- and neutron diffraction. However,independent of the method, certain properties of the film must be known. As the methods are basedon the determination of lattice spacings, only crystalline films can be characterized. Additionally,the use of Hooke’s law implies that the elastic properties of the film must be known. Otherwisesuccessful stress measurements are not possible. Another drawback of the methods is that they arenot suited for in-situ measurements as the measuring time is too long to get acceptable resolution,with the possible exception of synchrotron experiments.
For the determination of stresses in thin films, neutron diffraction measurements are not partic-ularly well suited. The reason is that the penetration depth associated with this method in typicalmaterials is several centimeters. For film thicknesses of the order of 100 nm, this seems a littleexaggerated [147].
The electron diffraction method can however be quite useful, as it combines focus diameters ofabout 10 nm with a penetration depth of less than 100 nm [147]. This combination allows a highresolution in local stress measurements. However the method does not make any direct statementabout the macroscopic stresses in the film.
The best suited method for stress measurements is X-ray diffraction. By use of either the Θ−2Θmode or the grazing incidence mode, direct determination of the in-plane strains are possible.Details on these modes of measurement can be found in chapter 4.

41
3.1.2 Curvature based methods
As seen in section 2.3, the biaxial stress in the film introduces a constant curvature of the entiresample. The Stoney equation (2.84) relates the radius of curvature R to the biaxial stress σ:
σ =Esd2
s
6(1−νs)d f
1R
(3.5)
It is obvious that methods based on measuring the curvature of the sample yield a direct determi-nation of the biaxial stress in the sample. This is even possible when only the elastic modulus andthe Poisson’s ratio of the substrate are known. No information on the elastic constants of the filmis necessary, and stresses in films that are not crystalline can also be measured.
Methods based on the wafer curvature approach are based a very accurate determination ofcurvatures. The most widespread ones are the capacitive deflection method, the curvature deter-mination using a scanning laser beam, and methods based on profilometry. While the two formermethods are well-suited for in-situ measurements upon variation of stress, the latter method re-quires removal of the sample and placement in the profilometer.
Curvature measurements based on capacitance changes are realized by metallizing the substrateon the non-film side and having this metal surface form a capacitor with a stiff electrode. When thesample is supported at its edge(s), a change of curvature will thus lead to a change of capacitance.
The measurement of stress based on a curvature determination utilizing a laser has the additionaladvantage, that it can be applied in a variety of setups without too many complications. In fact allthat is required is that the surface of the sample that faces the laser is reflective. Hence the laserbased system can be used whenever a window allows the laser to access the sample.
In the profilometry based approach, the topography of the sample is measured, and a meancurvature is determined, from which the stress can be calculated.
3.1.3 Spectroscopic methods
Another approach for measuring mechanical stresses is the application of spectroscopy. Photo-luminescence (PL) and in particular Raman spectroscopy have been applied in the literature forthis purpose. They exploit the fact that the characteristic peaks show a shift that depends linearlyon the stress. However, the application of these method is limited to cases where the sample canbe positioned in the spectrometer. Hence in-situ measurements of stress changes are difficult toimplement.
3.1.4 Comparison
An overview of the advantages and disadvantages of the methods suited for analysis of stresses inthin films as mentioned above is given in Table 3.1.
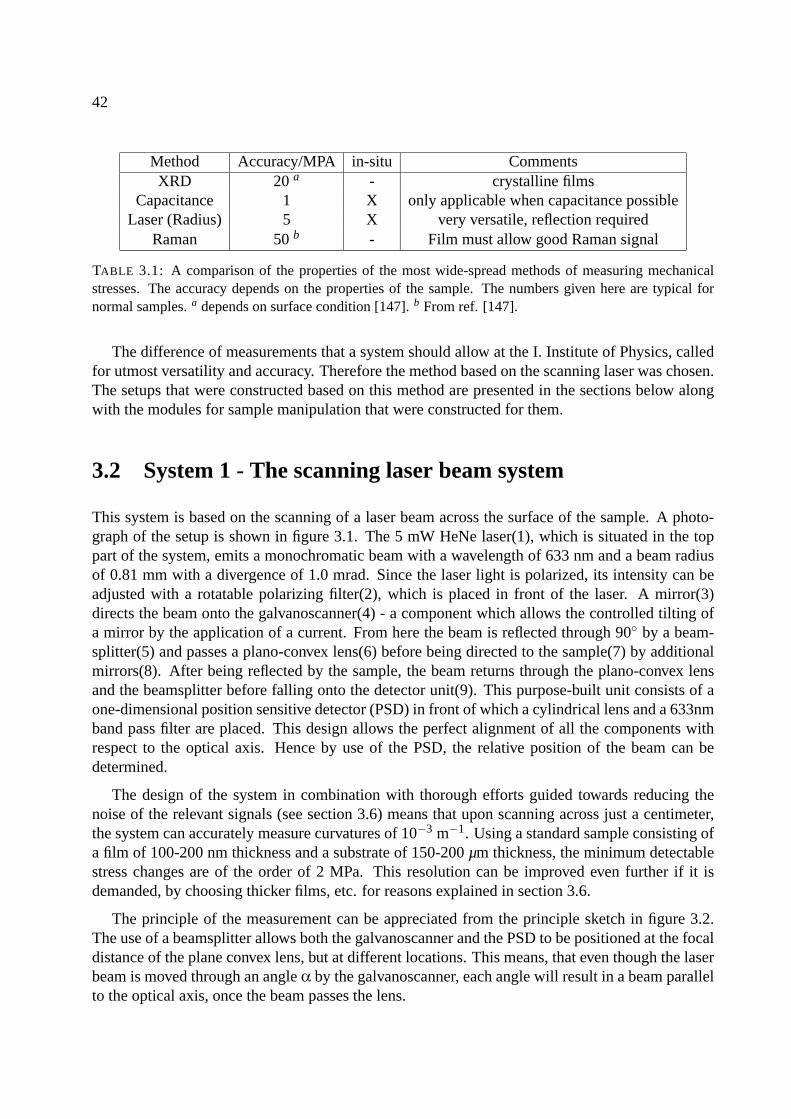
42
Method Accuracy/MPA in-situ CommentsXRD 20 a - crystalline films
Capacitance 1 X only applicable when capacitance possibleLaser (Radius) 5 X very versatile, reflection required
Raman 50 b - Film must allow good Raman signal
TABLE 3.1: A comparison of the properties of the most wide-spread methods of measuring mechanicalstresses. The accuracy depends on the properties of the sample. The numbers given here are typical fornormal samples. a depends on surface condition [147]. b From ref. [147].
The difference of measurements that a system should allow at the I. Institute of Physics, calledfor utmost versatility and accuracy. Therefore the method based on the scanning laser was chosen.The setups that were constructed based on this method are presented in the sections below alongwith the modules for sample manipulation that were constructed for them.
3.2 System 1 - The scanning laser beam system
This system is based on the scanning of a laser beam across the surface of the sample. A photo-graph of the setup is shown in figure 3.1. The 5 mW HeNe laser(1), which is situated in the toppart of the system, emits a monochromatic beam with a wavelength of 633 nm and a beam radiusof 0.81 mm with a divergence of 1.0 mrad. Since the laser light is polarized, its intensity can beadjusted with a rotatable polarizing filter(2), which is placed in front of the laser. A mirror(3)directs the beam onto the galvanoscanner(4) - a component which allows the controlled tilting ofa mirror by the application of a current. From here the beam is reflected through 90 by a beam-splitter(5) and passes a plano-convex lens(6) before being directed to the sample(7) by additionalmirrors(8). After being reflected by the sample, the beam returns through the plano-convex lensand the beamsplitter before falling onto the detector unit(9). This purpose-built unit consists of aone-dimensional position sensitive detector (PSD) in front of which a cylindrical lens and a 633nmband pass filter are placed. This design allows the perfect alignment of all the components withrespect to the optical axis. Hence by use of the PSD, the relative position of the beam can bedetermined.
The design of the system in combination with thorough efforts guided towards reducing thenoise of the relevant signals (see section 3.6) means that upon scanning across just a centimeter,the system can accurately measure curvatures of 10−3 m−1. Using a standard sample consisting ofa film of 100-200 nm thickness and a substrate of 150-200 µm thickness, the minimum detectablestress changes are of the order of 2 MPa. This resolution can be improved even further if it isdemanded, by choosing thicker films, etc. for reasons explained in section 3.6.
The principle of the measurement can be appreciated from the principle sketch in figure 3.2.The use of a beamsplitter allows both the galvanoscanner and the PSD to be positioned at the focaldistance of the plane convex lens, but at different locations. This means, that even though the laserbeam is moved through an angle α by the galvanoscanner, each angle will result in a beam parallelto the optical axis, once the beam passes the lens.
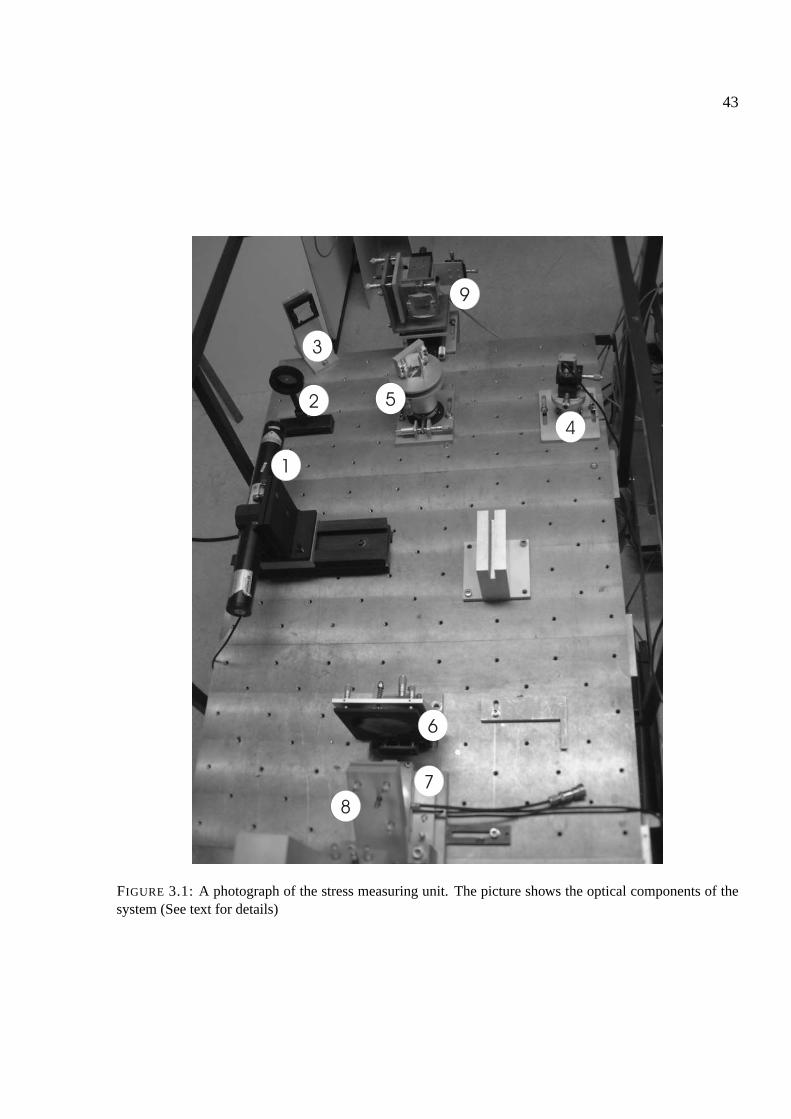
43
2
1
3
5
4
6
8
7
9
FIGURE 3.1: A photograph of the stress measuring unit. The picture shows the optical components of thesystem (See text for details)
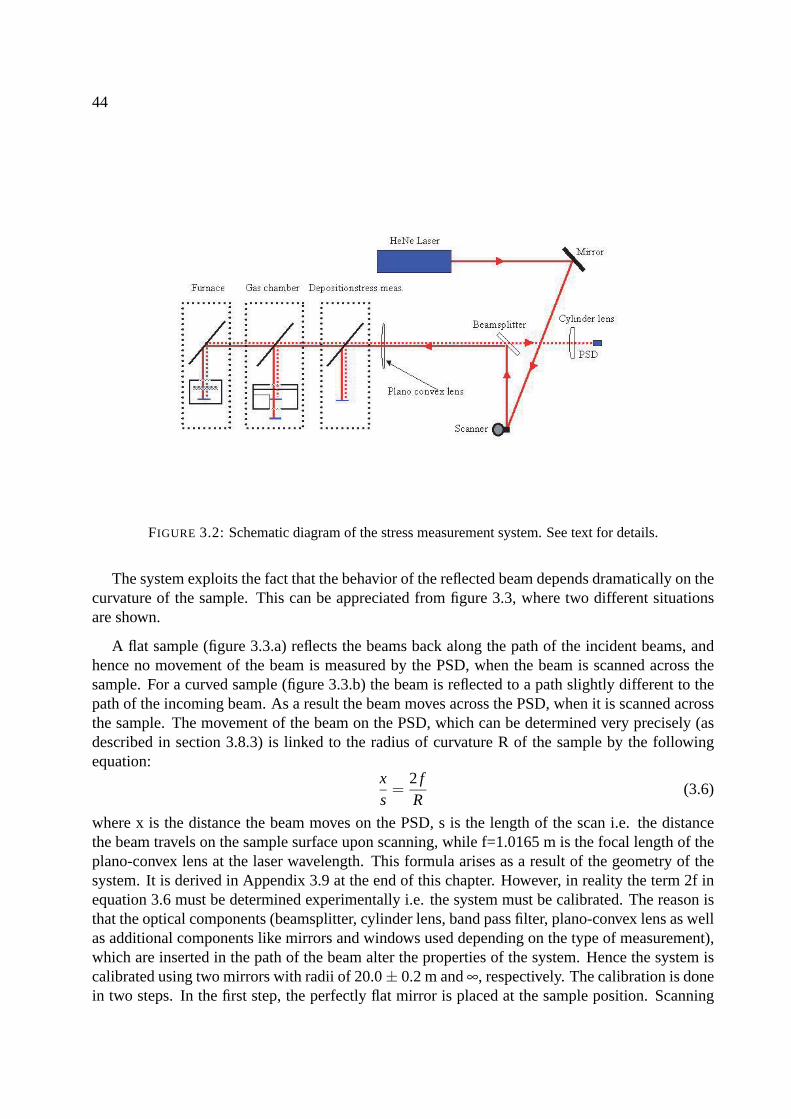
44
FIGURE 3.2: Schematic diagram of the stress measurement system. See text for details.
The system exploits the fact that the behavior of the reflected beam depends dramatically on thecurvature of the sample. This can be appreciated from figure 3.3, where two different situationsare shown.
A flat sample (figure 3.3.a) reflects the beams back along the path of the incident beams, andhence no movement of the beam is measured by the PSD, when the beam is scanned across thesample. For a curved sample (figure 3.3.b) the beam is reflected to a path slightly different to thepath of the incoming beam. As a result the beam moves across the PSD, when it is scanned acrossthe sample. The movement of the beam on the PSD, which can be determined very precisely (asdescribed in section 3.8.3) is linked to the radius of curvature R of the sample by the followingequation:
xs
=2 fR
(3.6)
where x is the distance the beam moves on the PSD, s is the length of the scan i.e. the distancethe beam travels on the sample surface upon scanning, while f=1.0165 m is the focal length of theplano-convex lens at the laser wavelength. This formula arises as a result of the geometry of thesystem. It is derived in Appendix 3.9 at the end of this chapter. However, in reality the term 2f inequation 3.6 must be determined experimentally i.e. the system must be calibrated. The reason isthat the optical components (beamsplitter, cylinder lens, band pass filter, plano-convex lens as wellas additional components like mirrors and windows used depending on the type of measurement),which are inserted in the path of the beam alter the properties of the system. Hence the system iscalibrated using two mirrors with radii of 20.0 ± 0.2 m and ∞, respectively. The calibration is donein two steps. In the first step, the perfectly flat mirror is placed at the sample position. Scanning
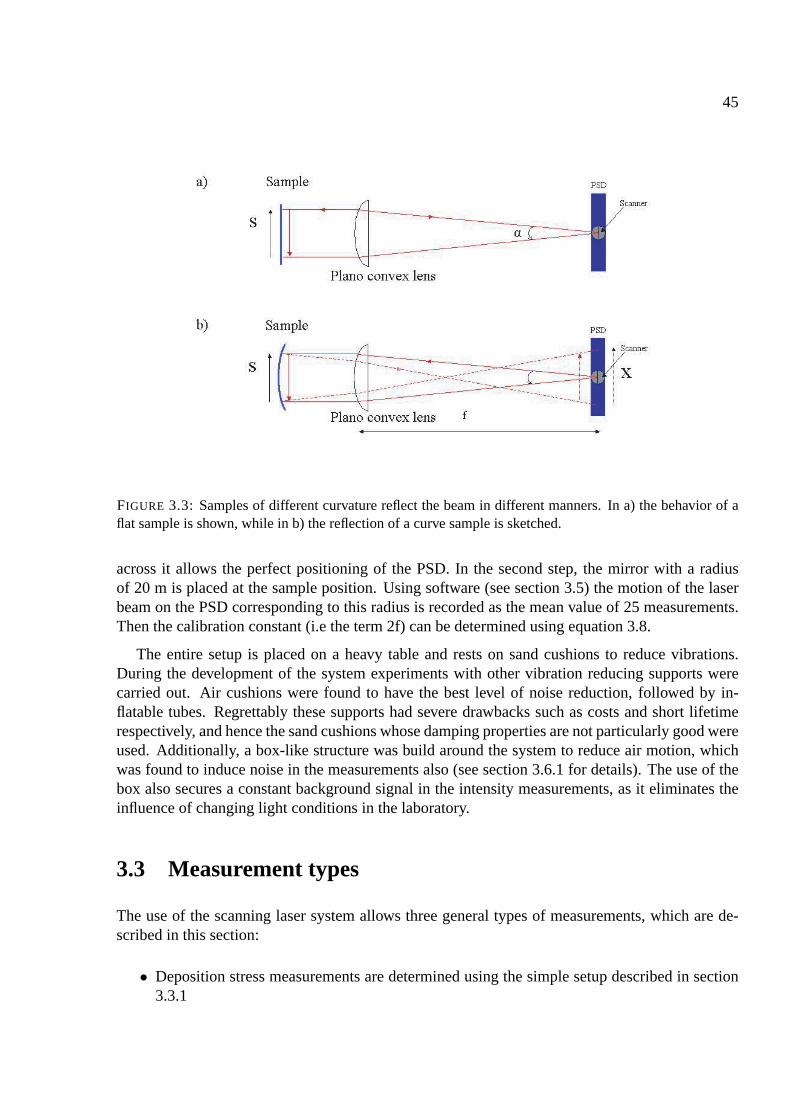
45
FIGURE 3.3: Samples of different curvature reflect the beam in different manners. In a) the behavior of aflat sample is shown, while in b) the reflection of a curve sample is sketched.
across it allows the perfect positioning of the PSD. In the second step, the mirror with a radiusof 20 m is placed at the sample position. Using software (see section 3.5) the motion of the laserbeam on the PSD corresponding to this radius is recorded as the mean value of 25 measurements.Then the calibration constant (i.e the term 2f) can be determined using equation 3.8.
The entire setup is placed on a heavy table and rests on sand cushions to reduce vibrations.During the development of the system experiments with other vibration reducing supports werecarried out. Air cushions were found to have the best level of noise reduction, followed by in-flatable tubes. Regrettably these supports had severe drawbacks such as costs and short lifetimerespectively, and hence the sand cushions whose damping properties are not particularly good wereused. Additionally, a box-like structure was build around the system to reduce air motion, whichwas found to induce noise in the measurements also (see section 3.6.1 for details). The use of thebox also secures a constant background signal in the intensity measurements, as it eliminates theinfluence of changing light conditions in the laboratory.
3.3 Measurement types
The use of the scanning laser system allows three general types of measurements, which are de-scribed in this section:
• Deposition stress measurements are determined using the simple setup described in section3.3.1
46
• in-situ stress measurements in optically switching gasochromic films are done using a specialgas chamber, which is described in section 3.3.2.
• in-situ stress measurements during thermal cycling are carried out using a furnace, whosedetails are explained in section 3.4.
3.3.1 Deposition stress measurements
When carrying out deposition stress measurements there are a few important practices to consider.Most of these arise because the commercially available substrates, which are used for these mea-surements are not perfectly flat i.e they do not possess an infinite radius of curvature. Instead theyare equipped with an intrinsic radius which often even is inhomogeneous across the substrate. Asthis influence cannot be ignored, the Stoney equation [104] includes a term describing the effectof the original curvature Rs of the substrate:
σ =Yf d2
s
6d f
[1
R f ,s− 1
Rs
](3.7)
This means, that the curvature of the substrate has to be measured before deposition. After thegrowth of the film, the new curvature R f ,s of the film/substrate combination is then measured.From the change of curvature, the deposition stress can be calculated using equation 3.7.
The difficulty of deposition stress measurements arises from the inhomogenity of substrate cur-vatures. As a result, the measured curvature depends on the exact location on the sample at whichthe scanning is carried out. Therefore the sample holder for these measurements was designed toensure that the sample is positioned in the same way every time: As seen in fig. 3.4, the samplecan be pushed into a corner formed by the three vertical pins. Using this system the measured radiican be reproduced very well, as evidenced by the 10 measurements of the same sample, removedand replaced after each measurement, seen in fig. 3.5.
Additionally the scientist carrying out these measurements should preferably carry a degree inbookkeeping, as only a perfect marking of the samples as well as monitoring the scan parameters(see section 3.5) ensure, that exactly the same position on the sample is scanned across before andafter deposition.
3.3.2 The gas chamber
For carrying out in-situ investigations of the stress build-up in switchable gasochromic films, aspecial chamber was designed. Its overall position can be seen in figure 3.1. It is placed at thesame position as the deposition stress unit(7), which can be removed to make space for the gaschamber.
The largest difference between the gas chamber unit and the setup for deposition stresses is thesupport of the sample. During initial experiments it was found, that the flow of gas into and outof the gas chamber resulted in vibrations of the sample when it was just supported at its edges.
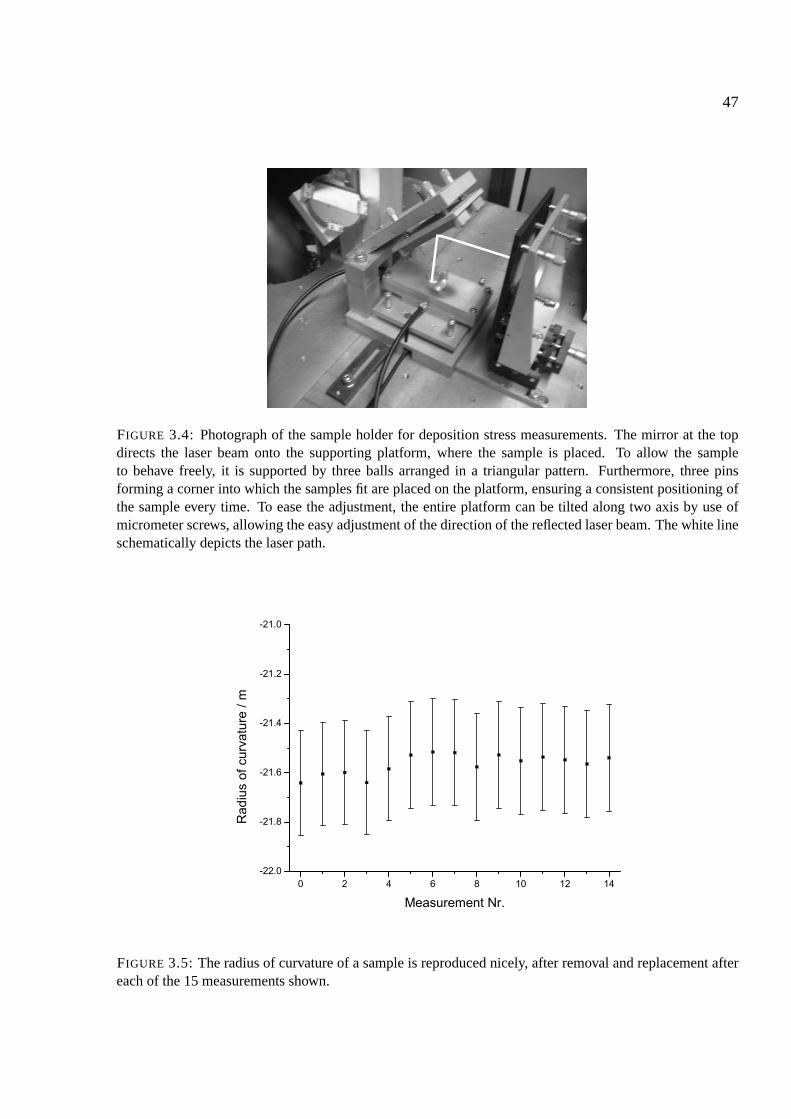
47
FIGURE 3.4: Photograph of the sample holder for deposition stress measurements. The mirror at the topdirects the laser beam onto the supporting platform, where the sample is placed. To allow the sampleto behave freely, it is supported by three balls arranged in a triangular pattern. Furthermore, three pinsforming a corner into which the samples fit are placed on the platform, ensuring a consistent positioning ofthe sample every time. To ease the adjustment, the entire platform can be tilted along two axis by use ofmicrometer screws, allowing the easy adjustment of the direction of the reflected laser beam. The white lineschematically depicts the laser path.
FIGURE 3.5: The radius of curvature of a sample is reproduced nicely, after removal and replacement aftereach of the 15 measurements shown.
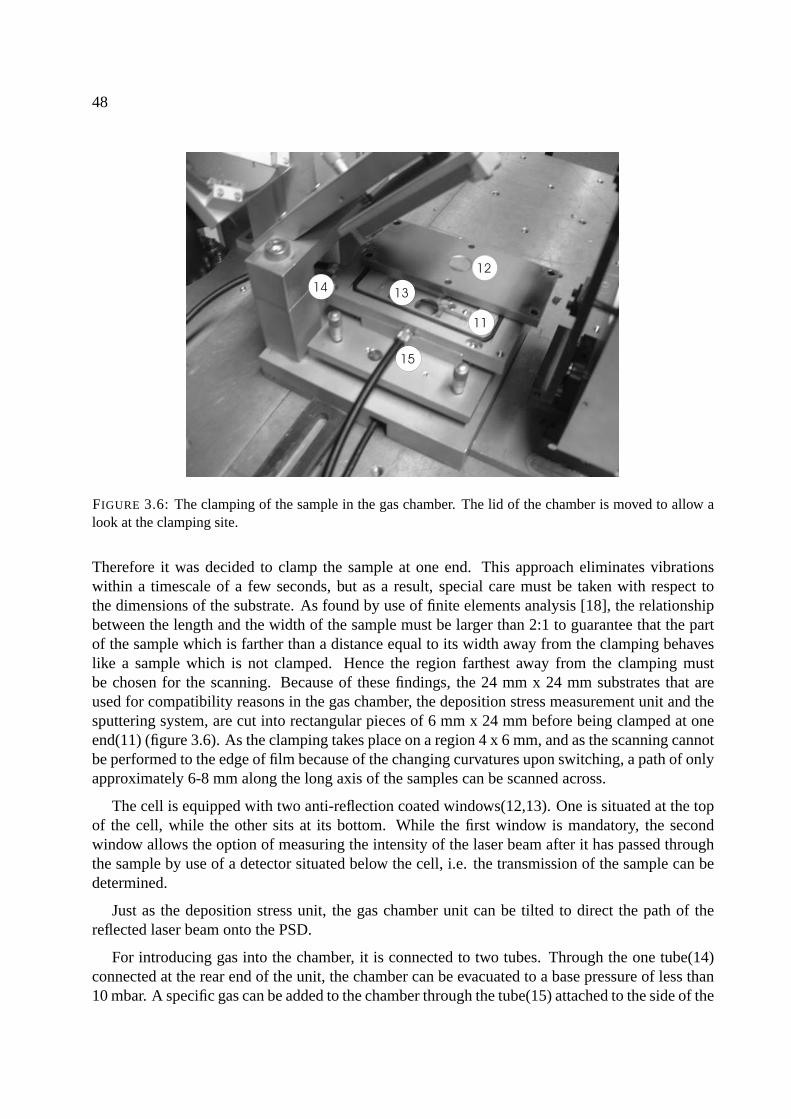
48
11
12
13
15
14
FIGURE 3.6: The clamping of the sample in the gas chamber. The lid of the chamber is moved to allow alook at the clamping site.
Therefore it was decided to clamp the sample at one end. This approach eliminates vibrationswithin a timescale of a few seconds, but as a result, special care must be taken with respect tothe dimensions of the substrate. As found by use of finite elements analysis [18], the relationshipbetween the length and the width of the sample must be larger than 2:1 to guarantee that the partof the sample which is farther than a distance equal to its width away from the clamping behaveslike a sample which is not clamped. Hence the region farthest away from the clamping mustbe chosen for the scanning. Because of these findings, the 24 mm x 24 mm substrates that areused for compatibility reasons in the gas chamber, the deposition stress measurement unit and thesputtering system, are cut into rectangular pieces of 6 mm x 24 mm before being clamped at oneend(11) (figure 3.6). As the clamping takes place on a region 4 x 6 mm, and as the scanning cannotbe performed to the edge of film because of the changing curvatures upon switching, a path of onlyapproximately 6-8 mm along the long axis of the samples can be scanned across.
The cell is equipped with two anti-reflection coated windows(12,13). One is situated at the topof the cell, while the other sits at its bottom. While the first window is mandatory, the secondwindow allows the option of measuring the intensity of the laser beam after it has passed throughthe sample by use of a detector situated below the cell, i.e. the transmission of the sample can bedetermined.
Just as the deposition stress unit, the gas chamber unit can be tilted to direct the path of thereflected laser beam onto the PSD.
For introducing gas into the chamber, it is connected to two tubes. Through the one tube(14)connected at the rear end of the unit, the chamber can be evacuated to a base pressure of less than10 mbar. A specific gas can be added to the chamber through the tube(15) attached to the side of the
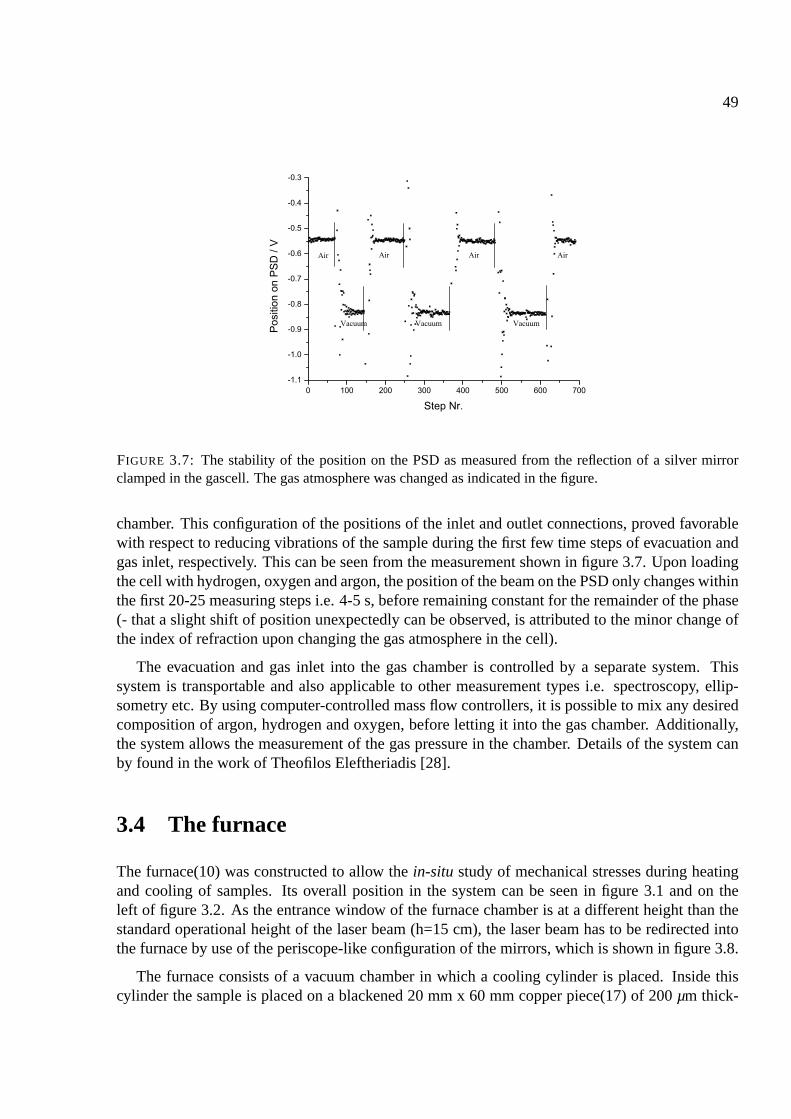
49
FIGURE 3.7: The stability of the position on the PSD as measured from the reflection of a silver mirrorclamped in the gascell. The gas atmosphere was changed as indicated in the figure.
chamber. This configuration of the positions of the inlet and outlet connections, proved favorablewith respect to reducing vibrations of the sample during the first few time steps of evacuation andgas inlet, respectively. This can be seen from the measurement shown in figure 3.7. Upon loadingthe cell with hydrogen, oxygen and argon, the position of the beam on the PSD only changes withinthe first 20-25 measuring steps i.e. 4-5 s, before remaining constant for the remainder of the phase(- that a slight shift of position unexpectedly can be observed, is attributed to the minor change ofthe index of refraction upon changing the gas atmosphere in the cell).
The evacuation and gas inlet into the gas chamber is controlled by a separate system. Thissystem is transportable and also applicable to other measurement types i.e. spectroscopy, ellip-sometry etc. By using computer-controlled mass flow controllers, it is possible to mix any desiredcomposition of argon, hydrogen and oxygen, before letting it into the gas chamber. Additionally,the system allows the measurement of the gas pressure in the chamber. Details of the system canby found in the work of Theofilos Eleftheriadis [28].
3.4 The furnace
The furnace(10) was constructed to allow the in-situ study of mechanical stresses during heatingand cooling of samples. Its overall position in the system can be seen in figure 3.1 and on theleft of figure 3.2. As the entrance window of the furnace chamber is at a different height than thestandard operational height of the laser beam (h=15 cm), the laser beam has to be redirected intothe furnace by use of the periscope-like configuration of the mirrors, which is shown in figure 3.8.
The furnace consists of a vacuum chamber in which a cooling cylinder is placed. Inside thiscylinder the sample is placed on a blackened 20 mm x 60 mm copper piece(17) of 200 µm thick-

50
14
16
FIGURE 3.8: The furnace seen from the outside. The laser beam (schematically depicted by the white line)is directed into the furnace by the periscope-like arrangement of the mirrors seen to the left.
18
19
20
21
23
17
FIGURE 3.9: The platform of the furnace. The blackened Cu-piece is supported by two Al2O3 cylinders.The UV-lamps are positioned above the sample at angles ±45

51
ness, which is supported towards its ends by two horizontal hollow ceramic Al2O3 cylinders(18)with a radius of 1 mm (fig 3.9). The use of thin Al2O3 supports minimizes the loss of heat bythermal conduction to other components of the sample holder. At the far end of the copper piece, areference sample, to which a thermocouple is glued, is fixed to the copper piece. This setup securesa reliable and precise measurement of the sample temperature. The heating itself is carried out byuse of two UV-radiation lamps(19) which are positioned at angles of ±45 above the sample (fig3.9). Their radiation is absorbed by the sample and also by the blackened copper piece, whichhelps achieving a homogeneous temperature profile across the sample. A temperature gradientacross the sample could therefore almost be eliminated as can be appreciated from figure 3.10.a.Here a phase change sample (see chapter 7) was heated. Upon the phase transition the samplechanges its optical properties, and the reflected signal increases. For a homogeneous temperaturein the film, the reflectance should increase by a constant amount at every point of the scan. Ascan be seen in fig. 3.10.a, this is almost the case. For comparison a support of the sample bystainless steel cylinders resulted in the thermal profile shown in figure 3.10.b: In the vicinity of thesupporting steel pins at positions -0.2 cm and 1.1 cm, large temperature gradients can be observed.
As mentioned above, the platform is placed inside a cooling cylinder(20) (figure 3.9). Thisdouble walled cylinder is filled with slowly flowing water and equipped with equally spaced layersof highly reflective tungsten foil(21) on its inner side. Additionally, the cylinder ends are closedby copper pieces coated with layers of tungsten foil on their inside only having small openings forsample positioning, thermocouple wires etc. To complete the confinement of the heat, the platformis shielded from below by a stainless steel radiation shield. Hereby the heated region is confinedto the region in the vicinity of the sample.
This design of furnace has three main advantages:
1. It allows heating rates of more than 30 K/min and cooling rates of more than 10 K/min(above 100C).
2. The platform is very stable during thermal cycling. As a result, the sample is very stable anddoes not tilt during heating. This is important, as early experiments showed, that a sidewaysmovement of the reflected laser beam result in slight variations of the determined stress.This can only be explained by slightly different optical properties of a changed optical path,meaning that the calibration constant determined as explained in section 3.2, is only accuratefor the beam path used when calibrating, and has a slightly different value when this pathis changed. Hence the path chosen upon calibration should be kept constant throughoutthe measurement. Thus, the achieved stability of the platform is of crucial importance forviscosity measurements, where very small and slowly emerging stress changes are detected.
3. The path of the reflected beam can be adjusted by hand from the outside using two mi-crometer screws, by which the entire platform(23), on which the sample is situated, can betilted.
The vacuum chamber is evacuated by a turbomolecular pump, which is attached to a mechanicalpump. Hereby, a base pressure of less than 10−6 mbar can be achieved. At present, the maximumtemperature which can be achieved is around 550C depending on the heating rate.
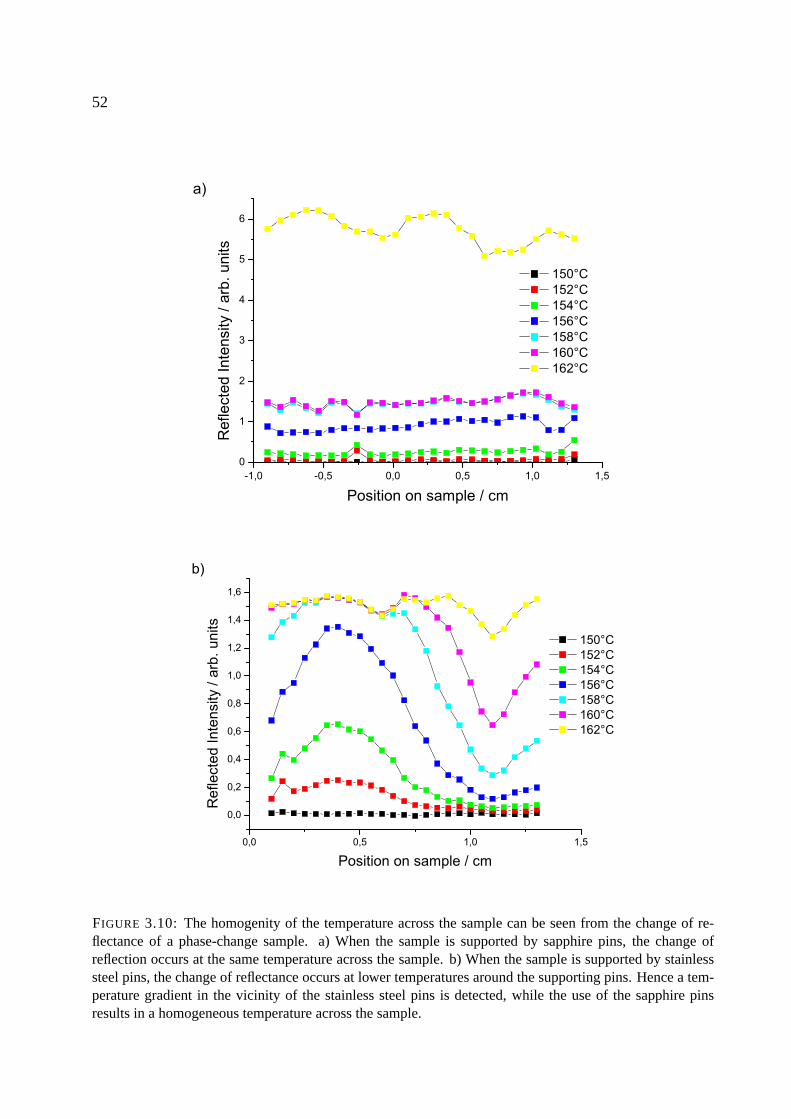
52
FIGURE 3.10: The homogenity of the temperature across the sample can be seen from the change of re-flectance of a phase-change sample. a) When the sample is supported by sapphire pins, the change ofreflection occurs at the same temperature across the sample. b) When the sample is supported by stainlesssteel pins, the change of reflectance occurs at lower temperatures around the supporting pins. Hence a tem-perature gradient in the vicinity of the stainless steel pins is detected, while the use of the sapphire pinsresults in a homogeneous temperature across the sample.
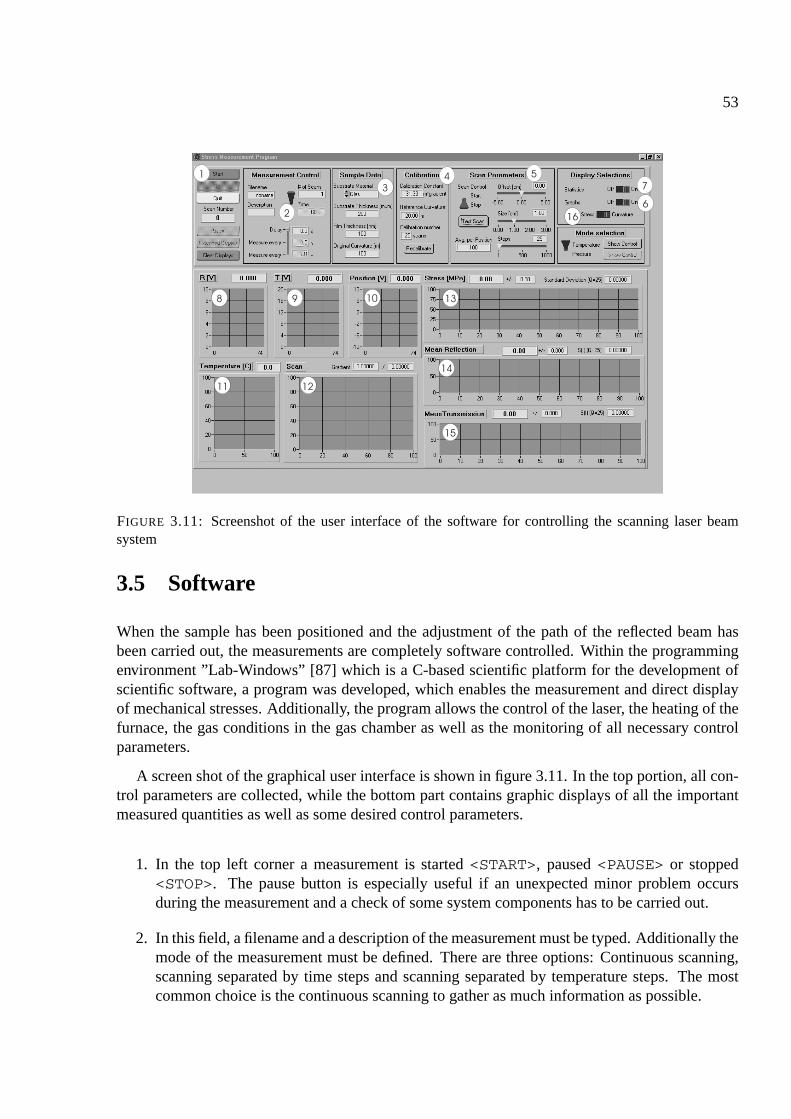
53
FIGURE 3.11: Screenshot of the user interface of the software for controlling the scanning laser beamsystem
3.5 Software
When the sample has been positioned and the adjustment of the path of the reflected beam hasbeen carried out, the measurements are completely software controlled. Within the programmingenvironment ”Lab-Windows” [87] which is a C-based scientific platform for the development ofscientific software, a program was developed, which enables the measurement and direct displayof mechanical stresses. Additionally, the program allows the control of the laser, the heating of thefurnace, the gas conditions in the gas chamber as well as the monitoring of all necessary controlparameters.
A screen shot of the graphical user interface is shown in figure 3.11. In the top portion, all con-trol parameters are collected, while the bottom part contains graphic displays of all the importantmeasured quantities as well as some desired control parameters.
1. In the top left corner a measurement is started <START>, paused <PAUSE> or stopped<STOP>. The pause button is especially useful if an unexpected minor problem occursduring the measurement and a check of some system components has to be carried out.
2. In this field, a filename and a description of the measurement must be typed. Additionally themode of the measurement must be defined. There are three options: Continuous scanning,scanning separated by time steps and scanning separated by temperature steps. The mostcommon choice is the continuous scanning to gather as much information as possible.
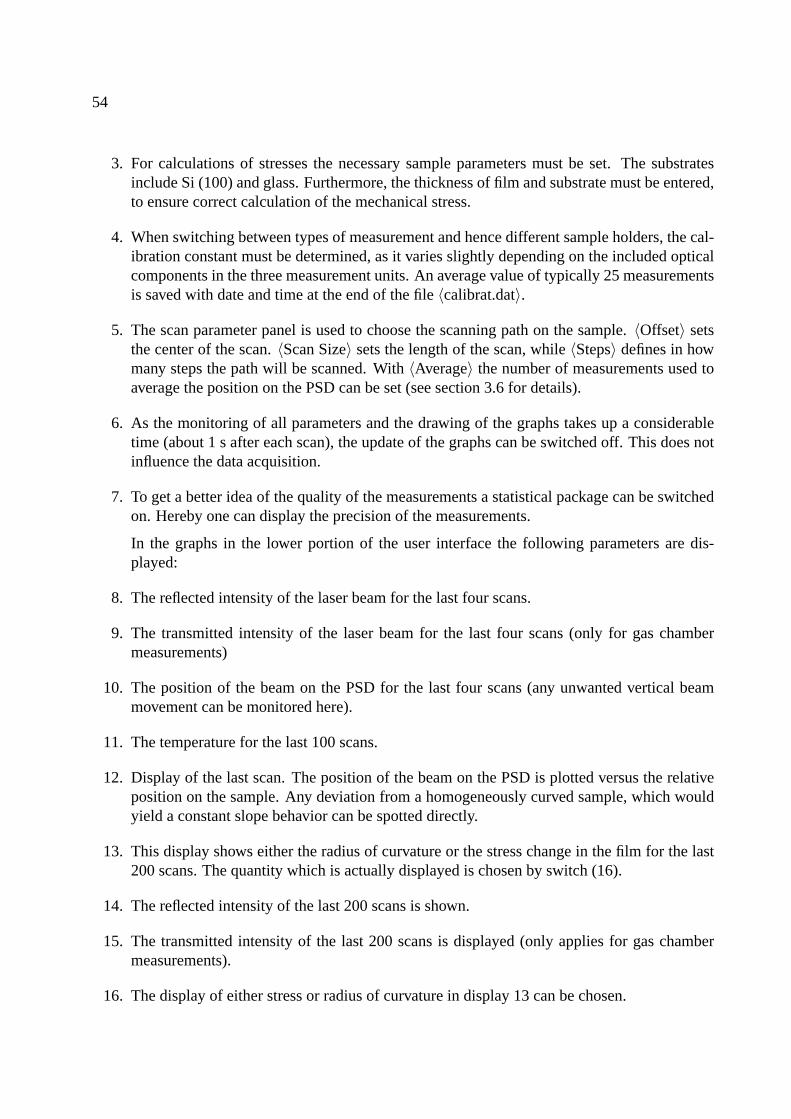
54
3. For calculations of stresses the necessary sample parameters must be set. The substratesinclude Si (100) and glass. Furthermore, the thickness of film and substrate must be entered,to ensure correct calculation of the mechanical stress.
4. When switching between types of measurement and hence different sample holders, the cal-ibration constant must be determined, as it varies slightly depending on the included opticalcomponents in the three measurement units. An average value of typically 25 measurementsis saved with date and time at the end of the file 〈calibrat.dat〉.
5. The scan parameter panel is used to choose the scanning path on the sample. 〈Offset〉 setsthe center of the scan. 〈Scan Size〉 sets the length of the scan, while 〈Steps〉 defines in howmany steps the path will be scanned. With 〈Average〉 the number of measurements used toaverage the position on the PSD can be set (see section 3.6 for details).
6. As the monitoring of all parameters and the drawing of the graphs takes up a considerabletime (about 1 s after each scan), the update of the graphs can be switched off. This does notinfluence the data acquisition.
7. To get a better idea of the quality of the measurements a statistical package can be switchedon. Hereby one can display the precision of the measurements.
In the graphs in the lower portion of the user interface the following parameters are dis-played:
8. The reflected intensity of the laser beam for the last four scans.
9. The transmitted intensity of the laser beam for the last four scans (only for gas chambermeasurements)
10. The position of the beam on the PSD for the last four scans (any unwanted vertical beammovement can be monitored here).
11. The temperature for the last 100 scans.
12. Display of the last scan. The position of the beam on the PSD is plotted versus the relativeposition on the sample. Any deviation from a homogeneously curved sample, which wouldyield a constant slope behavior can be spotted directly.
13. This display shows either the radius of curvature or the stress change in the film for the last200 scans. The quantity which is actually displayed is chosen by switch (16).
14. The reflected intensity of the last 200 scans is shown.
15. The transmitted intensity of the last 200 scans is displayed (only applies for gas chambermeasurements).
16. The display of either stress or radius of curvature in display 13 can be chosen.

55
FIGURE 3.12: Screenshot of the User interface window allowing the programming the ramps for the tem-perature cycling using the furnace.
The heating and cooling is controlled in a separate window (figure 3.12). Here the desiredtemperature and heating time can be set. From these entries, a heating rate is calculated anddisplayed. For cooling the same procedure applies. A total number of 7 ramps can be programmedlike this. All parameters set in this window must then be transferred to an external temperaturecontrolling unit from Eurotherm [31]. Once the parameters arrive at this unit, the measurementis started by pressing its <START> button. The Eurotherm controller now monitors the powerflowing from the external power supply into the lamps inside the furnace. Simultaneously thetemperature is measured by the Eurotherm controller and the power is adjusted to conform withthe desired heating rate. Additionally the temperature is fed to the software and shown in display11 (figure 3.11).
To limit the risk of data loss in the case of the computer stalling, the storage files are closed andreopened for every 100 scans. There are two files for every measurement. The first file (*.dat)contains the following informations of the measurement: Start time, end time, date, description,scanning parameters, number and relative time of scan, temperature during scan, gradient of scan,curvature of scan, averaged reflected intensity of laser beam and averaged transmitted intensity oflaser beam
The second file (*.da2) contains all information of each and every scan: Additionally to thescan number, all relative positions on the sample, all positions on the PSD, all reflected intensitiesas well as all transmitted intensities are recorded. Normally this file is not used, but it can be quiteuseful in controlling temperature homogeneity across the sample, beam movement etc.
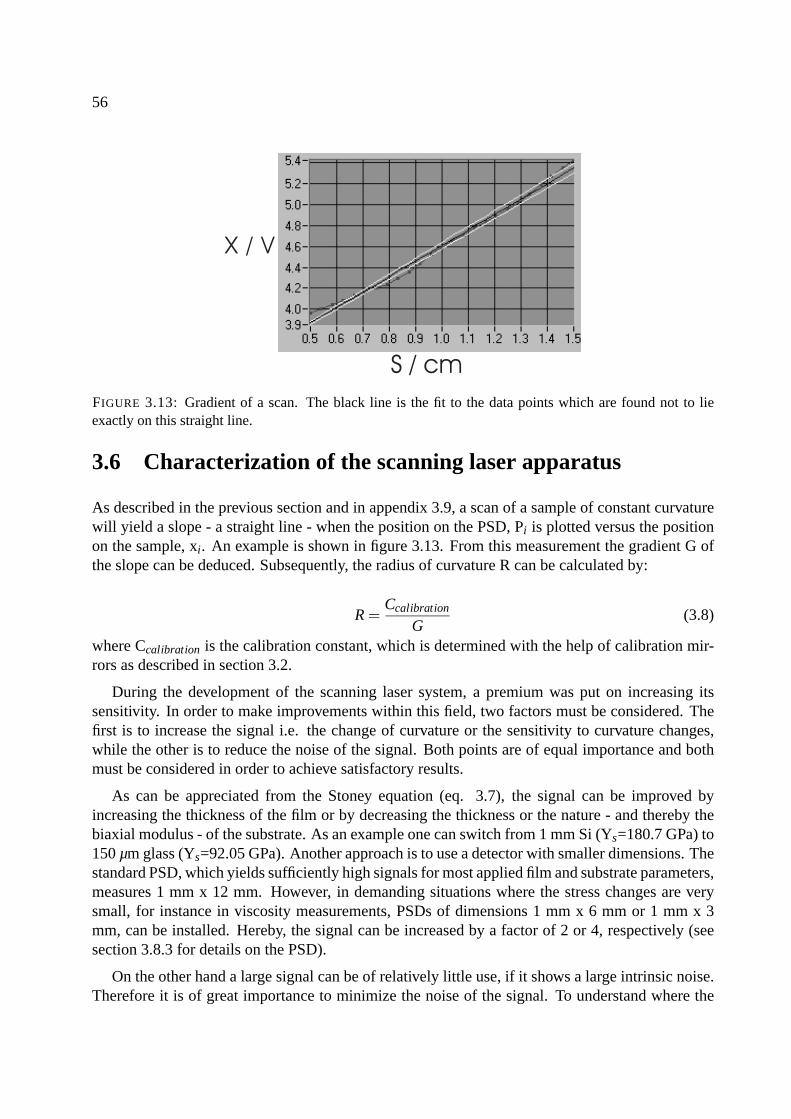
56
FIGURE 3.13: Gradient of a scan. The black line is the fit to the data points which are found not to lieexactly on this straight line.
3.6 Characterization of the scanning laser apparatus
As described in the previous section and in appendix 3.9, a scan of a sample of constant curvaturewill yield a slope - a straight line - when the position on the PSD, Pi is plotted versus the positionon the sample, xi. An example is shown in figure 3.13. From this measurement the gradient G ofthe slope can be deduced. Subsequently, the radius of curvature R can be calculated by:
R =Ccalibration
G(3.8)
where Ccalibration is the calibration constant, which is determined with the help of calibration mir-rors as described in section 3.2.
During the development of the scanning laser system, a premium was put on increasing itssensitivity. In order to make improvements within this field, two factors must be considered. Thefirst is to increase the signal i.e. the change of curvature or the sensitivity to curvature changes,while the other is to reduce the noise of the signal. Both points are of equal importance and bothmust be considered in order to achieve satisfactory results.
As can be appreciated from the Stoney equation (eq. 3.7), the signal can be improved byincreasing the thickness of the film or by decreasing the thickness or the nature - and thereby thebiaxial modulus - of the substrate. As an example one can switch from 1 mm Si (Ys=180.7 GPa) to150 µm glass (Ys=92.05 GPa). Another approach is to use a detector with smaller dimensions. Thestandard PSD, which yields sufficiently high signals for most applied film and substrate parameters,measures 1 mm x 12 mm. However, in demanding situations where the stress changes are verysmall, for instance in viscosity measurements, PSDs of dimensions 1 mm x 6 mm or 1 mm x 3mm, can be installed. Hereby, the signal can be increased by a factor of 2 or 4, respectively (seesection 3.8.3 for details on the PSD).
On the other hand a large signal can be of relatively little use, if it shows a large intrinsic noise.Therefore it is of great importance to minimize the noise of the signal. To understand where the
57
noise arises, the considerations below are useful. Further details on the concepts of precision andaccuracy can be found in [9].
A scan consists of a number of steps, M, at each of which the position, P j on the PSD isdetermined as an average of N measurements of the position, pi, j, as described in section 3.8.3.The averaged position is denoted PN, j. For each pi, j the difference to PN, j is given by:
pi, j −PN, j = δpi, j i = (1,2, ...,N) (3.9)
The best estimate of the standard deviation of the position, σN(P j), is given by [9]:
SN(Pj) =
√√√√√ N∑
i=1δpi, j
N(N −1)(3.10)
Hence for every one of the M steps of the scan, the position on the PSD is determined with anaccuracy of:
Pj = PN, j ±SN(Pj) j = (1,2, ...,M) (3.11)
From the position determination of the M steps the gradient, GM, is calculated:
GM =M
M∑j=1
x jPj −M∑j=1
x jM∑j=1
Pj
MM∑j=1
x j − (M∑j=1
x j)2
(3.12)
The points on the slope, PG, j, described by the gradient corresponding to the positions of the Msteps are given by:
PG, j = GMx j +B (3.13)
where B is a constant. Using (3.11) the difference between the measured points P j and the pointson the slope PG, j can be expressed as:
Pj −PG, j = δG, j ±SN(Pj) (3.14)
where δG, j = PN, j −PG, j.
The best estimate of the standard deviation σM(G) of the gradient can now be written as:
SM(GM) =
M
√M−1
M∑j=1
(Pj −PG, j)2
√(M−2)(M
M∑j=1
x2j − (
M∑j=1
x j)2)
(3.15)
=
M1/2
√M∑j=1
[δG, j ±SN(PN, j)]2√(M−2)(M
M∑j=1
x2j − (
M∑j=1
x j)2)
(3.16)
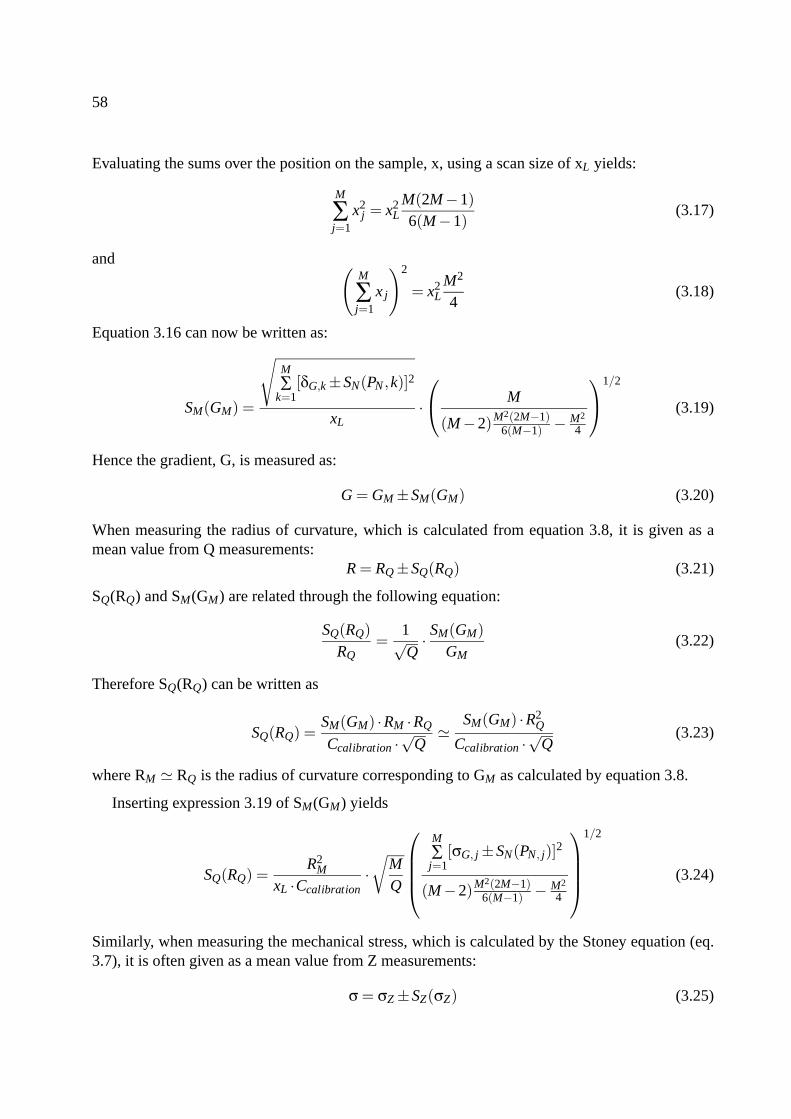
58
Evaluating the sums over the position on the sample, x, using a scan size of xL yields:
M
∑j=1
x2j = x2
LM(2M−1)6(M−1)
(3.17)
and (M
∑j=1
x j
)2
= x2L
M2
4(3.18)
Equation 3.16 can now be written as:
SM(GM) =
√M∑
k=1[δG,k ±SN(PN ,k)]2
xL·⎛⎝ M
(M−2)M2(2M−1)6(M−1) − M2
4
⎞⎠
1/2
(3.19)
Hence the gradient, G, is measured as:
G = GM ±SM(GM) (3.20)
When measuring the radius of curvature, which is calculated from equation 3.8, it is given as amean value from Q measurements:
R = RQ ±SQ(RQ) (3.21)
SQ(RQ) and SM(GM) are related through the following equation:
SQ(RQ)RQ
=1√Q· SM(GM)
GM(3.22)
Therefore SQ(RQ) can be written as
SQ(RQ) =SM(GM) ·RM ·RQ
Ccalibration ·√
Q SM(GM) ·R2
Q
Ccalibration ·√
Q(3.23)
where RM RQ is the radius of curvature corresponding to GM as calculated by equation 3.8.
Inserting expression 3.19 of SM(GM) yields
SQ(RQ) =R2
M
xL ·Ccalibration·√
MQ
⎛⎜⎜⎜⎝
M∑j=1
[σG, j ±SN(PN, j)]2
(M−2)M2(2M−1)6(M−1) − M2
4
⎞⎟⎟⎟⎠
1/2
(3.24)
Similarly, when measuring the mechanical stress, which is calculated by the Stoney equation (eq.3.7), it is often given as a mean value from Z measurements:
σ = σZ ±SZ(σZ) (3.25)

59
Similar to SQ(RQ) and SM(GM), SZ(σZ) and SQ(RQ) are related through:
SZ(σZ)σZ
=1√Z
SQ(RQ)RQ
=6d f SQ(RQ)σQ
Ysd2s
√Z
(3.26)
where σQ σZ corresponds to RQ by use of the Stoney equation. This means that SZ(σZ) can bewritten as
SZ(σZ) =6 ·σ2
Z ·d f
Ms ·d2s · xL ·Ccalibration
·√
MZQ
⎛⎜⎜⎜⎝
M∑j=1
[δG, j ±SN(PN, j)]2
(M−2)M2(2M−1)6(M−1) − M2
4
⎞⎟⎟⎟⎠
1/2
(3.27)
From this equation the direct implication of the parameters which influence the noise of the stressmeasurement can be seen. For instance a doubling of the length of the scan, xL, will halve thevalue of SZ(σZ).
3.6.1 Noise of signals
It is obvious from equations (3.24) and (3.27) that SQ(RZ) and SZ(σZ) are heavily affected bythe homogenity of the curvature, which is represented in the equation by the parameter δG, j, andthe accuracy with which the position on the PSD can be measured, represented by SN(PN , j).While the former parameter is easy to control as homogeneously curved substrates can be chosenbefore deposition, the accuracy of the position determination on the PSD can only be reduced to aminimum by investigating the parameters affecting it. Hence significant efforts were put into suchinvestigations, as presented below.
As described in detail in appendix 3.8.3, the output voltage V0 describing the position on thePSD is determined from the following equation:
V0 = 10 · V1 −V2
V1 +V2= 10 · VB
VA(3.28)
where V1 and V2 are the amplified voltages corresponding to the photocurrents produced when thelaser beam hits the detector, and VA and VB are their sum and difference, respectively. As can beseen from equation 3.28, the noise of the signals VA and VB will be transferred directly into thenoise of the signal V0.
The efforts to minimize the noise in the signals VA and V0, which are the reflected intensity andthe position on the detector, respectively, included analysis of the influence of every component ofthe optical setup as well as the electronic components used in the data acquisition and -evaluation.Below, the results from these investigations are presented.
The analysis of the influence of the components used in the setup focused on the laser itself,the galvanoscanner, the used lenses, mirrors and other optical components as well as the influencefrom the surroundings.
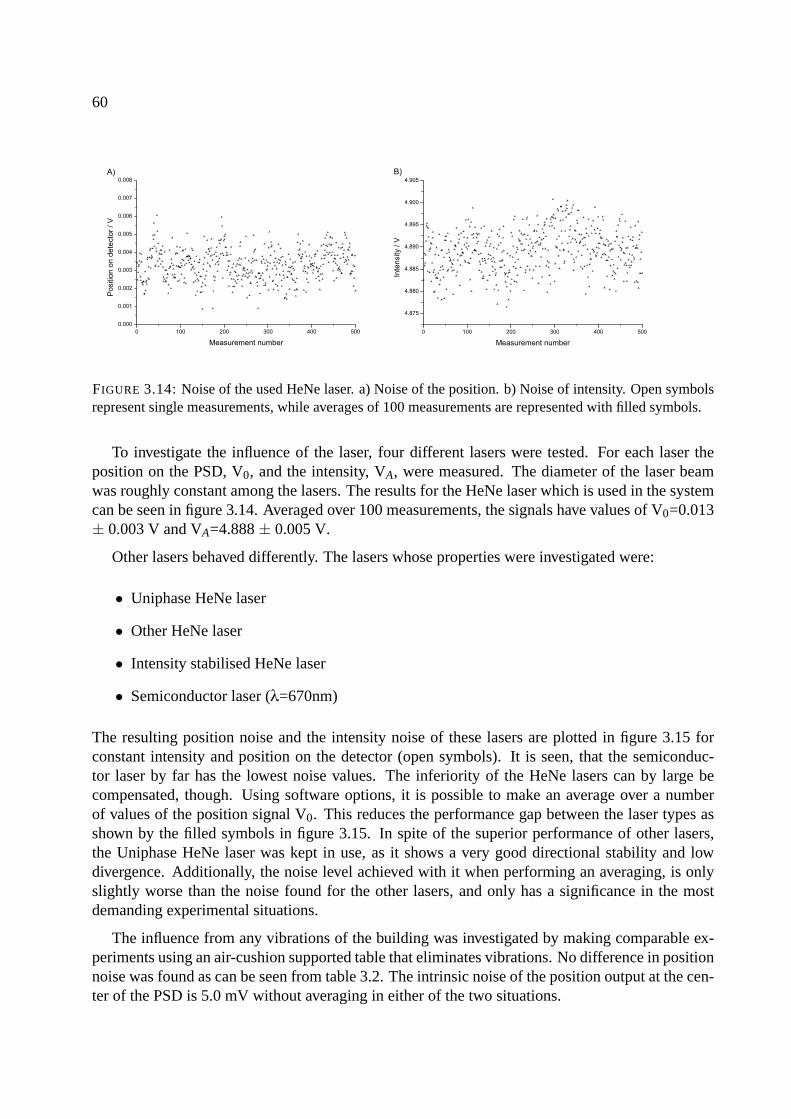
60
FIGURE 3.14: Noise of the used HeNe laser. a) Noise of the position. b) Noise of intensity. Open symbolsrepresent single measurements, while averages of 100 measurements are represented with filled symbols.
To investigate the influence of the laser, four different lasers were tested. For each laser theposition on the PSD, V0, and the intensity, VA, were measured. The diameter of the laser beamwas roughly constant among the lasers. The results for the HeNe laser which is used in the systemcan be seen in figure 3.14. Averaged over 100 measurements, the signals have values of V0=0.013± 0.003 V and VA=4.888 ± 0.005 V.
Other lasers behaved differently. The lasers whose properties were investigated were:
• Uniphase HeNe laser
• Other HeNe laser
• Intensity stabilised HeNe laser
• Semiconductor laser (λ=670nm)
The resulting position noise and the intensity noise of these lasers are plotted in figure 3.15 forconstant intensity and position on the detector (open symbols). It is seen, that the semiconduc-tor laser by far has the lowest noise values. The inferiority of the HeNe lasers can by large becompensated, though. Using software options, it is possible to make an average over a numberof values of the position signal V0. This reduces the performance gap between the laser types asshown by the filled symbols in figure 3.15. In spite of the superior performance of other lasers,the Uniphase HeNe laser was kept in use, as it shows a very good directional stability and lowdivergence. Additionally, the noise level achieved with it when performing an averaging, is onlyslightly worse than the noise found for the other lasers, and only has a significance in the mostdemanding experimental situations.
The influence from any vibrations of the building was investigated by making comparable ex-periments using an air-cushion supported table that eliminates vibrations. No difference in positionnoise was found as can be seen from table 3.2. The intrinsic noise of the position output at the cen-ter of the PSD is 5.0 mV without averaging in either of the two situations.
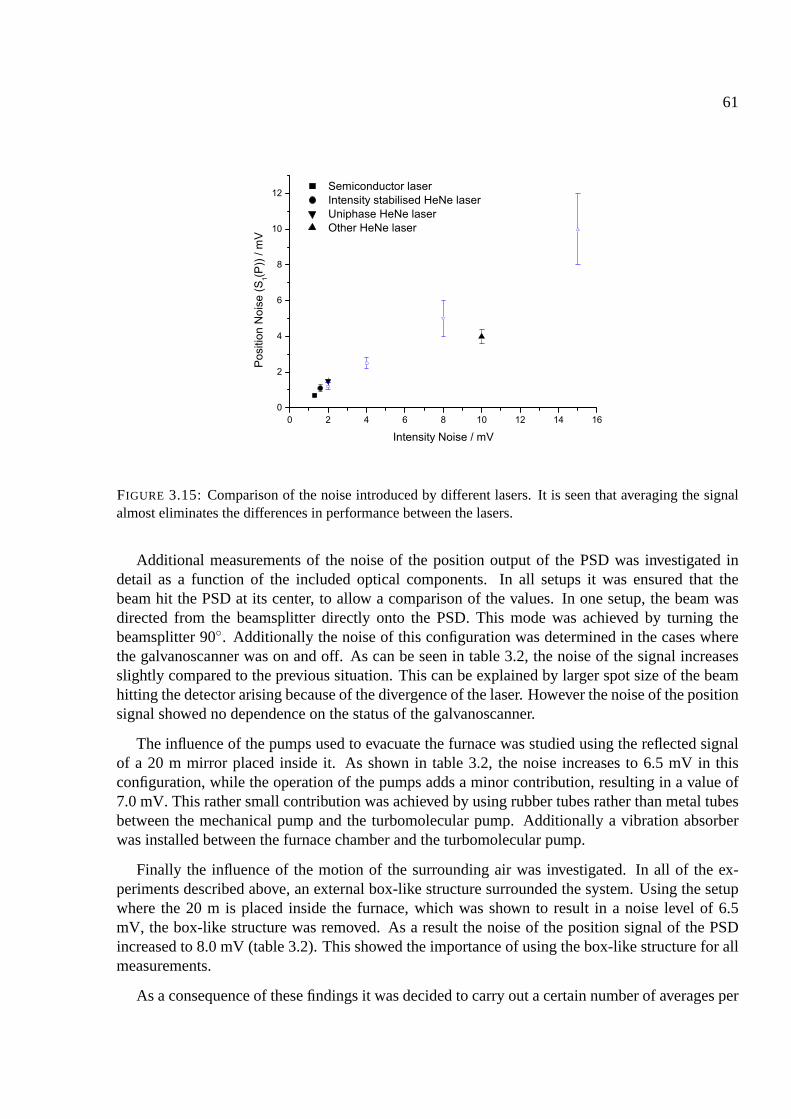
61
FIGURE 3.15: Comparison of the noise introduced by different lasers. It is seen that averaging the signalalmost eliminates the differences in performance between the lasers.
Additional measurements of the noise of the position output of the PSD was investigated indetail as a function of the included optical components. In all setups it was ensured that thebeam hit the PSD at its center, to allow a comparison of the values. In one setup, the beam wasdirected from the beamsplitter directly onto the PSD. This mode was achieved by turning thebeamsplitter 90. Additionally the noise of this configuration was determined in the cases wherethe galvanoscanner was on and off. As can be seen in table 3.2, the noise of the signal increasesslightly compared to the previous situation. This can be explained by larger spot size of the beamhitting the detector arising because of the divergence of the laser. However the noise of the positionsignal showed no dependence on the status of the galvanoscanner.
The influence of the pumps used to evacuate the furnace was studied using the reflected signalof a 20 m mirror placed inside it. As shown in table 3.2, the noise increases to 6.5 mV in thisconfiguration, while the operation of the pumps adds a minor contribution, resulting in a value of7.0 mV. This rather small contribution was achieved by using rubber tubes rather than metal tubesbetween the mechanical pump and the turbomolecular pump. Additionally a vibration absorberwas installed between the furnace chamber and the turbomolecular pump.
Finally the influence of the motion of the surrounding air was investigated. In all of the ex-periments described above, an external box-like structure surrounded the system. Using the setupwhere the 20 m is placed inside the furnace, which was shown to result in a noise level of 6.5mV, the box-like structure was removed. As a result the noise of the position signal of the PSDincreased to 8.0 mV (table 3.2). This showed the importance of using the box-like structure for allmeasurements.
As a consequence of these findings it was decided to carry out a certain number of averages per
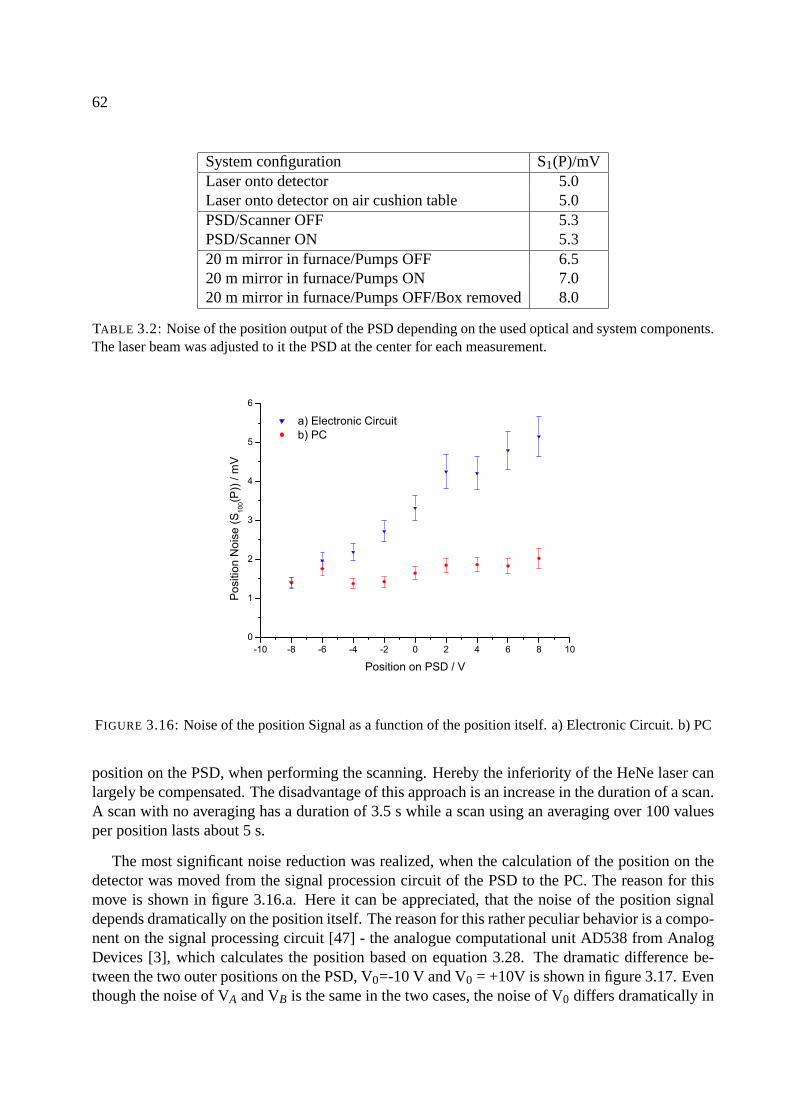
62
System configuration S1(P)/mVLaser onto detector 5.0Laser onto detector on air cushion table 5.0PSD/Scanner OFF 5.3PSD/Scanner ON 5.320 m mirror in furnace/Pumps OFF 6.520 m mirror in furnace/Pumps ON 7.020 m mirror in furnace/Pumps OFF/Box removed 8.0
TABLE 3.2: Noise of the position output of the PSD depending on the used optical and system components.The laser beam was adjusted to it the PSD at the center for each measurement.
FIGURE 3.16: Noise of the position Signal as a function of the position itself. a) Electronic Circuit. b) PC
position on the PSD, when performing the scanning. Hereby the inferiority of the HeNe laser canlargely be compensated. The disadvantage of this approach is an increase in the duration of a scan.A scan with no averaging has a duration of 3.5 s while a scan using an averaging over 100 valuesper position lasts about 5 s.
The most significant noise reduction was realized, when the calculation of the position on thedetector was moved from the signal procession circuit of the PSD to the PC. The reason for thismove is shown in figure 3.16.a. Here it can be appreciated, that the noise of the position signaldepends dramatically on the position itself. The reason for this rather peculiar behavior is a compo-nent on the signal processing circuit [47] - the analogue computational unit AD538 from AnalogDevices [3], which calculates the position based on equation 3.28. The dramatic difference be-tween the two outer positions on the PSD, V0=-10 V and V0 = +10V is shown in figure 3.17. Eventhough the noise of VA and VB is the same in the two cases, the noise of V0 differs dramatically in
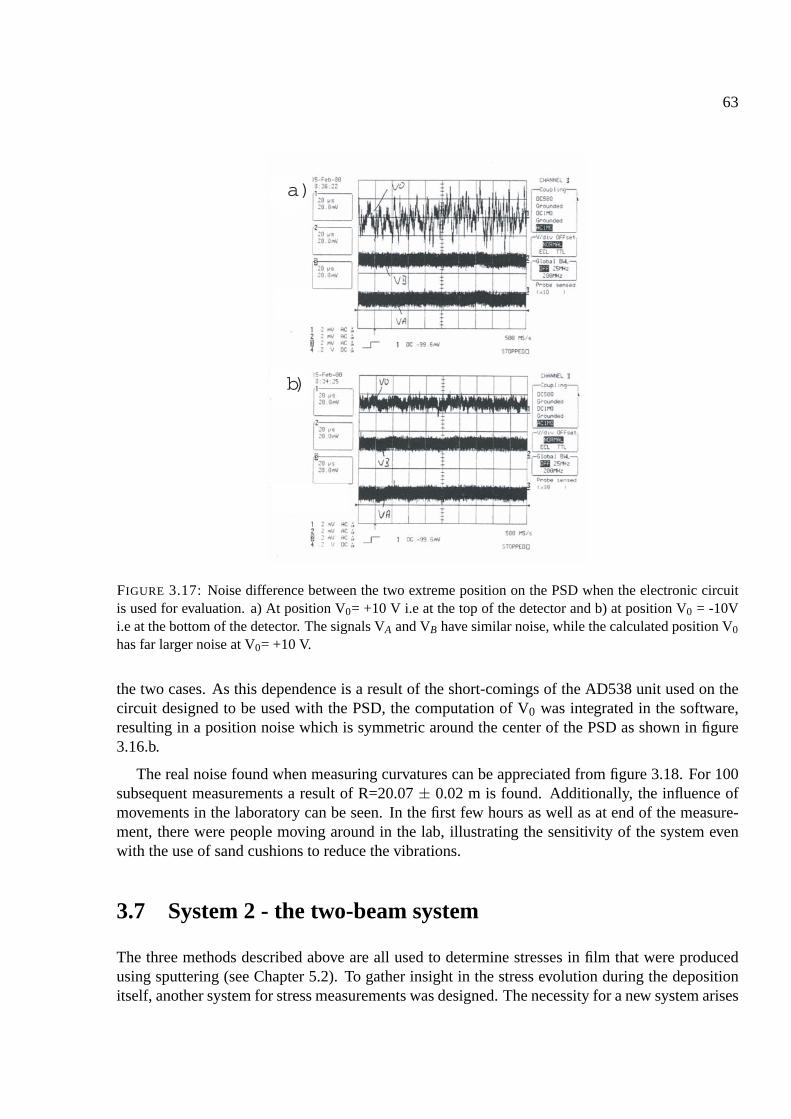
63
a)
b)
FIGURE 3.17: Noise difference between the two extreme position on the PSD when the electronic circuitis used for evaluation. a) At position V0= +10 V i.e at the top of the detector and b) at position V0 = -10Vi.e at the bottom of the detector. The signals VA and VB have similar noise, while the calculated position V0
has far larger noise at V0= +10 V.
the two cases. As this dependence is a result of the short-comings of the AD538 unit used on thecircuit designed to be used with the PSD, the computation of V0 was integrated in the software,resulting in a position noise which is symmetric around the center of the PSD as shown in figure3.16.b.
The real noise found when measuring curvatures can be appreciated from figure 3.18. For 100subsequent measurements a result of R=20.07 ± 0.02 m is found. Additionally, the influence ofmovements in the laboratory can be seen. In the first few hours as well as at end of the measure-ment, there were people moving around in the lab, illustrating the sensitivity of the system evenwith the use of sand cushions to reduce the vibrations.
3.7 System 2 - the two-beam system
The three methods described above are all used to determine stresses in film that were producedusing sputtering (see Chapter 5.2). To gather insight in the stress evolution during the depositionitself, another system for stress measurements was designed. The necessity for a new system arises
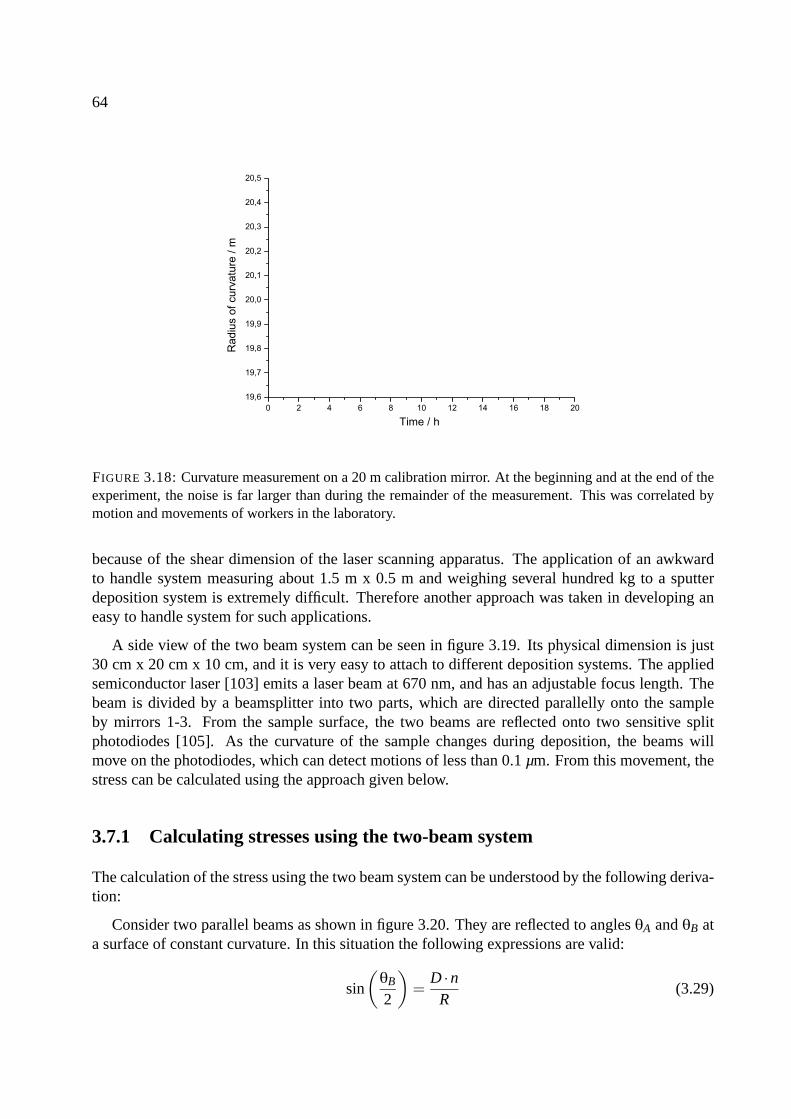
64
FIGURE 3.18: Curvature measurement on a 20 m calibration mirror. At the beginning and at the end of theexperiment, the noise is far larger than during the remainder of the measurement. This was correlated bymotion and movements of workers in the laboratory.
because of the shear dimension of the laser scanning apparatus. The application of an awkwardto handle system measuring about 1.5 m x 0.5 m and weighing several hundred kg to a sputterdeposition system is extremely difficult. Therefore another approach was taken in developing aneasy to handle system for such applications.
A side view of the two beam system can be seen in figure 3.19. Its physical dimension is just30 cm x 20 cm x 10 cm, and it is very easy to attach to different deposition systems. The appliedsemiconductor laser [103] emits a laser beam at 670 nm, and has an adjustable focus length. Thebeam is divided by a beamsplitter into two parts, which are directed parallelly onto the sampleby mirrors 1-3. From the sample surface, the two beams are reflected onto two sensitive splitphotodiodes [105]. As the curvature of the sample changes during deposition, the beams willmove on the photodiodes, which can detect motions of less than 0.1 µm. From this movement, thestress can be calculated using the approach given below.
3.7.1 Calculating stresses using the two-beam system
The calculation of the stress using the two beam system can be understood by the following deriva-tion:
Consider two parallel beams as shown in figure 3.20. They are reflected to angles θA and θB ata surface of constant curvature. In this situation the following expressions are valid:
sin
(θB
2
)=
D ·nR
(3.29)
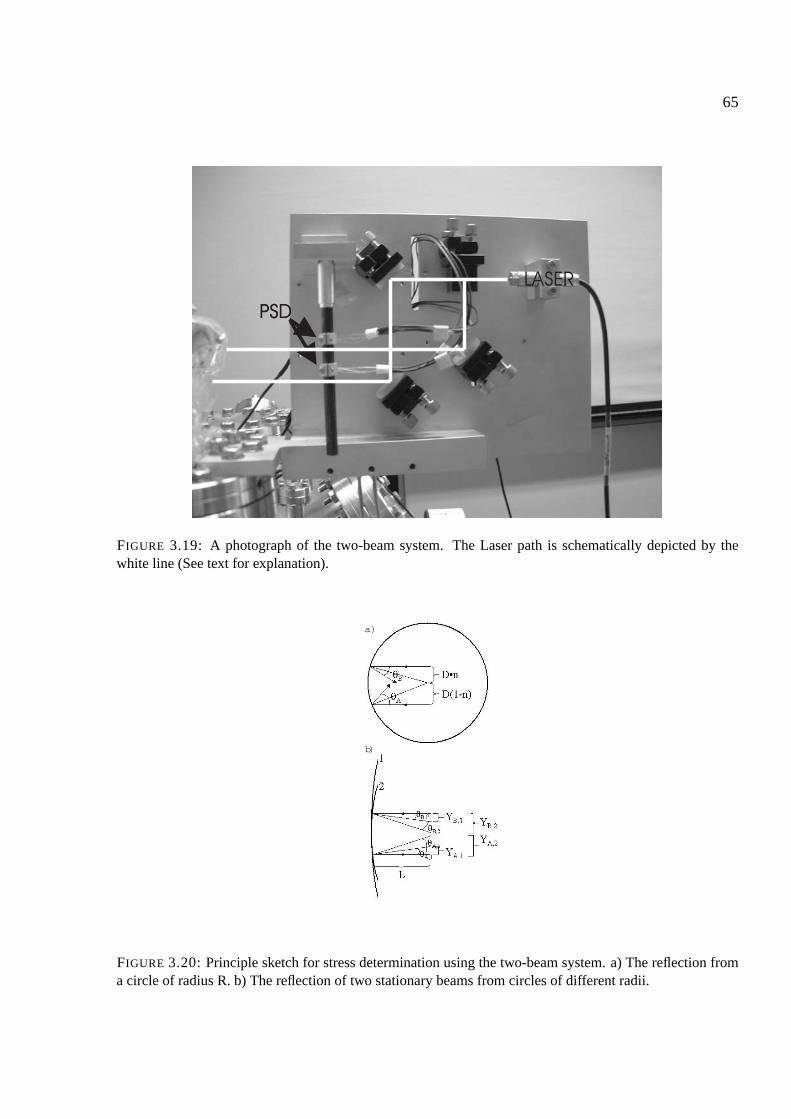
65
FIGURE 3.19: A photograph of the two-beam system. The Laser path is schematically depicted by thewhite line (See text for explanation).
a)
b)
FIGURE 3.20: Principle sketch for stress determination using the two-beam system. a) The reflection froma circle of radius R. b) The reflection of two stationary beams from circles of different radii.

66
sin
(θA
2
)=
D(1−n)R
(3.30)
where D is the distance between the two laser beams hitting the sample, while n determines theposition of the laser beams relative to the center of a circle of radius R.
Adding these expressions yields:
sin
(θB
2
)+ sin
(θA
2
)=
DR
(3.31)
which for small angles approaches:θB
2+
θA
2=
DR
(3.32)
In a situation where the radius of the circle changes from R1 to R2, the following expressions arevalid:
tan(θB,1) =YB,1
L(3.33)
and
tan(θB,2) =YB,2
L(3.34)
where YB,1 and YB,2 are the displacements of the reflected beams at a distance L from the surfaces1 and 2 respectively. θB,1 and θB,2 are the angles of reflection.
For small angles these expressions reduce to:
θB,1 =YB,1
L(3.35)
θB,2 =YB,2
L(3.36)
Combining equations (3.35) and (3.36) yields for beam B:
θB,2 −θB,1 =YB,2 −YB,1
L(3.37)
Similarly one gets the following expression for beam A:
θA,2 −θA,1 =YA,2 −YA,1
L(3.38)
From the Stoney equation (eq. 3.7)
∆σ =Msd2
s
6d f
(1
R2− 1
R1
)(3.39)
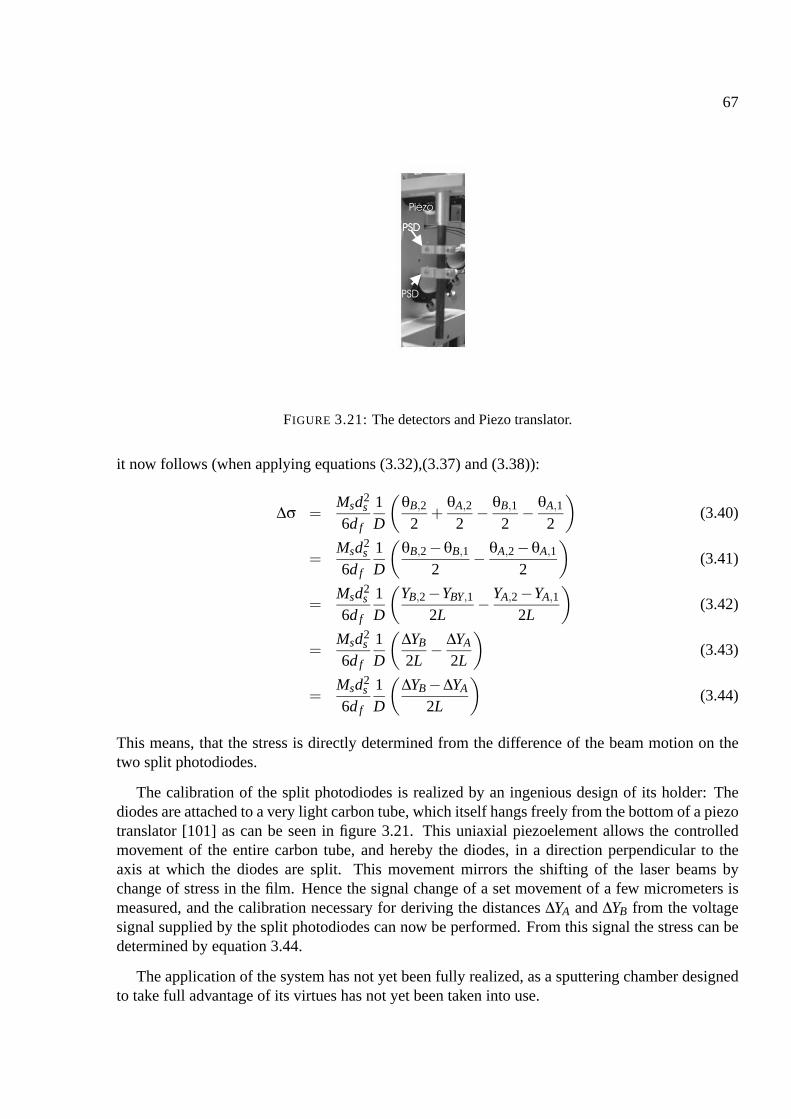
67
FIGURE 3.21: The detectors and Piezo translator.
it now follows (when applying equations (3.32),(3.37) and (3.38)):
∆σ =Msd2
s
6d f
1D
(θB,2
2+
θA,2
2− θB,1
2− θA,1
2
)(3.40)
=Msd2
s
6d f
1D
(θB,2 −θB,1
2− θA,2 −θA,1
2
)(3.41)
=Msd2
s
6d f
1D
(YB,2 −YBY,1
2L− YA,2 −YA,1
2L
)(3.42)
=Msd2
s
6d f
1D
(∆YB
2L− ∆YA
2L
)(3.43)
=Msd2
s
6d f
1D
(∆YB −∆YA
2L
)(3.44)
This means, that the stress is directly determined from the difference of the beam motion on thetwo split photodiodes.
The calibration of the split photodiodes is realized by an ingenious design of its holder: Thediodes are attached to a very light carbon tube, which itself hangs freely from the bottom of a piezotranslator [101] as can be seen in figure 3.21. This uniaxial piezoelement allows the controlledmovement of the entire carbon tube, and hereby the diodes, in a direction perpendicular to theaxis at which the diodes are split. This movement mirrors the shifting of the laser beams bychange of stress in the film. Hence the signal change of a set movement of a few micrometers ismeasured, and the calibration necessary for deriving the distances ∆YA and ∆YB from the voltagesignal supplied by the split photodiodes can now be performed. From this signal the stress can bedetermined by equation 3.44.
The application of the system has not yet been fully realized, as a sputtering chamber designedto take full advantage of its virtues has not yet been taken into use.
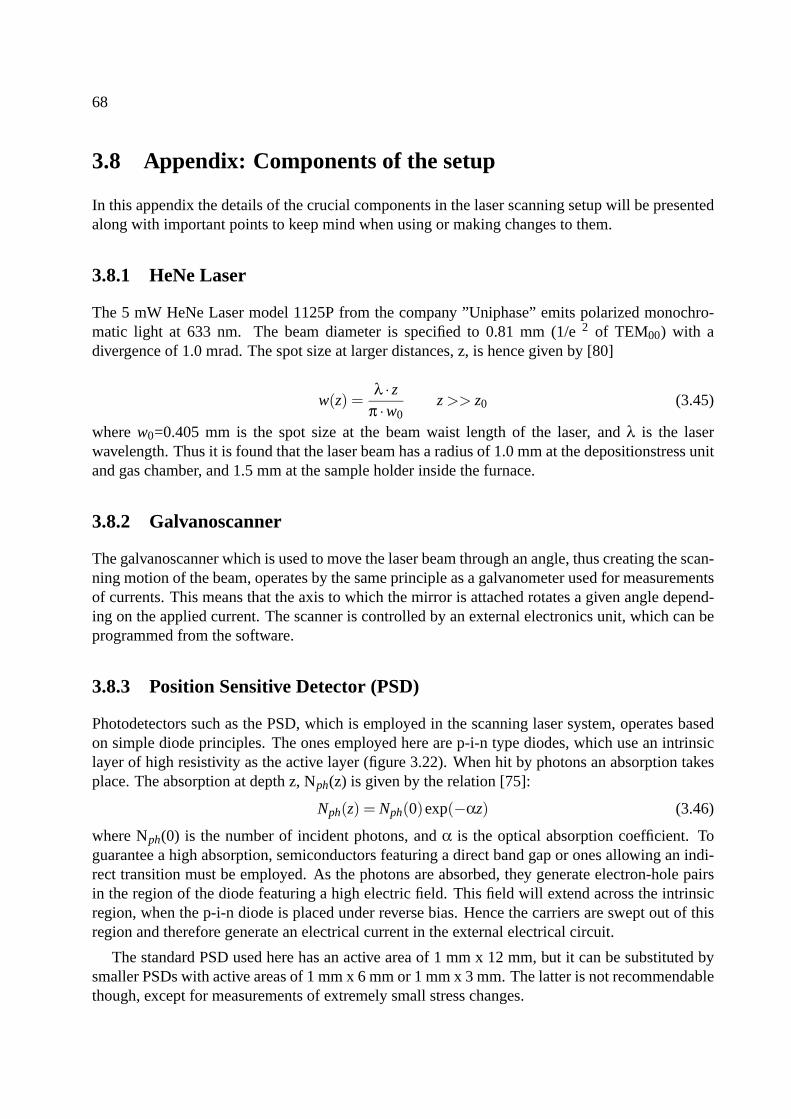
68
3.8 Appendix: Components of the setup
In this appendix the details of the crucial components in the laser scanning setup will be presentedalong with important points to keep mind when using or making changes to them.
3.8.1 HeNe Laser
The 5 mW HeNe Laser model 1125P from the company ”Uniphase” emits polarized monochro-matic light at 633 nm. The beam diameter is specified to 0.81 mm (1/e 2 of TEM00) with adivergence of 1.0 mrad. The spot size at larger distances, z, is hence given by [80]
w(z) =λ · z
π ·w0z >> z0 (3.45)
where w0=0.405 mm is the spot size at the beam waist length of the laser, and λ is the laserwavelength. Thus it is found that the laser beam has a radius of 1.0 mm at the depositionstress unitand gas chamber, and 1.5 mm at the sample holder inside the furnace.
3.8.2 Galvanoscanner
The galvanoscanner which is used to move the laser beam through an angle, thus creating the scan-ning motion of the beam, operates by the same principle as a galvanometer used for measurementsof currents. This means that the axis to which the mirror is attached rotates a given angle depend-ing on the applied current. The scanner is controlled by an external electronics unit, which can beprogrammed from the software.
3.8.3 Position Sensitive Detector (PSD)
Photodetectors such as the PSD, which is employed in the scanning laser system, operates basedon simple diode principles. The ones employed here are p-i-n type diodes, which use an intrinsiclayer of high resistivity as the active layer (figure 3.22). When hit by photons an absorption takesplace. The absorption at depth z, Nph(z) is given by the relation [75]:
Nph(z) = Nph(0)exp(−αz) (3.46)
where Nph(0) is the number of incident photons, and α is the optical absorption coefficient. Toguarantee a high absorption, semiconductors featuring a direct band gap or ones allowing an indi-rect transition must be employed. As the photons are absorbed, they generate electron-hole pairsin the region of the diode featuring a high electric field. This field will extend across the intrinsicregion, when the p-i-n diode is placed under reverse bias. Hence the carriers are swept out of thisregion and therefore generate an electrical current in the external electrical circuit.
The standard PSD used here has an active area of 1 mm x 12 mm, but it can be substituted bysmaller PSDs with active areas of 1 mm x 6 mm or 1 mm x 3 mm. The latter is not recommendablethough, except for measurements of extremely small stress changes.
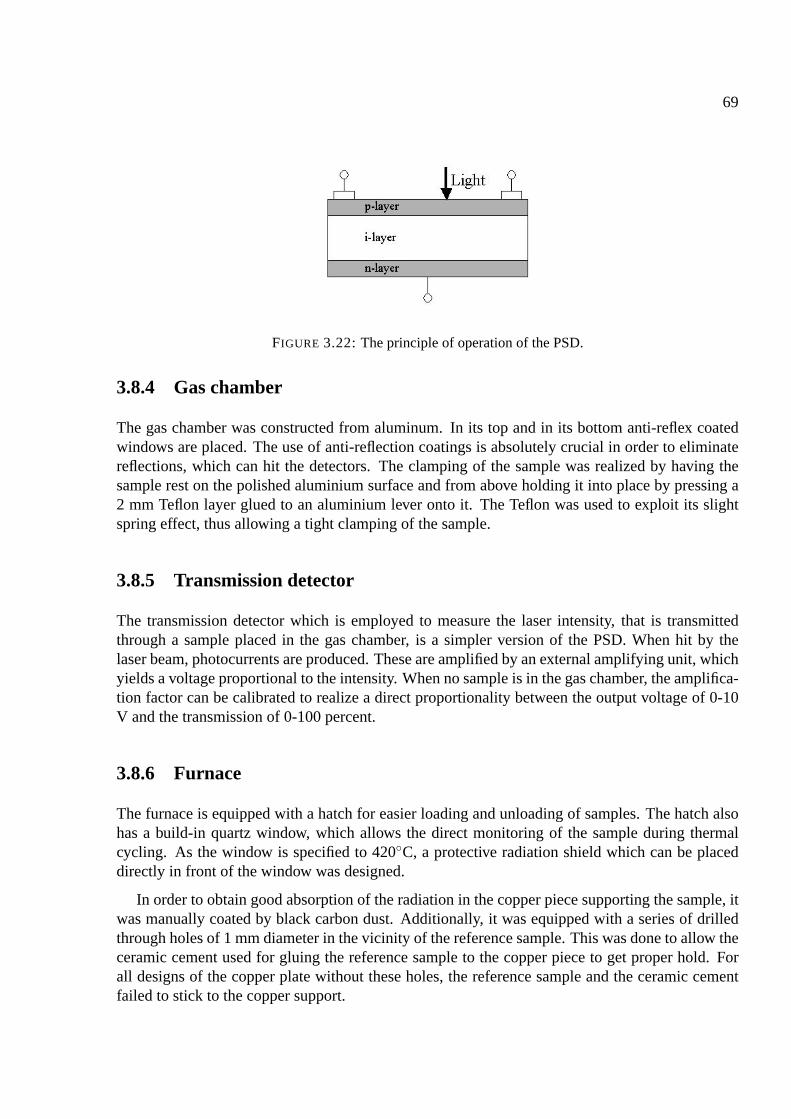
69
FIGURE 3.22: The principle of operation of the PSD.
3.8.4 Gas chamber
The gas chamber was constructed from aluminum. In its top and in its bottom anti-reflex coatedwindows are placed. The use of anti-reflection coatings is absolutely crucial in order to eliminatereflections, which can hit the detectors. The clamping of the sample was realized by having thesample rest on the polished aluminium surface and from above holding it into place by pressing a2 mm Teflon layer glued to an aluminium lever onto it. The Teflon was used to exploit its slightspring effect, thus allowing a tight clamping of the sample.
3.8.5 Transmission detector
The transmission detector which is employed to measure the laser intensity, that is transmittedthrough a sample placed in the gas chamber, is a simpler version of the PSD. When hit by thelaser beam, photocurrents are produced. These are amplified by an external amplifying unit, whichyields a voltage proportional to the intensity. When no sample is in the gas chamber, the amplifica-tion factor can be calibrated to realize a direct proportionality between the output voltage of 0-10V and the transmission of 0-100 percent.
3.8.6 Furnace
The furnace is equipped with a hatch for easier loading and unloading of samples. The hatch alsohas a build-in quartz window, which allows the direct monitoring of the sample during thermalcycling. As the window is specified to 420C, a protective radiation shield which can be placeddirectly in front of the window was designed.
In order to obtain good absorption of the radiation in the copper piece supporting the sample, itwas manually coated by black carbon dust. Additionally, it was equipped with a series of drilledthrough holes of 1 mm diameter in the vicinity of the reference sample. This was done to allow theceramic cement used for gluing the reference sample to the copper piece to get proper hold. Forall designs of the copper plate without these holes, the reference sample and the ceramic cementfailed to stick to the copper support.
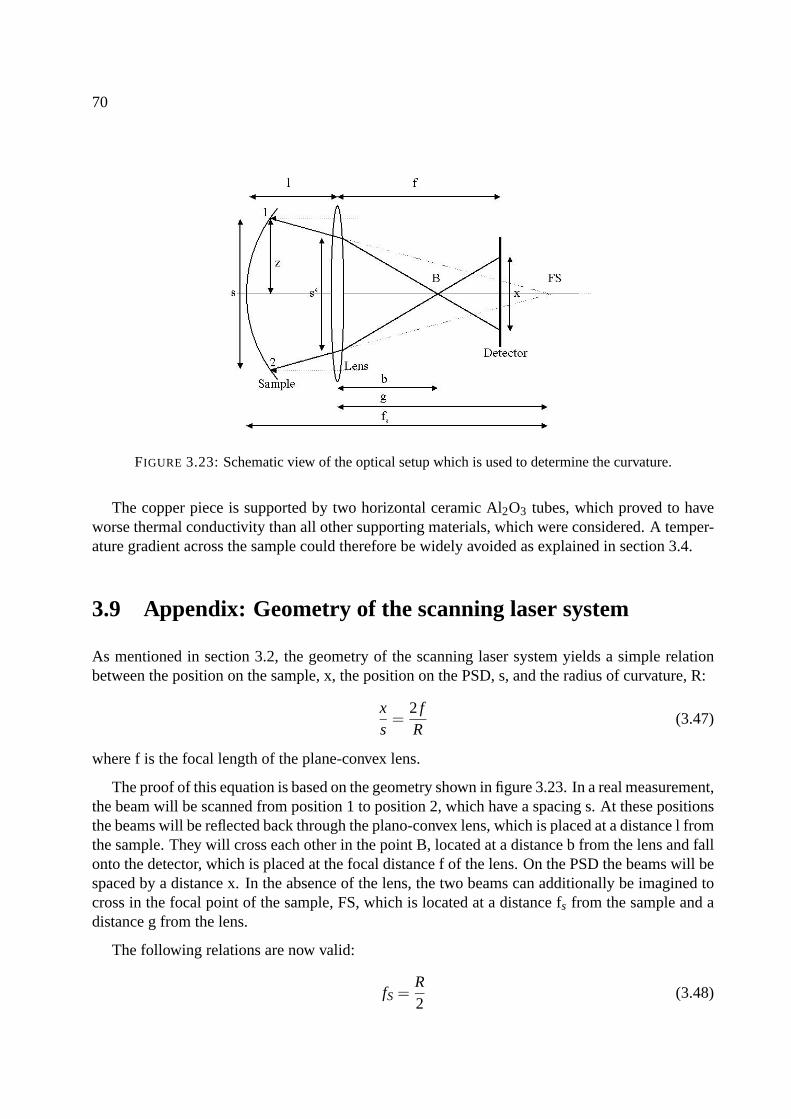
70
FIGURE 3.23: Schematic view of the optical setup which is used to determine the curvature.
The copper piece is supported by two horizontal ceramic Al2O3 tubes, which proved to haveworse thermal conductivity than all other supporting materials, which were considered. A temper-ature gradient across the sample could therefore be widely avoided as explained in section 3.4.
3.9 Appendix: Geometry of the scanning laser system
As mentioned in section 3.2, the geometry of the scanning laser system yields a simple relationbetween the position on the sample, x, the position on the PSD, s, and the radius of curvature, R:
xs
=2 fR
(3.47)
where f is the focal length of the plane-convex lens.
The proof of this equation is based on the geometry shown in figure 3.23. In a real measurement,the beam will be scanned from position 1 to position 2, which have a spacing s. At these positionsthe beams will be reflected back through the plano-convex lens, which is placed at a distance l fromthe sample. They will cross each other in the point B, located at a distance b from the lens and fallonto the detector, which is placed at the focal distance f of the lens. On the PSD the beams will bespaced by a distance x. In the absence of the lens, the two beams can additionally be imagined tocross in the focal point of the sample, FS, which is located at a distance fs from the sample and adistance g from the lens.
The following relations are now valid:
fS =R2
(3.48)
71
and1f
=1g· 1
b(3.49)
The relationship between x and s can be expressed as:
xs
=xs′· s′
s(3.50)
where the distance between the laser beams at the lens is s’. Denoting the height difference betweenthe point on the sample hit by the beam and the center of the sample by z means that:
s′
s=
gfs − z
=fs − lfs − z
(3.51)
= f
(1f− 1
g
)−1 (3.52)
=fg
(3.53)
=f
fs − l(3.54)
Similarly,
xs′
=f −b
b=
fb−1 (3.55)
= f
(1f− 1
g
)−1 (3.56)
=fg
(3.57)
=f
fs − l(3.58)
Inserting equations (3.54) and (3.58) in equation (3.50) and applying equation (3.48) now yields:
xs
=xs′· s′
s(3.59)
=f
fs − l· fs − l
fs − z(3.60)
=ffs· 1
1− zfs
(3.61)
=ffs
(z fs) (3.62)
=2 · f
R(2z R) (3.63)
Equation 3.63 is in fact only valid for 2z R. This means that there is a restriction on the scansize depending on the radius of curvature, as can be seen from the following considerations.
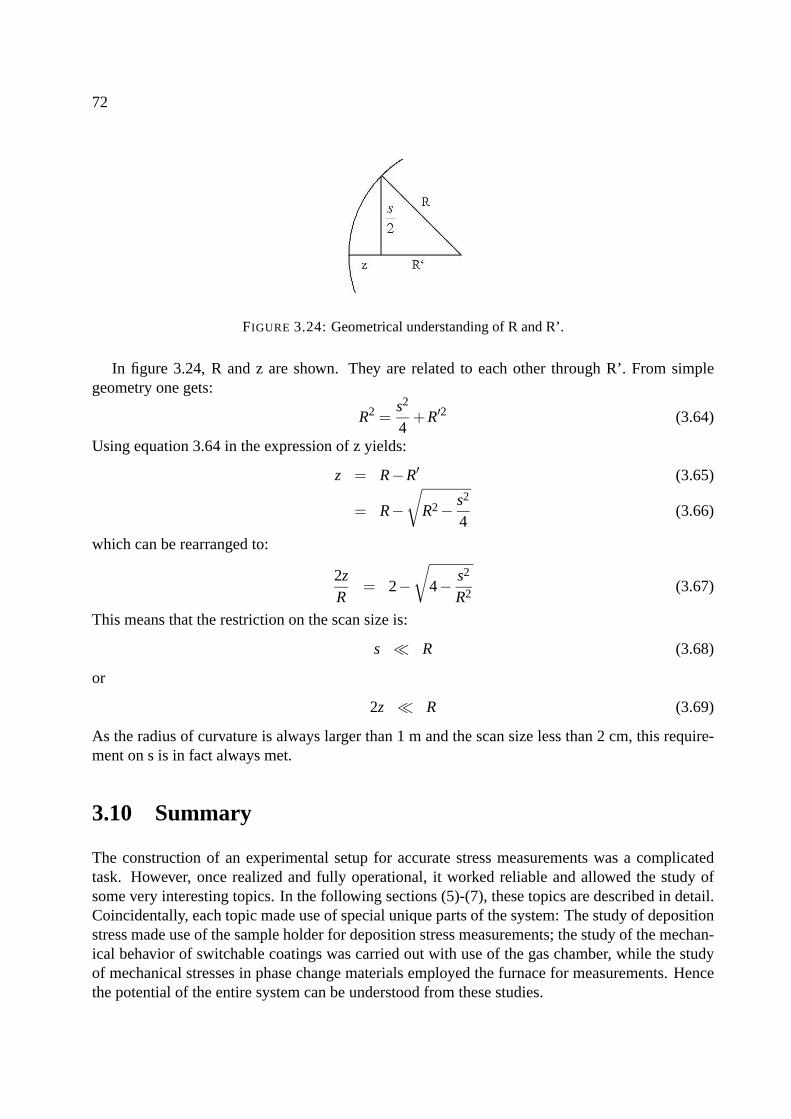
72
FIGURE 3.24: Geometrical understanding of R and R’.
In figure 3.24, R and z are shown. They are related to each other through R’. From simplegeometry one gets:
R2 =s2
4+R′2 (3.64)
Using equation 3.64 in the expression of z yields:
z = R−R′ (3.65)
= R−√
R2 − s2
4(3.66)
which can be rearranged to:
2zR
= 2−√
4− s2
R2 (3.67)
This means that the restriction on the scan size is:
s R (3.68)
or
2z R (3.69)
As the radius of curvature is always larger than 1 m and the scan size less than 2 cm, this require-ment on s is in fact always met.
3.10 Summary
The construction of an experimental setup for accurate stress measurements was a complicatedtask. However, once realized and fully operational, it worked reliable and allowed the study ofsome very interesting topics. In the following sections (5)-(7), these topics are described in detail.Coincidentally, each topic made use of special unique parts of the system: The study of depositionstress made use of the sample holder for deposition stress measurements; the study of the mechan-ical behavior of switchable coatings was carried out with use of the gas chamber, while the studyof mechanical stresses in phase change materials employed the furnace for measurements. Hencethe potential of the entire system can be understood from these studies.
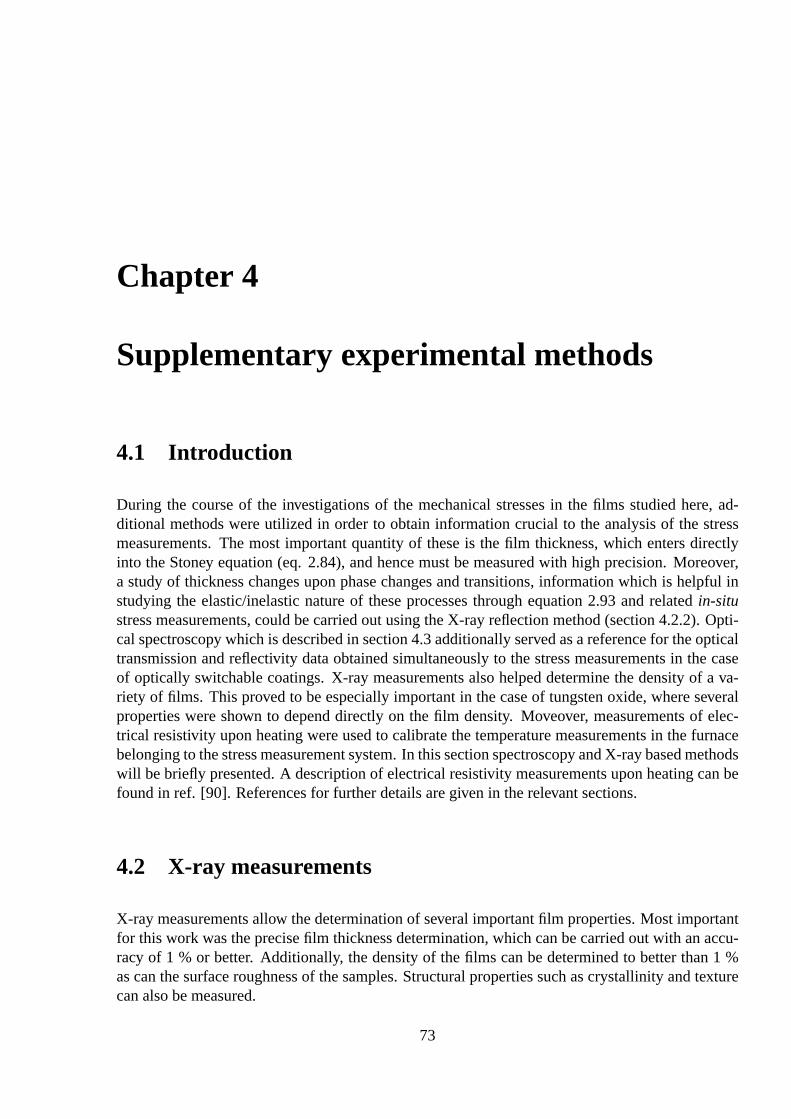
Chapter 4
Supplementary experimental methods
4.1 Introduction
During the course of the investigations of the mechanical stresses in the films studied here, ad-ditional methods were utilized in order to obtain information crucial to the analysis of the stressmeasurements. The most important quantity of these is the film thickness, which enters directlyinto the Stoney equation (eq. 2.84), and hence must be measured with high precision. Moreover,a study of thickness changes upon phase changes and transitions, information which is helpful instudying the elastic/inelastic nature of these processes through equation 2.93 and related in-situstress measurements, could be carried out using the X-ray reflection method (section 4.2.2). Opti-cal spectroscopy which is described in section 4.3 additionally served as a reference for the opticaltransmission and reflectivity data obtained simultaneously to the stress measurements in the caseof optically switchable coatings. X-ray measurements also helped determine the density of a va-riety of films. This proved to be especially important in the case of tungsten oxide, where severalproperties were shown to depend directly on the film density. Moveover, measurements of elec-trical resistivity upon heating were used to calibrate the temperature measurements in the furnacebelonging to the stress measurement system. In this section spectroscopy and X-ray based methodswill be briefly presented. A description of electrical resistivity measurements upon heating can befound in ref. [90]. References for further details are given in the relevant sections.
4.2 X-ray measurements
X-ray measurements allow the determination of several important film properties. Most importantfor this work was the precise film thickness determination, which can be carried out with an accu-racy of 1 % or better. Additionally, the density of the films can be determined to better than 1 %as can the surface roughness of the samples. Structural properties such as crystallinity and texturecan also be measured.
73
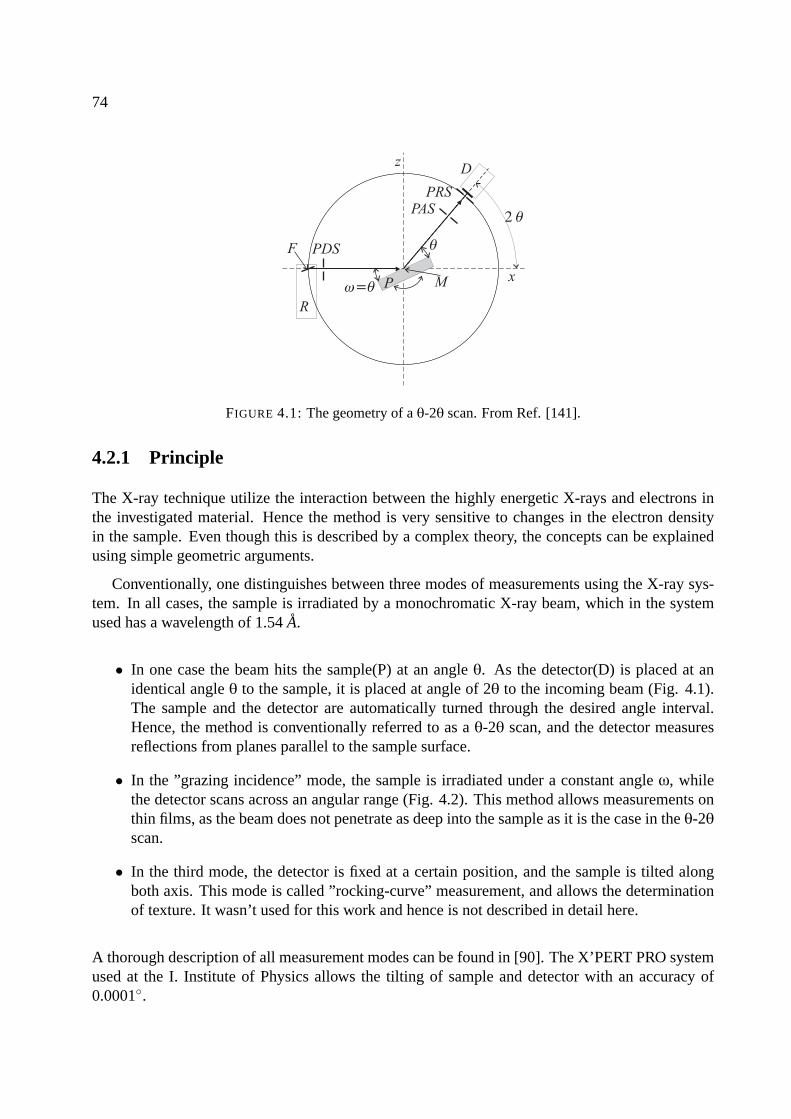
74
R
F PDS
PAS
PRS
D
Mx
z
P
FIGURE 4.1: The geometry of a θ-2θ scan. From Ref. [141].
4.2.1 Principle
The X-ray technique utilize the interaction between the highly energetic X-rays and electrons inthe investigated material. Hence the method is very sensitive to changes in the electron densityin the sample. Even though this is described by a complex theory, the concepts can be explainedusing simple geometric arguments.
Conventionally, one distinguishes between three modes of measurements using the X-ray sys-tem. In all cases, the sample is irradiated by a monochromatic X-ray beam, which in the systemused has a wavelength of 1.54 A.
• In one case the beam hits the sample(P) at an angle θ. As the detector(D) is placed at anidentical angle θ to the sample, it is placed at angle of 2θ to the incoming beam (Fig. 4.1).The sample and the detector are automatically turned through the desired angle interval.Hence, the method is conventionally referred to as a θ-2θ scan, and the detector measuresreflections from planes parallel to the sample surface.
• In the ”grazing incidence” mode, the sample is irradiated under a constant angle ω, whilethe detector scans across an angular range (Fig. 4.2). This method allows measurements onthin films, as the beam does not penetrate as deep into the sample as it is the case in the θ-2θscan.
• In the third mode, the detector is fixed at a certain position, and the sample is tilted alongboth axis. This mode is called ”rocking-curve” measurement, and allows the determinationof texture. It wasn’t used for this work and hence is not described in detail here.
A thorough description of all measurement modes can be found in [90]. The X’PERT PRO systemused at the I. Institute of Physics allows the tilting of sample and detector with an accuracy of0.0001.
75
R
F PDS
PAS
PRS
D
MP
z
x
FIGURE 4.2: The setup of a grazing incidence measurement. From Ref. [141].
4.2.2 X-ray reflection
In the case of X-ray reflection (XRR) measurements, the θ-2θ scan is applied in all cases. FromXRR measurements important film properties such as density, thickness and roughness can bededuced. The theory of these procedures can be found in references [141] and [90]. Here only abrief look into the determination of these properties is given.
In fig. 4.3 typical θ-2θ scans are shown. Several features are evident. At low angles the so-called total reflection edge is seen. Its position θT R is closely related to the density, ρ, of the filmthrough
ΘT R ∼ ρ1/2 (4.1)
At higher angles, an interference pattern from the reflection of the X-ray at the surface of the filmand the interface between film and substrate can be seen. The distance between the interferenceoscillations is closely related to the thickness d of the film:
d ≈ λ2
1Θn+1 −Θn
(4.2)
where Θn and Θn+1 are the angles of subsequent maxima, and λ is the wavelength of the X-ray.Additionally, statements about the sample roughness can be made using XRR measurements. Theextinction of the interference oscillations at lower angles as seen in fig. 4.3.c indicates that thesample has higher roughness than the samples shown in fig. 4.3.a and fig. 4.3.b.
4.2.3 X-ray diffraction
X-ray diffraction (XRD) is used for the characterization of crystalline samples. The method isbased on the well-known Bragg condition. In figure 4.4 the scattering from different lattice planesis shown. The Bragg condition for constructive interference is:
2dhklsinθ = λ (4.3)
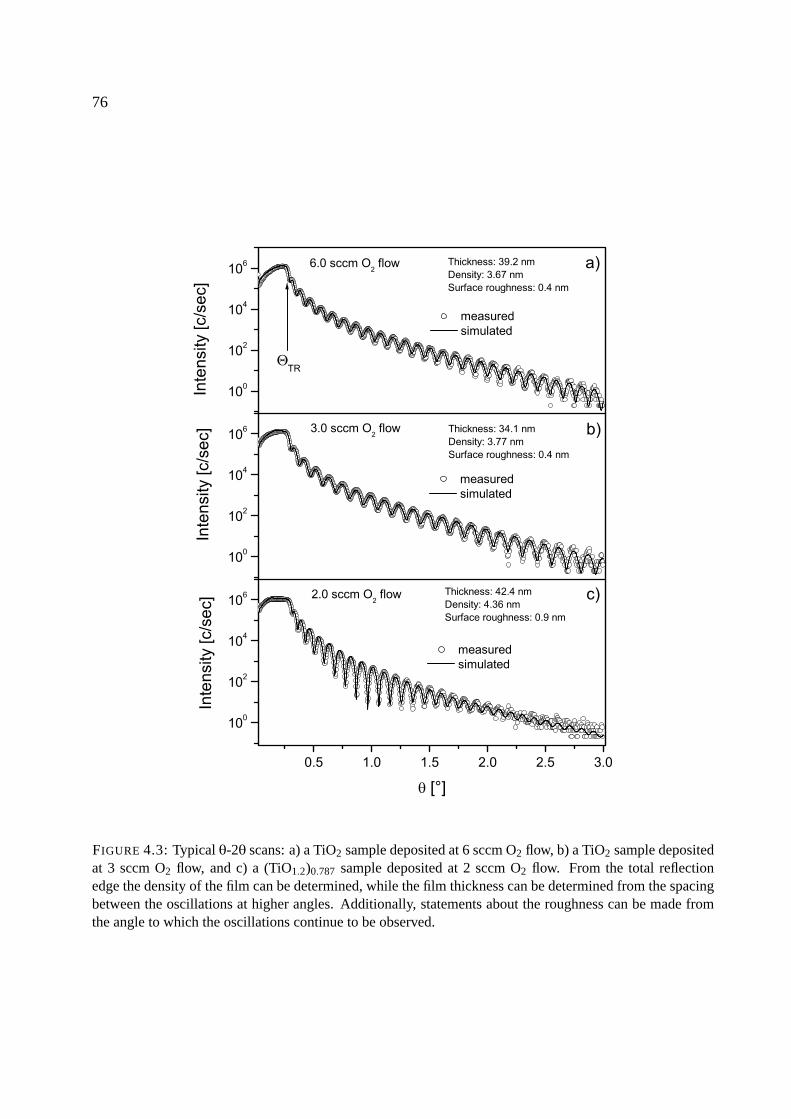
76
FIGURE 4.3: Typical θ-2θ scans: a) a TiO2 sample deposited at 6 sccm O2 flow, b) a TiO2 sample depositedat 3 sccm O2 flow, and c) a (TiO1.2)0.787 sample deposited at 2 sccm O2 flow. From the total reflectionedge the density of the film can be determined, while the film thickness can be determined from the spacingbetween the oscillations at higher angles. Additionally, statements about the roughness can be made fromthe angle to which the oscillations continue to be observed.
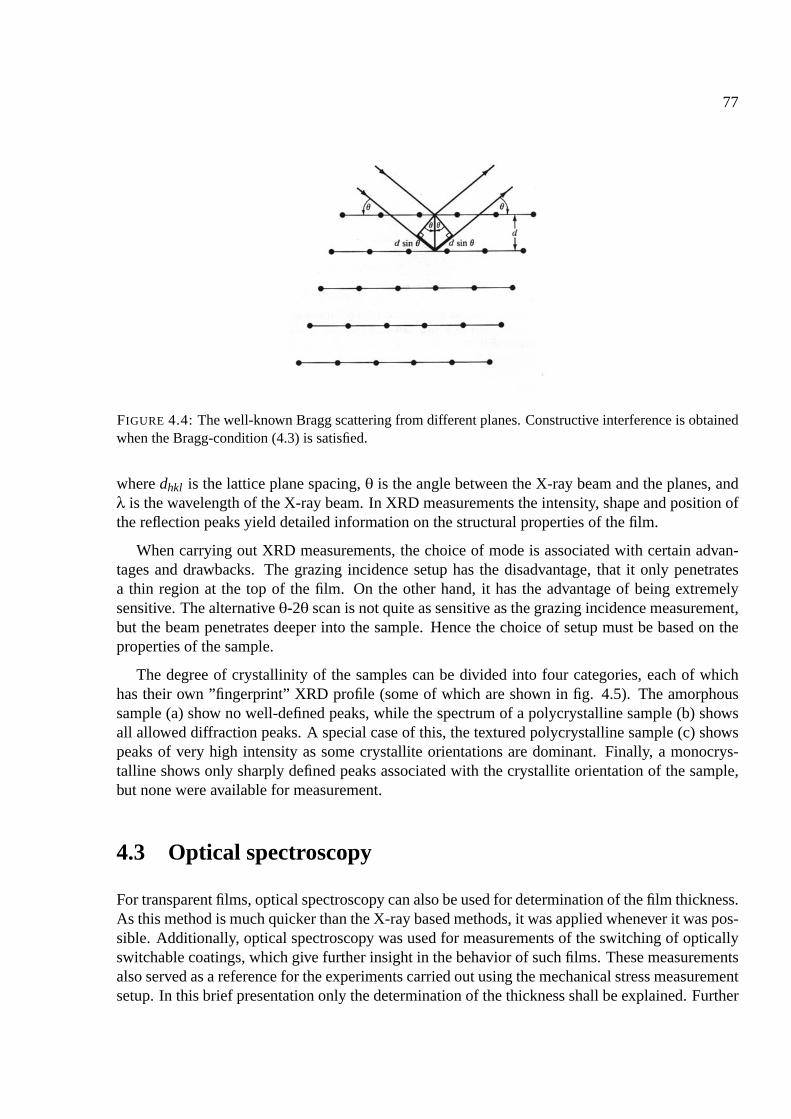
77
FIGURE 4.4: The well-known Bragg scattering from different planes. Constructive interference is obtainedwhen the Bragg-condition (4.3) is satisfied.
where dhkl is the lattice plane spacing, θ is the angle between the X-ray beam and the planes, andλ is the wavelength of the X-ray beam. In XRD measurements the intensity, shape and position ofthe reflection peaks yield detailed information on the structural properties of the film.
When carrying out XRD measurements, the choice of mode is associated with certain advan-tages and drawbacks. The grazing incidence setup has the disadvantage, that it only penetratesa thin region at the top of the film. On the other hand, it has the advantage of being extremelysensitive. The alternative θ-2θ scan is not quite as sensitive as the grazing incidence measurement,but the beam penetrates deeper into the sample. Hence the choice of setup must be based on theproperties of the sample.
The degree of crystallinity of the samples can be divided into four categories, each of whichhas their own ”fingerprint” XRD profile (some of which are shown in fig. 4.5). The amorphoussample (a) show no well-defined peaks, while the spectrum of a polycrystalline sample (b) showsall allowed diffraction peaks. A special case of this, the textured polycrystalline sample (c) showspeaks of very high intensity as some crystallite orientations are dominant. Finally, a monocrys-talline shows only sharply defined peaks associated with the crystallite orientation of the sample,but none were available for measurement.
4.3 Optical spectroscopy
For transparent films, optical spectroscopy can also be used for determination of the film thickness.As this method is much quicker than the X-ray based methods, it was applied whenever it was pos-sible. Additionally, optical spectroscopy was used for measurements of the switching of opticallyswitchable coatings, which give further insight in the behavior of such films. These measurementsalso served as a reference for the experiments carried out using the mechanical stress measurementsetup. In this brief presentation only the determination of the thickness shall be explained. Further
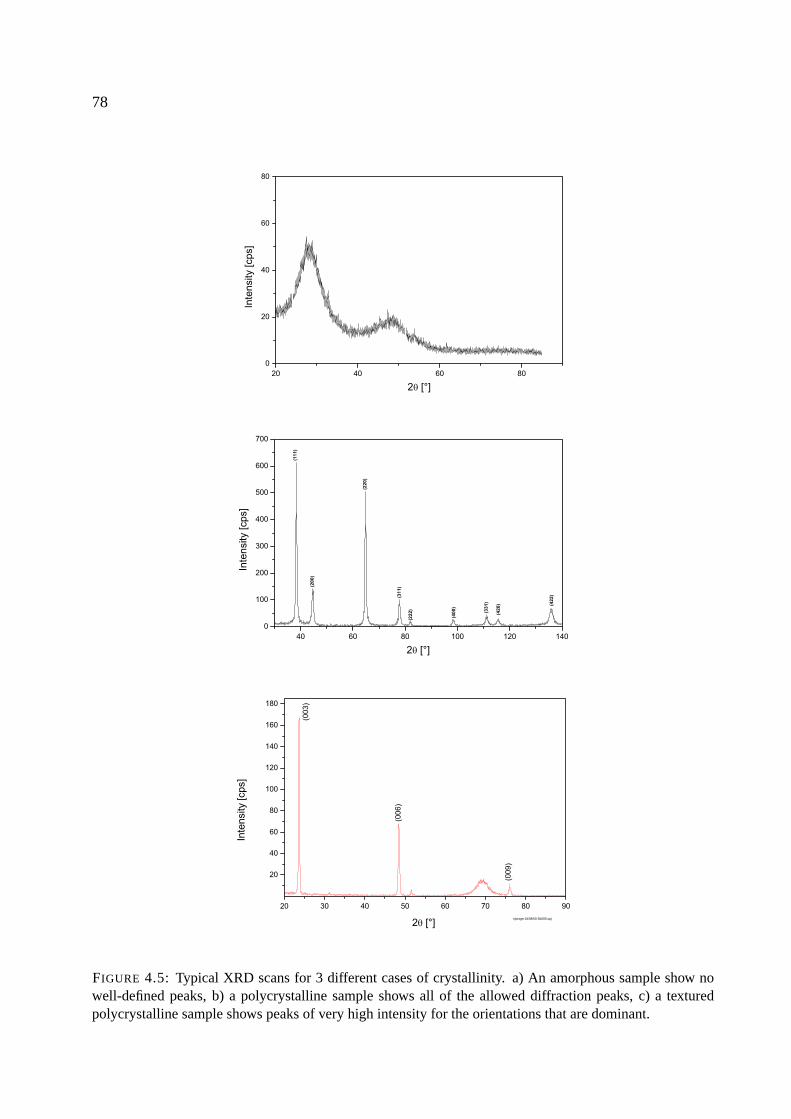
78
FIGURE 4.5: Typical XRD scans for 3 different cases of crystallinity. a) An amorphous sample show nowell-defined peaks, b) a polycrystalline sample shows all of the allowed diffraction peaks, c) a texturedpolycrystalline sample shows peaks of very high intensity for the orientations that are dominant.

79
FIGURE 4.6: The principle of the spectrometer. See text for details. After ref. [141].
details on the virtues of optical spectroscopy can be found in ref. [141].
4.3.1 Principle
The main purpose of optical spectroscopy is the determination of the transmission and reflectionproperties of a given film. At the I. Institute of Physics this was carried out using a LAMBDA-25spectrometer from Perkin-Elmer. This instrument allows investigations of optical properties in thewavelength region of λ = 190-1100 nm. The principle of the measurement is shown in fig. 4.6.For transmittance measurements the monochromatic light is simultaneously directed through thesample and a reference sample, while the reflectivity of the sample is compared with the reflectionof a reference sample in the case of reflectivity measurements. In a measurement, the reflectivityand transmission is measured step-wise across the desired wavelength region (typically 190 - 1100nm) with a resolution of 960 nm/min.
To obtain the thickness (and the index of refraction) the measured behavior of reflectivity andtransmission is simulated. The simulation is carried out in the SCOUT 2 programme by appli-cation of the Fresnel equations. By this procedure the film is characterized by its thickness andits dielectric function. It is beyond the scope of this work to describe this method in detail, but athorough treatment of optical spectroscopy and the simulations using SCOUT 2 can be found inref. [141].

80
Chapter 5
Deposition stresses in transition metaloxides
5.1 Introduction
Understanding and controlling mechanical stresses is of great importance in the field of transitionmetal oxides. The group of transition metals consists of Ti, Zr, Hf, V, Nb, Ta, Cr, Mo and W. Thesemetals form the stoichiometrically stable oxides TiO2, ZrO2, HfO2, V2O5, Nb2O5, Ta2O5, CrO3,MoO3 and WO3.
These oxides have a wide array of possible applications and are used as functional coatings inmany devices. Their main application is however optical coatings. Thin films based on these oxidescan be used to design coatings that allow a high transmission of the solar energy into a buildingand also has a high reflectance in the infrared, helping confine the heat in a building. Hence energyused for heating can be saved, by application of window equipped with such coatings. In warmregions of the world the coatings are designed in the opposite way to hinder the transmission ofsolar energy into the building. Thus energy used for cooling can be saved.
Additionally, such transition metal oxides find application in laser mirrors, ionic conductors,broadband interference filters [77] as well transparent conductive coatings, hard coatings etc. Inrecent years TiO2 has attracted particular interest as its anatase phase has photocatalytic and hy-drophylic properties, which have been exploited in devices such as antibacterial and self-sterilizingcoatings, self-cleaning clothes, self-cleaning windows and anti-fogging glass, dishwashers, self-cleaning house and street coatings [35] and air- and water purification devices [99] especially inJapan.
As these films are applied in situations where it is crucial to guarantee a certain lifetime, it isimportant to understand and control their level of mechanical stress. Stress induced effects canlead to a partly or complete loss of functionality in case of a serious failure such as delaminationor the formation of cracks. As the films in most cases do not undergo any transformations in theirapplication, but just deliver a given function, the source of mechanical stresses in the films ariseduring deposition. Hence it is the objective of this study to investigate and understand the originof deposition stresses in such transition metal oxides.
81
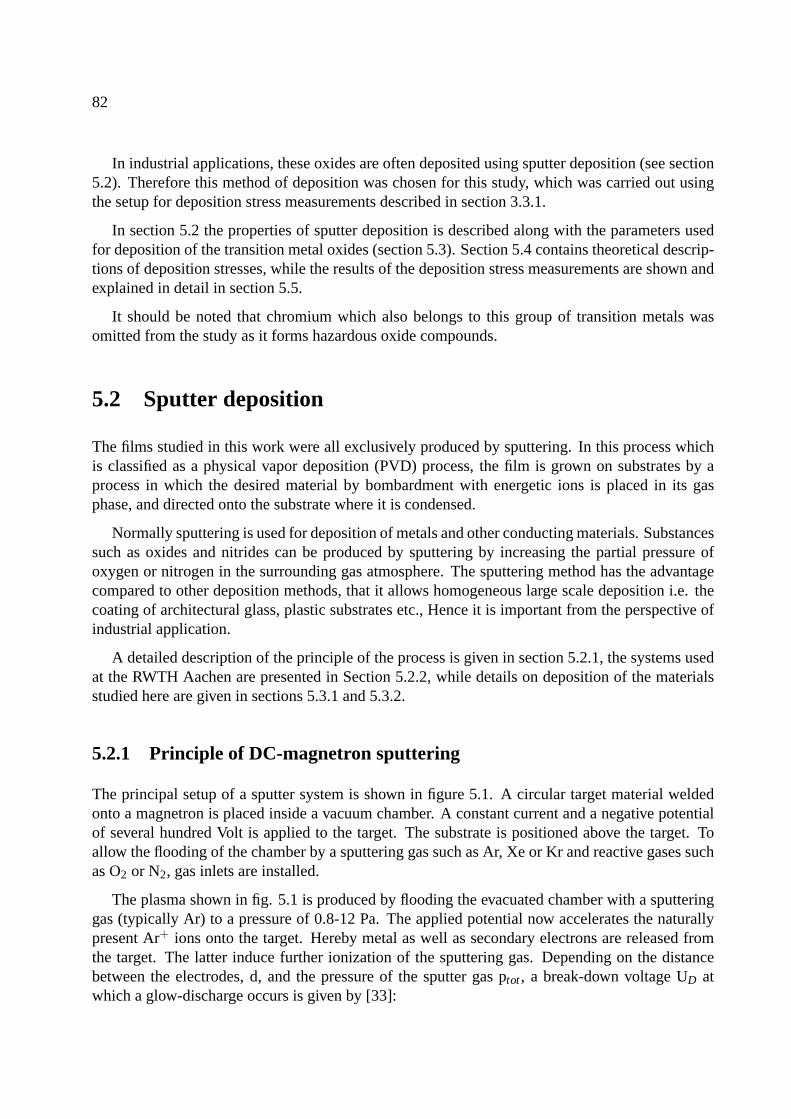
82
In industrial applications, these oxides are often deposited using sputter deposition (see section5.2). Therefore this method of deposition was chosen for this study, which was carried out usingthe setup for deposition stress measurements described in section 3.3.1.
In section 5.2 the properties of sputter deposition is described along with the parameters usedfor deposition of the transition metal oxides (section 5.3). Section 5.4 contains theoretical descrip-tions of deposition stresses, while the results of the deposition stress measurements are shown andexplained in detail in section 5.5.
It should be noted that chromium which also belongs to this group of transition metals wasomitted from the study as it forms hazardous oxide compounds.
5.2 Sputter deposition
The films studied in this work were all exclusively produced by sputtering. In this process whichis classified as a physical vapor deposition (PVD) process, the film is grown on substrates by aprocess in which the desired material by bombardment with energetic ions is placed in its gasphase, and directed onto the substrate where it is condensed.
Normally sputtering is used for deposition of metals and other conducting materials. Substancessuch as oxides and nitrides can be produced by sputtering by increasing the partial pressure ofoxygen or nitrogen in the surrounding gas atmosphere. The sputtering method has the advantagecompared to other deposition methods, that it allows homogeneous large scale deposition i.e. thecoating of architectural glass, plastic substrates etc., Hence it is important from the perspective ofindustrial application.
A detailed description of the principle of the process is given in section 5.2.1, the systems usedat the RWTH Aachen are presented in Section 5.2.2, while details on deposition of the materialsstudied here are given in sections 5.3.1 and 5.3.2.
5.2.1 Principle of DC-magnetron sputtering
The principal setup of a sputter system is shown in figure 5.1. A circular target material weldedonto a magnetron is placed inside a vacuum chamber. A constant current and a negative potentialof several hundred Volt is applied to the target. The substrate is positioned above the target. Toallow the flooding of the chamber by a sputtering gas such as Ar, Xe or Kr and reactive gases suchas O2 or N2, gas inlets are installed.
The plasma shown in fig. 5.1 is produced by flooding the evacuated chamber with a sputteringgas (typically Ar) to a pressure of 0.8-12 Pa. The applied potential now accelerates the naturallypresent Ar+ ions onto the target. Hereby metal as well as secondary electrons are released fromthe target. The latter induce further ionization of the sputtering gas. Depending on the distancebetween the electrodes, d, and the pressure of the sputter gas ptot , a break-down voltage UD atwhich a glow-discharge occurs is given by [33]:
83
FIGURE 5.1: Principle setup of a sputter system. The argon ions are accelerated onto the target wherematerial is sputtered away. Parts of the sputtered material hits the substrate where the film is grown. Seetext for further details. After ref. [141]
UD =A · ptot ·d
ln(ptot ·d)+B(5.1)
where A and B are material constants. Hence, when the ionization rate produced by the secondaryelectrons is above a certain threshold, a stable glowing plasma is created.
To reduce the necessary gas pressure required for stable plasma operation, in magnetron sput-tering a circular magnet is placed below the target. Due to its radial north-south characteristics, theelectrons now travel in paths above the target as seen in figure 5.1. Therefore the electrons travelin the sputter gas for a longer duration and thus have a larger possibility of ionizing it. As a result,the pressure of the sputtering gas can be reduced by up to a factor of 100 and still suffice for stableplasma operation. This reduction of the pressure additionally implies, that the material releasedfrom the target is subject to less collisions with the sputter gas atoms on its path to the substrate.Hence it possesses larger kinetic energy upon arrival at the substrate, and also the sputter rate isincreased. The disadvantage of the use of a magnet below the target is, that the electron-density inthe plasma is largest where the magnetic field is parallel to the target surface. Hence the majority ofthe released material from the target, origins from a circular area on it. This leads to the formationof a so-called erosion pit on the target mirroring the magnetic field. As a result the target materialis not used efficiently, as the target must be exchanged once the target material has been removedin the region of the erosion pit.
Because of the nature of the sputtering process, only conducting materials can be used as atarget material in the case of direct current (DC) sputtering. In the case of a non-conductive targetmaterial, the bombardment by positive ions would result in a build-up of charge at its surface. Thiswould result in a screening the applied electrical field, and thus the process would quickly stop.
84
The deposition of non-conductive films can only be made possible by applying special sputter-configurations. Oxides and nitrides can easily be prepared by addition of oxygen and nitrogen,respectively, to the gas atmosphere in the sputter chamber. This configuration is called ”reactivesputtering” and was used to deposit the oxides and nitrides studied in this work. Another con-figuration allowing the deposition of non-conductive materials is radio frequency (RF) sputtering,in which an alternating potential is applied to the target. In this case, the sputter process hastwo phases: In the first phase the deposition takes place, while in the second phase the charge isremoved from the target surface.
The properties of the resulting deposited films depend on a variety of parameters of the sputterprocess. The most important ones are:
• Sputter current (Is): The sputter current determines the current flowing in the target i.e. thenumber of impinging ions. The main contribution stems from the Ar+ ions. In the mostfrequently used sputter modes, the sputter current is held constant to ensure a constant rateof material removal.
• Sputter voltage (V): As mentioned above, a voltage can be applied to the target. This voltagedetermines the maximum energy with which the ions of the sputter gas can hit the target. Asthe gas ions do not transfer all their energy to single target atoms, the energy of the releasedatoms will have a distribution within a certain energy range (typical energies are 1-10 eV[56], [123]). Additionally, the sputter voltage determines the sputter yield Ys i.e. the numberof atoms released per incoming sputter gas ion by the relation [24]:
Ys = const · (V −V0)2/3 (5.2)
where V0 is a material constant which typically lies in the range 10-50 eV.
• Target to substrate distance (d): Along with the total pressure, the distance between thetarget and the substrate determines the number of collisions with the atoms of the sputtergas, which the sputtered particles are subject to on their path from the target to the substrateand hence their kinetic energies upon arrival at the substrate.
• Total pressure (ptot): The total pressure determines the mean free path length and hence thekinetic energy of the sputtered particles travelling towards the substrate. The mean free pathis proportional to 1/ptot (von Paschen law) [33].
• Partial pressures of reactive gases (pspecimen): By adding reactive gases such as O2 and N2
to the gas atmosphere of the sputter chamber, oxides and nitrides can be produced. Theirstoichiometry can be tuned by varying the pressure of the reactive gases at a constant totalpressure. The addition of reactive gases additionally affects the sputter yield and the rateof removal from the target, as they can cover the target surface. The implications of thesephenomena on the sputter conditions and film properties are further elaborated in section5.3.2.
• Substrate temperature (Ts): The temperature of the substrate affects the density and alsothe degree of crystallinity of the growing film, as elevated temperatures will assist diffusion
85
in the growing film. Additionally an elevated substrate temperature can lead to mechanicalstresses through (2.97).
• Substrate bias: By biasing the substrate, ions and electrons can be directed onto it, andadditionally be accelerated or decelerated. The density, crystallinity and other film propertiescan be manipulated using this approach [24], [144].
• Angle of deposition: Even though the system employed at the RWTH Aachen uses a parallelpositioning of target and substrate, other geometries can be used. As a result, a thicknessgradient across the film as well as anisotropic effects can be produced.
• Size and geometry of target: Depending on the target size and the depth of the erosion pit,the degree of (in)homogenity of the film properties across the substrate can be (in)voluntarychanged.
5.2.2 Sputter systems used
For the production of the films investigated in this work two sputter systems were used. The firstsystem was custom-built at the I. Institute of Physics (Fig. 5.2) [123]. It possesses six targetpositions placed inside a cylindrical chamber. The targets have a diameter of 76 mm. Above themat a distance of 55-78 mm, the substrates are positioned on a rotatable platform carrying 24 spacesfor substrates. The sputtering is carried out in a stationary mode i.e. the desired substrate is rotatedto a position above the target of choice, and the film is deposited. Before deposition the chamberis evacuated to a base pressure of 1 x 10⁻³ Pa before being flooded with an argon sputter gas of99.999% purity and in some cases a reactive gas (O2 or N2) of 99.999% purity to a total pressureof 0.8-12 Pa. Voltage is applied to the target by an external power supply yielding a max. outputof 600 V at 1.2 A. During sputtering the current is always kept constant.
The second system in use is a commercial system LS320S from Pfeiffer/von Ardenne (Fig 5.3).It is constructed for the sole purpose of sputtering films for optical data storage applications. Itallows the production of four samples per sputter run. The samples are positioned at a distance of40 mm above the targets on a rotatable platform. There are four target positions. Upon sputtering,the system is evacuated to a pressure of less than 3 x 10⁻⁶ mbar. An argon gas of 99.999% purityis used as a sputter gas at a flow rate of 30 sccm, yielding a total pressure of 7.3 x 10⁻³mbar. Aftera pre-sputter process, which serves to clean the target, the sputtering is carried out in either of twomodes:
• Stationary sputtering, where the substrate is placed above the target and the film is deposited.
• Sputtering during rotation, where the platform carrying the substrates is rotated at a rate ofapproximately 20 rpm.
The phase change material targets used with this system included Ag5.5In6.5Sb59Te29, Ge2Sb2Te5,and Ge4Sb1Te5, which were all deposited using DC-sputtering at rates of 0.5 nm/s, 0.5 nm/s and0.4 nm/s respectively. In some cases films of either SiO2, Si3N4 or ZnS-SiO2 were sputtered on topof the phase change films to protect them against oxidation - all these cap layers were depositedusing the RF-method at rates of 0.010 nm/s, 0.013 nm/s and 0.018 nm/s, respectively.
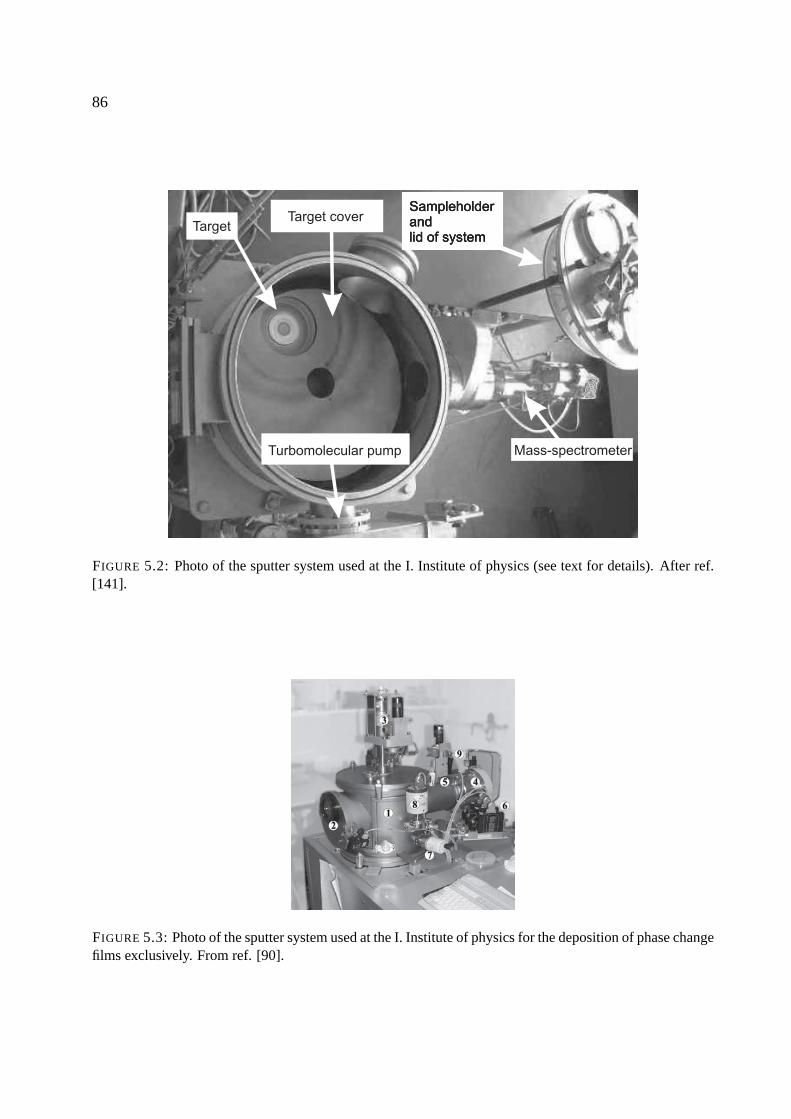
86
FIGURE 5.2: Photo of the sputter system used at the I. Institute of physics (see text for details). After ref.[141].
FIGURE 5.3: Photo of the sputter system used at the I. Institute of physics for the deposition of phase changefilms exclusively. From ref. [90].
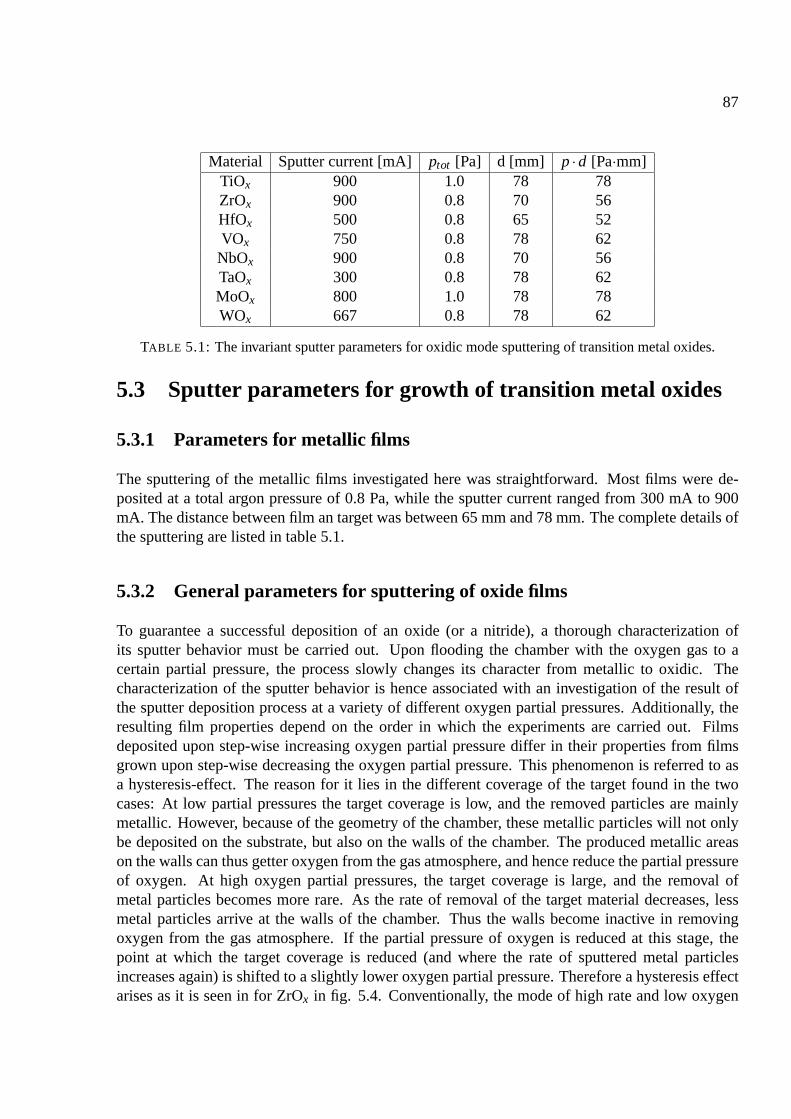
87
Material Sputter current [mA] ptot [Pa] d [mm] p ·d [Pa·mm]TiOx 900 1.0 78 78ZrOx 900 0.8 70 56HfOx 500 0.8 65 52VOx 750 0.8 78 62
NbOx 900 0.8 70 56TaOx 300 0.8 78 62MoOx 800 1.0 78 78WOx 667 0.8 78 62
TABLE 5.1: The invariant sputter parameters for oxidic mode sputtering of transition metal oxides.
5.3 Sputter parameters for growth of transition metal oxides
5.3.1 Parameters for metallic films
The sputtering of the metallic films investigated here was straightforward. Most films were de-posited at a total argon pressure of 0.8 Pa, while the sputter current ranged from 300 mA to 900mA. The distance between film an target was between 65 mm and 78 mm. The complete details ofthe sputtering are listed in table 5.1.
5.3.2 General parameters for sputtering of oxide films
To guarantee a successful deposition of an oxide (or a nitride), a thorough characterization ofits sputter behavior must be carried out. Upon flooding the chamber with the oxygen gas to acertain partial pressure, the process slowly changes its character from metallic to oxidic. Thecharacterization of the sputter behavior is hence associated with an investigation of the result ofthe sputter deposition process at a variety of different oxygen partial pressures. Additionally, theresulting film properties depend on the order in which the experiments are carried out. Filmsdeposited upon step-wise increasing oxygen partial pressure differ in their properties from filmsgrown upon step-wise decreasing the oxygen partial pressure. This phenomenon is referred to asa hysteresis-effect. The reason for it lies in the different coverage of the target found in the twocases: At low partial pressures the target coverage is low, and the removed particles are mainlymetallic. However, because of the geometry of the chamber, these metallic particles will not onlybe deposited on the substrate, but also on the walls of the chamber. The produced metallic areason the walls can thus getter oxygen from the gas atmosphere, and hence reduce the partial pressureof oxygen. At high oxygen partial pressures, the target coverage is large, and the removal ofmetal particles becomes more rare. As the rate of removal of the target material decreases, lessmetal particles arrive at the walls of the chamber. Thus the walls become inactive in removingoxygen from the gas atmosphere. If the partial pressure of oxygen is reduced at this stage, thepoint at which the target coverage is reduced (and where the rate of sputtered metal particlesincreases again) is shifted to a slightly lower oxygen partial pressure. Therefore a hysteresis effectarises as it is seen in for ZrOx in fig. 5.4. Conventionally, the mode of high rate and low oxygen
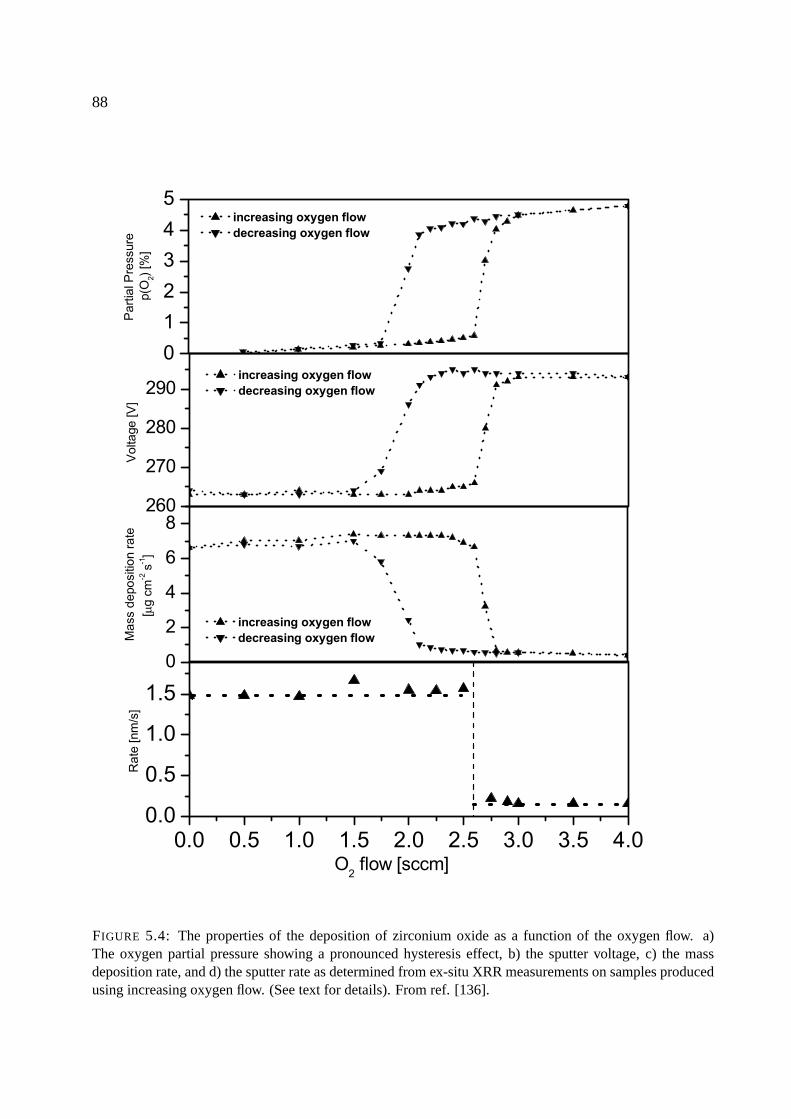
88
FIGURE 5.4: The properties of the deposition of zirconium oxide as a function of the oxygen flow. a)The oxygen partial pressure showing a pronounced hysteresis effect, b) the sputter voltage, c) the massdeposition rate, and d) the sputter rate as determined from ex-situ XRR measurements on samples producedusing increasing oxygen flow. (See text for details). From ref. [136].
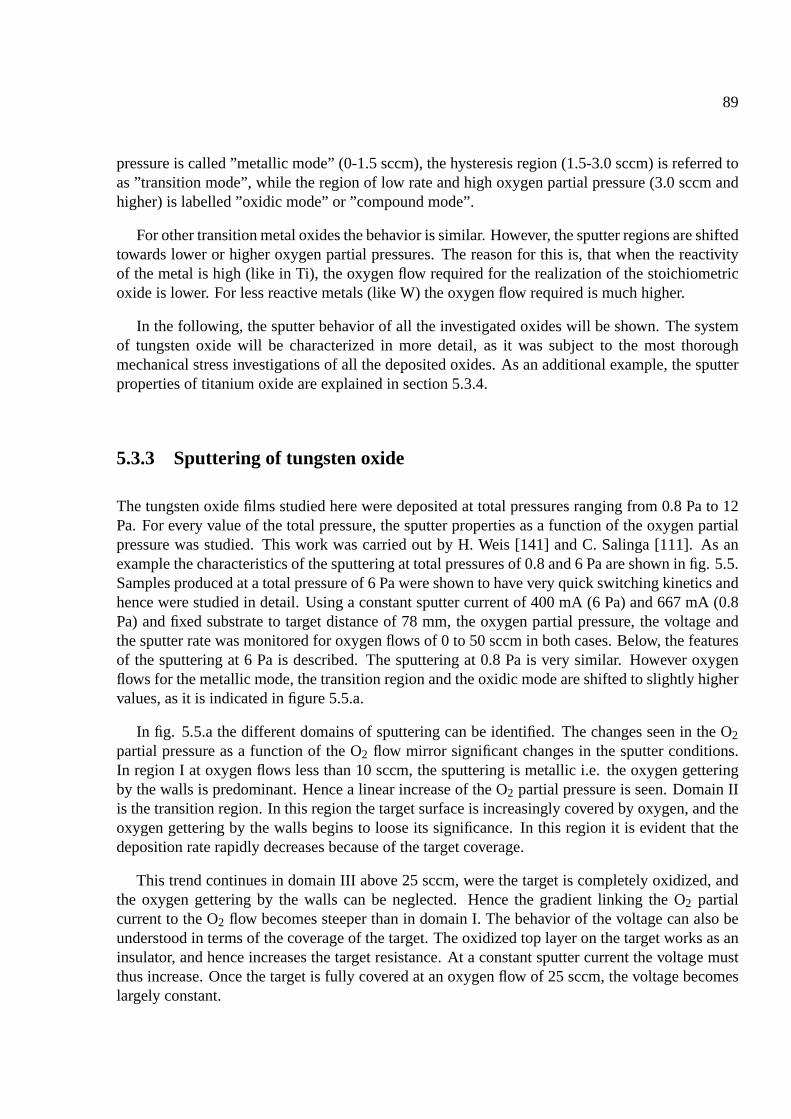
89
pressure is called ”metallic mode” (0-1.5 sccm), the hysteresis region (1.5-3.0 sccm) is referred toas ”transition mode”, while the region of low rate and high oxygen partial pressure (3.0 sccm andhigher) is labelled ”oxidic mode” or ”compound mode”.
For other transition metal oxides the behavior is similar. However, the sputter regions are shiftedtowards lower or higher oxygen partial pressures. The reason for this is, that when the reactivityof the metal is high (like in Ti), the oxygen flow required for the realization of the stoichiometricoxide is lower. For less reactive metals (like W) the oxygen flow required is much higher.
In the following, the sputter behavior of all the investigated oxides will be shown. The systemof tungsten oxide will be characterized in more detail, as it was subject to the most thoroughmechanical stress investigations of all the deposited oxides. As an additional example, the sputterproperties of titanium oxide are explained in section 5.3.4.
5.3.3 Sputtering of tungsten oxide
The tungsten oxide films studied here were deposited at total pressures ranging from 0.8 Pa to 12Pa. For every value of the total pressure, the sputter properties as a function of the oxygen partialpressure was studied. This work was carried out by H. Weis [141] and C. Salinga [111]. As anexample the characteristics of the sputtering at total pressures of 0.8 and 6 Pa are shown in fig. 5.5.Samples produced at a total pressure of 6 Pa were shown to have very quick switching kinetics andhence were studied in detail. Using a constant sputter current of 400 mA (6 Pa) and 667 mA (0.8Pa) and fixed substrate to target distance of 78 mm, the oxygen partial pressure, the voltage andthe sputter rate was monitored for oxygen flows of 0 to 50 sccm in both cases. Below, the featuresof the sputtering at 6 Pa is described. The sputtering at 0.8 Pa is very similar. However oxygenflows for the metallic mode, the transition region and the oxidic mode are shifted to slightly highervalues, as it is indicated in figure 5.5.a.
In fig. 5.5.a the different domains of sputtering can be identified. The changes seen in the O2
partial pressure as a function of the O2 flow mirror significant changes in the sputter conditions.In region I at oxygen flows less than 10 sccm, the sputtering is metallic i.e. the oxygen getteringby the walls is predominant. Hence a linear increase of the O2 partial pressure is seen. Domain IIis the transition region. In this region the target surface is increasingly covered by oxygen, and theoxygen gettering by the walls begins to loose its significance. In this region it is evident that thedeposition rate rapidly decreases because of the target coverage.
This trend continues in domain III above 25 sccm, were the target is completely oxidized, andthe oxygen gettering by the walls can be neglected. Hence the gradient linking the O2 partialcurrent to the O2 flow becomes steeper than in domain I. The behavior of the voltage can also beunderstood in terms of the coverage of the target. The oxidized top layer on the target works as aninsulator, and hence increases the target resistance. At a constant sputter current the voltage mustthus increase. Once the target is fully covered at an oxygen flow of 25 sccm, the voltage becomeslargely constant.
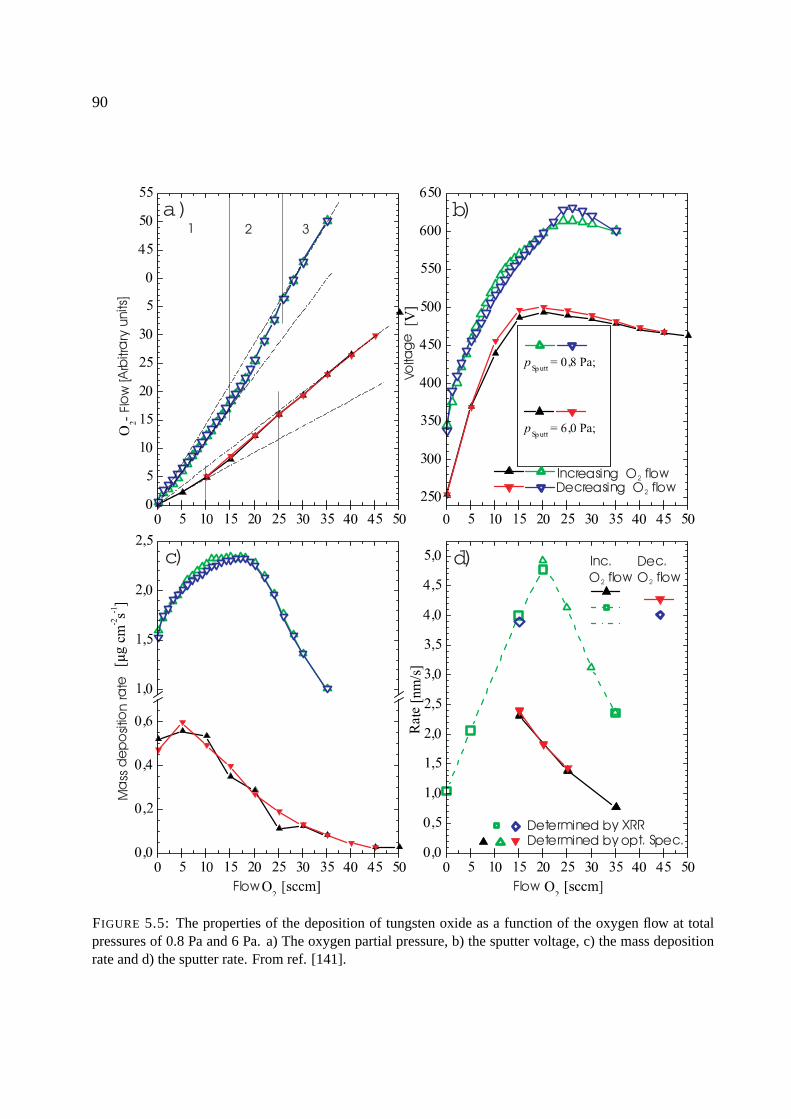
90
a) b)
c) d)
FIGURE 5.5: The properties of the deposition of tungsten oxide as a function of the oxygen flow at totalpressures of 0.8 Pa and 6 Pa. a) The oxygen partial pressure, b) the sputter voltage, c) the mass depositionrate and d) the sputter rate. From ref. [141].
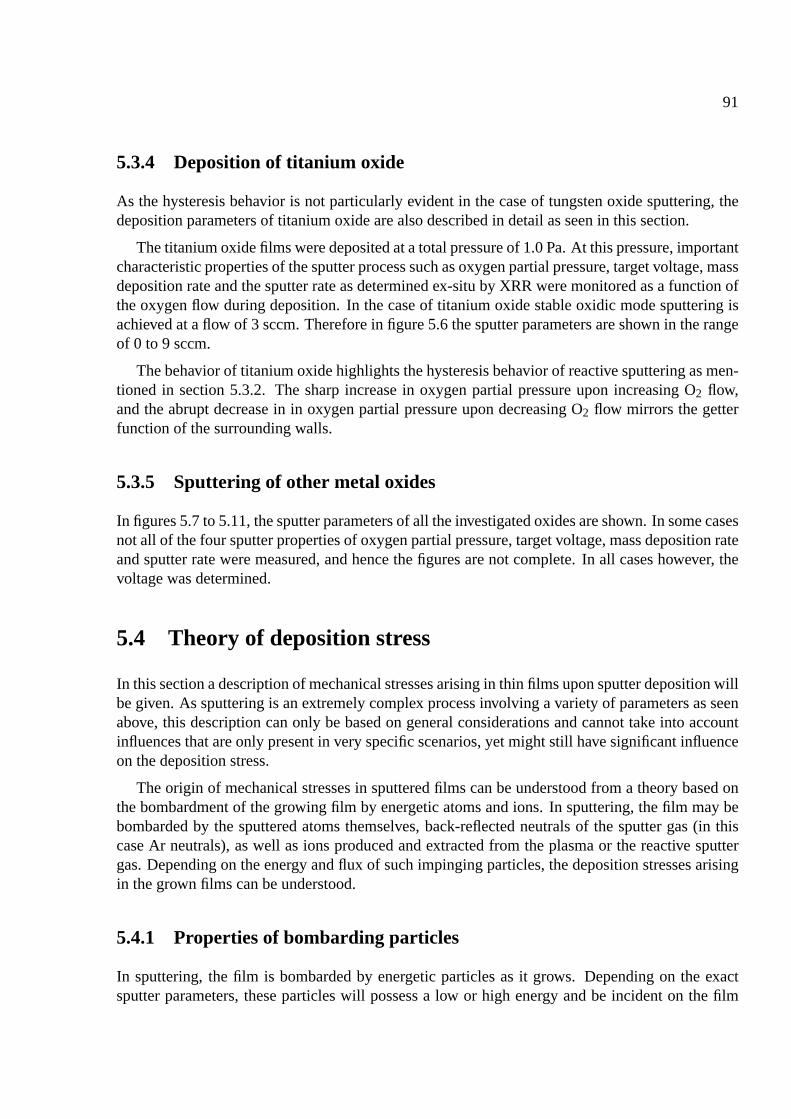
91
5.3.4 Deposition of titanium oxide
As the hysteresis behavior is not particularly evident in the case of tungsten oxide sputtering, thedeposition parameters of titanium oxide are also described in detail as seen in this section.
The titanium oxide films were deposited at a total pressure of 1.0 Pa. At this pressure, importantcharacteristic properties of the sputter process such as oxygen partial pressure, target voltage, massdeposition rate and the sputter rate as determined ex-situ by XRR were monitored as a function ofthe oxygen flow during deposition. In the case of titanium oxide stable oxidic mode sputtering isachieved at a flow of 3 sccm. Therefore in figure 5.6 the sputter parameters are shown in the rangeof 0 to 9 sccm.
The behavior of titanium oxide highlights the hysteresis behavior of reactive sputtering as men-tioned in section 5.3.2. The sharp increase in oxygen partial pressure upon increasing O2 flow,and the abrupt decrease in in oxygen partial pressure upon decreasing O2 flow mirrors the getterfunction of the surrounding walls.
5.3.5 Sputtering of other metal oxides
In figures 5.7 to 5.11, the sputter parameters of all the investigated oxides are shown. In some casesnot all of the four sputter properties of oxygen partial pressure, target voltage, mass deposition rateand sputter rate were measured, and hence the figures are not complete. In all cases however, thevoltage was determined.
5.4 Theory of deposition stress
In this section a description of mechanical stresses arising in thin films upon sputter deposition willbe given. As sputtering is an extremely complex process involving a variety of parameters as seenabove, this description can only be based on general considerations and cannot take into accountinfluences that are only present in very specific scenarios, yet might still have significant influenceon the deposition stress.
The origin of mechanical stresses in sputtered films can be understood from a theory based onthe bombardment of the growing film by energetic atoms and ions. In sputtering, the film may bebombarded by the sputtered atoms themselves, back-reflected neutrals of the sputter gas (in thiscase Ar neutrals), as well as ions produced and extracted from the plasma or the reactive sputtergas. Depending on the energy and flux of such impinging particles, the deposition stresses arisingin the grown films can be understood.
5.4.1 Properties of bombarding particles
In sputtering, the film is bombarded by energetic particles as it grows. Depending on the exactsputter parameters, these particles will possess a low or high energy and be incident on the film
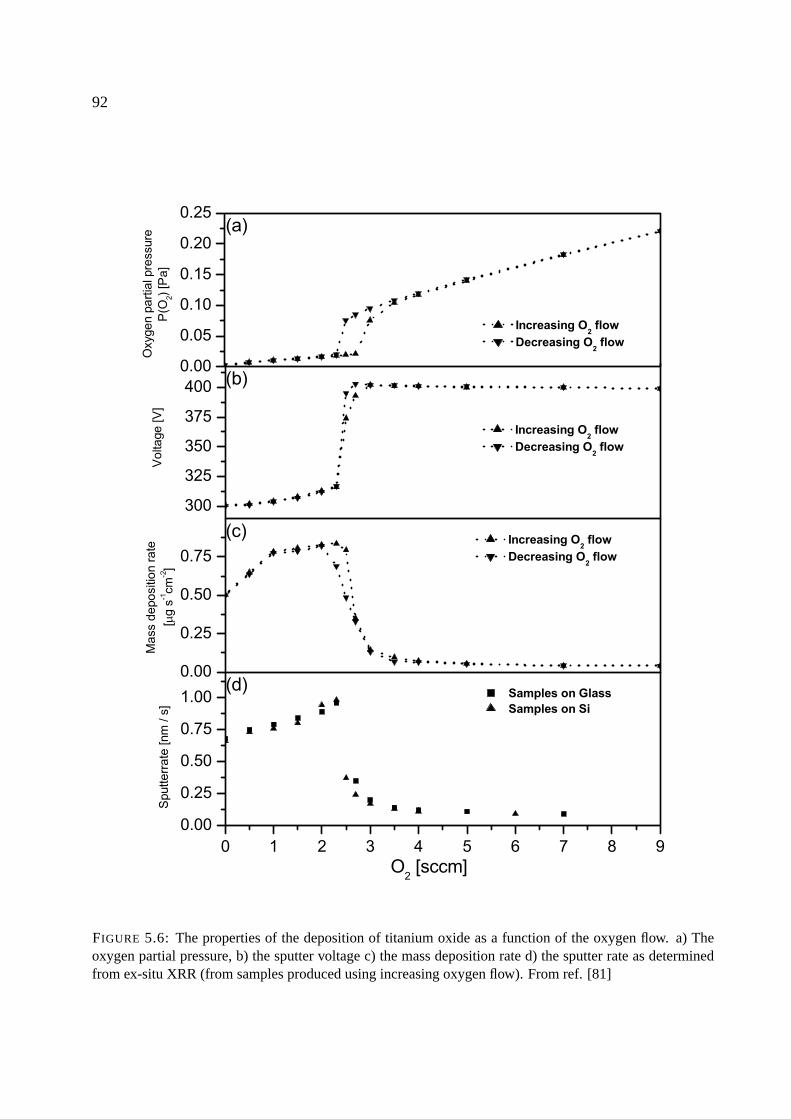
92
FIGURE 5.6: The properties of the deposition of titanium oxide as a function of the oxygen flow. a) Theoxygen partial pressure, b) the sputter voltage c) the mass deposition rate d) the sputter rate as determinedfrom ex-situ XRR (from samples produced using increasing oxygen flow). From ref. [81]
93
FIGURE 5.7: The properties of the deposition of hafnium oxide as a function of the oxygen flow. a) Theoxygen partial pressure, b) the sputter voltage and d) the sputter rate as determined from ex-situ XRR (allsamples produced using increasing oxygen flow).
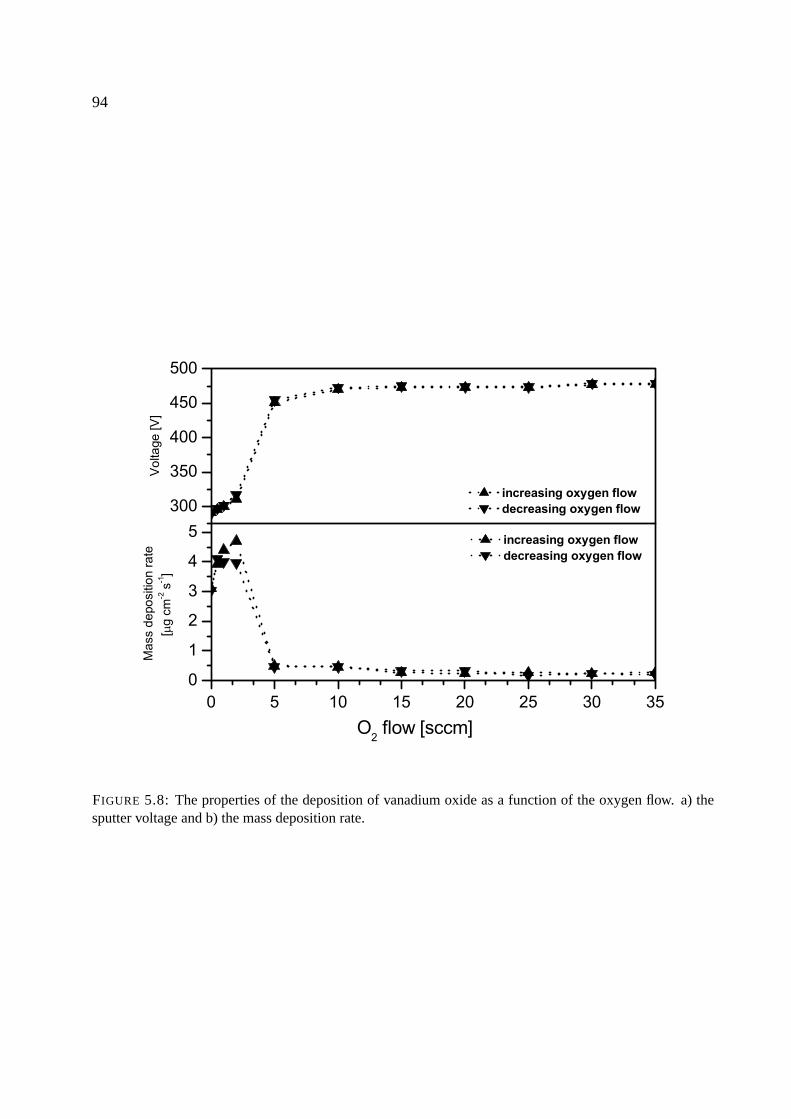
94
FIGURE 5.8: The properties of the deposition of vanadium oxide as a function of the oxygen flow. a) thesputter voltage and b) the mass deposition rate.
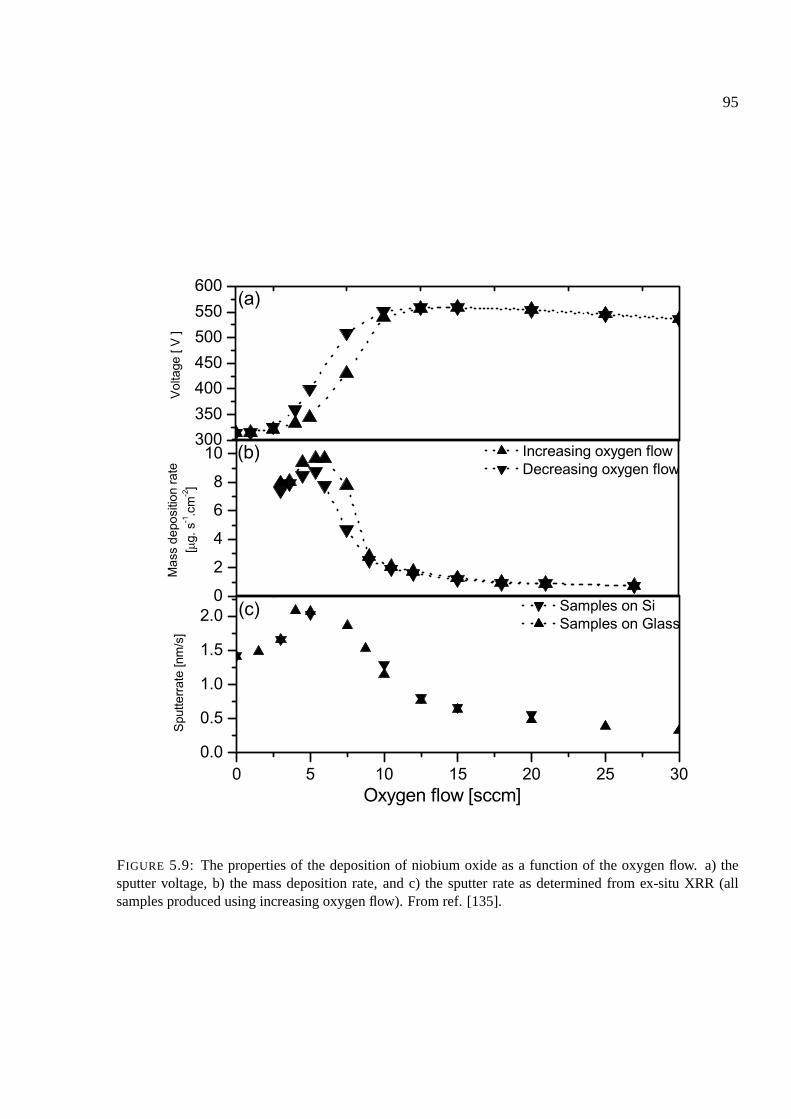
95
FIGURE 5.9: The properties of the deposition of niobium oxide as a function of the oxygen flow. a) thesputter voltage, b) the mass deposition rate, and c) the sputter rate as determined from ex-situ XRR (allsamples produced using increasing oxygen flow). From ref. [135].

96
FIGURE 5.10: The properties of the deposition of tantalum oxide as a function of the oxygen flow. a)the oxygen partial pressure, b) the sputter voltage, c) the mass deposition rate, and d) the sputter rate asdetermined from ex-situ XRR (all samples produced using increasing oxygen flow). From ref. [93].
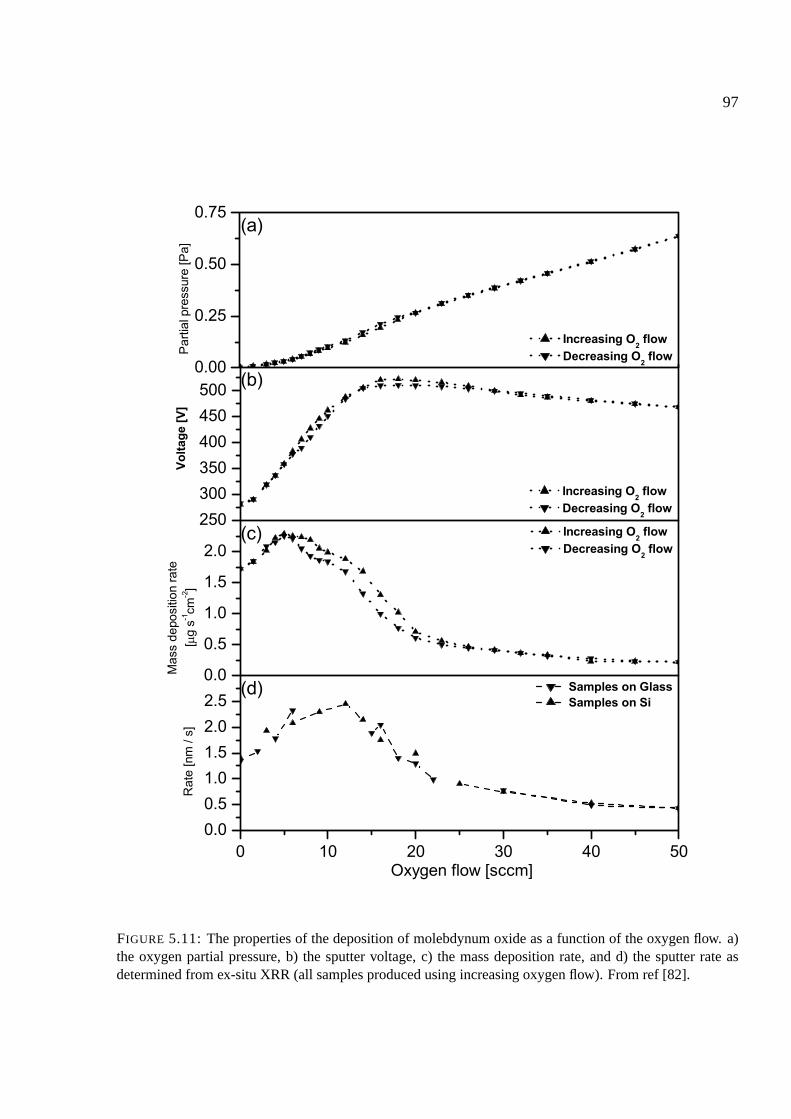
97
FIGURE 5.11: The properties of the deposition of molebdynum oxide as a function of the oxygen flow. a)the oxygen partial pressure, b) the sputter voltage, c) the mass deposition rate, and d) the sputter rate asdetermined from ex-situ XRR (all samples produced using increasing oxygen flow). From ref [82].
98
with a given flux. At the target three types of particles mainly arise: Secondary emitted electrons,sputtered particles and back-reflected Ar neutrals. The fraction of reflected Ar+ is very small i.e.of the order of 10−4 [145]. Hence the influence of such Ar+ ions can mostly be neglected becauseof their low number.
Considering the mass of the particles, it is evident that the Ar neutrals and the sputtered atomshave the biggest impact. Hence the total energy arriving at the substrate can be expressed as [145]:
Etotal =R jεr +Ysεs
α(5.3)
where εr and εs are the average energies of the reflected Ar particles and sputtered atoms re-spectively. α is the sputter efficiency, Ys is the sputter yield, while R j is the particle reflectioncoefficient of the Ar neutrals, which has been shown to follow:
R j ∼(
MT
MAr
)2
(5.4)
where MT is the atomic mass of the target and MAr is the Ar atomic mass.
The average energy of the sputtered particles is rather independent on the mass ratio M=MT /MAr,while the energy reflection coefficient for the argon neutrals can be expressed by:
εr ∼(
MT
MAr
)1/3
(5.5)
The sputter efficiency scales with M−1/2, while the sputter yield has an M−1 dependence. Hencethe total energy incident on the substrate can be expressed as:
Etotal ∼ KRM2 +KSM−1.5 (5.6)
where KR and KS are constants for reflected and sputtered particles, respectively. It can be seen thatfor target masses larger than the Ar mass i.e. M > 1, the contribution from the reflected particlesis dominant, while for light target materials the sputtered atoms contribute the most.
Based on these atom-energies and fluxes, the two borderline cases of tensile and compressivestress can be explained as given below, while a model linking the two cases together is also avail-able (see section 5.4.3).
5.4.2 Tensile stress
When the bombardment of the growing film occurs by ions of low energies i.e. less than a few eVper atom, the deposited film can contain a considerable amount of voids [151]. Other experimentshave associated tensile stress with a growth of columns perpendicular to the substrate [59]. De-pending on the structure of the film, these voids or columns will result in a state of tensile stressin the film. A model relating the structure of the sputtered film to the temperature and the Arpressure (which directly influences the particle energies) is seen in figure 5.12 [125], [78]. Under
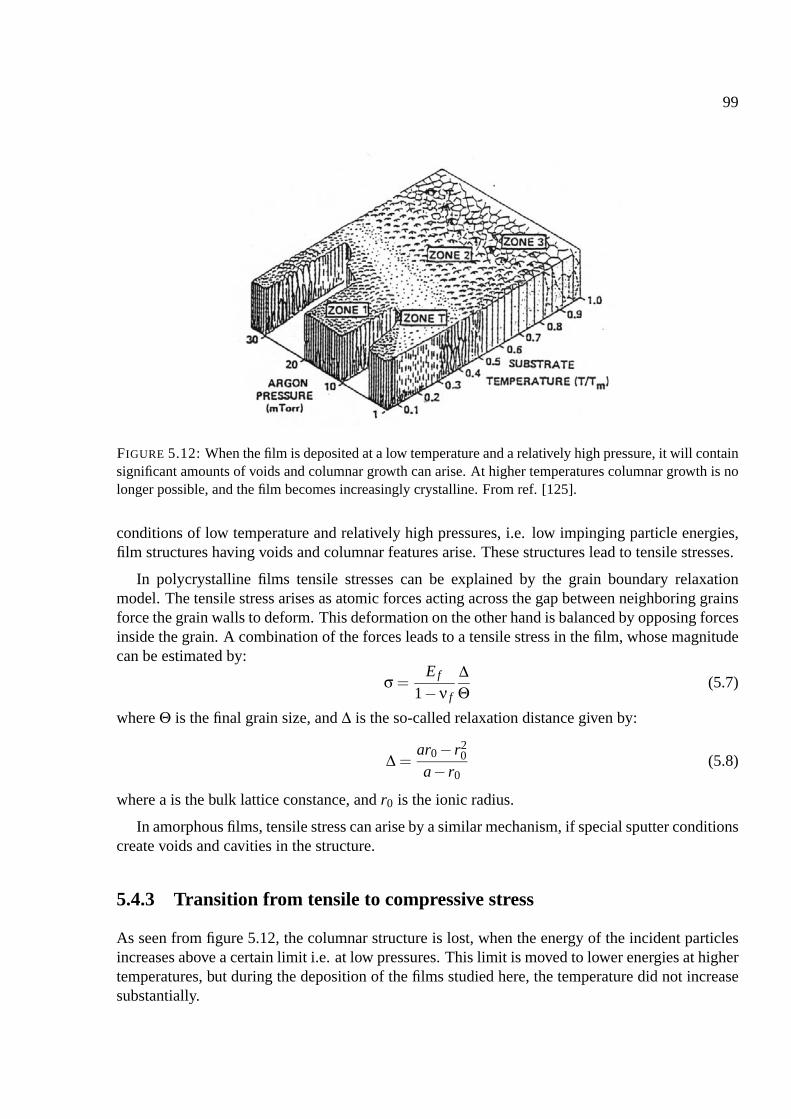
99
FIGURE 5.12: When the film is deposited at a low temperature and a relatively high pressure, it will containsignificant amounts of voids and columnar growth can arise. At higher temperatures columnar growth is nolonger possible, and the film becomes increasingly crystalline. From ref. [125].
conditions of low temperature and relatively high pressures, i.e. low impinging particle energies,film structures having voids and columnar features arise. These structures lead to tensile stresses.
In polycrystalline films tensile stresses can be explained by the grain boundary relaxationmodel. The tensile stress arises as atomic forces acting across the gap between neighboring grainsforce the grain walls to deform. This deformation on the other hand is balanced by opposing forcesinside the grain. A combination of the forces leads to a tensile stress in the film, whose magnitudecan be estimated by:
σ =E f
1−ν f
∆Θ
(5.7)
where Θ is the final grain size, and ∆ is the so-called relaxation distance given by:
∆ =ar0 − r2
0
a− r0(5.8)
where a is the bulk lattice constance, and r0 is the ionic radius.
In amorphous films, tensile stress can arise by a similar mechanism, if special sputter conditionscreate voids and cavities in the structure.
5.4.3 Transition from tensile to compressive stress
As seen from figure 5.12, the columnar structure is lost, when the energy of the incident particlesincreases above a certain limit i.e. at low pressures. This limit is moved to lower energies at highertemperatures, but during the deposition of the films studied here, the temperature did not increasesubstantially.
100
When the impinging ions have energies of tens to hundreds of eV, their collision with the grow-ing film will result in a displacement of atoms into the film i.e. into spaces smaller than the normalvolume per atom. As a result the film will be placed in a state of compressive stress. This tran-sition from tensile to compressive stress has been modelled by the following expression for thedeposition stress [59]:
σ = Yf1d0
(∆shad −ddepl,0
)− 13
Yf fannVjR
(5.9)
where the first term represents the tensile stress, and the second term is the compressive stress. Thetensile stress term is found by comparing the dimensions of the columnar growth features with thespaces between the columns. d0 is the total width of a square column and a neighboring void,while ∆shad and ddepl,0 are widths of the space between columns related to shadowing and surfaceenergy minimization. When no columnar growth is observed, ∆shad and ddepl,0 are zero, and notensile stress is found.
The second term of equation 5.9 corresponds to compressive stress. fan is a constant related toanisotropy effects, nV is a dimensionless parameter that increases with increasing ion energy, andalso depends on point defect properties and the defect density of the material. j is the flux of ionsincident on the growing film, R is the growth rate, while Y f is the biaxial modulus as introducedin section 2.3.
Examination of the term associated with compressive stresses shows, that the compressive stresscontribution increases for increasing ion energies (through nV ), for an increasing ion flux j, and fora decreasing sputter rate R.
Contrary to intuitive considerations, the natural incorporation of an amount of the sputter gasatoms has on the other hand been shown not to have any significant influence on the compressivestress. In fact it has been shown that compressive stress and the amount of gas in the film areindependent of each other as found by Thornton et al. [124]. The entrapment of argon in thegrowing film is hence a concurrent process, but it is not origin of the compressive stresses.
5.4.4 Compressive stress
A successful description of the origin of compressive mechanical stress in sputtered films has beenput forward by C.A. Davis [19]. This model explains the magnitude and origin of the compressivestress by a balance between stress induced by so-called ”knock-on implantation” of film atoms,and stress relieved by ”thermal spike migration”.
Build up of stress - knock-on implantation
Compressive stress is assumed to originate from atoms that are implanted below the surface of thefilm by an incident particle, in a process labelled ”knock-on implantation”. The displacement ofan atom into a position below the surface of the film only occurs, when the impinging ion has anenergy above a certain threshold Ekoi, which depends on the nature of the film. Using the theory of
101
knock-on cascades, the rate of atoms per area ∂ni/∂t that are moved to sites below the film surfaceis given by [145]:
∂ni
∂t∼ jE1/2 (5.10)
where j and E is the flux and energy respectively of the incident particles.
As the volume occupied by the displaced atoms is smaller than the normal atomic volume, thefilm is placed in a strained state by the knock-on implantation. Associated with this strain is acompressive stress as given by Hooke’s law (eq. 2.3).
Relaxation of stress - Thermal spikes
When the film is placed in a strained state by the implantation of atoms, it is energetically favorableto move the implanted atoms to its surface. To do so, an implanted atom must acquire a certainthreshold energy Eis to overcome the energy from the surrounding atoms, that confine it in itsposition, and be close to the surface. As some atoms are trapped deep in the film, not all atoms thatacquire sufficient energy will move to the surface of the film, an aspect that should be consideredwhen estimating the magnitude of Eis. The required energy can be received from the bombardingenergetic particles. When these hit the surface of the film, their energy is transferred to the atomssurrounding the site of impact. This produces a local heating, which is referred to as a thermalspike (or a displacement spike in the case of higher particle energies) [84]. For energies less than1 keV only one thermal spike occurs per particle impact. This means that the energy Q, which isdistributed in the process can be approximated by the kinetic energy of the impinging particle. Thisenergy is distributed to the atoms in the volume of the thermal spike and allows them to diffuse.
The number of atoms per area that receive sufficient energy to overcome Eis during a singlethermal spike, when the energy is distributed at the impact site can be expressed by [117]:
nis = 0.016ρ(
QEis
)5/3
(5.11)
where ρ is a material constant of the order of 1, which expresses the ratio of the diffusion coeffi-cients of atoms in the film to the diffusion coefficient of the heat [117].
The rate at which atoms are moved to the surface can hence be seen as a relaxation rate. It isproportional to nis, the fraction of the density of displaced atoms n to the density of the material N,and to the flux of impinging particles j:
∂nR
∂t= nis j
nN
= 0.016ρ jnN
(EEis
)5/3
(5.12)
where the energy Q distributed in the thermal spike was approximated by the kinetic energy E ofthe ions.
102
Equilibrium theory
The assumption on which Davis’ theory is based is that the density of implanted atoms, n, isconstant with time. As the film is growing, the net rate per area at which displaced atoms are buildinto the film is then given by:
dni,net
dt= R
nN
(5.13)
where R is the total rate at which addition of atoms to the film takes place.
Additionally the net implantation rate can be regarded as the balance of the rates of implantationni, and relaxation, nR:
dni,net
dt=
dni
dt− dnR
dt(5.14)
The fraction of implanted atoms can now be found by combining equations (5.10), (5.12), (5.13)and (5.14):
nN
=E1/2
Rj +0.016ρ
(E
Eis
)5/3(5.15)
By assuming that the strain of the film is proportional to the fraction of displaced atoms n/N, thestress can be computed [146]. By use of Hooke’s law (eq. 2.3) the following expression for thecompressive stress in the film can be found:
σ(E) = YfE1/2
Rj +0.016ρ
(E
Eis
)5/3(5.16)
= YfE1/2
Rj + kE5/3
(5.17)
where k = 0.016ρE5/3is
In the general case, the incident particles have energies spanning a range of energies. Hence anintegration over all energies above Eis must be carried out:
σ =∫ E
Eis
σ(E) f (E)dE (5.18)
where f(E)dE is the number of incident particles with energies in the interval E+dE.
The contents of equation 5.17 can be intuitively understood, if one plots the stress as a functionof the kinetic energy of the incident particles for different values of R/j (figure 5.13). It can beseen that the compressive stress in all cases initially increases as the ion energy increases. For evenhigher values of E, the compressive stress slowly decreases (Region II). However, the magnitudeof the maximum compressive stress is highly dependent on R/j (Region I). The largest compressivestress is found for low values of R/j, while the lower values of compressive stress at these energiesare found for high values of R/j.
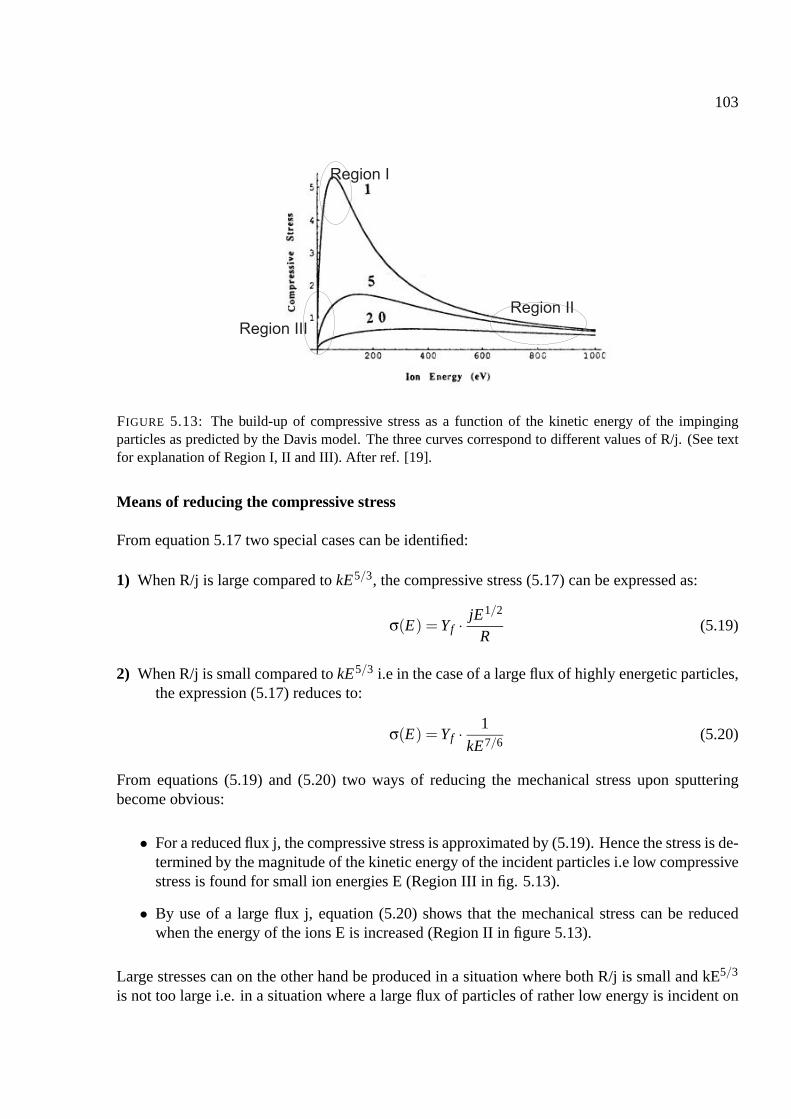
103
FIGURE 5.13: The build-up of compressive stress as a function of the kinetic energy of the impingingparticles as predicted by the Davis model. The three curves correspond to different values of R/j. (See textfor explanation of Region I, II and III). After ref. [19].
Means of reducing the compressive stress
From equation 5.17 two special cases can be identified:
1) When R/j is large compared to kE5/3, the compressive stress (5.17) can be expressed as:
σ(E) = Yf · jE1/2
R(5.19)
2) When R/j is small compared to kE5/3 i.e in the case of a large flux of highly energetic particles,the expression (5.17) reduces to:
σ(E) = Yf · 1
kE7/6(5.20)
From equations (5.19) and (5.20) two ways of reducing the mechanical stress upon sputteringbecome obvious:
• For a reduced flux j, the compressive stress is approximated by (5.19). Hence the stress is de-termined by the magnitude of the kinetic energy of the incident particles i.e low compressivestress is found for small ion energies E (Region III in fig. 5.13).
• By use of a large flux j, equation (5.20) shows that the mechanical stress can be reducedwhen the energy of the ions E is increased (Region II in figure 5.13).
Large stresses can on the other hand be produced in a situation where both R/j is small and kE5/3
is not too large i.e. in a situation where a large flux of particles of rather low energy is incident on
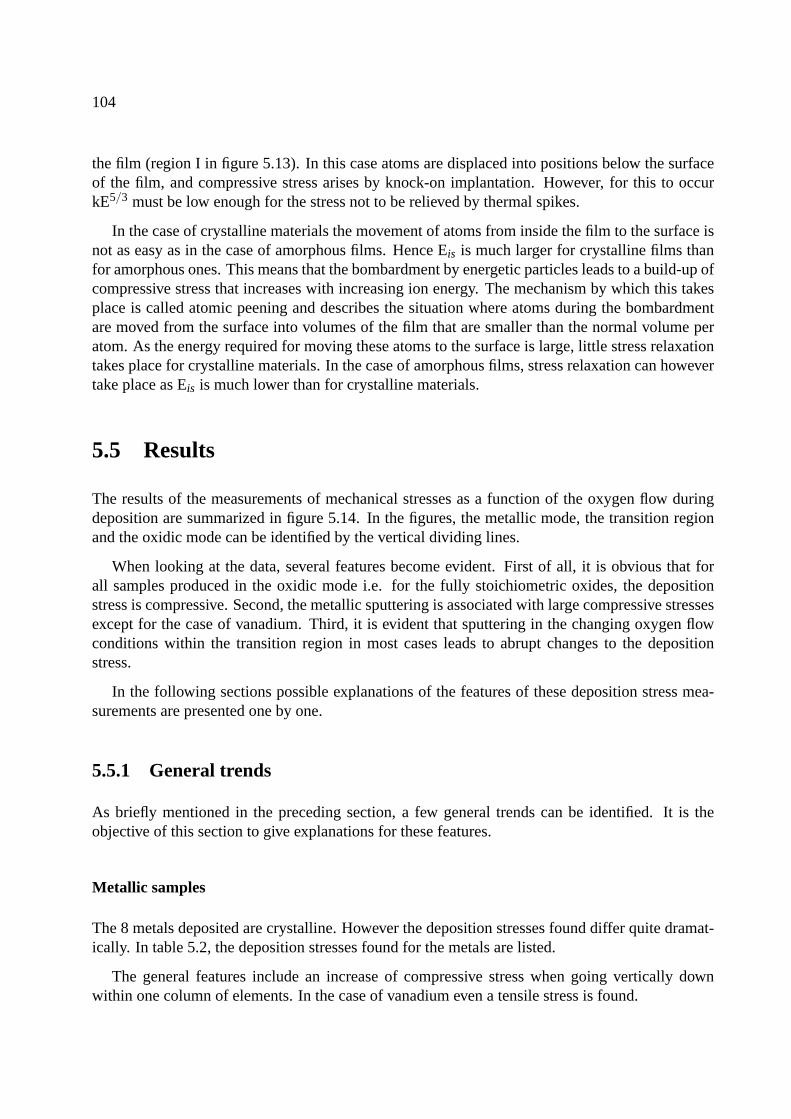
104
the film (region I in figure 5.13). In this case atoms are displaced into positions below the surfaceof the film, and compressive stress arises by knock-on implantation. However, for this to occurkE5/3 must be low enough for the stress not to be relieved by thermal spikes.
In the case of crystalline materials the movement of atoms from inside the film to the surface isnot as easy as in the case of amorphous films. Hence Eis is much larger for crystalline films thanfor amorphous ones. This means that the bombardment by energetic particles leads to a build-up ofcompressive stress that increases with increasing ion energy. The mechanism by which this takesplace is called atomic peening and describes the situation where atoms during the bombardmentare moved from the surface into volumes of the film that are smaller than the normal volume peratom. As the energy required for moving these atoms to the surface is large, little stress relaxationtakes place for crystalline materials. In the case of amorphous films, stress relaxation can howevertake place as Eis is much lower than for crystalline materials.
5.5 Results
The results of the measurements of mechanical stresses as a function of the oxygen flow duringdeposition are summarized in figure 5.14. In the figures, the metallic mode, the transition regionand the oxidic mode can be identified by the vertical dividing lines.
When looking at the data, several features become evident. First of all, it is obvious that forall samples produced in the oxidic mode i.e. for the fully stoichiometric oxides, the depositionstress is compressive. Second, the metallic sputtering is associated with large compressive stressesexcept for the case of vanadium. Third, it is evident that sputtering in the changing oxygen flowconditions within the transition region in most cases leads to abrupt changes to the depositionstress.
In the following sections possible explanations of the features of these deposition stress mea-surements are presented one by one.
5.5.1 General trends
As briefly mentioned in the preceding section, a few general trends can be identified. It is theobjective of this section to give explanations for these features.
Metallic samples
The 8 metals deposited are crystalline. However the deposition stresses found differ quite dramat-ically. In table 5.2, the deposition stresses found for the metals are listed.
The general features include an increase of compressive stress when going vertically downwithin one column of elements. In the case of vanadium even a tensile stress is found.

105
FIGURE 5.14: Deposition stresses in transition metal oxides as a function of oxygen flow. Top: TiOx, VOx.Middle: ZrOx, NbOx Bottom: HfOx, TaOx.
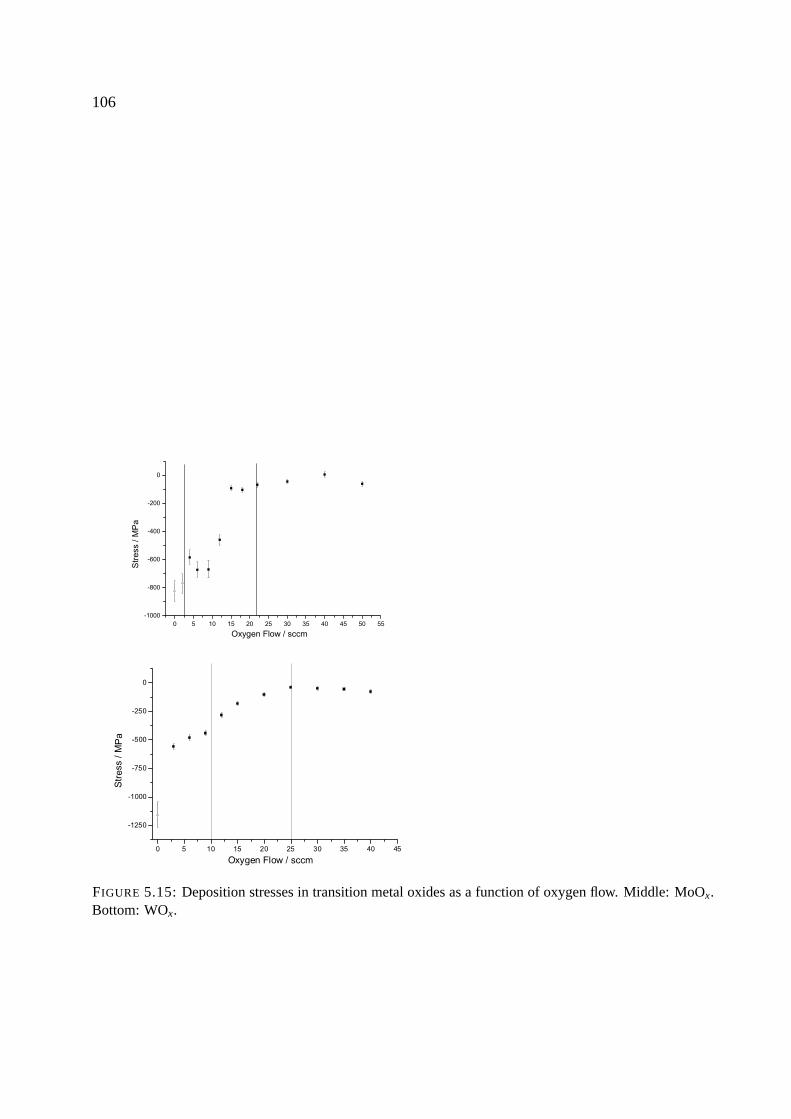
106
FIGURE 5.15: Deposition stresses in transition metal oxides as a function of oxygen flow. Middle: MoOx.Bottom: WOx.

107
Ti V Cr-250 MPa 1200 MPa −
Zr Nb Mo-1000 MPa -800 MPa -850 MPa
Hf Ta W-2000 MPa -2200 MPa -1200 MPa
TABLE 5.2: Deposition stresses for the transition metals.
TiO2 V2O5 Cr-200 MPa -10 MPa -
ZrO2 Nb2O5 MoO3
-1500 MPa -200 MPa -75 MPaHfO2 Ta2O5 WO3
-1000 MPa -300 MPa -100 MPa
TABLE 5.3: Deposition stresses for the stoichiometric oxides.
An explanation for this general trend can be found in the energy balance of the sputter process.Accelerated argon ions hit the target surface and transfer parts of their energy to metal particlesthat are detached from the target and directed onto the substrate (or the walls of the chamber). Theenergy transferred to a metal atom depends directly on its atomic mass. More important though,the energy of the reflected Ar neutrals as well as their flux is described by the equations (5.4)and (5.5). This means that the argon ions are recoiled away from the target and hit the growingfilm. As they possess a higher energy when reflected by heavier target materials, their impact isthe biggest in the case of heavy target materials. When these energetic argon neutrals bombardthe growing film, they move film atoms from the surface into non-lattice sites (like an interstitialsite) in the film. The concentration of atoms in non-lattice point positions leads to the build-upof compressive stress by atomic peening as described in section 5.4.4. As the energy of the Arneutrals is the highest for the heavy target masses, the highest stresses are also found for theseelements as seen from table 5.2.
The process of atomic peening is associated with the incorporation of argon atoms themselves,but as mentioned in section 5.4.3, this incorporation does not lead to compressive stress build-up.
Fully stoichiometric oxides
The oxides produced in oxidic mode sputtering i.e. TiO2, ZrO2, HfO2, V2O5, Nb2O5, Ta2O5,MoO3 and WO3 all possess compressive stresses upon deposition. In table 5.3, these depositionstresses are summarized.
A general trend is difficult to identify in these results. However, for ZrO2 and HfO2 the com-pressive stresses are far larger than the those found for the remaining oxides.
The Davis model states that high compressive stresses arise in situations where a low flux ofenergetic ions is incident on the film during deposition. It also states that low compressive stresses
108
are expected in situations where a large flux of particles of relatively low energy bombard the film.
Hence, a search for an explanation for the high stresses found in ZrO2 and HfO2 and the lowstresses found in the other oxides begins with a comparison of their properties. In the contextof varying the number of incident particles, the difference between the ionization potential ofthe metals and the oxygen electron affinity, MIP-EAO, can be regarded as a an energy barrierfor ionization of metal and oxygen. In table 5.4, values for MIP-EAO are listed. It can be seenthat MIP-EAO is lowest for ZrO2 and HfO2. Furthermore, when comparing the voltage for oxidesputtering VO in the oxidic mode, it is evident that the voltages for these two oxides are also lowerthan for the other oxides.
This means that the energy of the produced oxygen ions is different among the oxides, as thevoltage VO will accelerate negative oxygen ions onto the substrate.
Based on these informations, the following statements based on the Davis model can be made:
• The large stresses found in the case of ZrO2 and HfO2 can be explained by the fact thatthe sputter voltage is the lowest in these two cases. This means that the ions, which alsoare created more easily for these two materials, possess the lowest energy when they ariveat the film surface. Hence a situation is found, where both of the terms R/j and kE5/3 arerelatively small. In this case a large flux of particles of relatively low energy is incident on thefilm. This corresponds to region I in the Davis model (figure 5.13) where large compressivestresses are produced.
• In the case of TiO2, V2O5, Nb2O5, Ta2O5, MoO3 and WO3 high voltages are observedduring sputtering. For these materials MIP-EAO is larger than for ZrO2 and HfO2. Thisindicates that for the former oxides, ions are not as easily created as in the case of ZrO2 andHfO2. Hence a situation is found, where fewer ions are accelerated by a larger potential i.eR/j is large and the kinetic energy of the ions is also large. By comparison with eq. 5.17, itis evident, that this situation also corresponds to region III in the Davis model (figure 5.13),where low compressive stresses are found.
5.5.2 Behavior of NbOx, TaOx, MoOx and WOx
Looking at the dependence of the mechanical stress as a function of oxygen flow for the oxidesputtering of NbOx, TaOx, MoOx and WOx reveals a common characteristic behavior: With in-creasing O2 flow, the compressive stress is gradually reduced across the transition region until analmost constant value is achieved in the oxidic mode. The arguments used in the preceding sectioncan be applied again in these cases.
Characteristic for these four materials is a large increase of the sputter voltage ∆V/VM whengoing from metallic (VM) to oxidic mode (Table 5.4). This means, that the ions present duringsputtering are accelerated by a growing potential as the oxygen flow is increased. Hence the con-ditions of sputtering are dramatically changed. The metallic mode can be identified as a situation,
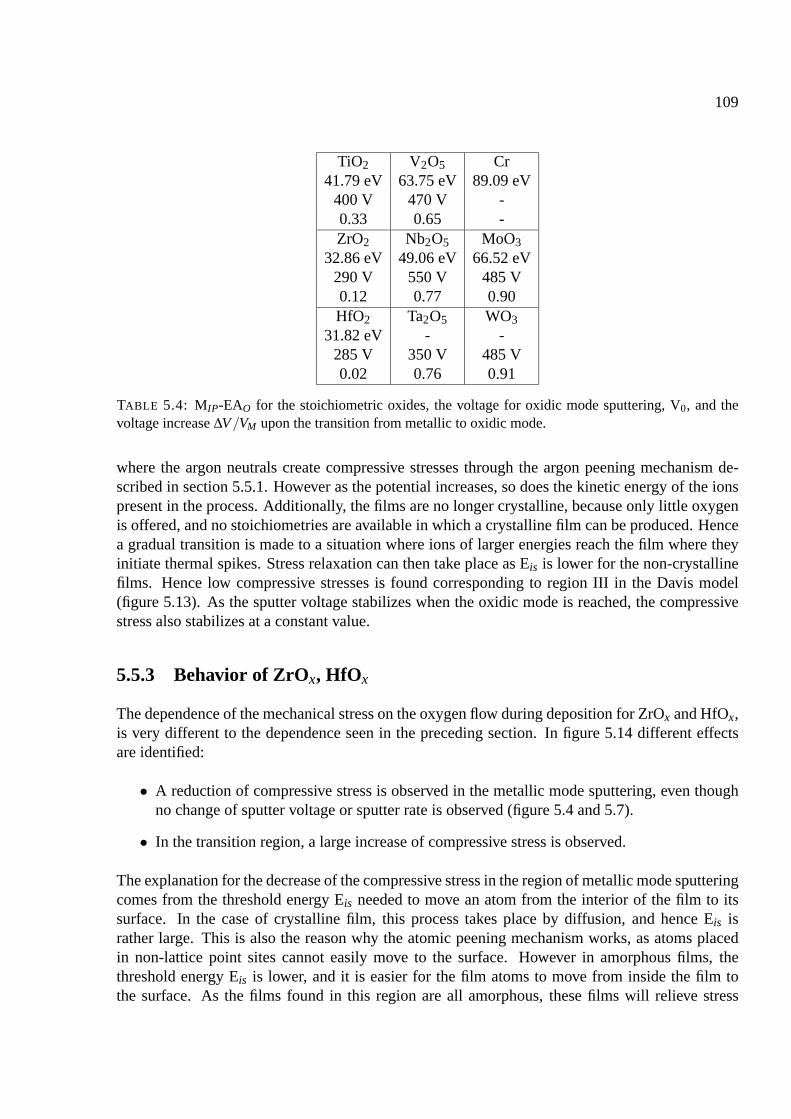
109
TiO2 V2O5 Cr41.79 eV 63.75 eV 89.09 eV
400 V 470 V -0.33 0.65 -ZrO2 Nb2O5 MoO3
32.86 eV 49.06 eV 66.52 eV290 V 550 V 485 V0.12 0.77 0.90HfO2 Ta2O5 WO3
31.82 eV - -285 V 350 V 485 V0.02 0.76 0.91
TABLE 5.4: MIP-EAO for the stoichiometric oxides, the voltage for oxidic mode sputtering, V0, and thevoltage increase ∆V/VM upon the transition from metallic to oxidic mode.
where the argon neutrals create compressive stresses through the argon peening mechanism de-scribed in section 5.5.1. However as the potential increases, so does the kinetic energy of the ionspresent in the process. Additionally, the films are no longer crystalline, because only little oxygenis offered, and no stoichiometries are available in which a crystalline film can be produced. Hencea gradual transition is made to a situation where ions of larger energies reach the film where theyinitiate thermal spikes. Stress relaxation can then take place as Eis is lower for the non-crystallinefilms. Hence low compressive stresses is found corresponding to region III in the Davis model(figure 5.13). As the sputter voltage stabilizes when the oxidic mode is reached, the compressivestress also stabilizes at a constant value.
5.5.3 Behavior of ZrOx, HfOx
The dependence of the mechanical stress on the oxygen flow during deposition for ZrOx and HfOx,is very different to the dependence seen in the preceding section. In figure 5.14 different effectsare identified:
• A reduction of compressive stress is observed in the metallic mode sputtering, even thoughno change of sputter voltage or sputter rate is observed (figure 5.4 and 5.7).
• In the transition region, a large increase of compressive stress is observed.
The explanation for the decrease of the compressive stress in the region of metallic mode sputteringcomes from the threshold energy Eis needed to move an atom from the interior of the film to itssurface. In the case of crystalline film, this process takes place by diffusion, and hence Eis israther large. This is also the reason why the atomic peening mechanism works, as atoms placedin non-lattice point sites cannot easily move to the surface. However in amorphous films, thethreshold energy Eis is lower, and it is easier for the film atoms to move from inside the film tothe surface. As the films found in this region are all amorphous, these films will relieve stress
110
upon ion bombardment, while the pure metals will not. The slow reduction of compressive stressis observed with increasing oxygen flow as a result of the increasing loss of long range order inthe film structure. This leads to a decrease of Eis and hence to a slow reduction of the compressivestress.
In the transition region, a large rather sudden increase of compressive stress is observed. Itsexplanation lies in the oxidation of the target occurring in this mode. This oxidation increases thenumber of oxygen ions present. Hence the flux j of ions incident on the growing film increases,and R/j decreases. This means that the compressive stress increases as seen in region I in the Davismodel (figure 5.13).
5.5.4 Behavior of TiOx, VOx
The mechanical stresses found in the sputtering of titanium oxide and vanadium oxide differ fromthe stresses found for all other investigated materials. When produced in the metallic mode and inthe transition region these materials can possess tensile stresses.
Different models for the build up of tensile stresses have been suggested as mentioned in section5.4.2. However all are based on the presence of voids in the structure of the film. Hence it may besuggested that the structures found in the metallic and transition region for TiOx and VOx containconsiderable amounts of voids, giving rise to the observed tensile stresses.
The change from tensile to compressive stresses within the transition region, can however beattributed to the increase in sputter voltage (figure 5.6) associated with this region. That thischange of voltage leads to changes to the stress can be explained: In their modelling of the tensileto compressive stress transition, Knuyt et al. suggested that the total stress in the film could bedescribed by equation 5.9.
This means that in the case of TiOx and VOx, the increase of the sputter voltage that it seenin the transition region will be associated with an increase of nV , which will ultimately lead to anincrease of the compressive stress term. Additionally, the oxidation of the target will lead to anincrease of oxygen ions, i.e to an increase of the ion flux j. This will according to the model alsolead to an increase of the compressive stress term. To complete the picture, the deposition rate Ralso decreases in the transition region (figures 5.6 and 5.8). From (5.9) it can be seen that this willalso serve to increase the compressive stress term. That a transition from tensile to compressivestress is observed in the transition region can hence be explained.
5.5.5 Structure formation
During the study of the transition metal oxides and their deposition, it was discovered that a numberof films were crystalline. In figures (5.14) and (5.15), these crystalline film are marked with anopen up-triangle label, while the amorphous film carry a filled square label. As can be seen, themetallic films are crystalline. Apart from this, only a few films have been found to be crystalline.In titanium oxide a crystalline film of stoichiometry (TiO1.2)0.787 is found at an O2 flow of 2 sccm.
111
For HfOx crystalline films is found at oxygen flows above 1.5 sccm. Similarly crystalline samplesare found for ZrOx at flows larger than 2.6 sccm.
The formation of crystalline stoichiometric oxides in oxidic mode sputtering can also be cor-related with the ionization barrier MIP-EAO. In a model proposed by Ngaruiya et al. [92], it wassuggested that crystalline stoichiometric transition metal oxide films were produced for low valuesof MIP-EAO. Comparing with table 5.4, the lowest values are found for for ZrO2, HfO2 and TiO2.The explanation given is that the low barriers for ionization result in a situation where a high fluxof oxygen ions - presumably O− - is sputtered from the target and is incident on the growing film.Additionally, the potential that accelerates these ions is lower in the case of ZrO2, HfO2 (and partlyTiO2). That the potential does not increase as much for these oxides as for the other ones means,that for these oxides the emission of secondary electrons is not reduced as much as for the remain-ing transition metal oxides. As a result, the fewer oxygen ions that are incident on the growingfilm for these oxides only possess moderate energies compared the other oxides.
This combination of many ions having an energy lower than a certain threshold energy forrequired for the formation of amorphous films leads to crystalline films in the case of ZrO2, HfO2
and for some cases of TiO2 sputtering.
In contrast, in the case of the other transition metal oxides, the high energy barrier for ionizationmeans that less oxygen ions are produced. Additionally, the coefficient of secondary electronemission is lower for these oxides, resulting in a large increase of the accelerating potential whengoing from the metallic mode to the oxidic mode. This in turn means that the fewer oxygen ionsare accelerated by a higher potential.. Hence their energy upon arrival at the growing film is toohigh for the formation of a crystalline film. Instead an amorphous film is the result.
5.6 Summary
As described in section 5.1, transition metal oxide films have many interesting applications. How-ever, it is crucial to control the mechanical stresses in the films, as high stresses could lead tofailure, cracking or delamination of the films. In this study, the stresses of the group of transitionmetal oxides consisting of TiO2, ZrO2, HfO2, V2O5, Nb2O5, Ta2O5, CrO3, MoO3 and WO3 werestudied with the omission of CrO3 which is hazardous. The reactive sputtering applied offereda way to study the change of stress in the single oxides when changing from metallic mode tooxidic mode sputtering. Additionally, the closely related materials allow a comparative study ofdeposition stresses of the oxides.
It was found that the stress correlates with the structure of the films. For crystalline films highstresses were found as seen for ZrO2 and HfO2. For amorphous films lower stresses were found.The structural formation was related to the number and energy of the ions incident on the film,while the magnitudes of the stresses were related to Eis i.e the energy required for an atom tomove from inside the film to the surface. This energy is large for crystalline films and lower foramorphous ones. The gradual transition from crystalline to amorphous and the related gradualreduction of compressive stress was monitored in the metallic mode of ZrOx and HfOx sputtering.
112
The transition from tensile to compressive stress as seen for TiOx and VOx was also predictedby application of the model of Knuyt et al. in combination with the sputter parameters for thesematerials (section 5.4.3).
Finally, the evolution of the deposition stress beginning at a metal and ending at its oxide,induced by increasing the oxygen flow during deposition was explained in detail. The number ofoxygen ions formed in the transition region and their energies, which are largely determined bythe sputter voltage, were found to allow an explanation for the gradual changes observed for thedeposition stress.
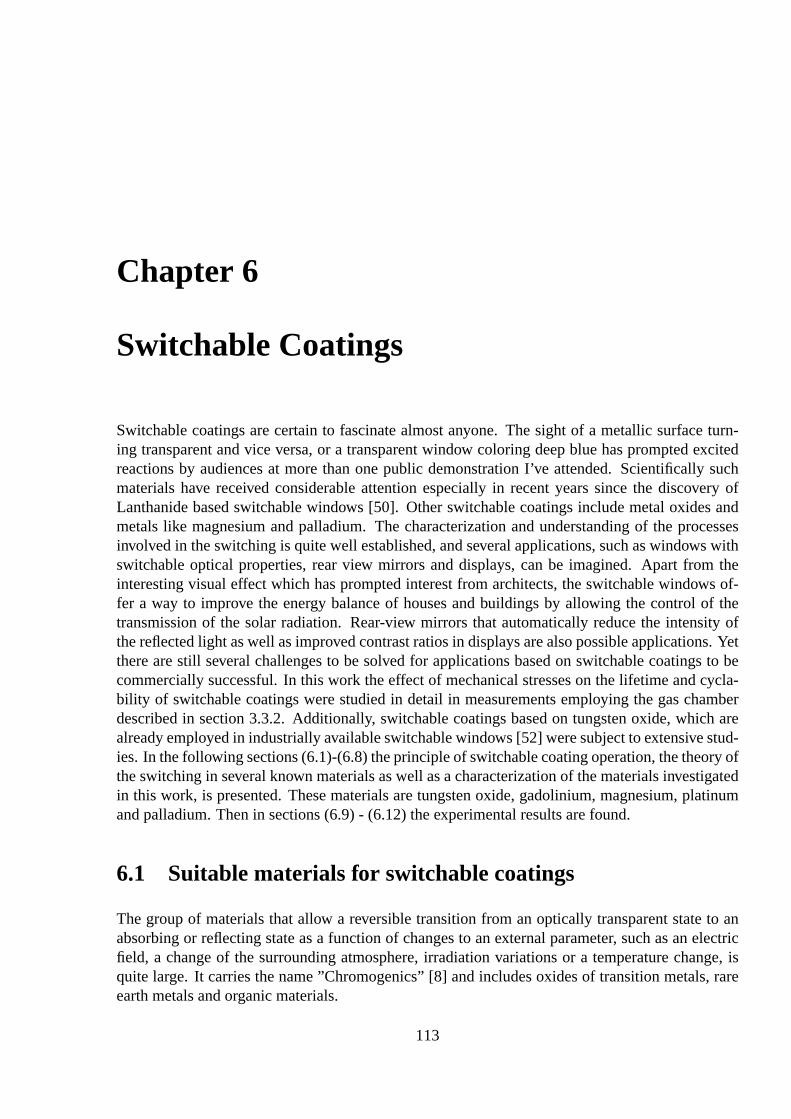
Chapter 6
Switchable Coatings
Switchable coatings are certain to fascinate almost anyone. The sight of a metallic surface turn-ing transparent and vice versa, or a transparent window coloring deep blue has prompted excitedreactions by audiences at more than one public demonstration I’ve attended. Scientifically suchmaterials have received considerable attention especially in recent years since the discovery ofLanthanide based switchable windows [50]. Other switchable coatings include metal oxides andmetals like magnesium and palladium. The characterization and understanding of the processesinvolved in the switching is quite well established, and several applications, such as windows withswitchable optical properties, rear view mirrors and displays, can be imagined. Apart from theinteresting visual effect which has prompted interest from architects, the switchable windows of-fer a way to improve the energy balance of houses and buildings by allowing the control of thetransmission of the solar radiation. Rear-view mirrors that automatically reduce the intensity ofthe reflected light as well as improved contrast ratios in displays are also possible applications. Yetthere are still several challenges to be solved for applications based on switchable coatings to becommercially successful. In this work the effect of mechanical stresses on the lifetime and cycla-bility of switchable coatings were studied in detail in measurements employing the gas chamberdescribed in section 3.3.2. Additionally, switchable coatings based on tungsten oxide, which arealready employed in industrially available switchable windows [52] were subject to extensive stud-ies. In the following sections (6.1)-(6.8) the principle of switchable coating operation, the theory ofthe switching in several known materials as well as a characterization of the materials investigatedin this work, is presented. These materials are tungsten oxide, gadolinium, magnesium, platinumand palladium. Then in sections (6.9) - (6.12) the experimental results are found.
6.1 Suitable materials for switchable coatings
The group of materials that allow a reversible transition from an optically transparent state to anabsorbing or reflecting state as a function of changes to an external parameter, such as an electricfield, a change of the surrounding atmosphere, irradiation variations or a temperature change, isquite large. It carries the name ”Chromogenics” [8] and includes oxides of transition metals, rareearth metals and organic materials.
113
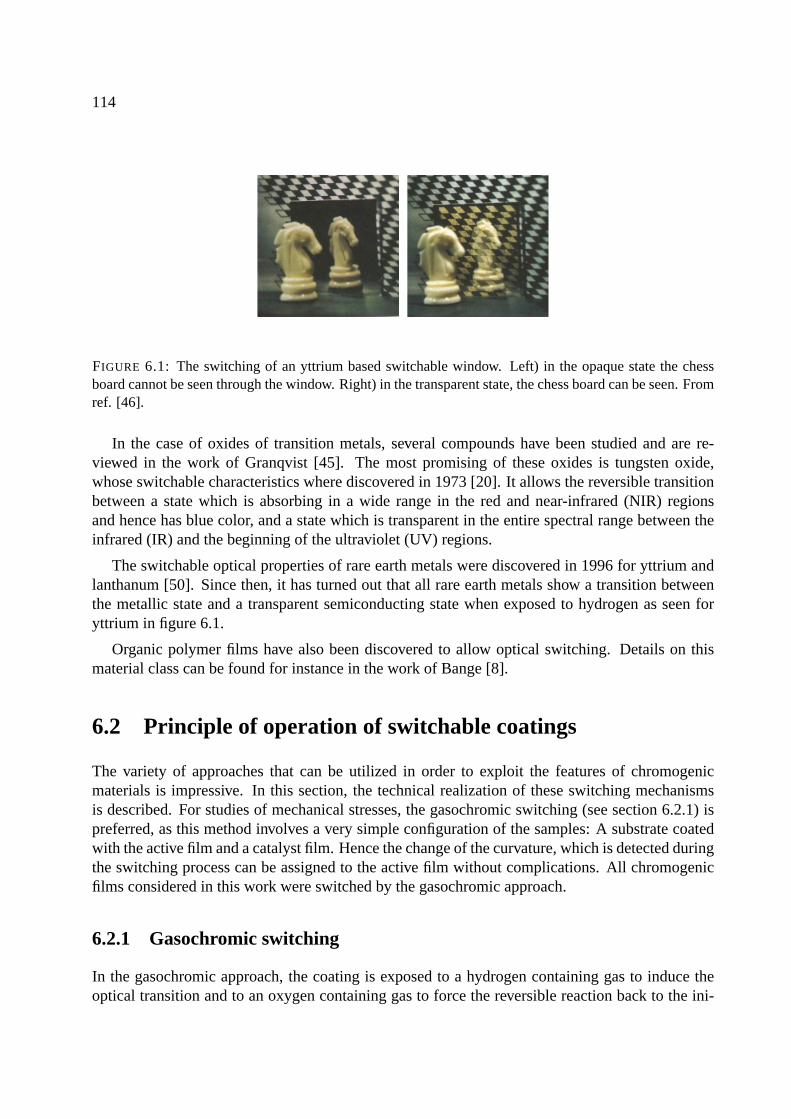
114
FIGURE 6.1: The switching of an yttrium based switchable window. Left) in the opaque state the chessboard cannot be seen through the window. Right) in the transparent state, the chess board can be seen. Fromref. [46].
In the case of oxides of transition metals, several compounds have been studied and are re-viewed in the work of Granqvist [45]. The most promising of these oxides is tungsten oxide,whose switchable characteristics where discovered in 1973 [20]. It allows the reversible transitionbetween a state which is absorbing in a wide range in the red and near-infrared (NIR) regionsand hence has blue color, and a state which is transparent in the entire spectral range between theinfrared (IR) and the beginning of the ultraviolet (UV) regions.
The switchable optical properties of rare earth metals were discovered in 1996 for yttrium andlanthanum [50]. Since then, it has turned out that all rare earth metals show a transition betweenthe metallic state and a transparent semiconducting state when exposed to hydrogen as seen foryttrium in figure 6.1.
Organic polymer films have also been discovered to allow optical switching. Details on thismaterial class can be found for instance in the work of Bange [8].
6.2 Principle of operation of switchable coatings
The variety of approaches that can be utilized in order to exploit the features of chromogenicmaterials is impressive. In this section, the technical realization of these switching mechanismsis described. For studies of mechanical stresses, the gasochromic switching (see section 6.2.1) ispreferred, as this method involves a very simple configuration of the samples: A substrate coatedwith the active film and a catalyst film. Hence the change of the curvature, which is detected duringthe switching process can be assigned to the active film without complications. All chromogenicfilms considered in this work were switched by the gasochromic approach.
6.2.1 Gasochromic switching
In the gasochromic approach, the coating is exposed to a hydrogen containing gas to induce theoptical transition and to an oxygen containing gas to force the reversible reaction back to the ini-
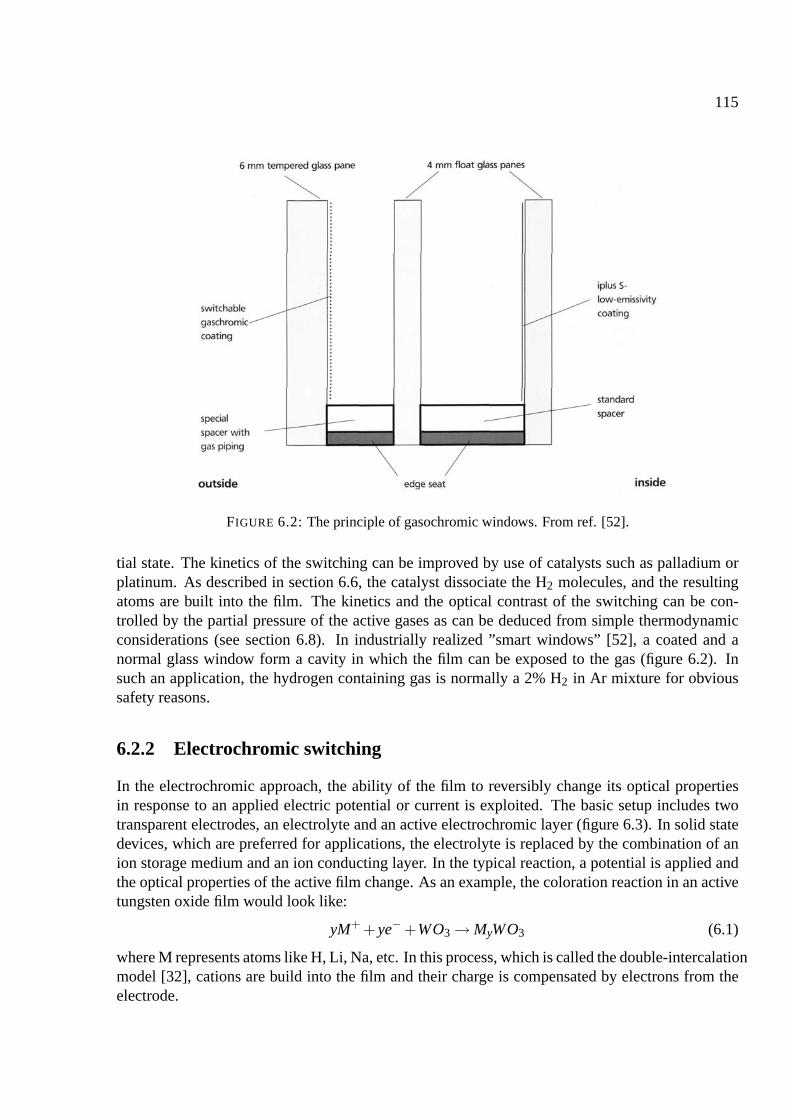
115
FIGURE 6.2: The principle of gasochromic windows. From ref. [52].
tial state. The kinetics of the switching can be improved by use of catalysts such as palladium orplatinum. As described in section 6.6, the catalyst dissociate the H2 molecules, and the resultingatoms are built into the film. The kinetics and the optical contrast of the switching can be con-trolled by the partial pressure of the active gases as can be deduced from simple thermodynamicconsiderations (see section 6.8). In industrially realized ”smart windows” [52], a coated and anormal glass window form a cavity in which the film can be exposed to the gas (figure 6.2). Insuch an application, the hydrogen containing gas is normally a 2% H2 in Ar mixture for obvioussafety reasons.
6.2.2 Electrochromic switching
In the electrochromic approach, the ability of the film to reversibly change its optical propertiesin response to an applied electric potential or current is exploited. The basic setup includes twotransparent electrodes, an electrolyte and an active electrochromic layer (figure 6.3). In solid statedevices, which are preferred for applications, the electrolyte is replaced by the combination of anion storage medium and an ion conducting layer. In the typical reaction, a potential is applied andthe optical properties of the active film change. As an example, the coloration reaction in an activetungsten oxide film would look like:
yM+ + ye− +WO3 → MyWO3 (6.1)
where M represents atoms like H, Li, Na, etc. In this process, which is called the double-intercalationmodel [32], cations are build into the film and their charge is compensated by electrons from theelectrode.

116
FIGURE 6.3: The principle of electrochromic windows. From ref. [8].
6.2.3 Thermochromic switching
In thermochromic switching the optical properties of the film change as a function of the tempera-ture. Materials showing thermochromic behavior include metal oxides like for instance vanadiumoxide. These materials are transformed from a transparent semiconducting state to an opaquemetallic state, when heated above a certain temperature, while the initial optical properties arerestored upon cooling to room temperature.
6.2.4 Photochromic switching
In photochromic switching the optical properties of the film change as a result of UV irradiation,while they can be restored in darkness. The materials that show photochromic behavior includemany organic materials that change their optical properties by processes such tautemerization andisomerization [8]. In inorganic materials such as metal oxides, the photochromic behavior involvesimperfections such as impurities and lattice defects in the films, which can induce the formation ofelectron-hole pairs and the trapping of charge carriers which lead to the formation of color centers(see section 6.3).
6.3 Tungsten oxide
Tungsten oxide (WOx) is an indirect semiconductor. It has a band gap of 2.6 to 3.5 eV dependingon its degree of crystallinity, and a refractive index in the range of n=1.8 to 2.3, depending on itsexact composition [45]. While it is transparent in its stoichiometric form WO3 down to WO2.55
[40], it has a slightly blue color in the region of 2.55>x>2.45 [40],[57]. All compositions can beswitched to an intense blue appearance. However, the processes are not reversible for the lattergroup of compositions. Tungsten oxide with an oxygen content x<2.45 is metallic. For sputteredfilms the desired composition can easily be controlled through the partial pressure of oxygen duringthe deposition (see Chapter 5.2).
The structure of crystalline tungsten oxide is similar to a Perovskite structure as seen in fig. 6.4.The central atom (C) is missing. The octahedron of WO6, where the distance W-O is of order 1.9
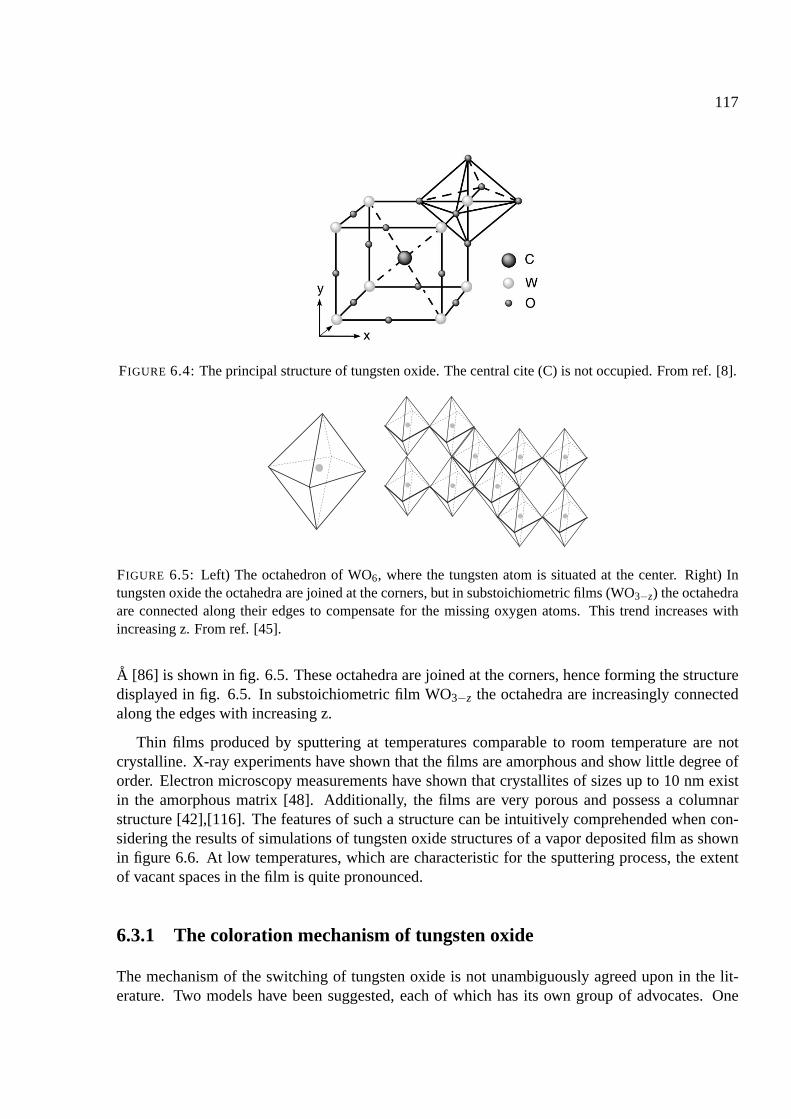
117
FIGURE 6.4: The principal structure of tungsten oxide. The central cite (C) is not occupied. From ref. [8].
FIGURE 6.5: Left) The octahedron of WO6, where the tungsten atom is situated at the center. Right) Intungsten oxide the octahedra are joined at the corners, but in substoichiometric films (WO3−z) the octahedraare connected along their edges to compensate for the missing oxygen atoms. This trend increases withincreasing z. From ref. [45].
A [86] is shown in fig. 6.5. These octahedra are joined at the corners, hence forming the structuredisplayed in fig. 6.5. In substoichiometric film WO3−z the octahedra are increasingly connectedalong the edges with increasing z.
Thin films produced by sputtering at temperatures comparable to room temperature are notcrystalline. X-ray experiments have shown that the films are amorphous and show little degree oforder. Electron microscopy measurements have shown that crystallites of sizes up to 10 nm existin the amorphous matrix [48]. Additionally, the films are very porous and possess a columnarstructure [42],[116]. The features of such a structure can be intuitively comprehended when con-sidering the results of simulations of tungsten oxide structures of a vapor deposited film as shownin figure 6.6. At low temperatures, which are characteristic for the sputtering process, the extentof vacant spaces in the film is quite pronounced.
6.3.1 The coloration mechanism of tungsten oxide
The mechanism of the switching of tungsten oxide is not unambiguously agreed upon in the lit-erature. Two models have been suggested, each of which has its own group of advocates. One
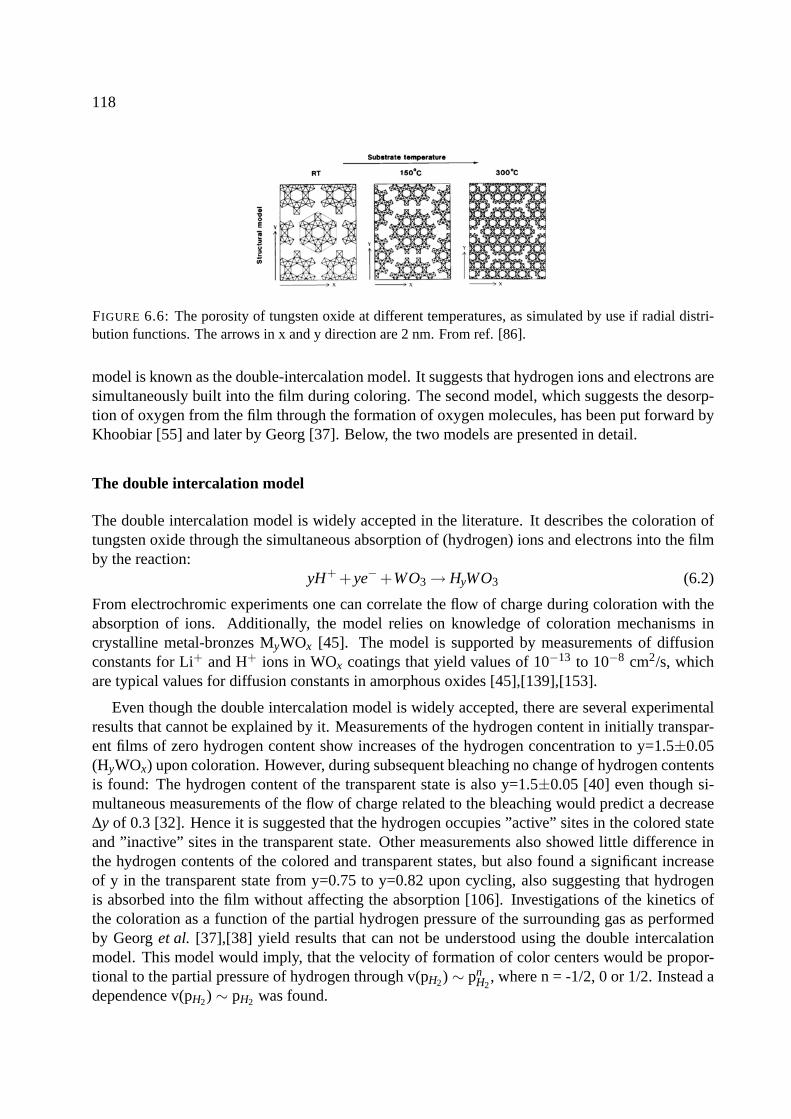
118
FIGURE 6.6: The porosity of tungsten oxide at different temperatures, as simulated by use if radial distri-bution functions. The arrows in x and y direction are 2 nm. From ref. [86].
model is known as the double-intercalation model. It suggests that hydrogen ions and electrons aresimultaneously built into the film during coloring. The second model, which suggests the desorp-tion of oxygen from the film through the formation of oxygen molecules, has been put forward byKhoobiar [55] and later by Georg [37]. Below, the two models are presented in detail.
The double intercalation model
The double intercalation model is widely accepted in the literature. It describes the coloration oftungsten oxide through the simultaneous absorption of (hydrogen) ions and electrons into the filmby the reaction:
yH+ + ye− +WO3 → HyWO3 (6.2)
From electrochromic experiments one can correlate the flow of charge during coloration with theabsorption of ions. Additionally, the model relies on knowledge of coloration mechanisms incrystalline metal-bronzes MyWOx [45]. The model is supported by measurements of diffusionconstants for Li+ and H+ ions in WOx coatings that yield values of 10−13 to 10−8 cm2/s, whichare typical values for diffusion constants in amorphous oxides [45],[139],[153].
Even though the double intercalation model is widely accepted, there are several experimentalresults that cannot be explained by it. Measurements of the hydrogen content in initially transpar-ent films of zero hydrogen content show increases of the hydrogen concentration to y=1.5±0.05(HyWOx) upon coloration. However, during subsequent bleaching no change of hydrogen contentsis found: The hydrogen content of the transparent state is also y=1.5±0.05 [40] even though si-multaneous measurements of the flow of charge related to the bleaching would predict a decrease∆y of 0.3 [32]. Hence it is suggested that the hydrogen occupies ”active” sites in the colored stateand ”inactive” sites in the transparent state. Other measurements also showed little difference inthe hydrogen contents of the colored and transparent states, but also found a significant increaseof y in the transparent state from y=0.75 to y=0.82 upon cycling, also suggesting that hydrogenis absorbed into the film without affecting the absorption [106]. Investigations of the kinetics ofthe coloration as a function of the partial hydrogen pressure of the surrounding gas as performedby Georg et al. [37],[38] yield results that can not be understood using the double intercalationmodel. This model would imply, that the velocity of formation of color centers would be propor-tional to the partial pressure of hydrogen through v(pH2) ∼ pn
H2, where n = -1/2, 0 or 1/2. Instead a
dependence v(pH2) ∼ pH2 was found.
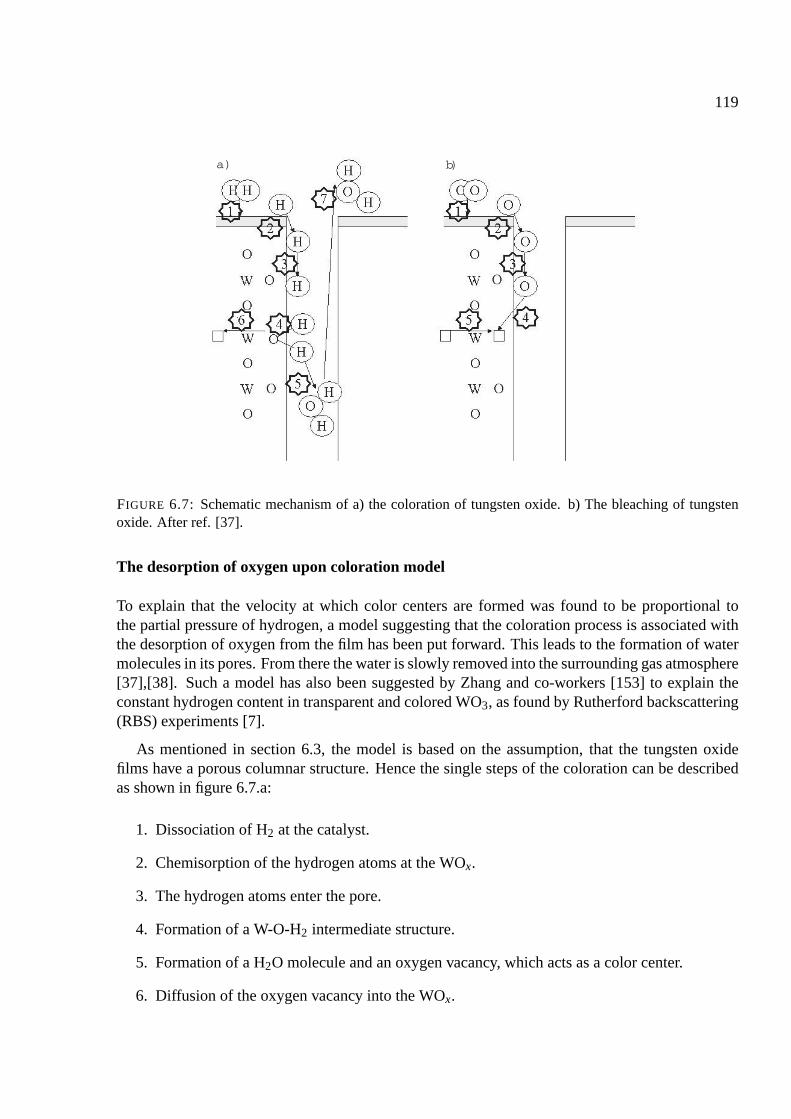
119
a) b)
FIGURE 6.7: Schematic mechanism of a) the coloration of tungsten oxide. b) The bleaching of tungstenoxide. After ref. [37].
The desorption of oxygen upon coloration model
To explain that the velocity at which color centers are formed was found to be proportional tothe partial pressure of hydrogen, a model suggesting that the coloration process is associated withthe desorption of oxygen from the film has been put forward. This leads to the formation of watermolecules in its pores. From there the water is slowly removed into the surrounding gas atmosphere[37],[38]. Such a model has also been suggested by Zhang and co-workers [153] to explain theconstant hydrogen content in transparent and colored WO3, as found by Rutherford backscattering(RBS) experiments [7].
As mentioned in section 6.3, the model is based on the assumption, that the tungsten oxidefilms have a porous columnar structure. Hence the single steps of the coloration can be describedas shown in figure 6.7.a:
1. Dissociation of H2 at the catalyst.
2. Chemisorption of the hydrogen atoms at the WOx.
3. The hydrogen atoms enter the pore.
4. Formation of a W-O-H2 intermediate structure.
5. Formation of a H2O molecule and an oxygen vacancy, which acts as a color center.
6. Diffusion of the oxygen vacancy into the WOx.
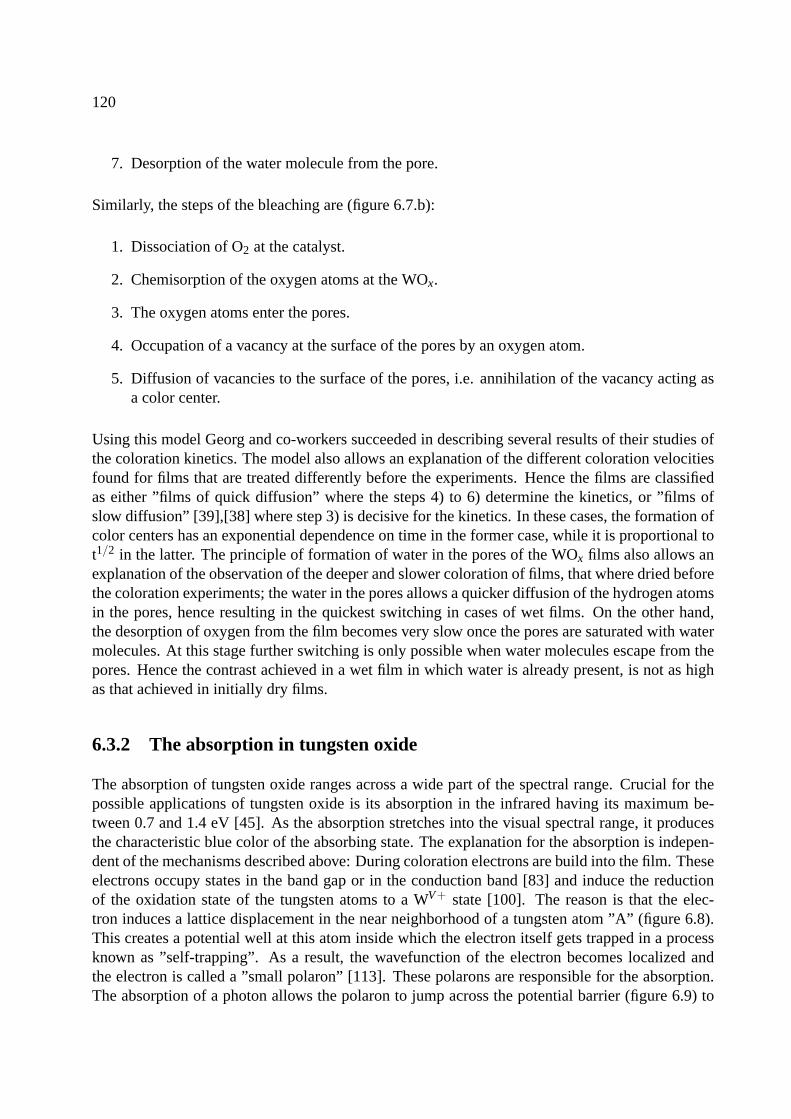
120
7. Desorption of the water molecule from the pore.
Similarly, the steps of the bleaching are (figure 6.7.b):
1. Dissociation of O2 at the catalyst.
2. Chemisorption of the oxygen atoms at the WOx.
3. The oxygen atoms enter the pores.
4. Occupation of a vacancy at the surface of the pores by an oxygen atom.
5. Diffusion of vacancies to the surface of the pores, i.e. annihilation of the vacancy acting asa color center.
Using this model Georg and co-workers succeeded in describing several results of their studies ofthe coloration kinetics. The model also allows an explanation of the different coloration velocitiesfound for films that are treated differently before the experiments. Hence the films are classifiedas either ”films of quick diffusion” where the steps 4) to 6) determine the kinetics, or ”films ofslow diffusion” [39],[38] where step 3) is decisive for the kinetics. In these cases, the formation ofcolor centers has an exponential dependence on time in the former case, while it is proportional tot1/2 in the latter. The principle of formation of water in the pores of the WOx films also allows anexplanation of the observation of the deeper and slower coloration of films, that where dried beforethe coloration experiments; the water in the pores allows a quicker diffusion of the hydrogen atomsin the pores, hence resulting in the quickest switching in cases of wet films. On the other hand,the desorption of oxygen from the film becomes very slow once the pores are saturated with watermolecules. At this stage further switching is only possible when water molecules escape from thepores. Hence the contrast achieved in a wet film in which water is already present, is not as highas that achieved in initially dry films.
6.3.2 The absorption in tungsten oxide
The absorption of tungsten oxide ranges across a wide part of the spectral range. Crucial for thepossible applications of tungsten oxide is its absorption in the infrared having its maximum be-tween 0.7 and 1.4 eV [45]. As the absorption stretches into the visual spectral range, it producesthe characteristic blue color of the absorbing state. The explanation for the absorption is indepen-dent of the mechanisms described above: During coloration electrons are build into the film. Theseelectrons occupy states in the band gap or in the conduction band [83] and induce the reductionof the oxidation state of the tungsten atoms to a WV+ state [100]. The reason is that the elec-tron induces a lattice displacement in the near neighborhood of a tungsten atom ”A” (figure 6.8).This creates a potential well at this atom inside which the electron itself gets trapped in a processknown as ”self-trapping”. As a result, the wavefunction of the electron becomes localized andthe electron is called a ”small polaron” [113]. These polarons are responsible for the absorption.The absorption of a photon allows the polaron to jump across the potential barrier (figure 6.9) to
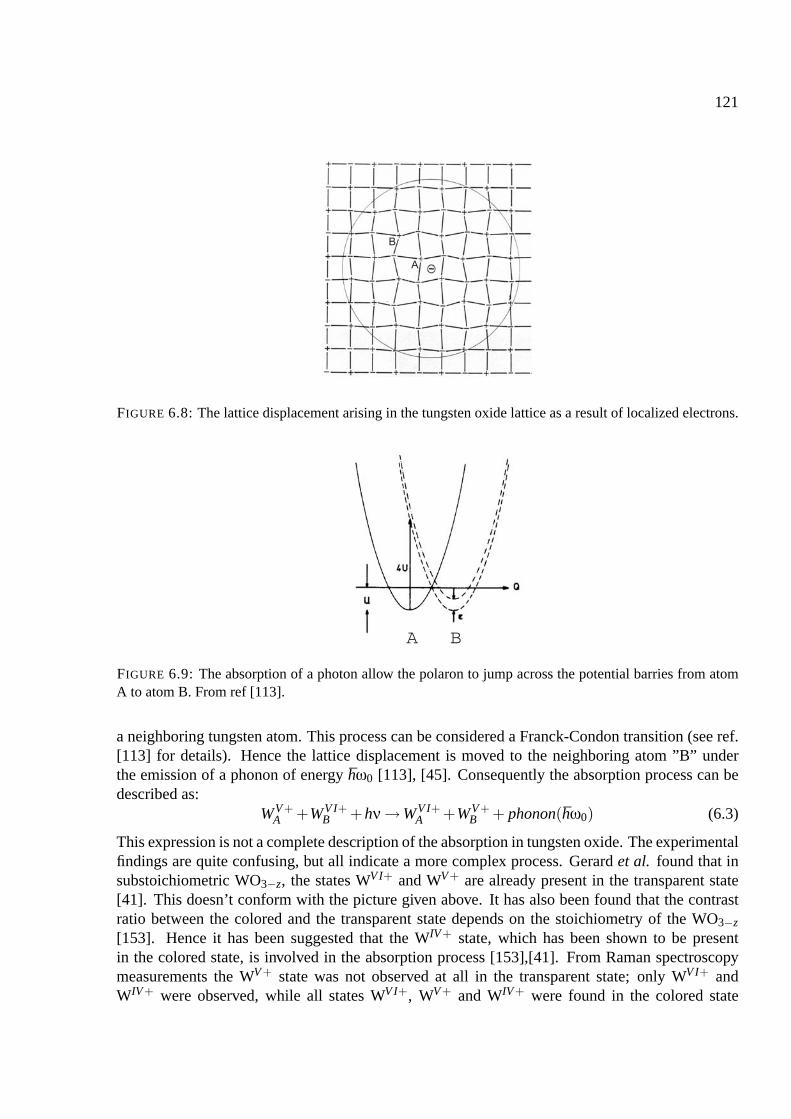
121
FIGURE 6.8: The lattice displacement arising in the tungsten oxide lattice as a result of localized electrons.
A B
FIGURE 6.9: The absorption of a photon allow the polaron to jump across the potential barries from atomA to atom B. From ref [113].
a neighboring tungsten atom. This process can be considered a Franck-Condon transition (see ref.[113] for details). Hence the lattice displacement is moved to the neighboring atom ”B” underthe emission of a phonon of energy hω0 [113], [45]. Consequently the absorption process can bedescribed as:
WV+A +WV I+
B +hν →WV I+A +WV+
B + phonon(hω0) (6.3)
This expression is not a complete description of the absorption in tungsten oxide. The experimentalfindings are quite confusing, but all indicate a more complex process. Gerard et al. found that insubstoichiometric WO3−z, the states WV I+ and WV+ are already present in the transparent state[41]. This doesn’t conform with the picture given above. It has also been found that the contrastratio between the colored and the transparent state depends on the stoichiometry of the WO3−z
[153]. Hence it has been suggested that the WIV+ state, which has been shown to be presentin the colored state, is involved in the absorption process [153],[41]. From Raman spectroscopymeasurements the WV+ state was not observed at all in the transparent state; only WV I+ andWIV+ were observed, while all states WV I+, WV+ and WIV+ were found in the colored state
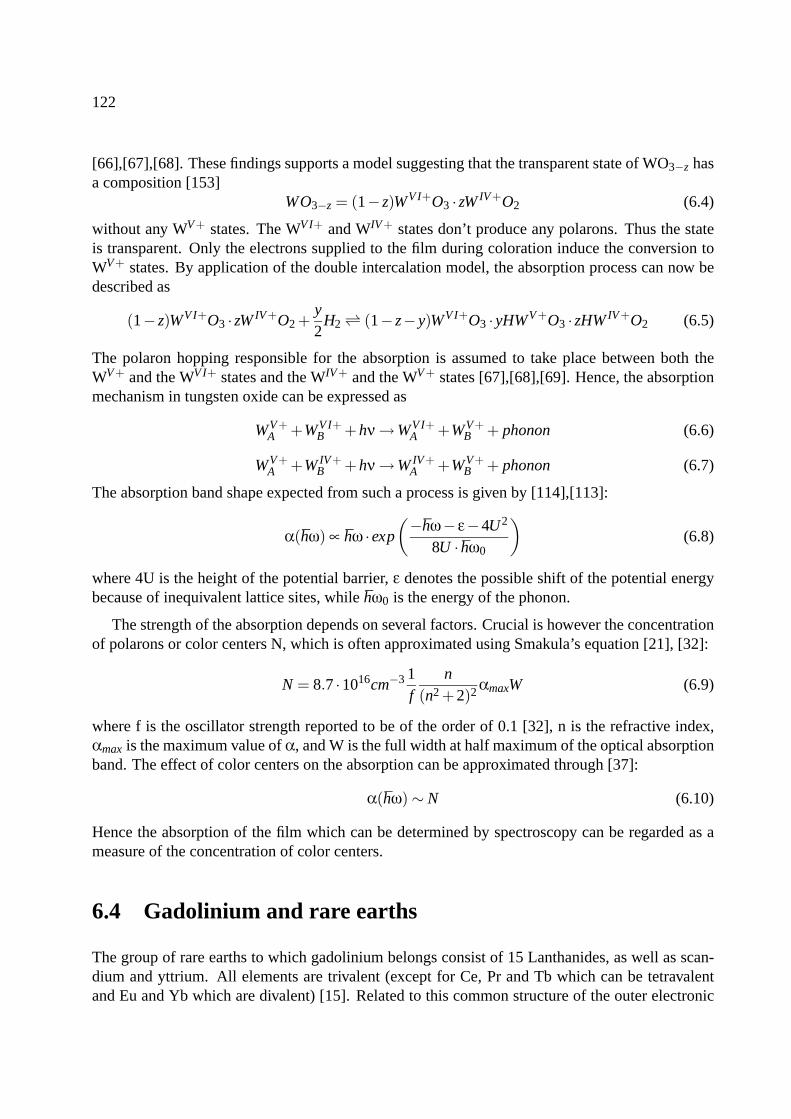
122
[66],[67],[68]. These findings supports a model suggesting that the transparent state of WO3−z hasa composition [153]
WO3−z = (1− z)WV I+O3 · zW IV+O2 (6.4)
without any WV+ states. The WV I+ and WIV+ states don’t produce any polarons. Thus the stateis transparent. Only the electrons supplied to the film during coloration induce the conversion toWV+ states. By application of the double intercalation model, the absorption process can now bedescribed as
(1− z)WV I+O3 · zW IV+O2 +y2
H2 (1− z− y)WV I+O3 · yHWV+O3 · zHW IV+O2 (6.5)
The polaron hopping responsible for the absorption is assumed to take place between both theWV+ and the WV I+ states and the WIV+ and the WV+ states [67],[68],[69]. Hence, the absorptionmechanism in tungsten oxide can be expressed as
WV+A +WV I+
B +hν →WV I+A +WV+
B + phonon (6.6)
WV+A +W IV+
B +hν →W IV+A +WV+
B + phonon (6.7)
The absorption band shape expected from such a process is given by [114],[113]:
α(hω) ∝ hω · exp
(−hω− ε−4U2
8U · hω0
)(6.8)
where 4U is the height of the potential barrier, ε denotes the possible shift of the potential energybecause of inequivalent lattice sites, while hω0 is the energy of the phonon.
The strength of the absorption depends on several factors. Crucial is however the concentrationof polarons or color centers N, which is often approximated using Smakula’s equation [21], [32]:
N = 8.7 ·1016cm−3 1f
n(n2 +2)2 αmaxW (6.9)
where f is the oscillator strength reported to be of the order of 0.1 [32], n is the refractive index,αmax is the maximum value of α, and W is the full width at half maximum of the optical absorptionband. The effect of color centers on the absorption can be approximated through [37]:
α(hω) ∼ N (6.10)
Hence the absorption of the film which can be determined by spectroscopy can be regarded as ameasure of the concentration of color centers.
6.4 Gadolinium and rare earths
The group of rare earths to which gadolinium belongs consist of 15 Lanthanides, as well as scan-dium and yttrium. All elements are trivalent (except for Ce, Pr and Tb which can be tetravalentand Eu and Yb which are divalent) [15]. Related to this common structure of the outer electronic
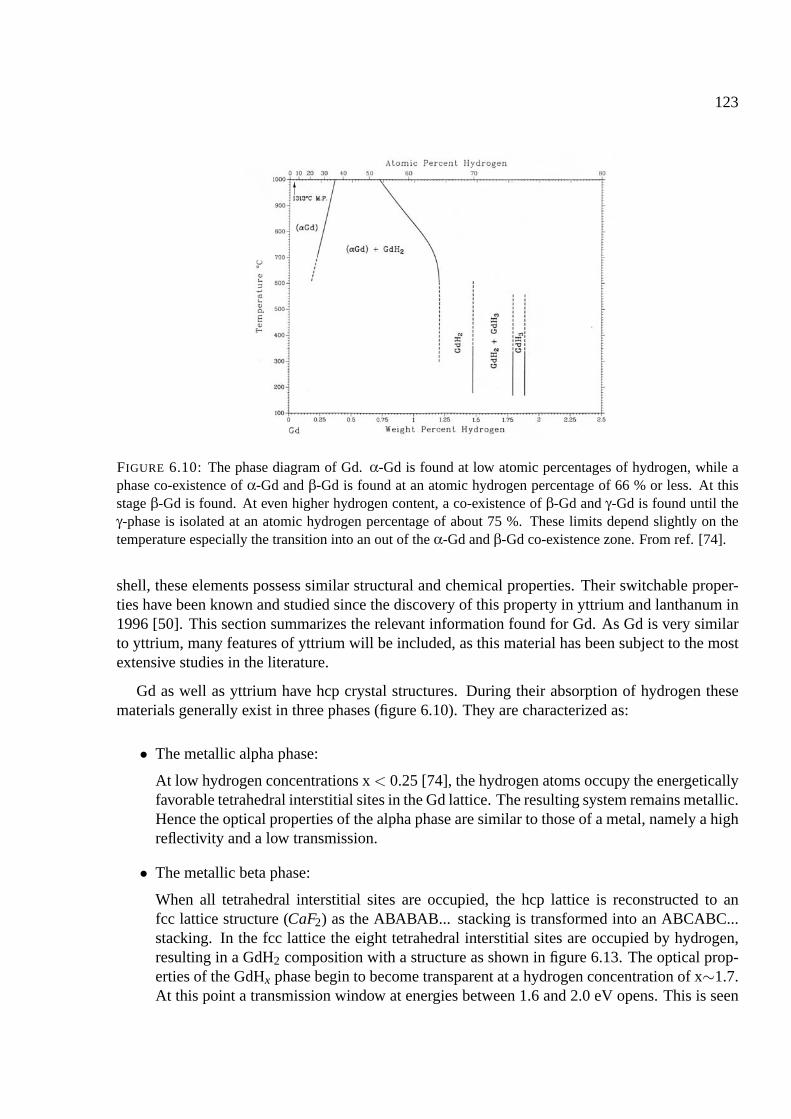
123
FIGURE 6.10: The phase diagram of Gd. α-Gd is found at low atomic percentages of hydrogen, while aphase co-existence of α-Gd and β-Gd is found at an atomic hydrogen percentage of 66 % or less. At thisstage β-Gd is found. At even higher hydrogen content, a co-existence of β-Gd and γ-Gd is found until theγ-phase is isolated at an atomic hydrogen percentage of about 75 %. These limits depend slightly on thetemperature especially the transition into an out of the α-Gd and β-Gd co-existence zone. From ref. [74].
shell, these elements possess similar structural and chemical properties. Their switchable proper-ties have been known and studied since the discovery of this property in yttrium and lanthanum in1996 [50]. This section summarizes the relevant information found for Gd. As Gd is very similarto yttrium, many features of yttrium will be included, as this material has been subject to the mostextensive studies in the literature.
Gd as well as yttrium have hcp crystal structures. During their absorption of hydrogen thesematerials generally exist in three phases (figure 6.10). They are characterized as:
• The metallic alpha phase:
At low hydrogen concentrations x < 0.25 [74], the hydrogen atoms occupy the energeticallyfavorable tetrahedral interstitial sites in the Gd lattice. The resulting system remains metallic.Hence the optical properties of the alpha phase are similar to those of a metal, namely a highreflectivity and a low transmission.
• The metallic beta phase:
When all tetrahedral interstitial sites are occupied, the hcp lattice is reconstructed to anfcc lattice structure (CaF2) as the ABABAB... stacking is transformed into an ABCABC...stacking. In the fcc lattice the eight tetrahedral interstitial sites are occupied by hydrogen,resulting in a GdH2 composition with a structure as shown in figure 6.13. The optical prop-erties of the GdHx phase begin to become transparent at a hydrogen concentration of x∼1.7.At this point a transmission window at energies between 1.6 and 2.0 eV opens. This is seen
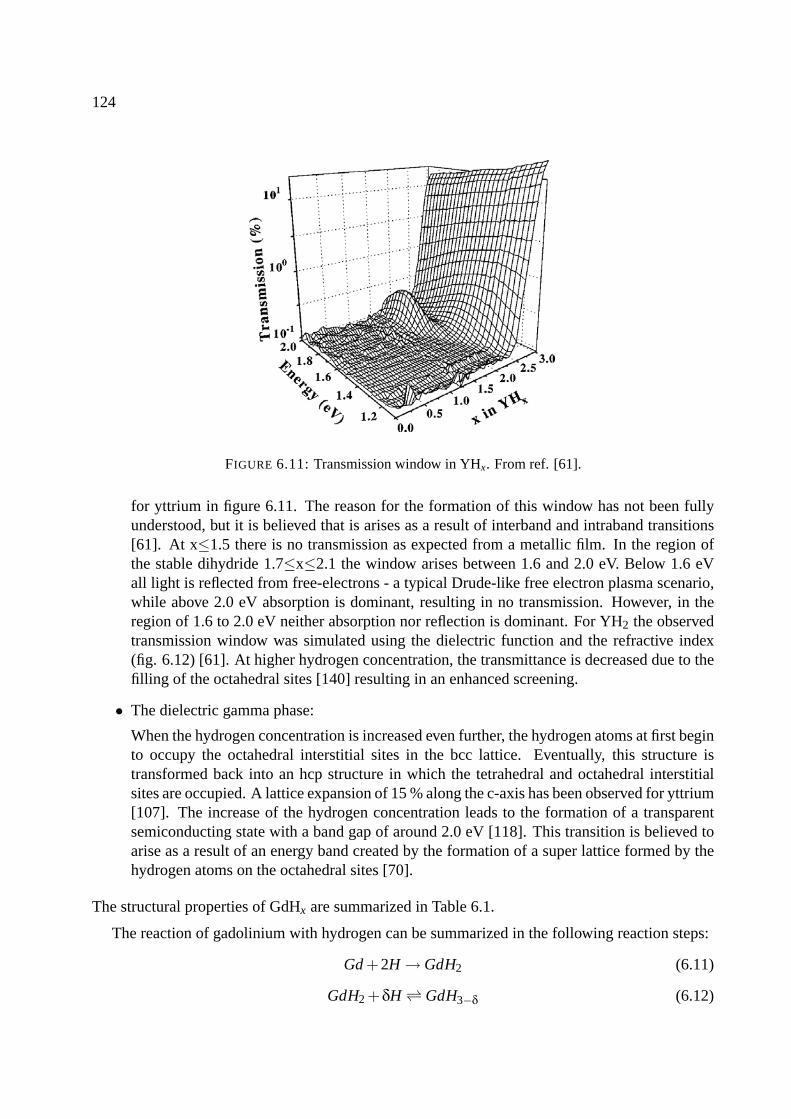
124
FIGURE 6.11: Transmission window in YHx. From ref. [61].
for yttrium in figure 6.11. The reason for the formation of this window has not been fullyunderstood, but it is believed that is arises as a result of interband and intraband transitions[61]. At x≤1.5 there is no transmission as expected from a metallic film. In the region ofthe stable dihydride 1.7≤x≤2.1 the window arises between 1.6 and 2.0 eV. Below 1.6 eVall light is reflected from free-electrons - a typical Drude-like free electron plasma scenario,while above 2.0 eV absorption is dominant, resulting in no transmission. However, in theregion of 1.6 to 2.0 eV neither absorption nor reflection is dominant. For YH2 the observedtransmission window was simulated using the dielectric function and the refractive index(fig. 6.12) [61]. At higher hydrogen concentration, the transmittance is decreased due to thefilling of the octahedral sites [140] resulting in an enhanced screening.
• The dielectric gamma phase:
When the hydrogen concentration is increased even further, the hydrogen atoms at first beginto occupy the octahedral interstitial sites in the bcc lattice. Eventually, this structure istransformed back into an hcp structure in which the tetrahedral and octahedral interstitialsites are occupied. A lattice expansion of 15 % along the c-axis has been observed for yttrium[107]. The increase of the hydrogen concentration leads to the formation of a transparentsemiconducting state with a band gap of around 2.0 eV [118]. This transition is believed toarise as a result of an energy band created by the formation of a super lattice formed by thehydrogen atoms on the octahedral sites [70].
The structural properties of GdHx are summarized in Table 6.1.
The reaction of gadolinium with hydrogen can be summarized in the following reaction steps:
Gd +2H → GdH2 (6.11)
GdH2 +δH GdH3−δ (6.12)
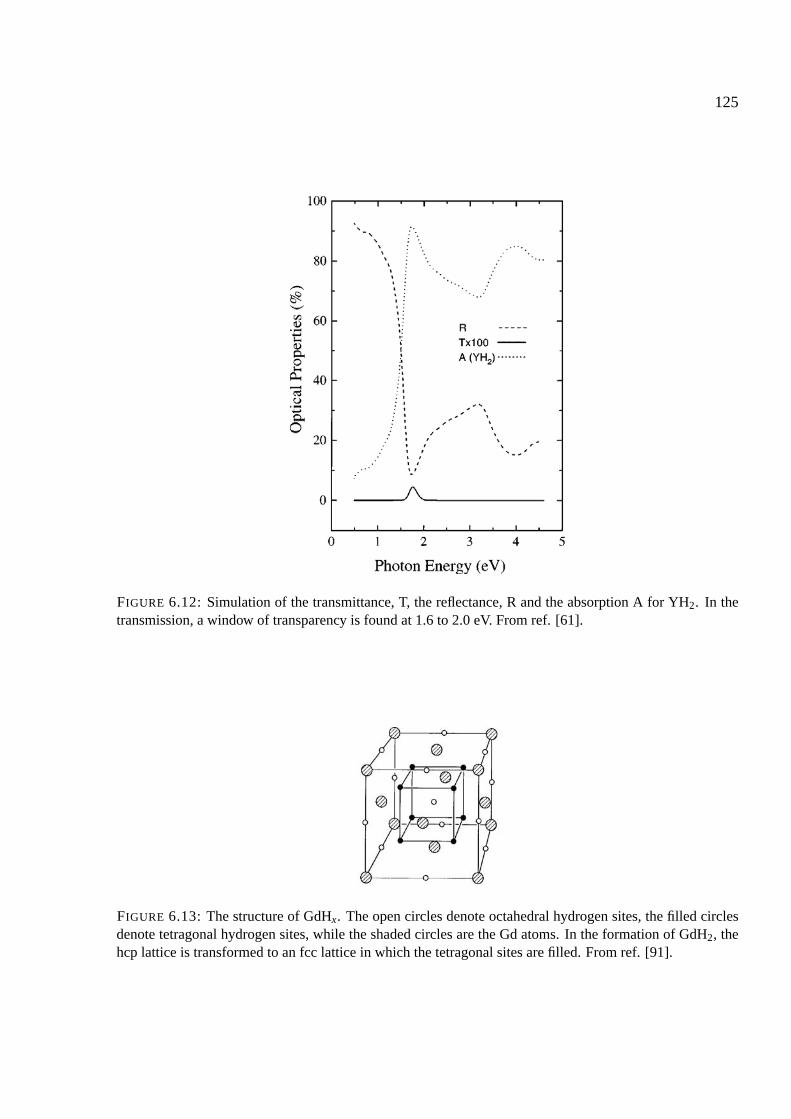
125
FIGURE 6.12: Simulation of the transmittance, T, the reflectance, R and the absorption A for YH2. In thetransmission, a window of transparency is found at 1.6 to 2.0 eV. From ref. [61].
FIGURE 6.13: The structure of GdHx. The open circles denote octahedral hydrogen sites, the filled circlesdenote tetragonal hydrogen sites, while the shaded circles are the Gd atoms. In the formation of GdH2, thehcp lattice is transformed to an fcc lattice in which the tetragonal sites are filled. From ref. [91].
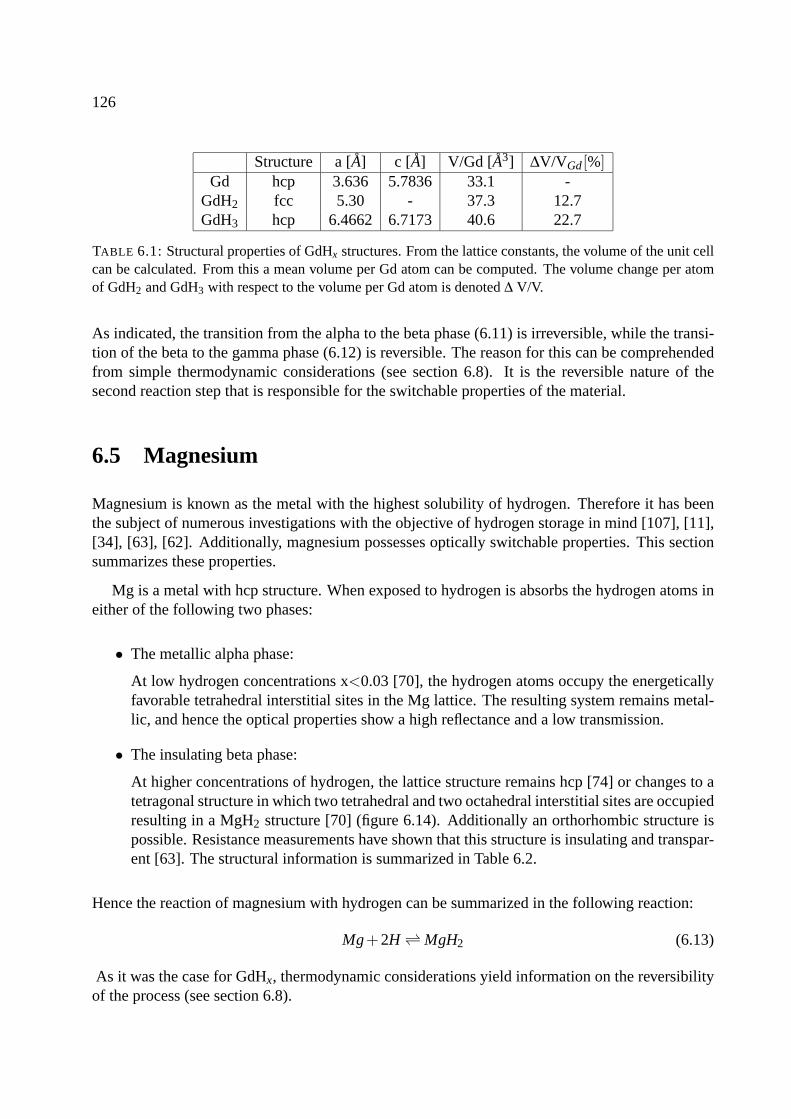
126
Structure a [A] c [A] V/Gd [A3] ∆V/VGd[%]Gd hcp 3.636 5.7836 33.1 -
GdH2 fcc 5.30 - 37.3 12.7GdH3 hcp 6.4662 6.7173 40.6 22.7
TABLE 6.1: Structural properties of GdHx structures. From the lattice constants, the volume of the unit cellcan be calculated. From this a mean volume per Gd atom can be computed. The volume change per atomof GdH2 and GdH3 with respect to the volume per Gd atom is denoted ∆ V/V.
As indicated, the transition from the alpha to the beta phase (6.11) is irreversible, while the transi-tion of the beta to the gamma phase (6.12) is reversible. The reason for this can be comprehendedfrom simple thermodynamic considerations (see section 6.8). It is the reversible nature of thesecond reaction step that is responsible for the switchable properties of the material.
6.5 Magnesium
Magnesium is known as the metal with the highest solubility of hydrogen. Therefore it has beenthe subject of numerous investigations with the objective of hydrogen storage in mind [107], [11],[34], [63], [62]. Additionally, magnesium possesses optically switchable properties. This sectionsummarizes these properties.
Mg is a metal with hcp structure. When exposed to hydrogen is absorbs the hydrogen atoms ineither of the following two phases:
• The metallic alpha phase:
At low hydrogen concentrations x<0.03 [70], the hydrogen atoms occupy the energeticallyfavorable tetrahedral interstitial sites in the Mg lattice. The resulting system remains metal-lic, and hence the optical properties show a high reflectance and a low transmission.
• The insulating beta phase:
At higher concentrations of hydrogen, the lattice structure remains hcp [74] or changes to atetragonal structure in which two tetrahedral and two octahedral interstitial sites are occupiedresulting in a MgH2 structure [70] (figure 6.14). Additionally an orthorhombic structure ispossible. Resistance measurements have shown that this structure is insulating and transpar-ent [63]. The structural information is summarized in Table 6.2.
Hence the reaction of magnesium with hydrogen can be summarized in the following reaction:
Mg+2H MgH2 (6.13)
As it was the case for GdHx, thermodynamic considerations yield information on the reversibilityof the process (see section 6.8).
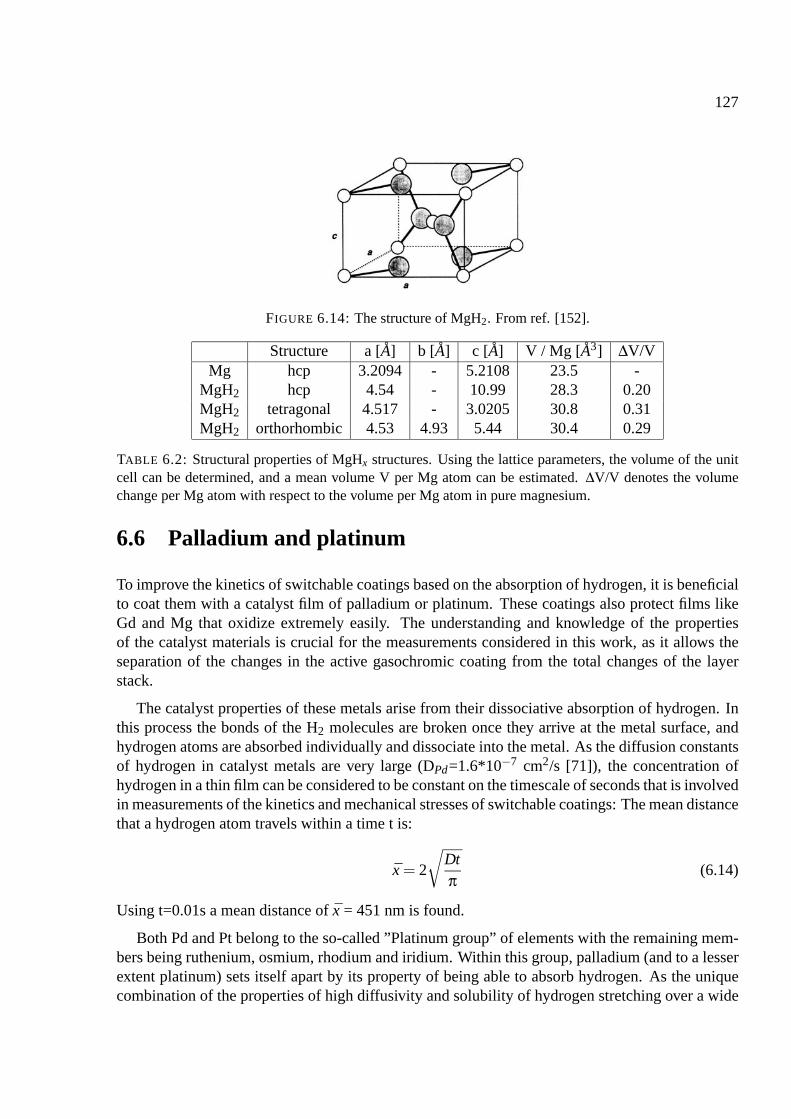
127
FIGURE 6.14: The structure of MgH2. From ref. [152].
Structure a [A] b [A] c [A] V / Mg [A3] ∆V/VMg hcp 3.2094 - 5.2108 23.5 -
MgH2 hcp 4.54 - 10.99 28.3 0.20MgH2 tetragonal 4.517 - 3.0205 30.8 0.31MgH2 orthorhombic 4.53 4.93 5.44 30.4 0.29
TABLE 6.2: Structural properties of MgHx structures. Using the lattice parameters, the volume of the unitcell can be determined, and a mean volume V per Mg atom can be estimated. ∆V/V denotes the volumechange per Mg atom with respect to the volume per Mg atom in pure magnesium.
6.6 Palladium and platinum
To improve the kinetics of switchable coatings based on the absorption of hydrogen, it is beneficialto coat them with a catalyst film of palladium or platinum. These coatings also protect films likeGd and Mg that oxidize extremely easily. The understanding and knowledge of the propertiesof the catalyst materials is crucial for the measurements considered in this work, as it allows theseparation of the changes in the active gasochromic coating from the total changes of the layerstack.
The catalyst properties of these metals arise from their dissociative absorption of hydrogen. Inthis process the bonds of the H2 molecules are broken once they arrive at the metal surface, andhydrogen atoms are absorbed individually and dissociate into the metal. As the diffusion constantsof hydrogen in catalyst metals are very large (DPd=1.6*10−7 cm2/s [71]), the concentration ofhydrogen in a thin film can be considered to be constant on the timescale of seconds that is involvedin measurements of the kinetics and mechanical stresses of switchable coatings: The mean distancethat a hydrogen atom travels within a time t is:
x = 2
√Dtπ
(6.14)
Using t=0.01s a mean distance of x = 451 nm is found.
Both Pd and Pt belong to the so-called ”Platinum group” of elements with the remaining mem-bers being ruthenium, osmium, rhodium and iridium. Within this group, palladium (and to a lesserextent platinum) sets itself apart by its property of being able to absorb hydrogen. As the uniquecombination of the properties of high diffusivity and solubility of hydrogen stretching over a wide
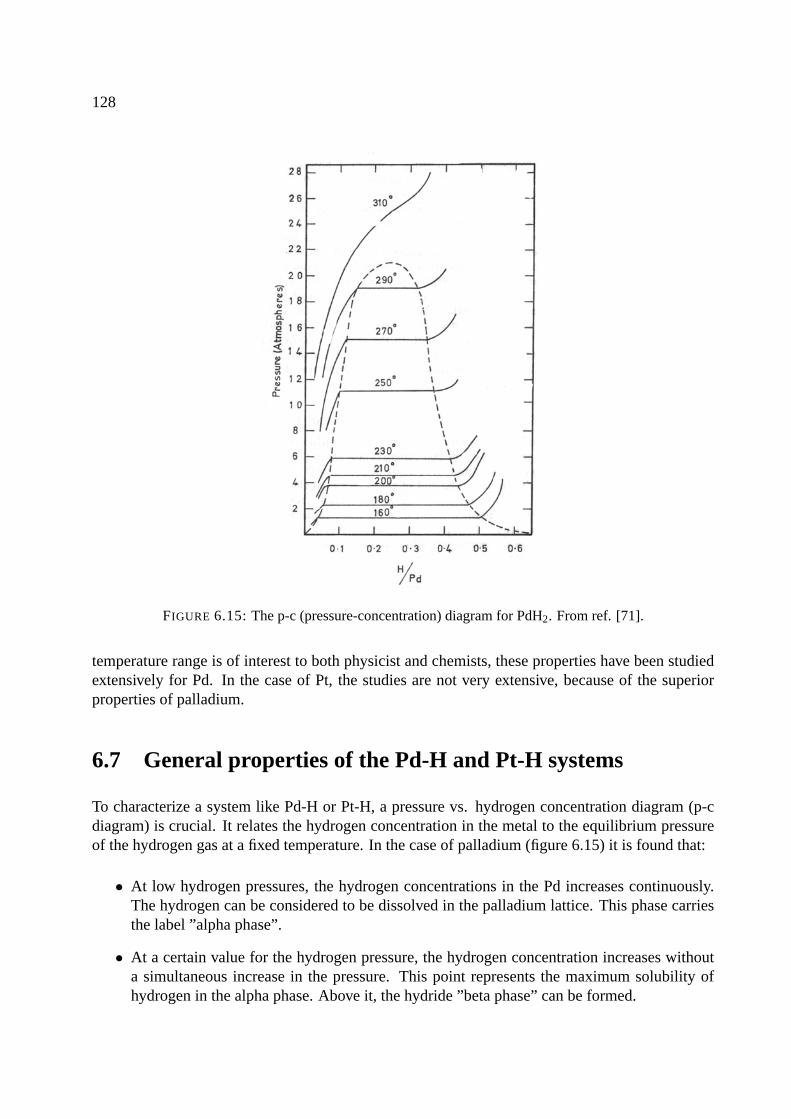
128
FIGURE 6.15: The p-c (pressure-concentration) diagram for PdH2. From ref. [71].
temperature range is of interest to both physicist and chemists, these properties have been studiedextensively for Pd. In the case of Pt, the studies are not very extensive, because of the superiorproperties of palladium.
6.7 General properties of the Pd-H and Pt-H systems
To characterize a system like Pd-H or Pt-H, a pressure vs. hydrogen concentration diagram (p-cdiagram) is crucial. It relates the hydrogen concentration in the metal to the equilibrium pressureof the hydrogen gas at a fixed temperature. In the case of palladium (figure 6.15) it is found that:
• At low hydrogen pressures, the hydrogen concentrations in the Pd increases continuously.The hydrogen can be considered to be dissolved in the palladium lattice. This phase carriesthe label ”alpha phase”.
• At a certain value for the hydrogen pressure, the hydrogen concentration increases withouta simultaneous increase in the pressure. This point represents the maximum solubility ofhydrogen in the alpha phase. Above it, the hydride ”beta phase” can be formed.
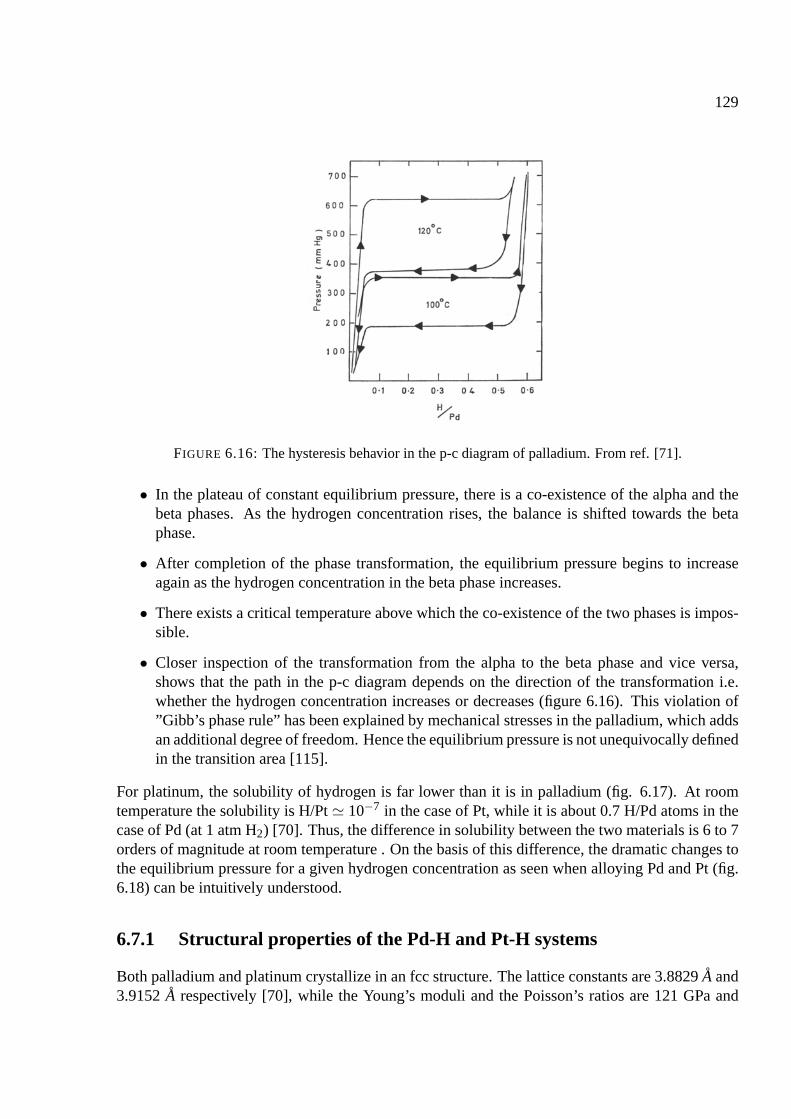
129
FIGURE 6.16: The hysteresis behavior in the p-c diagram of palladium. From ref. [71].
• In the plateau of constant equilibrium pressure, there is a co-existence of the alpha and thebeta phases. As the hydrogen concentration rises, the balance is shifted towards the betaphase.
• After completion of the phase transformation, the equilibrium pressure begins to increaseagain as the hydrogen concentration in the beta phase increases.
• There exists a critical temperature above which the co-existence of the two phases is impos-sible.
• Closer inspection of the transformation from the alpha to the beta phase and vice versa,shows that the path in the p-c diagram depends on the direction of the transformation i.e.whether the hydrogen concentration increases or decreases (figure 6.16). This violation of”Gibb’s phase rule” has been explained by mechanical stresses in the palladium, which addsan additional degree of freedom. Hence the equilibrium pressure is not unequivocally definedin the transition area [115].
For platinum, the solubility of hydrogen is far lower than it is in palladium (fig. 6.17). At roomtemperature the solubility is H/Pt 10−7 in the case of Pt, while it is about 0.7 H/Pd atoms in thecase of Pd (at 1 atm H2) [70]. Thus, the difference in solubility between the two materials is 6 to 7orders of magnitude at room temperature . On the basis of this difference, the dramatic changes tothe equilibrium pressure for a given hydrogen concentration as seen when alloying Pd and Pt (fig.6.18) can be intuitively understood.
6.7.1 Structural properties of the Pd-H and Pt-H systems
Both palladium and platinum crystallize in an fcc structure. The lattice constants are 3.8829 A and3.9152 A respectively [70], while the Young’s moduli and the Poisson’s ratios are 121 GPa and
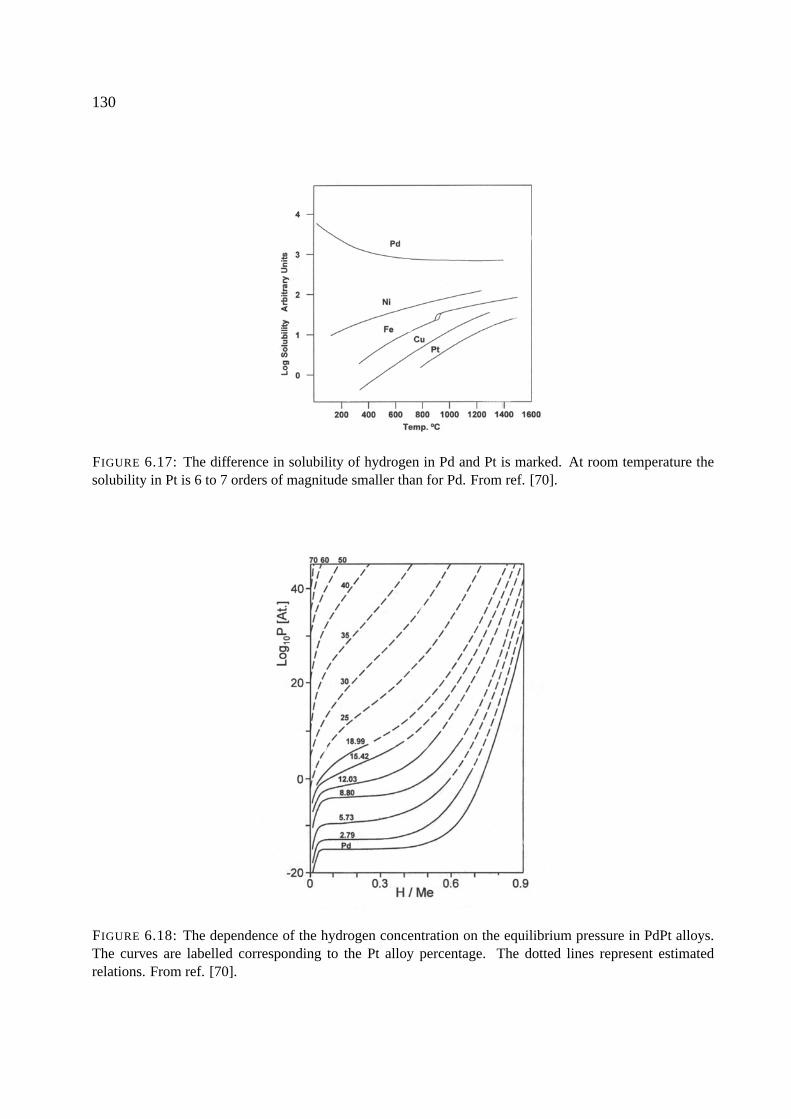
130
FIGURE 6.17: The difference in solubility of hydrogen in Pd and Pt is marked. At room temperature thesolubility in Pt is 6 to 7 orders of magnitude smaller than for Pd. From ref. [70].
FIGURE 6.18: The dependence of the hydrogen concentration on the equilibrium pressure in PdPt alloys.The curves are labelled corresponding to the Pt alloy percentage. The dotted lines represent estimatedrelations. From ref. [70].

131
FIGURE 6.19: In palladium hydrogen has a preference for occupying the octahedral interstitial sites (top)as opposed to the tetrahedral sites (bottom) From ref. [70].
0.39 for Pd and 168 GPa and 0.38 for Pt. The diffusion constants for hydrogen in the materials areabout 3 · 10−7 cm−2 /s for Pd and 2 · 10−9 cm−2 /s for Pt.
The effect of absorption of hydrogen is thoroughly investigated for Pd. On the other handlittle information can be found for Pt. In the case of palladium, the hydrogen atoms have beenfound to have a preference for occupying the octahedral interstitial sites as seen in figure 6.19. Inthe α-phase no periodical order is found in the occupation of the interstitial sites. The hydrogenmust be imagined jumping around between the interstitial sites with a frequency, that for Nb is ofthe order of 10−11 s−1 [2]. In the β-phase however, where the hydrogen concentration increasesdramatically, the mobility of the hydrogen atoms is decreased, and a long-range periodical orderemerges.
Associated with the phase transformation from the alpha to the beta phase is an increase in thelattice parameters of the fcc unit cell. In table 6.3 the lattice parameters found by use of X-raydiffraction [71] are listed. As can be seen from figure 6.20, pure Pd has a lattice constant of 3.8829A. This lattice constant increases to 3.895 A in the alpha phase. In the equilibrium pressure plateau,where the alpha and beta phases are both present, diffraction peaks for both phases are observed.At the end of the plateau, the lattice constant for the beta phase is found to be 4.016 A, and furtherincrease of the hydrogen concentration results in an almost linear increase of the lattice constant.At a pressure of 1 bar, a value of 4.04 A is found. Comparing to the volume of the Pd unit cell,a volume change of 0.9 % is expected within the alpha phase while the transformation to the beta
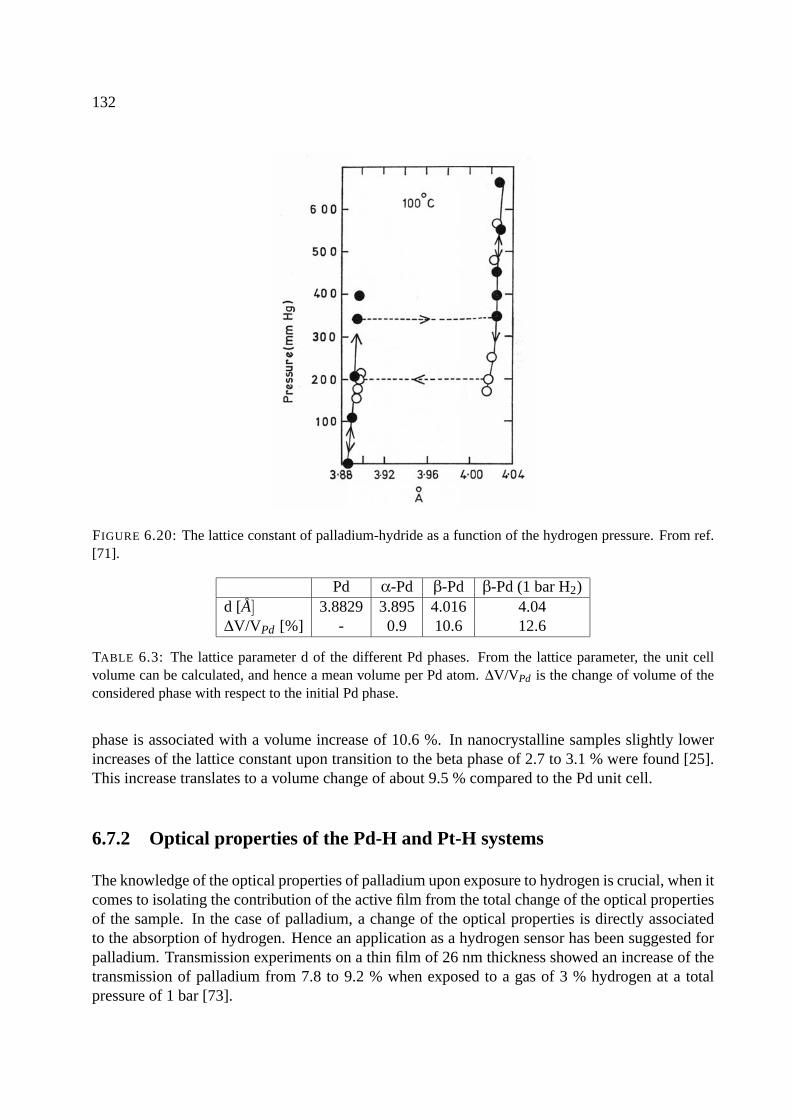
132
FIGURE 6.20: The lattice constant of palladium-hydride as a function of the hydrogen pressure. From ref.[71].
Pd α-Pd β-Pd β-Pd (1 bar H2)d [A] 3.8829 3.895 4.016 4.04∆V/VPd [%] - 0.9 10.6 12.6
TABLE 6.3: The lattice parameter d of the different Pd phases. From the lattice parameter, the unit cellvolume can be calculated, and hence a mean volume per Pd atom. ∆V/VPd is the change of volume of theconsidered phase with respect to the initial Pd phase.
phase is associated with a volume increase of 10.6 %. In nanocrystalline samples slightly lowerincreases of the lattice constant upon transition to the beta phase of 2.7 to 3.1 % were found [25].This increase translates to a volume change of about 9.5 % compared to the Pd unit cell.
6.7.2 Optical properties of the Pd-H and Pt-H systems
The knowledge of the optical properties of palladium upon exposure to hydrogen is crucial, when itcomes to isolating the contribution of the active film from the total change of the optical propertiesof the sample. In the case of palladium, a change of the optical properties is directly associatedto the absorption of hydrogen. Hence an application as a hydrogen sensor has been suggested forpalladium. Transmission experiments on a thin film of 26 nm thickness showed an increase of thetransmission of palladium from 7.8 to 9.2 % when exposed to a gas of 3 % hydrogen at a totalpressure of 1 bar [73].
133
Although this increase is very low, it cannot be overlooked when considering and analyzingthe total transmission of a primary switchable coating such as tungsten oxide, gadolinum or mag-nesium, coated with a palladium catalyst film, which must be considered as a switchable coatingitself.
For the Pt-H system no data were found.
6.8 Thermodynamic considerations
Thermodynamic considerations yield an explanation for the reversible switching behavior ex-plained above. It should be stressed though, that such considerations only yield information onwhether a certain reaction is energetically possible or not. There is no information on the kineticsof the processes to be found by this approach.
In this section a brief resume of the standard approach of thermodynamic considerations willbe given. A thorough treatment of this theory is given in standard chemistry textbooks such as [1].
6.8.1 Basic definitions
To describe the reactionν1A1 +ν2A2 + . . . µ1B1 +µ2B2 . . . (6.15)
where νi and µi are the number of species of the reactants Ai and the products Bi, it is necessaryto consider a number of thermodynamic state functions. The advantage of these thermodynamiccoordinates is that they are independent of the history of the system and only depend on the stateof the components, which is defined by state variables like pressure, temperature, volume etc. Indescribing the reaction (6.15), the relevant state functions are the entropy S, the enthalpy H andthe Gibb’s free energy G, which are related through:
G = H −T S (6.16)
where T is the temperature. The change in Gibb’s free energy at fixed temperature and pressurefor a given reaction (hence the subscript ”r”) is then calculated using:
∆rG = ∆rH −T ∆rS (6.17)
The calculation of the change in Gibb’s free energy is facilitated by tabulated values for the stan-dard enthalpy of formation ∆ f Ho
i and standard entropy Soi , which are known for most chemical
species i. Using these numbers the standard reaction enthalpy, ∆rHo and standard reaction entropy∆rSo can be calculated using:
∆rHo = ∑
iµi ·∆ f Ho
(Bi)−∑j
ν j ·∆ f Ho(A j). (6.18)
and∆rS
o = ∑i
µi ·So(Bi)−∑
jν j ·So
(A j). (6.19)
Hence ∆rGo can be calculated at the standard conditions po=1013 hPa and To=298.15 K, whichare symbolized by the superscript o.
134
6.8.2 Gibb’s free energy at arbitrary temperatures
At temperatures that do not deviate too much from To, one can assume that the reaction enthalpiesand entropies are constant. Hence the change is Gibb’s free energy is linearly dependent on tem-perature:
∆rG(T ) = ∆rHo −T ∆rS
o (6.20)
This approach is not an accurate one though. Finding the correct method begins at the expressionof the molar heat capacity at constant pressure:
Cp =(
∂H∂T
)p
(6.21)
which can be integrated to yield the following temperature dependence of ∆rH:
∆rH(T ) = ∆rHo +
∫ T
298KdT ′ ·∆Co
p(T′). (6.22)
Similarly the expression
∆rS(T ) = ∆rSo +
∫ T
298KdT ′ · ∆Co
p(T′)
T ′ . (6.23)
can be deduced for the entropy. Hence the change in Gibb’s free energy at a given temperature canbe calculated using:
∆rG(T ) = ∆rH(T )−T ∆rS(T ) (6.24)
6.8.3 Gibb’s free energy at arbitrary pressures
For reactions at pressures different from po, a similar approach must be taken. Beginning at thefundamental equation:
dG = −SdT +V d p (6.25)
one can deduce the following expression at a constant temperature:(∂G∂p
)T
= V. (6.26)
A straightforward integration now yields:
∫ G2
G1
dG =∫ p2
p1
V d p (6.27)
For an ideal gas, where V = nRT/p, the following expression for Gibb’s free energy is now found:
G(p,T ) = Go(T )+nRT lnppo . (6.28)
where R=8.314 J/(K·mol), and n is the amount of gas in moles.
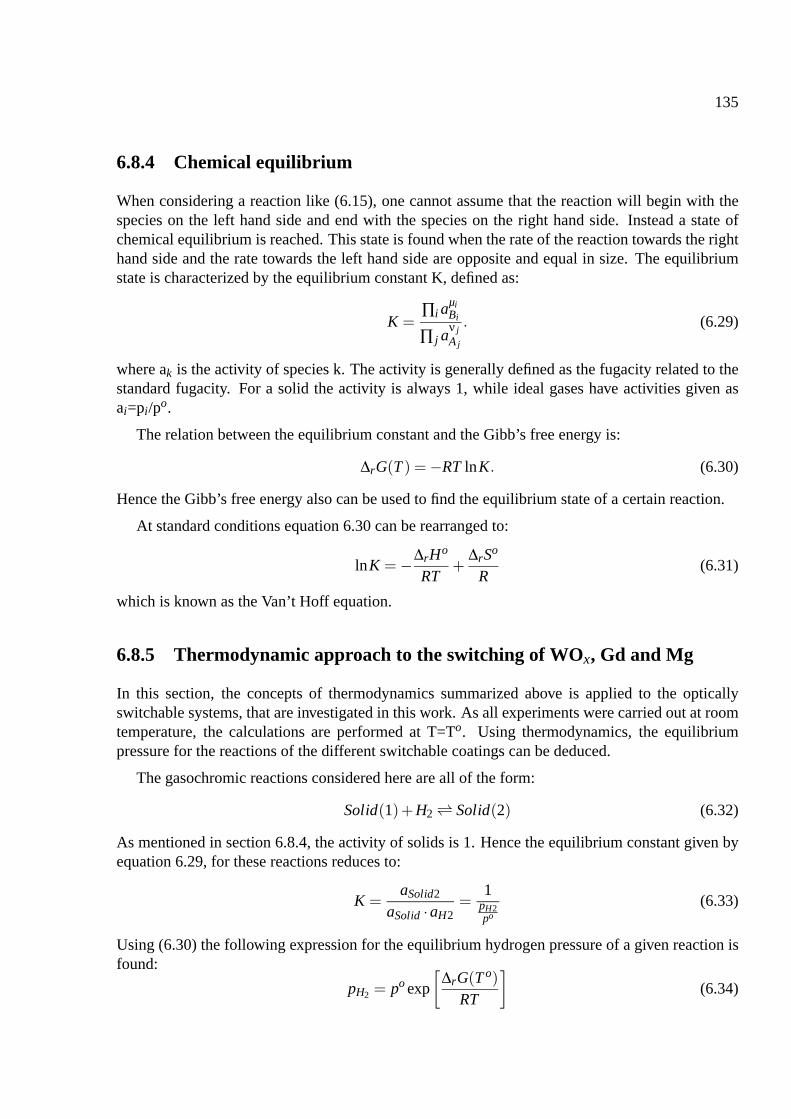
135
6.8.4 Chemical equilibrium
When considering a reaction like (6.15), one cannot assume that the reaction will begin with thespecies on the left hand side and end with the species on the right hand side. Instead a state ofchemical equilibrium is reached. This state is found when the rate of the reaction towards the righthand side and the rate towards the left hand side are opposite and equal in size. The equilibriumstate is characterized by the equilibrium constant K, defined as:
K =∏i aµi
Bi
∏ j aν jA j
. (6.29)
where ak is the activity of species k. The activity is generally defined as the fugacity related to thestandard fugacity. For a solid the activity is always 1, while ideal gases have activities given asai=pi/po.
The relation between the equilibrium constant and the Gibb’s free energy is:
∆rG(T ) = −RT lnK. (6.30)
Hence the Gibb’s free energy also can be used to find the equilibrium state of a certain reaction.
At standard conditions equation 6.30 can be rearranged to:
lnK = −∆rHo
RT+
∆rSo
R(6.31)
which is known as the Van’t Hoff equation.
6.8.5 Thermodynamic approach to the switching of WOx, Gd and Mg
In this section, the concepts of thermodynamics summarized above is applied to the opticallyswitchable systems, that are investigated in this work. As all experiments were carried out at roomtemperature, the calculations are performed at T=To. Using thermodynamics, the equilibriumpressure for the reactions of the different switchable coatings can be deduced.
The gasochromic reactions considered here are all of the form:
Solid(1)+H2 Solid(2) (6.32)
As mentioned in section 6.8.4, the activity of solids is 1. Hence the equilibrium constant given byequation 6.29, for these reactions reduces to:
K =aSolid2
aSolid ·aH2=
1pH2po
(6.33)
Using (6.30) the following expression for the equilibrium hydrogen pressure of a given reaction isfound:
pH2 = po exp
[∆rG(T o)
RT
](6.34)
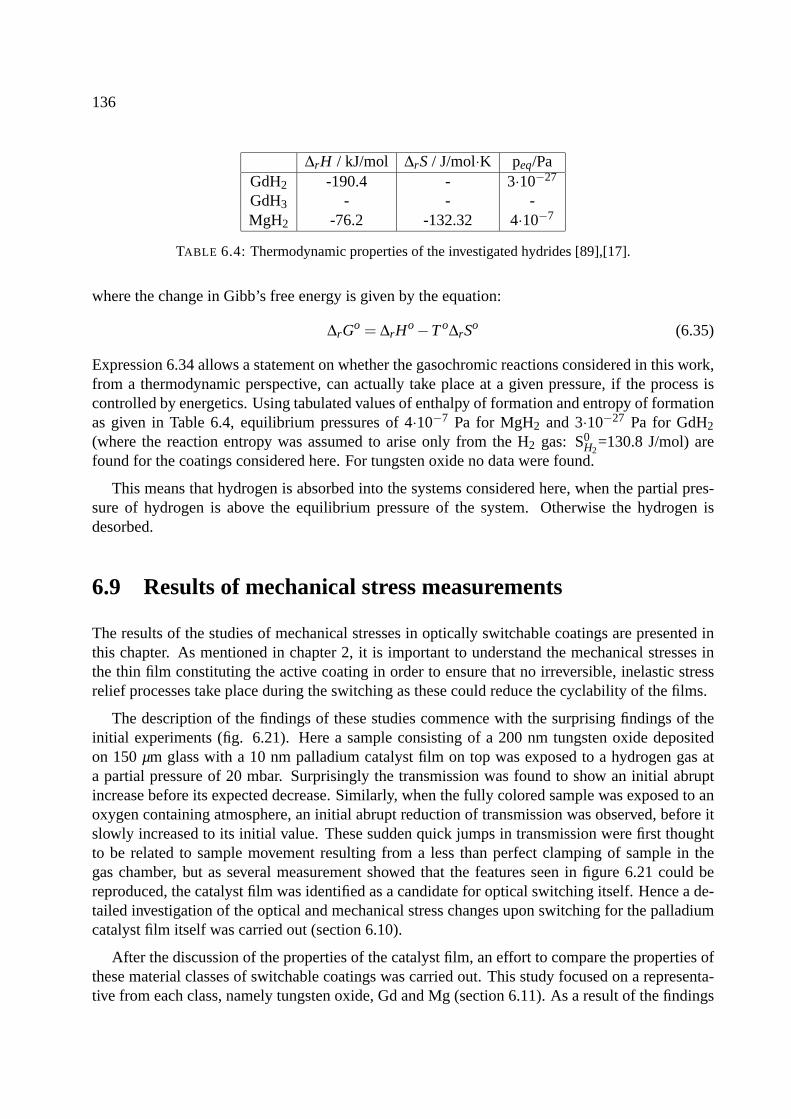
136
∆rH / kJ/mol ∆rS / J/mol·K peq/PaGdH2 -190.4 - 3·10−27
GdH3 - - -MgH2 -76.2 -132.32 4·10−7
TABLE 6.4: Thermodynamic properties of the investigated hydrides [89],[17].
where the change in Gibb’s free energy is given by the equation:
∆rGo = ∆rH
o −T o∆rSo (6.35)
Expression 6.34 allows a statement on whether the gasochromic reactions considered in this work,from a thermodynamic perspective, can actually take place at a given pressure, if the process iscontrolled by energetics. Using tabulated values of enthalpy of formation and entropy of formationas given in Table 6.4, equilibrium pressures of 4·10−7 Pa for MgH2 and 3·10−27 Pa for GdH2
(where the reaction entropy was assumed to arise only from the H2 gas: S0H2
=130.8 J/mol) arefound for the coatings considered here. For tungsten oxide no data were found.
This means that hydrogen is absorbed into the systems considered here, when the partial pres-sure of hydrogen is above the equilibrium pressure of the system. Otherwise the hydrogen isdesorbed.
6.9 Results of mechanical stress measurements
The results of the studies of mechanical stresses in optically switchable coatings are presented inthis chapter. As mentioned in chapter 2, it is important to understand the mechanical stresses inthe thin film constituting the active coating in order to ensure that no irreversible, inelastic stressrelief processes take place during the switching as these could reduce the cyclability of the films.
The description of the findings of these studies commence with the surprising findings of theinitial experiments (fig. 6.21). Here a sample consisting of a 200 nm tungsten oxide depositedon 150 µm glass with a 10 nm palladium catalyst film on top was exposed to a hydrogen gas ata partial pressure of 20 mbar. Surprisingly the transmission was found to show an initial abruptincrease before its expected decrease. Similarly, when the fully colored sample was exposed to anoxygen containing atmosphere, an initial abrupt reduction of transmission was observed, before itslowly increased to its initial value. These sudden quick jumps in transmission were first thoughtto be related to sample movement resulting from a less than perfect clamping of sample in thegas chamber, but as several measurement showed that the features seen in figure 6.21 could bereproduced, the catalyst film was identified as a candidate for optical switching itself. Hence a de-tailed investigation of the optical and mechanical stress changes upon switching for the palladiumcatalyst film itself was carried out (section 6.10).
After the discussion of the properties of the catalyst film, an effort to compare the properties ofthese material classes of switchable coatings was carried out. This study focused on a representa-tive from each class, namely tungsten oxide, Gd and Mg (section 6.11). As a result of the findings
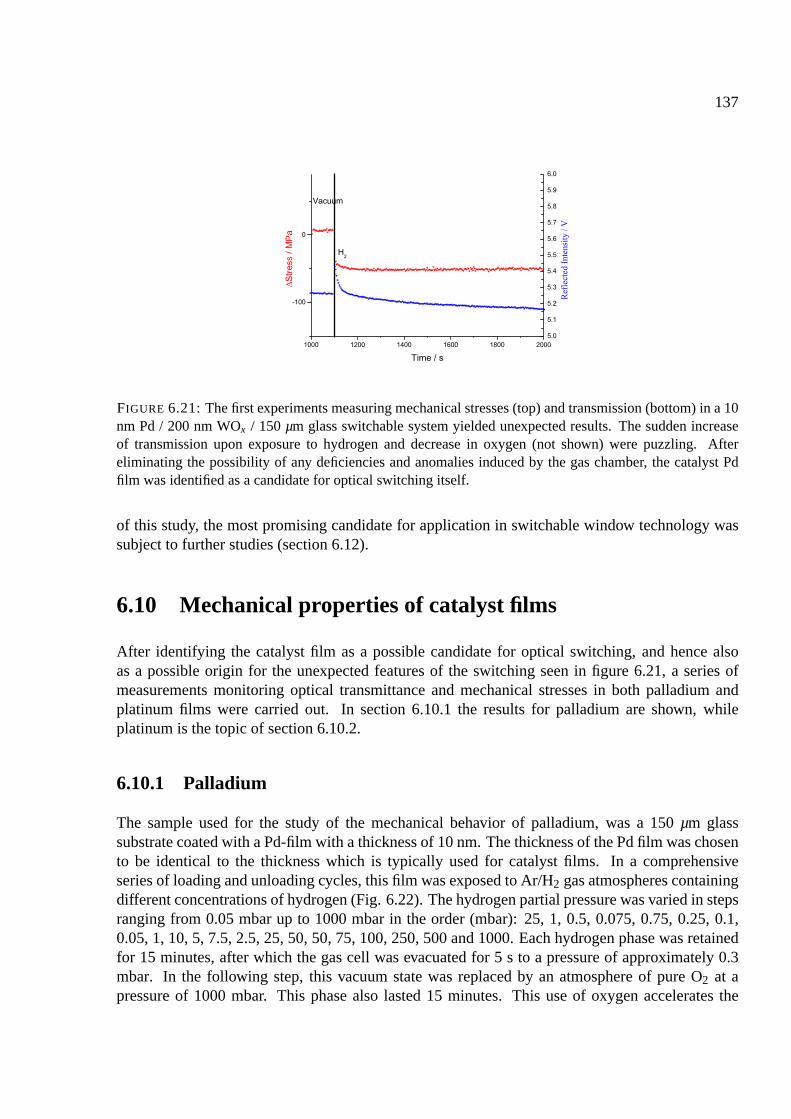
137
FIGURE 6.21: The first experiments measuring mechanical stresses (top) and transmission (bottom) in a 10nm Pd / 200 nm WOx / 150 µm glass switchable system yielded unexpected results. The sudden increaseof transmission upon exposure to hydrogen and decrease in oxygen (not shown) were puzzling. Aftereliminating the possibility of any deficiencies and anomalies induced by the gas chamber, the catalyst Pdfilm was identified as a candidate for optical switching itself.
of this study, the most promising candidate for application in switchable window technology wassubject to further studies (section 6.12).
6.10 Mechanical properties of catalyst films
After identifying the catalyst film as a possible candidate for optical switching, and hence alsoas a possible origin for the unexpected features of the switching seen in figure 6.21, a series ofmeasurements monitoring optical transmittance and mechanical stresses in both palladium andplatinum films were carried out. In section 6.10.1 the results for palladium are shown, whileplatinum is the topic of section 6.10.2.
6.10.1 Palladium
The sample used for the study of the mechanical behavior of palladium, was a 150 µm glasssubstrate coated with a Pd-film with a thickness of 10 nm. The thickness of the Pd film was chosento be identical to the thickness which is typically used for catalyst films. In a comprehensiveseries of loading and unloading cycles, this film was exposed to Ar/H2 gas atmospheres containingdifferent concentrations of hydrogen (Fig. 6.22). The hydrogen partial pressure was varied in stepsranging from 0.05 mbar up to 1000 mbar in the order (mbar): 25, 1, 0.5, 0.075, 0.75, 0.25, 0.1,0.05, 1, 10, 5, 7.5, 2.5, 25, 50, 50, 75, 100, 250, 500 and 1000. Each hydrogen phase was retainedfor 15 minutes, after which the gas cell was evacuated for 5 s to a pressure of approximately 0.3mbar. In the following step, this vacuum state was replaced by an atmosphere of pure O2 at apressure of 1000 mbar. This phase also lasted 15 minutes. This use of oxygen accelerates the
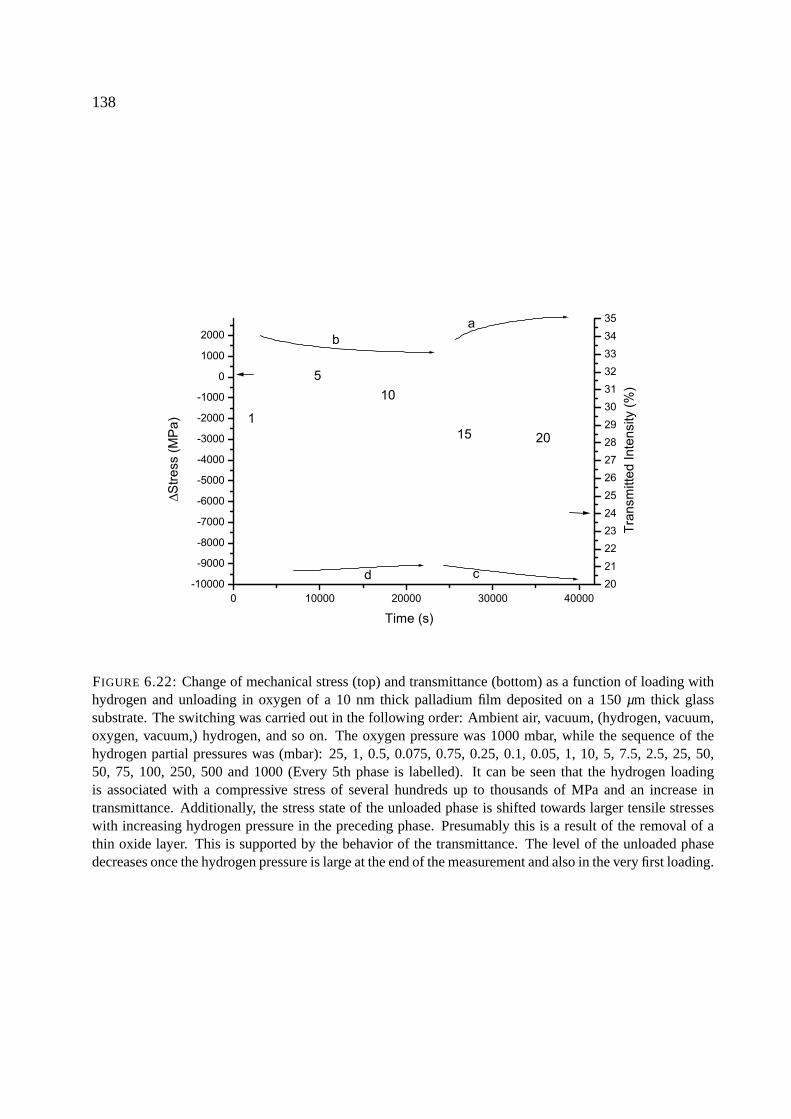
138
FIGURE 6.22: Change of mechanical stress (top) and transmittance (bottom) as a function of loading withhydrogen and unloading in oxygen of a 10 nm thick palladium film deposited on a 150 µm thick glasssubstrate. The switching was carried out in the following order: Ambient air, vacuum, (hydrogen, vacuum,oxygen, vacuum,) hydrogen, and so on. The oxygen pressure was 1000 mbar, while the sequence of thehydrogen partial pressures was (mbar): 25, 1, 0.5, 0.075, 0.75, 0.25, 0.1, 0.05, 1, 10, 5, 7.5, 2.5, 25, 50,50, 75, 100, 250, 500 and 1000 (Every 5th phase is labelled). It can be seen that the hydrogen loadingis associated with a compressive stress of several hundreds up to thousands of MPa and an increase intransmittance. Additionally, the stress state of the unloaded phase is shifted towards larger tensile stresseswith increasing hydrogen pressure in the preceding phase. Presumably this is a result of the removal of athin oxide layer. This is supported by the behavior of the transmittance. The level of the unloaded phasedecreases once the hydrogen pressure is large at the end of the measurement and also in the very first loading.
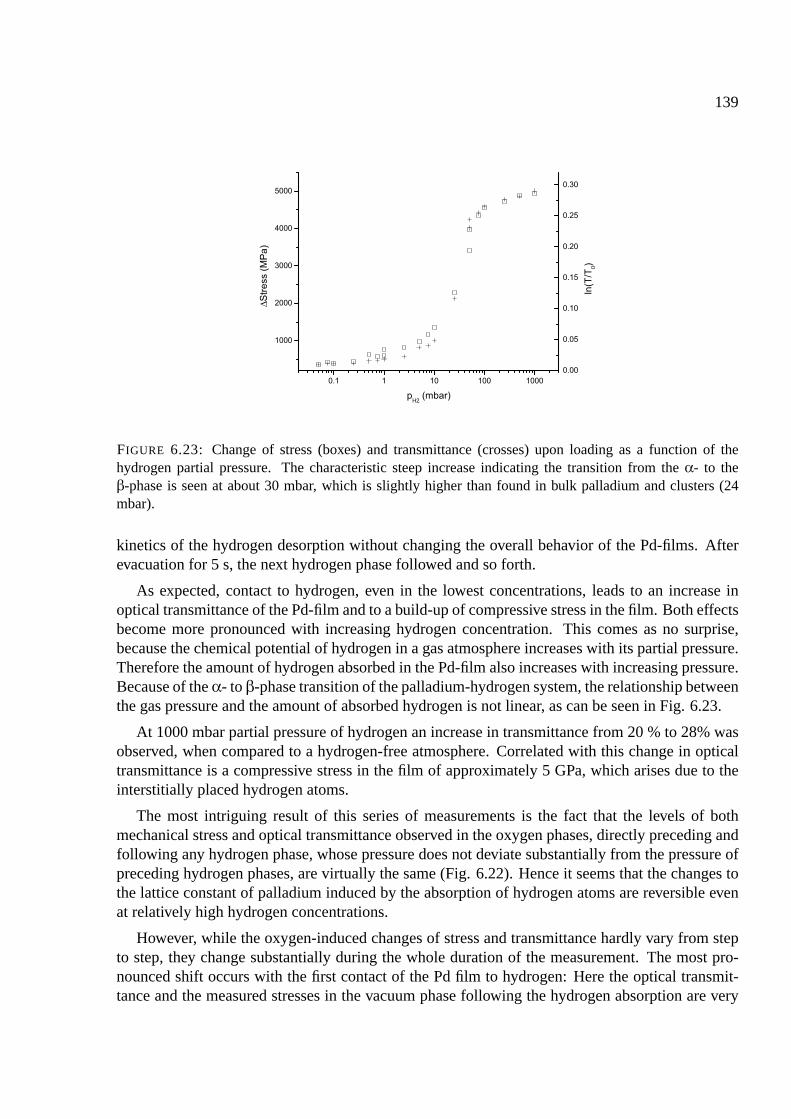
139
FIGURE 6.23: Change of stress (boxes) and transmittance (crosses) upon loading as a function of thehydrogen partial pressure. The characteristic steep increase indicating the transition from the α- to theβ-phase is seen at about 30 mbar, which is slightly higher than found in bulk palladium and clusters (24mbar).
kinetics of the hydrogen desorption without changing the overall behavior of the Pd-films. Afterevacuation for 5 s, the next hydrogen phase followed and so forth.
As expected, contact to hydrogen, even in the lowest concentrations, leads to an increase inoptical transmittance of the Pd-film and to a build-up of compressive stress in the film. Both effectsbecome more pronounced with increasing hydrogen concentration. This comes as no surprise,because the chemical potential of hydrogen in a gas atmosphere increases with its partial pressure.Therefore the amount of hydrogen absorbed in the Pd-film also increases with increasing pressure.Because of the α- to β-phase transition of the palladium-hydrogen system, the relationship betweenthe gas pressure and the amount of absorbed hydrogen is not linear, as can be seen in Fig. 6.23.
At 1000 mbar partial pressure of hydrogen an increase in transmittance from 20 % to 28% wasobserved, when compared to a hydrogen-free atmosphere. Correlated with this change in opticaltransmittance is a compressive stress in the film of approximately 5 GPa, which arises due to theinterstitially placed hydrogen atoms.
The most intriguing result of this series of measurements is the fact that the levels of bothmechanical stress and optical transmittance observed in the oxygen phases, directly preceding andfollowing any hydrogen phase, whose pressure does not deviate substantially from the pressure ofpreceding hydrogen phases, are virtually the same (Fig. 6.22). Hence it seems that the changes tothe lattice constant of palladium induced by the absorption of hydrogen atoms are reversible evenat relatively high hydrogen concentrations.
However, while the oxygen-induced changes of stress and transmittance hardly vary from stepto step, they change substantially during the whole duration of the measurement. The most pro-nounced shift occurs with the first contact of the Pd film to hydrogen: Here the optical transmit-tance and the measured stresses in the vacuum phase following the hydrogen absorption are very
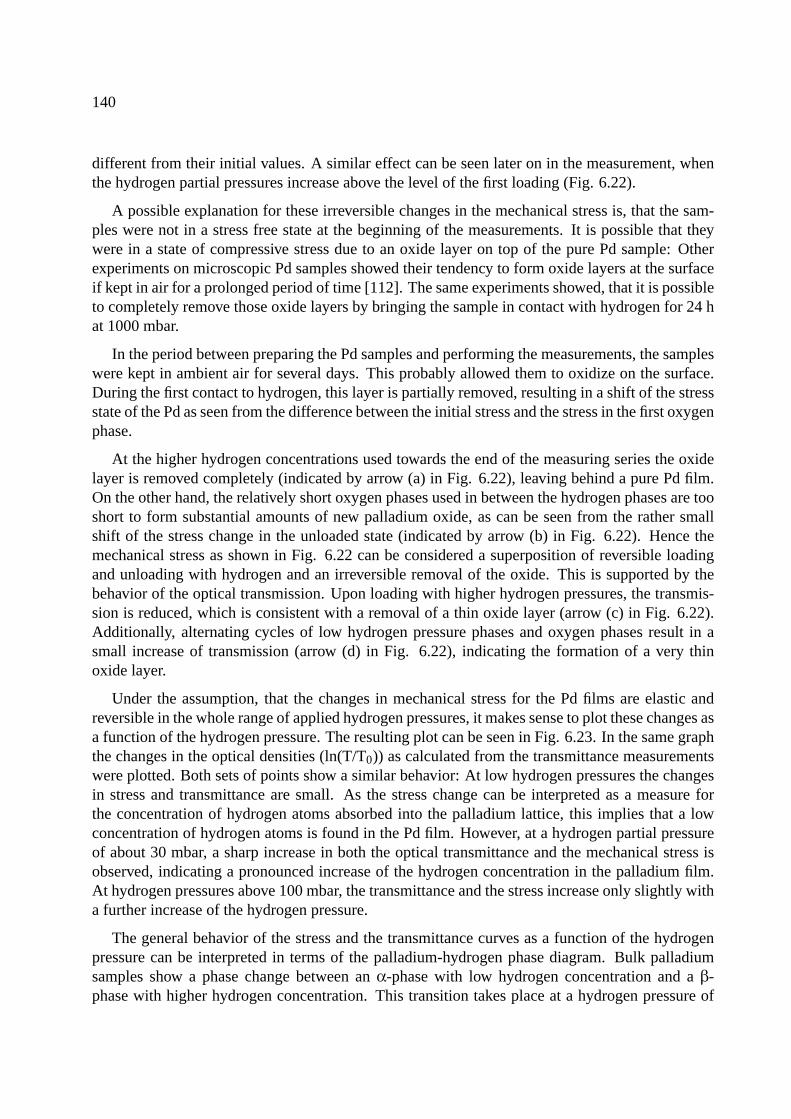
140
different from their initial values. A similar effect can be seen later on in the measurement, whenthe hydrogen partial pressures increase above the level of the first loading (Fig. 6.22).
A possible explanation for these irreversible changes in the mechanical stress is, that the sam-ples were not in a stress free state at the beginning of the measurements. It is possible that theywere in a state of compressive stress due to an oxide layer on top of the pure Pd sample: Otherexperiments on microscopic Pd samples showed their tendency to form oxide layers at the surfaceif kept in air for a prolonged period of time [112]. The same experiments showed, that it is possibleto completely remove those oxide layers by bringing the sample in contact with hydrogen for 24 hat 1000 mbar.
In the period between preparing the Pd samples and performing the measurements, the sampleswere kept in ambient air for several days. This probably allowed them to oxidize on the surface.During the first contact to hydrogen, this layer is partially removed, resulting in a shift of the stressstate of the Pd as seen from the difference between the initial stress and the stress in the first oxygenphase.
At the higher hydrogen concentrations used towards the end of the measuring series the oxidelayer is removed completely (indicated by arrow (a) in Fig. 6.22), leaving behind a pure Pd film.On the other hand, the relatively short oxygen phases used in between the hydrogen phases are tooshort to form substantial amounts of new palladium oxide, as can be seen from the rather smallshift of the stress change in the unloaded state (indicated by arrow (b) in Fig. 6.22). Hence themechanical stress as shown in Fig. 6.22 can be considered a superposition of reversible loadingand unloading with hydrogen and an irreversible removal of the oxide. This is supported by thebehavior of the optical transmission. Upon loading with higher hydrogen pressures, the transmis-sion is reduced, which is consistent with a removal of a thin oxide layer (arrow (c) in Fig. 6.22).Additionally, alternating cycles of low hydrogen pressure phases and oxygen phases result in asmall increase of transmission (arrow (d) in Fig. 6.22), indicating the formation of a very thinoxide layer.
Under the assumption, that the changes in mechanical stress for the Pd films are elastic andreversible in the whole range of applied hydrogen pressures, it makes sense to plot these changes asa function of the hydrogen pressure. The resulting plot can be seen in Fig. 6.23. In the same graphthe changes in the optical densities (ln(T/T0)) as calculated from the transmittance measurementswere plotted. Both sets of points show a similar behavior: At low hydrogen pressures the changesin stress and transmittance are small. As the stress change can be interpreted as a measure forthe concentration of hydrogen atoms absorbed into the palladium lattice, this implies that a lowconcentration of hydrogen atoms is found in the Pd film. However, at a hydrogen partial pressureof about 30 mbar, a sharp increase in both the optical transmittance and the mechanical stress isobserved, indicating a pronounced increase of the hydrogen concentration in the palladium film.At hydrogen pressures above 100 mbar, the transmittance and the stress increase only slightly witha further increase of the hydrogen pressure.
The general behavior of the stress and the transmittance curves as a function of the hydrogenpressure can be interpreted in terms of the palladium-hydrogen phase diagram. Bulk palladiumsamples show a phase change between an α-phase with low hydrogen concentration and a β-phase with higher hydrogen concentration. This transition takes place at a hydrogen pressure of
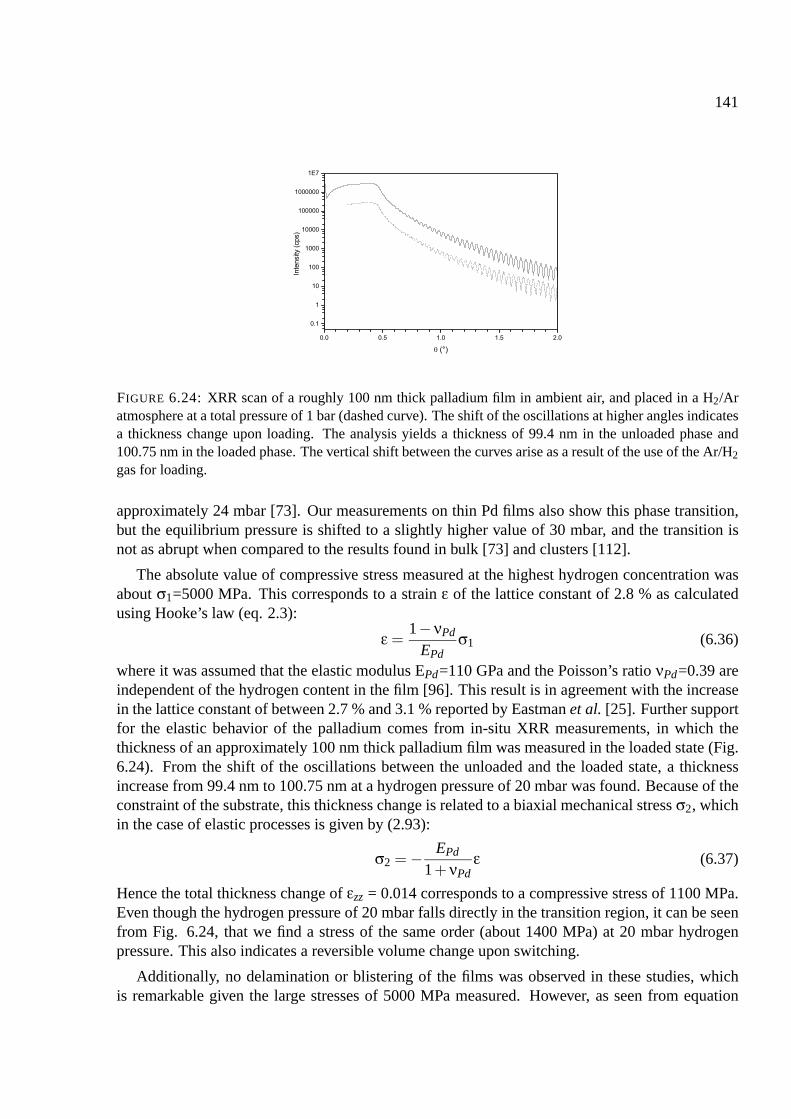
141
FIGURE 6.24: XRR scan of a roughly 100 nm thick palladium film in ambient air, and placed in a H2/Aratmosphere at a total pressure of 1 bar (dashed curve). The shift of the oscillations at higher angles indicatesa thickness change upon loading. The analysis yields a thickness of 99.4 nm in the unloaded phase and100.75 nm in the loaded phase. The vertical shift between the curves arise as a result of the use of the Ar/H2
gas for loading.
approximately 24 mbar [73]. Our measurements on thin Pd films also show this phase transition,but the equilibrium pressure is shifted to a slightly higher value of 30 mbar, and the transition isnot as abrupt when compared to the results found in bulk [73] and clusters [112].
The absolute value of compressive stress measured at the highest hydrogen concentration wasabout σ1=5000 MPa. This corresponds to a strain ε of the lattice constant of 2.8 % as calculatedusing Hooke’s law (eq. 2.3):
ε =1−νPd
EPdσ1 (6.36)
where it was assumed that the elastic modulus EPd=110 GPa and the Poisson’s ratio νPd=0.39 areindependent of the hydrogen content in the film [96]. This result is in agreement with the increasein the lattice constant of between 2.7 % and 3.1 % reported by Eastman et al. [25]. Further supportfor the elastic behavior of the palladium comes from in-situ XRR measurements, in which thethickness of an approximately 100 nm thick palladium film was measured in the loaded state (Fig.6.24). From the shift of the oscillations between the unloaded and the loaded state, a thicknessincrease from 99.4 nm to 100.75 nm at a hydrogen pressure of 20 mbar was found. Because of theconstraint of the substrate, this thickness change is related to a biaxial mechanical stress σ2, whichin the case of elastic processes is given by (2.93):
σ2 = − EPd
1+νPdε (6.37)
Hence the total thickness change of εzz = 0.014 corresponds to a compressive stress of 1100 MPa.Even though the hydrogen pressure of 20 mbar falls directly in the transition region, it can be seenfrom Fig. 6.24, that we find a stress of the same order (about 1400 MPa) at 20 mbar hydrogenpressure. This also indicates a reversible volume change upon switching.
Additionally, no delamination or blistering of the films was observed in these studies, whichis remarkable given the large stresses of 5000 MPa measured. However, as seen from equation
142
FIGURE 6.25: The optical and mechanical properties of an 8 nm platinum catalyst film on a 150 µm glasssubstrate as a function of the hydrogen loading and unloading. The transmission change (top) is of the orderof 1 %, while the stress change (bottom) is about 200 MPa at a hydrogen partial pressure of 4.0 bar. Theswitching is observed to be reversible.
2.102, delamination and cracking is closely related to the thickness of the film. The very thin filmsstudied here (10 nm) are hence not as prone to crack as thicker films. Other explanations for thedelamination that was been observed by others [95] could be related to the adhesion of the filmsand the cleaning of the substrates.
6.10.2 Platinum
As an alternative to Pd as a catalyst, platinum is a candidate. As mentioned in chapter 6, littleinformation is available on the properties of the Pt-H system. Hence the criteria important for acatalyst film for the application in stress measurements were investigated directly. An 8 nm thickPt film on a 150 µm glass substrate was produced at the facilities of Interpane E&B [52]. It alloweda preliminary and at the same time conclusive study of the optical and mechanical properties of Ptwhen exposed to hydrogen.
In fig. 6.25 the results of the study are shown. After evacuation of the gas chamber to a pressureof approximately 0.3 mbar, the Pt film was exposed to a hydrogen partial pressure of 4.0 bar fora period of 3 min. Subsequently, the chamber was again evacuated before being flooded withhydrogen again. It is seen that the transmittance change associated with the exposure to hydrogenis of the order of 1 %. Simultaneously a change of mechanical stress of 200 MPa is found. Duringthe following evacuation, the transmittance returns to its initial value as does the mechanical stress.The subsequent switching cycles show similar reversible behavior.
It is important to notice that the direction of the transmittance shift in the Pt film upon loadingwith hydrogen is the same as the one expected for tungsten oxide. Hence the platinum film work

143
with the tungsten oxide film, in contrast to the example of the palladium film where the change oftransmission works in opposite direction of the transmittance change of the tungsten oxide film.The use of platinum will thus help increase the contrast ratio that can be achieved in switchablewindow systems.
For the application in mechanical stress measurements, it is however even more important, thatthe stress change induced by the hydrogen loading is only 200 MPa at a hydrogen partial pressureof 4.0 bar as opposed to the 5000 MPa found for Pd at a similar hydrogen partial pressure. Thecontribution of the catalyst layer is in fact super-positioned in relation to its thickness onto thecontribution of the real active tungsten oxide film (or other optically switchable coatings), whenthe mechanical stress is measured. The reduction of stress in the catalyst film that is achieved byusing Pt instead of Pd, means that when the ratio of film thickness to catalyst film thickness is 20:1,the stress contribution of the catalyst layer is only a mere 10 MPa in the case of platinum at thehydrogen partial pressure of 4 bar. In contrast, for palladium the contribution depends dramaticallyon the hydrogen partial pressure as seen in section 6.10.1. However at a similar hydrogen pressureof 4.0 bar, the contribution the total stress is about 250 MPa.
It should be noted though, that in a situation where the partial pressures is kept so low that Pdremains in its α-phase, the stress contribution would be just 50 MPa for a 20:1 thickness relationbetween the active film and the catalyst film. However, as an additional complication, the precisevalue of the contribution from the Pd film, depends on the kinetics of switching for the catalyst film.Hence, it is extremely hard to calculate the exact change of stress in the active film by subtractingthe catalyst contribution. As a consequence it is extremely helpful, that the contribution to the totalstress from the Pt film can be neglected, once the ratio of film thickness to catalyst film thicknessis above 20.
6.11 Comparison of different switchable films
In this section, the results of a study of the mechanical properties of optically switchable coatingsfrom three material classes are found. WOx, Gd and Mg were subjected to hydrogen loading andunloading.
6.11.1 Tungsten oxide
In Fig. 6.26 the mechanical stress (top portion) and transmittance (lower portion) of a 100 nmWOx film covered by a 10 nm Pd catalyst film deposited on 150 µm are shown. During the firstcoloration, which is done by exposing the sample to a gas atmosphere consisting of 2% H2 inargon at a total pressure of 0.6 bar, the transmittance is reduced from 36% to 30% within a fewminutes. Simultaneously, the stress change reaches a minimum value of -65 MPa, which remainsconstant once the transmission reaches its constant value. During the following first bleachingperformed under the exposure to ambient air, both the transmittance and the stress change returnto their initial values. Subsequent switching cycles show the same behavior suggesting that theprocesses involved in the switching of WOx are reversible and elastic.
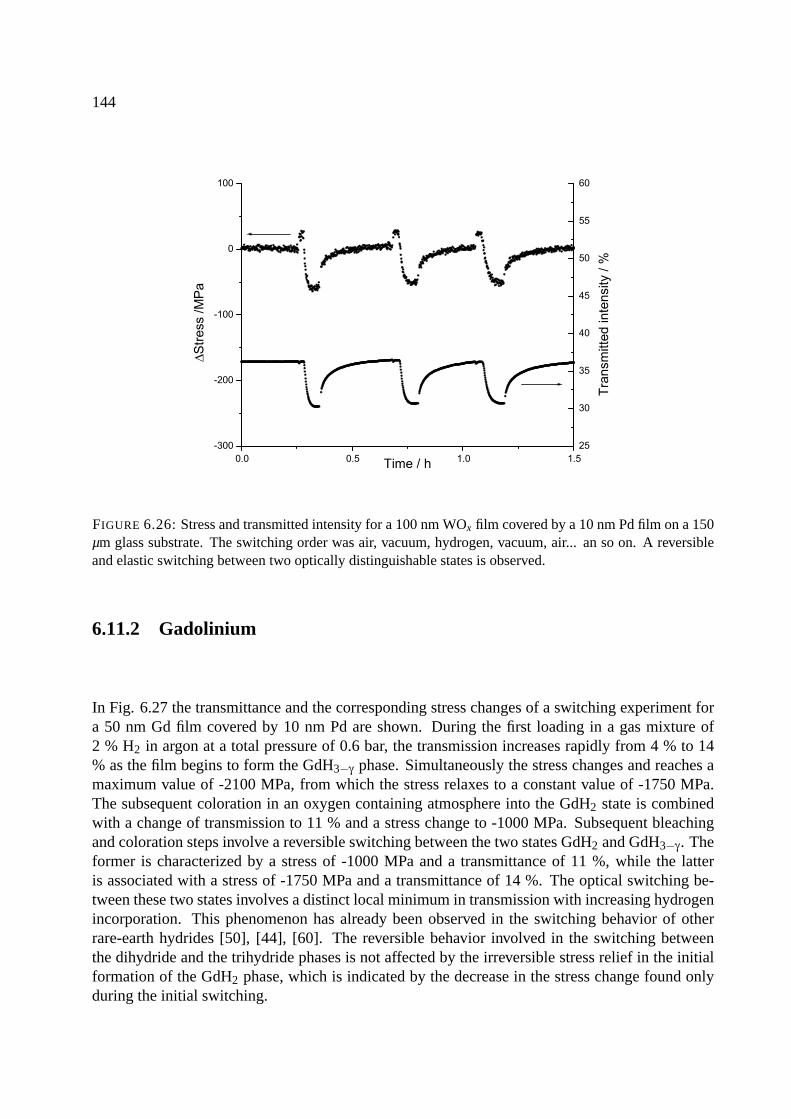
144
FIGURE 6.26: Stress and transmitted intensity for a 100 nm WOx film covered by a 10 nm Pd film on a 150µm glass substrate. The switching order was air, vacuum, hydrogen, vacuum, air... an so on. A reversibleand elastic switching between two optically distinguishable states is observed.
6.11.2 Gadolinium
In Fig. 6.27 the transmittance and the corresponding stress changes of a switching experiment fora 50 nm Gd film covered by 10 nm Pd are shown. During the first loading in a gas mixture of2 % H2 in argon at a total pressure of 0.6 bar, the transmission increases rapidly from 4 % to 14% as the film begins to form the GdH3−γ phase. Simultaneously the stress changes and reaches amaximum value of -2100 MPa, from which the stress relaxes to a constant value of -1750 MPa.The subsequent coloration in an oxygen containing atmosphere into the GdH2 state is combinedwith a change of transmission to 11 % and a stress change to -1000 MPa. Subsequent bleachingand coloration steps involve a reversible switching between the two states GdH2 and GdH3−γ. Theformer is characterized by a stress of -1000 MPa and a transmittance of 11 %, while the latteris associated with a stress of -1750 MPa and a transmittance of 14 %. The optical switching be-tween these two states involves a distinct local minimum in transmission with increasing hydrogenincorporation. This phenomenon has already been observed in the switching behavior of otherrare-earth hydrides [50], [44], [60]. The reversible behavior involved in the switching betweenthe dihydride and the trihydride phases is not affected by the irreversible stress relief in the initialformation of the GdH2 phase, which is indicated by the decrease in the stress change found onlyduring the initial switching.
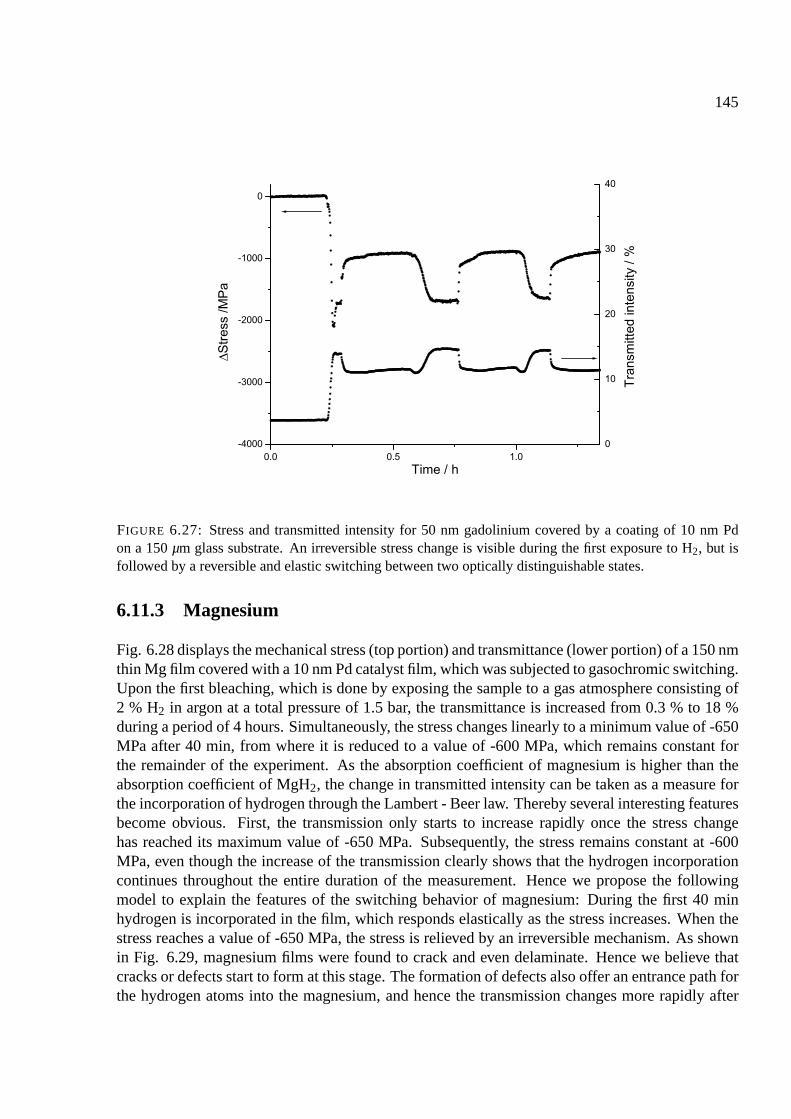
145
FIGURE 6.27: Stress and transmitted intensity for 50 nm gadolinium covered by a coating of 10 nm Pdon a 150 µm glass substrate. An irreversible stress change is visible during the first exposure to H2, but isfollowed by a reversible and elastic switching between two optically distinguishable states.
6.11.3 Magnesium
Fig. 6.28 displays the mechanical stress (top portion) and transmittance (lower portion) of a 150 nmthin Mg film covered with a 10 nm Pd catalyst film, which was subjected to gasochromic switching.Upon the first bleaching, which is done by exposing the sample to a gas atmosphere consisting of2 % H2 in argon at a total pressure of 1.5 bar, the transmittance is increased from 0.3 % to 18 %during a period of 4 hours. Simultaneously, the stress changes linearly to a minimum value of -650MPa after 40 min, from where it is reduced to a value of -600 MPa, which remains constant forthe remainder of the experiment. As the absorption coefficient of magnesium is higher than theabsorption coefficient of MgH2, the change in transmitted intensity can be taken as a measure forthe incorporation of hydrogen through the Lambert - Beer law. Thereby several interesting featuresbecome obvious. First, the transmission only starts to increase rapidly once the stress changehas reached its maximum value of -650 MPa. Subsequently, the stress remains constant at -600MPa, even though the increase of the transmission clearly shows that the hydrogen incorporationcontinues throughout the entire duration of the measurement. Hence we propose the followingmodel to explain the features of the switching behavior of magnesium: During the first 40 minhydrogen is incorporated in the film, which responds elastically as the stress increases. When thestress reaches a value of -650 MPa, the stress is relieved by an irreversible mechanism. As shownin Fig. 6.29, magnesium films were found to crack and even delaminate. Hence we believe thatcracks or defects start to form at this stage. The formation of defects also offer an entrance path forthe hydrogen atoms into the magnesium, and hence the transmission changes more rapidly after
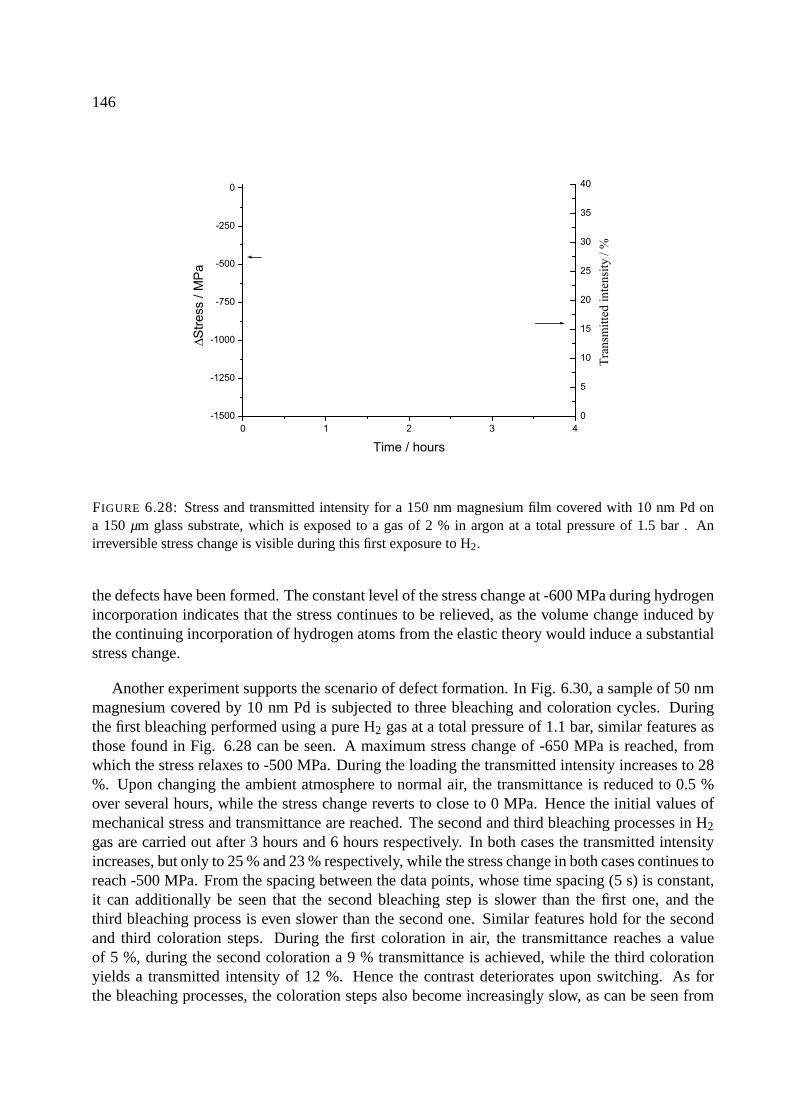
146
FIGURE 6.28: Stress and transmitted intensity for a 150 nm magnesium film covered with 10 nm Pd ona 150 µm glass substrate, which is exposed to a gas of 2 % in argon at a total pressure of 1.5 bar . Anirreversible stress change is visible during this first exposure to H2.
the defects have been formed. The constant level of the stress change at -600 MPa during hydrogenincorporation indicates that the stress continues to be relieved, as the volume change induced bythe continuing incorporation of hydrogen atoms from the elastic theory would induce a substantialstress change.
Another experiment supports the scenario of defect formation. In Fig. 6.30, a sample of 50 nmmagnesium covered by 10 nm Pd is subjected to three bleaching and coloration cycles. Duringthe first bleaching performed using a pure H2 gas at a total pressure of 1.1 bar, similar features asthose found in Fig. 6.28 can be seen. A maximum stress change of -650 MPa is reached, fromwhich the stress relaxes to -500 MPa. During the loading the transmitted intensity increases to 28%. Upon changing the ambient atmosphere to normal air, the transmittance is reduced to 0.5 %over several hours, while the stress change reverts to close to 0 MPa. Hence the initial values ofmechanical stress and transmittance are reached. The second and third bleaching processes in H2
gas are carried out after 3 hours and 6 hours respectively. In both cases the transmitted intensityincreases, but only to 25 % and 23 % respectively, while the stress change in both cases continues toreach -500 MPa. From the spacing between the data points, whose time spacing (5 s) is constant,it can additionally be seen that the second bleaching step is slower than the first one, and thethird bleaching process is even slower than the second one. Similar features hold for the secondand third coloration steps. During the first coloration in air, the transmittance reaches a valueof 5 %, during the second coloration a 9 % transmittance is achieved, while the third colorationyields a transmitted intensity of 12 %. Hence the contrast deteriorates upon switching. As forthe bleaching processes, the coloration steps also become increasingly slow, as can be seen from
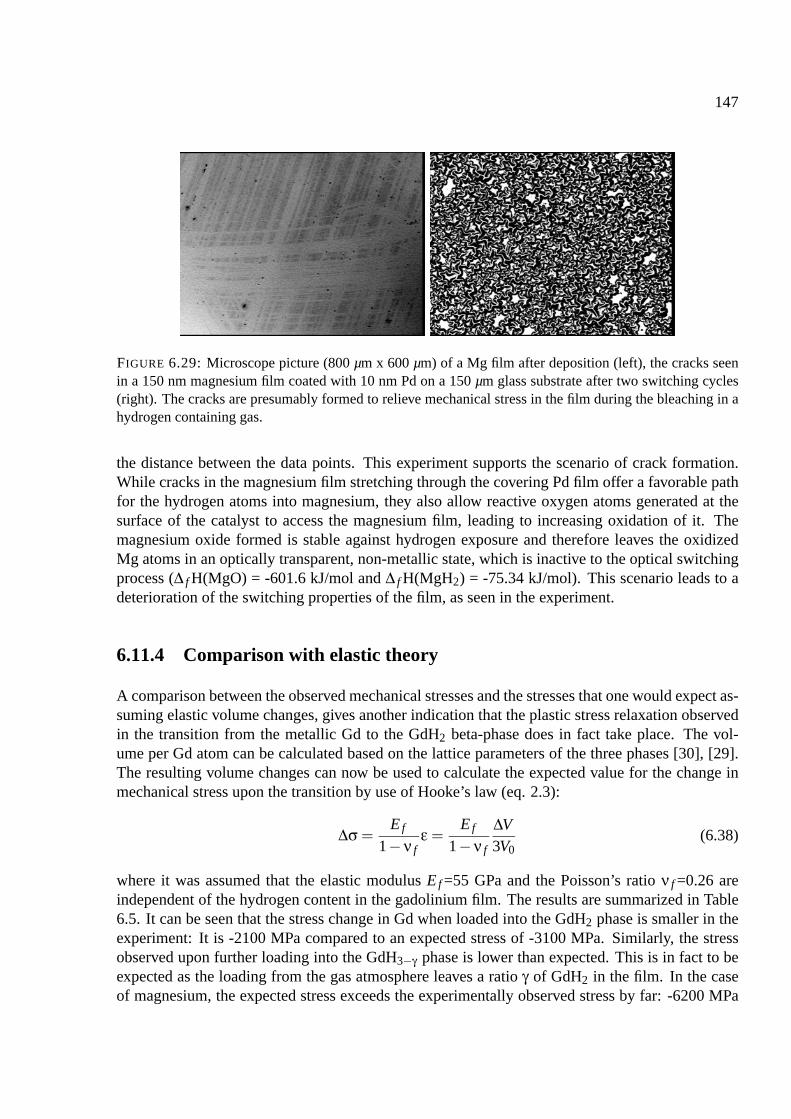
147
FIGURE 6.29: Microscope picture (800 µm x 600 µm) of a Mg film after deposition (left), the cracks seenin a 150 nm magnesium film coated with 10 nm Pd on a 150 µm glass substrate after two switching cycles(right). The cracks are presumably formed to relieve mechanical stress in the film during the bleaching in ahydrogen containing gas.
the distance between the data points. This experiment supports the scenario of crack formation.While cracks in the magnesium film stretching through the covering Pd film offer a favorable pathfor the hydrogen atoms into magnesium, they also allow reactive oxygen atoms generated at thesurface of the catalyst to access the magnesium film, leading to increasing oxidation of it. Themagnesium oxide formed is stable against hydrogen exposure and therefore leaves the oxidizedMg atoms in an optically transparent, non-metallic state, which is inactive to the optical switchingprocess (∆ f H(MgO) = -601.6 kJ/mol and ∆ f H(MgH2) = -75.34 kJ/mol). This scenario leads to adeterioration of the switching properties of the film, as seen in the experiment.
6.11.4 Comparison with elastic theory
A comparison between the observed mechanical stresses and the stresses that one would expect as-suming elastic volume changes, gives another indication that the plastic stress relaxation observedin the transition from the metallic Gd to the GdH2 beta-phase does in fact take place. The vol-ume per Gd atom can be calculated based on the lattice parameters of the three phases [30], [29].The resulting volume changes can now be used to calculate the expected value for the change inmechanical stress upon the transition by use of Hooke’s law (eq. 2.3):
∆σ =E f
1−ν fε =
E f
1−ν f
∆V3V0
(6.38)
where it was assumed that the elastic modulus E f =55 GPa and the Poisson’s ratio ν f =0.26 areindependent of the hydrogen content in the gadolinium film. The results are summarized in Table6.5. It can be seen that the stress change in Gd when loaded into the GdH2 phase is smaller in theexperiment: It is -2100 MPa compared to an expected stress of -3100 MPa. Similarly, the stressobserved upon further loading into the GdH3−γ phase is lower than expected. This is in fact to beexpected as the loading from the gas atmosphere leaves a ratio γ of GdH2 in the film. In the caseof magnesium, the expected stress exceeds the experimentally observed stress by far: -6200 MPa
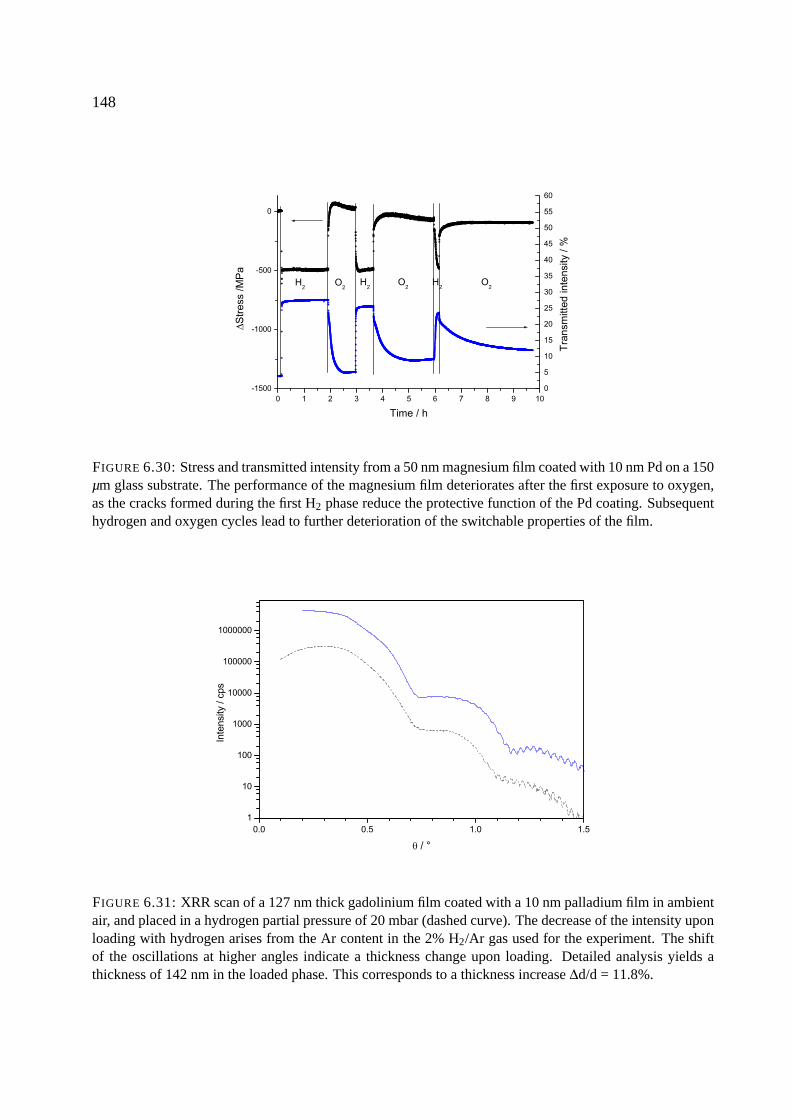
148
FIGURE 6.30: Stress and transmitted intensity from a 50 nm magnesium film coated with 10 nm Pd on a 150µm glass substrate. The performance of the magnesium film deteriorates after the first exposure to oxygen,as the cracks formed during the first H2 phase reduce the protective function of the Pd coating. Subsequenthydrogen and oxygen cycles lead to further deterioration of the switchable properties of the film.
FIGURE 6.31: XRR scan of a 127 nm thick gadolinium film coated with a 10 nm palladium film in ambientair, and placed in a hydrogen partial pressure of 20 mbar (dashed curve). The decrease of the intensity uponloading with hydrogen arises from the Ar content in the 2% H2/Ar gas used for the experiment. The shiftof the oscillations at higher angles indicate a thickness change upon loading. Detailed analysis yields athickness of 142 nm in the loaded phase. This corresponds to a thickness increase ∆d/d = 11.8%.
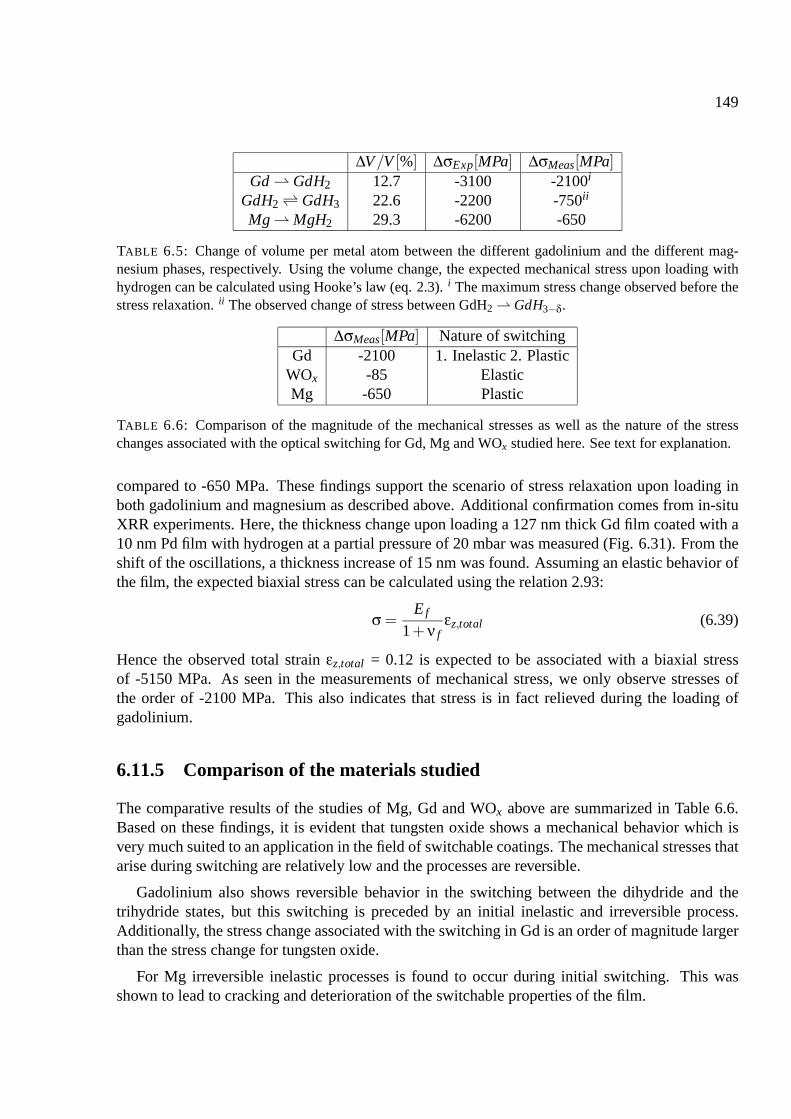
149
∆V/V [%] ∆σExp[MPa] ∆σMeas[MPa]Gd GdH2 12.7 -3100 -2100i
GdH2 GdH3 22.6 -2200 -750ii
Mg MgH2 29.3 -6200 -650
TABLE 6.5: Change of volume per metal atom between the different gadolinium and the different mag-nesium phases, respectively. Using the volume change, the expected mechanical stress upon loading withhydrogen can be calculated using Hooke’s law (eq. 2.3). i The maximum stress change observed before thestress relaxation. ii The observed change of stress between GdH2 GdH3−δ.
∆σMeas[MPa] Nature of switchingGd -2100 1. Inelastic 2. Plastic
WOx -85 ElasticMg -650 Plastic
TABLE 6.6: Comparison of the magnitude of the mechanical stresses as well as the nature of the stresschanges associated with the optical switching for Gd, Mg and WOx studied here. See text for explanation.
compared to -650 MPa. These findings support the scenario of stress relaxation upon loading inboth gadolinium and magnesium as described above. Additional confirmation comes from in-situXRR experiments. Here, the thickness change upon loading a 127 nm thick Gd film coated with a10 nm Pd film with hydrogen at a partial pressure of 20 mbar was measured (Fig. 6.31). From theshift of the oscillations, a thickness increase of 15 nm was found. Assuming an elastic behavior ofthe film, the expected biaxial stress can be calculated using the relation 2.93:
σ =E f
1+ν fεz,total (6.39)
Hence the observed total strain εz,total = 0.12 is expected to be associated with a biaxial stressof -5150 MPa. As seen in the measurements of mechanical stress, we only observe stresses ofthe order of -2100 MPa. This also indicates that stress is in fact relieved during the loading ofgadolinium.
6.11.5 Comparison of the materials studied
The comparative results of the studies of Mg, Gd and WOx above are summarized in Table 6.6.Based on these findings, it is evident that tungsten oxide shows a mechanical behavior which isvery much suited to an application in the field of switchable coatings. The mechanical stresses thatarise during switching are relatively low and the processes are reversible.
Gadolinium also shows reversible behavior in the switching between the dihydride and thetrihydride states, but this switching is preceded by an initial inelastic and irreversible process.Additionally, the stress change associated with the switching in Gd is an order of magnitude largerthan the stress change for tungsten oxide.
For Mg irreversible inelastic processes is found to occur during initial switching. This wasshown to lead to cracking and deterioration of the switchable properties of the film.

150
FIGURE 6.32: The change of transmission (top) and stress (bottom) upon switching in of a 8 nm Pt / 692nm WOx / 150 µm glass sample. The evacuation of the gas cell is associated with a large stress change eventhough no change of transmission is observed.
6.12 Detailed study of tungsten oxide
In the previous section it was shown, that when considering the applicability of the studied mate-rials in smart window technology from a perspective of mechanical stresses, WOx is the materialmost suited. Therefore further studies into the topic of stress in tungsten oxide were carried out.The results of these studies are presented in this section.
After the conclusive studies above, both regarding the choice of catalyst film and the choice ofthe active switchable film, a sample was produced courtesy of Interpane [52] consisting of 8 nm Pt/ 692 nm WOx / 150 µm glass.
This sample was subjected to switching cycles as presented above i.e. coloration in H2 andbleaching in O2 (fig. 6.32), which were made possible by the use of the purpose-built gas systemdescribed in section 3.3.2. An example of the results of initial experiments on this sample is shownin figure 6.32.
Interestingly, during the first phase of the measurement, significant stress changes are found inthe initial evacuation or vacuum phase. Starting from a value of 25 MPa in the preceding oxygenphase, a tensile change of stress of about 170 MPa in fact arises during the brief evacuation ofthe gas cell. The first coloration in hydrogen is associated with the expected change of stress toa value of -10 MPa. However, it is vastly unexpected that the subsequent vacuum phase again isassociated with a change of stress to 150 MPa, especially considering that the transmitted intensitydoes not change simultaneously. Indeed further cycles of hydrogen phases followed by vacuumphases show that this behavior is reversible (figure 6.33): In vacuum a stress change towards avalue of about 200 MPa is reached, while the hydrogen phases are associated with changes of
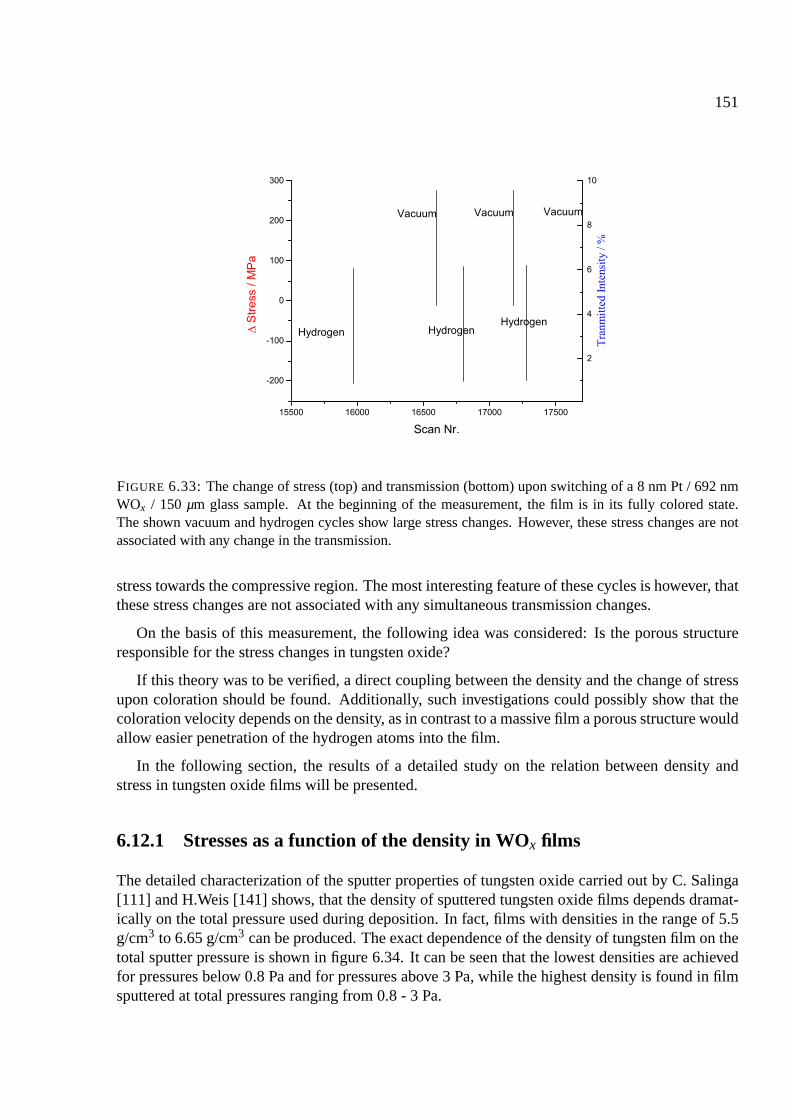
151
FIGURE 6.33: The change of stress (top) and transmission (bottom) upon switching of a 8 nm Pt / 692 nmWOx / 150 µm glass sample. At the beginning of the measurement, the film is in its fully colored state.The shown vacuum and hydrogen cycles show large stress changes. However, these stress changes are notassociated with any change in the transmission.
stress towards the compressive region. The most interesting feature of these cycles is however, thatthese stress changes are not associated with any simultaneous transmission changes.
On the basis of this measurement, the following idea was considered: Is the porous structureresponsible for the stress changes in tungsten oxide?
If this theory was to be verified, a direct coupling between the density and the change of stressupon coloration should be found. Additionally, such investigations could possibly show that thecoloration velocity depends on the density, as in contrast to a massive film a porous structure wouldallow easier penetration of the hydrogen atoms into the film.
In the following section, the results of a detailed study on the relation between density andstress in tungsten oxide films will be presented.
6.12.1 Stresses as a function of the density in WOx films
The detailed characterization of the sputter properties of tungsten oxide carried out by C. Salinga[111] and H.Weis [141] shows, that the density of sputtered tungsten oxide films depends dramat-ically on the total pressure used during deposition. In fact, films with densities in the range of 5.5g/cm3 to 6.65 g/cm3 can be produced. The exact dependence of the density of tungsten film on thetotal sputter pressure is shown in figure 6.34. It can be seen that the lowest densities are achievedfor pressures below 0.8 Pa and for pressures above 3 Pa, while the highest density is found in filmsputtered at total pressures ranging from 0.8 - 3 Pa.
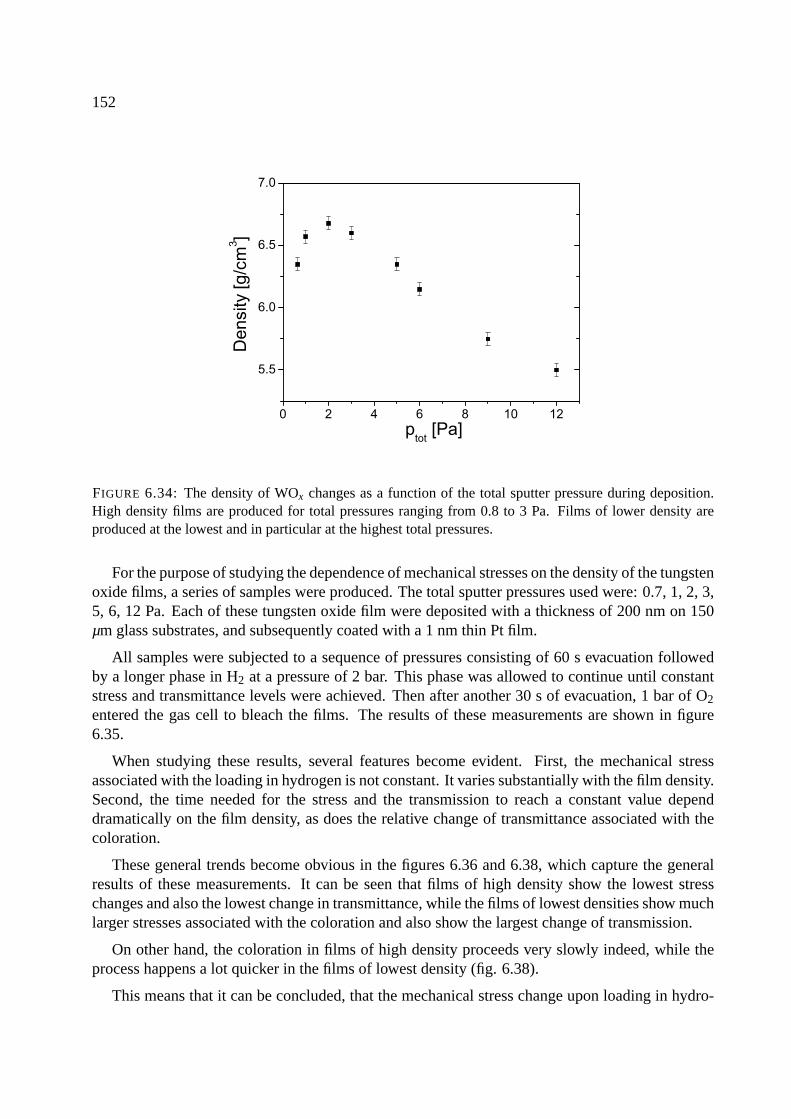
152
FIGURE 6.34: The density of WOx changes as a function of the total sputter pressure during deposition.High density films are produced for total pressures ranging from 0.8 to 3 Pa. Films of lower density areproduced at the lowest and in particular at the highest total pressures.
For the purpose of studying the dependence of mechanical stresses on the density of the tungstenoxide films, a series of samples were produced. The total sputter pressures used were: 0.7, 1, 2, 3,5, 6, 12 Pa. Each of these tungsten oxide film were deposited with a thickness of 200 nm on 150µm glass substrates, and subsequently coated with a 1 nm thin Pt film.
All samples were subjected to a sequence of pressures consisting of 60 s evacuation followedby a longer phase in H2 at a pressure of 2 bar. This phase was allowed to continue until constantstress and transmittance levels were achieved. Then after another 30 s of evacuation, 1 bar of O2
entered the gas cell to bleach the films. The results of these measurements are shown in figure6.35.
When studying these results, several features become evident. First, the mechanical stressassociated with the loading in hydrogen is not constant. It varies substantially with the film density.Second, the time needed for the stress and the transmission to reach a constant value dependdramatically on the film density, as does the relative change of transmittance associated with thecoloration.
These general trends become obvious in the figures 6.36 and 6.38, which capture the generalresults of these measurements. It can be seen that films of high density show the lowest stresschanges and also the lowest change in transmittance, while the films of lowest densities show muchlarger stresses associated with the coloration and also show the largest change of transmission.
On other hand, the coloration in films of high density proceeds very slowly indeed, while theprocess happens a lot quicker in the films of lowest density (fig. 6.38).
This means that it can be concluded, that the mechanical stress change upon loading in hydro-

153
FIGURE 6.35: The change of stress (top) and transmittance (bottom) upon exposure to an atmosphere of 2bar H2 for WOx films of varying density. a) 0.7 Pa, b) 1 Pa, c) 2 Pa, d) 3 Pa, e) 5 Pa, f) 6 Pa and g) 12 Pa.
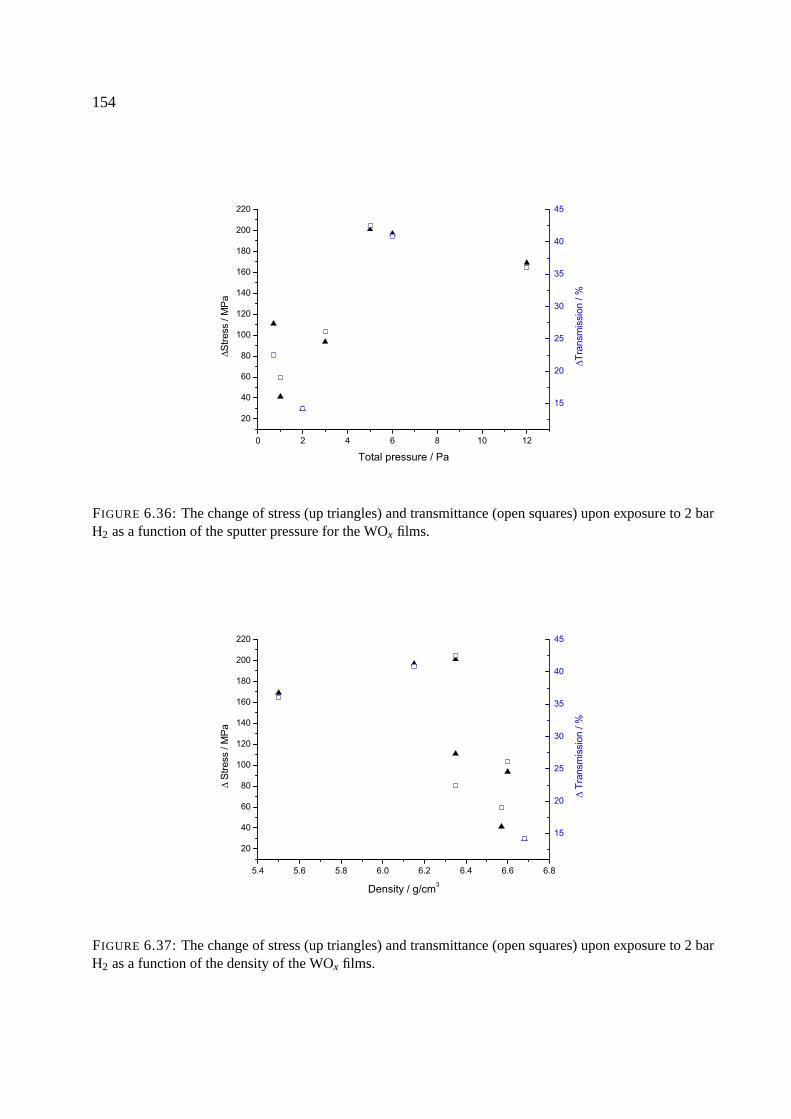
154
FIGURE 6.36: The change of stress (up triangles) and transmittance (open squares) upon exposure to 2 barH2 as a function of the sputter pressure for the WOx films.
FIGURE 6.37: The change of stress (up triangles) and transmittance (open squares) upon exposure to 2 barH2 as a function of the density of the WOx films.
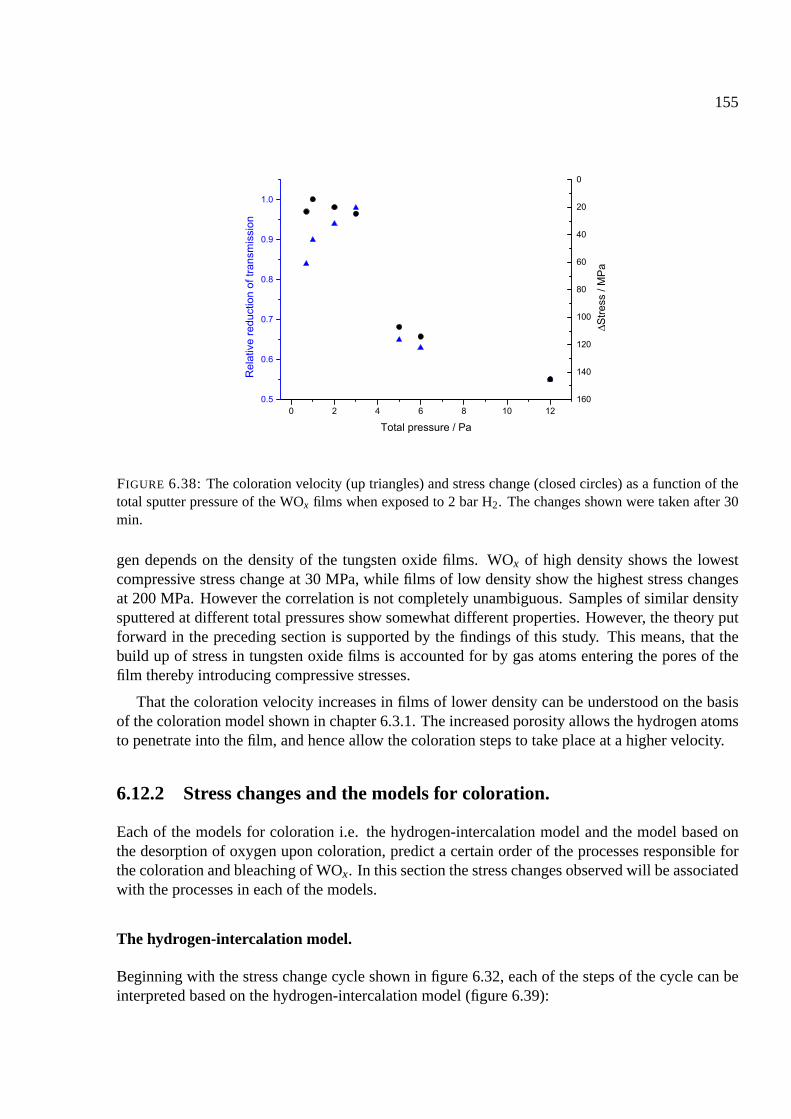
155
FIGURE 6.38: The coloration velocity (up triangles) and stress change (closed circles) as a function of thetotal sputter pressure of the WOx films when exposed to 2 bar H2. The changes shown were taken after 30min.
gen depends on the density of the tungsten oxide films. WOx of high density shows the lowestcompressive stress change at 30 MPa, while films of low density show the highest stress changesat 200 MPa. However the correlation is not completely unambiguous. Samples of similar densitysputtered at different total pressures show somewhat different properties. However, the theory putforward in the preceding section is supported by the findings of this study. This means, that thebuild up of stress in tungsten oxide films is accounted for by gas atoms entering the pores of thefilm thereby introducing compressive stresses.
That the coloration velocity increases in films of lower density can be understood on the basisof the coloration model shown in chapter 6.3.1. The increased porosity allows the hydrogen atomsto penetrate into the film, and hence allow the coloration steps to take place at a higher velocity.
6.12.2 Stress changes and the models for coloration.
Each of the models for coloration i.e. the hydrogen-intercalation model and the model based onthe desorption of oxygen upon coloration, predict a certain order of the processes responsible forthe coloration and bleaching of WOx. In this section the stress changes observed will be associatedwith the processes in each of the models.
The hydrogen-intercalation model.
Beginning with the stress change cycle shown in figure 6.32, each of the steps of the cycle can beinterpreted based on the hydrogen-intercalation model (figure 6.39):

156
FIGURE 6.39: The stress changes upon optical switching in WOx can be explained by the hydrogen-intercalation model, as indicated in the figure (see text for details).
• In the bleached state the pores are filled with H2O molecules.
• When exposing the sample to ”vacuum” conditions, the water molecules will be removedfrom the pores. This leads to a stress change towards tensile stresses.
• A subsequent exposure to a hydrogen gas leads to the filling of the pores with hydrogen,from where hydrogen atoms diffuse into the tungsten oxide film, where they form colorcenters. Both the filling of the pores and the diffusion of hydrogen into the film lead to astress change towards the compressive region.
• The next vacuum phase leads to the an evacuation of the pores. This results in a stress changetowards the tensile region. Associated with this evacuation no change of transmission changeis observed, meaning that the concentration of color centers remains constant in this phasei.e. no hydrogen is removed from the film, only from its pores.
• During the bleaching carried out in an oxygen atmosphere, oxygen atoms enter the pores.This leads to a stress change towards the compressive region. Additionally the hydrogenatoms from the films interior are removed into the pores to form water molecules which canslowly leave the pores. The removal of hydrogen atoms from the film is associated witha change of stress towards the tensile region; however this change might be balanced bythe stress change towards the compressive region associated with the formation of watermolecules. Any water molecules which might leave the pores would induce a change ofstress towards the tensile region. However, as the bleaching is associated with the fillingof the pores, a change of stress towards the compressive region, as it is observed, is readilyexpected.
Hence the direction of the stress changes observed in every step of the switching cycle can beexplained be the hydrogen intercalation model.
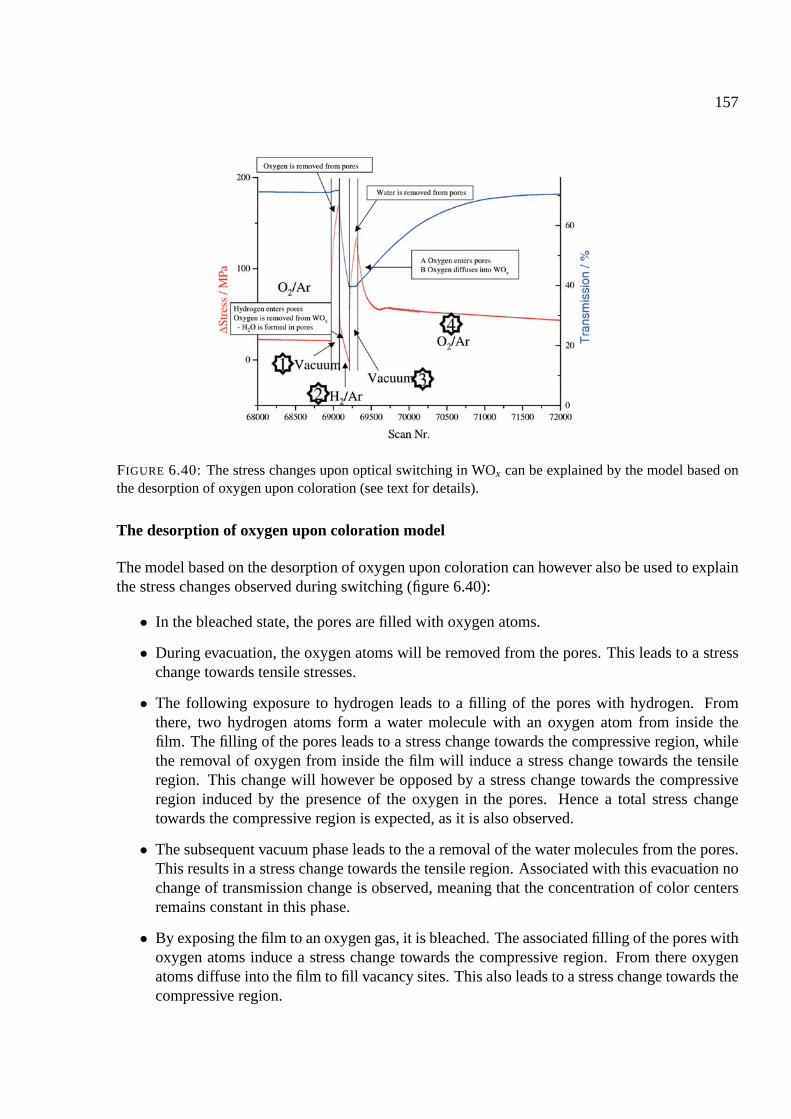
157
FIGURE 6.40: The stress changes upon optical switching in WOx can be explained by the model based onthe desorption of oxygen upon coloration (see text for details).
The desorption of oxygen upon coloration model
The model based on the desorption of oxygen upon coloration can however also be used to explainthe stress changes observed during switching (figure 6.40):
• In the bleached state, the pores are filled with oxygen atoms.
• During evacuation, the oxygen atoms will be removed from the pores. This leads to a stresschange towards tensile stresses.
• The following exposure to hydrogen leads to a filling of the pores with hydrogen. Fromthere, two hydrogen atoms form a water molecule with an oxygen atom from inside thefilm. The filling of the pores leads to a stress change towards the compressive region, whilethe removal of oxygen from inside the film will induce a stress change towards the tensileregion. This change will however be opposed by a stress change towards the compressiveregion induced by the presence of the oxygen in the pores. Hence a total stress changetowards the compressive region is expected, as it is also observed.
• The subsequent vacuum phase leads to the a removal of the water molecules from the pores.This results in a stress change towards the tensile region. Associated with this evacuation nochange of transmission change is observed, meaning that the concentration of color centersremains constant in this phase.
• By exposing the film to an oxygen gas, it is bleached. The associated filling of the pores withoxygen atoms induce a stress change towards the compressive region. From there oxygenatoms diffuse into the film to fill vacancy sites. This also leads to a stress change towards thecompressive region.
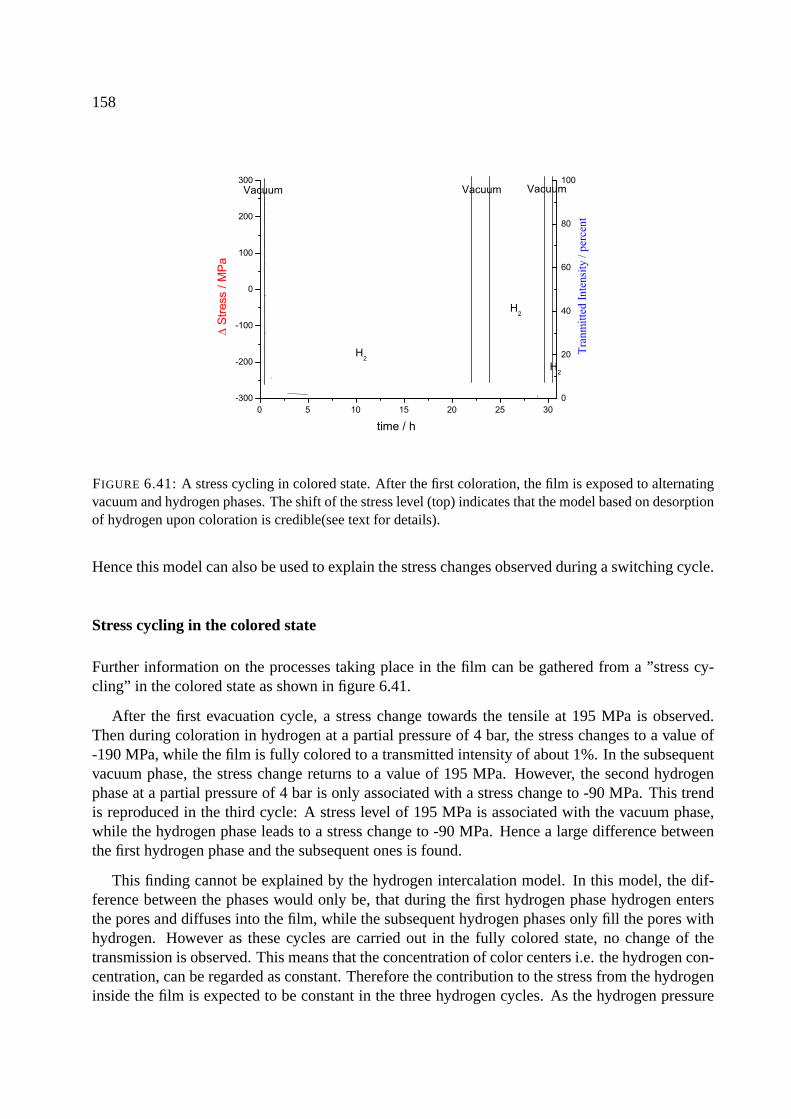
158
FIGURE 6.41: A stress cycling in colored state. After the first coloration, the film is exposed to alternatingvacuum and hydrogen phases. The shift of the stress level (top) indicates that the model based on desorptionof hydrogen upon coloration is credible(see text for details).
Hence this model can also be used to explain the stress changes observed during a switching cycle.
Stress cycling in the colored state
Further information on the processes taking place in the film can be gathered from a ”stress cy-cling” in the colored state as shown in figure 6.41.
After the first evacuation cycle, a stress change towards the tensile at 195 MPa is observed.Then during coloration in hydrogen at a partial pressure of 4 bar, the stress changes to a value of-190 MPa, while the film is fully colored to a transmitted intensity of about 1%. In the subsequentvacuum phase, the stress change returns to a value of 195 MPa. However, the second hydrogenphase at a partial pressure of 4 bar is only associated with a stress change to -90 MPa. This trendis reproduced in the third cycle: A stress level of 195 MPa is associated with the vacuum phase,while the hydrogen phase leads to a stress change to -90 MPa. Hence a large difference betweenthe first hydrogen phase and the subsequent ones is found.
This finding cannot be explained by the hydrogen intercalation model. In this model, the dif-ference between the phases would only be, that during the first hydrogen phase hydrogen entersthe pores and diffuses into the film, while the subsequent hydrogen phases only fill the pores withhydrogen. However as these cycles are carried out in the fully colored state, no change of thetransmission is observed. This means that the concentration of color centers i.e. the hydrogen con-centration, can be regarded as constant. Therefore the contribution to the stress from the hydrogeninside the film is expected to be constant in the three hydrogen cycles. As the hydrogen pressure
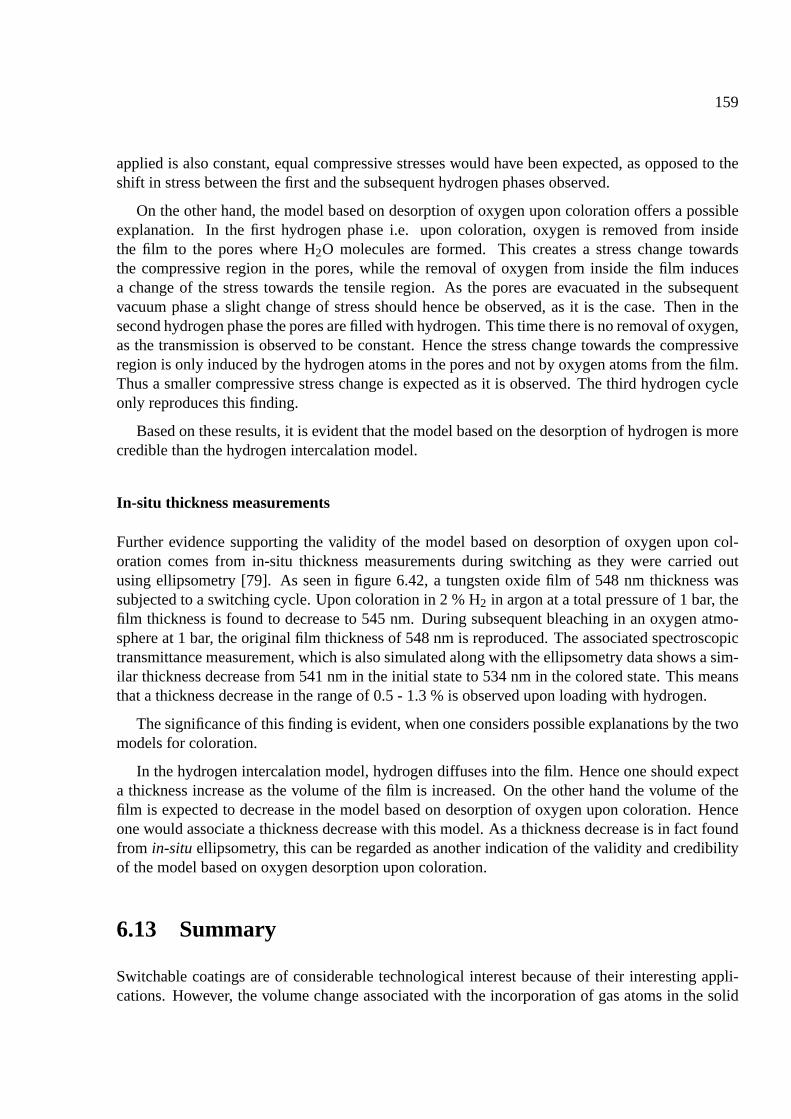
159
applied is also constant, equal compressive stresses would have been expected, as opposed to theshift in stress between the first and the subsequent hydrogen phases observed.
On the other hand, the model based on desorption of oxygen upon coloration offers a possibleexplanation. In the first hydrogen phase i.e. upon coloration, oxygen is removed from insidethe film to the pores where H2O molecules are formed. This creates a stress change towardsthe compressive region in the pores, while the removal of oxygen from inside the film inducesa change of the stress towards the tensile region. As the pores are evacuated in the subsequentvacuum phase a slight change of stress should hence be observed, as it is the case. Then in thesecond hydrogen phase the pores are filled with hydrogen. This time there is no removal of oxygen,as the transmission is observed to be constant. Hence the stress change towards the compressiveregion is only induced by the hydrogen atoms in the pores and not by oxygen atoms from the film.Thus a smaller compressive stress change is expected as it is observed. The third hydrogen cycleonly reproduces this finding.
Based on these results, it is evident that the model based on the desorption of hydrogen is morecredible than the hydrogen intercalation model.
In-situ thickness measurements
Further evidence supporting the validity of the model based on desorption of oxygen upon col-oration comes from in-situ thickness measurements during switching as they were carried outusing ellipsometry [79]. As seen in figure 6.42, a tungsten oxide film of 548 nm thickness wassubjected to a switching cycle. Upon coloration in 2 % H2 in argon at a total pressure of 1 bar, thefilm thickness is found to decrease to 545 nm. During subsequent bleaching in an oxygen atmo-sphere at 1 bar, the original film thickness of 548 nm is reproduced. The associated spectroscopictransmittance measurement, which is also simulated along with the ellipsometry data shows a sim-ilar thickness decrease from 541 nm in the initial state to 534 nm in the colored state. This meansthat a thickness decrease in the range of 0.5 - 1.3 % is observed upon loading with hydrogen.
The significance of this finding is evident, when one considers possible explanations by the twomodels for coloration.
In the hydrogen intercalation model, hydrogen diffuses into the film. Hence one should expecta thickness increase as the volume of the film is increased. On the other hand the volume of thefilm is expected to decrease in the model based on desorption of oxygen upon coloration. Henceone would associate a thickness decrease with this model. As a thickness decrease is in fact foundfrom in-situ ellipsometry, this can be regarded as another indication of the validity and credibilityof the model based on oxygen desorption upon coloration.
6.13 Summary
Switchable coatings are of considerable technological interest because of their interesting appli-cations. However, the volume change associated with the incorporation of gas atoms in the solid
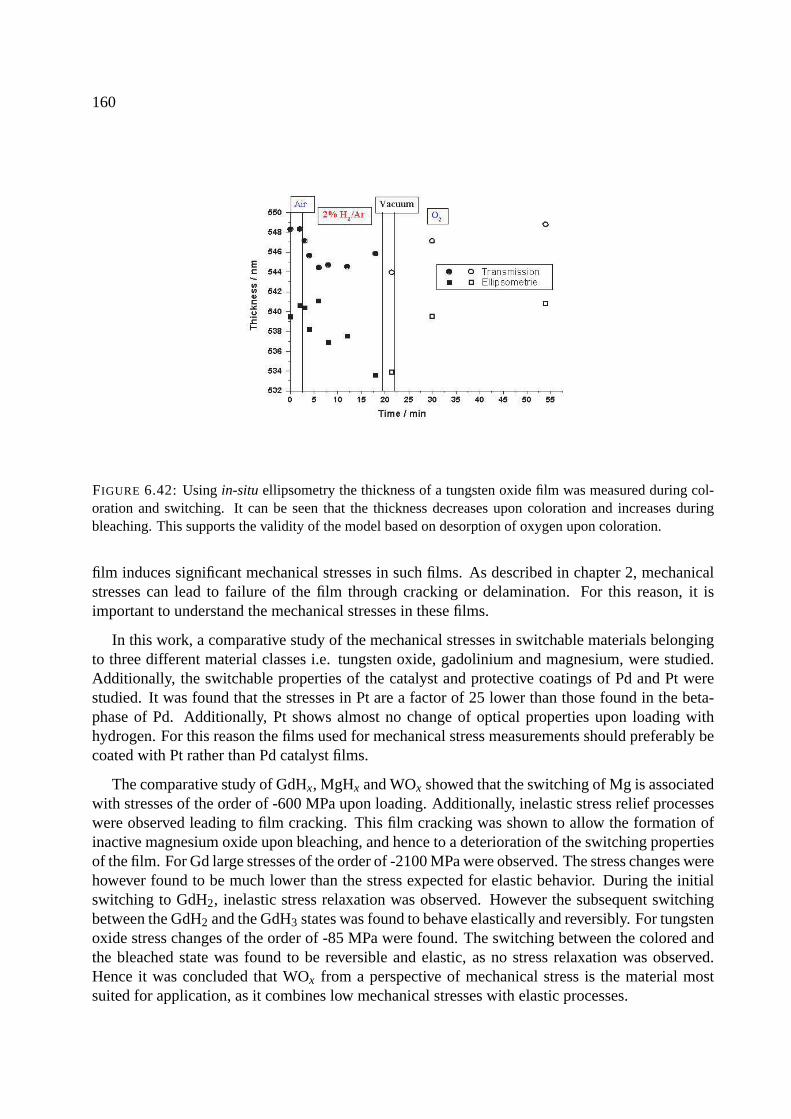
160
FIGURE 6.42: Using in-situ ellipsometry the thickness of a tungsten oxide film was measured during col-oration and switching. It can be seen that the thickness decreases upon coloration and increases duringbleaching. This supports the validity of the model based on desorption of oxygen upon coloration.
film induces significant mechanical stresses in such films. As described in chapter 2, mechanicalstresses can lead to failure of the film through cracking or delamination. For this reason, it isimportant to understand the mechanical stresses in these films.
In this work, a comparative study of the mechanical stresses in switchable materials belongingto three different material classes i.e. tungsten oxide, gadolinium and magnesium, were studied.Additionally, the switchable properties of the catalyst and protective coatings of Pd and Pt werestudied. It was found that the stresses in Pt are a factor of 25 lower than those found in the beta-phase of Pd. Additionally, Pt shows almost no change of optical properties upon loading withhydrogen. For this reason the films used for mechanical stress measurements should preferably becoated with Pt rather than Pd catalyst films.
The comparative study of GdHx, MgHx and WOx showed that the switching of Mg is associatedwith stresses of the order of -600 MPa upon loading. Additionally, inelastic stress relief processeswere observed leading to film cracking. This film cracking was shown to allow the formation ofinactive magnesium oxide upon bleaching, and hence to a deterioration of the switching propertiesof the film. For Gd large stresses of the order of -2100 MPa were observed. The stress changes werehowever found to be much lower than the stress expected for elastic behavior. During the initialswitching to GdH2, inelastic stress relaxation was observed. However the subsequent switchingbetween the GdH2 and the GdH3 states was found to behave elastically and reversibly. For tungstenoxide stress changes of the order of -85 MPa were found. The switching between the colored andthe bleached state was found to be reversible and elastic, as no stress relaxation was observed.Hence it was concluded that WOx from a perspective of mechanical stress is the material mostsuited for application, as it combines low mechanical stresses with elastic processes.
161
As tungsten oxide was found to be very promising for application, it was subjected to extensivestudies. It was found that a correlation between the mechanical stress and the density of the tung-sten oxide films exists. Hence it was concluded that the majority of the mechanical stress observedin WOx arises from gas atoms present in the pores of the tungsten oxide structure. Additionally, acorrelation between the density of films and the kinetics of switching was found. In films of lowdensity the coloration and bleaching steps take place at a higher velocity than for films of highdensity.
In section 6.3.1 two models for the switching of tungsten oxide were presented. Based onstress measurements in the fully colored state, it was found that the stress changes upon repeatedswitching between vacuum and a hydrogen atmosphere could only be explained by the model basedon oxygen desorption upon coloration. This finding was supported by the thickness decrease uponcoloration that was found using in-situ ellipsometry.

162
Chapter 7
Phase change materials
One only has to look at the size of the market for data storage to realize how interesting the asso-ciated technologies and their research are to humans focused on economic success. This markethas a net annual revenue of $114 billion in 2002 [128]. Hence companies across the world investhuge amounts of money and manpower to make them competitive in this market. For this reasonamongst others, the modern computer which nowadays can be found in almost every office andevery home in the modern world, has a performance that is very impressive considering the capa-bilities of the initial personal computers from the early eighties. Graphics resolution and -capacity,processor speed and sound quality are among the aspects that have been improved considerably.Even with this in mind, the progress that has been made in field of data storage is amazing. The ini-tial PC’s were only equipped with a magnetic 5.25” floppy disk of 360 kB capacity, while systemshaving multiple storage options totalling hundreds of GB are common today. Although magneticstorage devices remain the primary media for storage, a significant amount of data is today storedusing optical storage devices. This optical data storage technology has the huge advantage com-pared to magnetic systems, that it allows easy back-up of information compared to early magnetictapes, and also allows the easy physical transfer of large amount of data from location to locationby means of the compact disc (CD) and the digital versatile disc (DVD), which have storage ca-pacities that are several hundred times as large as that of a normal 3,5” floppy disk. While the CDand DVD were initially write-once media, the recent development of the now also commerciallyavailable rewritable DVD allows the optical technology to compete with magnetic media.
The principle of optical storage systems is called ”phase change optical recording”. It exploitsthe significant difference in optical properties of two different physical states of the active material;the amorphous and the crystalline state. Ingenious methods of heating microscopic volumes of thematerial by irradiation enable a phase transition between these two states, hence creating areaswith a reflection that differs from that of the surrounding matrix and thus allowing the storage ofinformation. Today, materials that allow a reversible phase transition between the two states areused. This means that the data storage media such as CD-RW and DVD-RW work as rewritablemedia.
Even though these optical storage devices have been extremely successful in the past, there arestill several improvements to be made in various fields. Other technologies allow higher storage
163
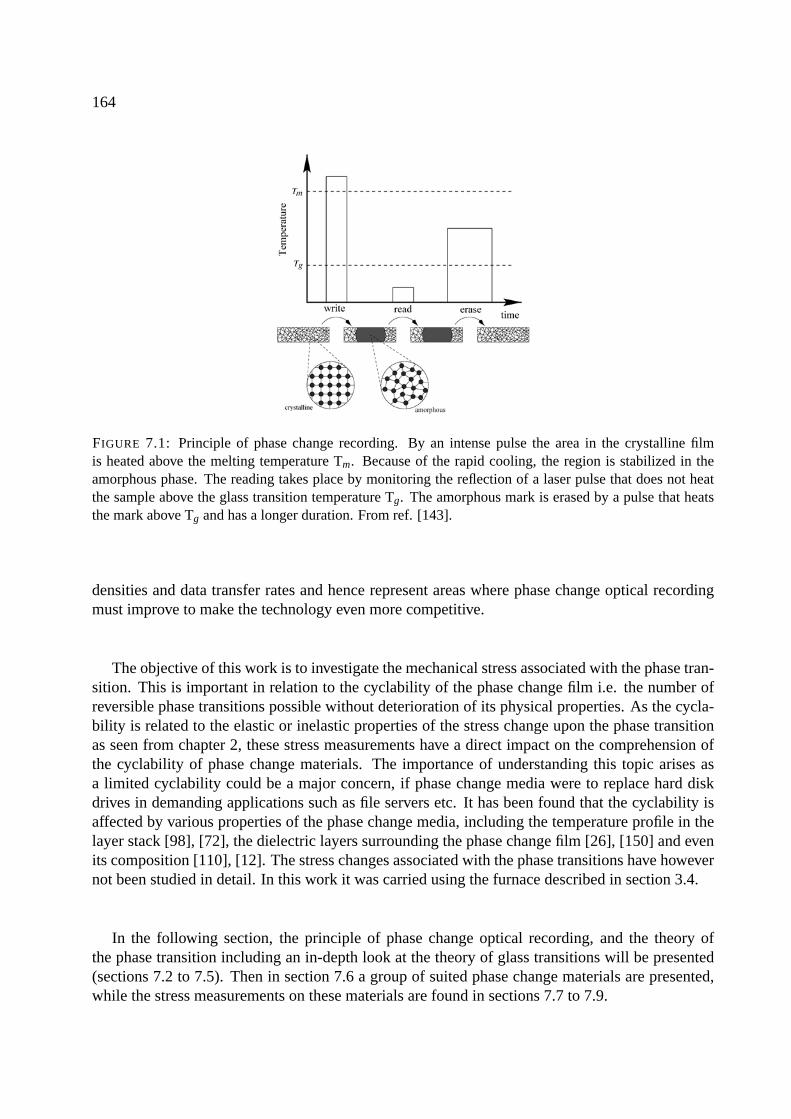
164
FIGURE 7.1: Principle of phase change recording. By an intense pulse the area in the crystalline filmis heated above the melting temperature Tm. Because of the rapid cooling, the region is stabilized in theamorphous phase. The reading takes place by monitoring the reflection of a laser pulse that does not heatthe sample above the glass transition temperature Tg. The amorphous mark is erased by a pulse that heatsthe mark above Tg and has a longer duration. From ref. [143].
densities and data transfer rates and hence represent areas where phase change optical recordingmust improve to make the technology even more competitive.
The objective of this work is to investigate the mechanical stress associated with the phase tran-sition. This is important in relation to the cyclability of the phase change film i.e. the number ofreversible phase transitions possible without deterioration of its physical properties. As the cycla-bility is related to the elastic or inelastic properties of the stress change upon the phase transitionas seen from chapter 2, these stress measurements have a direct impact on the comprehension ofthe cyclability of phase change materials. The importance of understanding this topic arises asa limited cyclability could be a major concern, if phase change media were to replace hard diskdrives in demanding applications such as file servers etc. It has been found that the cyclability isaffected by various properties of the phase change media, including the temperature profile in thelayer stack [98], [72], the dielectric layers surrounding the phase change film [26], [150] and evenits composition [110], [12]. The stress changes associated with the phase transitions have howevernot been studied in detail. In this work it was carried using the furnace described in section 3.4.
In the following section, the principle of phase change optical recording, and the theory ofthe phase transition including an in-depth look at the theory of glass transitions will be presented(sections 7.2 to 7.5). Then in section 7.6 a group of suited phase change materials are presented,while the stress measurements on these materials are found in sections 7.7 to 7.9.
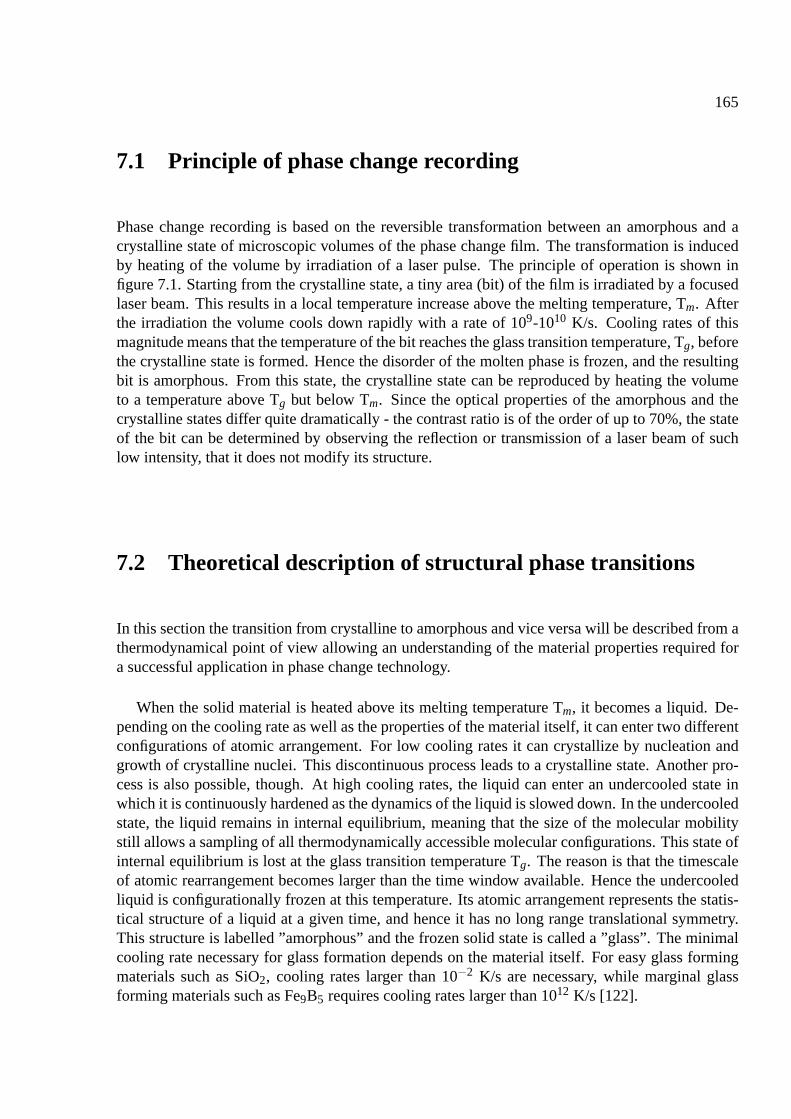
165
7.1 Principle of phase change recording
Phase change recording is based on the reversible transformation between an amorphous and acrystalline state of microscopic volumes of the phase change film. The transformation is inducedby heating of the volume by irradiation of a laser pulse. The principle of operation is shown infigure 7.1. Starting from the crystalline state, a tiny area (bit) of the film is irradiated by a focusedlaser beam. This results in a local temperature increase above the melting temperature, Tm. Afterthe irradiation the volume cools down rapidly with a rate of 109-1010 K/s. Cooling rates of thismagnitude means that the temperature of the bit reaches the glass transition temperature, Tg, beforethe crystalline state is formed. Hence the disorder of the molten phase is frozen, and the resultingbit is amorphous. From this state, the crystalline state can be reproduced by heating the volumeto a temperature above Tg but below Tm. Since the optical properties of the amorphous and thecrystalline states differ quite dramatically - the contrast ratio is of the order of up to 70%, the stateof the bit can be determined by observing the reflection or transmission of a laser beam of suchlow intensity, that it does not modify its structure.
7.2 Theoretical description of structural phase transitions
In this section the transition from crystalline to amorphous and vice versa will be described from athermodynamical point of view allowing an understanding of the material properties required fora successful application in phase change technology.
When the solid material is heated above its melting temperature Tm, it becomes a liquid. De-pending on the cooling rate as well as the properties of the material itself, it can enter two differentconfigurations of atomic arrangement. For low cooling rates it can crystallize by nucleation andgrowth of crystalline nuclei. This discontinuous process leads to a crystalline state. Another pro-cess is also possible, though. At high cooling rates, the liquid can enter an undercooled state inwhich it is continuously hardened as the dynamics of the liquid is slowed down. In the undercooledstate, the liquid remains in internal equilibrium, meaning that the size of the molecular mobilitystill allows a sampling of all thermodynamically accessible molecular configurations. This state ofinternal equilibrium is lost at the glass transition temperature Tg. The reason is that the timescaleof atomic rearrangement becomes larger than the time window available. Hence the undercooledliquid is configurationally frozen at this temperature. Its atomic arrangement represents the statis-tical structure of a liquid at a given time, and hence it has no long range translational symmetry.This structure is labelled ”amorphous” and the frozen solid state is called a ”glass”. The minimalcooling rate necessary for glass formation depends on the material itself. For easy glass formingmaterials such as SiO2, cooling rates larger than 10−2 K/s are necessary, while marginal glassforming materials such as Fe9B5 requires cooling rates larger than 1012 K/s [122].
166
FIGURE 7.2: The structure of glasses. The icosahedron structure (left) consists of 20 tetrahedrons (right),that are arranged in to share a common vertex. This means that they are slightly distorted. From ref. [51].
7.3 Atomic configuration of glasses
In a description of the structure of glasses there are two scales to consider. Most important isthe fact that glasses do not possess a periodic long range order. This even applies to the case ofinfinitively slow cooling, where the structure is determined by short range rules for atomic arrange-ments that only allow one unambiguous way of constructing the entire structure. The result is astate of zero entropy. As the case of infinitively slow cooling cannot be obtained experimentally,all glasses possess a residual entropy at low temperatures as a result of their abandoning of internalequilibrium. On a short range scale, metallic glasses on the other hand do possess a degree oforder. The atoms are ordered in a structure that resembles that of icosahedral quasicrystals. Theicosahedron which is characteristic for this structure can be seen in fig. 7.2.a. It consists of 20tetrahedrons (fig. 7.2.b), which are slightly distorted allowing them to share a common vertex inthe icosahedral structure. As mentioned above, the icosahedrons in a glass are not arranged with along range order.
7.4 A thermodynamic approach to the formation of glasses
Thermodynamics offer a straightforward framework for considerations regarding the stability ofglasses. As described in section 7.2, the glass is not in internal equilibrium as this property islost at the glass transition temperature. A simple law of thermodynamics states, that a system atconstant temperature and pressure is in a state of equilibrium at the global minimum value of theGibb’s free energy. Hence glasses will tend to lower their Gibb’s free energy in order to reach theirequilibrium atomic configuration. The Gibb’s free energy is given as (6.16):
G = H −T S (7.1)
167
Hence the difference in Gibb’s free energy between the liquid and the crystal, ∆Glc, can be ex-pressed as:
∆Glc(T ) = ∆Hlc(T )−T ∆Slc(T ). (7.2)
Expressions for the enthalpy and the entropy differences can be found by considering the basicthermodynamic relations:
dH = CpdT (7.3)
anddH = T dS +V dP (7.4)
Assuming a constant pressure, the following expressions can now be deduced:
∆Hlc(T ) = Hl(T )−Hc(T ) = ∆Hf +T∫
Tm
∆Cp,lc(T ′)dT ′ (7.5)
and
∆Slc(T ) = Sl(T )−Sc(T ) = ∆S f +T∫
Tm
∆Cp,lc(T ′)T ′ dT ′ (7.6)
where ∆H f = Hl(Tm)-Hc(Tm) is the heat of fusion, which represents the heat that is used to breakthe bonds upon melting of the crystal, and ∆S f = Sl(Tm)-Sc(Tm) is the entropy of fusion.
An important relation appears when one considers that the change in Gibbs free energy at themelting temperature for a single component system is:
∆Glc(Tm) = 0 (7.7)
Hence the following relation between the heat of fusion and entropy of fusion can be found:
∆S f =∆Hf
Tm(7.8)
The thermodynamic features of liquid-crystal systems can now be appreciated from plots of Cp,∆Glc, ∆Hlc and ∆Slc versus the temperature (Figure 7.3).
From figure 7.3.a it is seen that the heat capacity of the undercooled liquid is larger than that ofthe crystal, because of the additional configurational degrees of freedom of the liquid. Additionally,it can be appreciated, that the transition from an undercooled liquid to a glass is associated witha dramatic decrease of the heat capacity. The exact temperature at which the transition occurs isdependent on the cooling rate. The reason is that the time window for atomic rearrangements inthe liquid decreases with higher heating rates. Hence a quick cooling results in a glass transitionat a higher temperature as indicated by path a) in the figure. A slow cooling result in a glasstransition at a lower temperature as represented by path b). As the structure of the glass mirrors theconfiguration of the undercooled liquid at the time of the glass transition, the undercooled liquid issaid to be configurationally frozen, and the different paths a) and b) are called isoconfigurationalstates. After the transition, at temperatures below Tg, the heat capacities of the crystal and the glassare roughly equal.
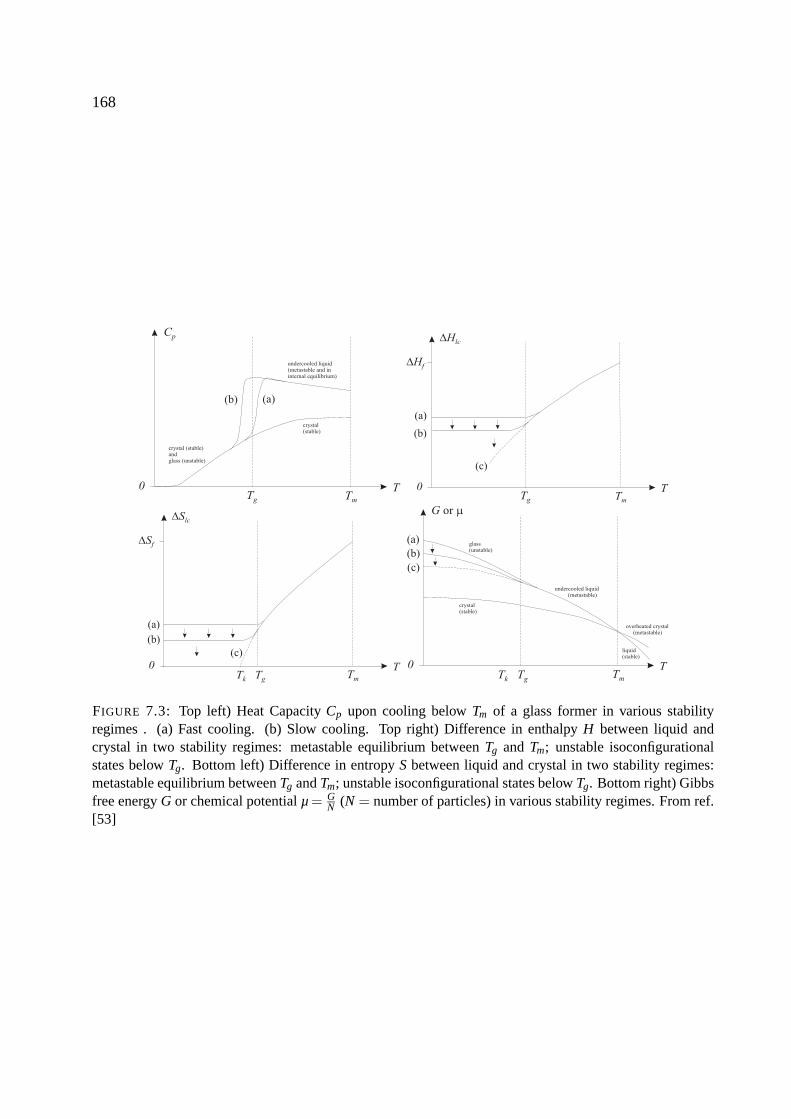
168
FIGURE 7.3: Top left) Heat Capacity Cp upon cooling below Tm of a glass former in various stabilityregimes . (a) Fast cooling. (b) Slow cooling. Top right) Difference in enthalpy H between liquid andcrystal in two stability regimes: metastable equilibrium between Tg and Tm; unstable isoconfigurationalstates below Tg. Bottom left) Difference in entropy S between liquid and crystal in two stability regimes:metastable equilibrium between Tg and Tm; unstable isoconfigurational states below Tg. Bottom right) Gibbsfree energy G or chemical potential µ = G
N (N = number of particles) in various stability regimes. From ref.[53]

169
Gib
bs fr
ee e
nerg
y di
ffere
nce
∆G
Radius of nucleus r
σ 4πr2
-∆Glc,V (4πr3)/3 ∆Gtotal(r)
0
0
rc
∆Gc
FIGURE 7.4: The terms of the Gibb’s free energy change upon formation of a crystalline nucleus of radiusr. At radii above rc the nuclei becomes stable.
In case of the enthalpy and the entropy, it can be seen from figure 7.3.b and 7.3.c, respectively,that slow cooling (paths b) results in a lower ∆Hlc and ∆Slc at temperatures below Tg than fastcooling (paths a). The dotted lines (path c) represents the case of infinitively slow cooling, inwhich case the undercooled liquid does not transform into a glass, but remains in a state of internalequilibrium. This scenario is obviously a theoretical case and not obtainable experimentally. Forthe entropy this extrapolation leads to a temperature Tk, at which ∆Slc is zero. Tk is called theKauzmann temperature and represents the temperature below which the undercooled liquid be-comes completely ordered [54]. The Gibb’s free energy, which is plotted in figure 7.3.d shows thestable physical state at all temperatures. The path of fast cooling results in a state of higher ∆Glc
than the slow cooling. The glass will tend to relax towards the equilibrium structure representedby path c), which is the configuration of lowest Gibb’s free energy. As a result of this, physicalproperties which depend on the atomic arrangement of the glass depend dramatically on its his-tory [134]. This constitutes a major problem in studies of amorphous materials as variations of10 in Young’s modulus, 0.5 in mass density and changes of several orders of magnitude for thediffusivity and the shear viscosity have been found [129],[108],[13],[109].
7.5 Crystallization
Eventually the glass will tend towards the crystalline structure, which is the overall state of lowestGibb’s free energy (fig. 7.3.d). However, in doing this the system does not only gain the energydifference between the two states, but also has to spend an energy to create an interface betweenthe liquid and the crystalline nucleus. This energy is called the interfacial energy ∆Gσ. As elasticenergy terms do not change the general description and can be ignored, the total change in Gibb’sfree energy for a homogeneous nucleation where the crystalline nucleus is completely surrounded
170
by the liquid is [120]:
∆Gtotal = −∆Glc +∆Gσ
= −∆Glc,V ·V +σ ·A, (7.9)
where A and V denote the area and the surface of the nucleus, ∆Glc,V is the difference in Gibb’sfree energy per volume between the liquid and the crystal, and σ is the interface tension of thecrystal melt. For a spherical nucleus with radius r, the expression can be rewritten as:
∆Gtotal(r) = ∆Glc,V · 43
πr3 +σ ·4πr2. (7.10)
When plotting ∆Gtotal versus r (figure 7.4), it can be seen that the Gibb’s free energy differenceincreases at small radii, while it obtains a maximum value at a radius of rc. Hence at r< rc, thegrowth of a nucleus is accompanied by an increase in ∆Gtotal . As this is not thermodynamicallyfavorable, the nucleus is not stable and will tend to decay. On the other hand nuclei with r>rc arestable and continue to grow as further growth is associated with a decrease of ∆Gtotal and henceis thermodynamically favorable. The formation of a stable nucleus is called crystal nucleation.Because of this, rc is called the critical radius, which by solving d(∆Gtotal)
dr = 0 can be expressed by:
rc =2σ
∆Glc,V(7.11)
Associated with the critical radius is the critical change in Gibb’s free energy, ∆Gc. This can beconsidered as a barrier for nucleation and can by use of (7.10) be expressed as:
∆Gc =16π
3σ3
(∆Glc,V )2 , (7.12)
Another case of crystallization is the heterogeneous crystallization, where foreign materials suchas a substrate are involved. The energy barrier for nucleation can in this case be expressed as [120]:
∆G(∗)c =
16π3
σ3
(∆Glc,V )2 · f (θ), (7.13)
where f(θ) is a geometrical factor [0≤f(θ)≤1] which reduces to 1 in the case of homogenouscrystallization [120].
The nuclei are formed and decay continuously because of thermal fluctuations. By use ofMaxwell-Boltzmann statistics, the number of nuclei of radius r that are present once equilibriumis attained after a duration called the incubation time, can be expressed as:
n(r) = n0 · exp
(−∆Gtotal(r)
kBT
)(7.14)
where n0 is a constant describing the total number of nucleation sites. Hence the total number ofcritical nuclei in equilibrium is:
nc = n0 · exp
(−∆Gc
kBT
)(7.15)
171
Correspondingly, the crystal nucleation frequency in steady state can be expressed by [10],[133]:
Iss = I0 · k j · exp
(−∆Gc
kBT
)(7.16)
where k j is the jump frequency per atom across the liquid-crystal interface and I0 is a constant.
Once stable nuclei have been formed they continue to grow, as atoms move across the liquid-crystal interface. The crystal growth velocity associated with this process is defined as [120]:
ucg = u0 · k j ·[
exp
(∆Glc, atom
kBT
)−1
](7.17)
where ∆Glc,atom is the difference in Gibb’s free energy per atom between the liquid and the crystalphases, and u0 is a constant.
For pure liquids consisting of just one element the crystallization is collision-limited as neigh-boring atoms are identical. Hence k j in this case can be expressed by:
k j =usound
λ(7.18)
where λ is the interatomic distance, and usound the sound velocity of the liquid. For alloys whereneighboring atoms are not necessarily alike, the crystallization is diffusion limited, as the atomsmust interchange their occupation of specific sites. In this case, the jump frequency per atom is:
k j =6Dλ2 (7.19)
Here D is the diffusivity of the liquid, which is related to the viscosity of the liquid through theStokes-Einstein relation:
ηD =kBT3πa0
(7.20)
where a0 is of the order of a molecular diameter [121],[120].
Through a combination of the expressions (7.16), (7.17), (7.19) and (7.20), the steady statecrystal nucleation frequency in the diffusion limited case can be expressed as:
I(dl)ss = 2I0
kBTπλ2a0
1η· exp
(−∆Gc
kBT
)(7.21)
and the crystal growth velocity in steady state can be written as:
u(dl)cg = 2u0
kBTπλ2a0
1η·[
exp
(∆Glc, atom
kBT
)−1
](7.22)
The functions (7.22) and (7.21) are qualitatively plotted in fig. 7.5 as a function of the reducedtemperature Tr = T/Tl , where Tl is the melting point of liquidus temperature. The three curves cor-respond to different values of the reduced glass transition temperature Trg=Tg/Tl namely Trg=2/3,Trg=1/2 and Trg=1/3.

172
log
[ ucg
(dl) ]
(a
rb. u
nits
)
1.00.80.60.40.20.0
Reduced temperature Tr
log
[ Iss
(dl) ]
(a
rb. u
nits
)
FIGURE 7.5: Nucleation frequency I(dl)ss and crystal growth velocity u(dl)
cg for three values of the reducedglass transition temperature: Trg = 2
3 (solid), Trg = 12 (dashed), and Trg = 1
3 (dotted). From [53].
The curves are based on the following assumptions: The viscosity, can be estimated by theFulcher-Vogel equation. There is a unique melting temperature Tg equal to T0 (the temperaturebelow which the viscosity is divergent as defined in (2.116)). The tension σ between the crystaland the melt is proportional to Tr, and ∆Glc is proportional to the undercooling (1-Tr).
The factor that by far has the biggest influence on the shape of the curves is the viscosity i.e.
the Fulcher-Vogel behavior. Interestingly, the maxima of the curves for u(dl)cg and I(dl)
ss is found atdifferent temperatures, as can be explained by the different temperature dependence of (7.21) and(7.22).
The reduced glass transition temperature used for plotting has the physical implication, thatit serves as a criterion for the glass forming ability of a material [131]. As found by Turnbull,
at values of Trg >2/3, glass formation upon quenching is almost guaranteed, as I(dl)ss is almost
negligibly small.
A particular case of interest when considering crystallization is the case of isothermal homo-geneous crystallization. In this case, the so-called Johnson-Mehl-Avrami equation [133], [5], [64]gives a measure of the crystallized volume fraction of space fc, as a function of time:
fc(t) = 1− exp
(−4
3πu3
cg ·∫ t
0I(t) · (t − t ′)3dt ′
)(7.23)
where I(t) is the time-dependent crystal nucleation frequency. Considering the steady state scenarioas described above, where I(t) is described by (7.16), equation 7.23 reduces to:
fc(t) = 1− exp[−(kmt)4] (7.24)

173
where it was applied that∫ t
0(t − t ′)3dt ′ = t4
4 . Here
km =(
13
πu3cgIss
) 14
(7.25)
is called the rate constant. Its temperature dependence is described by equations 7.16 and 7.17, butit can be approximated by a simple Arrhenius behavior:
km(T ) ∝ exp
(− EA
kBT
)(7.26)
where EA can be seen as the effective activation energy for crystallization.
7.6 Materials suited for phase change application
Only a small group of materials have been found to be suited for application as phase changematerials. Many candidates have been deemed unsuitable, as short recrystallization times are adifficult requirement to fulfil. Materials found suitable for application include the alloy familiesof GeTe, GeSbTe, GeTeSnO, AgInSbTe, InSbTe, SnTeSe and InSe [154]. Currently the mostpopular and applied materials are the ternary GeSbTe and the quarternary AgInSbTe alloy families.Depending on its exact composition, an alloy of the former group can be found in the ternary-diagram of these materials (fig. 7.6). Incidentally the compositions which have been found mostsuited for a phase change application until now are all situated on the so-called pseudo-binary line[97], that has its name from the fact that the two components of the supposedly binary alloy areGeTe and Sb2Te3. These compositions include Ge2Sb2Te5, Ge1Sb2Te4 and Ge1Sb4Te7. This workis limited to the study of the following three alloys:
• Ge2Sb2Te5
(TM=620.5C)
• Ge4Sb1Te5
(TM=685.0C)
• AgInSbTe
(TM=536.8C)
(Ag 5.5%, In 6.5%, Sb 59%, Te 29% as determined by inductively coupled plasma emissionspectroscopy and energy dispersive X-ray analysis)
but systematic efforts searching for other suitable compositions are currently being carried out[149], [22].
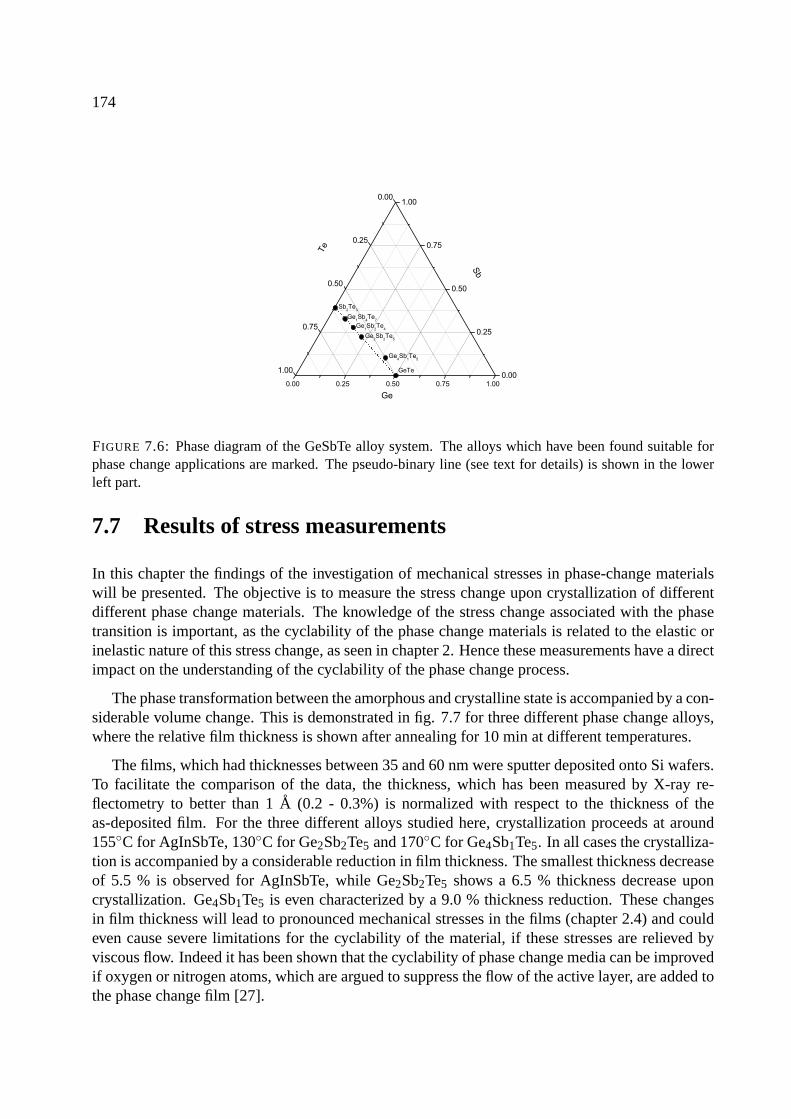
174
FIGURE 7.6: Phase diagram of the GeSbTe alloy system. The alloys which have been found suitable forphase change applications are marked. The pseudo-binary line (see text for details) is shown in the lowerleft part.
7.7 Results of stress measurements
In this chapter the findings of the investigation of mechanical stresses in phase-change materialswill be presented. The objective is to measure the stress change upon crystallization of differentdifferent phase change materials. The knowledge of the stress change associated with the phasetransition is important, as the cyclability of the phase change materials is related to the elastic orinelastic nature of this stress change, as seen in chapter 2. Hence these measurements have a directimpact on the understanding of the cyclability of the phase change process.
The phase transformation between the amorphous and crystalline state is accompanied by a con-siderable volume change. This is demonstrated in fig. 7.7 for three different phase change alloys,where the relative film thickness is shown after annealing for 10 min at different temperatures.
The films, which had thicknesses between 35 and 60 nm were sputter deposited onto Si wafers.To facilitate the comparison of the data, the thickness, which has been measured by X-ray re-flectometry to better than 1 A (0.2 - 0.3%) is normalized with respect to the thickness of theas-deposited film. For the three different alloys studied here, crystallization proceeds at around155C for AgInSbTe, 130C for Ge2Sb2Te5 and 170C for Ge4Sb1Te5. In all cases the crystalliza-tion is accompanied by a considerable reduction in film thickness. The smallest thickness decreaseof 5.5 % is observed for AgInSbTe, while Ge2Sb2Te5 shows a 6.5 % thickness decrease uponcrystallization. Ge4Sb1Te5 is even characterized by a 9.0 % thickness reduction. These changesin film thickness will lead to pronounced mechanical stresses in the films (chapter 2.4) and couldeven cause severe limitations for the cyclability of the material, if these stresses are relieved byviscous flow. Indeed it has been shown that the cyclability of phase change media can be improvedif oxygen or nitrogen atoms, which are argued to suppress the flow of the active layer, are added tothe phase change film [27].
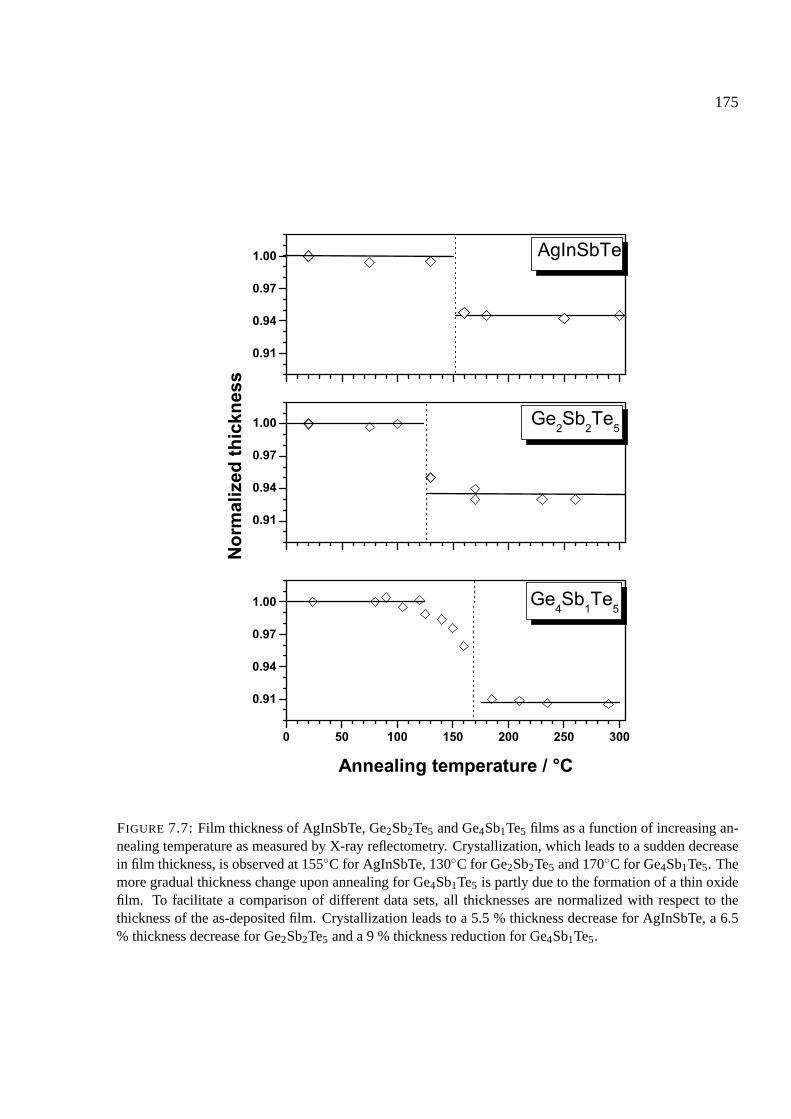
175
FIGURE 7.7: Film thickness of AgInSbTe, Ge2Sb2Te5 and Ge4Sb1Te5 films as a function of increasing an-nealing temperature as measured by X-ray reflectometry. Crystallization, which leads to a sudden decreasein film thickness, is observed at 155C for AgInSbTe, 130C for Ge2Sb2Te5 and 170C for Ge4Sb1Te5. Themore gradual thickness change upon annealing for Ge4Sb1Te5 is partly due to the formation of a thin oxidefilm. To facilitate a comparison of different data sets, all thicknesses are normalized with respect to thethickness of the as-deposited film. Crystallization leads to a 5.5 % thickness decrease for AgInSbTe, a 6.5% thickness decrease for Ge2Sb2Te5 and a 9 % thickness reduction for Ge4Sb1Te5.
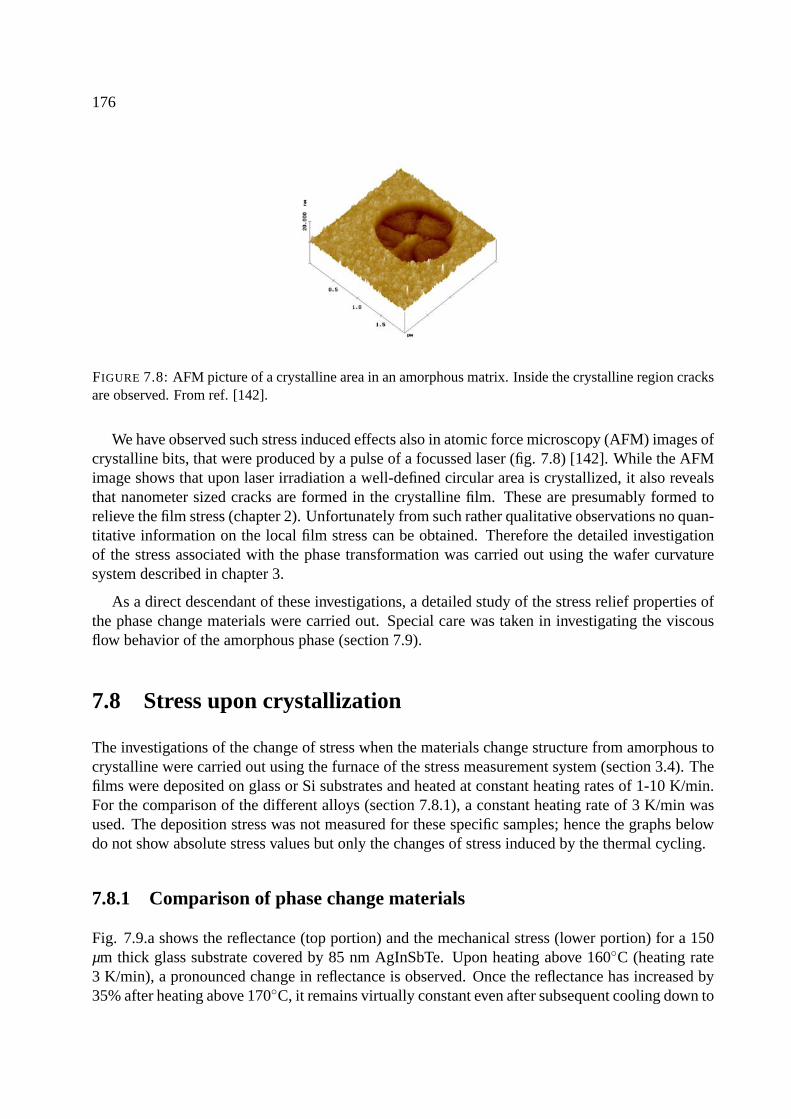
176
FIGURE 7.8: AFM picture of a crystalline area in an amorphous matrix. Inside the crystalline region cracksare observed. From ref. [142].
We have observed such stress induced effects also in atomic force microscopy (AFM) images ofcrystalline bits, that were produced by a pulse of a focussed laser (fig. 7.8) [142]. While the AFMimage shows that upon laser irradiation a well-defined circular area is crystallized, it also revealsthat nanometer sized cracks are formed in the crystalline film. These are presumably formed torelieve the film stress (chapter 2). Unfortunately from such rather qualitative observations no quan-titative information on the local film stress can be obtained. Therefore the detailed investigationof the stress associated with the phase transformation was carried out using the wafer curvaturesystem described in chapter 3.
As a direct descendant of these investigations, a detailed study of the stress relief properties ofthe phase change materials were carried out. Special care was taken in investigating the viscousflow behavior of the amorphous phase (section 7.9).
7.8 Stress upon crystallization
The investigations of the change of stress when the materials change structure from amorphous tocrystalline were carried out using the furnace of the stress measurement system (section 3.4). Thefilms were deposited on glass or Si substrates and heated at constant heating rates of 1-10 K/min.For the comparison of the different alloys (section 7.8.1), a constant heating rate of 3 K/min wasused. The deposition stress was not measured for these specific samples; hence the graphs belowdo not show absolute stress values but only the changes of stress induced by the thermal cycling.
7.8.1 Comparison of phase change materials
Fig. 7.9.a shows the reflectance (top portion) and the mechanical stress (lower portion) for a 150µm thick glass substrate covered by 85 nm AgInSbTe. Upon heating above 160C (heating rate3 K/min), a pronounced change in reflectance is observed. Once the reflectance has increased by35% after heating above 170C, it remains virtually constant even after subsequent cooling down to
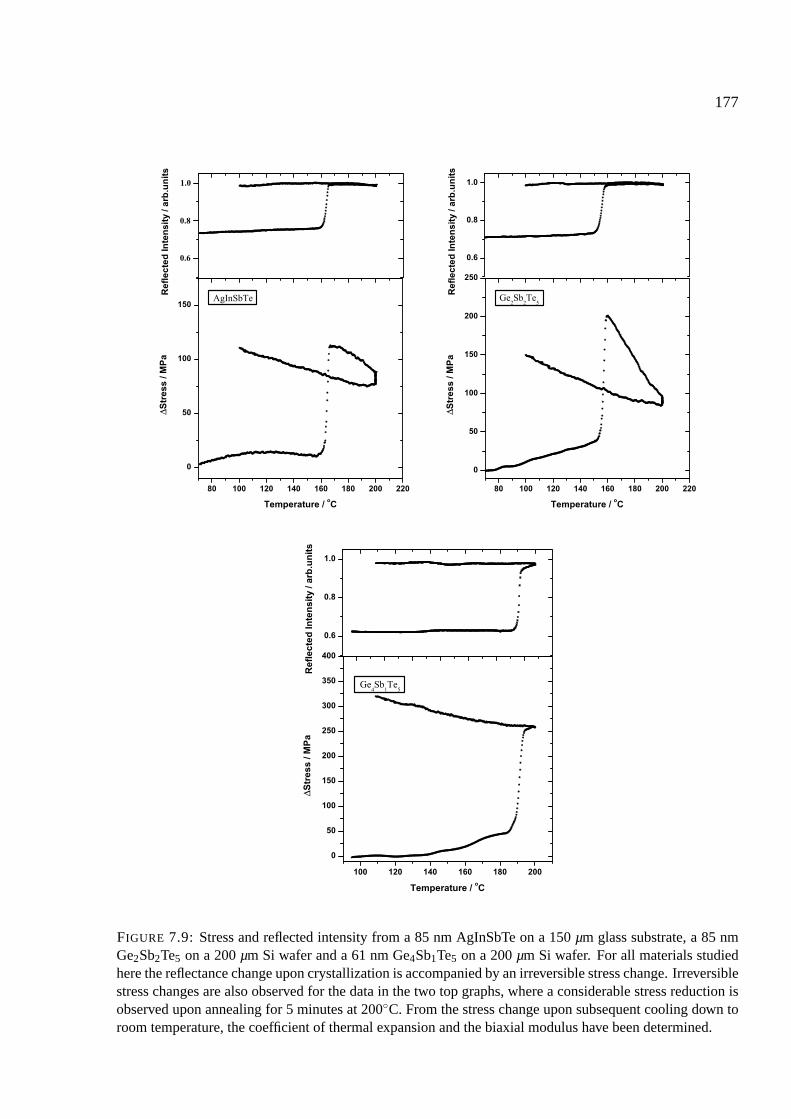
177
FIGURE 7.9: Stress and reflected intensity from a 85 nm AgInSbTe on a 150 µm glass substrate, a 85 nmGe2Sb2Te5 on a 200 µm Si wafer and a 61 nm Ge4Sb1Te5 on a 200 µm Si wafer. For all materials studiedhere the reflectance change upon crystallization is accompanied by an irreversible stress change. Irreversiblestress changes are also observed for the data in the two top graphs, where a considerable stress reduction isobserved upon annealing for 5 minutes at 200C. From the stress change upon subsequent cooling down toroom temperature, the coefficient of thermal expansion and the biaxial modulus have been determined.

178
200
180
160
140
120
100
80
60
40
20
0
-20
Str
ess
(MP
a)
28024020016012080400Temperature (°C)
amorphous
crystalline
FIGURE 7.10: Reversible thermal cycling of a 965 nm Ge2Sb2Te5 film on a 200 µm Si substrate. Thermalcycling was carried out in both the amorphous and the crystalline state. The large stress increase at 167Carises as a result of the crystallization and the associated volume change of the film.
room temperature. This reflectance change is characteristic for crystallization as confirmed by X-ray diffraction measurements. Correlated with the phase transition is a stress change of 105 MPa.Further heating of the sample leads to a reduction in film stress. Neither the rapid stress build-upupon heating above 160C nor the subsequent stress decrease upon further heating are reversible.This can be seen from the stress data upon cooling down to room temperature. Subsequent heatingback to 200C leads to a reversible change of the film stress, which is attributed to the differentcoefficients of thermal expansion of the film and the substrate, as explained in section 2.5. Bycomparing the reversible stress change upon heating or cooling for films deposited onto differentsubstrates, we have determined the coefficient of thermal expansion and the biaxial elastic modulusfor the different phase change materials shown (section 7.8.2).
Similar behavior upon heating is observed for Ge2Sb2Te5 (Fig.7.9.b) and Ge4Sb1Te5 (figure7.9.c). At temperatures of 159C for Ge2Sb2Te5 and 191C for Ge4Sb1Te5, the films crystallize.The crystallization is associated with changes of stress of 165 MPa and 215 MPa, respectively.The associated reflection changes are in the range of 40-60 % for all alloys. In neither of theexperiments, the sudden stress change upon crystallization nor the stress decrease seen upon furtherheating to 200 C is recovered during the subsequent cooling. After the first heating and coolingsteps, the samples were subjected to additional heating and cooling cycles, that in all cases resultedin a reversible linear behavior. This linear behavior is expected from the thermal stress associatedwith the difference between the coefficients of thermal expansion of the film and the substrate(chapter 2.5).
7.8.2 Determination of the elastic constant for phase change materials
To determine the elastic constants of the phase change alloys, identical films were deposited on thetwo thermally stable substrates, (100) Si and (0001) sapphire (Al2O3). The biaxial moduli of these
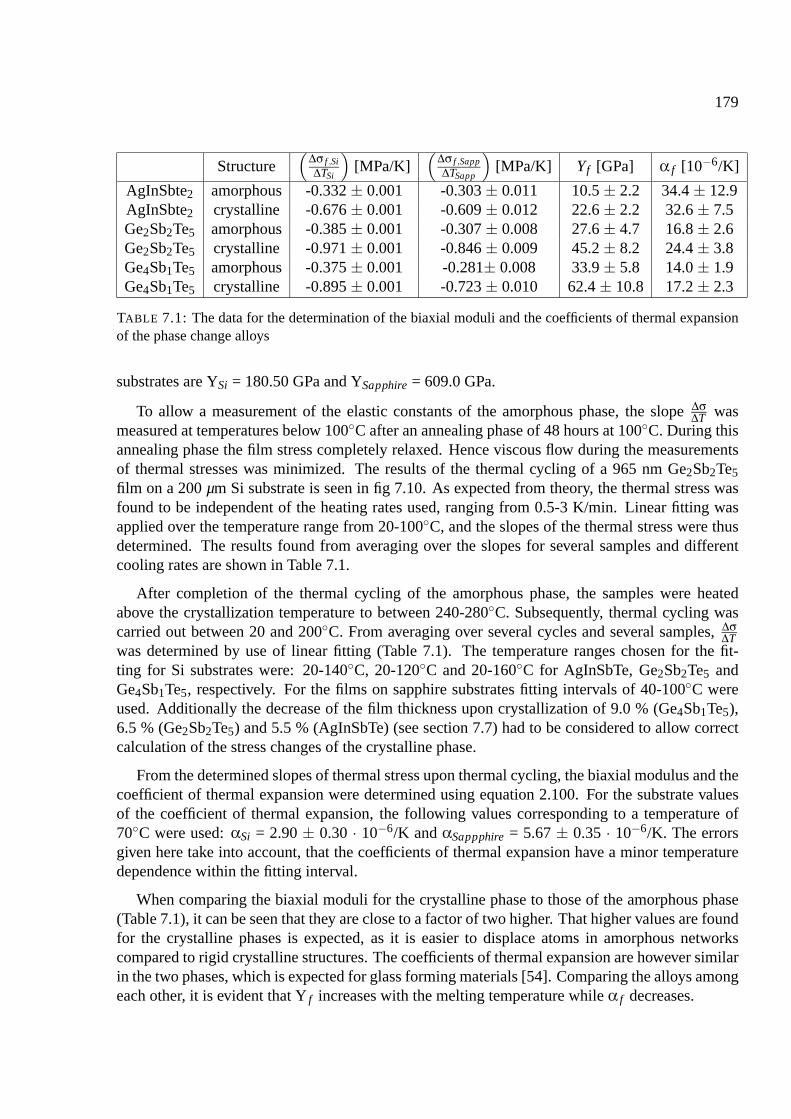
179
Structure(
∆σ f ,Si∆TSi
)[MPa/K]
(∆σ f ,Sapp∆TSapp
)[MPa/K] Yf [GPa] α f [10−6/K]
AgInSbte2 amorphous -0.332 ± 0.001 -0.303 ± 0.011 10.5 ± 2.2 34.4 ± 12.9AgInSbte2 crystalline -0.676 ± 0.001 -0.609 ± 0.012 22.6 ± 2.2 32.6 ± 7.5Ge2Sb2Te5 amorphous -0.385 ± 0.001 -0.307 ± 0.008 27.6 ± 4.7 16.8 ± 2.6Ge2Sb2Te5 crystalline -0.971 ± 0.001 -0.846 ± 0.009 45.2 ± 8.2 24.4 ± 3.8Ge4Sb1Te5 amorphous -0.375 ± 0.001 -0.281± 0.008 33.9 ± 5.8 14.0 ± 1.9Ge4Sb1Te5 crystalline -0.895 ± 0.001 -0.723 ± 0.010 62.4 ± 10.8 17.2 ± 2.3
TABLE 7.1: The data for the determination of the biaxial moduli and the coefficients of thermal expansionof the phase change alloys
substrates are YSi = 180.50 GPa and YSapphire = 609.0 GPa.
To allow a measurement of the elastic constants of the amorphous phase, the slope ∆σ∆T was
measured at temperatures below 100C after an annealing phase of 48 hours at 100C. During thisannealing phase the film stress completely relaxed. Hence viscous flow during the measurementsof thermal stresses was minimized. The results of the thermal cycling of a 965 nm Ge2Sb2Te5
film on a 200 µm Si substrate is seen in fig 7.10. As expected from theory, the thermal stress wasfound to be independent of the heating rates used, ranging from 0.5-3 K/min. Linear fitting wasapplied over the temperature range from 20-100C, and the slopes of the thermal stress were thusdetermined. The results found from averaging over the slopes for several samples and differentcooling rates are shown in Table 7.1.
After completion of the thermal cycling of the amorphous phase, the samples were heatedabove the crystallization temperature to between 240-280C. Subsequently, thermal cycling wascarried out between 20 and 200C. From averaging over several cycles and several samples, ∆σ
∆Twas determined by use of linear fitting (Table 7.1). The temperature ranges chosen for the fit-ting for Si substrates were: 20-140C, 20-120C and 20-160C for AgInSbTe, Ge2Sb2Te5 andGe4Sb1Te5, respectively. For the films on sapphire substrates fitting intervals of 40-100C wereused. Additionally the decrease of the film thickness upon crystallization of 9.0 % (Ge4Sb1Te5),6.5 % (Ge2Sb2Te5) and 5.5 % (AgInSbTe) (see section 7.7) had to be considered to allow correctcalculation of the stress changes of the crystalline phase.
From the determined slopes of thermal stress upon thermal cycling, the biaxial modulus and thecoefficient of thermal expansion were determined using equation 2.100. For the substrate valuesof the coefficient of thermal expansion, the following values corresponding to a temperature of70C were used: αSi = 2.90 ± 0.30 · 10−6/K and αSappphire = 5.67 ± 0.35 · 10−6/K. The errorsgiven here take into account, that the coefficients of thermal expansion have a minor temperaturedependence within the fitting interval.
When comparing the biaxial moduli for the crystalline phase to those of the amorphous phase(Table 7.1), it can be seen that they are close to a factor of two higher. That higher values are foundfor the crystalline phases is expected, as it is easier to displace atoms in amorphous networkscompared to rigid crystalline structures. The coefficients of thermal expansion are however similarin the two phases, which is expected for glass forming materials [54]. Comparing the alloys amongeach other, it is evident that Y f increases with the melting temperature while α f decreases.

180
γamorph γcrystal
AgInSbTe 0.49 ± 0.34) 0.96 ± 0.52Ge2Sb2Te5 0.62 ± 0.27) 1.38 ± 0.60Ge4Sb1Te5 0.62 ± 0.25) 1.29 ± 0.53
TABLE 7.2: The Gruneisen constant γ as calculated for the amorphous and crystalline phases by use of theelastic constants and coefficients of thermal expansion found in this section.
This finding agrees nicely with the general rule of thumb that the elastic modulus increases andthe coefficient of thermal expansion decreases with increasing melting temperature. Additionally,the Gruneisen constant γ is normally found in the range of 1 to 3. It is given by [4]:
γ =3α ·B
CV(7.27)
where B is the bulk modulus, which can be expressed by the biaxial modulus and the Poisson’sratio:
B =13· 1−ν
1−2ν·Yf (7.28)
and CV is the heat capacity at constant volume of the film. It can be estimated by the Dulong-Petitvalue [4]:
CV =3 · kB ·N
V(7.29)
where N/V is the number of atoms per volume. For Ge4Sb1Te5, CV can be calculated to:
CV =3 · kB ·ρ · (4+1+5)
4 ·MGe +1 ·MSb +5 ·MTe(7.30)
Using the values for Y f and α f found in this section, the values for γ shown in table 7.2 are foundfor the different alloys in the amorphous and crystalline phases, respectively. For CV an error of10% was assumed. It can be seen that the values of the Gruneisen constant are in agreement withthe Gruneisen’s law. The values found for the crystalline phase fall in the range normally foundfor γ i.e between 1 and 3. However the values for the amorphous phase are a little lower at close to0.5, meaning that these values are rather low.
7.8.3 Comparison of the stress changes with elastic theory
As shown in chapter 7.7, the phase transition from amorphous to crystalline is associated withlarge thickness decreases of 5.5 % for AgInSbTe, 6.5 % for Ge2Sb2Te5 and 9.0% for Ge4Sb1Te5.By combining these thickness changes with the values for the biaxial moduli of the phase changematerials, one can estimate the stress change upon crystallization under the assumption, that theprocess proceeds elastically. Under this condition the stress change is (2.93):
∆σ = −Yf · 1−ν f
1+ν f· εzz,total (7.31)
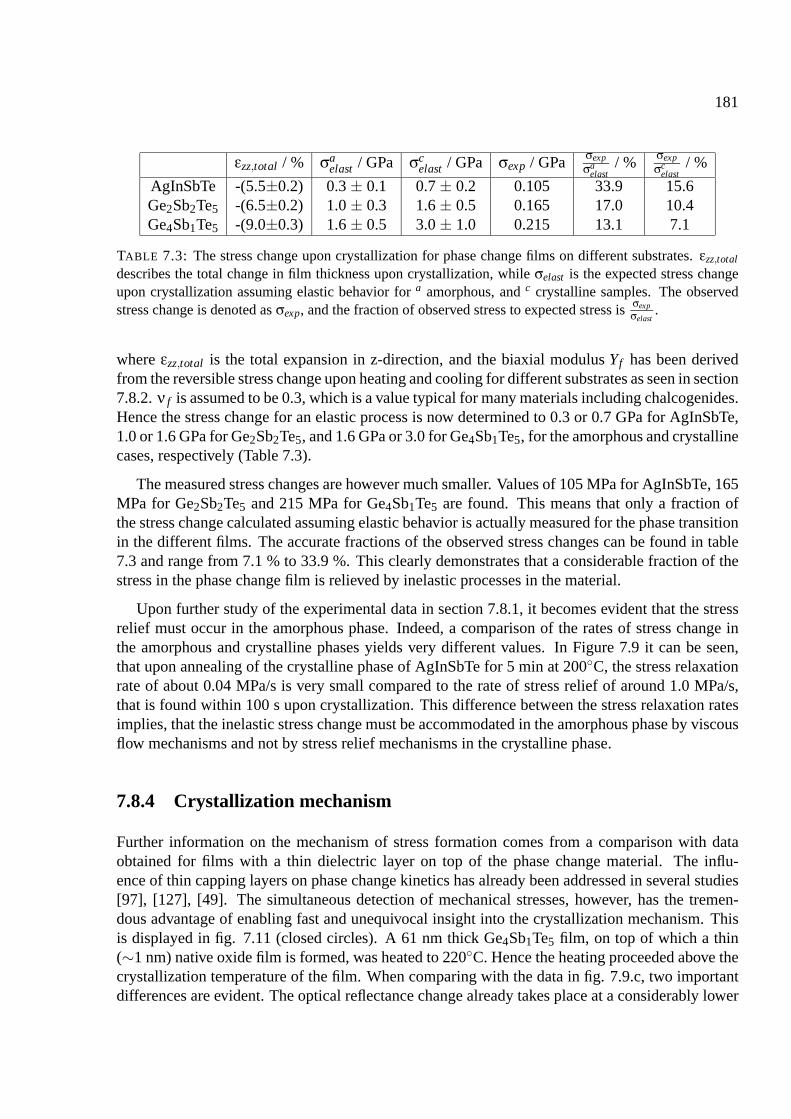
181
εzz,total / % σaelast / GPa σc
elast / GPa σexp / GPa σexpσa
elast/ % σexp
σcelast
/ %
AgInSbTe -(5.5±0.2) 0.3 ± 0.1 0.7 ± 0.2 0.105 33.9 15.6Ge2Sb2Te5 -(6.5±0.2) 1.0 ± 0.3 1.6 ± 0.5 0.165 17.0 10.4Ge4Sb1Te5 -(9.0±0.3) 1.6 ± 0.5 3.0 ± 1.0 0.215 13.1 7.1
TABLE 7.3: The stress change upon crystallization for phase change films on different substrates. εzz,total
describes the total change in film thickness upon crystallization, while σelast is the expected stress changeupon crystallization assuming elastic behavior for a amorphous, and c crystalline samples. The observedstress change is denoted as σexp, and the fraction of observed stress to expected stress is σexp
σelast.
where εzz,total is the total expansion in z-direction, and the biaxial modulus Yf has been derivedfrom the reversible stress change upon heating and cooling for different substrates as seen in section7.8.2. ν f is assumed to be 0.3, which is a value typical for many materials including chalcogenides.Hence the stress change for an elastic process is now determined to 0.3 or 0.7 GPa for AgInSbTe,1.0 or 1.6 GPa for Ge2Sb2Te5, and 1.6 GPa or 3.0 for Ge4Sb1Te5, for the amorphous and crystallinecases, respectively (Table 7.3).
The measured stress changes are however much smaller. Values of 105 MPa for AgInSbTe, 165MPa for Ge2Sb2Te5 and 215 MPa for Ge4Sb1Te5 are found. This means that only a fraction ofthe stress change calculated assuming elastic behavior is actually measured for the phase transitionin the different films. The accurate fractions of the observed stress changes can be found in table7.3 and range from 7.1 % to 33.9 %. This clearly demonstrates that a considerable fraction of thestress in the phase change film is relieved by inelastic processes in the material.
Upon further study of the experimental data in section 7.8.1, it becomes evident that the stressrelief must occur in the amorphous phase. Indeed, a comparison of the rates of stress change inthe amorphous and crystalline phases yields very different values. In Figure 7.9 it can be seen,that upon annealing of the crystalline phase of AgInSbTe for 5 min at 200C, the stress relaxationrate of about 0.04 MPa/s is very small compared to the rate of stress relief of around 1.0 MPa/s,that is found within 100 s upon crystallization. This difference between the stress relaxation ratesimplies, that the inelastic stress change must be accommodated in the amorphous phase by viscousflow mechanisms and not by stress relief mechanisms in the crystalline phase.
7.8.4 Crystallization mechanism
Further information on the mechanism of stress formation comes from a comparison with dataobtained for films with a thin dielectric layer on top of the phase change material. The influ-ence of thin capping layers on phase change kinetics has already been addressed in several studies[97], [127], [49]. The simultaneous detection of mechanical stresses, however, has the tremen-dous advantage of enabling fast and unequivocal insight into the crystallization mechanism. Thisis displayed in fig. 7.11 (closed circles). A 61 nm thick Ge4Sb1Te5 film, on top of which a thin(∼1 nm) native oxide film is formed, was heated to 220C. Hence the heating proceeded above thecrystallization temperature of the film. When comparing with the data in fig. 7.9.c, two importantdifferences are evident. The optical reflectance change already takes place at a considerably lower
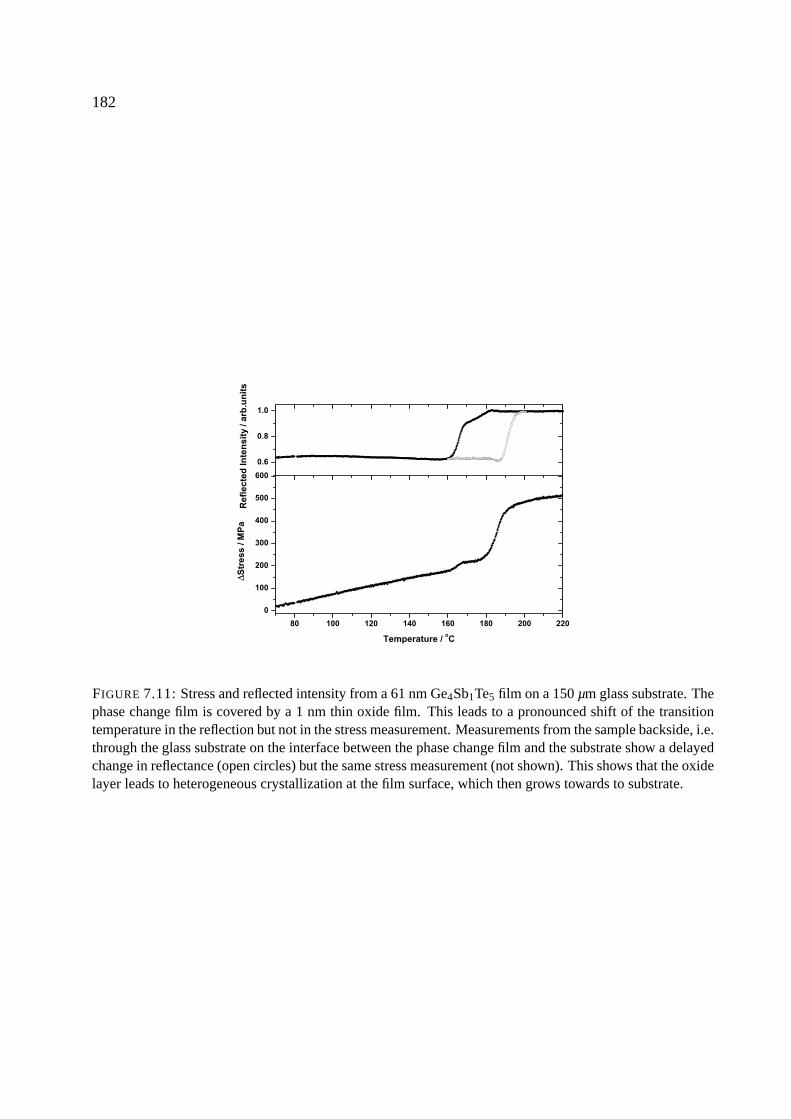
182
FIGURE 7.11: Stress and reflected intensity from a 61 nm Ge4Sb1Te5 film on a 150 µm glass substrate. Thephase change film is covered by a 1 nm thin oxide film. This leads to a pronounced shift of the transitiontemperature in the reflection but not in the stress measurement. Measurements from the sample backside, i.e.through the glass substrate on the interface between the phase change film and the substrate show a delayedchange in reflectance (open circles) but the same stress measurement (not shown). This shows that the oxidelayer leads to heterogeneous crystallization at the film surface, which then grows towards to substrate.
183
temperature i.e. 162C as compared with 182C for the non-oxidized film. This is evidence thatthe crystallization proceeds via heterogeneous nucleation at the interface between the oxide andthe phase change film. The onset of crystallization is accompanied by a small stress change, butthe major stress change is only observed after the reflectance change is almost complete. Thisimplies that a large fraction of the stress is only formed when different grains start to form a con-tinuous crystalline film. Such a scenario is indicative for a high viscous flow rate of the amorphousphase, which reduces the maximum film stress that can be observed. The scenario of interfacedriven heterogeneous crystallization can be confirmed by a straightforward experiment. Turningthe sample upside down, the laser beam passes through the glass substrate onto the phase changefilm. This geometry leaves the stress measurement unaffected, but leads to a rather different re-flectance change (open circles): Since the laser beam now has to first pass through the amorphousGe4Sb1Te5 film, the onset of crystallization at the interface is not visible. This directly confirmsthe heterogeneous crystallization process at the oxide/phase change interface presented above.
7.9 Viscosity measurements
From the studies of the stress change upon crystallization, it was found the the stress relief pre-sumably takes place by viscous flow in the amorphous phase of the phase change materials. Hencein an effort to understand the mechanism of viscous flow, which is predominant in these materials,careful studies of viscous flow in these materials was carried out.
The experiments were carried out in a fashion that exploits the build up of thermal stress in thinfilms. Phase change films deposited on Si substrates were heated rapidly to a temperature wellbelow the crystallization temperature. Thereby thermal stress was induced in the films by equation2.97. Subsequently, the temperature was kept constant until the introduced stress had relaxed. Ina next step, the temperature was rapidly increased to another temperature below the crystallizationtemperature. Again the relaxation of the thermal stress introduced was monitored at a constanttemperature. Hence as an example the films were subjected to a temperature cycle which whenplotted as a function of time looks like shown in figure 7.12.
The temperatures used for these studies were chosen from the criterion, that they had to intro-duce a sufficient thermal stress in the film in order to get sufficient signal during the measurement.It was also desirable to have at least two phases of viscous flow per sample. Additionally thetemperatures were chosen to be as low as possible to minimize the risk of crystallization.
7.9.1 Results of viscosity measurements
In figures (7.14), (7.13) and (7.15) examples of the results of the studies of viscous flow are shownfor each of the three alloys. Similarities between the behavior of the alloys are evident:
First of all, a compressive stress is induced in the film during the initial heating. This stressarises as a result of the coefficient of thermal expansion for all alloys being larger than that ofthe silicon substrates used. Because AgInSbTe has the lowest biaxial elastic modulus, the thermalstress induced is lowest for that alloy.
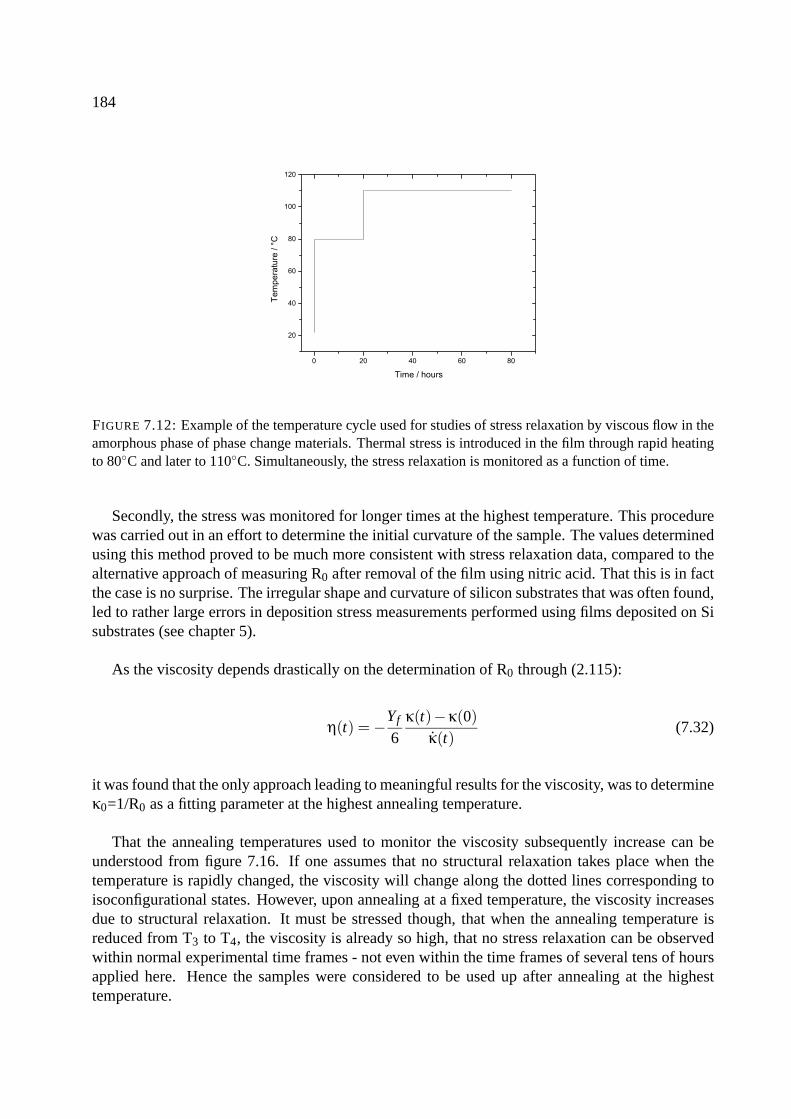
184
FIGURE 7.12: Example of the temperature cycle used for studies of stress relaxation by viscous flow in theamorphous phase of phase change materials. Thermal stress is introduced in the film through rapid heatingto 80C and later to 110C. Simultaneously, the stress relaxation is monitored as a function of time.
Secondly, the stress was monitored for longer times at the highest temperature. This procedurewas carried out in an effort to determine the initial curvature of the sample. The values determinedusing this method proved to be much more consistent with stress relaxation data, compared to thealternative approach of measuring R0 after removal of the film using nitric acid. That this is in factthe case is no surprise. The irregular shape and curvature of silicon substrates that was often found,led to rather large errors in deposition stress measurements performed using films deposited on Sisubstrates (see chapter 5).
As the viscosity depends drastically on the determination of R0 through (2.115):
η(t) = −Yf
6κ(t)−κ(0)
κ(t)(7.32)
it was found that the only approach leading to meaningful results for the viscosity, was to determineκ0=1/R0 as a fitting parameter at the highest annealing temperature.
That the annealing temperatures used to monitor the viscosity subsequently increase can beunderstood from figure 7.16. If one assumes that no structural relaxation takes place when thetemperature is rapidly changed, the viscosity will change along the dotted lines corresponding toisoconfigurational states. However, upon annealing at a fixed temperature, the viscosity increasesdue to structural relaxation. It must be stressed though, that when the annealing temperature isreduced from T3 to T4, the viscosity is already so high, that no stress relaxation can be observedwithin normal experimental time frames - not even within the time frames of several tens of hoursapplied here. Hence the samples were considered to be used up after annealing at the highesttemperature.
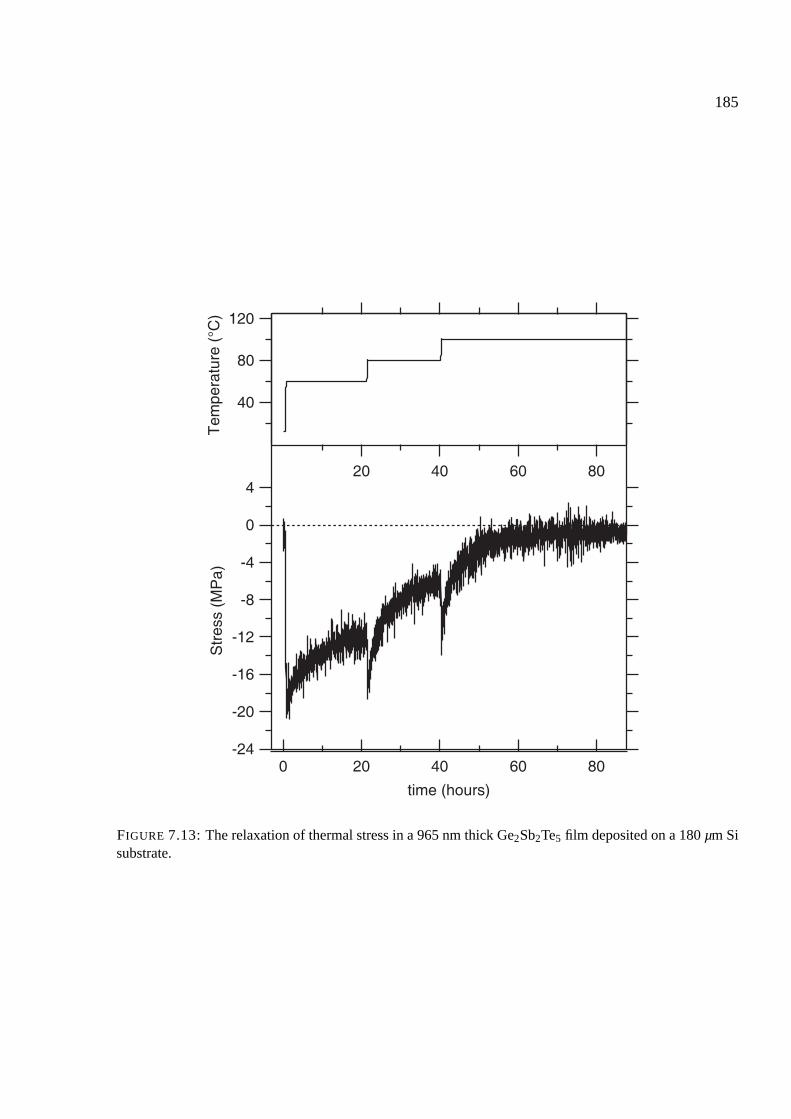
185
-24
-20
-16
-12
-8
-4
0
4
Str
ess
(MP
a)
806040200
time (hours)
120
80
40
Tem
pera
ture
(°C
)
80604020
FIGURE 7.13: The relaxation of thermal stress in a 965 nm thick Ge2Sb2Te5 film deposited on a 180 µm Sisubstrate.
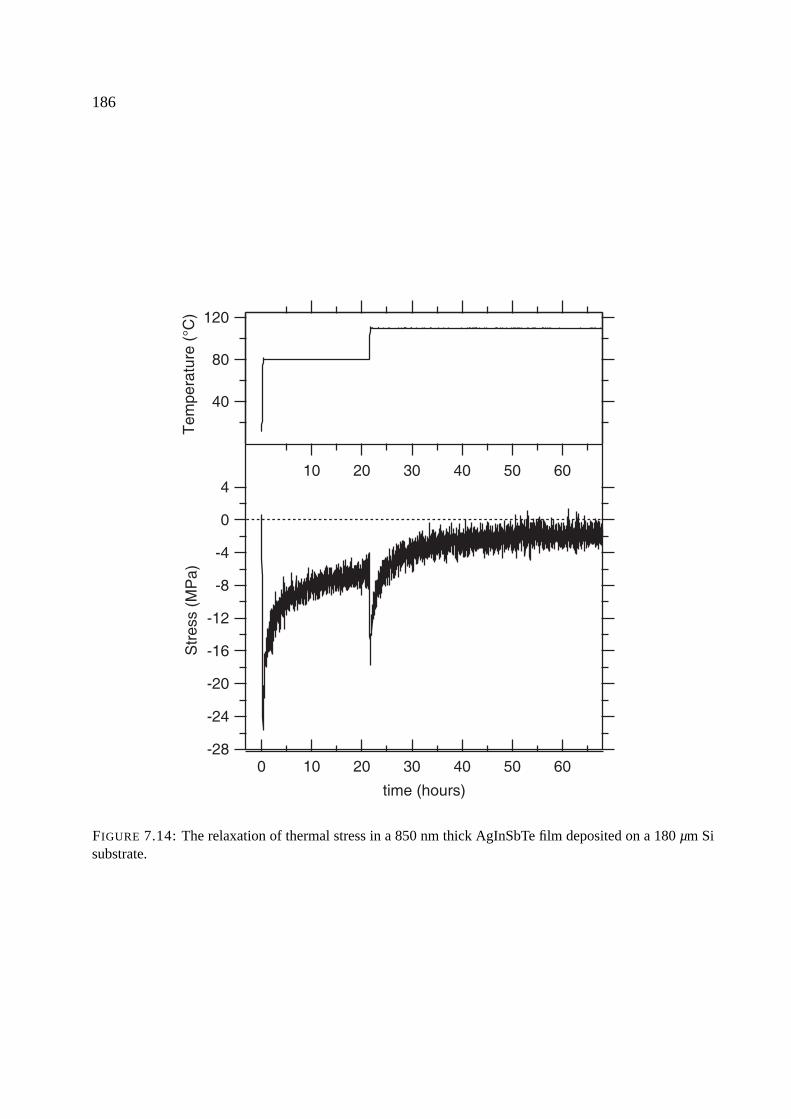
186
-28
-24
-20
-16
-12
-8
-4
0
4
Str
ess
(MP
a)
6050403020100
time (hours)
120
80
40
Tem
pera
ture
(°C
)
605040302010
FIGURE 7.14: The relaxation of thermal stress in a 850 nm thick AgInSbTe film deposited on a 180 µm Sisubstrate.
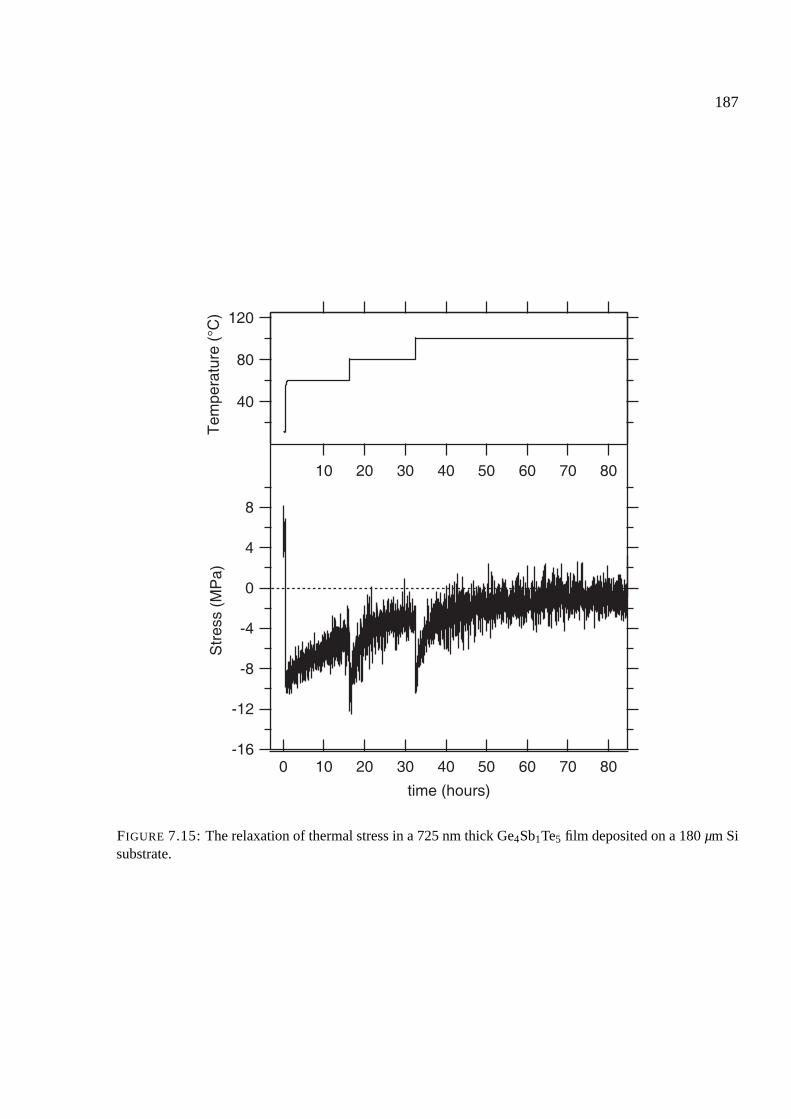
187
-16
-12
-8
-4
0
4
8
Str
ess
(MP
a)
80706050403020100
time (hours)
120
80
40
Tem
pera
ture
(°C
)
8070605040302010
FIGURE 7.15: The relaxation of thermal stress in a 725 nm thick Ge4Sb1Te5 film deposited on a 180 µm Sisubstrate.
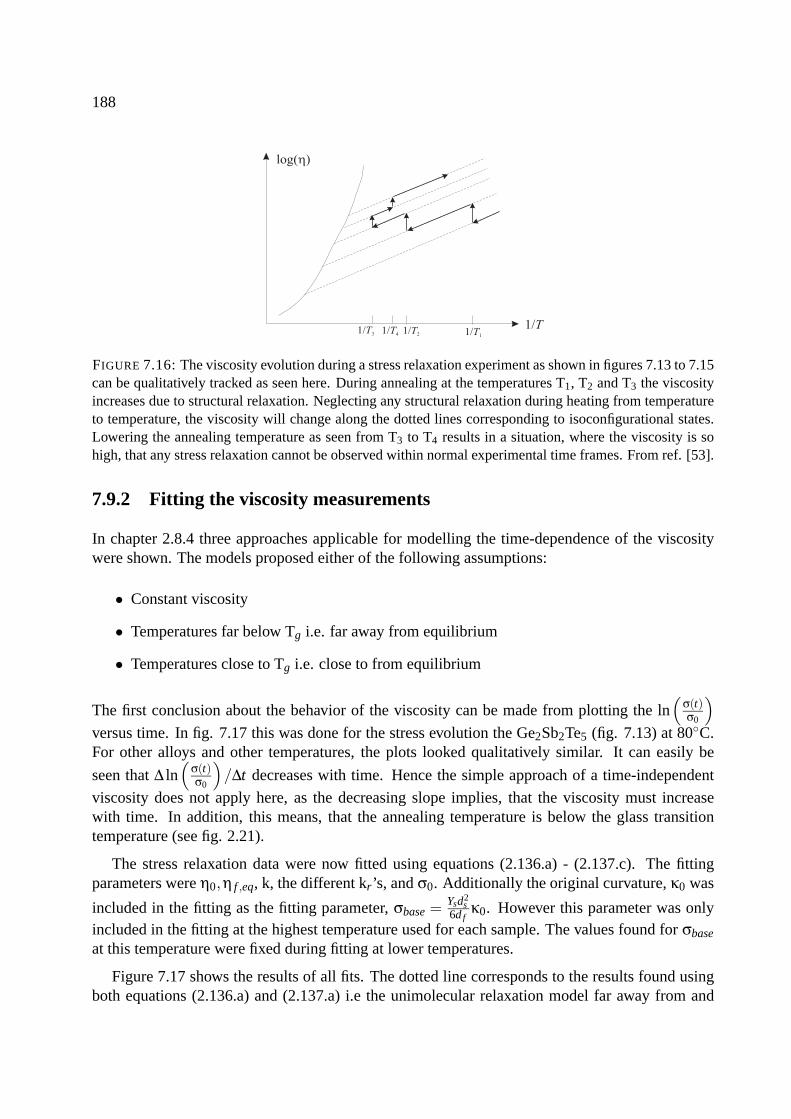
188
FIGURE 7.16: The viscosity evolution during a stress relaxation experiment as shown in figures 7.13 to 7.15can be qualitatively tracked as seen here. During annealing at the temperatures T1, T2 and T3 the viscosityincreases due to structural relaxation. Neglecting any structural relaxation during heating from temperatureto temperature, the viscosity will change along the dotted lines corresponding to isoconfigurational states.Lowering the annealing temperature as seen from T3 to T4 results in a situation, where the viscosity is sohigh, that any stress relaxation cannot be observed within normal experimental time frames. From ref. [53].
7.9.2 Fitting the viscosity measurements
In chapter 2.8.4 three approaches applicable for modelling the time-dependence of the viscositywere shown. The models proposed either of the following assumptions:
• Constant viscosity
• Temperatures far below Tg i.e. far away from equilibrium
• Temperatures close to Tg i.e. close to from equilibrium
The first conclusion about the behavior of the viscosity can be made from plotting the ln(
σ(t)σ0
)versus time. In fig. 7.17 this was done for the stress evolution the Ge2Sb2Te5 (fig. 7.13) at 80C.For other alloys and other temperatures, the plots looked qualitatively similar. It can easily be
seen that ∆ ln(
σ(t)σ0
)/∆t decreases with time. Hence the simple approach of a time-independent
viscosity does not apply here, as the decreasing slope implies, that the viscosity must increasewith time. In addition, this means, that the annealing temperature is below the glass transitiontemperature (see fig. 2.21).
The stress relaxation data were now fitted using equations (2.136.a) - (2.137.c). The fittingparameters were η0,η f ,eq, k, the different kr’s, and σ0. Additionally the original curvature, κ0 was
included in the fitting as the fitting parameter, σbase = Ysd2s
6d fκ0. However this parameter was only
included in the fitting at the highest temperature used for each sample. The values found for σbase
at this temperature were fixed during fitting at lower temperatures.
Figure 7.17 shows the results of all fits. The dotted line corresponds to the results found usingboth equations (2.136.a) and (2.137.a) i.e the unimolecular relaxation model far away from and
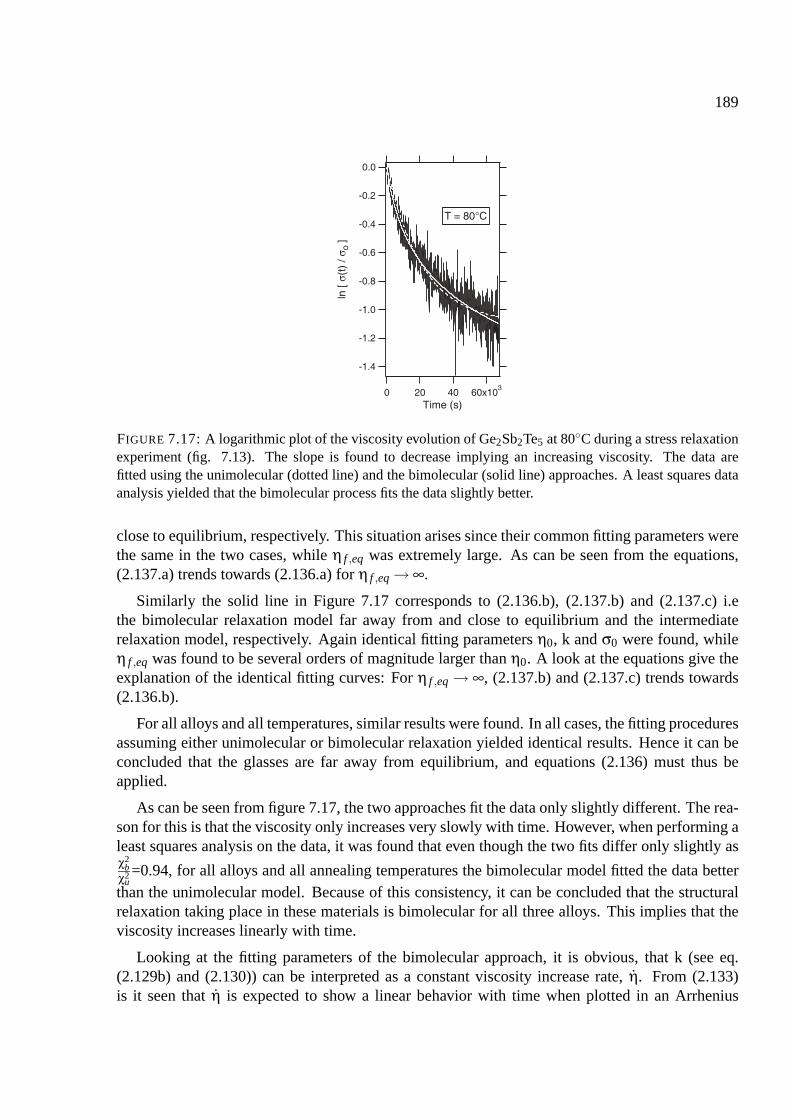
189
-1.4
-1.2
-1.0
-0.8
-0.6
-0.4
-0.2
0.0
ln [
σ(t)
/ σ o
]
60x103
40200Time (s)
T = 80°C
FIGURE 7.17: A logarithmic plot of the viscosity evolution of Ge2Sb2Te5 at 80C during a stress relaxationexperiment (fig. 7.13). The slope is found to decrease implying an increasing viscosity. The data arefitted using the unimolecular (dotted line) and the bimolecular (solid line) approaches. A least squares dataanalysis yielded that the bimolecular process fits the data slightly better.
close to equilibrium, respectively. This situation arises since their common fitting parameters werethe same in the two cases, while η f ,eq was extremely large. As can be seen from the equations,(2.137.a) trends towards (2.136.a) for η f ,eq → ∞.
Similarly the solid line in Figure 7.17 corresponds to (2.136.b), (2.137.b) and (2.137.c) i.ethe bimolecular relaxation model far away from and close to equilibrium and the intermediaterelaxation model, respectively. Again identical fitting parameters η0, k and σ0 were found, whileη f ,eq was found to be several orders of magnitude larger than η0. A look at the equations give theexplanation of the identical fitting curves: For η f ,eq → ∞, (2.137.b) and (2.137.c) trends towards(2.136.b).
For all alloys and all temperatures, similar results were found. In all cases, the fitting proceduresassuming either unimolecular or bimolecular relaxation yielded identical results. Hence it can beconcluded that the glasses are far away from equilibrium, and equations (2.136) must thus beapplied.
As can be seen from figure 7.17, the two approaches fit the data only slightly different. The rea-son for this is that the viscosity only increases very slowly with time. However, when performing aleast squares analysis on the data, it was found that even though the two fits differ only slightly asχ2
bχ2
u=0.94, for all alloys and all annealing temperatures the bimolecular model fitted the data better
than the unimolecular model. Because of this consistency, it can be concluded that the structuralrelaxation taking place in these materials is bimolecular for all three alloys. This implies that theviscosity increases linearly with time.
Looking at the fitting parameters of the bimolecular approach, it is obvious, that k (see eq.(2.129b) and (2.130)) can be interpreted as a constant viscosity increase rate, η. From (2.133)is it seen that η is expected to show a linear behavior with time when plotted in an Arrhenius
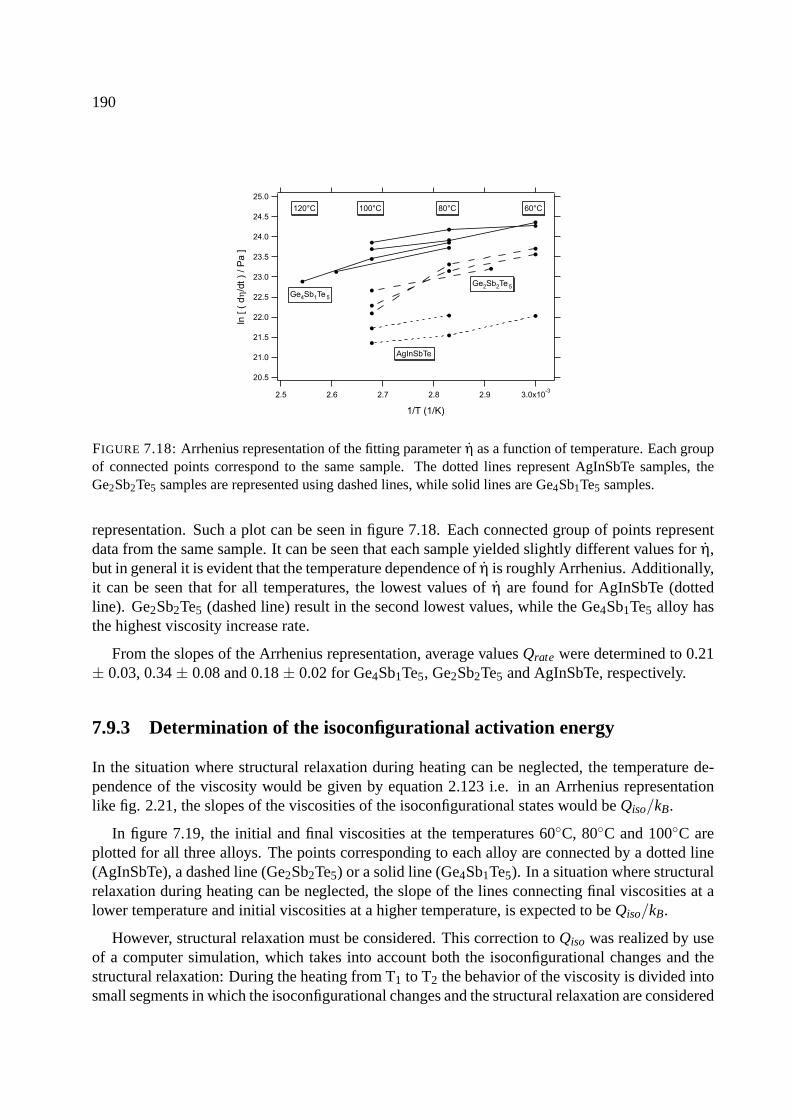
190
FIGURE 7.18: Arrhenius representation of the fitting parameter η as a function of temperature. Each groupof connected points correspond to the same sample. The dotted lines represent AgInSbTe samples, theGe2Sb2Te5 samples are represented using dashed lines, while solid lines are Ge4Sb1Te5 samples.
representation. Such a plot can be seen in figure 7.18. Each connected group of points representdata from the same sample. It can be seen that each sample yielded slightly different values for η,but in general it is evident that the temperature dependence of η is roughly Arrhenius. Additionally,it can be seen that for all temperatures, the lowest values of η are found for AgInSbTe (dottedline). Ge2Sb2Te5 (dashed line) result in the second lowest values, while the Ge4Sb1Te5 alloy hasthe highest viscosity increase rate.
From the slopes of the Arrhenius representation, average values Qrate were determined to 0.21± 0.03, 0.34 ± 0.08 and 0.18 ± 0.02 for Ge4Sb1Te5, Ge2Sb2Te5 and AgInSbTe, respectively.
7.9.3 Determination of the isoconfigurational activation energy
In the situation where structural relaxation during heating can be neglected, the temperature de-pendence of the viscosity would be given by equation 2.123 i.e. in an Arrhenius representationlike fig. 2.21, the slopes of the viscosities of the isoconfigurational states would be Qiso/kB.
In figure 7.19, the initial and final viscosities at the temperatures 60C, 80C and 100C areplotted for all three alloys. The points corresponding to each alloy are connected by a dotted line(AgInSbTe), a dashed line (Ge2Sb2Te5) or a solid line (Ge4Sb1Te5). In a situation where structuralrelaxation during heating can be neglected, the slope of the lines connecting final viscosities at alower temperature and initial viscosities at a higher temperature, is expected to be Qiso/kB.
However, structural relaxation must be considered. This correction to Qiso was realized by useof a computer simulation, which takes into account both the isoconfigurational changes and thestructural relaxation: During the heating from T1 to T2 the behavior of the viscosity is divided intosmall segments in which the isoconfigurational changes and the structural relaxation are considered
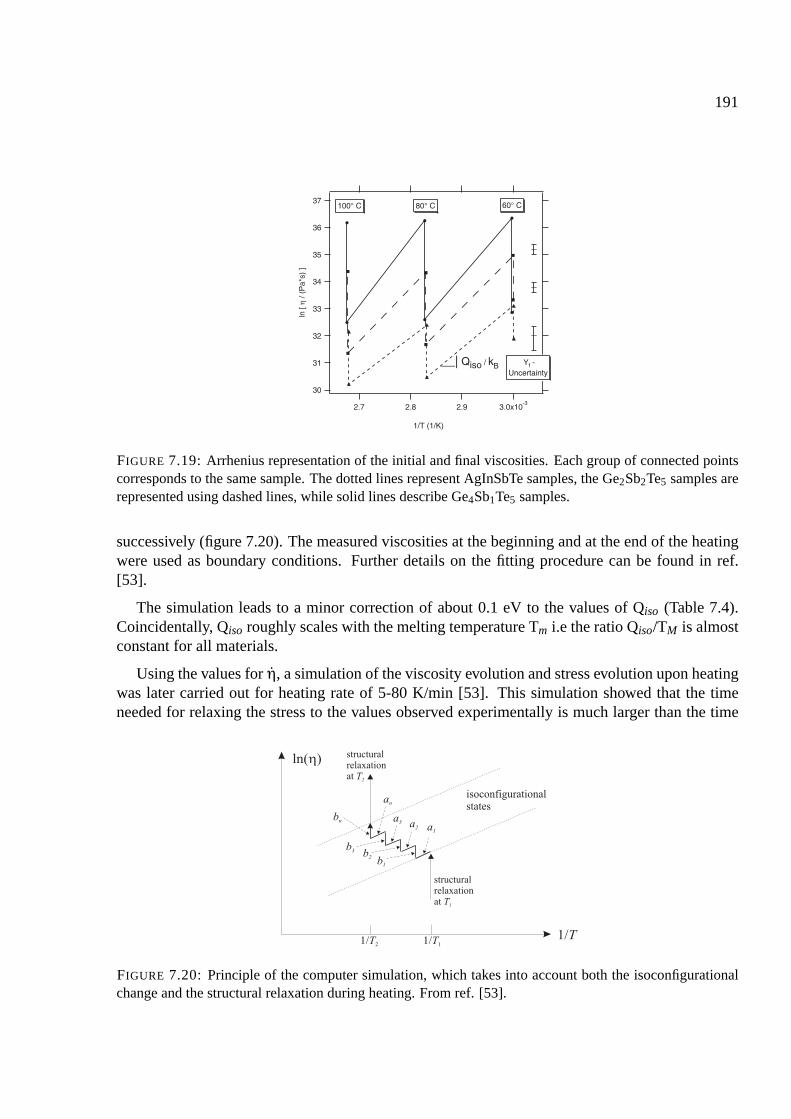
191
37
36
35
34
33
32
31
30
ln [
η / (
Pa*
s) ]
3.0x10⁻³
2.92.82.7
1/T (1/K)
__| Qiso / kB
60° C80° C100° C
Yf -Uncertainty
FIGURE 7.19: Arrhenius representation of the initial and final viscosities. Each group of connected pointscorresponds to the same sample. The dotted lines represent AgInSbTe samples, the Ge2Sb2Te5 samples arerepresented using dashed lines, while solid lines describe Ge4Sb1Te5 samples.
successively (figure 7.20). The measured viscosities at the beginning and at the end of the heatingwere used as boundary conditions. Further details on the fitting procedure can be found in ref.[53].
The simulation leads to a minor correction of about 0.1 eV to the values of Qiso (Table 7.4).Coincidentally, Qiso roughly scales with the melting temperature Tm i.e the ratio Qiso/TM is almostconstant for all materials.
Using the values for η, a simulation of the viscosity evolution and stress evolution upon heatingwas later carried out for heating rate of 5-80 K/min [53]. This simulation showed that the timeneeded for relaxing the stress to the values observed experimentally is much larger than the time
FIGURE 7.20: Principle of the computer simulation, which takes into account both the isoconfigurationalchange and the structural relaxation during heating. From ref. [53].
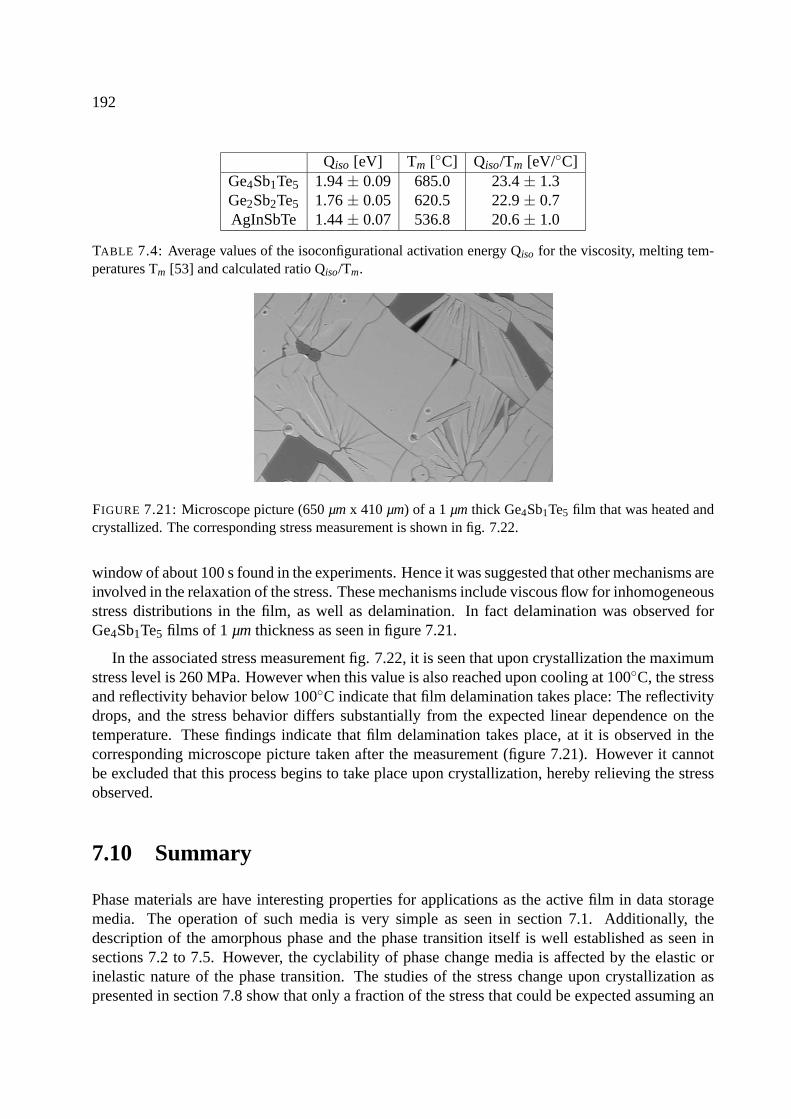
192
Qiso [eV] Tm [C] Qiso/Tm [eV/C]Ge4Sb1Te5 1.94 ± 0.09 685.0 23.4 ± 1.3Ge2Sb2Te5 1.76 ± 0.05 620.5 22.9 ± 0.7AgInSbTe 1.44 ± 0.07 536.8 20.6 ± 1.0
TABLE 7.4: Average values of the isoconfigurational activation energy Qiso for the viscosity, melting tem-peratures Tm [53] and calculated ratio Qiso/Tm.
FIGURE 7.21: Microscope picture (650 µm x 410 µm) of a 1 µm thick Ge4Sb1Te5 film that was heated andcrystallized. The corresponding stress measurement is shown in fig. 7.22.
window of about 100 s found in the experiments. Hence it was suggested that other mechanisms areinvolved in the relaxation of the stress. These mechanisms include viscous flow for inhomogeneousstress distributions in the film, as well as delamination. In fact delamination was observed forGe4Sb1Te5 films of 1 µm thickness as seen in figure 7.21.
In the associated stress measurement fig. 7.22, it is seen that upon crystallization the maximumstress level is 260 MPa. However when this value is also reached upon cooling at 100C, the stressand reflectivity behavior below 100C indicate that film delamination takes place: The reflectivitydrops, and the stress behavior differs substantially from the expected linear dependence on thetemperature. These findings indicate that film delamination takes place, at it is observed in thecorresponding microscope picture taken after the measurement (figure 7.21). However it cannotbe excluded that this process begins to take place upon crystallization, hereby relieving the stressobserved.
7.10 Summary
Phase materials are have interesting properties for applications as the active film in data storagemedia. The operation of such media is very simple as seen in section 7.1. Additionally, thedescription of the amorphous phase and the phase transition itself is well established as seen insections 7.2 to 7.5. However, the cyclability of phase change media is affected by the elastic orinelastic nature of the phase transition. The studies of the stress change upon crystallization aspresented in section 7.8 show that only a fraction of the stress that could be expected assuming an
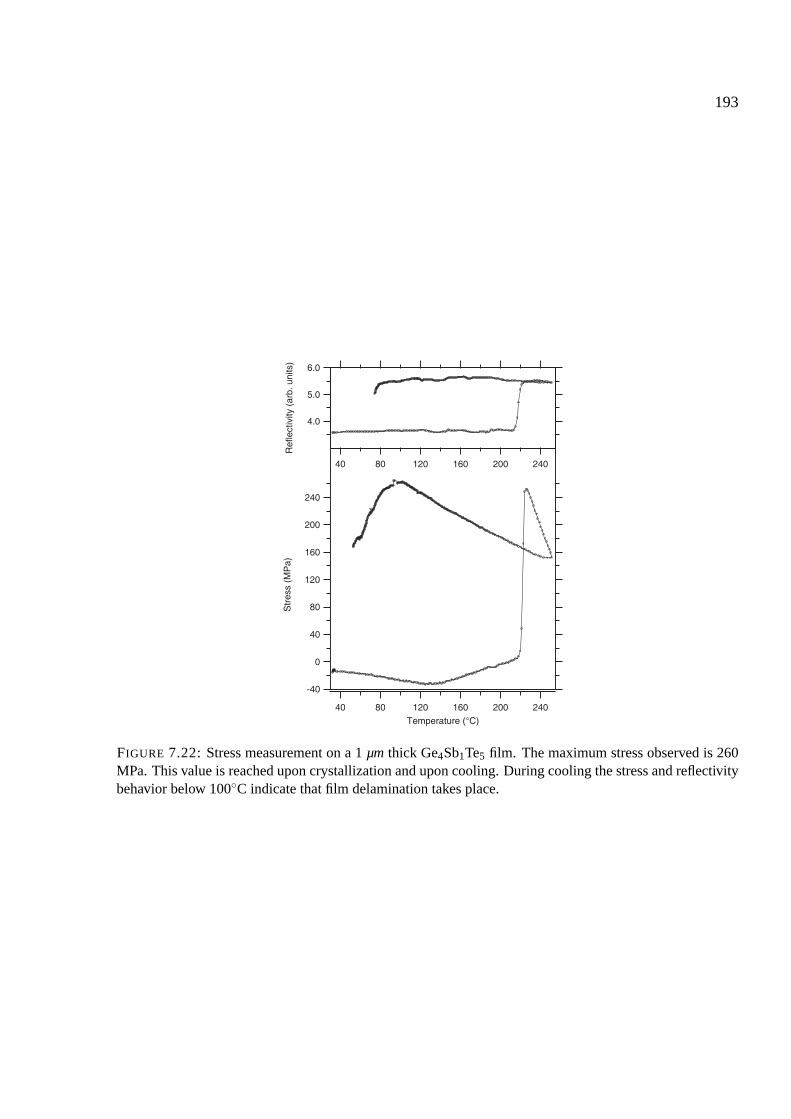
193
240
200
160
120
80
40
0
-40
Str
ess
(MP
a)
2402001601208040
Temperature (°C)
6.0
5.0
4.0
Ref
lect
ivity
(ar
b. u
nits
)
2402001601208040
FIGURE 7.22: Stress measurement on a 1 µm thick Ge4Sb1Te5 film. The maximum stress observed is 260MPa. This value is reached upon crystallization and upon cooling. During cooling the stress and reflectivitybehavior below 100C indicate that film delamination takes place.

194
elastic behavior is actually found in the measurements. In fact only between 7.1 % and 33.9 %,depending on the material and the choice of elastic modulus, of the expected elastic stress is found(section 7.8.3). Additionally, a comparison of the stress relaxation rates of the amorphous and thecrystalline phases shows that this relaxation can only be accommodated in the amorphous phase.Studies of the viscous flow in the amorphous phase yielded that the stress relaxation can be simu-lated using a bimolecular model (section 7.9.2). Using this approach the viscosity increase rate ηand isoconfigurational activation energy Qiso characteristic of the studied alloys were determined.It was found that η and Qiso were highest for Ge4Sb1Te5, second highest for Ge2Sb2Te5 and lowestfor AgInSbTe.
Chapter 8
Conclusion
Mechanical stress is an important parameter to control in the many functional coatings which havefound their way into applications in recent years and led to exciting new technological inventions.The reason is that high stresses can lead to failure of the properties of the film through fatal pro-cesses like cracking or even delamination.
The topic of this work was to study and understand the nature of the stress behavior of mate-rials within certain application fields. Thereby the focus was set on determining the depositionstresses, the magnitude of the stresses involved in certain processes like optical switching or phasechanges, as well as studying the elastic or inelastic nature of the stress changes associated withthese processes.
The basis for such a study is a well-functioning experimental setup. As described in chap-ter 3, such a system was custom-built and subsequently continuously improved until it showedsatisfactory properties. Once this was realized, carefully selected topics could be studied.
The first of these topics is deposition stresses in transition metal oxides. These oxides have alarge number of applications. They are used as functional coatings in many devices, yet their mainfield of application is as optical coatings. Used as coatings on window glass, such thin oxide filmscan help improve the energy balance of houses and buildings. Additionally, metal oxide films areused as transparent conductive oxides, hard coatings etc. Therefore the control of the depositionstresses in these films is extremely important as stress-induced processes can lead to a completeloss of the functionality in case of delamination. Hence the topic of deposition stresses in DC-sputtered films was studied systematically in the group of the transition metal oxides: TiO2, ZrO2,HfO2, V2O5, Nb2O5, Ta2O5, MoO3 and WO3.
The stress was found to correlate with the structure of the films. The formation of either crys-talline or amorphous films was related to the number and the energy of the ions incident on thegrowing film. For amorphous films, lower compressive stresses were found, while higher compres-sive stresses were found in the case of crystalline films as seen for ZrO2 and HfO2. This findingwas explained by a combination of a lower value of the threshold energy Eis required for stressrelaxation in amorphous films compared to crystalline films, and the the number and energy of theincident ions.
195
196
Furthermore, for each of the transition metal oxides, films were produced at different oxygenflows resulting in samples ranging from metallic to oxidic. For all oxygen flows deposition stresseswere measured. These deposition stresses were all explained by use of the models given in chapter5, including the transition from tensile to compressive stress as seen for TiOx and VOx. Thesefindings showed how sensitive the deposition stress is to changes of sputter parameters such as thesputter voltage.
Similarly, in the field of phase change materials applied in optical data storage media, severalmaterials suited for an application are available. Phase change materials exploit the difference inoptical properties between the crystalline and the amorphous state of the materials. The phasechange from crystalline to amorphous is carried out by heating the material to a temperature aboveits melting temperature. Through a very high cooling rate, the liquid can be stabilized in the amor-phous structure. The reverse transition is then performed by heating the amorphous phase aboveits glass transition temperature. This leads to crystallization. In this study, the stress-wise behaviorupon crystallization of the compounds Ge2Sb2Te5, Ge4Sb1Te5 and AgInSbTe was investigated.
The transition from amorphous to crystalline is associated with a volume decrease rangingfrom 5.5-9.0 % for the three alloys. This volume change will lead to mechanical stresses in thefilms because of the constraint condition induced on the film by the substrate. To determine themagnitude of the expected stress assuming an elastic behavior, the elastic properties of the filmswere measured. This was done by exploiting the different thermal stresses induced in equal filmsdeposited on different substrates. In the amorphous phase values of 10.5 GPa, 27.6 GPa and 33.9GPa were found for AgInSbTe, Ge2Sb2Te5 and Ge4Sb1Te5, respectively. In the crystalline phasevalues of 22.6 GPa, 45.2 GPa and 62.4 GPa were found. Hence the stress change for an elasticprocess could be determined to be 0.3 or 0.7 GPa for AgInSbTe, 1.0 or 1.6 GPa for Ge2Sb2Te5,and 1.6 or 3.0 GPa for Ge4Sb1Te5, where the given values refer to use of the Young’s moduli forthe amorphous and the crystalline phase, respectively.
However, the measured stress changes upon crystallization are smaller than these predictions.Values of 105 MPa for AgInSbTe, 165 MPa for Ge2Sb2Te5 and 215 MPa for Ge4Sb1Te5 werefound. The precise fractions of the observed stress changes hence range from 7.1 % to 33.9 %.This means that only a fraction of the stress change calculated assuming elastic behavior is actuallymeasured for the phase transition in the different films. It can thus be concluded that a considerablefraction of the stress in the phase change film is relieved by inelastic processes in the material.
A comparison of the stress relaxation rates in the amorphous and the crystalline phases showedthat in the amorphous phase the rate is far larger than that found in the crystalline phase (1.0 MPa/scompared to 0.04 MPa/s). Hence it was concluded that the stress relaxation takes place in theamorphous phase. For this reason a detailed study of the viscous flow properties of the amorphousphase were carried out.
Finally, the exciting properties of optically switchable coatings were studied. These films ex-ploit the optical contrast, that can be achieved in an active film either by an electrochromic, athermochromic or a gasochromic approach. In this study only gasochromic films i.e. films thatchange their properties upon exposure to a certain gas, were studied. The films chosen for thestudy were tungsten oxide, gadolinium, magnesium. As these materials belong to three differentmaterial classes a comparative study was carried out.
197
Mg, Gd and WOx all show a change of their optical properties upon exposure to a hydrogen gas.However it was found that the magnitude of stresses associated with this optical switching, as wellas the nature of the stress changes, varied considerably between the materials. In Gd large stressesof the order of -2100 MPa were observed. Additionally, the stress changes were found to be muchlower than the stress expected for elastic behavior (-3100 MPa). This finding agreed with a featureof the in-situ stress measurement, which showed that the initial switching to GdH2 is associatedwith an inelastic stress relaxation. It must however be noted that the subsequent switching betweenthe GdH2 and the GdH3 states was found to behave elastically and reversibly. This was howevernot the case for the switching of Mg. In that case, the optical switching was found to be associatedwith stresses of the order of -600 MPa upon loading. Additionally, inelastic stress relief processeswere observed, which led to deterioration of the switching properties and also to film cracking. ForWOx stress changes of the order of -85 MPa were found. Furthermore, the switching between thecolored and the bleached state was found to be elastic and reversible, as no stress relaxation wasobserved.
By considering these findings from a perspective of mechanical stresses, it was concluded thatWOx is the material best suited for application as it combines low mechanical stresses with elasticswitching processes.
Therefore a detailed study of the switching of tungsten oxide was carried out. It was foundthat the magnitude of the stress change depends on the density of the film. Stress changes uponswitching in a 2 bar H2 atmosphere ranged from 30 MPa to 200 MPa. Based on this finding, aswell as the discovery that significant stress changes could be induced in the film by placing it invacuum conditions, without observing a simultaneous optical switching, it was concluded that themajority of the stress changes observed upon switching in WOx film arises from gas atoms in thepores of the film structure.
This finding was exploited in an experiment were a fully colored film was exposed to a numberof vacuum and hydrogen phases. It was found that the first coloration was associated with adifferent compressive stress than the subsequent hydrogen phases, which all showed a similarstress level. This difference could only be accounted for using the model based on the desorptionof oxygen upon coloration. The hydrogen intercalation model did on the other hand not offerany possible explanation for this finding. Therefore it was concluded that the former model ismore credible. In-situ ellipsometry measurements were subsequently found to yield a thicknessdecrease upon coloration, a finding that could also only be explained by use of the model based ondesorption of oxygen upon coloration. Hence it was concluded that this model is credible.
Regarding the complete findings of these studies, it is evident that they show the immenseimportance of control of mechanical stresses in functional coatings. The dramatic failure of thefilm through cracking and delamination is fatal for any application relying on the properties ofsuch coatings. Such failures were also encountered in this work, most notably in the case ofoptical switching of Mg, as well as in rather thick phase change films. Additionally, the power ofmechanical stress measurements was exploited to gather interesting knowledge on the nature of thephase change materials via the viscosity measurements, and of the tungsten oxide films throughthe switching of films of different density. Stress measurements even allowed a statement on thecredibility of the proposed models for switching.

198
References
[1] R.A. ALBERTY AND R.J. SILBEY Physical Chemistry. John Wiley and Sons, Inc. (1992)
[2] G. ALEFELD, N.A. SCHOLTUS, W.K. HALL Hydrogen in metals as an example for a latticegas with phase transitions - static and dynamic critical phenomena. KernforschngsanlageJulich , Institut fur Festkorper un Neutronenphysik (1968)
[3] ANALOGUE DEVICES Computational unit AD538
[4] N.W. ASHCROFT AND N.D. MERMIN Solid State Physics - International Edition. SaundersCollege Publishing (1976)
[5] M. AVRAMI Kinetics of phase change. I. General theory. J. Chem. Phys., 7, p. 1103 (1939)
[6] P. ARETZ Aufbau eines Spannungsmeßplatzes und dessen Charakterisierung. Diplomarbeitin Physik, RWTH Aachen (1999)
[7] K. BANGE, R. KELLER, W. WAGNER AND F. RAUCH Investigation to the electrochroismof a-WO3 in single films and all-solid-state devices. SPIE vol. 1016, p. 50-56 (1988)
[8] K. BANGE Colouration of tungsten oxide films: A model for optically active coatings. SolarEnergy Materials and Solar Cells, 58(1), p. 1-131 (1999)
[9] N.C. BARFORD Experimental Measurements: Precision, Error and Truth. 2nd Edition, JohnWiley and Sons Ltd (1985)
[10] R. BECKER AND W. DORING. Kinetische Behandlung der Keimbildung in ubersattigtenDampfen. Ann. Phys., 24, p. 719 (1935)
[11] B. BOGDANOVIC, K. BOHMHAMMEL, B. CHRIST, A. REISER, K. SCHLICHTE, R.VEHLEN AND U. WOLF Thermodynamic investigation of the magnesium-hydrogen system.J. Alloys and Compounds. 282, p. 84-87 (1996)
[12] M. CHEN, K. A. RUBIN, V. MARELLO, U. G. GERBER AND V. B. JIPSON Reversibilityand stability of tellurium alloys for optical data storage applications. Appl. Phys. Lett. 46,p. 734-736 (1985)
[13] H.S. CHEN, L.C. KIMERLING, J.M. POATE, AND W.L. BROWN Diffusion in a Pd-Cu-Simetallic glass. Appl. Phys. Lett., 32, p. 461-463 (1978)
199

200
[14] M.H. COHEN AND D. TURNBULL Molecular transport in liquids and glasses. J. Chem.Phys., 31(5), p. 1164 (1959)
[15] F.A. COTTON, G. WILKINSON, AND P.L. GAUS Basic Inorganic Chemistry. John Wiley &Sons Inc., New York (1987)
[16] T.H. COURTNEY Mechanical behavior of materials. McGraw-Hill, Inc. (1990)
[17] CRC Handbook of Chemistry and Physics. CRC Press LLC (1997)
[18] K. DAHMEN Induzierte Spannungen an Einkristalloberflachen. Ph.D. Thesis, Forschungzen-trum Julich, Julicd, Germany (2001)
[19] C.A. DAVIS A simple model for the formation of compressive stress in thin films sby ionbombardment. Thin Solid Films, 226, p. 30-34 (1993)
[20] DEB. S.K. Optical and photoelectrical Properties and Colour centres in Thin Films of tung-sten Oxide. Philos. Mag., 27(4), p.801-822 (1973)
[21] A. DENEUVILLE AND P. GERARD Influence of substoichiometry, hydrogen content and crys-tallinity on the optical and electrical properties of HxWOy thin films. Journal of ElectronicMaterials, 7(4), p. 559-588 (1978)
[22] R. DETEMPLE Ph.D. thesis, RWTH Aachen (2003)
[23] N.E. DOWLING Mechanical behavior of materials Prentice-Hall International, Inc. (1973)
[24] T.P. DRUSEDAU, T. BOCK, T,-M. JOHN, F. KLABUNDE, W. ECKSTEIN Energy transferinto the growing film during sputter deposition: An investigation by calorimetric measure-ments and Monte-Carlo simulations. J. Vac. Sci. Tech. 17(5), p. 2896-2905 (1999)
[25] J.A. EASTMAN, L.J. THOMPSON AND B.J. KESTEL Narrowing of the palladium-hydrogenmiscibility gap in nanocrystalline palladium. Phys. Rev. B 48, p. 84-92 (1993)
[26] A. EBINA, M. HIRASAKA, J. ISEMOTO, A. TAKASE, G. FUJINAWA, AND I. SUGIYAMA
Jpn. J. Appl. Phys. 40, p. 1569 (2001)
[27] A. EBINA, M. HIRASAKA AND K. NAKATANI J. Vac. Sci. Technol. A 17(6), p. 3463 (1999)
[28] T. ELEFTHERIADIS Gasochromes Schalten an Magnesiumschichten. Diplomarbeit in Physik,RWTH Aachen (2002)
[29] M. ELLNER, H. REULE AND E.J. MITTERMEIJER J. Alloys and Comp. 309, p. 127 (2000)
[30] M. ELLNER, H. REULE AND E.J. MITTERMEIJER J. Alloys and Comp. 279, p. 179 (1998)
[31] EUROTHERM Temperature Controller Model 818P
[32] B.W. FAUGHNAN, R.S. CRANDALL AND P.M. HEYMAN Electrochromism in WO3 amor-phous films. RCA Review, 36(1), p. 177-197 (1975)
201
[33] H. FREY Band 1: Plasmaphysik - Plasmadiagnostik - Analytik. Vacuumbeschichtung, VDIVerlag, Dusseldorf (1995)
[34] G. FRIEDLMEIER AND M. GROLL Experimental analysis and modelling of the hydridingkinetics of Ni-doped and pure Mg. J. Alloys and Compounds, 253-254, p. 550-555 (1997)
[35] A. FUJISHAMA Fundamentals and Applications of TiO2 Photocatalysis. Short Courses, 4thInternatical Conference on Coatings on Glass, Braunschweig, Germany (2002)
[36] G.S. FULCHER J. Am. Ceram. Soc., 6, p. 339 (1925)
[37] A. GEORG Zum optischen Schalten von Wolframoxidschichten mittels reduzierender und ox-idierender Gase. Ph.D. thesis, Albert-Ludwigs-Universitat, Freiburg, Germany (1999)
[38] A. GEORG, W. GRAF, R. NEUMANN AND V. WITTWER Mechanism of the gasochromiccoloration of porous WO3 films. Sol. State Ion., 127(3-4), p. 319-328 (2000)
[39] A. GEORG, W. GRAF, R. NEUMANN AND V. WITTWER The role of water in gasochromicWO3 films. Thin Solid Films, 384(2), p. 269-275 (2001)
[40] P. GERARD, A. DENEUVILLE, AND R. COURTHS Characterization of a-”‘WO3”’ thin filmsbefore and after coloration. Thin Solid Films, 71(2), p. 221-236 (1980)
[41] P. GERARD, A. DENEUVILLE, G. HOLLINGER AND T. M. DUC Color in ”‘tungsten triox-ide”’ thin films. Journal of Applied Physics, 48(10), p. 4252-4255 (1977)
[42] A. P. GIRI, AND R. MESSIER Mat. Res. Soc. Symp. Proc. 24, p. 221-227 (1984)
[43] S. GLADSTONE, K.J. LAIDLER, AND H. EYRING The theory of rate processes.. McGraw-Hill Book Company, Inc. New York (1941)
[44] A.T.M. VAN GOGH, D.G.NAGENGAST, E.S.KOOIJ, N.J. KOEMAN AND R. GRIESSEN
Quenching of Giant Hysteresis Effects in La1−zYzHx Switchable Mirrors. Phys. Rev. Lett. 85,p. 2156-2159 (2000)
[45] GRANQUIST, C.G. Handbook of Inorganic Electrochromic Materials. Elsevier, Amsterdam(1995)
[46] R. GRIESSEN, J.N. HUIBERS, M.KREMERS, A.T.M. VAN GOGH, N.J. KOEMAN, J.PDEKKER, AND P.H.L. NOTTEN, Yttrium and Lanthanum hydride films with switchable op-tical properties. J. All. Comp. 253-254, p. 44-50 (1997)
[47] HAMAMATSU Model: C3683-01
[48] S. HASHIMOTO, AND H. MATSUOKA Mechanism of electrochromism for amorphous WO3
thin films. J. Appl. Phys. 69, p. 933-937 (1991)
[49] M. HORIE AND T. OHNO Durability of dielectric protective layers against repetitious ther-mal stress in phase-change optical recording. Thin Solid Films 278, p. 74-81 (1996)
202
[50] J.N. HUIBERTS, R. GRIESEN, J.H. RECTOR, R.J. WIJNGAARDEN, J.P. DEKKER, D.G.DE GROOT AND N.J. KOEMAN Yttrium and Lanthanum Hydride Films with switchableoptical properties. Nature, 380, p. 231-234 (1996)
[51] J.R. HOOK AND H.E. HALL Solid State physics, The Manchester Physics series 2nd Edition,J. Wiley & Sons, New York (1991)
[52] INTERPANE GLAS INDUSTRIE AG, LAUENFORDE, GERMANY
[53] J.A. KALB Stresses, viscous flow and crystallization kinetics in thin films of amorphouschalcogenides used for optical data storage. M.Sc. Thesis, RWTH Aachen, Germany (2002)
[54] W. KAUZMANN The nature of the glassy state and the behavior of liquids at low tempera-tures. Chem. Rev. 43, p. 219 (1948)
[55] S. KHOOBIAR Particle to Particle Migration of Hydrogen Atoms on Platinum-Alumina Cat-alysts from Particle to Neighboring Particles. J. Phys. Chem., 68, p. 411-412 (1964)
[56] G. KIENEL, AND K. ROLL Band 2 - Verfahrren und Anlagen. Vacuumbeschichtung, VDIVerlag, Dusseldorf (1995)
[57] M. KITAO, S. YAMADA, S. YOSHIDA, H. AKRAM, AND K. URABE Preparation conditionsof sputtered electrochromic WO3 films and their infrared absorption spectra Solar EnergyMaterials and Solar Cells, 25(3-4), p. 241-255 (1992)
[58] C. KITTEL. Einfuhrung in die Festkorperphysik. Oldenbourg Verlag, 9th edition (1991)
[59] G. KNUYT, W. LAUWERENS, AND L.M. STALS A unified theoretical model for tensile andcompressive residul film stress. Thin Solid Films 370, p. 232-237 (2000)
[60] E.S. KOOIJ, A.T.M. VAN GOGH, D.G. NAGENGAST, N.J. KOEMAN AND R. GRIESSEN
Hysteresis and the single-phase metal-insulator transition in switchable YHx films. Phys.Rev. B 62, p. 10088-10100 (2000)
[61] M. KREMERS, N. J. KOEMAN, R. GRIESSEN, P. H. L. NOTTEN, R. TOLBOOM, P. J.KELLY, AND P. A. DUINE Optical transmission spectroscopy of switchable yttrium hydridefilms. Phys. Rev. B, 57, p. 4943-4949 (1998)
[62] A. KROZER AND B. KASEMO Unusual kinetics due to interface hydride formation in thehydriding of Pd/Mg sandwich layers. J. Vac. Sci. Tech A, 5, p. 1003-1005 (1987)
[63] A. KROZER, P. HJORT AND B. KASEMO Resistivity and hydrogen uptake measurements inevaporated Mg films at 350 K. Journal of Alloys and Compounds, 234(2), p. L11-L15 (1996)
[64] W.A. JOHNSON AND R.F. MEHL Trans. A.I.M.E., 135, p. 416 (1939)
[65] U. LAUDAHN, S. FAHLER, H.U. KREBS, A. PUNDT, M. BICKER, U.V.HULSEN, U.GEYER, R. KIRCHHEIM Determination of elastic constants in thin films using hydrogenloading. Appl. Phys. Lett. 74, p. 647-649 (1999)
203
[66] S.-H. LEE, H.M. CHEONG, C. E. TRACY, A. MASCARENHAS, D. K. BENSON, AND S. K.DEB Raman spectroscopic studies of electrochromic a-WO3. Electrochimica Acta, 44(18), p.3111-3115 (1999)
[67] S.-H. LEE, H.M. CHEONG, C. E. TRACY, A. MASCARENHAS, , A.W. CZANDERNA AND
S. K. DEB Electrochromic coloration efficiency of a-WO3−y thin films as a function of oxygendeficiency. Appl. Phys. Lett., 75(11), p. 1541-1543 (1999)
[68] S.-H. LEE, H.M. CHEONG, J.-G. ZHANG, A. MASCARENHAS, D. K. BENSON, AND
S. K. DEB Electrochromic mechanism in a-WO3−y thin films. Appl. Phys. Lett., 74(2), p.242-244 (1999)
[69] G. LEFTHERIOTIS, S. PAPAEFTHIMIOU, P. YIANOULIS AND A. SIOKOU. Effect of thetungsten oxidation states in the thermal coloration and bleaching of amorphous WO3 films.Thin Solid Films, 384(2), p. 298-306 (2001)
[70] F.A. LEWIS, A. ALADJEM Hydrogen metal systems I-II. Solid State Phenomena, ScitecPublications Ltd., Zuerich-Uetikon, Switzerland (1996)
[71] F.A. LEWIS The Palladium/Hydrogen System. Academic Press London (1967)
[72] M. LIBERA AND M. CHEN MRS Bulletin, Vol. 15(4), p. 40 (1992)
[73] A. MANDELIS, AND J.A. GARCIA Pd/PVDF Thin Film Hydrogen Sensor Based on Laser-Amplitude-Modulated Optical-Transmittance: Dependence on H2 Concentration and DevicePhysics. Sensors and Actuators B. 49, p. 258-267 (1998)
[74] EDITOR: MASALSKI Binary Alloy phase diagrams. Volume 2, Academic Press (1996)
[75] J.W. MAYER AND S.S. LAU Electronic Materials Science: For integrated circuits in Si andGaAs. Macmillan Publishing Company, New York (1990)
[76] F.A. MCCLINTOCK, AND A.S. ARGON Mechanical behavior of Materials. Addison-Wesleypublishing company, inc., Reading, Massachusetts (1966)
[77] V.M.M. MERCIER, AND P. VAN DER SLUIS Toward solid-state switchable mirrors using azirconium oxide proton conductor. Solid State Ionics 145, p. 17-24 (2001)
[78] R. MESSIER, A.P. GIRI, AND R.A. ROY Revised structure zone model for thin film physicalstructure. J. Vac. Sci. Tech. A2, p. 500 (1984)
[79] P. MEYERS In-situ ellipsometrie an gacochrom schaltbarem Wolframoxid. Diplomarbeit,RWTH Aachen (2002)
[80] P.W. MILONNI AND J.H. EBERLY Lasers. John Wiley and Sons, Inc. (1988)
[81] S. H. MOHAMED, T.P. LEERVAD PEDERSEN, R. DRESE, O. KAPPERTZ AND M. WUTTIG
Properties of TiOx coatings prepared by DC magnetron sputtering. Phys. Stat. Sol. in press
204
[82] S. H. MOHAMED, O. KAPPERTZ, J.M. NGARUIYA, T.P. LEERVAD PEDERSEN, R. DRESE
AND M. WUTTIG Correlation between structure, stress and optical properties in direct cur-rent sputtered molebdynum oxide. Thin Solid Films, in press
[83] N.F. MOTT The degenerate electron gas in tungsten bronzes and in highly doped silicon.Philos. Mag. 35, p. 111-128 (1977)
[84] K.-H. MULLER Monte Carlo calculation for structural modifications in ion-assisted thinfilm deposition due to thermal spikes. J. Vac. Sci. Tech. A, 4, p. 184-188 (1986)
[85] J.A. MULLING Viscous flow and structural relaxation in amorphous silicon and amorphousselenium thin films. Ph.D. Thesis, Harvard University, Boston (2000)
[86] T. NANBA AND I. YASUI X-ray diffraction study of microstructure of amorphous tungstentrioxide films prepared by electron beam vacuum evaporation. J. of Solid State Chemistry,83, p. 304-15 (1989)
[87] NATIONAL INSTRUMENTS Austin, Texas (1996)
[88] W. D. NIX Mechanical Properties of Thin Films. Metall. Trans. A 20A p. 2218-2245 (1989)
[89] NIST Chemistry WebBook NIST Standard Reference Database Number 69 - July 2001 Re-lease
[90] W.K. NJOROGE Phase Change Optical Recording - Preparation and X-ray Characterizationof GeSbTe and AgInSbTe films. Ph.D. Thesis, RWTH-Aachen, Aachen, Germany (2001)
[91] K. K. NG, F. C. ZHANG, V. I. ANISIMOV, AND T. M. RICE Theory for metal hydrides withswitchable optical properties. Phys. Rev. B 59, p. 5398-5413 (1999)
[92] J.M. NGARUIYA, O. KAPPERTZ, S.H. MOHAMED, AND M. WUTTIG Structure formationupon reactive sputtering of transition metal oxide films. in press
[93] J.M. NGARUIYA, T.P. LEERVAD PEDERSEN, R. DRESE, O. KAPPERTZ, S. VENKATARAJ
AND M. WUTTIG Preparation and characterization of Tantalum oxide films produced byreactive DC magnetron sputtering. Phys. Stat. Sol. accepted
[94] J.F. NYE Physical Properties of Crystals. Oxford University Press (1985)
[95] Y. OH, J. HAMAGAMI, Y. WATANABE, M. TANAKA, AND H. YANAGIDA J. Ceramic Soc.Jpn. 110, p.618 (1993)
[96] M. OHRING The Materials Science of Thin Films. Academic Press, San Diego (1992)
[97] N. OHSHIMA Crystallization of germaniumantimonytellurium amorphous thin film sand-wiched between various dielectric protective films. J. Appl. Phys. 79(11), p. 8357-8363(1996)
[98] S. OKAMINE, S. HIRASAWA, M. TERAO, AND Y. MIYAUCHI. SPIE Proc. 1663, p. 315(1992)
205
[99] D.F. OLLIS, AND H. AL-EKABI Photocatalytic Purification and treatment of Water and Air.Elsevier, Amsterdam (1993)
[100] C. OTTERMANN, A. TEMMINK, AND K. BANGE Thin Solid Films, 193-194, p. 409-417(1990)
[101] PI GMBH LVPZT-Translator Model P-841.10
[102] G.J. ROBERTS AND J.P. ROBERTS 7th Int. Conf. on Glass, p. 31 (1965)
[103] SCHAFTER UND KIRCHHOFF Semiconductor laser Model:21C-A4,5-670-T02-4-3+5MM-s325-08-L
[104] G. G. STONEY The tension in metallic films deposited by electrolysis. Proc. R. Soc. London,Ser. A 82 p. 172-175 (1909)
[105] UDT SENSORS, INC. Segmented Photodiodes (SPOT Series, Model SPOT-4D)
[106] F. RAUCH, W. WAGNER, AND K. BANGE Nuclear reaction analysis of Hydrogen in opti-cally active coatings on glass. Nuclear Instruments and Methods in Physics Research, B42,p. 264-267 (1989)
[107] A. REMHOF, G. SONG, CH. SUTTER, A. SCHREYER, R. SIEBRECHT, H. ZABEL, F.GUTHOFF AND J. WINDGASSE Hydrogen and deuterium in epitaxial Y(0001) films: Struc-tural properties and isotope exchange. Phys. Rev. B, 59, p. 6689-6699 (1999)
[108] S. ROORDA, J.M. POATE, D.C. JACOBSON, D.J. EAGLESHAM, B.S. DENNIS,S. DIERKER, W.C. SINKE, F. SPAEPEN, AND P. FUOSS Structural relaxation and defectannihilation in pure amorphous silicon. Phys. Rev. B, 44, p. 3702-3725 (1991)
[109] M.P. ROSENBLUM, F. SPAEPEN, AND D. TURNBULL Diffusion and structural relaxationin compositionally modulated amorphous metal films. Appl. Phys. Lett., 37, p.184-186 (1980)
[110] K. A. RUBIN AND M. CHEN Progress and issues of phase-change erasable optical record-ing media. Thin Solid Films 181, p. 129-139 (1989)
[111] C. SALINGA Wolframoxid - Untersuchung des Schaltverhaltens gasochromer WOx-Schichten M.Sc. Thesis, RWTH Aachen (2000)
[112] C. SACHS, A. PUNDT, R. KIRCHHEIM, M. WINTER, M.T. REETZ, AND D. FRITSCH
Solubility of hydrogen in single-sized palladium clusters. Phys. Rev. B 64, p. 075408-1 -075408-10 (2001)
[113] O.F. SCHIRMER, V. WITTWER, G. BAUR AND G. BRANDT. Dependence of WO3 elec-trochromic absorption on crystallinity. Journal of the Electrochemical Society, 124(5), p.749-753 (1977)
[114] O.F.SCHIRMER, K.W.BLAZEY, W.BERLINER AND R. DIEHL ESR and optical absorptionof bound small polarons in YAlO3. Phys. Rev. B, 11, p. 4201-4211 (1975)
206
[115] N.A. SCHOLTUS, W.K. HALL Hysteresis in the Palladium-Hydrogen System J. Chem.Phys. 39(4), p.868-870 (1963)
[116] D. SCHWEIGER, A. GEORG, W. GRAF, AND V. WITTWER Solar Energy Materials andsolar Cells (1998)
[117] F. SEITZ AND J.S. KOEHLER Displacement of atoms during irradiation. Solid StatePhysics, 3, p. 305-448 (1956)
[118] J.V.D SLUIS, OUWERKERK, DUINE Optical switches base on lanthanide alloy hydrides.Appl. Phys. Lett. 70, p. 3356-3359 (1997)
[119] I.S. SOKOLNIKOFF Mathematical Theory of Elasticity. McGraw-Hill, Inc. (1956)
[120] F. SPAEPEN Lectures on phase transformations. Lecture notes for students, Harvard Uni-versity, Boston USA (1984)
[121] F. SPAEPEN Physics of defects. Les Houches Lectures XXXV. North-Holland, Amsterdam,p. 133 (1981)
[122] F. SPAEPEN The identification of the metallic glass state. Mat. Res. Soc. Symp. Proc., p.57-161 (1986)
[123] J. STOLLENWERK Reaktives Sputtern von Oxidfilmen - Herstellung dielektrischer dunnerSchichten fur technische Anwendungen. Ph.D. Thesis, RWTH-Aachen, Aachen, Germany(1993)
[124] J.A. THORNTON, J. TABOCK, AND D.W. HOFFMAN Internal stress in metallic film de-posited by cylindrical magnetron sputtering. Thin Solid Films, 64, p. 111-119 (1979)
[125] J.A. THORNTON Influence of apparatus geometry and deposition conditions on the struc-ture and topography of thick sputtered coatings. J. Vac. Sci. Tech. 11, p. 666 (1974)
[126] S. TIMOSHENKO AND S. WOINEOWKY-KRIEGER Theory of Plates and Shells. McGraw-Hill (1959)
[127] J. TOMINAGA, T. NAKANO AND N. ATODA Double Optical Phase Transition of GeSbTeThin Films Sandwiched between Two SiN Layers. Jpn. J. Appl. Phys. 37, p. 1852-1854 (1998)
[128] WWW.TRENDFOCUS.COM (2002)
[129] S.I. TSAO Structural Relaxation and Isoconfigurational Flow in Metallic Glasses. Ph.D.thesis, Harvard University (1983)
[130] S.S. TSAO AND F. SPAEPEN Structural relaxation of a metallic glass near equilibrium.Acta metall. 33(5), p. 881 (1985)
[131] D. TURNBULL Under what conditions can a glass be formed? Contemp. Phys., 10, p. 473(1969)

207
[132] D. TURNBULL AND M.H. COHEN On the free-volume model of the liquid-glass transition.J. Chem. Phys., 52, p. 3038 (1970)
[133] D.R. UHLMANN AND N.J. KREIDL, EDITORS Glass: Science and Technology, volume 1.Academic Press (1983).
[134] D.R. UHLMANN AND N.J. KREIDL, EDITORS Glass: Science and Technology, volume 3.Academic Press (1986)
[135] S. VENKATARAJ, R. DRESE, O. KAPPERTZ, R. JAYAVEL, AND M. WUTTIG Characteri-zation of Niobium oxide films prepared by reactive DC magnetron sputtering. Phys. Stat. Sol.A 188, p. 1047-1058 (2001)
[136] S. VENKATARAJ, O. KAPPERTZ, H. WEIS, R. DRESE, R. JAYAVEL, AND M. WUTTIG
Structural and optical properties of thin zirconium oxide films prepared by reactive directcurrent magnetron sputtering. J. Appl. Phys. 92, p. 3599-3607 (2002)
[137] H. VOGEL Das Temperaturabhangigkeitsgesetz der Viskositat von Flussigkeiten. Phys.Zeitung, 22, p. 645 (1921)
[138] C.A. VOLKERT Flow and relaxation in amorphous metals. PhD Thesis, Harvard University(1988)
[139] J. WANG AND J.M. BELL The kinetic behaviour of ion injection in WO3 based films pro-duced by sputter and sol-gel deposition: Part II. diffusion coefficients. Solar Energy Materialsand Solar Cells, 58(4), p. 411-429 (1999)
[140] J. H. WEAVER, R. ROSEI, AND D. T. PETERSON Electronic Structure of metal hydrides.I. Optical studies of ScH2, YH2, and LuH2. Phys. Rev. B 19, p. 4855-4866 (1979)
[141] H. WEIS Untersuchung gasochrom schaltender Wolframoxide Ph.D. thesis, RWTH Aachen(2002)
[142] V. WEIDENHOF, I. FRIEDRICH, S. ZIEGLER AND M. WUTTIG Atomic force microscopystudy of laser induced phase transitions in Ge2Sb2Te5. J. Appl. Phys. 86, p. 5879-5887 (1999)
[143] V. WEIDENHOF Optische Datenspeicherung mit Phasenwechselmedien -Geschwindigkeitbestimmende Prozesse der Phasenumwandlungen in Ge2Sb2Te5. Ph.D.Thesis, RWTH Aachen, Germany (2000)
[144] R. WENDT, AND K. ELLMER Desorption of Zn frm a Growing ZnO:Al film deposited bymagnetron sputtering. Surface and Coatings Tech. 93(1), p. 27-31 (1997)
[145] H. WINDISHMANN Intrinsic stress in sputter-deposited thin films. Critical reviews in SolidState and Materials Science, 17:6, p. 547-596 (1992)
[146] H. WINDISHMANN An intrinsic stress scaling law for polycrystalline thin films prepared byion beam sputtering. J. Appl. Phys., 62, p. 1800-1807 (1987)
208
[147] P.J. WITHERS AND H.K.D.H. BHADESHIA Residual stress: Part 1 - Measurement tech-niques. Mat. Sci. Tech. 17, p. 355 (2001)
[148] A. WITVROUW AND F. SPAEPEN Viscosity and elastic constants of amorphous Si and Ge.J. Appl. Phys., 74, p. 7154-7161 (1993)
[149] H.-W. WOLTGENS Ph.D. thesis, RWTH Aachen (2003)
[150] N. YAMADA, M. OTOBA, K. KAWAHARA, N. MIYAGAWA, H. OHTA, N. AKAHIRA, AND
T. MATSUNAGA Phase-Change Optical Disk Having a Nitride Interface Layer. Jpn. J. Appl.Phys. 37, p. 2104-2110 (1998)
[151] J.E. YEHODA, B. YANG, K. VEDAM, AND R. MESSIER Investigation of the void structurein amorphous germanium thin films as a function of low-energy ion bombardment. J. Vac.Sci. Tech. A, 6, p. 1631-1635 (1988)
[152] RICI YU AND PUI K. LAM Electronic and structural properties of MgH2. Phys. Rev. B 37,p. 8730-8737 (1988)
[153] J.-G. ZHANG, D.K. BENSON, C.E. TRACY, S.K. DEB, A.W. CZANDERNA AND
C. BECHINGER Chromic mechanism in amorphous WO3-films J. Elechtrochem. Soc., 144,p.2022-2026 (1997)
[154] G.-F. ZHOU Material aspects in phase change optical recording. Mat. Res. and Eng. A,304-306, p. 73 (2001)

209
Lebenslauf
Personliche Daten
Name, Vorname: Pedersen, Tom Peder LeervadGeburtsdatum: 15.02.1974Geburtsort: Aarhus, DanemarkFamilienstand: Ledig
Studium und Ausbildung
1980-1989 Bredagerskolen, Jelling, Danemark1989 9.klasse udvidet afgangseksamen (Grundschule)1989-1992 Rodkilde amtsgymnasium, Vejle, Danemark1992 Studentereksamen (Abitur)1992-1998 Aarhus Universitet, Institut for Fysik og Astronomi,
Aarhus, Danemark1998 cand. scient. in Physik/Chemie1999-2003 Wissenschaftlicher Mitarbeiter am I. Physikalisches
Institut der RWTH Aachen, Aachen, Deutschland.