Embed Size (px)
Citation preview

MediaWiki Performance ProfilingMediaWiki Performance Profiling
Asher Feldman2012 WMF SF TechDays
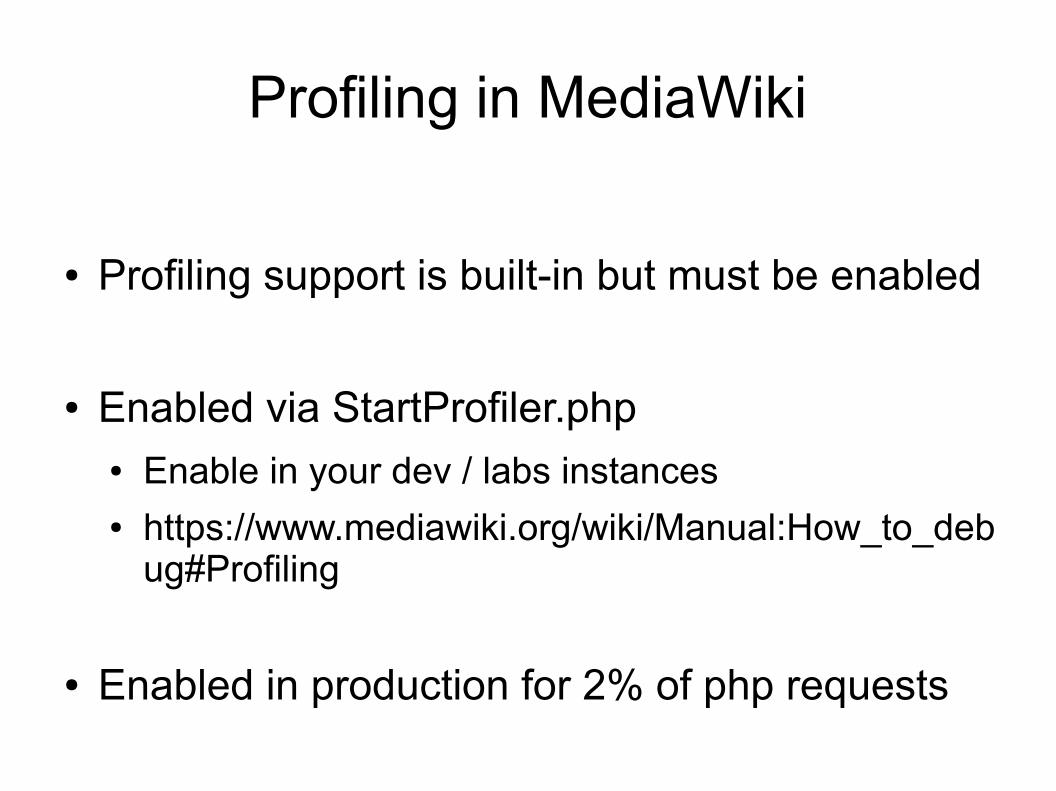
Profiling in MediaWiki
● Profiling support is built-in but must be enabled
● Enabled via StartProfiler.php● Enable in your dev / labs instances● https://www.mediawiki.org/wiki/Manual:How_to_deb
ug#Profiling
● Enabled in production for 2% of php requests
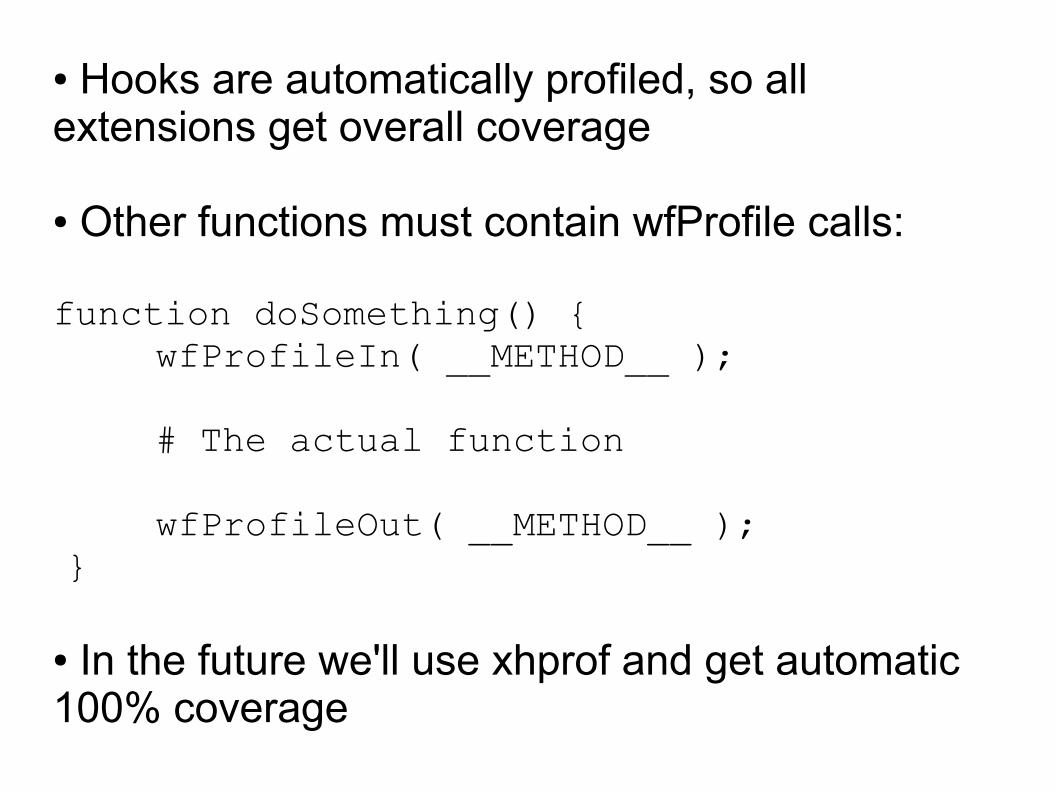
● Hooks are automatically profiled, so all extensions get overall coverage
● Other functions must contain wfProfile calls:
function doSomething() { wfProfileIn( __METHOD__ ); # The actual function
wfProfileOut( __METHOD__ );}
● In the future we'll use xhprof and get automatic 100% coverage
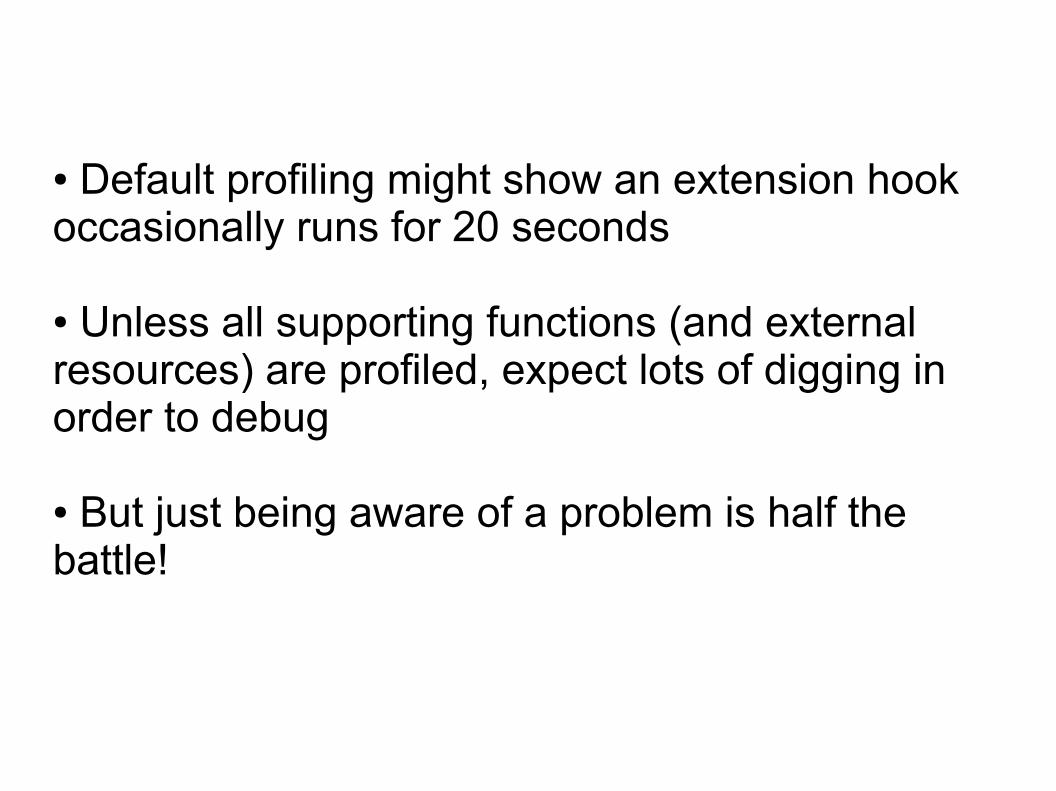
● Default profiling might show an extension hook occasionally runs for 20 seconds
● Unless all supporting functions (and external resources) are profiled, expect lots of digging in order to debug
● But just being aware of a problem is half the battle!
● Profile your PHP and SQL in development, but also check both in production after deployment
● The site didn't go down != everything is ok
● Look at 90th and 99th percentile metrics! Our performance long tail includes some of our most important pages, and today's edge case might be common tomorrow.
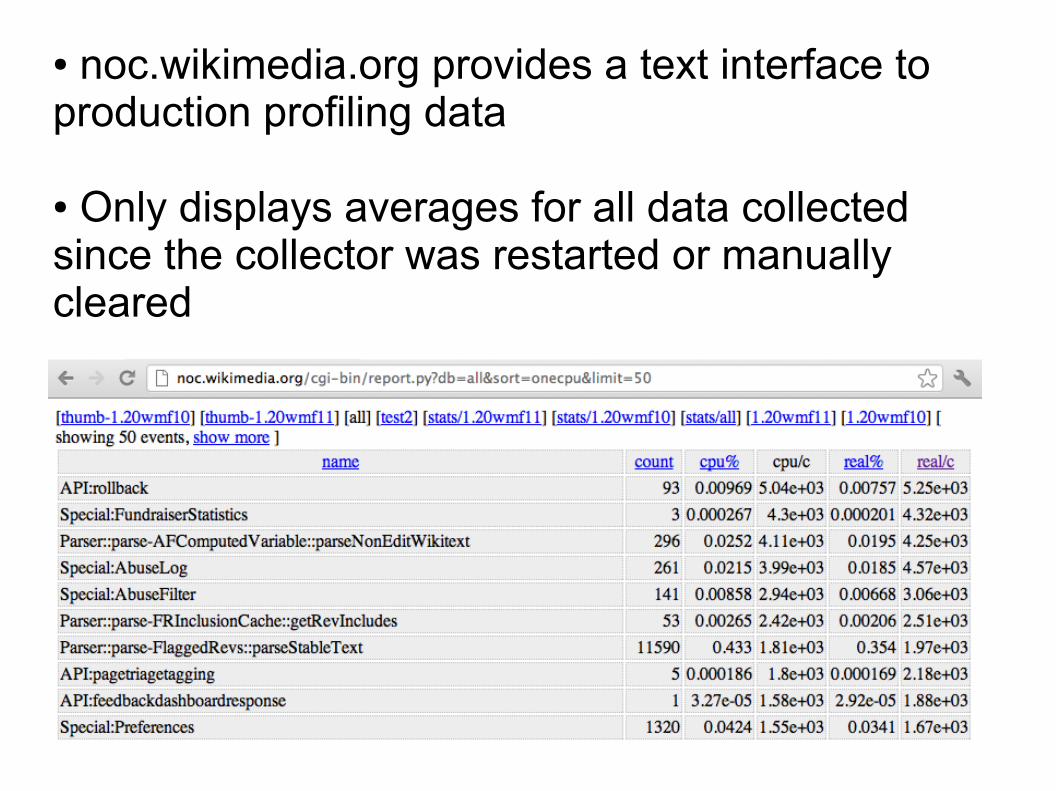
● noc.wikimedia.org provides a text interface to production profiling data
● Only displays averages for all data collected since the collector was restarted or manually cleared
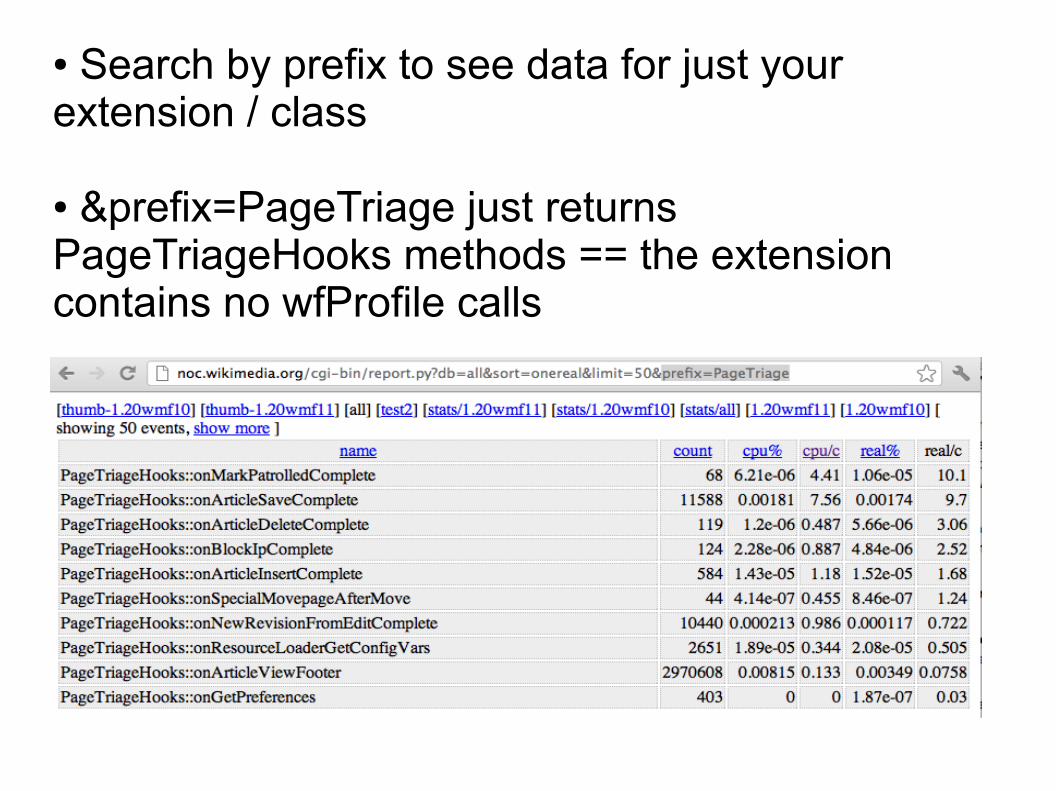
● Search by prefix to see data for just your extension / class
● &prefix=PageTriage just returns PageTriageHooks methods == the extension contains no wfProfile calls
● Problems surfaced in report.py are likely either problems on most calls, or extremely slow on some, enough so to skew the average
● Wallclock (but not cpu) times are fed into graphite every minute, allowing the data to be viewed as a time series and breaking free from averages (percentiles are calculated at ingestion time from buckets of the last 300 samples per metric)
● Cpu data from report.py can be a good augmentation but isn't always reliable
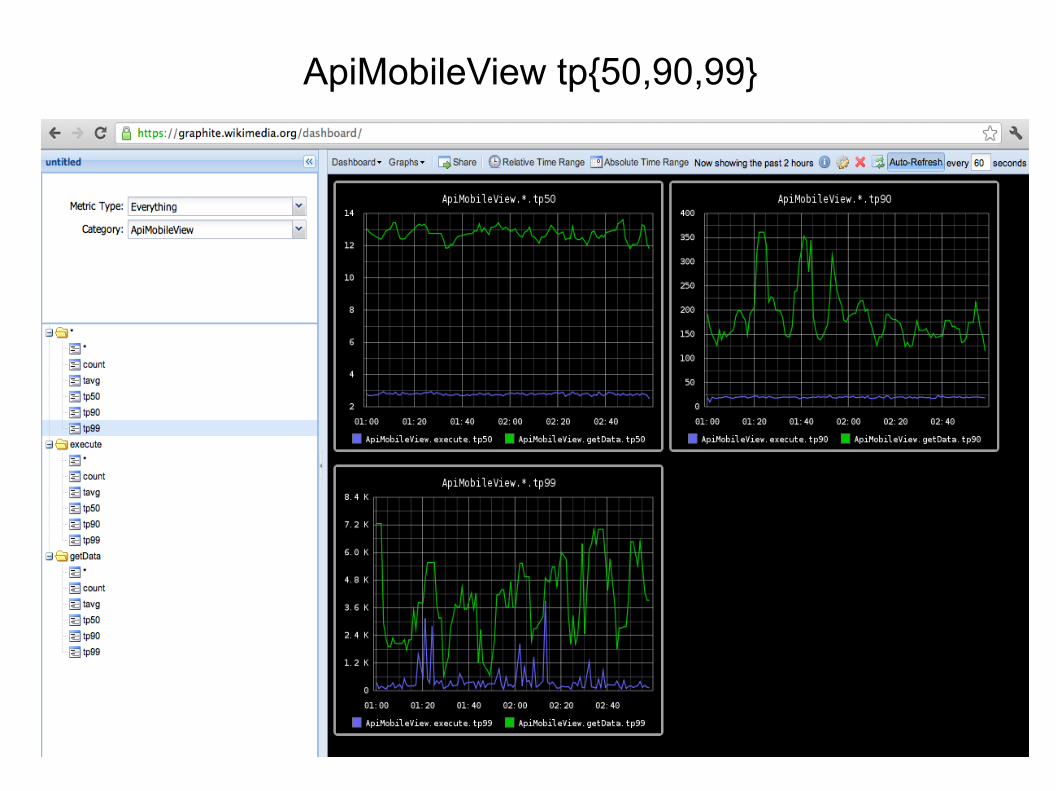
ApiMobileView tp{50,90,99}
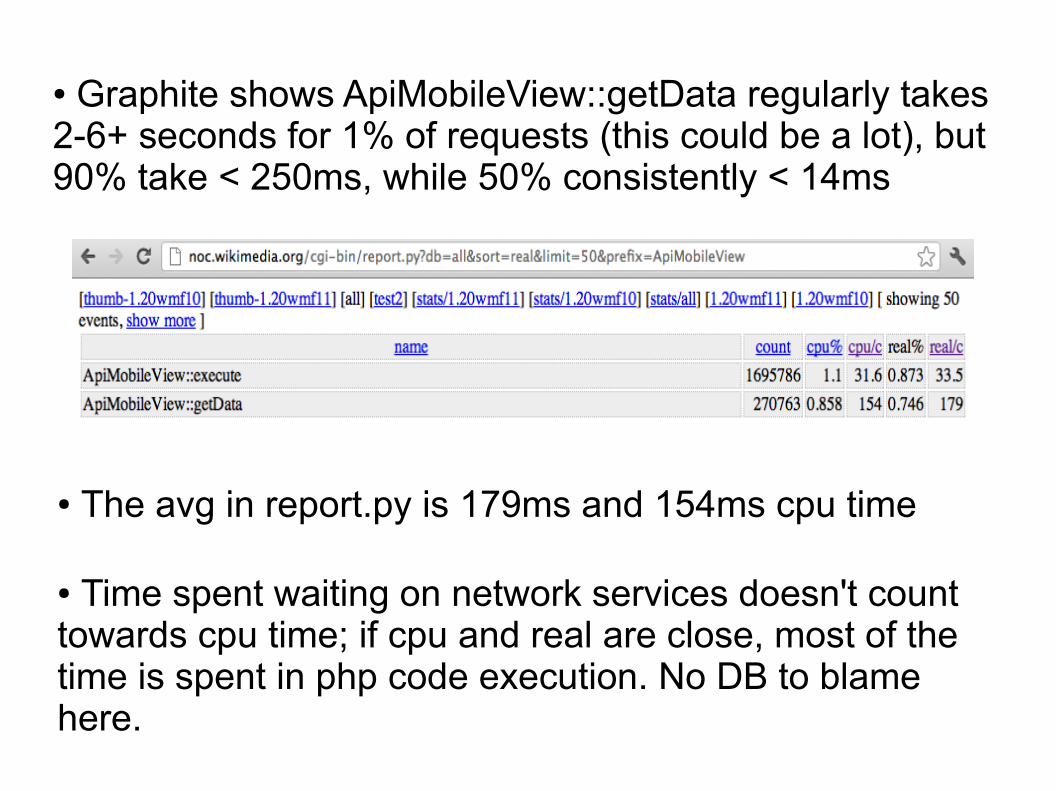
● Graphite shows ApiMobileView::getData regularly takes 2-6+ seconds for 1% of requests (this could be a lot), but 90% take < 250ms, while 50% consistently < 14ms
● The avg in report.py is 179ms and 154ms cpu time
● Time spent waiting on network services doesn't count towards cpu time; if cpu and real are close, most of the time is spent in php code execution. No DB to blame here.
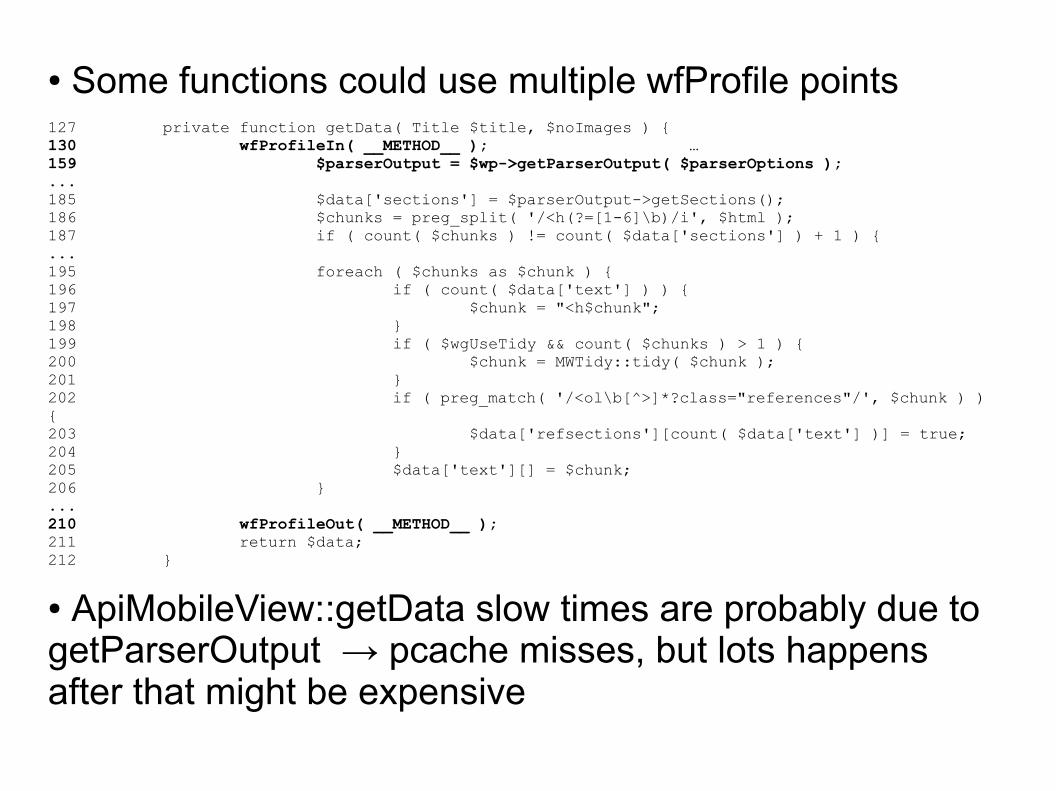
● Some functions could use multiple wfProfile points127 private function getData( Title $title, $noImages ) {130 wfProfileIn( __METHOD__ ); …159 $parserOutput = $wp->getParserOutput( $parserOptions );...185 $data['sections'] = $parserOutput->getSections();186 $chunks = preg_split( '/<h(?=[1-6]\b)/i', $html );187 if ( count( $chunks ) != count( $data['sections'] ) + 1 ) {...195 foreach ( $chunks as $chunk ) {196 if ( count( $data['text'] ) ) {197 $chunk = "<h$chunk";198 }199 if ( $wgUseTidy && count( $chunks ) > 1 ) {200 $chunk = MWTidy::tidy( $chunk );201 }202 if ( preg_match( '/<ol\b[^>]*?class="references"/', $chunk ) ) {203 $data['refsections'][count( $data['text'] )] = true;204 }205 $data['text'][] = $chunk;206 }...210 wfProfileOut( __METHOD__ );211 return $data;212 }
● ApiMobileView::getData slow times are probably due to getParserOutput → pcache misses, but lots happens after that might be expensive
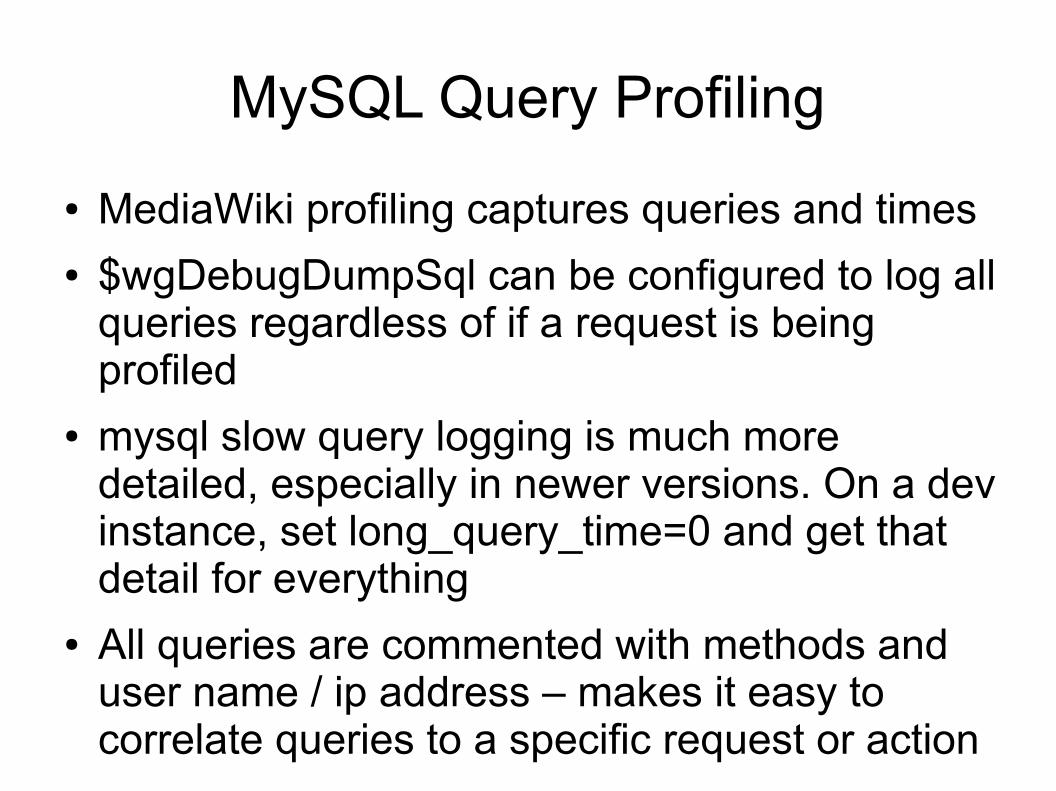
MySQL Query Profiling
● MediaWiki profiling captures queries and times● $wgDebugDumpSql can be configured to log all
queries regardless of if a request is being profiled
● mysql slow query logging is much more detailed, especially in newer versions. On a dev instance, set long_query_time=0 and get that detail for everything
● All queries are commented with methods and user name / ip address – makes it easy to correlate queries to a specific request or action
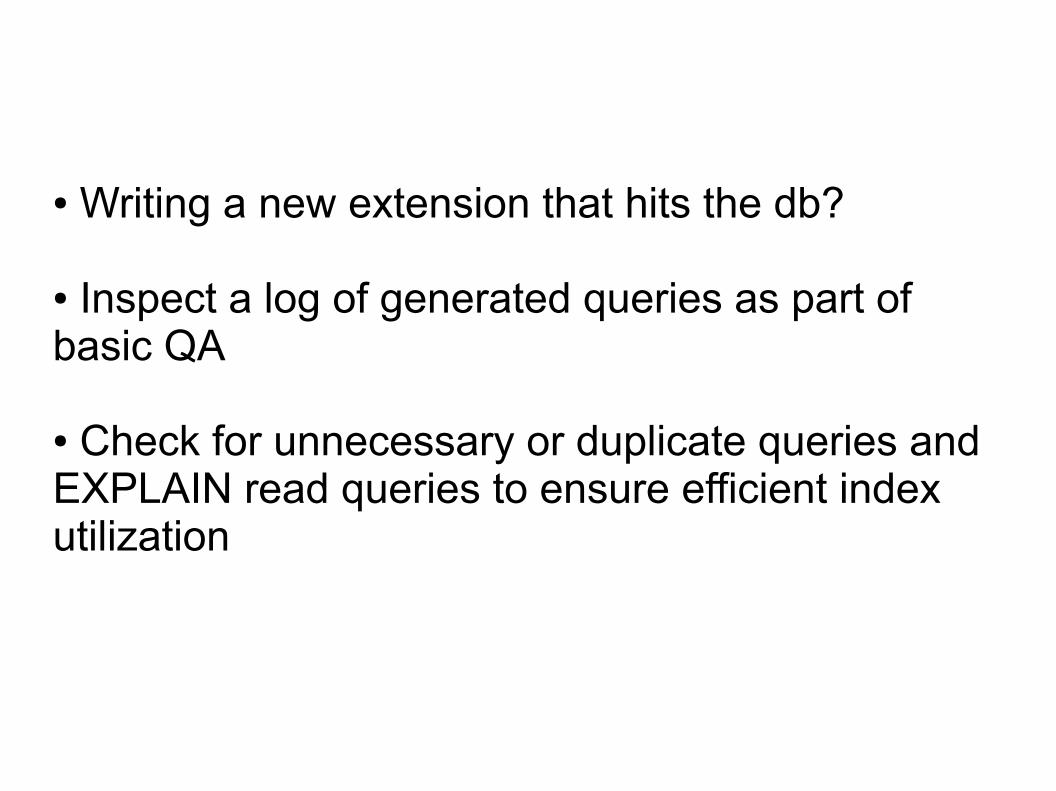
● Writing a new extension that hits the db?
● Inspect a log of generated queries as part of basic QA
● Check for unnecessary or duplicate queries and EXPLAIN read queries to ensure efficient index utilization
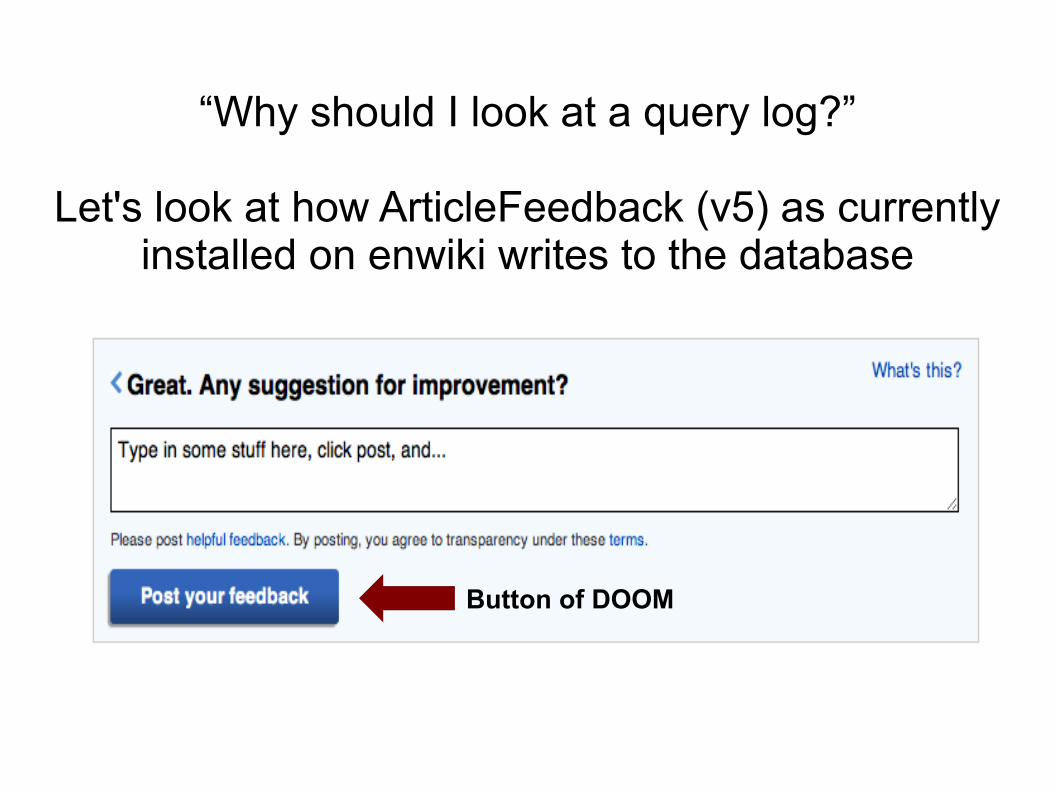
“Why should I look at a query log?”
Let's look at how ArticleFeedback (v5) as currently installed on enwiki writes to the database
Button of DOOM
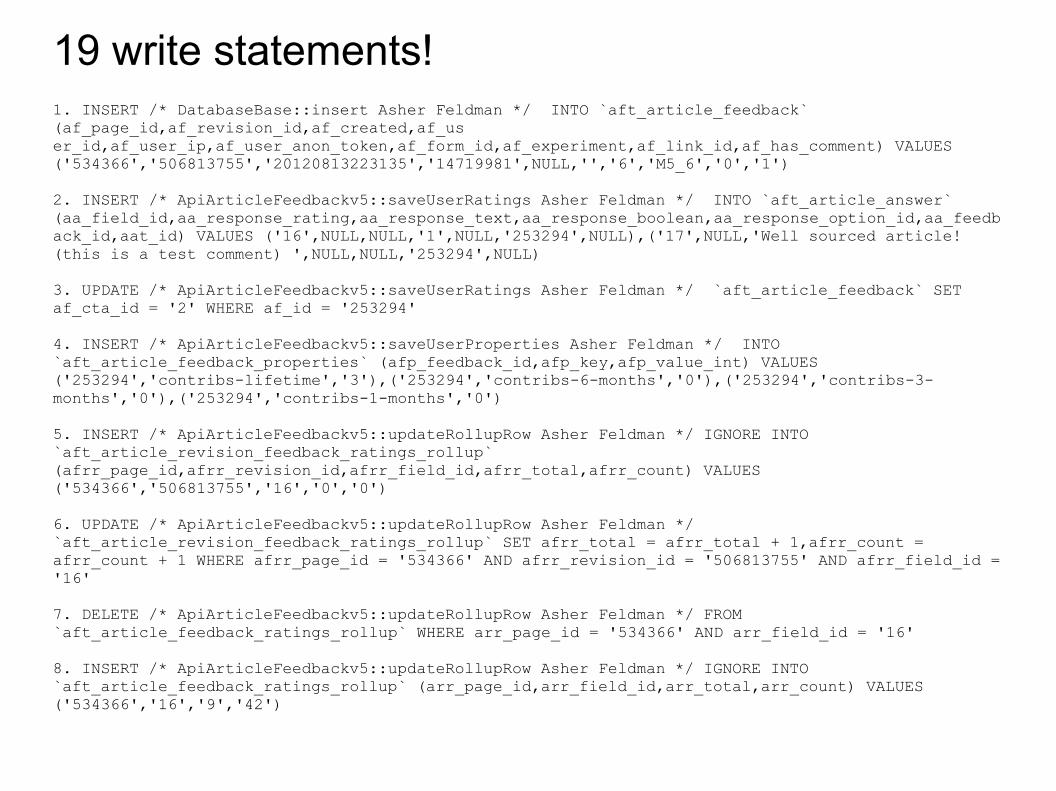
19 write statements!1. INSERT /* DatabaseBase::insert Asher Feldman */ INTO `aft_article_feedback` (af_page_id,af_revision_id,af_created,af_user_id,af_user_ip,af_user_anon_token,af_form_id,af_experiment,af_link_id,af_has_comment) VALUES ('534366','506813755','20120813223135','14719981',NULL,'','6','M5_6','0','1')
2. INSERT /* ApiArticleFeedbackv5::saveUserRatings Asher Feldman */ INTO `aft_article_answer` (aa_field_id,aa_response_rating,aa_response_text,aa_response_boolean,aa_response_option_id,aa_feedback_id,aat_id) VALUES ('16',NULL,NULL,'1',NULL,'253294',NULL),('17',NULL,'Well sourced article! (this is a test comment) ',NULL,NULL,'253294',NULL)
3. UPDATE /* ApiArticleFeedbackv5::saveUserRatings Asher Feldman */ `aft_article_feedback` SET af_cta_id = '2' WHERE af_id = '253294'
4. INSERT /* ApiArticleFeedbackv5::saveUserProperties Asher Feldman */ INTO `aft_article_feedback_properties` (afp_feedback_id,afp_key,afp_value_int) VALUES ('253294','contribs-lifetime','3'),('253294','contribs-6-months','0'),('253294','contribs-3-months','0'),('253294','contribs-1-months','0')
5. INSERT /* ApiArticleFeedbackv5::updateRollupRow Asher Feldman */ IGNORE INTO `aft_article_revision_feedback_ratings_rollup` (afrr_page_id,afrr_revision_id,afrr_field_id,afrr_total,afrr_count) VALUES ('534366','506813755','16','0','0')
6. UPDATE /* ApiArticleFeedbackv5::updateRollupRow Asher Feldman */ `aft_article_revision_feedback_ratings_rollup` SET afrr_total = afrr_total + 1,afrr_count = afrr_count + 1 WHERE afrr_page_id = '534366' AND afrr_revision_id = '506813755' AND afrr_field_id = '16'
7. DELETE /* ApiArticleFeedbackv5::updateRollupRow Asher Feldman */ FROM `aft_article_feedback_ratings_rollup` WHERE arr_page_id = '534366' AND arr_field_id = '16'
8. INSERT /* ApiArticleFeedbackv5::updateRollupRow Asher Feldman */ IGNORE INTO `aft_article_feedback_ratings_rollup` (arr_page_id,arr_field_id,arr_total,arr_count) VALUES ('534366','16','9','42')
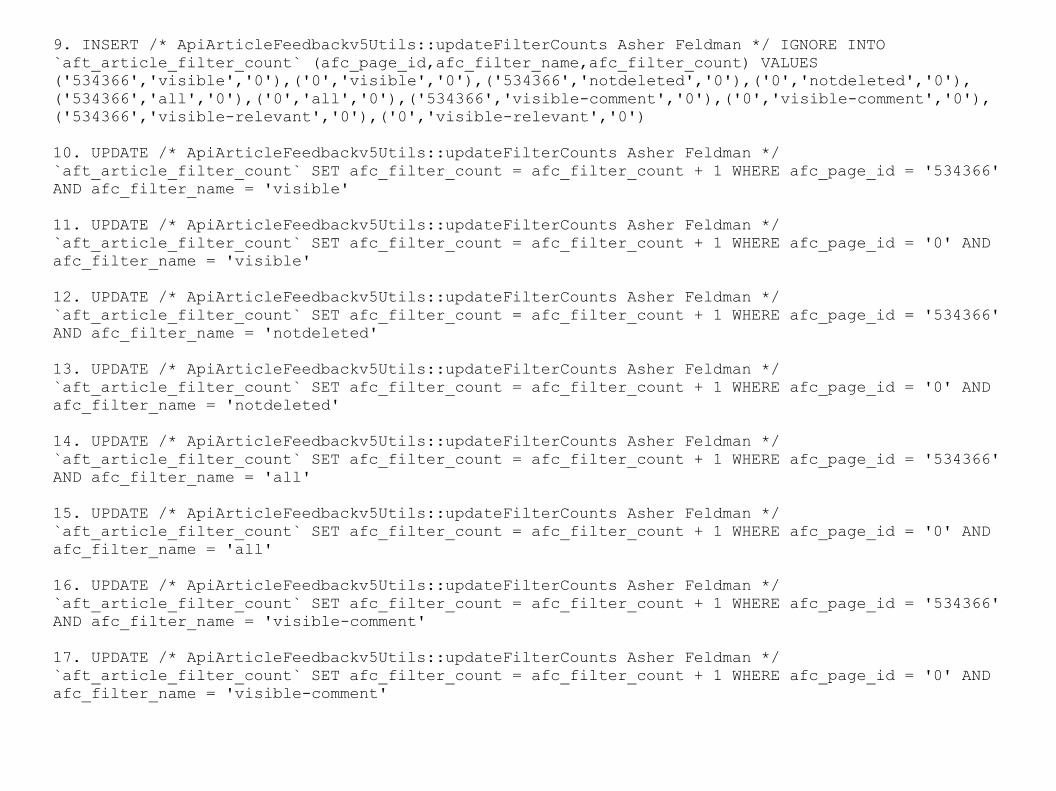
9. INSERT /* ApiArticleFeedbackv5Utils::updateFilterCounts Asher Feldman */ IGNORE INTO `aft_article_filter_count` (afc_page_id,afc_filter_name,afc_filter_count) VALUES ('534366','visible','0'),('0','visible','0'),('534366','notdeleted','0'),('0','notdeleted','0'),('534366','all','0'),('0','all','0'),('534366','visible-comment','0'),('0','visible-comment','0'),('534366','visible-relevant','0'),('0','visible-relevant','0')
10. UPDATE /* ApiArticleFeedbackv5Utils::updateFilterCounts Asher Feldman */ `aft_article_filter_count` SET afc_filter_count = afc_filter_count + 1 WHERE afc_page_id = '534366' AND afc_filter_name = 'visible'
11. UPDATE /* ApiArticleFeedbackv5Utils::updateFilterCounts Asher Feldman */ `aft_article_filter_count` SET afc_filter_count = afc_filter_count + 1 WHERE afc_page_id = '0' AND afc_filter_name = 'visible'
12. UPDATE /* ApiArticleFeedbackv5Utils::updateFilterCounts Asher Feldman */ `aft_article_filter_count` SET afc_filter_count = afc_filter_count + 1 WHERE afc_page_id = '534366' AND afc_filter_name = 'notdeleted'
13. UPDATE /* ApiArticleFeedbackv5Utils::updateFilterCounts Asher Feldman */ `aft_article_filter_count` SET afc_filter_count = afc_filter_count + 1 WHERE afc_page_id = '0' AND afc_filter_name = 'notdeleted'
14. UPDATE /* ApiArticleFeedbackv5Utils::updateFilterCounts Asher Feldman */ `aft_article_filter_count` SET afc_filter_count = afc_filter_count + 1 WHERE afc_page_id = '534366' AND afc_filter_name = 'all'
15. UPDATE /* ApiArticleFeedbackv5Utils::updateFilterCounts Asher Feldman */ `aft_article_filter_count` SET afc_filter_count = afc_filter_count + 1 WHERE afc_page_id = '0' AND afc_filter_name = 'all'
16. UPDATE /* ApiArticleFeedbackv5Utils::updateFilterCounts Asher Feldman */ `aft_article_filter_count` SET afc_filter_count = afc_filter_count + 1 WHERE afc_page_id = '534366' AND afc_filter_name = 'visible-comment'
17. UPDATE /* ApiArticleFeedbackv5Utils::updateFilterCounts Asher Feldman */ `aft_article_filter_count` SET afc_filter_count = afc_filter_count + 1 WHERE afc_page_id = '0' AND afc_filter_name = 'visible-comment'
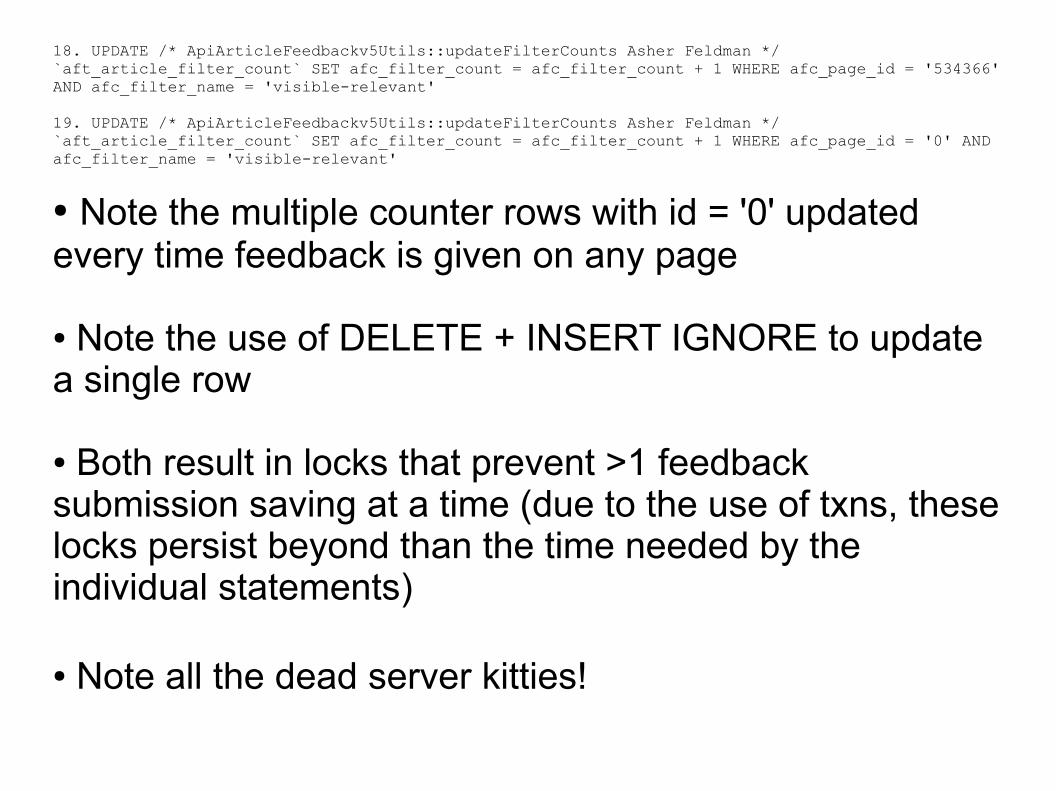
18. UPDATE /* ApiArticleFeedbackv5Utils::updateFilterCounts Asher Feldman */ `aft_article_filter_count` SET afc_filter_count = afc_filter_count + 1 WHERE afc_page_id = '534366' AND afc_filter_name = 'visible-relevant'
19. UPDATE /* ApiArticleFeedbackv5Utils::updateFilterCounts Asher Feldman */ `aft_article_filter_count` SET afc_filter_count = afc_filter_count + 1 WHERE afc_page_id = '0' AND afc_filter_name = 'visible-relevant'
● Note the multiple counter rows with id = '0' updated every time feedback is given on any page
● Note the use of DELETE + INSERT IGNORE to update a single row
● Both result in locks that prevent >1 feedback submission saving at a time (due to the use of txns, these locks persist beyond than the time needed by the individual statements)
● Note all the dead server kitties!
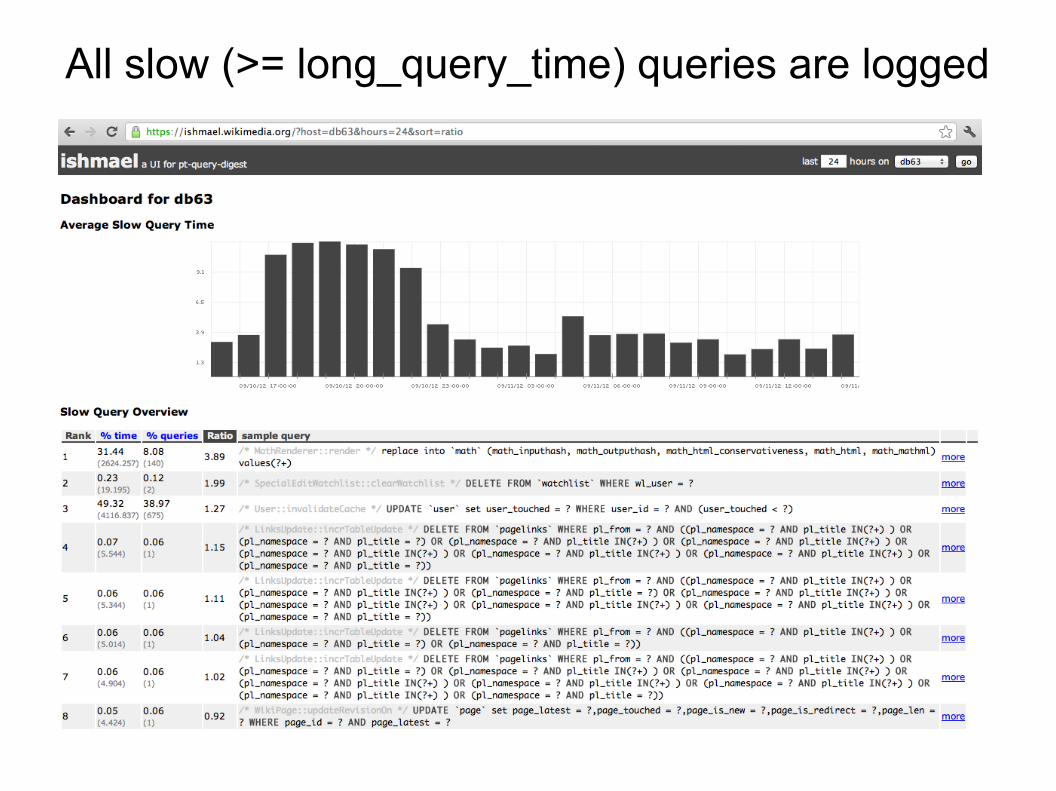
All slow (>= long_query_time) queries are logged
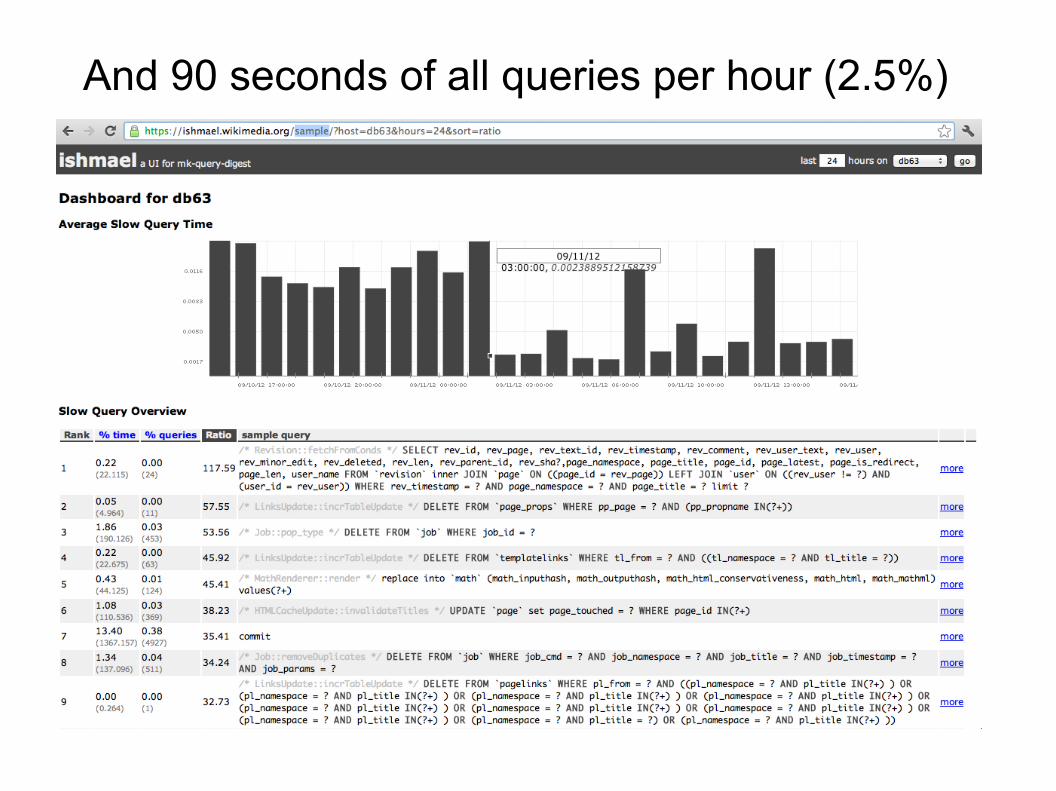
And 90 seconds of all queries per hour (2.5%)
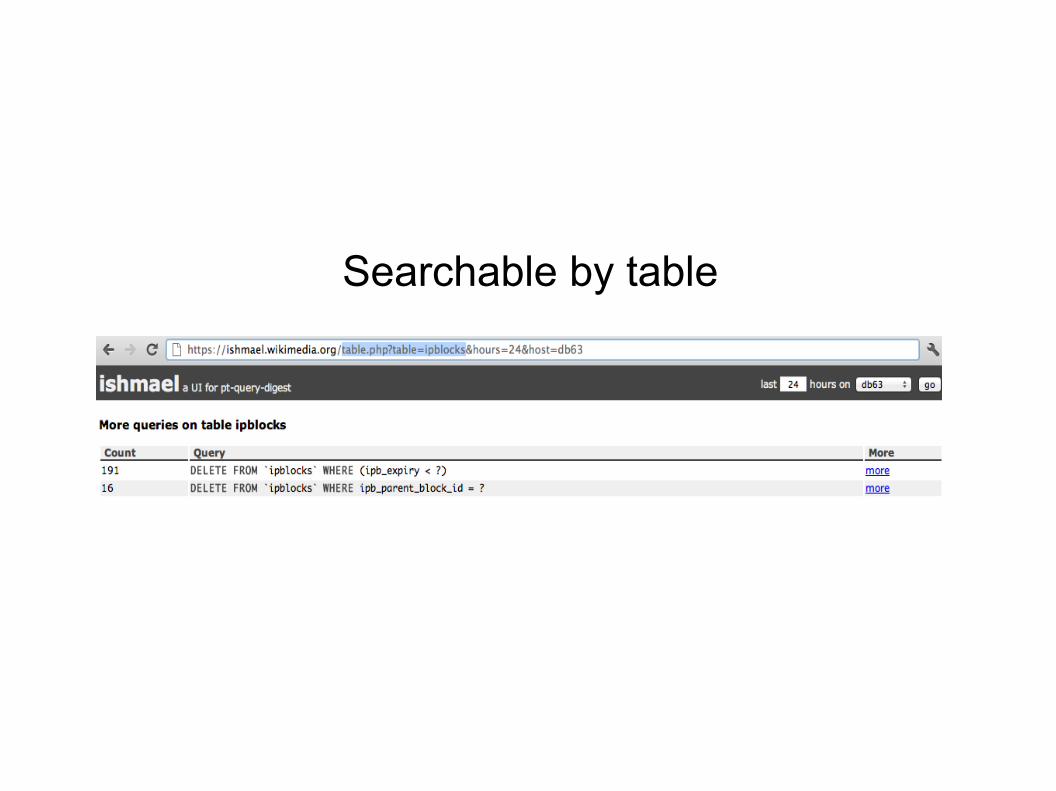
Searchable by table
● Slow and sample reports linked to for all dbs from http://noc.wikimedia.org/dbtree/
● Check if new code shows up in slow at all
● Check sample to see if queries are executing more often than necessary (put a cache on it)
● Check the master and one slave for the largest wiki the code is live on